Revista Contabilidade & Finanças -...
21
Revista Contabilidade & Finanças This is an open-access artcle distributed under the terms of the Creatve Commons Aributon Licenseu Fonteu hpu// uscieloubr/scielouphpcscript=sci_arext&pid=1515- 7077205700100505&lng=en&nrm=isou Acesso emu 56 janu 2058u REFERÊNCIA RO1A, Paulo 1érgio; GARTNER, Ivan Ricardou Financial distress in Brazilian banksu an early arning modelu Revista Contabilidade & Finanças, 1ão Paulo, 2057u Disponível emu <hpu//uscieloubr/scielouphpcscript=sci_arext&pid=1515- 7077205700100505&lng=en&nrm=iso>u Acesso emu 56 janu 2058u Epub Dec 20, 2057u doiu hpu//dxudoiuorg/50u510/5808-017x20580950u
Transcript of Revista Contabilidade & Finanças -...

Revista Contabilidade & Finanças This is an open-access artcle distributed under the terms of the Creatve Commons
Attributon Licenseu Fonteu httpu//wwwwwwuscieloubr/scielouphpcscript=sci_arttext&pid=1515-7077205700100505&lng=en&nrm=isou Acesso emu 56 janu 2058u
REFERÊNCIARO1A, Paulo 1érgio; GARTNER, Ivan Ricardou Financial distress in Brazilian banksu an early wwarning modelu Revista Contabilidade & Finanças, 1ão Paulo, 2057u Disponível emu <httpu//wwwwwwuscieloubr/scielouphpcscript=sci_arttext&pid=1515-7077205700100505&lng=en&nrm=iso>u Acesso emu 56 janu 2058u Epub Dec 20, 2057u doiu httpu//dxudoiuorg/50u510/5808-017x20580950u
ISSN 1808-057X
R. Cont. Fin. – USP, São Paulo 1
DOI: 10.1590/1808-057x201803910
*Paper presented at the XL Meeting of the National Association for Post Graduate Studies and Research in Business Administration, Costa do Sauipe, BA, Brazil, September 2016
**The views expressed in this study are exclusively those of the authors, and do not necessarily express the position of the Central Bank of Brazil or its members.
Original ArticleFinancial distress in Brazilian banks: an early warning model*,**
Paulo Sérgio Rosa Universidade de Brasília, Faculdade de Economia, Administração, Contabilidade e Gestão Pública, Programa de Pós-Graduação em Administração, Brasília, DF, BrazilEmail: [email protected]
Ivan Ricardo GartnerUniversidade de Brasília, Faculdade de Economia, Administração, Contabilidade e Gestão Pública, Programa de Pós-Graduação em Administração, Brasília, DF, BrazilEmail: [email protected]
Received on 06.14.2016 – Desk acceptance on 06.19.2016 – 3rd version approved on 06.07.2017
ABSTRACT� is study aims to propose an early warning model for predicting � nancial distress events in Brazilian banking institutions. Initially, a set of economic-� nancial indicators is evaluated, suggested by the risk management literature for identifying situations of bank insolvency and exclusively taking public information into account. For this, multivariate logistic regressions are performed, using as independent variables � nancial indicators involving capital adequacy, asset quality, management quality, earnings, and liquidity. � e empirical analysis was based on a sample of 142 � nancial institutions, including privately and publicly held and state-owned companies, using monthly data from 2006 to 2014, which resulted in panel data with 12,136 observations. In the sample window there were nine cases of Brazilian Central Bank intervention or mergers and acquisitions motivated by � nancial distress. � e results were evaluated based on the estimation of the in-sample parameters, out-of-sample tests, and the early warning model signs for a 12-month forecast horizon. � ese obtained true positive rates of 81%, 94%, and 89%, respectively. We conclude that typical balance-sheet indicators are relevant for the early warning signs of � nancial distress in Brazilian banks, which contributes to the literature on � nancial intermediary credit risk, especially from the perspective of bank supervisory agencies acting towards � nancial stability.
Keywords: � nancial institutions, risk management, � nancial distress, insolvency, early warning model.
Correspondence address:
Paulo Sérgio RosaUniversidade de Brasília, Departamento de AdministraçãoCampus Universitário Darcy Ribeiro, Bloco A-2, 1º andar, Sala A1-54/7 – CEP 70910-900Asa Norte – Brasília – DF – Brasil
Financial distress in Brazilian banks: an early warning model
2 R. Cont. Fin. – USP, São Paulo
1. INTRODUCTION
Particularly in periods following � nancial crises – such as the 2007-2008 subprimes crisis, in which the fall of Lehman Brothers showed the systemic risk of a series of bankruptcies and the high cost for society resulting from government interventions (bail-outs) in the � nancial sector, such as in the United States and other European countries – the relevance of the issue of � nancial stability comes under focus, with the leadership of important multilateral organizations, such as the Basel Committee for Banking Supervision, of which Brazil has been a member since 2009, and the Financial Stability Board, linked to the Group of 20 biggest economies in the world.
� e Basel recommendations involve three pillars: minimum levels of capital requirement (Basel ratio), in which financial institutions must have adequate levels of own capital in relation to the risks of their assets; supervision processes, which concern banking supervision practices for � nancial institutions; and market discipline. For this last pillar, � nancial institutions should maintain e� ective processes for disclosing information and displaying transparency to the market.
� e studies found in the literature on predicting financial distress are based on samples of financial institutions from the European Union (Betz, Oprica, Peltonen, & Sarlin, 2014), Russia (Peresetsky, Karminsky, & Golovan, 2011), North America (Cleary & Hebb, 2016; Lane, Looney, & Wansley, 1986), Iran (Valahzaghard & Bahrami, 2013), and Malaysia (Wanke, Azad, & Barros, 2016), as well as cross-country samples (Liu, 2015).
However, a lack of studies was found involving the modeling of early warnings for Brazilian banking institutions, possibly due to the particularities of banking industry business models and the relatively small number of publicly-held � nancial institutions. As a result of this � nding, which is consistent with Brito, Assaf Neto, and Corrar (2009) with regards to the potential to explore this area of knowledge – of interest to both supervisory bodies and market investors –, this study’s main aim is to
propose an early warning model for predicting � nancial distress events in Brazilian banking institutions.
Despite the rarity of the occurrence of the events of interest in this study – the sample related to the period between 2006 and 2014 contains nine cases in the treatment group –, it is understood that assessing the risks of a � nancial system is based on identifying vulnerabilities at its micro level, which can trigger systemic risk events via contagion processes due to the interconnectivity of the � nancial relationships between the agents participating in the market, independent of their relative size.
Moreover, early warning systems constitute important tools from the banking supervision framework (Pillar 2). In the search to maintain � nancial stability, which is typically attributed to central banks, anticipating potential sources of � nancial distress can contribute to streamlining the use of resources when executing public policies for regulation and supervision, as well as providing information for monitoring systemic risk.
On the other hand, by using data from banks’ balance sheets, the study contributes to evaluating disclosure practices in the country (Pillar 3), which are also relevant for savers. � e study sets out the following research proposal: the information set in the public domain involving � nancial statements constitutes a su� cient element for modeling an early warning system for � nancial distress events in Brazil.
Using monthly data to compose an unbalanced panel of pooled data, it is concluded that the categories of the CAMELS system (capitalization, asset quality, management, earnings, and liquidity) constitute important measures for analyzing situations of � nancial distress in banks in the National Financial System and contribute to modeling an early warning system on a 12-month timescale.
The literature review and research methodology sections are presented next, followed by the results analysis and conclusion sections.
2. INFERENTIAL FINANCIAL DISTRESS MODELS
Ever since the study from Altman (1968), with the classic model known as Z-score for discriminate analysis among groups, the literature accumulated on models for predicting corporate bankruptcies is diversi� ed in terms of variables used, as well as the methodology for estimating the probability of default. � ere are models
that extract their inputs from � nancial statements, add macroeconomic indicators, and also those that use market information, such as � nancial asset prices. Many studies compare the main approaches developed for identifying the � nancial situation of companies, such as discriminant analysis, factor analysis, logit and probit models, arti� cial
Paulo Sérgio Rosa & Ivan Ricardo Gartner
3R. Cont. Fin. – USP, São Paulo
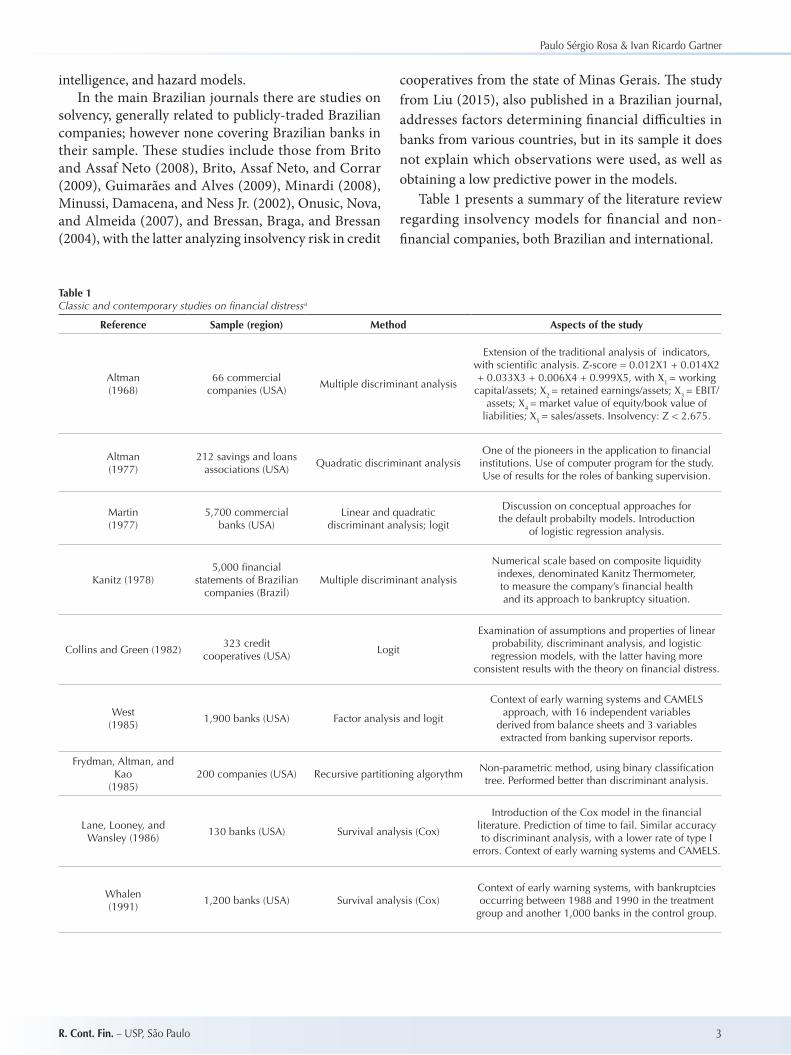
Table 1Classic and contemporary studies on � nancial distressa
Reference Sample (region) Method Aspects of the study
Altman (1968)
66 commercial companies (USA)
Multiple discriminant analysis
Extension of the traditional analysis of indicators, with scienti� c analysis. Z-score = 0.012X1 + 0.014X2 + 0.033X3 + 0.006X4 + 0.999X5, with X1 = working
capital/assets; X2 = retained earnings/assets; X3 = EBIT/assets; X4 = market value of equity/book value of
liabilities; X5 = sales/assets. Insolvency: Z < 2.675.
Altman (1977)
212 savings and loans associations (USA)
Quadratic discriminant analysis One of the pioneers in the application to � nancial institutions. Use of computer program for the study. Use of results for the roles of banking supervision.
Martin (1977)
5,700 commercial banks (USA)
Linear and quadratic discriminant analysis; logit
Discussion on conceptual approaches for the default probabilty models. Introduction
of logistic regression analysis.
Kanitz (1978)5,000 � nancial
statements of Brazilian companies (Brazil)
Multiple discriminant analysis
Numerical scale based on composite liquidity indexes, denominated Kanitz Thermometer, to measure the company’s � nancial health and its approach to bankruptcy situation.
Collins and Green (1982)323 credit
cooperatives (USA)Logit
Examination of assumptions and properties of linear probability, discriminant analysis, and logistic regression models, with the latter having more
consistent results with the theory on � nancial distress.
West (1985)
1,900 banks (USA) Factor analysis and logit
Context of early warning systems and CAMELS approach, with 16 independent variables
derived from balance sheets and 3 variables extracted from banking supervisor reports.
Frydman, Altman, and Kao
(1985)200 companies (USA) Recursive partitioning algorythm
Non-parametric method, using binary classi� cation tree. Performed better than discriminant analysis.
Lane, Looney, and Wansley (1986)
130 banks (USA) Survival analysis (Cox)
Introduction of the Cox model in the � nancial literature. Prediction of time to fail. Similar accuracy to discriminant analysis, with a lower rate of type I
errors. Context of early warning systems and CAMELS.
Whalen (1991)
1,200 banks (USA) Survival analysis (Cox)Context of early warning systems, with bankruptcies occurring between 1988 and 1990 in the treatment
group and another 1,000 banks in the control group.
intelligence, and hazard models.In the main Brazilian journals there are studies on
solvency, generally related to publicly-traded Brazilian companies; however none covering Brazilian banks in their sample. � ese studies include those from Brito and Assaf Neto (2008), Brito, Assaf Neto, and Corrar (2009), Guimarães and Alves (2009), Minardi (2008), Minussi, Damacena, and Ness Jr. (2002), Onusic, Nova, and Almeida (2007), and Bressan, Braga, and Bressan (2004), with the latter analyzing insolvency risk in credit
cooperatives from the state of Minas Gerais. � e study from Liu (2015), also published in a Brazilian journal, addresses factors determining � nancial di� culties in banks from various countries, but in its sample it does not explain which observations were used, as well as obtaining a low predictive power in the models.
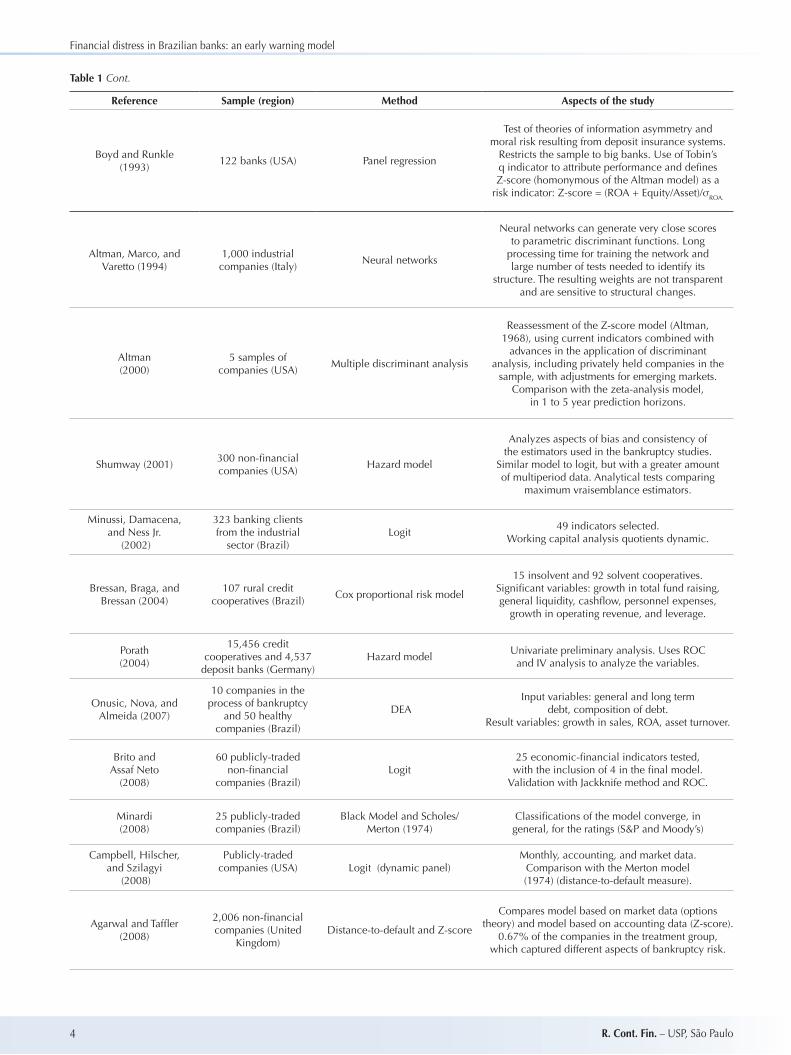
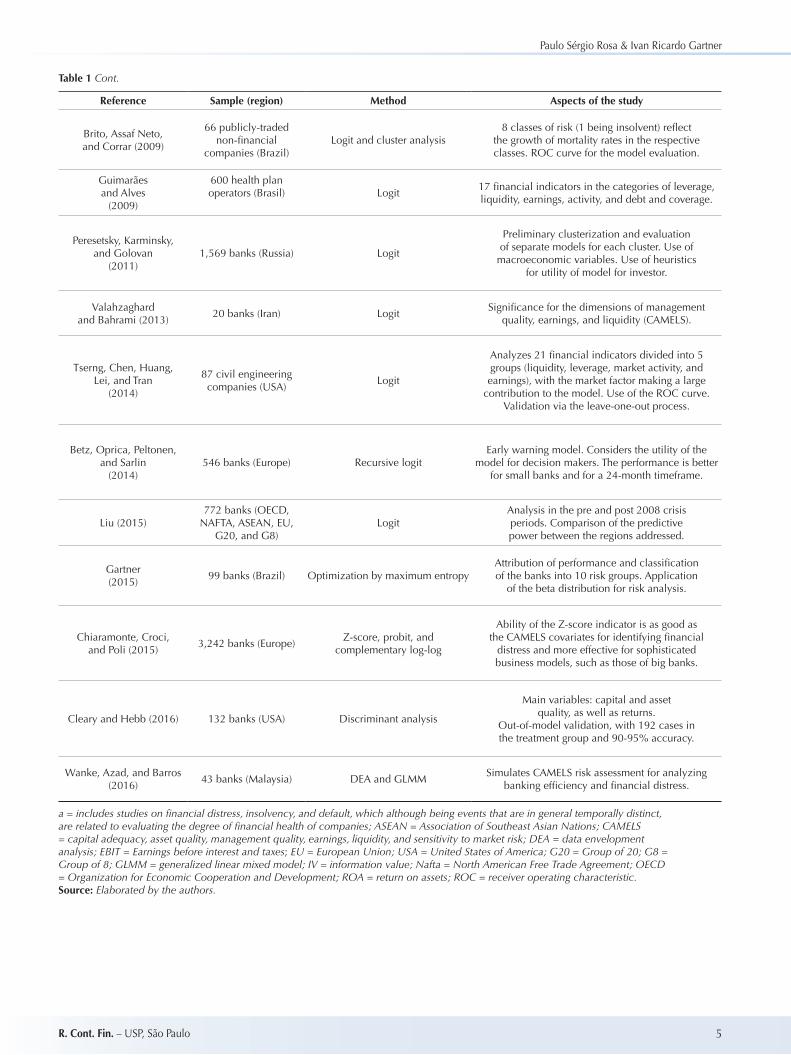
Table 1 presents a summary of the literature review regarding insolvency models for � nancial and non-� nancial companies, both Brazilian and international.
Financial distress in Brazilian banks: an early warning model
4 R. Cont. Fin. – USP, São Paulo
Reference Sample (region) Method Aspects of the study
Boyd and Runkle (1993)
122 banks (USA) Panel regression
Test of theories of information asymmetry and moral risk resulting from deposit insurance systems.
Restricts the sample to big banks. Use of Tobin’s q indicator to attribute performance and de� nes Z-score (homonymous of the Altman model) as a
risk indicator: Z-score = (ROA + Equity/Asset)/σROA.
Altman, Marco, and Varetto (1994)
1,000 industrial companies (Italy)
Neural networks
Neural networks can generate very close scores to parametric discriminant functions. Long
processing time for training the network and large number of tests needed to identify its
structure. The resulting weights are not transparent and are sensitive to structural changes.
Altman (2000)
5 samples of companies (USA)
Multiple discriminant analysis
Reassessment of the Z-score model (Altman, 1968), using current indicators combined with
advances in the application of discriminant analysis, including privately held companies in the
sample, with adjustments for emerging markets. Comparison with the zeta-analysis model,
in 1 to 5 year prediction horizons.
Shumway (2001)300 non-� nancial companies (USA)
Hazard model
Analyzes aspects of bias and consistency of the estimators used in the bankruptcy studies.
Similar model to logit, but with a greater amount of multiperiod data. Analytical tests comparing
maximum vraisemblance estimators.
Minussi, Damacena, and Ness Jr.
(2002)
323 banking clients from the industrial
sector (Brazil)Logit
49 indicators selected. Working capital analysis quotients dynamic.
Bressan, Braga, and Bressan (2004)
107 rural credit cooperatives (Brazil)
Cox proportional risk model
15 insolvent and 92 solvent cooperatives. Signi� cant variables: growth in total fund raising, general liquidity, cash� ow, personnel expenses,
growth in operating revenue, and leverage.
Porath (2004)
15,456 credit cooperatives and 4,537
deposit banks (Germany) Hazard model
Univariate preliminary analysis. Uses ROC and IV analysis to analyze the variables.
Onusic, Nova, and Almeida (2007)
10 companies in the process of bankruptcy
and 50 healthy companies (Brazil)
DEAInput variables: general and long term
debt, composition of debt. Result variables: growth in sales, ROA, asset turnover.
Brito and Assaf Neto
(2008)
60 publicly-traded non-� nancial
companies (Brazil)Logit
25 economic-� nancial indicators tested, with the inclusion of 4 in the � nal model.
Validation with Jackknife method and ROC.
Minardi (2008)
25 publicly-traded companies (Brazil)
Black Model and Scholes/Merton (1974)
Classi� cations of the model converge, in general, for the ratings (S&P and Moody’s)
Campbell, Hilscher, and Szilagyi
(2008)
Publicly-traded companies (USA) Logit (dynamic panel)
Monthly, accounting, and market data. Comparison with the Merton model (1974) (distance-to-default measure).
Agarwal and Taf� er (2008)
2,006 non-� nancial companies (United
Kingdom)Distance-to-default and Z-score
Compares model based on market data (options theory) and model based on accounting data (Z-score).
0.67% of the companies in the treatment group, which captured different aspects of bankruptcy risk.
Table 1 Cont.
Paulo Sérgio Rosa & Ivan Ricardo Gartner
5R. Cont. Fin. – USP, São Paulo
Reference Sample (region) Method Aspects of the study
Brito, Assaf Neto, and Corrar (2009)
66 publicly-traded non-� nancial
companies (Brazil)Logit and cluster analysis
8 classes of risk (1 being insolvent) re� ect the growth of mortality rates in the respective classes. ROC curve for the model evaluation.
Guimarães and Alves
(2009)
600 health plan operators (Brasil) Logit
17 � nancial indicators in the categories of leverage, liquidity, earnings, activity, and debt and coverage.
Peresetsky, Karminsky, and Golovan
(2011)1,569 banks (Russia) Logit
Preliminary clusterization and evaluation of separate models for each cluster. Use of
macroeconomic variables. Use of heuristics for utility of model for investor.
Valahzaghard and Bahrami (2013)
20 banks (Iran) LogitSigni� cance for the dimensions of management
quality, earnings, and liquidity (CAMELS).
Tserng, Chen, Huang, Lei, and Tran
(2014)
87 civil engineering companies (USA)
Logit
Analyzes 21 � nancial indicators divided into 5 groups (liquidity, leverage, market activity, and earnings), with the market factor making a large
contribution to the model. Use of the ROC curve. Validation via the leave-one-out process.
Betz, Oprica, Peltonen, and Sarlin
(2014)546 banks (Europe) Recursive logit
Early warning model. Considers the utility of the model for decision makers. The performance is better
for small banks and for a 24-month timeframe.
Liu (2015)772 banks (OECD,
NAFTA, ASEAN, EU, G20, and G8)
LogitAnalysis in the pre and post 2008 crisis periods. Comparison of the predictive power between the regions addressed.
Gartner (2015)
99 banks (Brazil) Optimization by maximum entropyAttribution of performance and classi� cation of the banks into 10 risk groups. Application
of the beta distribution for risk analysis.
Chiaramonte, Croci, and Poli (2015)
3,242 banks (Europe)Z-score, probit, and
complementary log-log
Ability of the Z-score indicator is as good as the CAMELS covariates for identifying � nancial
distress and more effective for sophisticated business models, such as those of big banks.
Cleary and Hebb (2016) 132 banks (USA) Discriminant analysis
Main variables: capital and asset quality, as well as returns.
Out-of-model validation, with 192 cases in the treatment group and 90-95% accuracy.
Wanke, Azad, and Barros (2016)
43 banks (Malaysia) DEA and GLMMSimulates CAMELS risk assessment for analyzing
banking ef� ciency and � nancial distress.
a = includes studies on � nancial distress, insolvency, and default, which although being events that are in general temporally distinct, are related to evaluating the degree of � nancial health of companies; ASEAN = Association of Southeast Asian Nations; CAMELS = capital adequacy, asset quality, management quality, earnings, liquidity, and sensitivity to market risk; DEA = data envelopment analysis; EBIT = Earnings before interest and taxes; EU = European Union; USA = United States of America; G20 = Group of 20; G8 = Group of 8; GLMM = generalized linear mixed model; IV = information value; Nafta = North American Free Trade Agreement; OECD = Organization for Economic Cooperation and Development; ROA = return on assets; ROC = receiver operating characteristic.Source: Elaborated by the authors.
Table 1 Cont.

Financial distress in Brazilian banks: an early warning model
6 R. Cont. Fin. – USP, São Paulo
2.1 Financial Institutions and the CAMELS System
In the area of integrated � nancial systems, studies aim to show indicators for measuring systemic risks or the importance of systemically important institutions (too big to fail), such as in Canedo and Jaramillo (2009), Capelletto and Corrar (2008), Fazio, Tabak, and Cajueiro (2014), and Tabak, Fazio, and Cajueiro (2013). Along these same lines, Souza (2014) simulates the e� ects of credit risk, changes in capital requirements, and price shocks in the Brazilian banking system, showing that the contribution of medium-sized banks can also be signi� cant for systemic risk.
According to Chan-Lau (2006), estimating the probabilities of default for individual agents is the � rst step in evaluating credit exposure and potential losses. � e probabilities of default are, therefore, the basic inputs for analyzing systemic risk and � nancial system distress tests. It is important for the proactive analysis of systemic risk measures to take into account the individual evaluation of bank failure risks for each institution in the system, whether small, medium or large-sized.
Speci� cally for the case of banks, the introduction of the CAMEL classi� cation system by American regulators in 1979 resulted in a major boost to the development of the literature on bank failures. � e CAMEL acronym stands for capital adequacy, asset quality, management quality, earnings, and liquidity, and represents a banking supervision tool for evaluating the strength of � nancial institutions. In 1996, the sensitivity to market risk item was added to the abbreviation currently known as CAMELS.
A pioneer in the use of logistic regression to predict bank failures, Martin (1977) analyzes the importance of early warning models, both from the theoretical and practical points of view, for measuring the strength of the commercial banking sector and implications for supervisors, regulators, and system users. � e author evaluates the different approaches for defining the dependent variable, that is, what constitutes a bank failure: the recording of negative net equity, the impossibility of continuing operations without incurring losses that would result in negative equity, and intervention by the banking supervisor to coordinate mergers and acquisitions.
For the empirical analysis, Martin (1977) uses 5,700 banks from the Federal Reserve of the United States of America system, in which there were 58 cases of failures in the period between 1970 and 1976. Using logit and discriminant analyses, combinations of eight independent variables in year t are generated for analyzing the model with the greatest explanatory power in year t + 1. � e results do not present stability, with some variables having explanatory power in some periods and even an opposite
sign to that expected in subsequent periods. � e author ponders whether the banking solidity criteria can vary over the business cycle. In periods in which bankruptcies are extremely rare, the relationship between capital adequacy, for example, and the occurrence of failures will be weak. In periods of � nancial distress, earnings measures and asset composition can be indicators of risk.
West (1985) explores combining the analysis of factors and logistic regression to measure the individual conditions of commercial banks and attribution of probabilities of problems, taking commonly used � nancial indicators and information extracted from bank inspections as explanatory variables. � e factors produced to use in the logit estimation are similar to the CAMEL classi� cation system used in the � eld work of banking supervisors. 19 variables are used that characterize dependency in relation to particular categories of loans, source of fund raising, liquidity, capital adequacy, fund raising costs, bank size, earnings measures, quality, and portfolio risk.
Concerned about the performance measures of early warnings models – such as those of Martin (1977) and of West (1985) – Korobow and Stuhr (1985) propose a new weighted measure of e� ciency analysis to correct the problem related to the small percentage of the sample involving problematic banks: weighted efficiency = percentage of correct classi� cations * TP/(TP+FP) * TP/(TP+FN), in which TP, FP, and FN are true-positive, false-positive, and false-negative, respectively, and correspond to the classi� cations in the contingency matrix. Besides observing the existence of di� erent levels of separation (cut-o� threshold) of healthy and critical banks in the models evaluated, the authors apply a new measure proposed, showing the low performance of early warning models.
In situations in which the sample is composed of a low number of events in the treatment (insolvent) group in relation to the control (solvent) group, Lane, Looney, and Wansley (1986) make an important consideration with relation to the prior probabilities of belonging to a group for use in the analysis. � ese probabilities should be de� ned via a reasonable estimation of the probability of a member belonging to a group of the population, assuming that the sample is random.
One of the models most widely used as a banking risk indicator is the Z-score (homonymous of the indicator produced by Altman, in 1968), presented by Boyd and Runkle (1993), who test two important theories applied to banks – information asymmetry among agents and moral risk resulting from deposit insurance systems – which indicate a correlation between a company’s size and its performance. � e Z-score indicator is generated as a risk
Paulo Sérgio Rosa & Ivan Ricardo Gartner
7R. Cont. Fin. – USP, São Paulo
measure for large banks, using the rate of returns on assets and the ratio between equity and assets as variables. � e authors observe that the estimates with accounting data for the Z-score may not generate good results.
Chiaramonte, Croci, and Poli (2015) use the Z-score and evaluate that its popularity derives from the simplicity of computing it, requiring few data: Z-score = (ROA + Equity/Assets) /σROA. Chiaramonte, Croci, and Poli (2015) apply the Z-score indicator and the CAMELS system for a sample of European banks, concluding that the ability of that indicator is as good as the covariates of this system for identifying � nancial distress events and more e� ective when sophisticated business models are involved, as in the case of big banks. � e authors argue that other measures such as the distance-to-default from Merton (1974) and credit default swaps prices are unviable for use in the presence of banks that are not listed on stock exchanges.
The CAMELS indicators are also used by Betz, Oprica, Peltonen, and Sarlin (2014) to analyze situations
of � nancial distress in European banking institutions, with quarterly observations in the period from 2000 to 2013. � e authors de� ne three categories of � nancial distress: (i) bankruptcies; (ii) state assistance for banks in distress, both via direct capital injections and participation in protection or guarantee programs; and (iii) private sector solutions for mergers and acquisitions of entities in � nancial distress.
As a methodology for studying � nancial distress, Betz, Oprica, Peltonen, and Sarlin (2014) indicate that there is a preference for the pooled logit type model in relation to panel data analysis, due to the relatively small number of crisis cases. Instead of using lagged explanatory variables, Betz, Oprica, Peltonen, and Sarlin (2014) de� ne the dependent variable as “1” in the eight quarters before the � nancial distress event and “0” otherwise and use a recursive logit model with quarterly estimations via increasing data windows.
3. EMPIRICAL ANALYSIS METHODOLOGY
3.1 Data Sources, Sample Selection, and Computational Support
� e database for the study is composed of information from the Accounting Plan for Institutions of the National Financial System (Cosif), available from the Brazilian Central Bank website (http://www.bcb.gov.br); from historical data on economic indicators, obtained from the website of the Applied Economic Research Institute (http://www.ipea.gov.br); from real estate market price ratios, available from the São Paulo Stock, Commodities, and Futures Exchange (BM&FBOVESPA) website(http://www.bm� ovespa.com.br); from publications on special regimes decreed by the Central Bank (Temporary Special Administration Regime, Decree-Law 2,321/1987; Intervention or Receivership, Law 6,024/1974) (Brazilian Central Bank, 1974, 1987); from merger and acquisition events with the assumption of � nancial distress for the
acquired institution, reported by the country’s media. � e analysis window covers the period from January 2006 to June 2014, which enables the period of the last � nancial crisis to be incorporated and a series of � nancial distress events needed for the study.
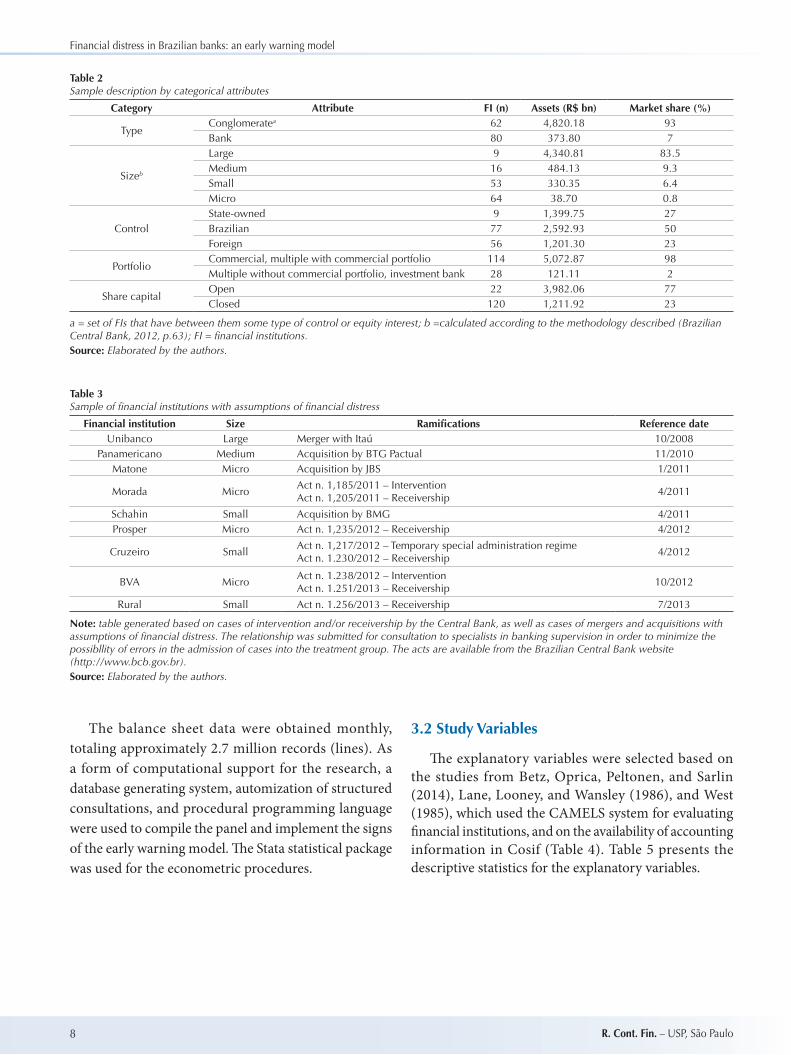
All in all, the sample contains 142 � nancial institutions, already taking into account the exclusion of 17 for which it was not possible to calculate the independent variables, and also the Caixa Econômica Federal and the National Bank for Economic and Social Development (BNDES), due to their speci� cities. � e sample description can be found in Table 2. � e treatment group (Table 3) has nine � nancial institutions, which underwent intervention and/or receivership processes or were considered by the authors, for the purposes of this study, as merger and acquisition events with the assumption of � nancial distress.
Financial distress in Brazilian banks: an early warning model
8 R. Cont. Fin. – USP, São Paulo
Table 3Sample of � nancial institutions with assumptions of � nancial distress
Financial institution Size Rami� cations Reference dateUnibanco Large Merger with Itaú 10/2008
Panamericano Medium Acquisition by BTG Pactual 11/2010Matone Micro Acquisition by JBS 1/2011
Morada MicroAct n. 1,185/2011 – InterventionAct n. 1,205/2011 – Receivership
4/2011
Schahin Small Acquisition by BMG 4/2011Prosper Micro Act n. 1,235/2012 – Receivership 4/2012
Cruzeiro SmallAct n. 1,217/2012 – Temporary special administration regimeAct n. 1.230/2012 – Receivership
4/2012
BVA MicroAct n. 1.238/2012 – InterventionAct n. 1.251/2013 – Receivership
10/2012
Rural Small Act n. 1.256/2013 – Receivership 7/2013
Note: table generated based on cases of intervention and/or receivership by the Central Bank, as well as cases of mergers and acquisitions with assumptions of � nancial distress. The relationship was submitted for consultation to specialists in banking supervision in order to minimize the possibllity of errors in the admission of cases into the treatment group. The acts are available from the Brazilian Central Bank website(http://www.bcb.gov.br).Source: Elaborated by the authors.
Table 2Sample description by categorical attributes
Category Attribute FI (n) Assets (R$ bn) Market share (%)
TypeConglomeratea 62 4,820.18 93Bank 80 373.80 7
Sizeb
Large 9 4,340.81 83.5Medium 16 484.13 9.3Small 53 330.35 6.4Micro 64 38.70 0.8
ControlState-owned 9 1,399.75 27Brazilian 77 2,592.93 50Foreign 56 1,201.30 23
PortfolioCommercial, multiple with commercial portfolio 114 5,072.87 98Multiple without commercial portfolio, investment bank 28 121.11 2
Share capitalOpen 22 3,982.06 77Closed 120 1,211.92 23
a = set of FIs that have between them some type of control or equity interest; b =calculated according to the methodology described (Brazilian Central Bank, 2012, p.63); FI = � nancial institutions.Source: Elaborated by the authors.
The balance sheet data were obtained monthly, totaling approximately 2.7 million records (lines). As a form of computational support for the research, a database generating system, automization of structured consultations, and procedural programming language were used to compile the panel and implement the signs of the early warning model. � e Stata statistical package was used for the econometric procedures.
3.2 Study Variables
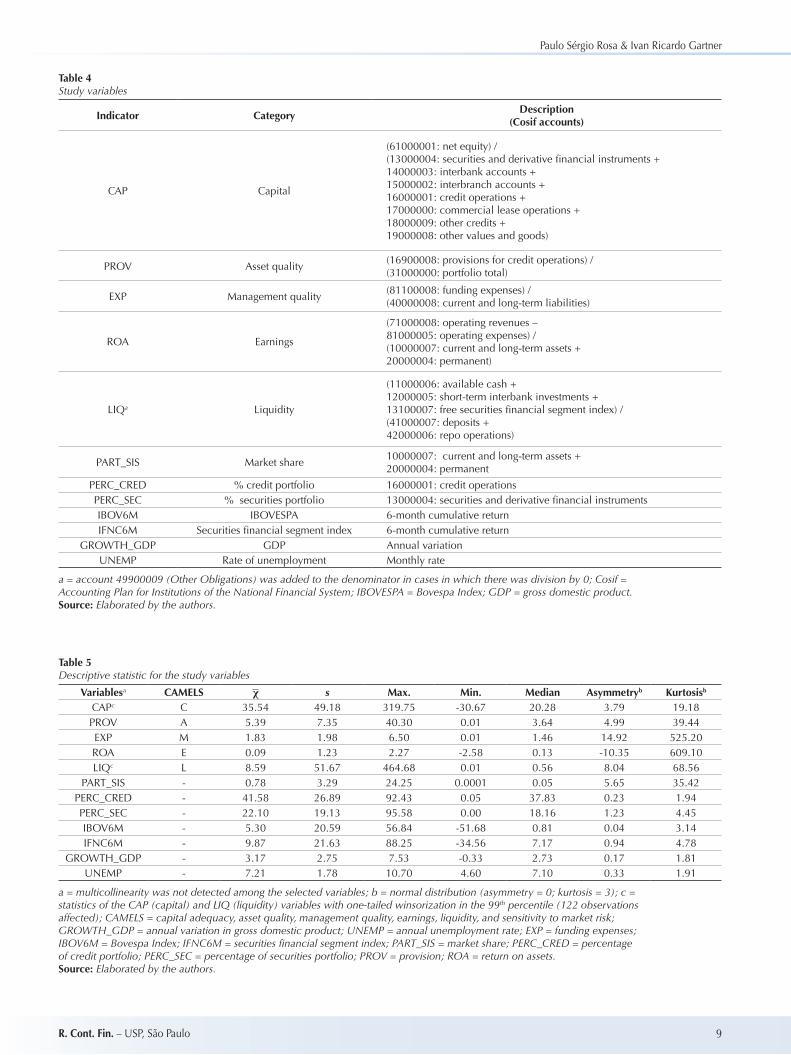
� e explanatory variables were selected based on the studies from Betz, Oprica, Peltonen, and Sarlin (2014), Lane, Looney, and Wansley (1986), and West (1985), which used the CAMELS system for evaluating � nancial institutions, and on the availability of accounting information in Cosif (Table 4). Table 5 presents the descriptive statistics for the explanatory variables.
Paulo Sérgio Rosa & Ivan Ricardo Gartner
9R. Cont. Fin. – USP, São Paulo
Table 4Study variables
Indicator CategoryDescription
(Cosif accounts)
CAP Capital
(61000001: net equity) /(13000004: securities and derivative � nancial instruments +14000003: interbank accounts +15000002: interbranch accounts +16000001: credit operations +17000000: commercial lease operations +18000009: other credits +19000008: other values and goods)
PROV Asset quality(16900008: provisions for credit operations) /(31000000: portfolio total)
EXP Management quality(81100008: funding expenses) /(40000008: current and long-term liabilities)
ROA Earnings
(71000008: operating revenues –81000005: operating expenses) /(10000007: current and long-term assets +20000004: permanent)
LIQa Liquidity
(11000006: available cash +12000005: short-term interbank investments +13100007: free securities � nancial segment index) /(41000007: deposits +42000006: repo operations)
PART_SIS Market share10000007: current and long-term assets +20000004: permanent
PERC_CRED % credit portfolio 16000001: credit operationsPERC_SEC % securities portfolio 13000004: securities and derivative � nancial instrumentsIBOV6M IBOVESPA 6-month cumulative returnIFNC6M Securities � nancial segment index 6-month cumulative return
GROWTH_GDP GDP Annual variationUNEMP Rate of unemployment Monthly rate
a = account 49900009 (Other Obligations) was added to the denominator in cases in which there was division by 0; Cosif = Accounting Plan for Institutions of the National Financial System; IBOVESPA = Bovespa Index; GDP = gross domestic product.Source: Elaborated by the authors.
Table 5Descriptive statistic for the study variables
Variablesa CAMELS χ s Max. Min. Median Asymmetryb Kurtosisb
CAPc C 35.54 49.18 319.75 -30.67 20.28 3.79 19.18PROV A 5.39 7.35 40.30 0.01 3.64 4.99 39.44EXP M 1.83 1.98 6.50 0.01 1.46 14.92 525.20ROA E 0.09 1.23 2.27 -2.58 0.13 -10.35 609.10LIQc L 8.59 51.67 464.68 0.01 0.56 8.04 68.56
PART_SIS - 0.78 3.29 24.25 0.0001 0.05 5.65 35.42PERC_CRED - 41.58 26.89 92.43 0.05 37.83 0.23 1.94PERC_SEC - 22.10 19.13 95.58 0.00 18.16 1.23 4.45IBOV6M - 5.30 20.59 56.84 -51.68 0.81 0.04 3.14IFNC6M - 9.87 21.63 88.25 -34.56 7.17 0.94 4.78
GROWTH_GDP - 3.17 2.75 7.53 -0.33 2.73 0.17 1.81UNEMP - 7.21 1.78 10.70 4.60 7.10 0.33 1.91
a = multicollinearity was not detected among the selected variables; b = normal distribution (asymmetry = 0; kurtosis = 3); c = statistics of the CAP (capital) and LIQ (liquidity) variables with one-tailed winsorization in the 99th percentile (122 observations affected); CAMELS = capital adequacy, asset quality, management quality, earnings, liquidity, and sensitivity to market risk; GROWTH_GDP = annual variation in gross domestic product; UNEMP = annual unemployment rate; EXP = funding expenses; IBOV6M = Bovespa Index; IFNC6M = securities � nancial segment index; PART_SIS = market share; PERC_CRED = percentage of credit portfolio; PERC_SEC = percentage of securities portfolio; PROV = provision; ROA = return on assets.Source: Elaborated by the authors.
Financial distress in Brazilian banks: an early warning model
10 R. Cont. Fin. – USP, São Paulo
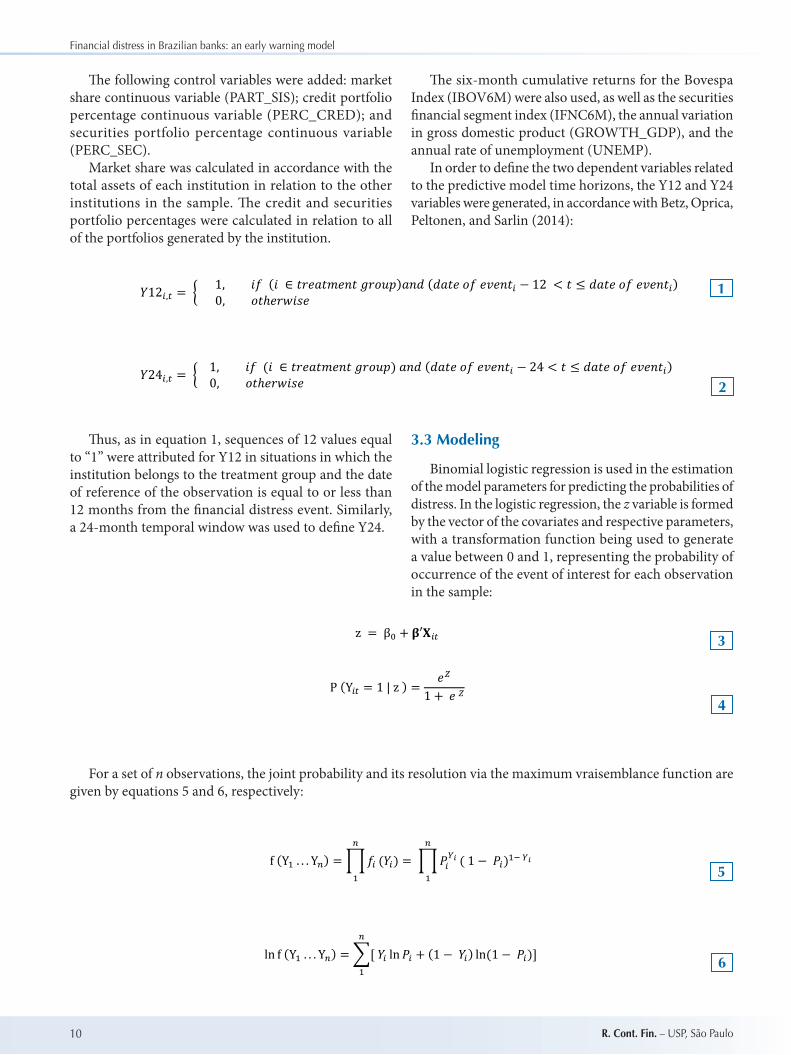
� e following control variables were added: market share continuous variable (PART_SIS); credit portfolio percentage continuous variable (PERC_CRED); and securities portfolio percentage continuous variable (PERC_SEC).
Market share was calculated in accordance with the total assets of each institution in relation to the other institutions in the sample. � e credit and securities portfolio percentages were calculated in relation to all of the portfolios generated by the institution.
� e six-month cumulative returns for the Bovespa Index (IBOV6M) were also used, as well as the securities � nancial segment index (IFNC6M), the annual variation in gross domestic product (GROWTH_GDP), and the annual rate of unemployment (UNEMP).
In order to de� ne the two dependent variables related to the predictive model time horizons, the Y12 and Y24 variables were generated, in accordance with Betz, Oprica, Peltonen, and Sarlin (2014):
� us, as in equation 1, sequences of 12 values equal to “1” were attributed for Y12 in situations in which the institution belongs to the treatment group and the date of reference of the observation is equal to or less than 12 months from the � nancial distress event. Similarly, a 24-month temporal window was used to de� ne Y24.
3.3 Modeling
Binomial logistic regression is used in the estimation of the model parameters for predicting the probabilities of distress. In the logistic regression, the z variable is formed by the vector of the covariates and respective parameters, with a transformation function being used to generate a value between 0 and 1, representing the probability of occurrence of the event of interest for each observation in the sample:
For a set of n observations, the joint probability and its resolution via the maximum vraisemblance function are given by equations 5 and 6, respectively:
3
4
5
6
1
2
𝑌𝑌12�,� = � 1, 𝑖𝑖𝑖𝑖 (𝑖𝑖 ∈ 𝑡𝑡𝑡𝑡𝑡𝑡𝑡𝑡𝑡𝑡𝑡𝑡𝑡𝑡𝑡𝑡𝑡𝑡 𝑔𝑔𝑡𝑡𝑔𝑔𝑔𝑔𝑔𝑔)𝑡𝑡𝑡𝑡𝑎𝑎 (𝑎𝑎𝑡𝑡𝑡𝑡𝑡𝑡 𝑔𝑔𝑖𝑖 𝑡𝑡𝑒𝑒𝑡𝑡𝑡𝑡𝑡𝑡� − 12 < 𝑡𝑡 ≤ 𝑎𝑎𝑡𝑡𝑡𝑡𝑡𝑡 𝑔𝑔𝑖𝑖 𝑡𝑡𝑒𝑒𝑡𝑡𝑡𝑡𝑡𝑡�) 0, 𝑔𝑔𝑡𝑡ℎ𝑡𝑡𝑡𝑡𝑒𝑒𝑖𝑖𝑒𝑒𝑡𝑡
𝑌𝑌24�,� = � 1, 𝑖𝑖𝑖𝑖 (𝑖𝑖 ∈ 𝑡𝑡𝑡𝑡𝑡𝑡𝑡𝑡𝑡𝑡𝑡𝑡𝑡𝑡𝑡𝑡𝑡𝑡 𝑔𝑔𝑡𝑡𝑔𝑔𝑔𝑔𝑔𝑔) 𝑡𝑡𝑡𝑡𝑎𝑎 (𝑎𝑎𝑡𝑡𝑡𝑡𝑡𝑡 𝑔𝑔𝑖𝑖 𝑡𝑡𝑒𝑒𝑡𝑡𝑡𝑡𝑡𝑡� − 24 < 𝑡𝑡 ≤ 𝑎𝑎𝑡𝑡𝑡𝑡𝑡𝑡 𝑔𝑔𝑖𝑖 𝑡𝑡𝑒𝑒𝑡𝑡𝑡𝑡𝑡𝑡�) 0, 𝑔𝑔𝑡𝑡ℎ𝑡𝑡𝑡𝑡𝑒𝑒𝑖𝑖𝑒𝑒𝑡𝑡
z = β� + 𝛃𝛃′𝐗𝐗��
P (Y�� = 1 | z ) =𝑒𝑒�
1 + 𝑒𝑒 �
f (Y� . . . Y�) = � 𝑓𝑓� (𝑌𝑌�) = � 𝑃𝑃���
�
�
( 1 − 𝑃𝑃�)�� ��
�
�
ln f (Y� . . . Y�) = �[ 𝑌𝑌� ln 𝑃𝑃� + (1 − 𝑌𝑌�) ln(1 − 𝑃𝑃�)]�
�
Paulo Sérgio Rosa & Ivan Ricardo Gartner
11R. Cont. Fin. – USP, São Paulo
� e logistic regression with pooled data has been used in studies of this type, as analyzed by Betz, Oprica, Peltonen, and Sarlin (2014) and Sarlin (2013). � us, the pooled logit model was used for the regression of the independent variables over the selected dependent variable. � e data were grouped in a panel, with the cross-sectional units being monitored over the course of the sampling period (spatial and temporal dimensions). � e panel is of the unbalanced type, since because of a lack of data in the monthly balance sheets, some economic-� nancial indicators were not calculated. Of the total of 12,136 observations in the panel, 10,994 are complete observations, containing values for all of the independent variables.
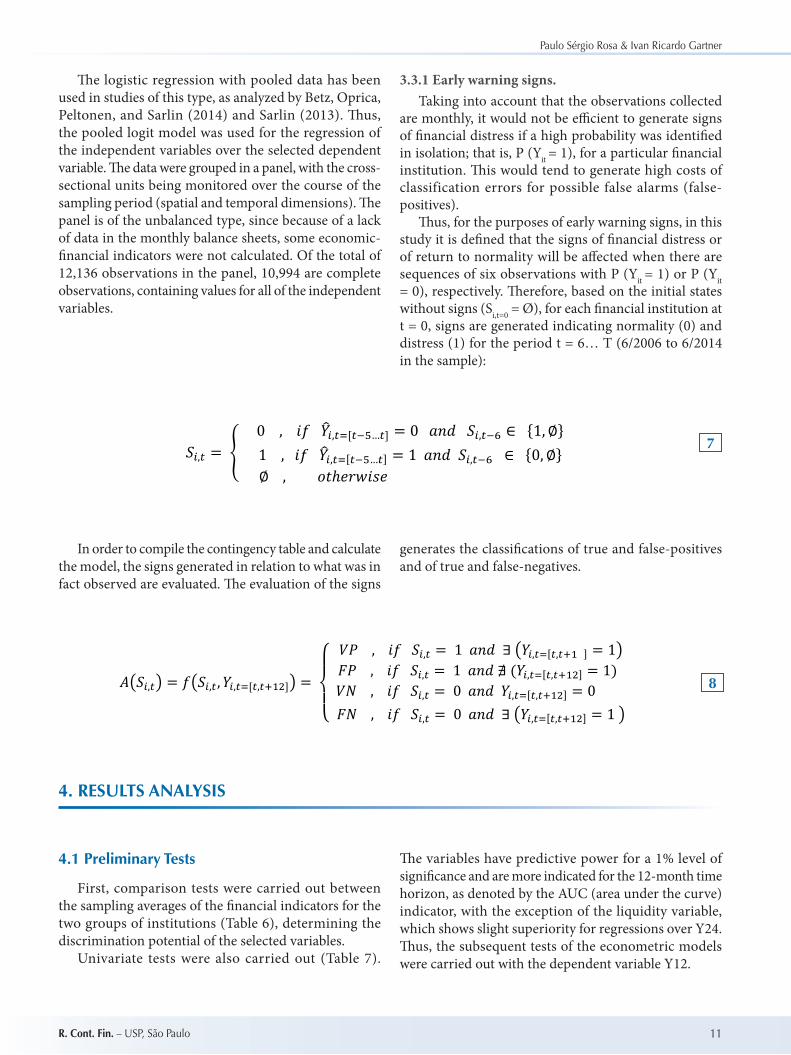
3.3.1 Early warning signs.Taking into account that the observations collected
are monthly, it would not be e� cient to generate signs of � nancial distress if a high probability was identi� ed in isolation; that is, P (Yit = 1), for a particular � nancial institution. � is would tend to generate high costs of classification errors for possible false alarms (false-positives).
� us, for the purposes of early warning signs, in this study it is de� ned that the signs of � nancial distress or of return to normality will be a� ected when there are sequences of six observations with P (Yit = 1) or P (Yit = 0), respectively. � erefore, based on the initial states without signs (Si,t=0 = Ø), for each � nancial institution at t = 0, signs are generated indicating normality (0) and distress (1) for the period t = 6… T (6/2006 to 6/2014 in the sample):
In order to compile the contingency table and calculate the model, the signs generated in relation to what was in fact observed are evaluated. � e evaluation of the signs
generates the classi� cations of true and false-positives and of true and false-negatives.
4. RESULTS ANALYSIS
4.1 Preliminary Tests
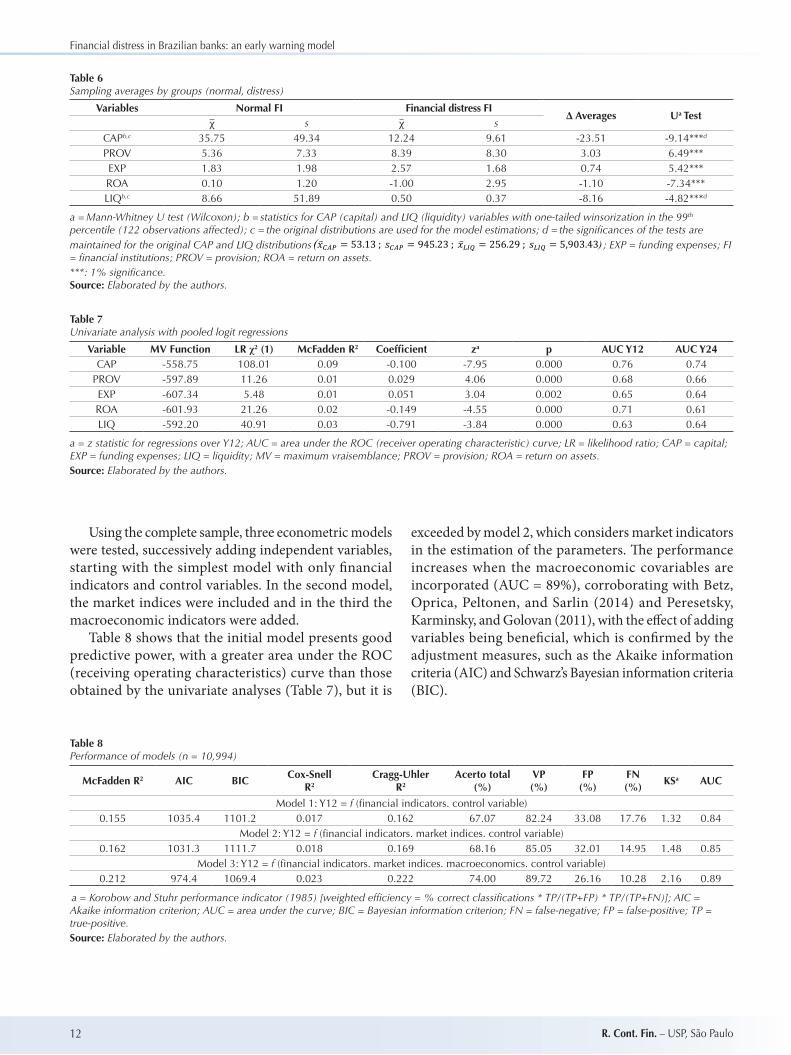
First, comparison tests were carried out between the sampling averages of the � nancial indicators for the two groups of institutions (Table 6), determining the discrimination potential of the selected variables.
Univariate tests were also carried out (Table 7).
� e variables have predictive power for a 1% level of signi� cance and are more indicated for the 12-month time horizon, as denoted by the AUC (area under the curve) indicator, with the exception of the liquidity variable, which shows slight superiority for regressions over Y24. � us, the subsequent tests of the econometric models were carried out with the dependent variable Y12.
7
8
𝑆𝑆�,� = � 0 , 𝑖𝑖𝑖𝑖 𝑌𝑌��,��[���…�] = 0 𝑎𝑎𝑎𝑎𝑎𝑎 𝑆𝑆�,��� ∈ {1, ∅} 1 , 𝑖𝑖𝑖𝑖 𝑌𝑌��,��[���…�] = 1 𝑎𝑎𝑎𝑎𝑎𝑎 𝑆𝑆�,��� ∈ {0, ∅}∅ , 𝑜𝑜𝑜𝑜ℎ𝑒𝑒𝑒𝑒𝑒𝑒𝑖𝑖𝑒𝑒𝑒𝑒
𝐴𝐴�𝑆𝑆�,�� = 𝑖𝑖�𝑆𝑆�,�, 𝑌𝑌�,��[�,����]� =
⎩⎪⎨
⎪⎧ 𝑉𝑉𝑉𝑉 , 𝑖𝑖𝑖𝑖 𝑆𝑆�,� = 1 𝑎𝑎𝑎𝑎𝑎𝑎 ∃ �𝑌𝑌�,��[�,��� ] = 1�
𝐹𝐹𝑉𝑉 , 𝑖𝑖𝑖𝑖 𝑆𝑆�,� = 1 𝑎𝑎𝑎𝑎𝑎𝑎 ∄ (𝑌𝑌�,��[�,����] = 1) 𝑉𝑉𝑉𝑉 , 𝑖𝑖𝑖𝑖 𝑆𝑆�,� = 0 𝑎𝑎𝑎𝑎𝑎𝑎 𝑌𝑌�,��[�,����] = 0
𝐹𝐹𝑉𝑉 , 𝑖𝑖𝑖𝑖 𝑆𝑆�,� = 0 𝑎𝑎𝑎𝑎𝑎𝑎 ∃ �𝑌𝑌�,��[�,����] = 1 �
Financial distress in Brazilian banks: an early warning model
12 R. Cont. Fin. – USP, São Paulo
Table 6Sampling averages by groups (normal, distress)
Variables Normal FI Financial distress FI∆ Averages Ua Test
χ s χ sCAPb,c 35.75 49.34 12.24 9.61 -23.51 -9.14***d
PROV 5.36 7.33 8.39 8.30 3.03 6.49***EXP 1.83 1.98 2.57 1.68 0.74 5.42***ROA 0.10 1.20 -1.00 2.95 -1.10 -7.34***LIQb,c 8.66 51.89 0.50 0.37 -8.16 -4.82***d
a = Mann-Whitney U test (Wilcoxon); b = statistics for CAP (capital) and LIQ (liquidity) variables with one-tailed winsorization in the 99th percentile (122 observations affected); c = the original distributions are used for the model estimations; d = the signi� cances of the tests are maintained for the original CAP and LIQ distributions
(�̅�𝑥��� = 53.13 ; 𝑠𝑠��� = 945.23 ; �̅�𝑥��� = 256.29 ; 𝑠𝑠��� = 5,903.43)
; EXP = funding expenses; FI = � nancial institutions; PROV = provision; ROA = return on assets. ***: 1% signi� cance.Source: Elaborated by the authors.
Table 7Univariate analysis with pooled logit regressions
Variable MV Function LR χ2 (1) McFadden R2 Coef� cient za p AUC Y12 AUC Y24CAP -558.75 108.01 0.09 -0.100 -7.95 0.000 0.76 0.74
PROV -597.89 11.26 0.01 0.029 4.06 0.000 0.68 0.66EXP -607.34 5.48 0.01 0.051 3.04 0.002 0.65 0.64ROA -601.93 21.26 0.02 -0.149 -4.55 0.000 0.71 0.61LIQ -592.20 40.91 0.03 -0.791 -3.84 0.000 0.63 0.64
a = z statistic for regressions over Y12; AUC = area under the ROC (receiver operating characteristic) curve; LR = likelihood ratio; CAP = capital; EXP = funding expenses; LIQ = liquidity; MV = maximum vraisemblance; PROV = provision; ROA = return on assets.Source: Elaborated by the authors.
Using the complete sample, three econometric models were tested, successively adding independent variables, starting with the simplest model with only � nancial indicators and control variables. In the second model, the market indices were included and in the third the macroeconomic indicators were added.
Table 8 shows that the initial model presents good predictive power, with a greater area under the ROC (receiving operating characteristics) curve than those obtained by the univariate analyses (Table 7), but it is
exceeded by model 2, which considers market indicators in the estimation of the parameters. � e performance increases when the macroeconomic covariables are incorporated (AUC = 89%), corroborating with Betz, Oprica, Peltonen, and Sarlin (2014) and Peresetsky, Karminsky, and Golovan (2011), with the e� ect of adding variables being bene� cial, which is con� rmed by the adjustment measures, such as the Akaike information criteria (AIC) and Schwarz’s Bayesian information criteria (BIC).
Table 8Performance of models (n = 10,994)
McFadden R2 AIC BICCox-Snell
R2Cragg-Uhler
R2Acerto total
(%)VP(%)
FP(%)
FN(%)
KSa AUC
Model 1: Y12 = f (� nancial indicators. control variable)0.155 1035.4 1101.2 0.017 0.162 67.07 82.24 33.08 17.76 1.32 0.84
Model 2: Y12 = f (� nancial indicators. market indices. control variable)0.162 1031.3 1111.7 0.018 0.169 68.16 85.05 32.01 14.95 1.48 0.85
Model 3: Y12 = f (� nancial indicators. market indices. macroeconomics. control variable)0.212 974.4 1069.4 0.023 0.222 74.00 89.72 26.16 10.28 2.16 0.89
a = Korobow and Stuhr performance indicator (1985) [weighted ef� ciency = % correct classi� cations * TP/(TP+FP) * TP/(TP+FN)]; AIC = Akaike information criterion; AUC = area under the curve; BIC = Bayesian information criterion; FN = false-negative; FP = false-positive; TP = true-positive. Source: Elaborated by the authors.
Paulo Sérgio Rosa & Ivan Ricardo Gartner
13R. Cont. Fin. – USP, São Paulo
It is also observed that the rate of true-positives increases to around 89%, while the Korobow and Stuhr index (1985) also shows this improvement. � e type I errors (erroneous classi� cation of � nancial distress as normal situations) fall to 10%. In light of these results, the following tests are conducted in accordance with the speci� cation of model 3.
4.2 Adjustment, Adequacy, and Validation of the Model
Tserng, Chen, Huang, Lei, and Tran (2014) highlight that the construction of a predictive model requires validation in a di� erent sample (cross-validation) from
the estimation to avoid the problem of over-� tting, which would result in models that only perform well in the sample used.
For this, the total sample of 10,994 observations was divided into two subsets: the � rst, with 70% of the observations and � ve ninths of the cases of � nancial distress, was used in the estimation of the parameters and the second, with 30% of the observations and four ninths of the cases of the event of interest, was assigned to the validation tests (out-of-sample).
� e model estimation can be found in Table 9. � e classi� cation of the estimation sample observations can be found in Table 10.
Table 9Estimation of the model (n = 7,585)
Y12 β Standard errora |z| Standard error |z| Standard error |z| exp(β)(1) (2) (3)
Intercept 3.250 1.232 2.64*** 0.931 3.49*** 1.699 1.91* 25.78CAP -0.062 0.015 4.10*** 0.013 4.71*** 0.030 2.10** 0.94
PROV 0.058 0.018 3.26*** 0.012 4.61*** 0.026 2.27** 1.06EXP 0.056 0.030 1.93** 0.017 3.26*** 0.026 2.16** 1.05ROA -0.466 0.086 5.41*** 0.076 6.13*** 0.137 3.40*** 0.63LIQ -0.984 0.204 4.82*** 0.162 6.07*** 0.373 2.63*** 0.36
PART_SIS -0.053 0.045 1.18 0.019 2.78*** 0.067 0.79 0.95PERC_CRED -0.014 0.009 1.61* 0.005 3.06*** 0.013 1.08 0.99PERC_SEC 0.022 0.009 2.48*** 0.007 3.01*** 0.023 0.94 1.02IBOV6M 0.059 0.020 2.89*** 0.018 3.26*** 0.009 6.89*** 1.06IFNC6M -0.072 0.023 3.13*** 0.021 3.49*** 0.011 6.56*** 0.93
GROWTH_GDP 0.213 0.062 3.42*** 0.059 3.60*** 0.079 2.69*** 1.24UNEMP -1.031 0.158 6.53*** 0.123 8.34*** 0.277 3.72*** 0.36
MV Function -316.8McFadden R2 0.24
LR χ2 (12) 198.9Prob > χ2 0.000
a = the variances and covariances matrix of the estimators was calculated using the standard least squares method in model 1, with heteroskedasticity correction by White adjustments in model 2 and with adjustments by clusterization in model 3; CAP = capital; GROWTH_GDP = annual variation in gross domestic product; UNEMP = annual rate of unemployment; EXP = funding expenses; IBOV6M = Bovespa Index; IFNC6M = securities � nancial segment index; LIQ = liquidity; MV = maximum vraisemblance; PART_SIS = market share; PERC_CRED = credit portfolio percentage; PERC_SEC= securities portfolio percentage; PROV = provision; ROA = return on assets. ***, **, *: 1%, 5%, and 10% signi� cance, respectively.Source: Elaborated by the authors.
Table 10Contingency table (model estimation)
RealityDistress Normal Total
Classi� cationDistress 60 1,785b 1,845Normal 14a 5,726 5,740
Total 74 7,511 7,585
a = false-negative (type I error); b = false-positive (type II error).Source: Elaborated by the authors.
Financial distress in Brazilian banks: an early warning model
14 R. Cont. Fin. – USP, São Paulo
Considering the estimators with residuals calculated using the least squares method, fourth fifths of the � nancial indicators were obtained with 1% signi� cance (capitalization, provisioning, liquidity, and return on assets), with the funding expenses variable being 5% signi� cant. When the White correction is applied for the presence of heteroskedasticity in the error terms, all of the coe� cients present 1% signi� cance. � e estimation of the residuals with the clusterization criterion is consistent with the previous � ndings. � e signs of the variables were as expected: increases in the levels of capital, in the ROA, and in liquidity reduce the probability of � nancial distress, while an increase in funding expenses and provisioning for credit operations increases this probability.
It is worth observing that a one percentage point increase in return on assets, all else remaining constant, reduces the risk of � nancial di� culties by around 37% (odds ratio). � is impact is greater with relation to the
liquidity indicator, whose inference is of a reduction of around 64% in the probability of distress for a one percentage point increase.
On the other hand, each percentage point increase in the funding expenses indicator (EXP) generates an increase in the expected probability of � nancial distress in the order of 5%. For the provisioning variable, the increase is almost in the same order (6%), suggesting that an increase in portfolio provisions does not necessarily represent poorer quality credit assets.
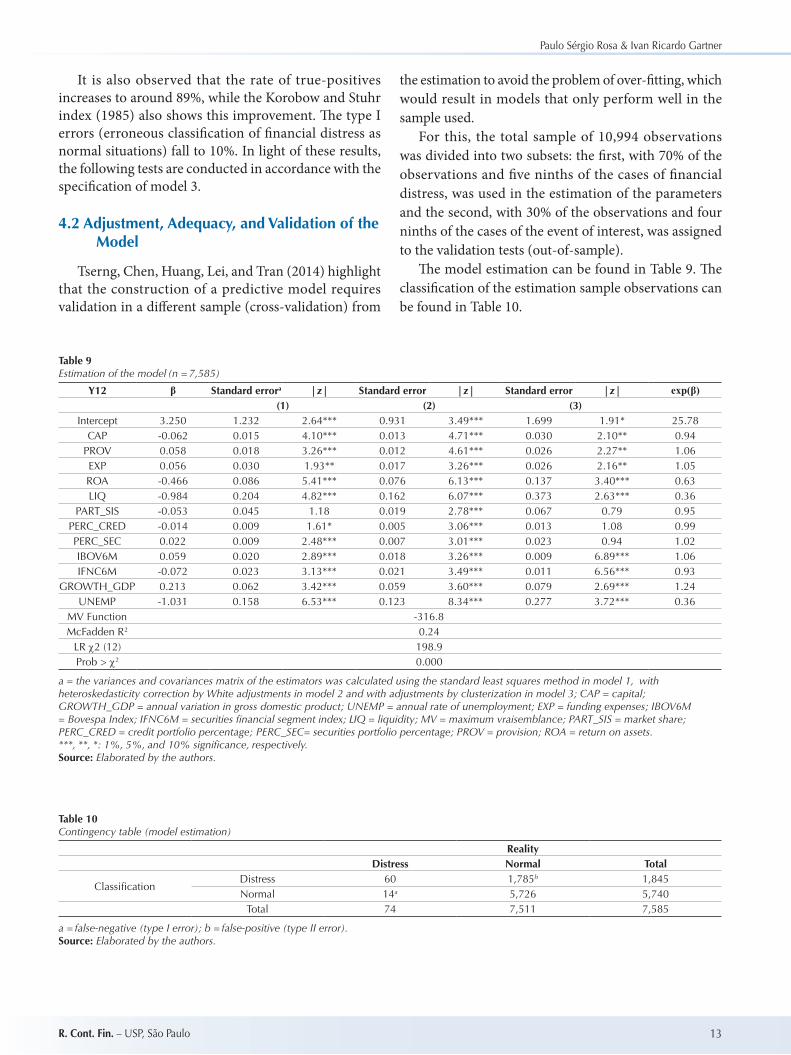
� e analysis of residuals from the generalized linear model estimation (Figure 1) indicates the presence of outliers in the observations, which mainly refer to capitalization and liquidity variables. However, the use of the distributions of these variables with winsorization in the 95% percentile did not alter the general results of the tests.
Figure 1 Pearson ResidualsSource: Elaborated by the authors.
Paulo Sérgio Rosa & Ivan Ricardo Gartner
15R. Cont. Fin. – USP, São Paulo
Figure 2 ROC (receiver operating characteristic) curveAUC = area under the curve.Source: Elaborated by the authors.
Table 11In-sample and out-of-sample tests
Observations (n) Total accuracy (%) TP (%) FP (%) FN (%) KSa AUCModel 3 – Estimation 7,585 76.28 81.08 23.77 18.92 2.01 0.896Model 3 – Validation 3,409 71.22 93.94 29.00 6.06 2.05 0.903
a = Korobow and Stuhr (1985) performance indicator [weighted ef� ciency = % correct classi� cations * TP/(TP+FP) * TP/(TP+FN)]; AUC = area under the receiver operating characteristic curve; FN = false-negative; FP = false-positive; TP = true-positive. Source: Elaborated by the authors.
Table 12Contingency table (signs)
RealityDistress Normal Total
Classi� cationDistress 8 90b 98Normal 1a 187 188
Total 9 277 286
a = false-negative (type I error); b = false-positive (type II error).Source: Elaborated by the authors.
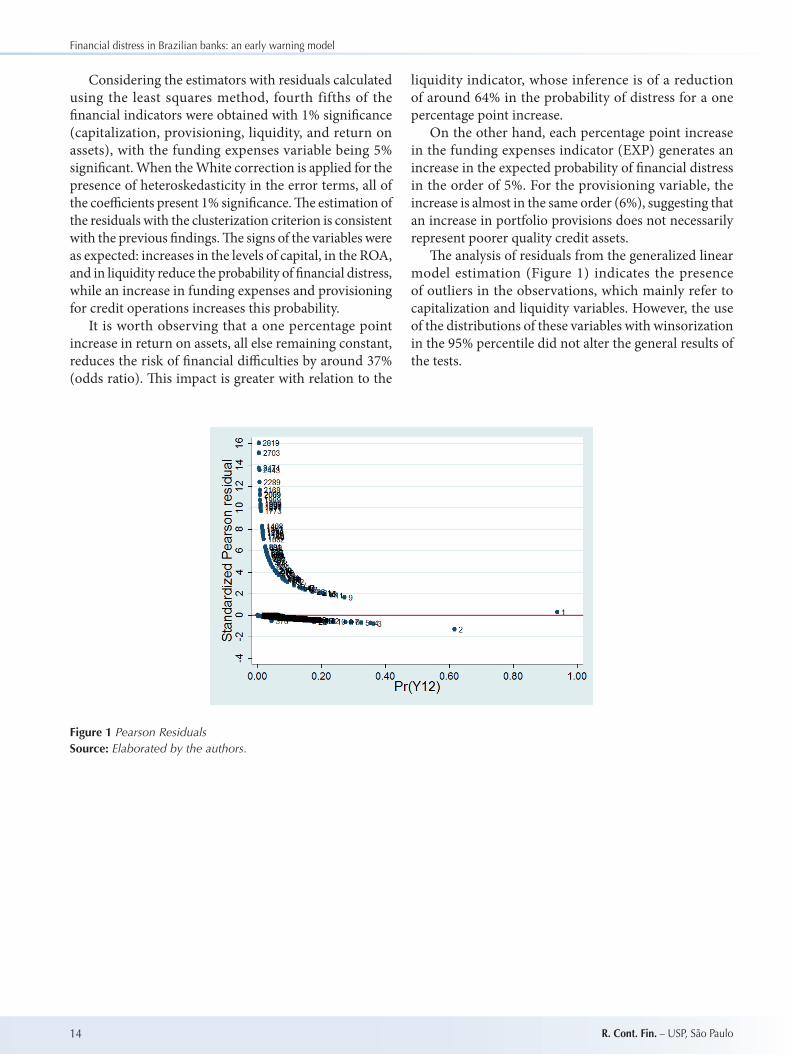
� e ROC curves for the in-sample and out-of-sample tests (Figure 2) show that the classi� cations indicated by the model studied di� er from a random classi� cation, which has equal probabilities for failure and non-failure (reference line, whose AUC is 0.50). In Figure 2, it is perceived that while the true-positive (sensitivity) classi� cations reach almost 75%, the false-positive (1 –
speci� city) classi� cations reach only around 12% for a particular cut-o� .
As shown in Table 11, the estimation with the out-of-sample data supports the predictive power of the model, both in relation to the total accuracy percentage and the speci� c type I (false-negative) and type II (false-positive) error classi� cations.
4.3 Signs
Finally, the algorithm for the early warning model signs (equation 7) and the respective evaluations (equation 8)were applied. Of the nine � nancial institutions that experienced � nancial distress in the sampling period, eight
received a sign of distress (Table 12). Of the institutions that were correctly classi� ed, there is one case of fraud, which shows that the multivariate analysis enables a combination of various factors to identify the events of interest.
Financial distress in Brazilian banks: an early warning model
16 R. Cont. Fin. – USP, São Paulo
Table 13In-sample tests, out-of-sample tests, and signs
Observations (n) Total accuracy (%) TP (%) FP (%) FN (%) KSa AUCModel 3 – Estimation 7,585 76.28 81.08 23.77 18.92 2.01 0.896Model 3 – Validation 3,409 71.22 93.94 29.00 6.06 2.05 0.903Signs – Early warning 10,994 68.18 88.89 32.49 11.11 4.95 -
a = Korobow and Stuhr (1985) performance indicator [weighted ef� ciency = % correct classi� cations * TP/(TP+FP) * TP/(TP+FN)]; AUC = area under the receiver operating characteristic curve; FN = false-negative; FP = false-positive; TP = true-positive. Source: Elaborated by the authors.
Figure 3 Average probability of default by control typeSource: Elaborated by the authors.
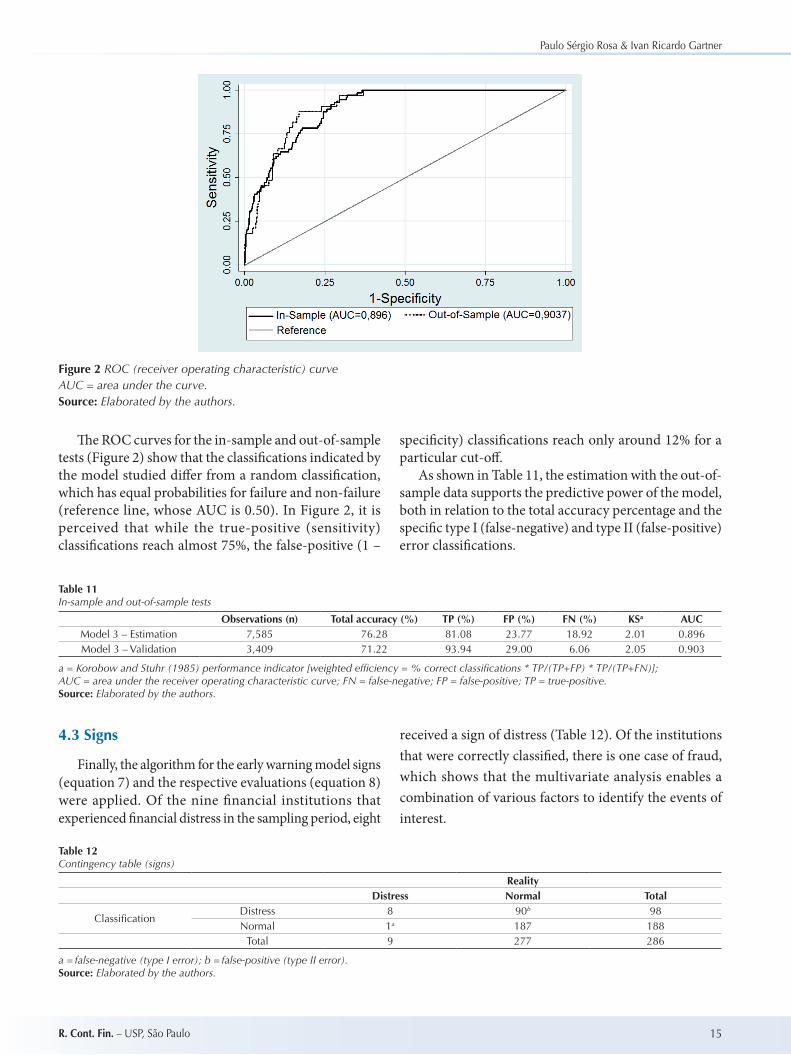
Table 13 presents a summary of the performance of the estimation and validation model and of the early warning model’s signs. With a higher performance indicator (4.95), the warning sign model, based on the need for a sequence of monthly probabilities of distress to characterize
a warning, was shown to constitute an e� ective and timely approach for microprudential monitoring, at a � nancial institution level, as well as producing inputs that contribute to monitoring systemic risk, as observed by Chan-Lau (2006).
It is important to observe that, given the treatment group, the only institution that did not obtain a sign of � nancial distress (Unibanco) had three consecutive monthly signs with
𝑃𝑃(𝑌𝑌)� = 1
, but the warning sign criterion required a sequence of six months with
𝑃𝑃(𝑌𝑌)� = 1
.It bears mentioning that sensitivity to market risk was the only dimension of the CAMELS system that was not included in the research model, due to the inviability of computing it with the data used. On the other hand, the PERC_SEC covariable aims to incorporate this aspect into the model as a measure of the securities portfolio percentage, without considering other market risk factors, such as exposures to o� -balance derivatives, which at times of crisis, such as in 2007/2008, can generate raised margin calls and e� ective losses in the contracts. It also
bears mentioning that, in reality, this institution may not have su� ered from � nancial distress as is supposed in the study.
Ninety undue signs were generated with type II errors, whose cost of classi� cation tends to be lower from the point of view of banking supervision, which routinely monitors all � nancial institutions. As 16% of this total refers to state-owned banks, the performance of the early warning model could increase if these institutions did not participate in the research sample. However, the decision was made to maintain the complete sample, with the exception of the exclusions mentioned in the methodology section. Figure 3 presents the average probabilities of default by control type.
Paulo Sérgio Rosa & Ivan Ricardo Gartner
17R. Cont. Fin. – USP, São Paulo
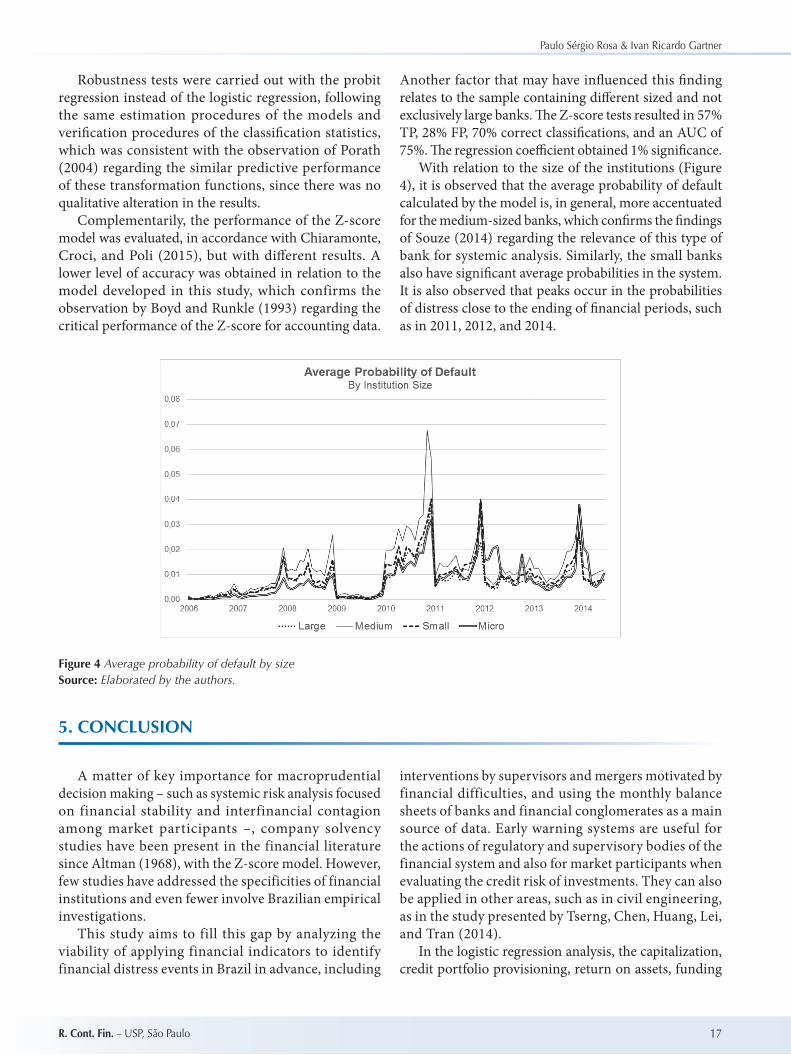
Figure 4 Average probability of default by sizeSource: Elaborated by the authors.
Robustness tests were carried out with the probit regression instead of the logistic regression, following the same estimation procedures of the models and veri� cation procedures of the classi� cation statistics, which was consistent with the observation of Porath (2004) regarding the similar predictive performance of these transformation functions, since there was no qualitative alteration in the results.
Complementarily, the performance of the Z-score model was evaluated, in accordance with Chiaramonte, Croci, and Poli (2015), but with di� erent results. A lower level of accuracy was obtained in relation to the model developed in this study, which confirms the observation by Boyd and Runkle (1993) regarding the critical performance of the Z-score for accounting data.
Another factor that may have in� uenced this � nding relates to the sample containing di� erent sized and not exclusively large banks. � e Z-score tests resulted in 57% TP, 28% FP, 70% correct classi� cations, and an AUC of 75%. � e regression coe� cient obtained 1% signi� cance.
With relation to the size of the institutions (Figure 4), it is observed that the average probability of default calculated by the model is, in general, more accentuated for the medium-sized banks, which con� rms the � ndings of Souze (2014) regarding the relevance of this type of bank for systemic analysis. Similarly, the small banks also have signi� cant average probabilities in the system. It is also observed that peaks occur in the probabilities of distress close to the ending of � nancial periods, such as in 2011, 2012, and 2014.
5. CONCLUSION
A matter of key importance for macroprudential decision making – such as systemic risk analysis focused on financial stability and interfinancial contagion among market participants –, company solvency studies have been present in the financial literature since Altman (1968), with the Z-score model. However, few studies have addressed the specificities of financial institutions and even fewer involve Brazilian empirical investigations.
This study aims to fill this gap by analyzing the viability of applying financial indicators to identify financial distress events in Brazil in advance, including
interventions by supervisors and mergers motivated by financial difficulties, and using the monthly balance sheets of banks and financial conglomerates as a main source of data. Early warning systems are useful for the actions of regulatory and supervisory bodies of the financial system and also for market participants when evaluating the credit risk of investments. They can also be applied in other areas, such as in civil engineering, as in the study presented by Tserng, Chen, Huang, Lei, and Tran (2014).
In the logistic regression analysis, the capitalization, credit portfolio provisioning, return on assets, funding
Financial distress in Brazilian banks: an early warning model
18 R. Cont. Fin. – USP, São Paulo
costs, and liquidity variables were shown to be signi� cant, showing the importance of the CAMELS dimensions for analyzing the � nancial situation of banks, which is in line with other papers that have used this categorization (Betz, Oprica, Peltonen, & Sarlin, 2014; Lane, Looney, & Wansley 1986; Wanke, Azad, & Barros, 2016; West, 1985).
Using logit regressions with pooled data and a 12-month time horizon for predicting distress, the predictive power of the estimation, validation, and early warning signs models was shown to perform well, even considering the inclusion of state-owned and investment banks in the sample. � e true-positive rates for the models were 81%, 94%, and 89%, respectively. Of the nine institutions belonging to the treatment group, eight received true-positive signs.
Considering the weighted analysis of the efficiency of the signs of financial distress, it was verified that the use of monthly data – together with criteria to avoid excessive type II errors (false-positives), due to the occurrence of sporadic probabilities of distress related to the monthly observations – results in timeliness in identifying the events of interest, in terms of an early warning model. In this study, six consecutive monthly observations with
𝑃𝑃(𝑌𝑌)� = 1
were defined as the warning sign criterion.
Regarding the structural pillars of the Basel recommendations, the study con� rmed the importance of the capitalization (Pillar 1) of the institutions as one of the modeling variables, as well as ratifying the proposition of this research: the publicly available information set involving � nancial statements constitutes a su� cient
element for modeling an early warning system for � nancial distress events in Brazil.
Thus, the empirical analysis contributes to studies on banking supervision processes (Pillar 2), which by anticipating possible cases of financial distress benefit from the effectiveness and efficiency of conducting public policies to maintain financial stability. By using data from the balance sheets of financial institutions, the study contributes to disclosure analysis (Pillar 3) in Brazil, and is in line with Brito and Assaf Neto (2008) and Brito, Assaf Neto, and Corrar (2009), who use accounting statement information to model credit risk in Brazilian companies.
Future research could incorporate the usefulness of the model for policy makers and the classi� cation costs of the early warning model, in a similar way to Betz, Oprica, Peltonen, and Sarlin (2014) in their study on European banks in the post-2008 crisis period. � e use of recursive models and moving windows to estimate parameters and predict out-of-sample probabilities tends to improve the comparison between the predictive power of models of this type.
The main limitations of this study were: (i) the relatively small number of observations for the treatment group, taking into account the limited amount of financial distress events identified; (ii) the subjective portion in the selection of merger and acquisition events with assumptions of financial distress; and (iii) the model’s lack of an independent variable related to the sensitivity to market risk of the CAMELS categorization.
REFERENCES
Agarwal, V., & Ta� er, R. (2008). Comparing the performance of market-based and accounting-based bankruptcy prediction models. Journal of Banking and Finance, 32(8), 1541-1551.
Altman, E. I. (2000). Predicting � nancial distress of companies: revisiting the Z-score and ZETA models. Retrieved from http://pages.stern.nyu.edu/~ealtman/ Zscores.pdf.
Altman, E. I. (1968). Financial ratios, discriminant analysis and the prediction of corporate bankruptcy. � e Journal of Finance, 23(4), 589-609.
Altman, E. I. (1977). Predicting performance in the savings and loan association industry. Journal of Monetary Economics, 3(4), 443-466.
Altman, E. I., Marco, G., & Varetto, F. (1994). Corporate distress diagnosis: comparisons using linear discriminant analysis and neural networks (the Italian experience). Journal of Banking and Finance, 18(3), 505-529.
Banco Central Do Brasil. (1974). Law 6,024 of March 13 1974. Dispõe sobre a intervenção e a liquidação extrajudicial de instituições � nanceiras, e dá outras providências. Retrieved from http://www.bcb.gov.br/pre/leisedecretos/Port/lei6024.pdf.
Banco Central Do Brasil. (1987). Decree-Law 2,321 of February 25 1987. Institui, em defesa das � nanças públicas, regime de administração especial temporária, nas instituições � nanceiras privadas e públicas não federais, e dá outras providências. Retrieved from http://www.bcb.gov.br/pre/leisedecretos/Port/declei2321.pdf.
Banco Central do Brasil. (2012). Relatório de Estabilidade Financeira–2012. Retrieved from http://www.bcb.gov.br.
Betz, F., Oprica, S., Peltonen, T., & Sarlin, P. (2014). Predicting distress in European banks. Journal of Banking and Finance, 45(C), 225-241.
Paulo Sérgio Rosa & Ivan Ricardo Gartner
19R. Cont. Fin. – USP, São Paulo
Boyd, J. H., & Runkle, D. E. (1993). Size and performance of banking � rms. Journal of Monetary Economics, 31(1), 47-67.
Bressan, V. G. F., Braga, M. J., & Bressan, A. A. (2004). Análise do risco de insolvência pelo modelo de Cox: uma aplicação prática. Revista de Administração de Empresas, 44(0), 83-96.
Brito, G. A. S., & Assaf Neto, A. (2008). Modelo de classi� cação de risco de crédito de empresas. Revista Contabilidade & Finanças, 19(46), 18-29.
Brito, G. A. S., Assaf Neto, A., & Corrar, L. J. (2009). Sistema de classi� cação de risco de crédito: uma aplicação a companhias abertas no Brasil. Revista Contabilidade & Finanças, 20(51), 28-43.
Campbell, J. Y., Hilscher, J., & Szilagyi, J. (2008). In search of distress risk. � e Journal of Finance, 63(6), 2899-2939.
Canedo, J., & Jaramillo, S. (2009). A network model of systemic risk: stress testing the banking system. Intelligent Systems in Accounting, Finance and Management, 16(1-2), 87-110.
Capelletto, L. R., & Corrar, L. J. (2008). Índices de risco sistêmico para o setor bancário. Revista Contabilidade & Finanças, 19(47), 6-18.
Chan-Lau, J. (2006). Fundamentals-based estimation of default probabilities: a survey. [Working Paper n. 6/149]. International Monetary Fund. Washington, DC.
Chiaramonte, L., Croci, E., & Poli, F. (2015). Should we trust the Z-score? Evidence from European Banking Industry. Global Finance Journal, 28(C), 111-131.
Cleary, S., & Hebb, G. (2016). An e� cient and functional model for predicting bank distress: in and out of sample evidence. Journal of Banking and Finance, 64(C), 101-111.
Collins, R. A., & Green, R. D. (1982). Statistical methods for bankruptcy forecasting. Journal of Economics and Business, 34(4), 349-354.
Fazio, D. M., Tabak, B. M., & Cajueiro, D. O. (2014). In� ation targeting and banking system soundness: a comprehensive analysis. [Working Paper n. 347]. Banco Central do Brasil. Brasília, DF.
Frydman, H., Altman, E. I., & Kao, D. (1985). Introducing recursive partitioning for � nancial classi� cation: the case of � nancial distress. � e Journal of Finance, 40(1), 269-291.
Gartner, I. R. (2015). Multi-attribute utility model based on the maximum entropy principle applied in the evaluation of the � nancial performance of Brazilian banks. In: Guarnieri, P. Decision models in engineering and management (pp. 29-55). Cham: Springer.
Guimarães, A. L. S., & Alves, W. O. (2009). Prevendo a insolvência de operadoras de planos de saúde. Revista de Administração de Empresas, 49(4), 459-471.
Kanitz, S. C. (1978). Como prever falências. São Paulo: McGraw-Hill do Brasil.
Korobow, L., & Stuhr, D. (1985). Performance measurement of early warning models, Journal of
Banking and Finance, 9(2), 267-273.Lane, W. R., Looney, S. W., & Wansley, J. W. (1986). An
application of the Cox proportional hazards model to bank failure. Journal of Banking and Finance, 10(4), 511-531.
Liu, Z. J. (2015). Cross-country study on the determinants of bank � nancial distress. Revista de Administração de Empresas, 55(5), 593-603.
Martin, D. (1977). Early warning of bank failure: a logit regression approach. Journal of Banking and Finance, 1(3), 249-276.
Merton, R. (1974). On the pricing of corporate debt: the risk structure of interest rates. � e Journal of Finance, 29(2), 449-470.
Minardi, A. M. A. F. (2008). Probabilidade de inadimplência de empresas brasileiras re� etida nas informações do mercado acionário. RAC-Eletrônica, 2(2), 311-329.
Minussi, J. A., Damacena, C., & Ness Jr., W. L. (2002). Um modelo de previsão de solvência utilizando regressão logística. Revista de Administração Contemporânea, 6(2), 109-128.
Onusic, L. M., Nova, S. P. C. C., & Almeida, F. C. (2007). Modelos de previsão de insolvência utilizando a análise por envoltória de dados: aplicação a empresas brasileiras. Revista de Administração Contemporânea, 11(suppl. 2), 77-97.
Peresetsky, A., Karminsky, A., & Golovan, S. (2011). Probability of default models of Russian banks. Economic Change and Restructuring, 44(4), 297-334.
Porath, D. (2004). Estimating probabilities of default for German savings banks and credit cooperatives. [Working Paper n. 6]. Deutsche Bundesbank. Frankfurt.
Sarlin, P. (2013). On policymaker’ loss functions and the evaluation of early warning systems. Economics Letters, 119(1), 1-7.
Shumway, T. (2001). Forecasting Bankruptcy more accurately: a simple hazard model. � e Journal of Business, 74(1),101-124.
Souza, S. R. (2014). Capital requirements, liquidity and � nancial stability: the case of Brazil. [Working Paper n. 375]. Banco Central do Brasil. Brasília, DF.
Tabak, B. M., Fazio, D. M., & Cajueiro, D. O. (2013). Systemically important banks and � nancial stability: the case of Latin America. Journal of Banking and Finance, 37(10), 3855-3866.
Tserng, H. P., Chen, P. C., Huang, W. H., Lei, M. C., & Tran, Q. H. (2014). Prediction of default probability for construction � rms using the logit model. Journal of Engineering and Management, 20(2), 247-255.
Valahzaghard, M. K., & Bahrami, M. (2013). Prediction of default probability in banking industry using CAMELS index: a case study of Iranian banks. Management Science Letters, 3(4), 1113-1118.
Wanke, P., Azad, M. A. K., & Barros, C. P. (2016). Financial distress and the Malaysian dual banking system: a dynamic slacks approach. Journal of Banking and Finance, 66(C), 1-18.
Financial distress in Brazilian banks: an early warning model
20 R. Cont. Fin. – USP, São Paulo
West, R. C. (1985). A factor-analytic approach to bank condition. Journal of Banking and Finance, 9(2), 253-266.
Whalen, G. (1991). A proportional hazards model of bank failure: an examination of its usefulness as an early warning tool. Federal Reserve Bank of Cleveland Economic Review, 27(1), 21-31.