Merk Business Cycle Chart Book - Merk Investments
22
U.S. Business Cycle Report August 2019 Nick Reece, CFA Senior Analyst & Portfolio Manager, Merk Investments LLC
Transcript of Merk Business Cycle Chart Book - Merk Investments
U.S. Business Cycle Report
August 2019
Nick Reece, CFA Senior Analyst & Portfolio Manager, Merk Investments LLC
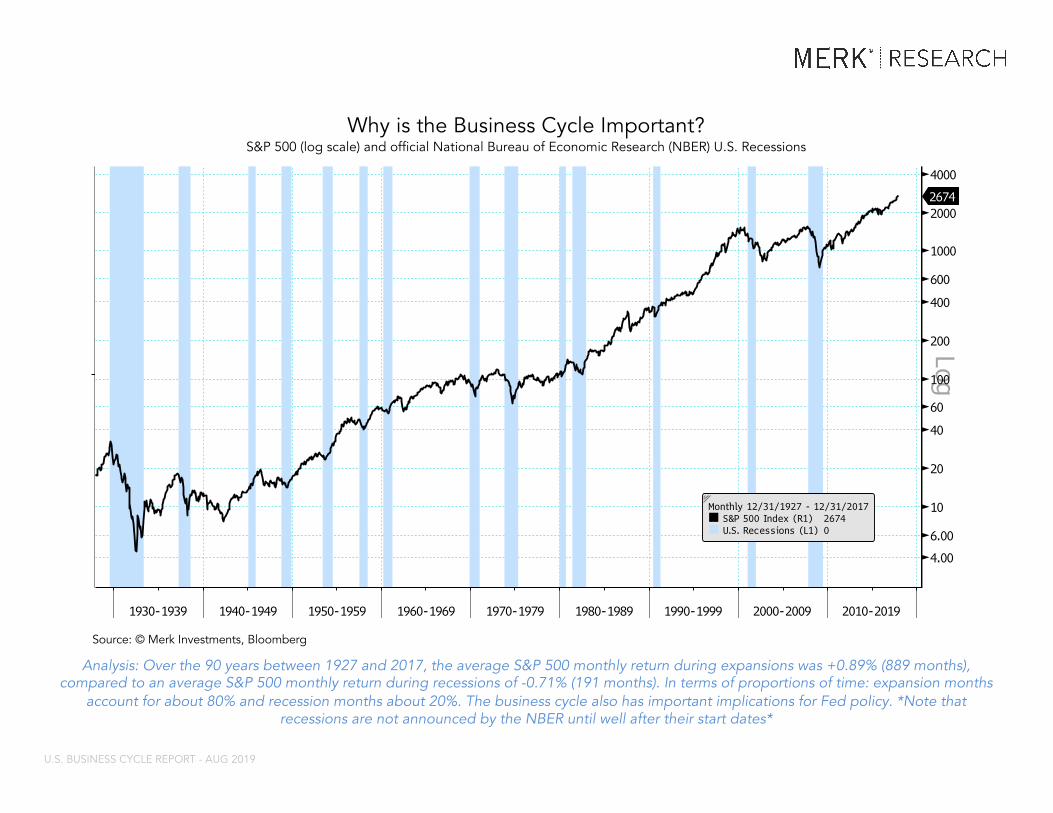
Chart - 2/1/2019SPX Index (S&P 500 Index) USRINDEX Index (U.S. Recession Indicator...
This report may not be modified or altered in any way. The BLOOMBERG PROFESSIONAL service and BLOOMBERG Data are owned and distributed locally by Bloomberg Finance LP (“BFLP”) and its subsidiaries in all jurisdictions other than Argentina, Bermuda, China, India, Japan and Korea (the (“BFLPCountries”). BFLP is a wholly-owned subsidiary of Bloomberg LP (“BLP”). BLP provides BFLP with all the global marketing and operational support and service for the Services and distributes the Services either directly or through a non-BFLP subsidiary in the BLP Countries. BFLP, BLP and their affiliatesdo not provide investment advice, and nothing herein shall constitute an offer of financial instruments by BFLP, BLP or their affiliates.
Bloomberg ® 02/01/2019 18:54:18 1
U.S. BUSINESS CYCLE REPORT - AUG 2019
Analysis: Over the 90 years between 1927 and 2017, the average S&P 500 monthly return during expansions was +0.89% (889 months),compared to an average S&P 500 monthly return during recessions of -0.71% (191 months). In terms of proportions of time: expansion months
account for about 80% and recession months about 20%. The business cycle also has important implications for Fed policy. *Note that recessions are not announced by the NBER until well after their start dates*
Why is the Business Cycle Important?S&P 500 (log scale) and official National Bureau of Economic Research (NBER) U.S. Recessions
Source: © Merk Investments, Bloomberg
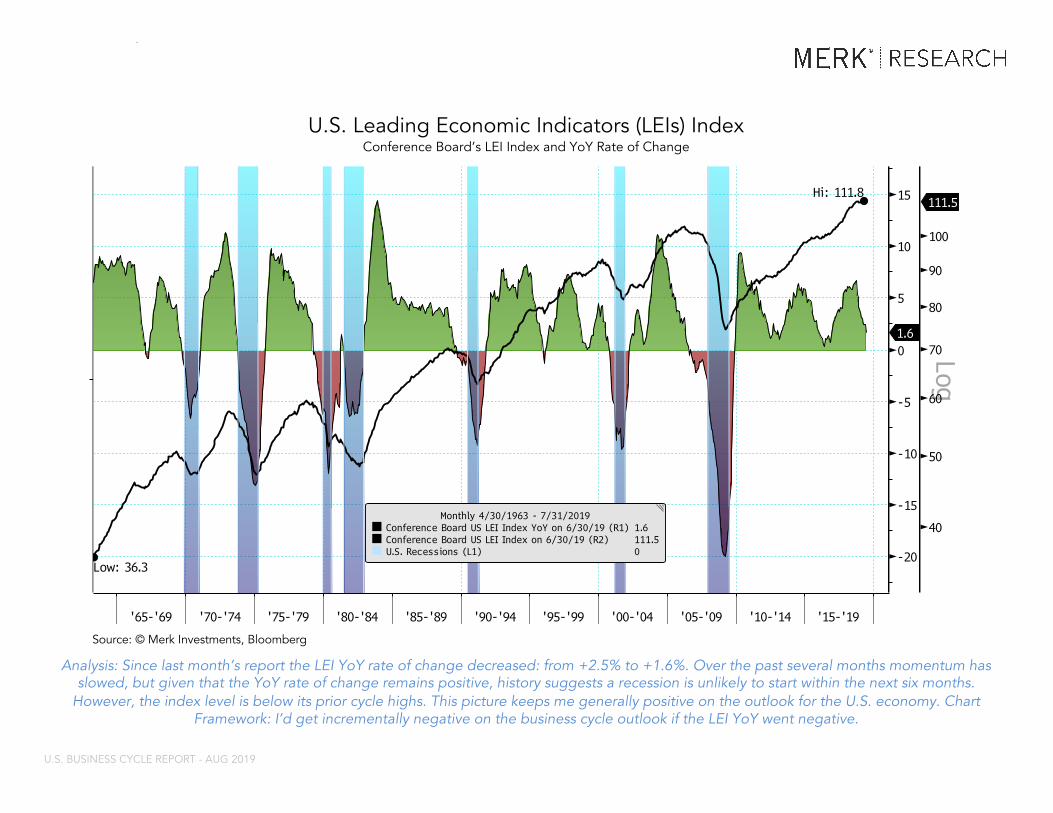
Chart - 8/5/2019LEI YOY Index (Conference Board US Leadi... LEI TOTL Index (Conference Board US Lead... USRINDEX Index (U.S. Recession Indicator...
This report may not be modified or altered in any way. The BLOOMBERG PROFESSIONAL service and BLOOMBERG Data are owned and distributed locally by Bloomberg Finance LP (“BFLP”) and its subsidiaries in all jurisdictions other than Argentina, Bermuda, China, India, Japan and Korea (the (“BFLPCountries”). BFLP is a wholly-owned subsidiary of Bloomberg LP (“BLP”). BLP provides BFLP with all the global marketing and operational support and service for the Services and distributes the Services either directly or through a non-BFLP subsidiary in the BLP Countries. BFLP, BLP and their affiliatesdo not provide investment advice, and nothing herein shall constitute an offer of financial instruments by BFLP, BLP or their affiliates.
Bloomberg ® 08/05/2019 08:34:08 27
Analysis: Since last month’s report the LEI YoY rate of change decreased: from +2.5% to +1.6%. Over the past several months momentum has slowed, but given that the YoY rate of change remains positive, history suggests a recession is unlikely to start within the next six months.
However, the index level is below its prior cycle highs. This picture keeps me generally positive on the outlook for the U.S. economy. Chart Framework: I’d get incrementally negative on the business cycle outlook if the LEI YoY went negative.
U.S. Leading Economic Indicators (LEIs) IndexConference Board’s LEI Index and YoY Rate of Change
Source: © Merk Investments, Bloomberg
U.S. BUSINESS CYCLE REPORT - AUG 2019
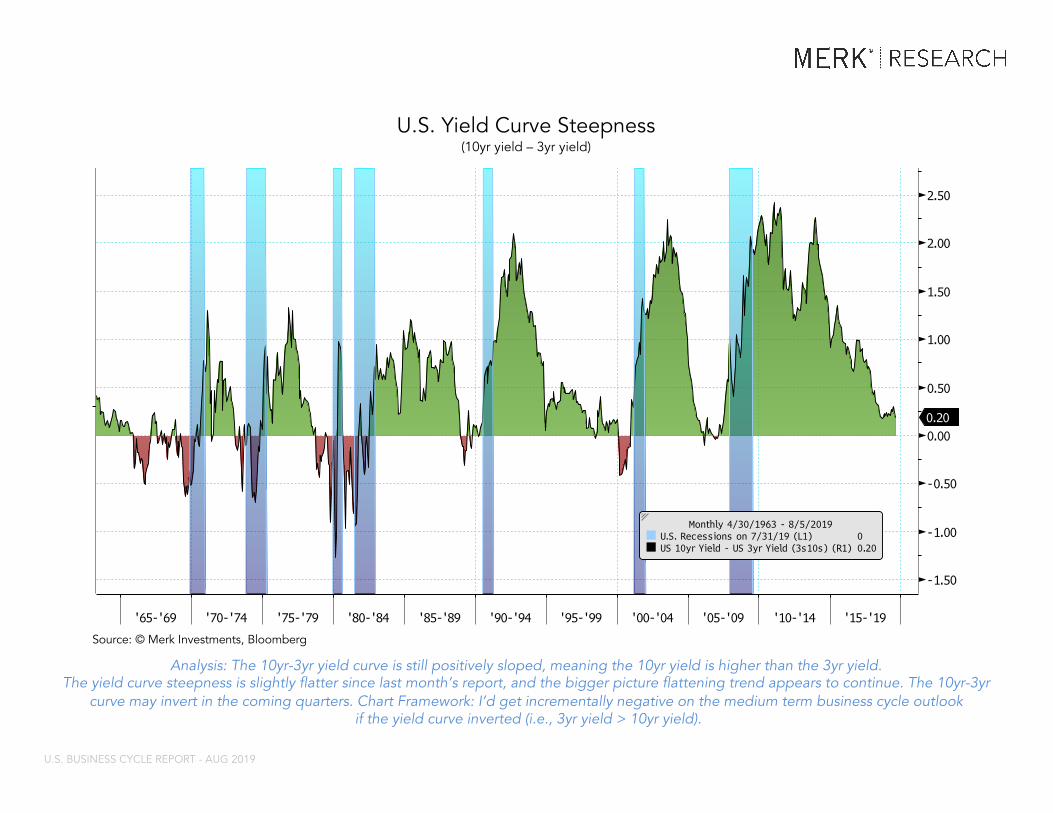
Chart - 8/5/2019USRINDEX Index (U.S. Recession Indicator... US 10yr Yield - US 3yr Yield (3s10s)
This report may not be modified or altered in any way. The BLOOMBERG PROFESSIONAL service and BLOOMBERG Data are owned and distributed locally by Bloomberg Finance LP (“BFLP”) and its subsidiaries in all jurisdictions other than Argentina, Bermuda, China, India, Japan and Korea (the (“BFLPCountries”). BFLP is a wholly-owned subsidiary of Bloomberg LP (“BLP”). BLP provides BFLP with all the global marketing and operational support and service for the Services and distributes the Services either directly or through a non-BFLP subsidiary in the BLP Countries. BFLP, BLP and their affiliatesdo not provide investment advice, and nothing herein shall constitute an offer of financial instruments by BFLP, BLP or their affiliates.
Bloomberg ® 08/05/2019 08:32:08 2
Analysis: The 10yr-3yr yield curve is still positively sloped, meaning the 10yr yield is higher than the 3yr yield.The yield curve steepness is slightly flatter since last month’s report, and the bigger picture flattening trend appears to continue. The 10yr-3yr
curve may invert in the coming quarters. Chart Framework: I’d get incrementally negative on the medium term business cycle outlookif the yield curve inverted (i.e., 3yr yield > 10yr yield).
U.S. Yield Curve Steepness(10yr yield – 3yr yield)
U.S. BUSINESS CYCLE REPORT - AUG 2019
Source: © Merk Investments, Bloomberg
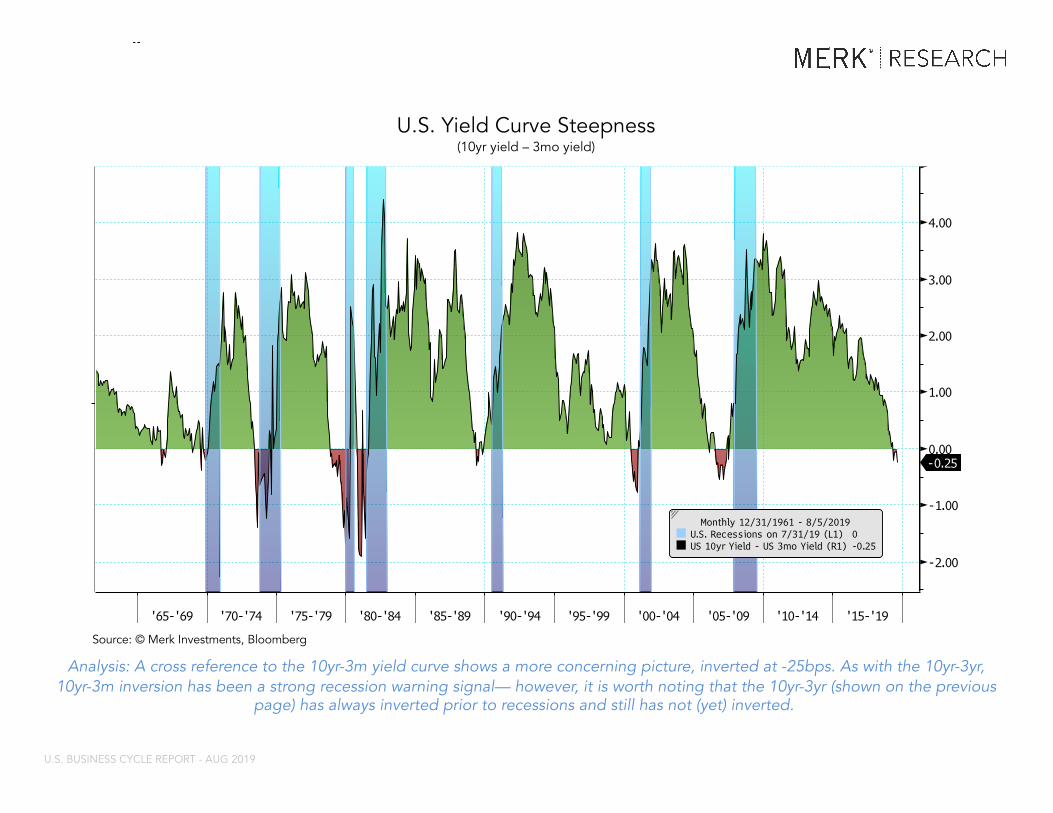
Chart - 8/5/2019USRINDEX Index (U.S. Recession Indicator... US 10yr Yield - US 3mo Yield
This report may not be modified or altered in any way. The BLOOMBERG PROFESSIONAL service and BLOOMBERG Data are owned and distributed locally by Bloomberg Finance LP (“BFLP”) and its subsidiaries in all jurisdictions other than Argentina, Bermuda, China, India, Japan and Korea (the (“BFLPCountries”). BFLP is a wholly-owned subsidiary of Bloomberg LP (“BLP”). BLP provides BFLP with all the global marketing and operational support and service for the Services and distributes the Services either directly or through a non-BFLP subsidiary in the BLP Countries. BFLP, BLP and their affiliatesdo not provide investment advice, and nothing herein shall constitute an offer of financial instruments by BFLP, BLP or their affiliates.
Bloomberg ® 08/05/2019 08:32:08 4
Analysis: A cross reference to the 10yr-3m yield curve shows a more concerning picture, inverted at -25bps. As with the 10yr-3yr, 10yr-3m inversion has been a strong recession warning signal— however, it is worth noting that the 10yr-3yr (shown on the previous
page) has always inverted prior to recessions and still has not (yet) inverted.
U.S. Yield Curve Steepness(10yr yield – 3mo yield)
U.S. BUSINESS CYCLE REPORT - AUG 2019
Source: © Merk Investments, Bloomberg
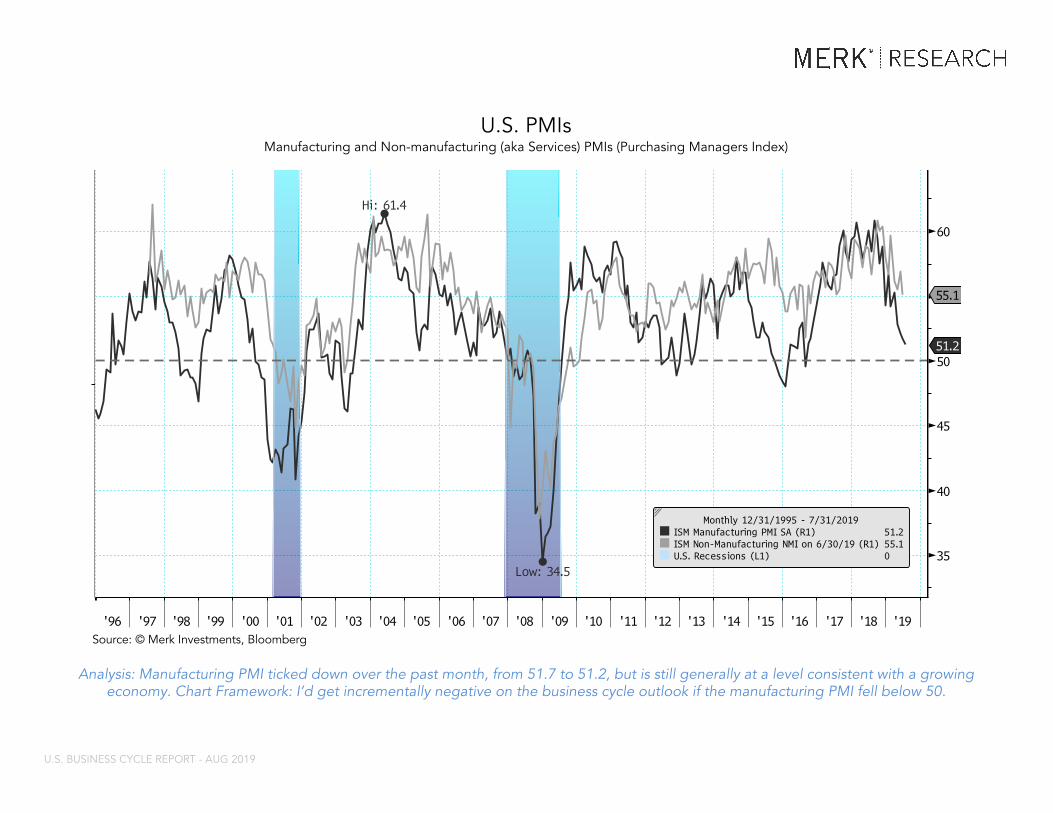
Chart - 8/5/2019NAPMPMI Index (ISM Manufacturing PMI SA) NAPMNMI Index (ISM Non-Manufacturing NMI... USRINDEX Index (U.S. Recession Indicator...
This report may not be modified or altered in any way. The BLOOMBERG PROFESSIONAL service and BLOOMBERG Data are owned and distributed locally by Bloomberg Finance LP (“BFLP”) and its subsidiaries in all jurisdictions other than Argentina, Bermuda, China, India, Japan and Korea (the (“BFLPCountries”). BFLP is a wholly-owned subsidiary of Bloomberg LP (“BLP”). BLP provides BFLP with all the global marketing and operational support and service for the Services and distributes the Services either directly or through a non-BFLP subsidiary in the BLP Countries. BFLP, BLP and their affiliatesdo not provide investment advice, and nothing herein shall constitute an offer of financial instruments by BFLP, BLP or their affiliates.
Bloomberg ® 08/05/2019 08:32:08 5
Analysis: Manufacturing PMI ticked down over the past month, from 51.7 to 51.2, but is still generally at a level consistent with a growing economy. Chart Framework: I’d get incrementally negative on the business cycle outlook if the manufacturing PMI fell below 50.
U.S. PMIsManufacturing and Non-manufacturing (aka Services) PMIs (Purchasing Managers Index)
U.S. BUSINESS CYCLE REPORT - AUG 2019
Source: © Merk Investments, Bloomberg
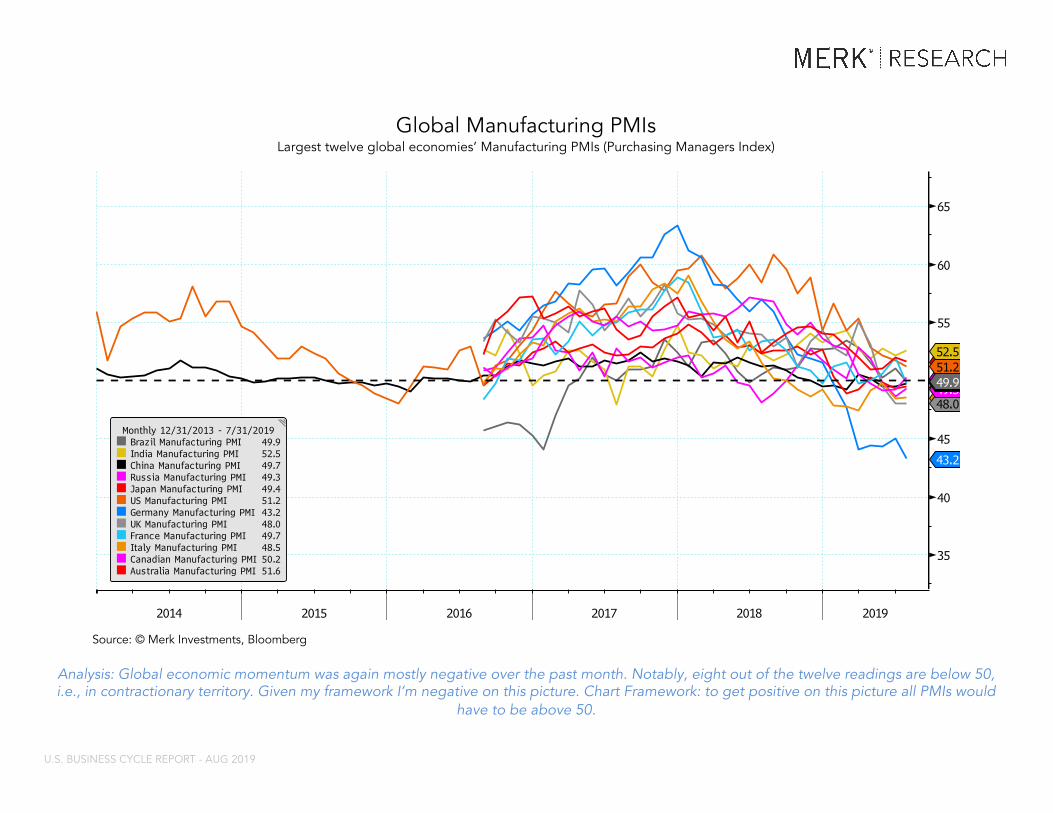
Chart - 8/5/2019MPMIBRMA Index (Markit Brazil Manufactur... MPMIJPMA Index (Jibun Bank Japan Manufac...MPMIINMA Index (Markit India Manufacturi... NAPMPMI Index (ISM Manufacturing PMI SA)CPMINDX Index (China Manufacturing PMI S... MPMIDEMA Index (Markit/BME Germany Manuf...MPMIRUMA Index (Markit Russia Manufactur... MPMIGBMA Index (Markit/CIPS UK Manufactu...
This report may not be modified or altered in any way. The BLOOMBERG PROFESSIONAL service and BLOOMBERG Data are owned and distributed locally by Bloomberg Finance LP (“BFLP”) and its subsidiaries in all jurisdictions other than Argentina, Bermuda, China, India, Japan and Korea (the (“BFLPCountries”). BFLP is a wholly-owned subsidiary of Bloomberg LP (“BLP”). BLP provides BFLP with all the global marketing and operational support and service for the Services and distributes the Services either directly or through a non-BFLP subsidiary in the BLP Countries. BFLP, BLP and their affiliatesdo not provide investment advice, and nothing herein shall constitute an offer of financial instruments by BFLP, BLP or their affiliates.
Bloomberg ® 08/05/2019 08:32:08 6 Analysis: Global economic momentum was again mostly negative over the past month. Notably, eight out of the twelve readings are below 50, i.e., in contractionary territory. Given my framework I’m negative on this picture. Chart Framework: to get positive on this picture all PMIs would
have to be above 50.
Global Manufacturing PMIsLargest twelve global economies’ Manufacturing PMIs (Purchasing Managers Index)
U.S. BUSINESS CYCLE REPORT - AUG 2019
Source: © Merk Investments, Bloomberg
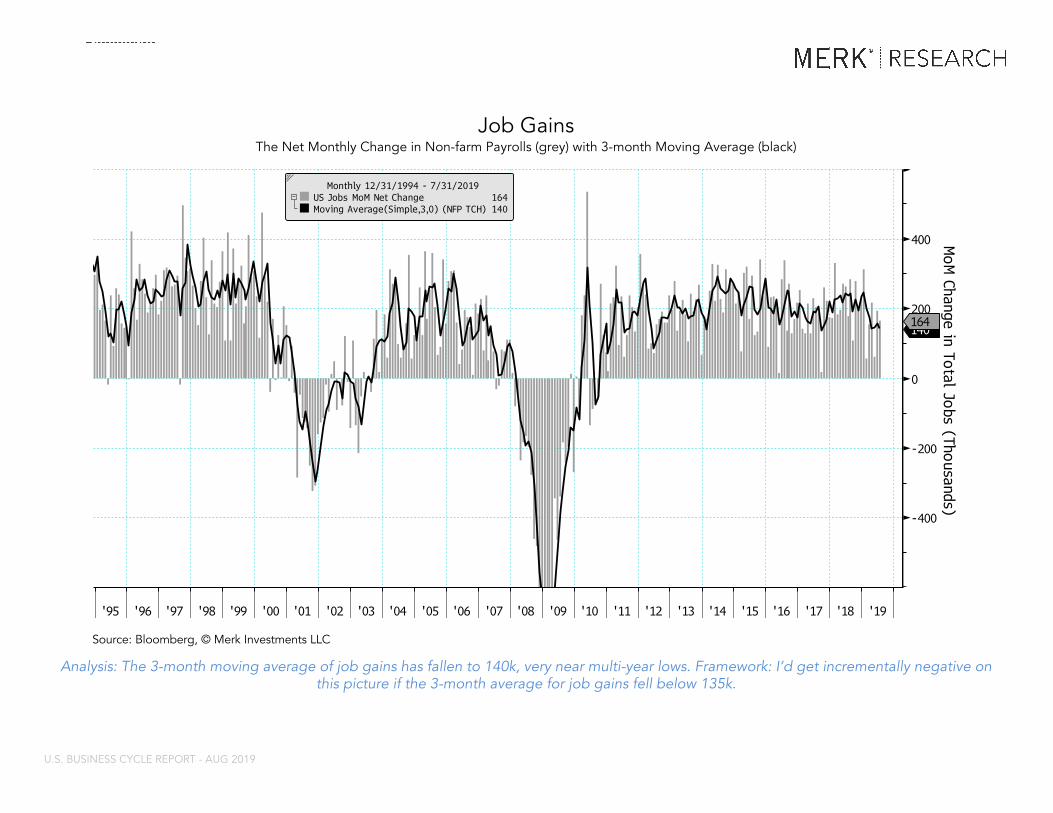
Chart - 8/5/2019NFP TCH Index (US Employees on Nonfarm P...
This report may not be modified or altered in any way. The BLOOMBERG PROFESSIONAL service and BLOOMBERG Data are owned and distributed locally by Bloomberg Finance LP (“BFLP”) and its subsidiaries in all jurisdictions other than Argentina, Bermuda, China, India, Japan and Korea (the (“BFLPCountries”). BFLP is a wholly-owned subsidiary of Bloomberg LP (“BLP”). BLP provides BFLP with all the global marketing and operational support and service for the Services and distributes the Services either directly or through a non-BFLP subsidiary in the BLP Countries. BFLP, BLP and their affiliatesdo not provide investment advice, and nothing herein shall constitute an offer of financial instruments by BFLP, BLP or their affiliates.
Bloomberg ® 08/05/2019 08:32:08 7
Source: Bloomberg, © Merk Investments LLC
Analysis: The 3-month moving average of job gains has fallen to 140k, very near multi-year lows. Framework: I’d get incrementally negative on this picture if the 3-month average for job gains fell below 135k.
Job GainsThe Net Monthly Change in Non-farm Payrolls (grey) with 3-month Moving Average (black)
U.S. BUSINESS CYCLE REPORT - AUG 2019
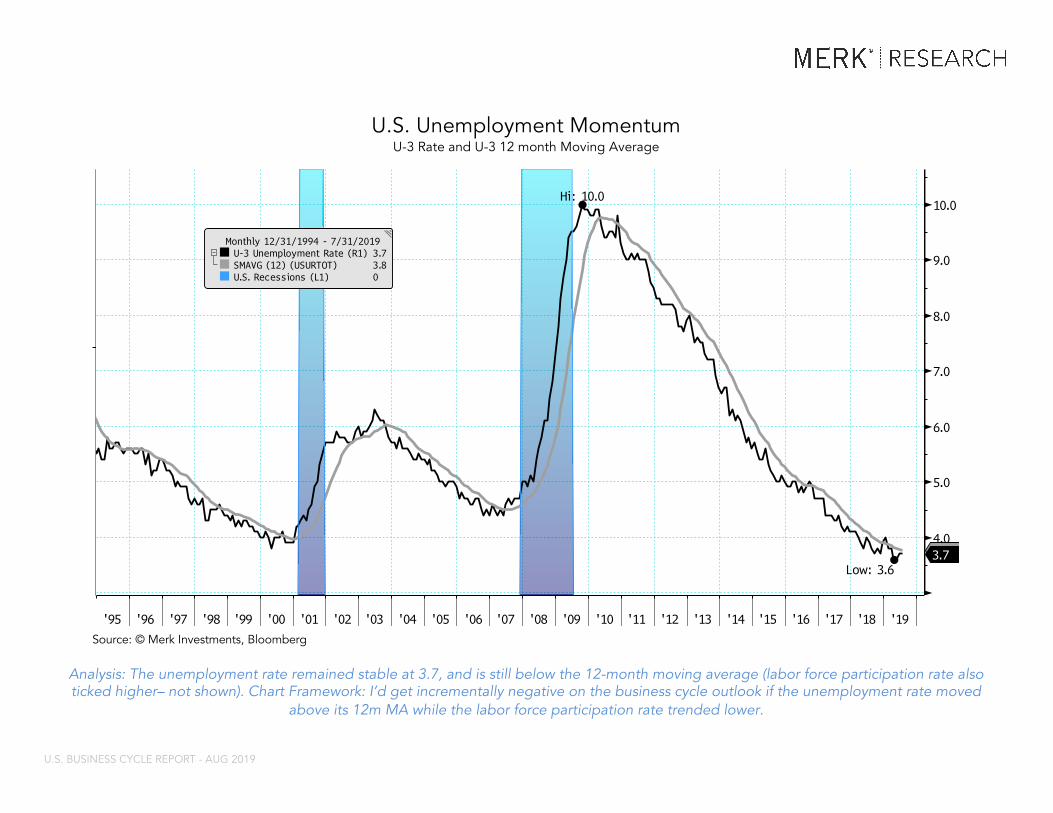
Chart - 8/5/2019USURTOT Index (U-3 US Unemployment Rate ... USRINDEX Index (U.S. Recession Indicator...
This report may not be modified or altered in any way. The BLOOMBERG PROFESSIONAL service and BLOOMBERG Data are owned and distributed locally by Bloomberg Finance LP (“BFLP”) and its subsidiaries in all jurisdictions other than Argentina, Bermuda, China, India, Japan and Korea (the (“BFLPCountries”). BFLP is a wholly-owned subsidiary of Bloomberg LP (“BLP”). BLP provides BFLP with all the global marketing and operational support and service for the Services and distributes the Services either directly or through a non-BFLP subsidiary in the BLP Countries. BFLP, BLP and their affiliatesdo not provide investment advice, and nothing herein shall constitute an offer of financial instruments by BFLP, BLP or their affiliates.
Bloomberg ® 08/05/2019 08:32:08 8
Analysis: The unemployment rate remained stable at 3.7, and is still below the 12-month moving average (labor force participation rate also ticked higher– not shown). Chart Framework: I’d get incrementally negative on the business cycle outlook if the unemployment rate moved
above its 12m MA while the labor force participation rate trended lower.
U.S. Unemployment MomentumU-3 Rate and U-3 12 month Moving Average
U.S. BUSINESS CYCLE REPORT - AUG 2019
Source: © Merk Investments, Bloomberg
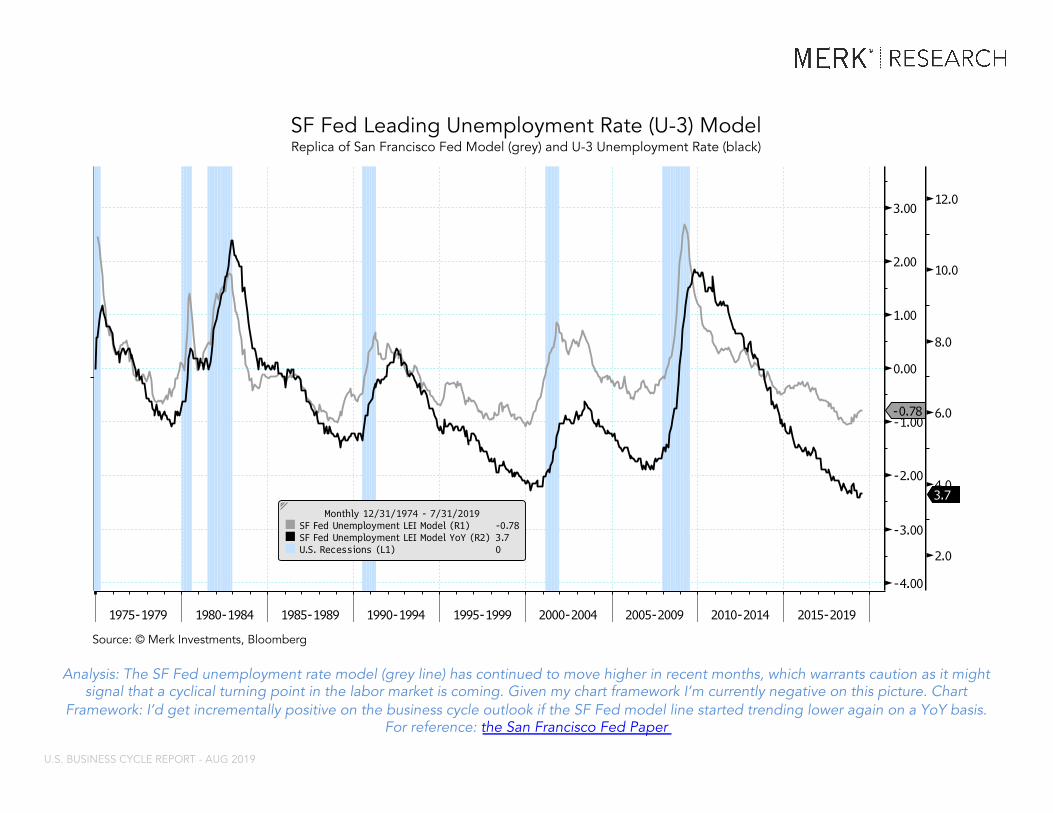
Chart - 8/5/2019.SFUM U Index (SF Fed Unemployment LEI M... USURTOT Index (U-3 US Unemployment Rate ... USRINDEX Index (U.S. Recession Indicator...
This report may not be modified or altered in any way. The BLOOMBERG PROFESSIONAL service and BLOOMBERG Data are owned and distributed locally by Bloomberg Finance LP (“BFLP”) and its subsidiaries in all jurisdictions other than Argentina, Bermuda, China, India, Japan and Korea (the (“BFLPCountries”). BFLP is a wholly-owned subsidiary of Bloomberg LP (“BLP”). BLP provides BFLP with all the global marketing and operational support and service for the Services and distributes the Services either directly or through a non-BFLP subsidiary in the BLP Countries. BFLP, BLP and their affiliatesdo not provide investment advice, and nothing herein shall constitute an offer of financial instruments by BFLP, BLP or their affiliates.
Bloomberg ® 08/05/2019 09:38:09 1
Analysis: The SF Fed unemployment rate model (grey line) has continued to move higher in recent months, which warrants caution as it might signal that a cyclical turning point in the labor market is coming. Given my chart framework I’m currently negative on this picture. Chart
Framework: I’d get incrementally positive on the business cycle outlook if the SF Fed model line started trending lower again on a YoY basis. For reference: the San Francisco Fed Paper
SF Fed Leading Unemployment Rate (U-3) ModelReplica of San Francisco Fed Model (grey) and U-3 Unemployment Rate (black)
U.S. BUSINESS CYCLE REPORT - AUG 2019
Source: © Merk Investments, Bloomberg
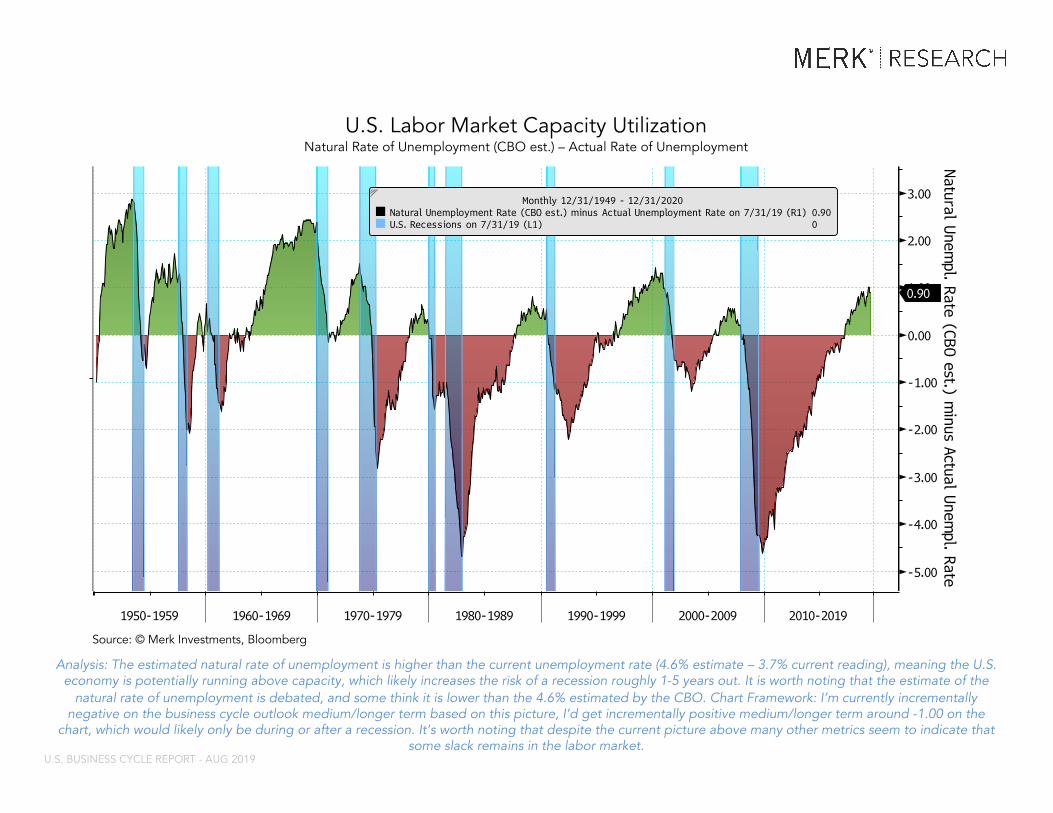
Chart - 8/5/2019Natural Unemployment Rate (CBO est.) min... USRINDEX Index (U.S. Recession Indicator...
This report may not be modified or altered in any way. The BLOOMBERG PROFESSIONAL service and BLOOMBERG Data are owned and distributed locally by Bloomberg Finance LP (“BFLP”) and its subsidiaries in all jurisdictions other than Argentina, Bermuda, China, India, Japan and Korea (the (“BFLPCountries”). BFLP is a wholly-owned subsidiary of Bloomberg LP (“BLP”). BLP provides BFLP with all the global marketing and operational support and service for the Services and distributes the Services either directly or through a non-BFLP subsidiary in the BLP Countries. BFLP, BLP and their affiliatesdo not provide investment advice, and nothing herein shall constitute an offer of financial instruments by BFLP, BLP or their affiliates.
Bloomberg ® 08/05/2019 08:32:08 11
Analysis: The estimated natural rate of unemployment is higher than the current unemployment rate (4.6% estimate – 3.7% current reading), meaning the U.S. economy is potentially running above capacity, which likely increases the risk of a recession roughly 1-5 years out. It is worth noting that the estimate of the
natural rate of unemployment is debated, and some think it is lower than the 4.6% estimated by the CBO. Chart Framework: I’m currently incrementally negative on the business cycle outlook medium/longer term based on this picture, I’d get incrementally positive medium/longer term around -1.00 on the
chart, which would likely only be during or after a recession. It’s worth noting that despite the current picture above many other metrics seem to indicate that some slack remains in the labor market.
U.S. Labor Market Capacity UtilizationNatural Rate of Unemployment (CBO est.) – Actual Rate of Unemployment
U.S. BUSINESS CYCLE REPORT - AUG 2019
Source: © Merk Investments, Bloomberg
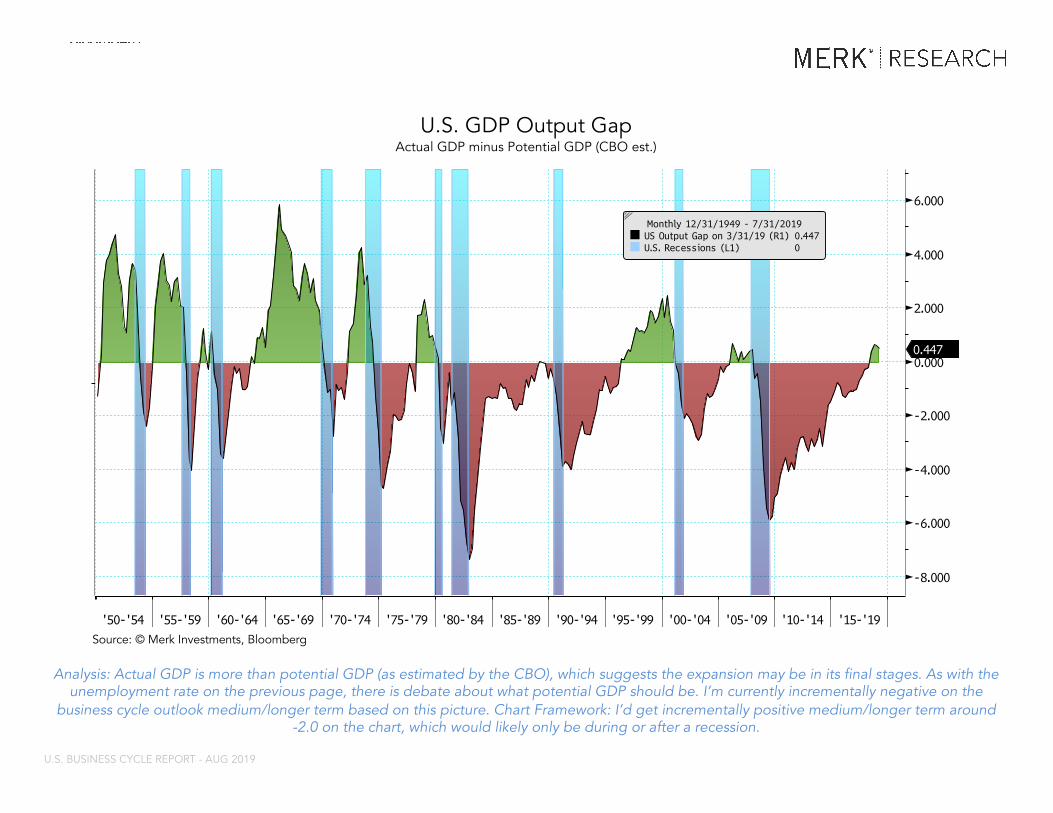
Chart - 8/5/2019CBOPGAPN Index (US Nominal Output Gap as... USRINDEX Index (U.S. Recession Indicator...
This report may not be modified or altered in any way. The BLOOMBERG PROFESSIONAL service and BLOOMBERG Data are owned and distributed locally by Bloomberg Finance LP (“BFLP”) and its subsidiaries in all jurisdictions other than Argentina, Bermuda, China, India, Japan and Korea (the (“BFLPCountries”). BFLP is a wholly-owned subsidiary of Bloomberg LP (“BLP”). BLP provides BFLP with all the global marketing and operational support and service for the Services and distributes the Services either directly or through a non-BFLP subsidiary in the BLP Countries. BFLP, BLP and their affiliatesdo not provide investment advice, and nothing herein shall constitute an offer of financial instruments by BFLP, BLP or their affiliates.
Bloomberg ® 08/05/2019 08:32:08 12
Analysis: Actual GDP is more than potential GDP (as estimated by the CBO), which suggests the expansion may be in its final stages. As with the unemployment rate on the previous page, there is debate about what potential GDP should be. I’m currently incrementally negative on the
business cycle outlook medium/longer term based on this picture. Chart Framework: I’d get incrementally positive medium/longer term around -2.0 on the chart, which would likely only be during or after a recession.
U.S. GDP Output GapActual GDP minus Potential GDP (CBO est.)
U.S. BUSINESS CYCLE REPORT - AUG 2019
Source: © Merk Investments, Bloomberg
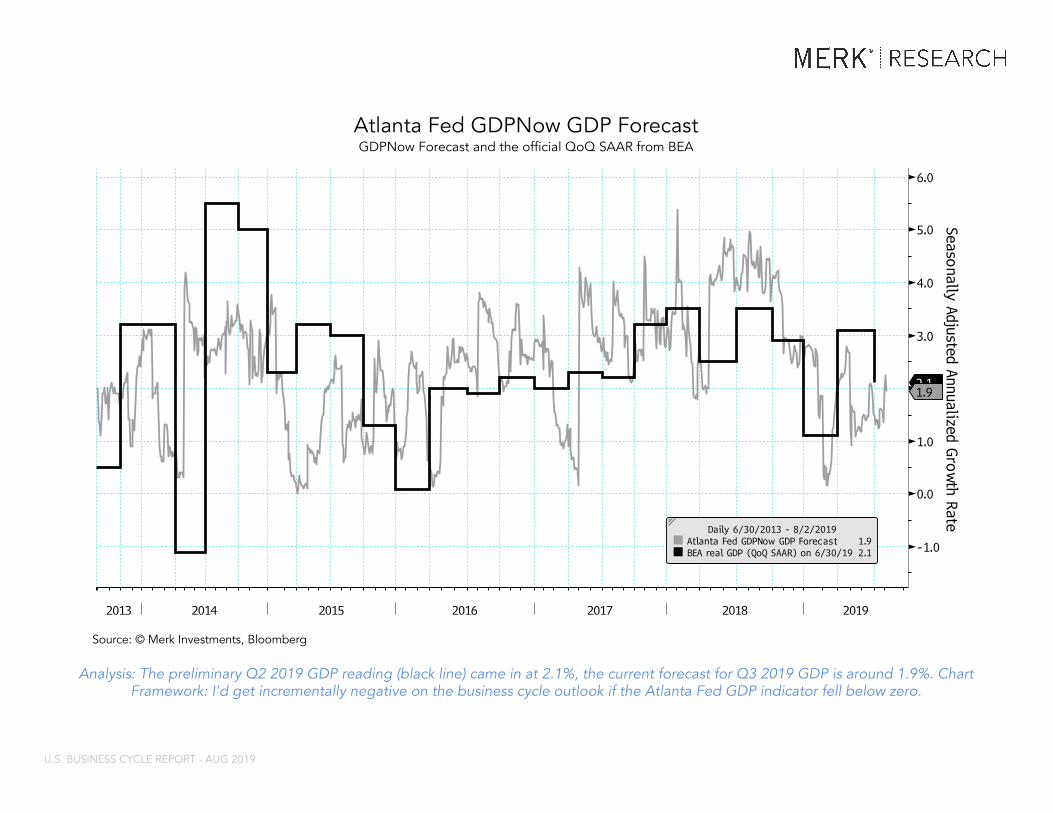
Chart - 8/5/2019GDGCAFJP Index (Atlanta Fed GDPNow GDP F... GDP CQOQ Index (GDP US Chained 2012 Doll...
This report may not be modified or altered in any way. The BLOOMBERG PROFESSIONAL service and BLOOMBERG Data are owned and distributed locally by Bloomberg Finance LP (“BFLP”) and its subsidiaries in all jurisdictions other than Argentina, Bermuda, China, India, Japan and Korea (the (“BFLPCountries”). BFLP is a wholly-owned subsidiary of Bloomberg LP (“BLP”). BLP provides BFLP with all the global marketing and operational support and service for the Services and distributes the Services either directly or through a non-BFLP subsidiary in the BLP Countries. BFLP, BLP and their affiliatesdo not provide investment advice, and nothing herein shall constitute an offer of financial instruments by BFLP, BLP or their affiliates.
Bloomberg ® 08/05/2019 08:32:08 13 Analysis: The preliminary Q2 2019 GDP reading (black line) came in at 2.1%, the current forecast for Q3 2019 GDP is around 1.9%. Chart
Framework: I’d get incrementally negative on the business cycle outlook if the Atlanta Fed GDP indicator fell below zero.
Atlanta Fed GDPNow GDP ForecastGDPNow Forecast and the official QoQ SAAR from BEA
U.S. BUSINESS CYCLE REPORT - AUG 2019
Source: © Merk Investments, Bloomberg
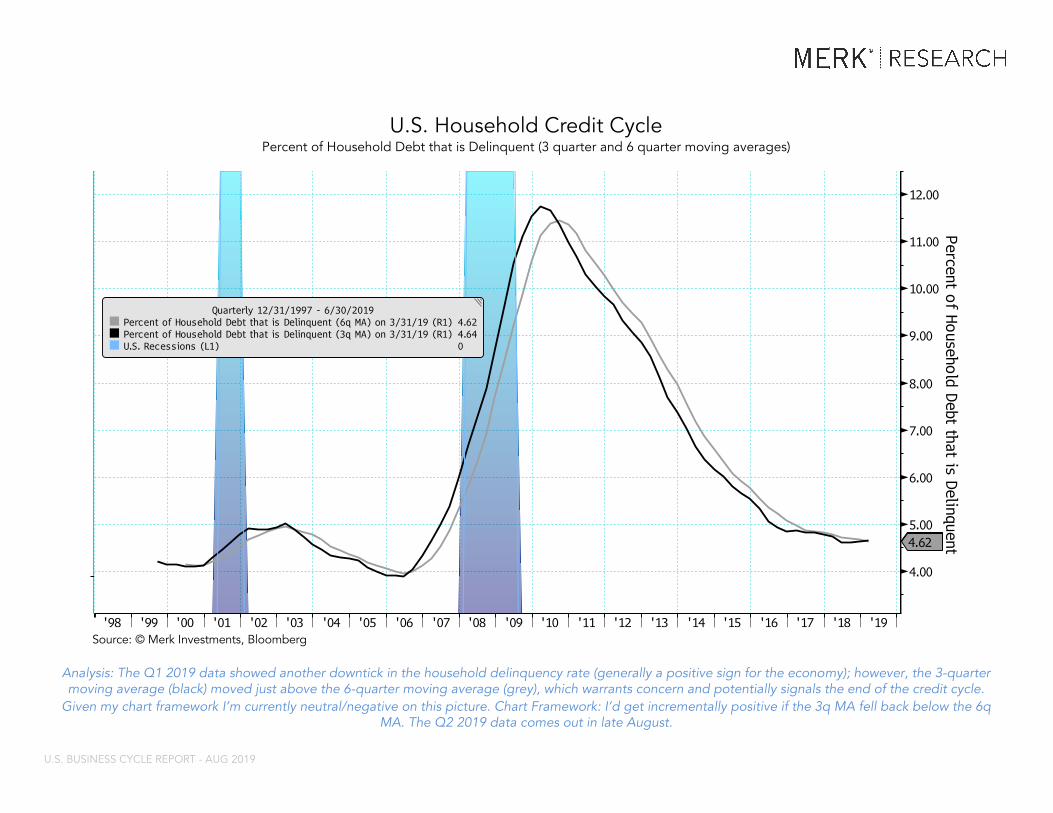
Chart - 7/5/2019.NYFED6 S 91291320 Index (6q moving avg) .NYFED3 S 91291319 Index (3q moving avg) USRINDXQ Index (U.S. Recession Indicator...
This report may not be modified or altered in any way. The BLOOMBERG PROFESSIONAL service and BLOOMBERG Data are owned and distributed locally by Bloomberg Finance LP (“BFLP”) and its subsidiaries in all jurisdictions other than Argentina, Bermuda, China, India, Japan and Korea (the (“BFLPCountries”). BFLP is a wholly-owned subsidiary of Bloomberg LP (“BLP”). BLP provides BFLP with all the global marketing and operational support and service for the Services and distributes the Services either directly or through a non-BFLP subsidiary in the BLP Countries. BFLP, BLP and their affiliatesdo not provide investment advice, and nothing herein shall constitute an offer of financial instruments by BFLP, BLP or their affiliates.
Bloomberg ® 07/05/2019 13:12:13 14
Analysis: The Q1 2019 data showed another downtick in the household delinquency rate (generally a positive sign for the economy); however, the 3-quarter moving average (black) moved just above the 6-quarter moving average (grey), which warrants concern and potentially signals the end of the credit cycle.
Given my chart framework I’m currently neutral/negative on this picture. Chart Framework: I’d get incrementally positive if the 3q MA fell back below the 6q MA. The Q2 2019 data comes out in late August.
U.S. Household Credit CyclePercent of Household Debt that is Delinquent (3 quarter and 6 quarter moving averages)
U.S. BUSINESS CYCLE REPORT - AUG 2019
Source: © Merk Investments, Bloomberg
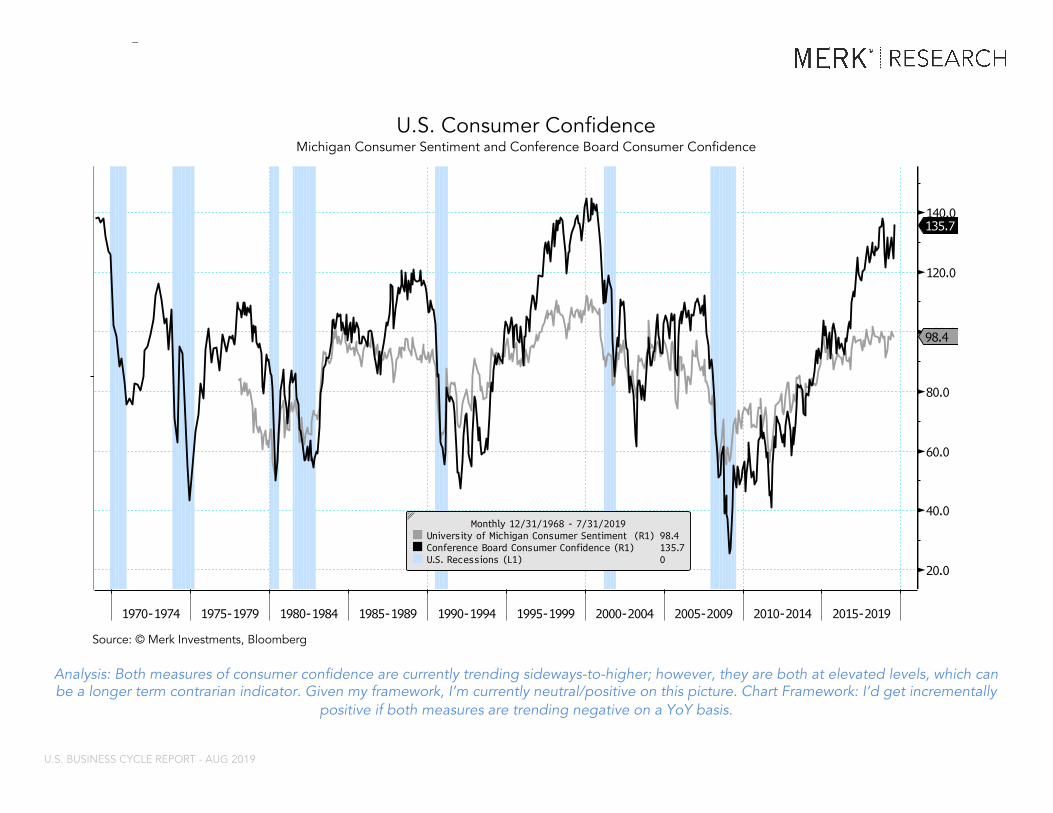
Chart - 8/5/2019CONSSENT Index (University of Michigan C... CONCCONF Index (Conference Board Consume... USRINDEX Index (U.S. Recession Indicator...
This report may not be modified or altered in any way. The BLOOMBERG PROFESSIONAL service and BLOOMBERG Data are owned and distributed locally by Bloomberg Finance LP (“BFLP”) and its subsidiaries in all jurisdictions other than Argentina, Bermuda, China, India, Japan and Korea (the (“BFLPCountries”). BFLP is a wholly-owned subsidiary of Bloomberg LP (“BLP”). BLP provides BFLP with all the global marketing and operational support and service for the Services and distributes the Services either directly or through a non-BFLP subsidiary in the BLP Countries. BFLP, BLP and their affiliatesdo not provide investment advice, and nothing herein shall constitute an offer of financial instruments by BFLP, BLP or their affiliates.
Bloomberg ® 08/05/2019 08:32:08 15
Analysis: Both measures of consumer confidence are currently trending sideways-to-higher; however, they are both at elevated levels, which can be a longer term contrarian indicator. Given my framework, I’m currently neutral/positive on this picture. Chart Framework: I’d get incrementally
positive if both measures are trending negative on a YoY basis.
U.S. Consumer ConfidenceMichigan Consumer Sentiment and Conference Board Consumer Confidence
U.S. BUSINESS CYCLE REPORT - AUG 2019
Source: © Merk Investments, Bloomberg
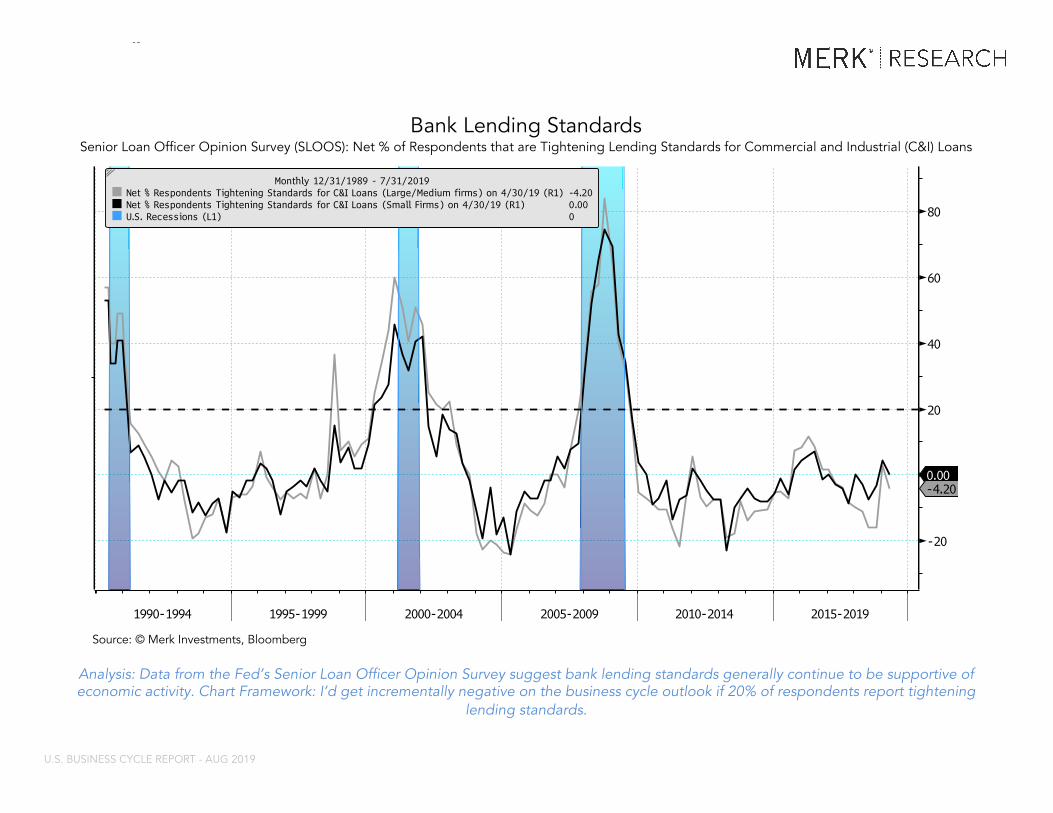
Chart - 8/5/2019SLDETIGT Index (Net % of Domestic Respon... SLDETGTS Index (Net % of Domestic Respon... USRINDEX Index (U.S. Recession Indicator...
This report may not be modified or altered in any way. The BLOOMBERG PROFESSIONAL service and BLOOMBERG Data are owned and distributed locally by Bloomberg Finance LP (“BFLP”) and its subsidiaries in all jurisdictions other than Argentina, Bermuda, China, India, Japan and Korea (the (“BFLPCountries”). BFLP is a wholly-owned subsidiary of Bloomberg LP (“BLP”). BLP provides BFLP with all the global marketing and operational support and service for the Services and distributes the Services either directly or through a non-BFLP subsidiary in the BLP Countries. BFLP, BLP and their affiliatesdo not provide investment advice, and nothing herein shall constitute an offer of financial instruments by BFLP, BLP or their affiliates.
Bloomberg ® 08/05/2019 08:32:08 16
Bank Lending StandardsSenior Loan Officer Opinion Survey (SLOOS): Net % of Respondents that are Tightening Lending Standards for Commercial and Industrial (C&I) Loans
Analysis: Data from the Fed’s Senior Loan Officer Opinion Survey suggest bank lending standards generally continue to be supportive of economic activity. Chart Framework: I’d get incrementally negative on the business cycle outlook if 20% of respondents report tightening
lending standards.
U.S. BUSINESS CYCLE REPORT - AUG 2019
Source: © Merk Investments, Bloomberg
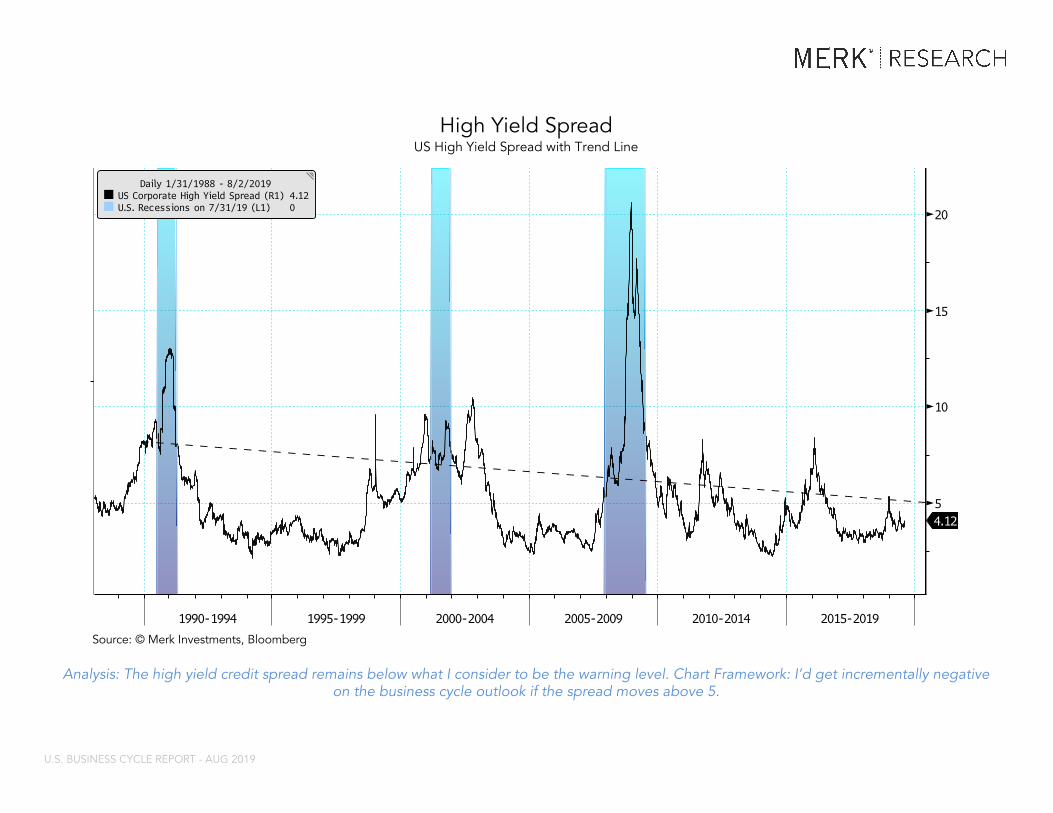
Chart - 8/5/2019CSI BARC Index (BarCap US Corp HY YTW - ... USRINDEX Index (U.S. Recession Indicator...
This report may not be modified or altered in any way. The BLOOMBERG PROFESSIONAL service and BLOOMBERG Data are owned and distributed locally by Bloomberg Finance LP (“BFLP”) and its subsidiaries in all jurisdictions other than Argentina, Bermuda, China, India, Japan and Korea (the (“BFLPCountries”). BFLP is a wholly-owned subsidiary of Bloomberg LP (“BLP”). BLP provides BFLP with all the global marketing and operational support and service for the Services and distributes the Services either directly or through a non-BFLP subsidiary in the BLP Countries. BFLP, BLP and their affiliatesdo not provide investment advice, and nothing herein shall constitute an offer of financial instruments by BFLP, BLP or their affiliates.
Bloomberg ® 08/05/2019 08:32:08 17
High Yield SpreadUS High Yield Spread with Trend Line
Analysis: The high yield credit spread remains below what I consider to be the warning level. Chart Framework: I’d get incrementally negative on the business cycle outlook if the spread moves above 5.
U.S. BUSINESS CYCLE REPORT - AUG 2019
Source: © Merk Investments, Bloomberg
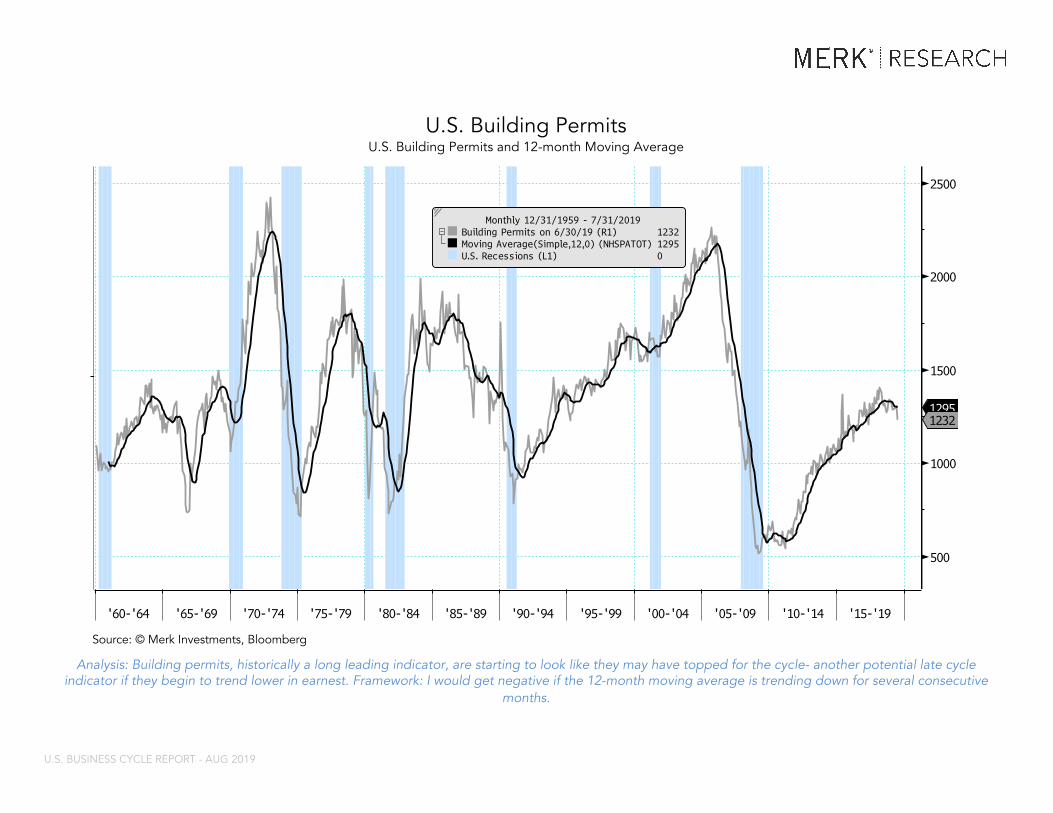
Chart - 8/5/2019NHSPATOT Index (Private Housing Authoriz... USRINDEX Index (U.S. Recession Indicator...
This report may not be modified or altered in any way. The BLOOMBERG PROFESSIONAL service and BLOOMBERG Data are owned and distributed locally by Bloomberg Finance LP (“BFLP”) and its subsidiaries in all jurisdictions other than Argentina, Bermuda, China, India, Japan and Korea (the (“BFLPCountries”). BFLP is a wholly-owned subsidiary of Bloomberg LP (“BLP”). BLP provides BFLP with all the global marketing and operational support and service for the Services and distributes the Services either directly or through a non-BFLP subsidiary in the BLP Countries. BFLP, BLP and their affiliatesdo not provide investment advice, and nothing herein shall constitute an offer of financial instruments by BFLP, BLP or their affiliates.
Bloomberg ® 08/05/2019 08:32:08 28
Analysis: Building permits, historically a long leading indicator, are starting to look like they may have topped for the cycle- another potential late cycle indicator if they begin to trend lower in earnest. Framework: I would get negative if the 12-month moving average is trending down for several consecutive
months.
U.S. Building PermitsU.S. Building Permits and 12-month Moving Average
Source: © Merk Investments, Bloomberg
U.S. BUSINESS CYCLE REPORT - AUG 2019
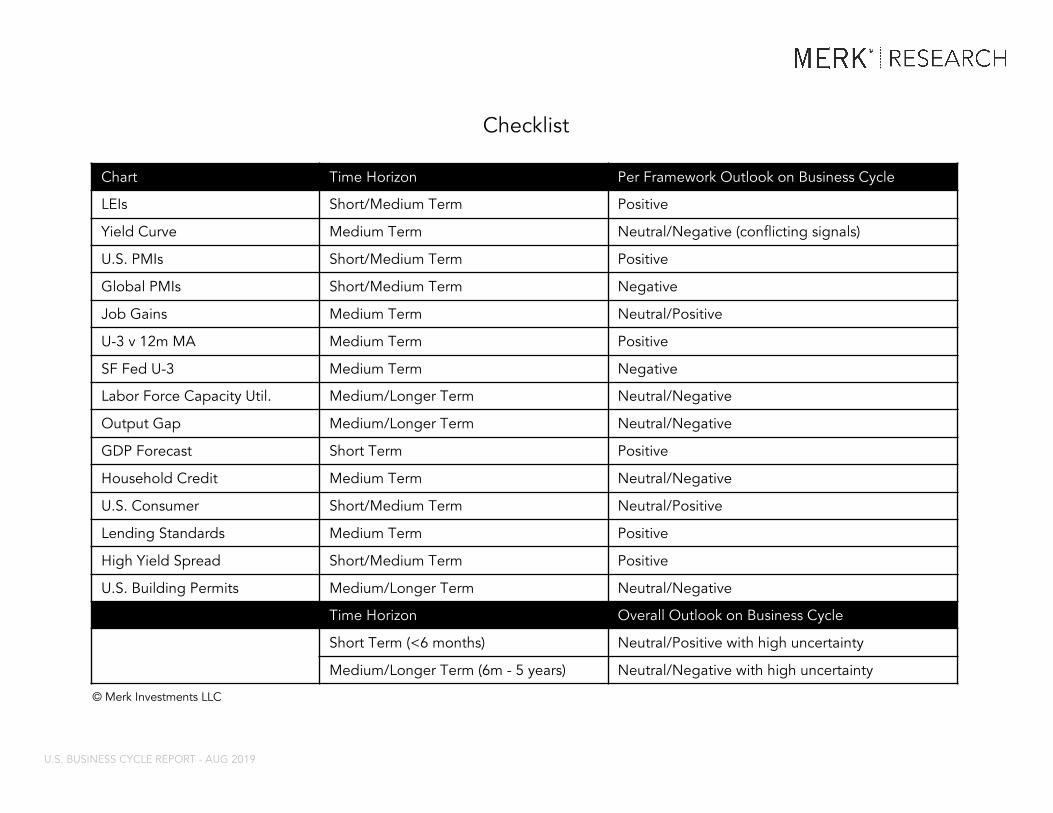
Chart Time Horizon Per Framework Outlook on Business Cycle
LEIs Short/Medium Term Positive
Yield Curve Medium Term Neutral/Negative (conflicting signals)
U.S. PMIs Short/Medium Term Positive
Global PMIs Short/Medium Term Negative
Job Gains Medium Term Neutral/Positive
U-3 v 12m MA Medium Term Positive
SF Fed U-3 Medium Term Negative
Labor Force Capacity Util. Medium/Longer Term Neutral/Negative
Output Gap Medium/Longer Term Neutral/Negative
GDP Forecast Short Term Positive
Household Credit Medium Term Neutral/Negative
U.S. Consumer Short/Medium Term Neutral/Positive
Lending Standards Medium Term Positive
High Yield Spread Short/Medium Term Positive
U.S. Building Permits Medium/Longer Term Neutral/Negative
Time Horizon Overall Outlook on Business Cycle
Short Term (<6 months) Neutral/Positive with high uncertainty
Medium/Longer Term (6m - 5 years) Neutral/Negative with high uncertainty
Checklist
U.S. BUSINESS CYCLE REPORT - AUG 2019
© Merk Investments LLC
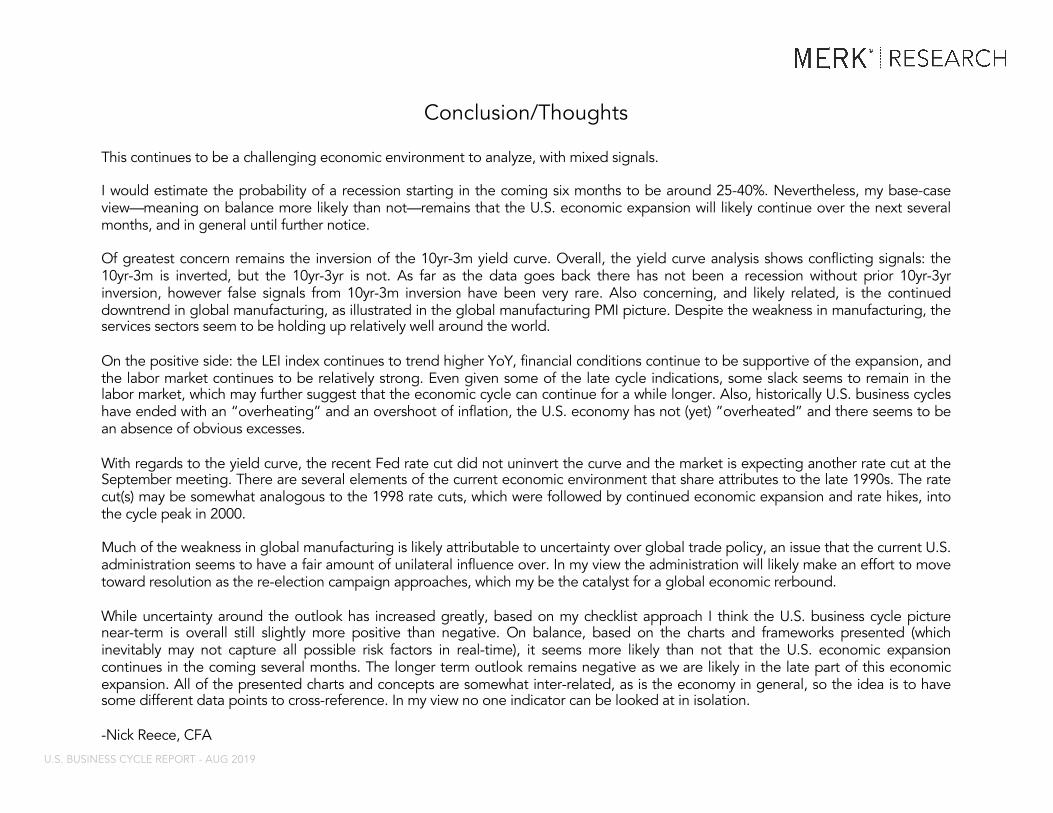
This continues to be a challenging economic environment to analyze, with mixed signals.
I would estimate the probability of a recession starting in the coming six months to be around 25-40%. Nevertheless, my base-caseview—meaning on balance more likely than not—remains that the U.S. economic expansion will likely continue over the next severalmonths, and in general until further notice.
Of greatest concern remains the inversion of the 10yr-3m yield curve. Overall, the yield curve analysis shows conflicting signals: the10yr-3m is inverted, but the 10yr-3yr is not. As far as the data goes back there has not been a recession without prior 10yr-3yrinversion, however false signals from 10yr-3m inversion have been very rare. Also concerning, and likely related, is the continueddowntrend in global manufacturing, as illustrated in the global manufacturing PMI picture. Despite the weakness in manufacturing, theservices sectors seem to be holding up relatively well around the world.
On the positive side: the LEI index continues to trend higher YoY, financial conditions continue to be supportive of the expansion, andthe labor market continues to be relatively strong. Even given some of the late cycle indications, some slack seems to remain in thelabor market, which may further suggest that the economic cycle can continue for a while longer. Also, historically U.S. business cycleshave ended with an “overheating” and an overshoot of inflation, the U.S. economy has not (yet) ”overheated” and there seems to bean absence of obvious excesses.
With regards to the yield curve, the recent Fed rate cut did not uninvert the curve and the market is expecting another rate cut at theSeptember meeting. There are several elements of the current economic environment that share attributes to the late 1990s. The ratecut(s) may be somewhat analogous to the 1998 rate cuts, which were followed by continued economic expansion and rate hikes, intothe cycle peak in 2000.
Much of the weakness in global manufacturing is likely attributable to uncertainty over global trade policy, an issue that the current U.S.administration seems to have a fair amount of unilateral influence over. In my view the administration will likely make an effort to movetoward resolution as the re-election campaign approaches, which my be the catalyst for a global economic rerbound.
While uncertainty around the outlook has increased greatly, based on my checklist approach I think the U.S. business cycle picturenear-term is overall still slightly more positive than negative. On balance, based on the charts and frameworks presented (whichinevitably may not capture all possible risk factors in real-time), it seems more likely than not that the U.S. economic expansioncontinues in the coming several months. The longer term outlook remains negative as we are likely in the late part of this economicexpansion. All of the presented charts and concepts are somewhat inter-related, as is the economy in general, so the idea is to havesome different data points to cross-reference. In my view no one indicator can be looked at in isolation.
-Nick Reece, CFA
Conclusion/Thoughts
U.S. BUSINESS CYCLE REPORT - AUG 2019
Nick Reece, CFA: Nick is a Senior Analyst and Portfolio Manager at MerkInvestments. He focuses on macroeconomic research and private wealthmanagement, regularly publishing reports on the U.S. business cycle andequity market. Prior to joining Merk in 2012, Nick gained experience workingon capital markets deals with Paul Hastings in Hong Kong, and with AtlantisInvestment Management. Mr. Reece holds a B.A. in Economics from TrinityCollege and is a Chartered Financial Analyst (CFA) charterholder. Nick lives inNew York City. Outside of work, he is an avid reader and volunteer high schoolmath tutor. You can follow Nick on Twitter @nicholastreece.
About the Author
DisclosureThis report was prepared by Merk Investments LLC, and reflects the current opinion of the authors. It is based uponsources and data believed to be accurate and reliable. Merk Investments LLC makes no representation regarding theadvisability of investing in the products herein. Opinions and forward-looking statements expressed are subject tochange without notice. This information does not constitute investment advice and is not intended as anendorsement of any specific investment. The information contained herein is general in nature and is provided solelyfor educational and informational purposes. Some believe predicting recessions is either impossible or verydifficult. The information provided does not constitute legal, financial or tax advice. You should obtain advice specificto your circumstances from your own legal, financial and tax advisors. Past performance is no guarantee of futureresults.
* * *
Explicit permission must be obtained from Merk Investments LLC in order to replicate, copy, distribute or quote from this document or any portion thereof.
Published by Merk Investments LLC
© 2019 Merk Investments LLC