
Mechanical behaviour of Transparent Structural Silicone ... · TSSA bulk material was also...
24
Glass Struct. Eng. (2018) 3:213–236 https://doi.org/10.1007/s40940-018-0066-9 SI: CHALLENGING GLASS PAPER Mechanical behaviour of Transparent Structural Silicone Adhesive (TSSA) steel-to-glass laminated connections under monotonic and cyclic loading Anna Ioannidou-Kati · Manuel Santarsiero · Peter de Vries · Sofia Teixeira de Freitas · Rob Nijsse · Christian Louter Received: 14 January 2018 / Accepted: 28 March 2018 / Published online: 10 April 2018 © The Author(s) 2018 Abstract Steel-to-glass laminated connections, which have recently been developed, limit stress inten- sifications on the glass and combine strength and transparency. Transparent Structural Silicone Adhesive (TSSA) connections have been used in several projects worldwide; however, the hyperelastic and viscoelastic nature of the material has to date not been fully inves- tigated. In this work, the first objective is to investigate the mechanical response of TSSA connections under static and cyclic loading by means of experimental tests. Firstly, the shear behaviour of TSSA circular con- nections is characterized by means of monotonic and cyclic loading tests. The adhesive exhibits significant stress-softening under repeated cycles that becomes A. Ioannidou-Kati · P. de Vries · R. Nijsse Department of Structural Engineering, Faculty of Civil Engineering and Geosciences, Delft University of Technology (TU Delft), Delft, The Netherlands A. Ioannidou-Kati Mott MacDonald, London, UK M. Santarsiero Eckersley O’Callaghan Engineers (EOC), London, UK S. Teixeira de Freitas Department of Aerospace Structures and Materials, Faculty of Aerospace Engineering, Delft University of Technology (TU Delft), Delft, The Netherlands R. Nijsse · C. Louter (B ) Department of Architectural Engineering and Technology, Faculty of Architecture and the Built Environment, Delft University of Technology (TU Delft), Delft, The Netherlands e-mail: [email protected] more severe as the maximum load increases. Secondly, TSSA circular connections are subjected to monotonic and cyclic tensile loading of increasing maximum load. The way whitening propagates on the adhesive surface shows some consistency comparing the cases of static and cyclic loading. The second objective is to analyti- cally describe the deformation behaviour of the adhe- sive based on hyperelastic prediction models. Uniaxial and biaxial tension tests are combined with the simple shear tests, for the material characterization of TSSA. The hyperelastic material parameters are calibrated by a simultaneous multi-experiment-data-fit based on the nonlinear least squares optimization method. The soft- ening behaviour observed in shear tests is modeled based on a simplified pseudo-elastic damage model proposed by Ogden–Roxburgh. A first attempt is also made to model the actual softening response of the adhesive. A less conservative approach proposed by Guo, also based on the theory of pseudo-elasticity, proved to give a good approximation of the actual cyclic response of the adhesive. Keywords Glass · TSSA · Silicone · Mullins effect 1 Introduction 1.1 Transparent Structural Silicone Adhesive Transparent Structural Silicone Adhesive is a crystal clear silicone adhesive film produced by Dow Corning 123
Transcript of Mechanical behaviour of Transparent Structural Silicone ... · TSSA bulk material was also...
Glass Struct. Eng. (2018) 3:213–236https://doi.org/10.1007/s40940-018-0066-9
SI: CHALLENGING GLASS PAPER
Mechanical behaviour of Transparent Structural SiliconeAdhesive (TSSA) steel-to-glass laminated connections undermonotonic and cyclic loading
Anna Ioannidou-Kati · Manuel Santarsiero ·Peter de Vries · Sofia Teixeira de Freitas ·Rob Nijsse · Christian Louter
Received: 14 January 2018 / Accepted: 28 March 2018 / Published online: 10 April 2018© The Author(s) 2018
Abstract Steel-to-glass laminated connections,which have recently been developed, limit stress inten-sifications on the glass and combine strength andtransparency. Transparent Structural SiliconeAdhesive(TSSA) connections have been used in several projectsworldwide; however, the hyperelastic and viscoelasticnature of the material has to date not been fully inves-tigated. In this work, the first objective is to investigatethe mechanical response of TSSA connections understatic and cyclic loading by means of experimentaltests. Firstly, the shear behaviour of TSSA circular con-nections is characterized by means of monotonic andcyclic loading tests. The adhesive exhibits significantstress-softening under repeated cycles that becomes
A. Ioannidou-Kati · P. de Vries · R. NijsseDepartment of Structural Engineering, Faculty of CivilEngineering and Geosciences, Delft University ofTechnology (TU Delft), Delft, The Netherlands
A. Ioannidou-KatiMott MacDonald, London, UK
M. SantarsieroEckersley O’Callaghan Engineers (EOC), London, UK
S. Teixeira de FreitasDepartment of Aerospace Structures and Materials, Facultyof Aerospace Engineering, Delft University of Technology(TU Delft), Delft, The Netherlands
R. Nijsse · C. Louter (B)Department of Architectural Engineering and Technology,Faculty of Architecture and the Built Environment, DelftUniversity of Technology (TU Delft), Delft,The Netherlandse-mail: [email protected]
more severe as the maximum load increases. Secondly,TSSA circular connections are subjected to monotonicand cyclic tensile loading of increasingmaximum load.The way whitening propagates on the adhesive surfaceshows some consistency comparing the cases of staticand cyclic loading. The second objective is to analyti-cally describe the deformation behaviour of the adhe-sive based on hyperelastic prediction models. Uniaxialand biaxial tension tests are combined with the simpleshear tests, for the material characterization of TSSA.The hyperelastic material parameters are calibrated bya simultaneous multi-experiment-data-fit based on thenonlinear least squares optimization method. The soft-ening behaviour observed in shear tests is modeledbased on a simplified pseudo-elastic damage modelproposed by Ogden–Roxburgh. A first attempt is alsomade to model the actual softening response of theadhesive. A less conservative approach proposed byGuo, also based on the theory of pseudo-elasticity,proved to give a good approximation of the actual cyclicresponse of the adhesive.
Keywords Glass · TSSA · Silicone · Mullins effect
1 Introduction
1.1 Transparent Structural Silicone Adhesive
Transparent Structural Silicone Adhesive is a crystalclear silicone adhesive film produced by Dow Corning
123

214 A. Ioannidou-Kati et al.
that exhibits thermal stability and excellent weather-ability (Sitte et al. 2011). It was developed for frame-less glazed facade applications with steel to glass lam-inated adhesive connections. It is an elastomeric one-component addition cured siliconewith no by-products(and no odor), characterized by nanosilica and cross-linked polymers (Santarsiero et al. 2016a). TSSA lam-inated connections have been used in several projects,such as the Dow Corning’s new European DistributionCentre in Belgium. In this project, TSSA frameless spi-der connections allowed the use of insulated glazedunits, easier fabrication on site and avoided drilling theglass.Overend et al. (2013) tested TSSA single lap jointsand T-peel specimens. The results showed that TSSAexhibits sufficient strength in combination with a flex-ible behavior, which is unique among other transpar-ent heat-curing foils, such as SentryGlas. In the workof Sitte et al. (2011), the tensile and shear mono-tonic behavior of TSSA connections was investigatedat room temperature. In addition, the behaviour ofTSSA bulk material was also investigated at a con-stant displacement rate. The results showed that TSSAexhibits a hyperelastic response. Cyclic loading testswere also performed, and results showed the appear-ance of the stress softening phenomenon, also referredto as Mullins effect.In the work performed by Santarsiero et al. (2016b),TSSA dumbbell shaped specimens were subjected touniaxial tensile tests. The tests were performed atdifferent temperatures (− 20, 23 and 80 ◦C) and dis-placement rates (1, 10 or 100 mm/min). A nonlinearstress–strain response was also observed, confirmingthe hyperelastic nature of TSSA. Temperature varia-tions did not significantly influence the stiffness of theadhesive; however, the stress and strain at the pointof failure showed a temperature dependency. Santar-siero et al. (2016a) also performed shear and tensiletests on TSSA laminated circular connections. Thespecimens consisted of annealed glass plates with alaminated stainless steel circular button with diame-ter 50 mm. The shear behaviour of those connectionsproved to be mainly linear until failure, a fact whichwas also observed in the work of Hagl et al. (2012) andSitte et al. (2011). On the other hand, the mechanicalresponse of laminated circular connections under ten-sile load appeared to be bilinear, showing a very stiffresponse followed by a hardening phase. The influence
of temperature on the shear and tensile behaviour ofthe connection proved to be negligible.Tensile tests of TSSA dumbbells and TSSA metal toglass connections (Santarsiero et al. 2016b; Sitte et al.2011) have showed that the adhesive does not remaintransparent throughout testing. Its colour changes fromcompletely transparent to white above a certain stresslevel. According to the manufacturing company, DowCorning®, the whitening phenomenon is expectedwhen the local stress exceeds 2 MPa. In the work ofSantarsiero et al. (2016a) and Sitte et al. (2011), thewhitening of TSSA is clearly visible at engineeringstresses close to 5 MPa.
1.2 The Mullins effect
Elastomer or rubber-like materials, such as TSSA,undergo a stress softening phenomenon under cyclicloading. More specifically, they exhibit a hystereticbehaviour, which is characterized by a differencebetween the loading and unloading mechanicalresponse. This softening effect, also referred to as theMullins effect, was first extensively studied byMullins(1969) in the 1970’s. More specifically, the Mullinseffect describes the dependency of the stress–straincurve of rubbers on the maximum load previouslyencountered. When the load is less than the previousmaximum load, the loading response of rubbers followsthe path of the undamaged ‘virgin’ material, whereasthe unloading response is characterized by a soften-ing behaviour. Whenever the load increases above itsprior maximum value, the stress–strain curve changes,resulting in more severe softening behaviour.Several physical interpretations have been proposed tounderstand the stress-softening phenomenon of rub-bers. However, there is still no universal consensus onthe origin of this phenomenon (Diani et al. 2009). Blan-chard and Parkinson (1952) expressed the theory thatthe stress-softening effect is the result of bond rupturestaking place during stretching. According to their the-ory, the weaker bonds (or physical bonds) are rupturedfirst, followed by the stronger (or chemical) bonds.Houwink (1956) used instead the theory of moleculesslipping over the surface of fillers, as a fact whichcauses new bonds to be created. These new bondsare of the same physical nature, but they are locatedat different places along the rubber molecules (Dianiet al. 2009). According to this theory, the phenomenon
123

Mechanical behaviour of Transparent Structural Silicone Adhesive 215
could be reversible with exposing the rubber to ele-vated temperatures. Other theories have been devel-oped by Kraus et al. (1966) who attribute the stress-softening effect to the rupture of carbon-black struc-ture, which is used as reinforcing filler in many rubberproducts.
1.3 Objectives
The monotonic response of TSSA dumbbell speci-mens and TSSA laminated circular connections hasbeen already investigated by Hagl et al. (2012), San-tarsiero et al. (2016b) and Sitte et al. (2011). How-ever, very few experimental data exist on the cyclicbehaviour of TSSA, and the appearance of the Mullinseffect.In this study, TSSA laminated circular connectionswith diameter 50 mm are subjected to a series ofmonotonic and cyclic-shear and tensile tests. The firstobjective is to study the mechanical response of theseconnections under loading cycles and to observe ifthey exhibit the stress-softening phenomenon. Sec-ondly, the development of the whitening phenomenonwill be compared under monotonic and cyclic load-ing. Thirdly, the propagation of whitening both forthe cases of static and cyclic loading and the recoveryof the phenomenon when removing the load is stud-ied.Even though significant research has been performedon the mechanical response and the stress state of cir-cular TSSA connections, as well as a generalized fail-ure criterion has been developed by Santarsiero et al.(2018), limited information can be found in literatureon the non-linear TSSA constitutive law. This makesit difficult to produce a finite element model that suf-ficiently describes the behaviour of TSSA laminatedconnections under certain specific stress states. Thebehaviour of elastomeric materials, such as TSSA, canbedescribedby abroad rangeof hyperelastic non-linearconstitutive laws, most of which can be implementedin finite element software to describe the behaviourof elastomers. The accuracy of the predicted mechan-ical response largely depends on the chosen model.Therefore, the final objective of this study is the cal-ibration of several material models based on experi-mental data and the assessment of the suitability ofeach model to describe the stress–strain response ofthe adhesive.
2 Method
2.1 Materials and specimens
The tested specimens (see Fig. 1) consist of a solid316L stainless steel connector with diameter 50 mm,height 20 mm and tolerance h9 [ISO 286] (Santarsieroet al. 2016a). The connector is located in the centerof a 150 × 150 mm annealed glass plate of 15 mmthickness. The TSSA foil is 1 mm thick. The con-nector has a circular shape, which is favorable as inthis way stress concentrations at the edges are avoided,unlike the case of rectangular connectors (Santarsieroet al. 2016b). The bonded surface was machined (uni-directional polishing) with roughness of 8 micron, toensure good contact of the materials (Santarsiero et al.2016a). Prior to lamination, the substrateswere cleanedwith isopropanol and primed with a heptane basedsolvent specially developed for Dow Corning® TSSA(Dow Corning® 92-023 Primer).
2.2 Shear test set-up
Tests are performedwith a SCHENCK testingmachineand a 10KN load cell at the Stevin Laboratory at theFaculty of Civil Engineering and Geosciences at TUDelft. A specially designed steel set-up (see Fig. 2) ismade to ensure that the test approximates, as much aspossible a simple shear stress state. The shear load istransferred via a 10 mm thick steel plate with a circularhole (diameter 50.1 mm) in the middle. The circularhole renders possible to impose inverse shear loadingto the connection. The steel plate is connected to a steelrod which in turn is connected to the load cell and fixedto the upper part of themachine. The rest of the steel set-up ensures that the glass specimen is rigidly fixed to the
Fig. 1 Glass specimens with laminated circular connectors
123
216 A. Ioannidou-Kati et al.
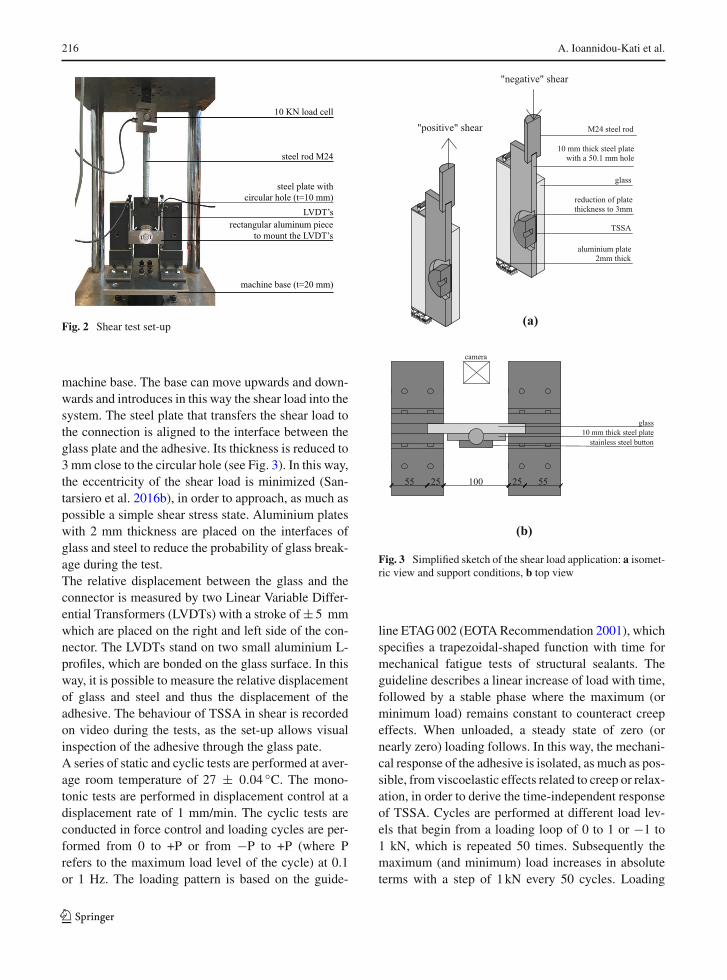
Fig. 2 Shear test set-up
machine base. The base can move upwards and down-wards and introduces in this way the shear load into thesystem. The steel plate that transfers the shear load tothe connection is aligned to the interface between theglass plate and the adhesive. Its thickness is reduced to3 mm close to the circular hole (see Fig. 3). In this way,the eccentricity of the shear load is minimized (San-tarsiero et al. 2016b), in order to approach, as much aspossible a simple shear stress state. Aluminium plateswith 2 mm thickness are placed on the interfaces ofglass and steel to reduce the probability of glass break-age during the test.The relative displacement between the glass and theconnector is measured by two Linear Variable Differ-ential Transformers (LVDTs) with a stroke of ± 5 mmwhich are placed on the right and left side of the con-nector. The LVDTs stand on two small aluminium L-profiles, which are bonded on the glass surface. In thisway, it is possible to measure the relative displacementof glass and steel and thus the displacement of theadhesive. The behaviour of TSSA in shear is recordedon video during the tests, as the set-up allows visualinspection of the adhesive through the glass pate.A series of static and cyclic tests are performed at aver-age room temperature of 27 ± 0.04 ◦C. The mono-tonic tests are performed in displacement control at adisplacement rate of 1 mm/min. The cyclic tests areconducted in force control and loading cycles are per-formed from 0 to +P or from −P to +P (where Prefers to the maximum load level of the cycle) at 0.1or 1 Hz. The loading pattern is based on the guide-
(a)
(b)
Fig. 3 Simplified sketch of the shear load application: a isomet-ric view and support conditions, b top view
line ETAG 002 (EOTARecommendation 2001), whichspecifies a trapezoidal-shaped function with time formechanical fatigue tests of structural sealants. Theguideline describes a linear increase of load with time,followed by a stable phase where the maximum (orminimum load) remains constant to counteract creepeffects. When unloaded, a steady state of zero (ornearly zero) loading follows. In this way, the mechani-cal response of the adhesive is isolated, as much as pos-sible, from viscoelastic effects related to creep or relax-ation, in order to derive the time-independent responseof TSSA. Cycles are performed at different load lev-els that begin from a loading loop of 0 to 1 or −1 to1 kN, which is repeated 50 times. Subsequently themaximum (and minimum) load increases in absoluteterms with a step of 1kN every 50 cycles. Loading
123

Mechanical behaviour of Transparent Structural Silicone Adhesive 217
Fig. 4 Cyclic loadingschedule
cycles are performed up to 8kN. Performing cycles upto this load level would avoid failure of the specimenduring cyclic loading, since previously recorded failureloads range between 9.3 and 11.9kN (Santarsiero et al.2016a). Data are acquired with a frequency of 10 Hz.Figure 4 illustrates the load versus time relation. Theleft graph describes the tests that involve reverse shear-ing, whereas the right graph describes shearing in onlyone direction. The duration of the steady state of theload is indicated either with t1, when the load is max-imum, or t2, when the load is nearly zero. The valuesof t1 and t2 (t1= t2) are 2 or 0.2 s corresponding tofrequencies 0.1 and 1 Hz.
2.3 Tensile test set-up
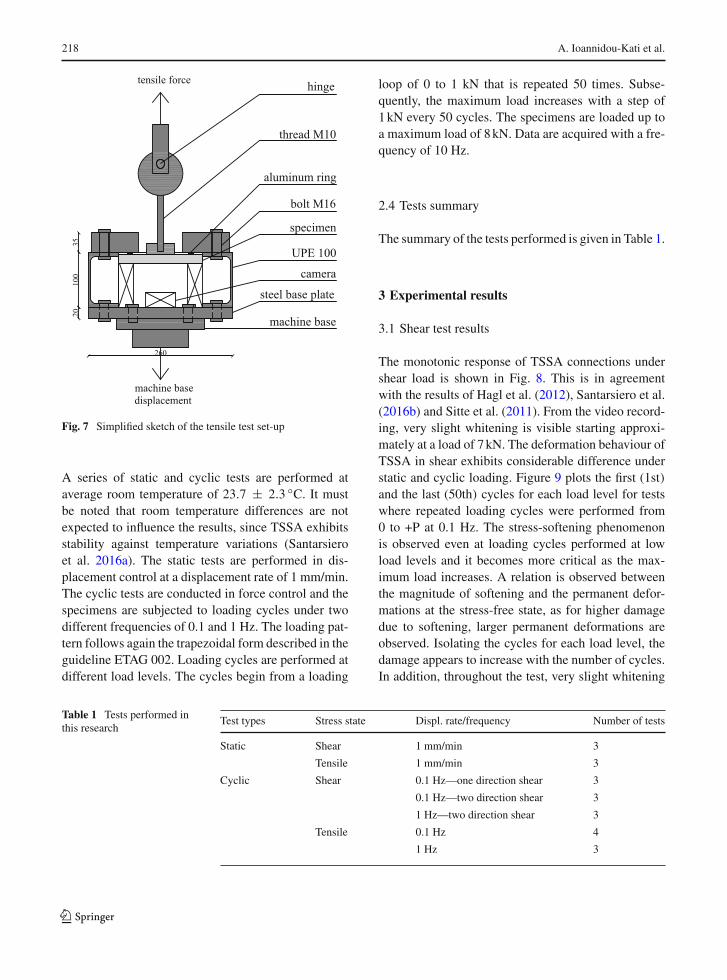
Tests were performed with a SCHENCK testingmachine and a 10kN load cell. A steel set-up is madeto restrain the glass plate during loading. More specif-ically, a 35 mm thick steel plate with a circular hole(diameter 80mm) in themiddle is bolted onto twoUPE100 sections (European Standard U Channels with Par-allel Flanges), which in turn are fixed onto the machinebase (see Fig. 5). The glass specimen is positionedright underneath the thick steel plate. The UPE sec-tions allow the placement of a camera right below theglass specimen. For safety reasons, two pieces of tim-ber uphold the glass plate. Between the steel and glassplates an aluminium ring is placed to ensure that theforce is equally distributed (see Fig. 6). The ring hasan external diameter of 120 mm and has a width of20 mm. A cardboard mould was used to make sure thatthe aluminium ring is always positioned in the cen-ter of the specimen. The stainless steel button is con-nected to a hinge with a M10 steel rod. The hinge isused to make sure that the force is well centered rel-ative to the specimen. The tensile force is introducedto the system by displacing the machine base (Fig. 7).
Fig. 5 Tensile test set-up
Fig. 6 Glass specimens subjected to tensile tests
The displacements are measured by means of threeLVDTs with a stroke of± 1 mm, uniformly distributedaround the stainless steel button. This is to considerpossible rotations induced by fabrication tolerances orimperfections (Santarsiero et al. 2016b). The LVDTsare mounted onto an aluminium ring, which in turn isrigidly fixed onto the stainless steel button.
123
218 A. Ioannidou-Kati et al.
Fig. 7 Simplified sketch of the tensile test set-up
A series of static and cyclic tests are performed ataverage room temperature of 23.7 ± 2.3 ◦C. It mustbe noted that room temperature differences are notexpected to influence the results, since TSSA exhibitsstability against temperature variations (Santarsieroet al. 2016a). The static tests are performed in dis-placement control at a displacement rate of 1 mm/min.The cyclic tests are conducted in force control and thespecimens are subjected to loading cycles under twodifferent frequencies of 0.1 and 1 Hz. The loading pat-tern follows again the trapezoidal form described in theguideline ETAG 002. Loading cycles are performed atdifferent load levels. The cycles begin from a loading
loop of 0 to 1 kN that is repeated 50 times. Subse-quently, the maximum load increases with a step of1kN every 50 cycles. The specimens are loaded up toa maximum load of 8kN. Data are acquired with a fre-quency of 10 Hz.
2.4 Tests summary
The summary of the tests performed is given in Table 1.
3 Experimental results
3.1 Shear test results
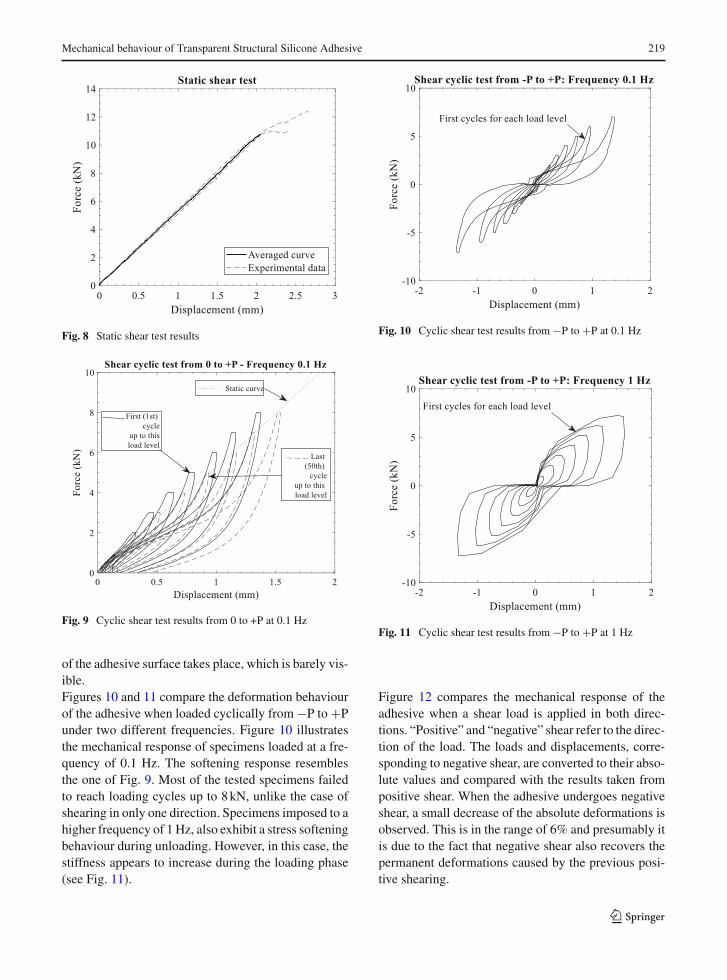
The monotonic response of TSSA connections undershear load is shown in Fig. 8. This is in agreementwith the results of Hagl et al. (2012), Santarsiero et al.(2016b) and Sitte et al. (2011). From the video record-ing, very slight whitening is visible starting approxi-mately at a load of 7kN. The deformation behaviour ofTSSA in shear exhibits considerable difference understatic and cyclic loading. Figure 9 plots the first (1st)and the last (50th) cycles for each load level for testswhere repeated loading cycles were performed from0 to +P at 0.1 Hz. The stress-softening phenomenonis observed even at loading cycles performed at lowload levels and it becomes more critical as the max-imum load increases. A relation is observed betweenthe magnitude of softening and the permanent defor-mations at the stress-free state, as for higher damagedue to softening, larger permanent deformations areobserved. Isolating the cycles for each load level, thedamage appears to increase with the number of cycles.In addition, throughout the test, very slight whitening
Table 1 Tests performed inthis research
Test types Stress state Displ. rate/frequency Number of tests
Static Shear 1 mm/min 3
Tensile 1 mm/min 3
Cyclic Shear 0.1 Hz—one direction shear 3
0.1 Hz—two direction shear 3
1 Hz—two direction shear 3
Tensile 0.1 Hz 4
1 Hz 3
123
Mechanical behaviour of Transparent Structural Silicone Adhesive 219
Fig. 8 Static shear test results
Fig. 9 Cyclic shear test results from 0 to +P at 0.1 Hz
of the adhesive surface takes place, which is barely vis-ible.Figures 10 and 11 compare the deformation behaviourof the adhesive when loaded cyclically from −P to +Punder two different frequencies. Figure 10 illustratesthe mechanical response of specimens loaded at a fre-quency of 0.1 Hz. The softening response resemblesthe one of Fig. 9. Most of the tested specimens failedto reach loading cycles up to 8kN, unlike the case ofshearing in only one direction. Specimens imposed to ahigher frequency of 1Hz, also exhibit a stress softeningbehaviour during unloading. However, in this case, thestiffness appears to increase during the loading phase(see Fig. 11).
Fig. 10 Cyclic shear test results from −P to +P at 0.1 Hz
Fig. 11 Cyclic shear test results from −P to +P at 1 Hz
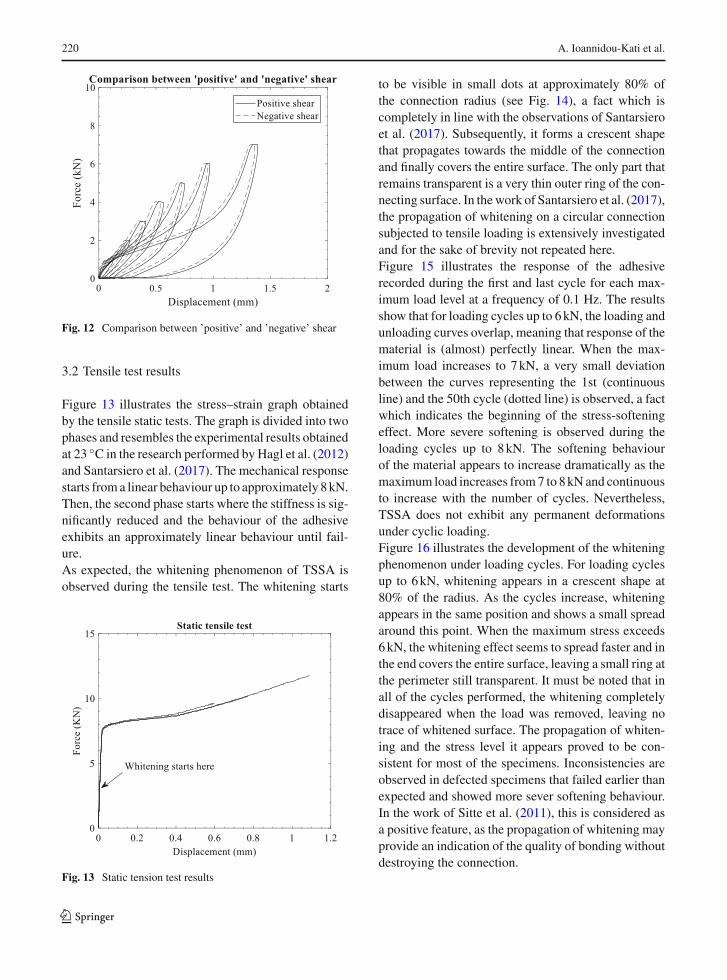
Figure 12 compares the mechanical response of theadhesive when a shear load is applied in both direc-tions. “Positive” and “negative” shear refer to the direc-tion of the load. The loads and displacements, corre-sponding to negative shear, are converted to their abso-lute values and compared with the results taken frompositive shear. When the adhesive undergoes negativeshear, a small decrease of the absolute deformations isobserved. This is in the range of 6% and presumably itis due to the fact that negative shear also recovers thepermanent deformations caused by the previous posi-tive shearing.
123
220 A. Ioannidou-Kati et al.
Fig. 12 Comparison between ’positive’ and ’negative’ shear
3.2 Tensile test results
Figure 13 illustrates the stress–strain graph obtainedby the tensile static tests. The graph is divided into twophases and resembles the experimental results obtainedat 23 ◦C in the research performed by Hagl et al. (2012)and Santarsiero et al. (2017). The mechanical responsestarts froma linear behaviour up to approximately 8kN.Then, the second phase starts where the stiffness is sig-nificantly reduced and the behaviour of the adhesiveexhibits an approximately linear behaviour until fail-ure.As expected, the whitening phenomenon of TSSA isobserved during the tensile test. The whitening starts
Fig. 13 Static tension test results
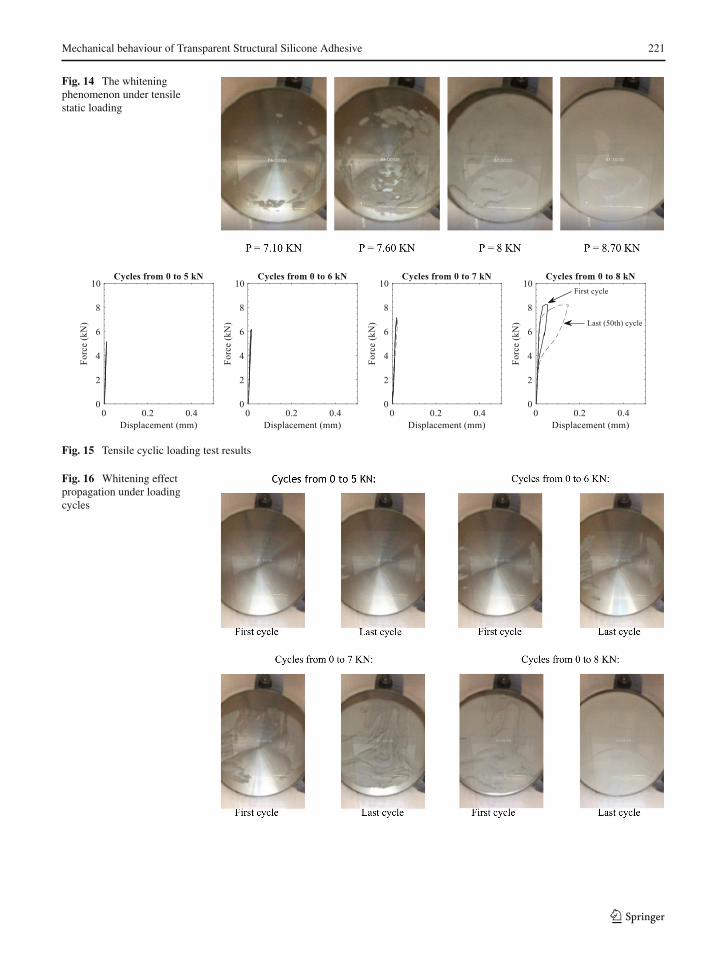
to be visible in small dots at approximately 80% ofthe connection radius (see Fig. 14), a fact which iscompletely in line with the observations of Santarsieroet al. (2017). Subsequently, it forms a crescent shapethat propagates towards the middle of the connectionand finally covers the entire surface. The only part thatremains transparent is a very thin outer ring of the con-necting surface. In thework of Santarsiero et al. (2017),the propagation of whitening on a circular connectionsubjected to tensile loading is extensively investigatedand for the sake of brevity not repeated here.Figure 15 illustrates the response of the adhesiverecorded during the first and last cycle for each max-imum load level at a frequency of 0.1 Hz. The resultsshow that for loading cycles up to 6kN, the loading andunloading curves overlap, meaning that response of thematerial is (almost) perfectly linear. When the max-imum load increases to 7kN, a very small deviationbetween the curves representing the 1st (continuousline) and the 50th cycle (dotted line) is observed, a factwhich indicates the beginning of the stress-softeningeffect. More severe softening is observed during theloading cycles up to 8kN. The softening behaviourof the material appears to increase dramatically as themaximum load increases from7 to 8kN and continuousto increase with the number of cycles. Nevertheless,TSSA does not exhibit any permanent deformationsunder cyclic loading.Figure 16 illustrates the development of the whiteningphenomenon under loading cycles. For loading cyclesup to 6kN, whitening appears in a crescent shape at80% of the radius. As the cycles increase, whiteningappears in the same position and shows a small spreadaround this point. When the maximum stress exceeds6kN, the whitening effect seems to spread faster and inthe end covers the entire surface, leaving a small ring atthe perimeter still transparent. It must be noted that inall of the cycles performed, the whitening completelydisappeared when the load was removed, leaving notrace of whitened surface. The propagation of whiten-ing and the stress level it appears proved to be con-sistent for most of the specimens. Inconsistencies areobserved in defected specimens that failed earlier thanexpected and showed more sever softening behaviour.In the work of Sitte et al. (2011), this is considered asa positive feature, as the propagation of whitening mayprovide an indication of the quality of bonding withoutdestroying the connection.
123
Mechanical behaviour of Transparent Structural Silicone Adhesive 221
Fig. 14 The whiteningphenomenon under tensilestatic loading
Fig. 15 Tensile cyclic loading test results
Fig. 16 Whitening effectpropagation under loadingcycles
123
222 A. Ioannidou-Kati et al.
4 Analytical modeling
When numerically analyzing adhesive point-fixingsusing a finite element software, the accuracy of theresults largely depends on the predefined materialmodel. The glass and steel elements can be simulatedwith linear elastic properties; however, adhesives, suchas TSSA, require specific mathematical expressions todescribe their behaviour. The suitability of the model isassessed by curve fitting various mathematical expres-sions to experimental data that is generated in the cur-rent paper and experimental data derived from litera-ture.
4.1 Theoretical background
Nonlinear elasticity problems are often solved usingstrain energy functions (Marckmann andVerron 2006).The constitutive models are expressed as a functionof the deformation gradient tensor. Most hyperelas-tic material models are based on the assumption thatelastomers are perfectly incompressible. Even thoughrubber-like materials have a Poisson’s ratio very closeto 0.5, it is not correct to assume that their behaviour isincompressible. Rubbers still exhibit volume changes,especially when they are under a confined state. Forthis reason, the mathematical modeling of the mechan-ical behaviour of elastomers requires the strain energyfunction to be broken down to an isochoric and a vol-umetric part. The decoupled strain energy function iswritten as
W = W ( f ) = Wiso(F) + Wvol(J ) (1)
where W, the strain energy density (or potential) or thestrain per unit of reference volume; F, the deformationgradient tensor;Wiso(F), the isochoric part of the strainenergy function, corresponding to the case of perfectincompressibility; Wvol(J ), the volumetric part of thestrain energy function, accounting for volume changes.The majority of hyperelastic material models thatassume incompressible behaviour are based on thevolume-preserving deformation tensor F. A model thatis solely based on this assumption can only be consid-ered acceptable for non-confined cases, such as uni-axial tension or compression, simple shear and biax-ial stress states. Most finite element codes express thestrain energy function in terms of the principal invari-ants of the left Cauchy–Green tensor B or in terms ofthe principal extension ratios λ1,λ2,λ3, as
Wiso(F) = Wiso
(I1, I2, I3
) = Wiso (λ1, λ2, λ3) (2)
where
F = J13 F (3)
I1 = λ21 + λ22 + λ23 (4)
I2 = λ21λ22 + λ22λ
23 + λ23λ
21 (5)
I3 = λ21λ22λ
23 = 1 (6)
4.2 Method
The curve fitting process requires the reformulationof the strain energy functions in terms of engineeringstresses and strains. In large strain problems, based onthe finite deformation theory, the stress state of rubberscan be expressed either in terms of the Cauchy (or true)stress tensor σ or of the 1st Piola–Kirchhoff tensor P.The relation between the stress tensors is
P = JσF−T (7)
where J, the Jacobian of the deformation gradient tensor(J=det(F)); σ, the Cauchy stresses tensor.
The Cauchy stress tensor defines the stress stateof the body in the deformed state, whereas the 1stPiola–Kirchhoff tensor defines the stress state relativeto the reference configuration. The 1st Piola–Kirchhoffstresses are also referred to as engineering stresses. Inliterature (Drass et al. 2017a; Guo and Sluys 2006;Ogden et al. 2004), one can find the stress state of rub-bers expressed also in Biot (or nominal) stresses ti. Forcommon deformation states, such as uniaxial or biax-ial tension and compression or simple shear, the Biotstresses are equal to the 1st Piola–Kirchhoff stresses,since no rotation of the rigid body takes place underthese stress states.
T = RTP (8)
where T, the Biot (or nominal) stress tensor; RT, thetranspose of the rotation matrix (the rotation matrix Ris equal to the identity matrix I for commonly testeddeformation states).
It is common to assess the behaviour of elastomericmaterials based on their undeformed state since exper-imental data are expressed in terms of engineeringstresses and strains. For this reason, the derivation ofthe 1st Piola–Kirchhoff stress is considered more suit-able for the curve fitting process. However, this tensordoes not provide any physical interpretation and thusthe Cauchy stress tensor provides better insight when
123
Mechanical behaviour of Transparent Structural Silicone Adhesive 223
numerically analyzing rubbermaterials. The relation ofthe principal Cauchy stresses σi with the strain energydensity is
σi = λi∂W(λ1, λ2, λ3)
∂λi(9)
The relation of the Cauchy stress tensor with the cor-responding Biot (or engineering) stresses (Drass et al.2017b; Guo and Sluys 2006; Marckmann and Verron2006; Mooney 1940; Ogden et al. 2004), which aremeasured directly in experiments, is
ti = λi∂W(λ1, λ2, λ3)
∂λi− pλ−1
i ≡ σiλ−1i (10)
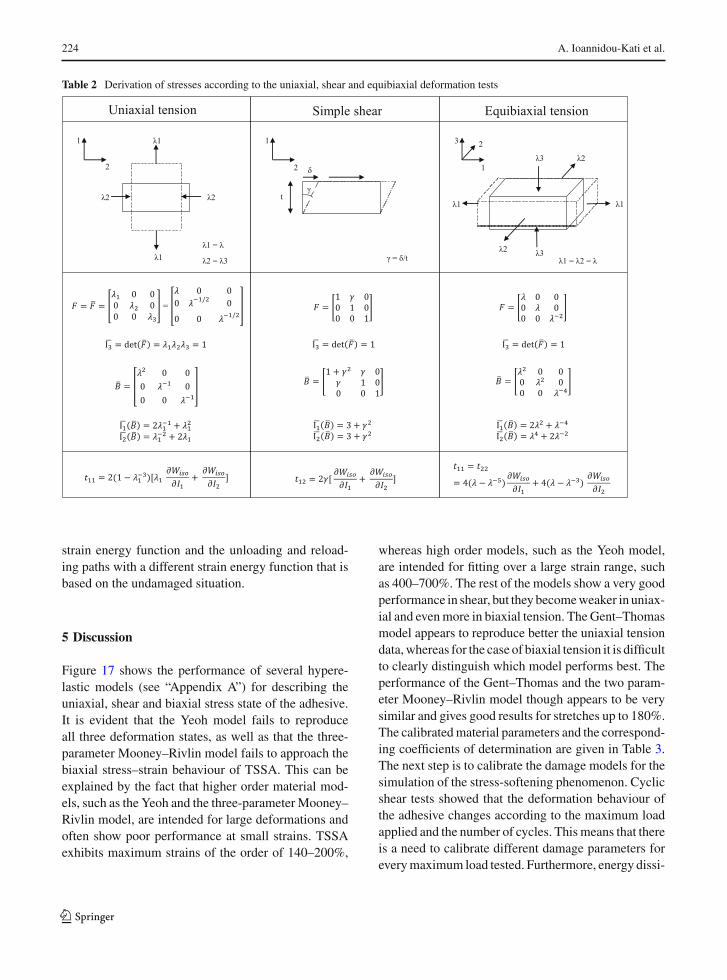
In this study, the results of the shear tests are com-bined with data from uniaxial tension and biaxial testsconducted by Drass et al. (2017a) and Santarsiero et al.(2016a), respectively. Drass et al. performed biaxialbulge tests, where water pressure was applied to theTSSA foil. In this way, a biaxial deformation state wasinduced in the adhesive, based on the principle of aninflating balloon. Santarsiero et al. performed uniax-ial tension tests on dumbbell specimens at a displace-ment rate of 1 mm/min. The size of the dumbbell spec-imens was based on EN ISO 37-type 2 (InternationalOrganization for Standardization 2011), with only thetransversal dimensions increased with a factor of 2.5.Both tests were performed at room temperature.This work aims to calibrate only the material parame-ters for the isochoric part of TSSA, which are suitablefor non-confined deformation states. For this purpose,material models with maximum three parameters aregoing to be considered, since larger number of param-eters also requires a larger experimental database to befitted. The deformation gradient tensor and the stressreformulations for each deformation state (uniaxial,shear and biaxial) are summarized in Table 2. For futureresearch, it is recommended that oedometric tests areperformed, in order to calibrate the bulk modulus ofTSSA (see “Appendix A”).The calibration of the material parameters is based onthe non-linear least square optimization method. Thestress–strain curves derived from the shear tests areaveraged by means of a Matlab® script that interpo-lates between the ordinate values of each dataset andsubsequently averages the corresponding abscissa val-ues. A Matlab® script is also developed for the curvefitting process. The accuracy of the material modelis increased when datasets from multiple deformation
states are taken into account, because in this case a sin-gle set of material parameters is used to describe alldeformations states. The fitting process is based on theleast squares method that calibrates the material con-stants by minimizing the value of the error functionE. The Matlab® functions Lsqcurvefit and Lsqnonlinwere used for this purpose. Matlab® also offers theoption to minimize the error either using the ’Trust-region-reflective’ or the ‘Levenberg–Marquardt’ algo-rithm. For both cases the results were the same. Theerror function is
E =nUT∑
i=1
(σtestι − σtheorι
)2 +nS∑
j=1
(σtestj − σtheorj
)2
+nBT∑
k=1
(σtestk − σtheork
)2(11)
where, nUT, nS, nET—the number of data points ofuniaxial tension, shear and equibiaxial tension tests,respectively.The fitting of each model to the experimental data isassessed by introducing the coefficient of determina-tion R2, which takes the value of 1 in case of perfectfitting.
R = 1 −∑
(yi − yi )2∑(yi − yi )2
(12)
where yi , yi and yi , the test data—the model data andthe average value of the test data, respectively.
4.3 Modeling the stress-softening phenomenon
Several continuummechanics and pseudo-elastic mod-els exist that describe the stress-softening phenomenonobserved in elastomers. In practice, few of them areused and are commercially available in finite elementanalysis software. Such modes were proposed by Simo(1987), Govindjee and Simo (1991), Ogden and Rox-burgh (1999), Chagnon et al. (2004), Qi and Boyce(2004) and many others. It must be noted that thesemodels can describe only a small fraction of the struc-tural properties of elastomers, since the mechanicalresponse of these materials changes constantly withthe number of cycles. The models based on continuummechanics theory are considered complex and compu-tationally demanding. On the other hand, most finiteelement software make use of pseudo-elastic materialmodels (see “Appendix B”) that make use of a damageparameter to describe the loading path with a common
123
224 A. Ioannidou-Kati et al.
Table 2 Derivation of stresses according to the uniaxial, shear and equibiaxial deformation tests
strain energy function and the unloading and reload-ing paths with a different strain energy function that isbased on the undamaged situation.
5 Discussion
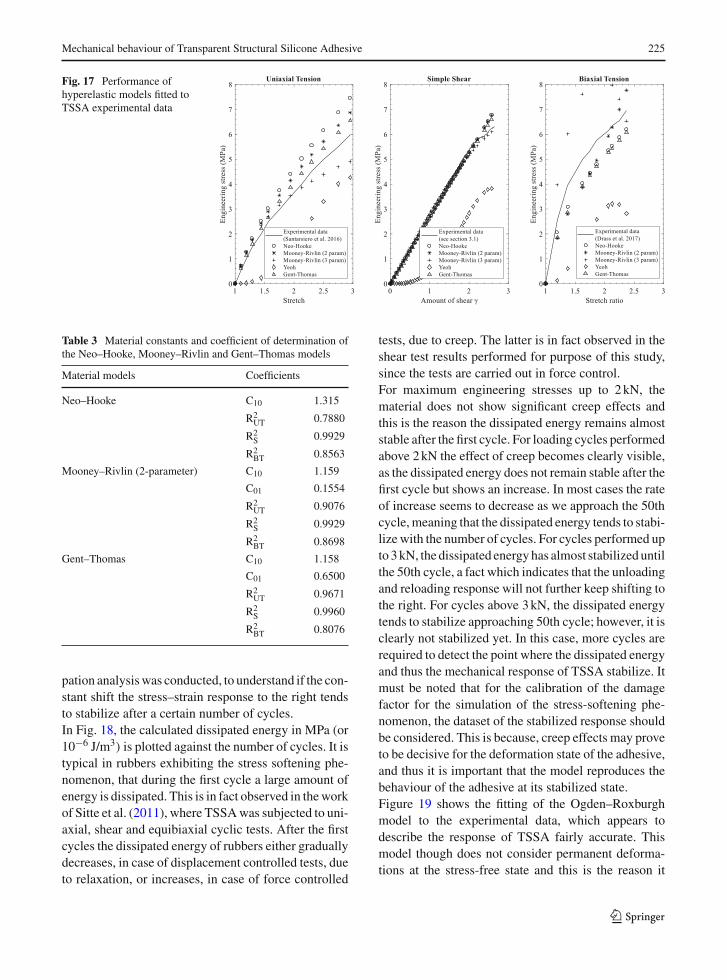
Figure 17 shows the performance of several hypere-lastic models (see “Appendix A”) for describing theuniaxial, shear and biaxial stress state of the adhesive.It is evident that the Yeoh model fails to reproduceall three deformation states, as well as that the three-parameter Mooney–Rivlin model fails to approach thebiaxial stress–strain behaviour of TSSA. This can beexplained by the fact that higher order material mod-els, such as the Yeoh and the three-parameterMooney–Rivlin model, are intended for large deformations andoften show poor performance at small strains. TSSAexhibits maximum strains of the order of 140–200%,
whereas high order models, such as the Yeoh model,are intended for fitting over a large strain range, suchas 400–700%. The rest of the models show a very goodperformance in shear, but they becomeweaker in uniax-ial and evenmore in biaxial tension. TheGent–Thomasmodel appears to reproduce better the uniaxial tensiondata,whereas for the case of biaxial tension it is difficultto clearly distinguish which model performs best. Theperformance of the Gent–Thomas and the two param-eter Mooney–Rivlin model though appears to be verysimilar and gives good results for stretches up to 180%.The calibratedmaterial parameters and the correspond-ing coefficients of determination are given in Table 3.The next step is to calibrate the damage models for thesimulation of the stress-softening phenomenon. Cyclicshear tests showed that the deformation behaviour ofthe adhesive changes according to the maximum loadapplied and the number of cycles. Thismeans that thereis a need to calibrate different damage parameters foreverymaximum load tested. Furthermore, energy dissi-
123
Mechanical behaviour of Transparent Structural Silicone Adhesive 225
Fig. 17 Performance ofhyperelastic models fitted toTSSA experimental data
Table 3 Material constants and coefficient of determination ofthe Neo–Hooke, Mooney–Rivlin and Gent–Thomas models
Material models Coefficients
Neo–Hooke C10 1.315
R2UT 0.7880
R2S 0.9929
R2BT 0.8563
Mooney–Rivlin (2-parameter) C10 1.159
C01 0.1554
R2UT 0.9076
R2S 0.9929
R2BT 0.8698
Gent–Thomas C10 1.158
C01 0.6500
R2UT 0.9671
R2S 0.9960
R2BT 0.8076
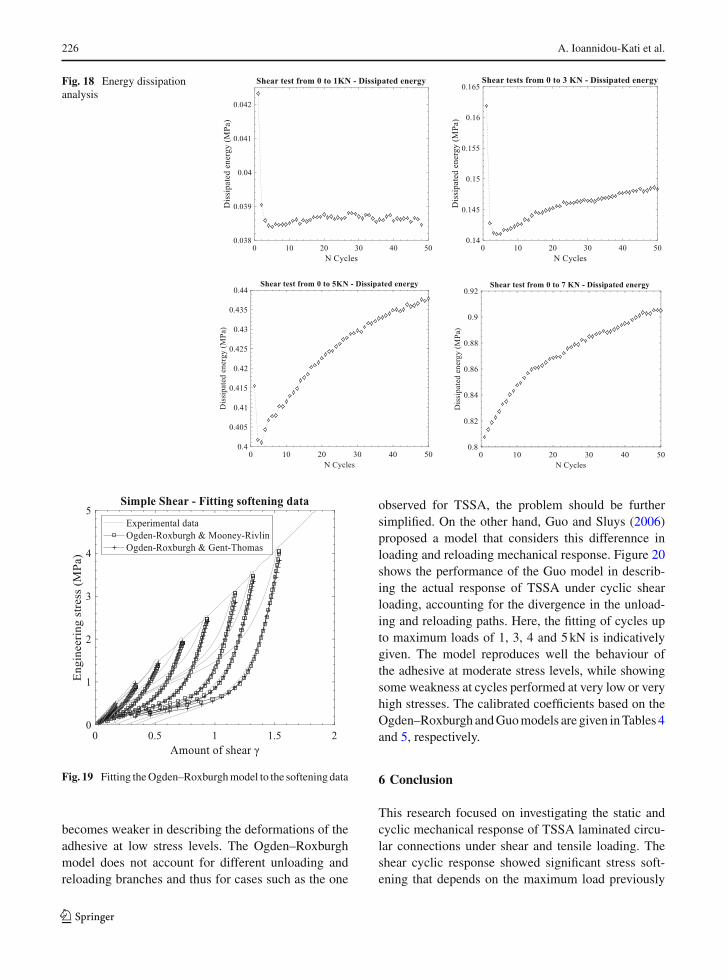
pation analysiswas conducted, to understand if the con-stant shift the stress–strain response to the right tendsto stabilize after a certain number of cycles.In Fig. 18, the calculated dissipated energy in MPa (or10−6 J/m3) is plotted against the number of cycles. It istypical in rubbers exhibiting the stress softening phe-nomenon, that during the first cycle a large amount ofenergy is dissipated. This is in fact observed in theworkof Sitte et al. (2011), where TSSAwas subjected to uni-axial, shear and equibiaxial cyclic tests. After the firstcycles the dissipated energy of rubbers either graduallydecreases, in case of displacement controlled tests, dueto relaxation, or increases, in case of force controlled
tests, due to creep. The latter is in fact observed in theshear test results performed for purpose of this study,since the tests are carried out in force control.For maximum engineering stresses up to 2kN, thematerial does not show significant creep effects andthis is the reason the dissipated energy remains almoststable after the first cycle. For loading cycles performedabove 2kN the effect of creep becomes clearly visible,as the dissipated energy does not remain stable after thefirst cycle but shows an increase. In most cases the rateof increase seems to decrease as we approach the 50thcycle,meaning that the dissipated energy tends to stabi-lize with the number of cycles. For cycles performed upto 3kN, the dissipated energyhas almost stabilized untilthe 50th cycle, a fact which indicates that the unloadingand reloading response will not further keep shifting tothe right. For cycles above 3kN, the dissipated energytends to stabilize approaching 50th cycle; however, it isclearly not stabilized yet. In this case, more cycles arerequired to detect the point where the dissipated energyand thus the mechanical response of TSSA stabilize. Itmust be noted that for the calibration of the damagefactor for the simulation of the stress-softening phe-nomenon, the dataset of the stabilized response shouldbe considered. This is because, creep effects may proveto be decisive for the deformation state of the adhesive,and thus it is important that the model reproduces thebehaviour of the adhesive at its stabilized state.Figure 19 shows the fitting of the Ogden–Roxburghmodel to the experimental data, which appears todescribe the response of TSSA fairly accurate. Thismodel though does not consider permanent deforma-tions at the stress-free state and this is the reason it
123
226 A. Ioannidou-Kati et al.
Fig. 18 Energy dissipationanalysis
Fig. 19 Fitting theOgden–Roxburghmodel to the softening data
becomes weaker in describing the deformations of theadhesive at low stress levels. The Ogden–Roxburghmodel does not account for different unloading andreloading branches and thus for cases such as the one
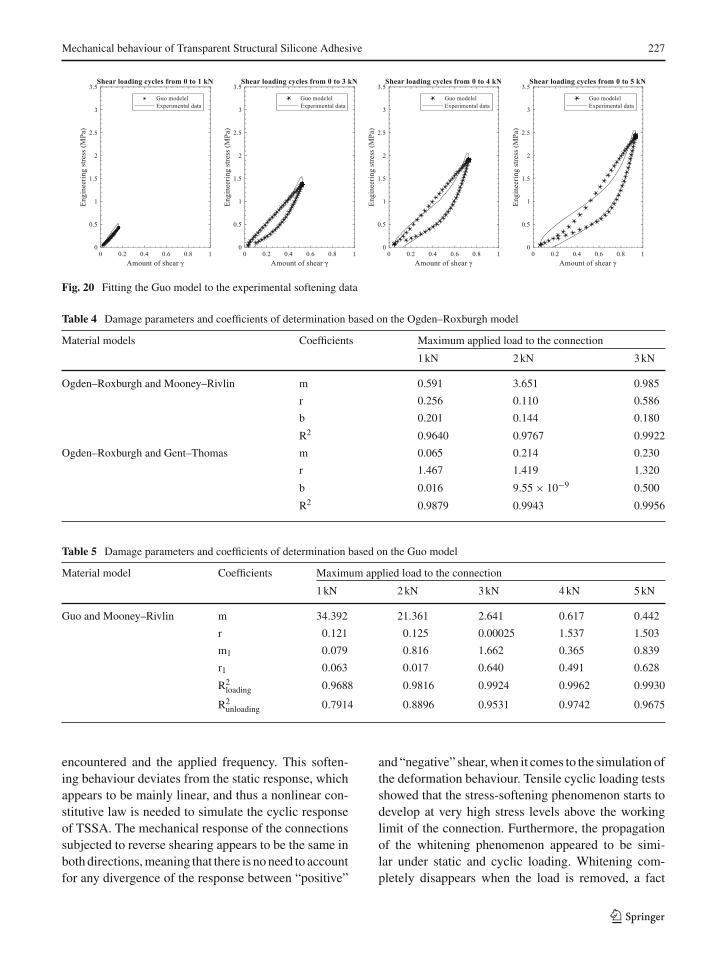
observed for TSSA, the problem should be furthersimplified. On the other hand, Guo and Sluys (2006)proposed a model that considers this differennce inloading and reloading mechanical response. Figure 20shows the performance of the Guo model in describ-ing the actual response of TSSA under cyclic shearloading, accounting for the divergence in the unload-ing and reloading paths. Here, the fitting of cycles upto maximum loads of 1, 3, 4 and 5kN is indicativelygiven. The model reproduces well the behaviour ofthe adhesive at moderate stress levels, while showingsome weakness at cycles performed at very low or veryhigh stresses. The calibrated coefficients based on theOgden–Roxburgh andGuomodels are given inTables 4and 5, respectively.
6 Conclusion
This research focused on investigating the static andcyclic mechanical response of TSSA laminated circu-lar connections under shear and tensile loading. Theshear cyclic response showed significant stress soft-ening that depends on the maximum load previously
123
Mechanical behaviour of Transparent Structural Silicone Adhesive 227
Fig. 20 Fitting the Guo model to the experimental softening data
Table 4 Damage parameters and coefficients of determination based on the Ogden–Roxburgh model
Material models Coefficients Maximum applied load to the connection
1kN 2kN 3kN
Ogden–Roxburgh and Mooney–Rivlin m 0.591 3.651 0.985
r 0.256 0.110 0.586
b 0.201 0.144 0.180
R2 0.9640 0.9767 0.9922
Ogden–Roxburgh and Gent–Thomas m 0.065 0.214 0.230
r 1.467 1.419 1.320
b 0.016 9.55 × 10⁻⁹ 0.500
R2 0.9879 0.9943 0.9956
Table 5 Damage parameters and coefficients of determination based on the Guo model
Material model Coefficients Maximum applied load to the connection
1kN 2kN 3kN 4kN 5kN
Guo and Mooney–Rivlin m 34.392 21.361 2.641 0.617 0.442
r 0.121 0.125 0.00025 1.537 1.503
m1 0.079 0.816 1.662 0.365 0.839
r1 0.063 0.017 0.640 0.491 0.628
R2loading 0.9688 0.9816 0.9924 0.9962 0.9930
R2unloading 0.7914 0.8896 0.9531 0.9742 0.9675
encountered and the applied frequency. This soften-ing behaviour deviates from the static response, whichappears to be mainly linear, and thus a nonlinear con-stitutive law is needed to simulate the cyclic responseof TSSA. The mechanical response of the connectionssubjected to reverse shearing appears to be the same inbothdirections,meaning that there is noneed to accountfor any divergence of the response between “positive”
and “negative” shear,when it comes to the simulation ofthe deformation behaviour. Tensile cyclic loading testsshowed that the stress-softening phenomenon starts todevelop at very high stress levels above the workinglimit of the connection. Furthermore, the propagationof the whitening phenomenon appeared to be simi-lar under static and cyclic loading. Whitening com-pletely disappears when the load is removed, a fact
123

228 A. Ioannidou-Kati et al.
which must be carefully considered in case the phe-nomenon is utilized as a warning for overloading. Incivil engineering practice, stress peaks usually appearinstantaneously, a fact which means that whitening isexpected to occur instantly. Nevertheless, the propaga-tion of the whitening effect shows some consistency,a fact which is considered advantageous as it may beused as an indicator of the quality of bonding in non-destructive quality assurance testing. Finally, the sheartests were combined with uniaxial and biaxial test datato calibrate various hyperelastic models for the simu-lation of the mechanical response of TSSA. The soft-ening behaviour observed in shear tests was modeledbased on the simplified approach proposed by Ogdenand Roxburgh. A less conservative approach was sug-gested based on the model of Guo, which provides agood approximation of the actual cyclic response ofthe adhesive. This model may be implemented in FEanalysis through a user-defined subroutine and be usedto predict the changes in stiffness observed during thetests.
Acknowledgements The authors would like to thank GlasTrösch AG Swisslamex, Dow Corning and Nuova Oxidal forthe material support and fabrication of specimens. Furthermore,the assistance and support of all TU Delft Stevin Laboratorymembers that contributed in preparing and conducting the testsis gratefully acknowledged.
Compliance with ethical standards
Conflict of interest On behalf of all authors, the correspondingauthor states that there is no conflict of interest.
Open Access This article is distributed under the terms ofthe Creative Commons Attribution 4.0 International License(http://creativecommons.org/licenses/by/4.0/), which permitsunrestricted use, distribution, and reproduction in any medium,provided you give appropriate credit to the original author(s) andthe source, provide a link to the Creative Commons license, andindicate if changes were made.
Appendix A
Isochoric part - Assumption of incompressibility:Rubber-like material models are classified into twobasic categories based on the expression of the strainenergy function. The phenomenological models thatprovide a mathematical framework for describing themechanical behaviour of elastomers based on con-tinuum mechanics. The determination of the material
parameters is difficult and thesemodelsmayprove to beinaccurate for large deformations out of the predefinedrange of the model. Since they are in essence empiricalexpressions, they lack a physical interpretation (Dis-persyn et al. 2017). The physical (ormicro-mechanical)models that are based on physics of polymer chains andon statistical and kinetic theory. These models deriveelastic properties from an idealized model of the struc-ture (Guo and Sluys 2006). The strain energy func-tion is formed based on microscopic phenomena. Thisstudy focuses on phenomenological models and com-pares the performance of the Mooney–Rivlin (with 2or 3 parameters), Neo–Hooke, Yeoh andGent–Thomasmodels.Mooney–RivlinIn the work of Marckmann and Verron (2006), theMooney–Rivlin theory is considered appropriate forrubbers exhibiting moderate deformations (lower than200%). The strain energy function of this model is
Wiso = C10(I1 − 3) + C01(I2 − 3)
where C10 and C01 are the material parameters (Dis-persyn et al. 2017; Mooney 1940).Neo–HookeThe Neo–Hookean hyperelastic model is a special caseof the Mooney–Rivlin model, where C01 is equal tozero and thus the strain energy function depends onlyon the first invariant I1 (Dispersyn et al. 2017). It isthe simplest hyperelastic model and it is applicable incases when few test data are available (Dispersyn et al.2017). Even though a single test is needed to deter-mine the material response, the model is not able toaccurately describe the behaviour in other modes suchas other multi-parameter models; however, it can stillprovide a good approximation (Ali et al. 2010; Mar-low 2003). In addition, due to its simplified formula,this model does not accommodate differences in curva-ture and therefore cannot describe an S-shaped stress-deformation diagram. According to Steinmann et al.(2012) the model describes experimental data fairlyaccurate for small deformations(λ) in uniaxial tensionand simple shear up to 1.5 and 1.9, respectively. Thestrain energy function of the Neo-Hooke model is:
Wiso = C10(I1 − 3)
YeohThis model is suitable to describe large deformations(Dispersyn et al. 2017) and predicts the stress–strainbehaviour of different deformation states from test data
123
Mechanical behaviour of Transparent Structural Silicone Adhesive 229
coming only from uniaxial tension data (Peeters andKussner 1999). However, the performance of the Yeohmodel at low strains must be carefully examined (Yeoh1995). The mathematical expression of the Yeoh mod-els is
Wiso = C10(I1 − 3) + C20(I1 − 3)2 + C30(I1 − 3)3
Gent–ThomasThe phenomenological model proposed by Gent andThomas (1958) has the same material constants as theMooney–Rivlinmodel,with the only difference that thenatural logarithm is included in the second term. Sinceit does not include higher terms of I1, it is not suit-able for predicting large deformations (Dispersyn et al.2017), as the Yeoh model, but it is considered fairlyaccurate at small strains. The strain energy function ofthe Gent–Thomas model is
Wiso = C10(I1 − 3) + C01 ln
(I13
)
Volumetric part - Extension to compressibility:In literature, one can find several models that describevolumetric changes of rubbers andwhich are expressedas a function of the jacobian, J, of the deformation gra-dient tensor. These models consist of a single materialconstant which is the bulk modulus, K, of the adhesive.In order to properly define the bulk modulus of rub-bers, oedometric test are needed (Dias and Odenbreit2016). An oedometric test requires inserting a piece ofthe adhesive, often a circular specimen, inside a rigidmatrix in order to achieve a perfectly confined state byfully restraining lateral expansion. Subsequently, theupper part of the adhesive is compressed with the helpof a piston in order to impose a hydrostatic stress stateto the adhesive. During this process, stress and straindata are kept for the determination of the bulk modu-lus. The most common material model that accountsfor compressible behaviour is expressed by Sussmanand Bathe (1987) and is
Wvol = K
2(J − 1)2
Appendix B
Most finite element software make use of pseudo-elastic material models to describe stress-softeningphenomena of elastomers. Pseudo-elastic models usethe theory of pseudo-elasticity to describe the loadingpath with a common strain energy function and the
unloading and reloading paths with a different strainenergy function that is based on the undamaged situa-tion.Ogden–RoxburghThemost commonly usedmodel in finite element codesthat considers cyclic stress-softening effects is based onthe generalization of the Ogden and Roxburgh model(Ogden and Roxburgh 1999) proposed byMars (2004).This model introduces a scalar variable η that rangesbetween 0 and 1. This variable represents the damagecaused by the Mullins effect. In the undamaged situa-tion (1st loading) η is equal to 1. It must be noted thatthis variable does not affect the hydrostatic (volumet-ric) part of the strain energy function, because volumevariations are very small.
W = ηWiso(I 1, I 2) + �(η) + Wvol
η = 1
rer f
[1
m
((Wm − Wiso(I 1, I 2))
m + bWm
]
wherem and r,material constants,m, r> 0; b, a positivematerial parameter, 0≤ b≤ 0.5; erf, the error function;Wm, the previously maximum energy encountered.GuoThe Ogden–Roxburgh model can only describe situa-tions that approach the “idealMullins effect”,where theunloading and reloading response follow the samepath.In cases of diverging loading and reloading responses,a second class of models is defined. To this day, thesemodels are not supported by finite element codes,unless they are considered via a user defined subrou-tine.Models accounting for this divergence of the load-ing and reloading paths have been developed byMiehe(1995) and Besdo and Ihlemann (2003). Recently, adamage model based on the theory of pseudo-elasticitywas proposed by Guo (Guo and Sluys 2006).Unloading branch:
η = 1 − 1
rer f
[1
m
((Wm − W0)
m(Wm − W00)
)]
ηm = 1 − 1
rer f
[1
m
]
where W0, strain energy of the undamaged material;W00, strain energy at the origin in the stress-free state;ηm, the minimum value of the damage variable.Reloading branch:
ηr = ηm + (1 − ηm)er f
[1
m1
(Wm − Wmr
Wm − W00
)r1]
Where:
123

230 A. Ioannidou-Kati et al.
m1 and r1 material constants, m, r > 0Wmr the strain energy when the material is
again subjected to loading (assume 0)
Appendix C
Static tests
123
Mechanical behaviour of Transparent Structural Silicone Adhesive 231
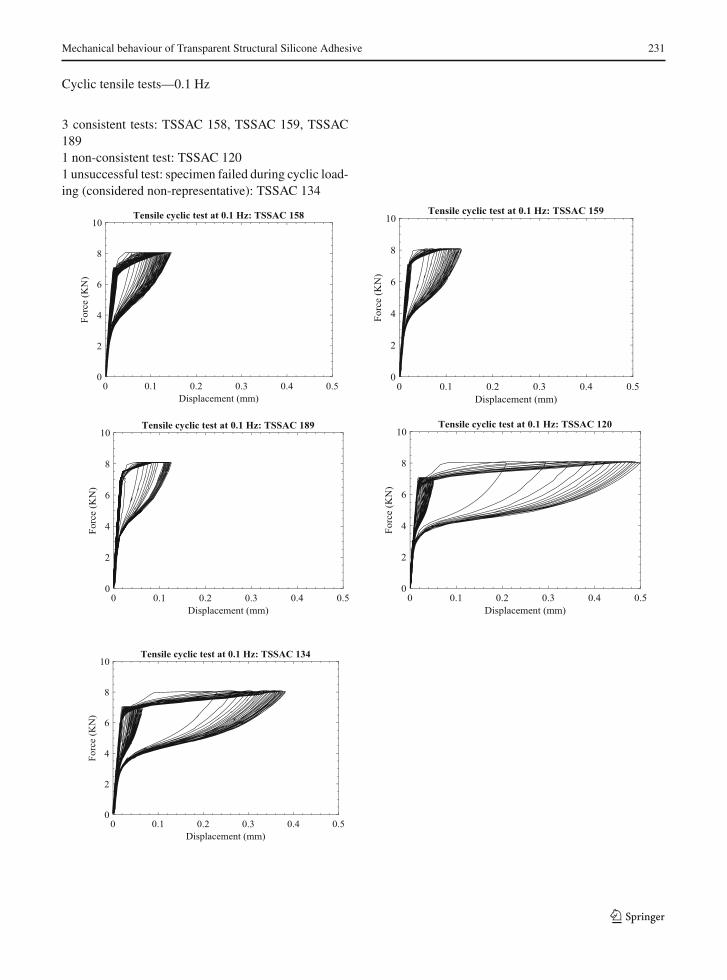
Cyclic tensile tests—0.1 Hz
3 consistent tests: TSSAC 158, TSSAC 159, TSSAC1891 non-consistent test: TSSAC 1201 unsuccessful test: specimen failed during cyclic load-ing (considered non-representative): TSSAC 134
123
232 A. Ioannidou-Kati et al.
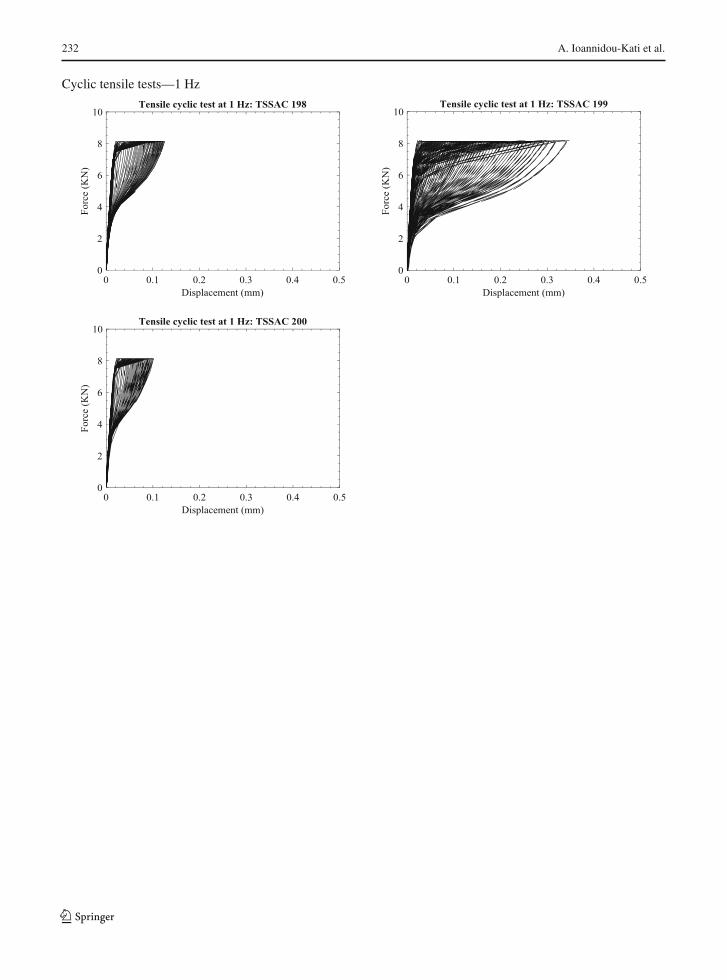
Cyclic tensile tests—1 Hz
123

Mechanical behaviour of Transparent Structural Silicone Adhesive 233
Cyclic shear tests—0.1 Hz one direction shear
123

234 A. Ioannidou-Kati et al.
Cyclic shear tests—0.1 Hz two direction shear
123
Mechanical behaviour of Transparent Structural Silicone Adhesive 235
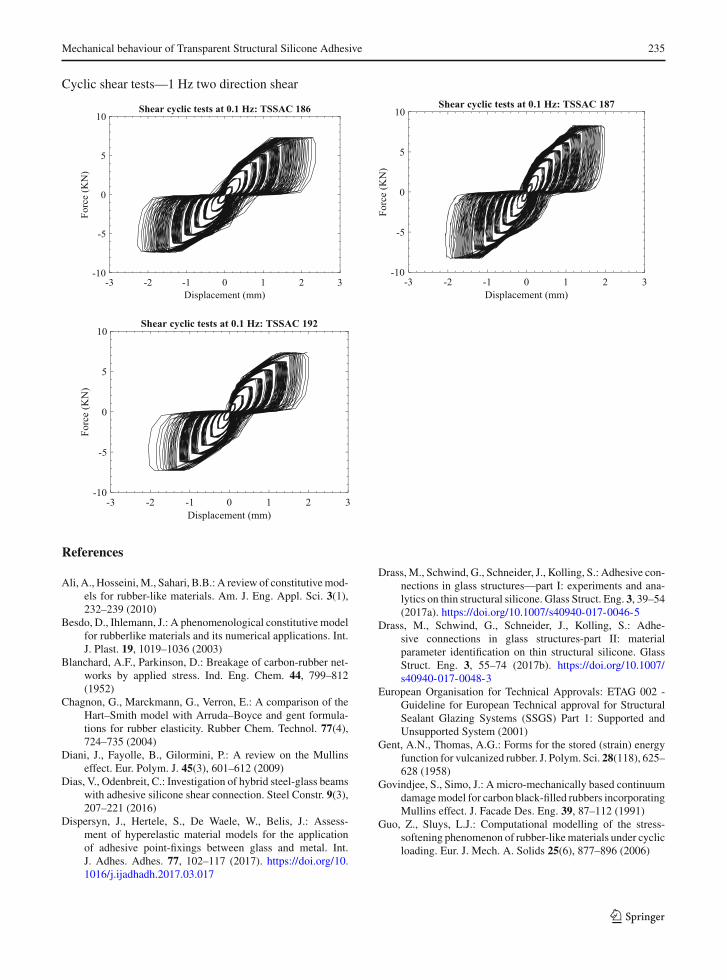
Cyclic shear tests—1 Hz two direction shear
References
Ali, A., Hosseini,M., Sahari, B.B.: A review of constitutivemod-els for rubber-like materials. Am. J. Eng. Appl. Sci. 3(1),232–239 (2010)
Besdo, D., Ihlemann, J.: A phenomenological constitutive modelfor rubberlike materials and its numerical applications. Int.J. Plast. 19, 1019–1036 (2003)
Blanchard, A.F., Parkinson, D.: Breakage of carbon-rubber net-works by applied stress. Ind. Eng. Chem. 44, 799–812(1952)
Chagnon, G., Marckmann, G., Verron, E.: A comparison of theHart–Smith model with Arruda–Boyce and gent formula-tions for rubber elasticity. Rubber Chem. Technol. 77(4),724–735 (2004)
Diani, J., Fayolle, B., Gilormini, P.: A review on the Mullinseffect. Eur. Polym. J. 45(3), 601–612 (2009)
Dias, V., Odenbreit, C.: Investigation of hybrid steel-glass beamswith adhesive silicone shear connection. Steel Constr. 9(3),207–221 (2016)
Dispersyn, J., Hertele, S., De Waele, W., Belis, J.: Assess-ment of hyperelastic material models for the applicationof adhesive point-fixings between glass and metal. Int.J. Adhes. Adhes. 77, 102–117 (2017). https://doi.org/10.1016/j.ijadhadh.2017.03.017
Drass,M., Schwind, G., Schneider, J., Kolling, S.: Adhesive con-nections in glass structures—part I: experiments and ana-lytics on thin structural silicone. Glass Struct. Eng. 3, 39–54(2017a). https://doi.org/10.1007/s40940-017-0046-5
Drass, M., Schwind, G., Schneider, J., Kolling, S.: Adhe-sive connections in glass structures-part II: materialparameter identification on thin structural silicone. GlassStruct. Eng. 3, 55–74 (2017b). https://doi.org/10.1007/s40940-017-0048-3
European Organisation for Technical Approvals: ETAG 002 -Guideline for European Technical approval for StructuralSealant Glazing Systems (SSGS) Part 1: Supported andUnsupported System (2001)
Gent, A.N., Thomas, A.G.: Forms for the stored (strain) energyfunction for vulcanized rubber. J. Polym. Sci. 28(118), 625–628 (1958)
Govindjee, S., Simo, J.: A micro-mechanically based continuumdamagemodel for carbon black-filled rubbers incorporatingMullins effect. J. Facade Des. Eng. 39, 87–112 (1991)
Guo, Z., Sluys, L.J.: Computational modelling of the stress-softening phenomenon of rubber-likematerials under cyclicloading. Eur. J. Mech. A. Solids 25(6), 877–896 (2006)
123

236 A. Ioannidou-Kati et al.
Hagl, A., Dieterich, O., Wolf, A.T., Sitte, S.: Tensile loading ofsilicone point supports-revisited. Chall. Glass 3, 235–247(2012)
Houwink, R.: Slipping of molecules during the deformationof reinforced rubber. Rubber Chem. Technol. 29, 888–93(1956)
International Organization for Standardization.: ISO 37-Rubber,vulcanized or thermoplastic—determination of tensilestress–strain properties (2011)
Kraus, G., Childers, C.W., Rollman, K.W.: Stress softening incarbon black reinforced vulcanizates. Strain rate and tem-perature effects. J. Appl. Polym. Sci. 10, 229–240 (1966)
Marckmann, G., Verron, E.: Comparison of hyperelastic mod-els for rubber-like materials. Rubber Chem. Technol. 79(5),835–858 (2006)
Marlow, R.S.: A general first-invariant hyperelastic constitutivemodel. In: Constitutive Models For Rubber-Proceedings,pp. 157–160 (2003)
Mars,W.V.: Evaluation of a pseudo-elastic model for theMullinseffect. Tire Sci. Technol. 32(3), 120–145 (2004)
Miehe, C.: Discontinuous and continuous damage evolution inOgden-type large-strain elastic materials. Eur. J. Mech. ASolids 14, 697–720 (1995)
Mooney,M.: A theory of large elastic deformation. J. Appl. Phys.11(9), 582–592 (1940)
Mullins, L.: Softening of rubber by deformation. Rubber Chem.Technol. 42(1), 339–362 (1969)
Ogden, R.W., Roxburgh, D.J.: A pseudo-elastic model for theMullins effect in filled rubber. Proc. R. Soc. A Math. Phys.Eng. Sci. 455, 2861–2877 (1999)
Ogden, R.W., Saccomandi, G., Sgura, I.: Fitting hyperelasticmodels to experimental data. Comput. Mech. 34(6), 484–502 (2004)
Overend, M., Nhamoinesu, S., Watson, J.: Structural perfor-mance of bolted connections and adhesively bonded jointsin glass structures. J. Struct. Eng. 139(12) , 04013015-1–04013015-12 (2013). https://ascelibrary.org/doi/pdf/10.1061/%28ASCE%29ST.1943-541X.0000748
Peeters, F., Kussner, M.: Material law selection in the finite ele-ment simulation of rubber-like materials and its practicalapplication in the industrial design process. In: Constitu-tive Models for Rubber: Proceedings of the First EuropeanConference on Constitutive Models for Rubber, pp. 29–36(1999)
Qi, H.J., Boyce, M.C.: Constitutive model for stretch-inducedsoftening of the stress-stretch behavior of elastomeric mate-rials. J. Mech. Phys. Solids 52(10), 2187–2205 (2004)
Santarsiero, M., Louter, C., Nussbaumer, A.: Laminated connec-tions for structural glass applications under shear loadingat different temperatures and strain rates. Constr. Build.Mater. 128, 214–237 (2016a). https://doi.org/10.1016/j.conbuildmat.2016.10.045
Santarsiero, M., Louter, C., Nussbaumer, A.: The mechanicalbehaviour of SentryGlas ionomer and TSSA silicon bulkmaterials at different temperatures and strain rates underuniaxial tensile stress state. Glass Struct. Eng. (2016b).https://doi.org/10.1007/s40940-016-0018-1
Santarsiero, M., Louter, C., Nussbaumer, A.: Laminated connec-tions for structural glass applications under tensile loading atdifferent temperatures and strain rates. Int. J. Adhes. Adhes.(2017). https://doi.org/10.1016/j.ijadhadh
Santarsiero, M., Louter, C., Nussbaumer, A.: A novel triaxialfailure model for adhesive connections in structural glassapplications. Eng. Struct. 166, 195–211 (2018). https://doi.org/10.1016/j.engstruct.2018.03.058
Simo, J.C.: On a fully three-dimensional finite-strain viscoelas-tic damage model: formulation and computational aspects.Comput.Methods Appl.Mech. Eng. 60(2), 153–173 (1987)
Sitte, S., Brasseur, M.J., Carbary, L.D., Wolf, A.T.: Preliminaryevaluation of the mechanical properties and durability oftransparent structural silicone adhesive (TSSA) for pointfixing in glazing. J. ASTM Int. 8(10), 1–27 (2011)
Steinmann, P., Hossain, M., Possart, G.: Hyperelastic models forrubber-like materials: consistent tangent operators and suit-ability for Treloar’s data. Arch. Appl. Mech. 82(9), 1183–1217 (2012)
Sussman, T., Bathe,K.J.: Afinite element formulation for nonlin-ear incompressible elastic and inelastic analysis. Comput.Struct. 26, 357–409 (1987)
Yeoh, O.H.: Phenomenological theory of rubber elasticity. In:Aggarwal, S.L. (ed.) Comprehensive Polymer Science.Pergamon Press, Oxford (1995)
123


![[Brown] a Simple Trasnversely Isotropic Hyperelastic Model](https://static.fdocuments.in/doc/165x107/55cf9680550346d0338be74e/brown-a-simple-trasnversely-isotropic-hyperelastic-model.jpg)


