Mapping Lung Cancer Disease in Libya using Standardized ... Maryam Ahmed Alramah.pdf ·...
9
Sains Malaysiana 48(1)(2019): 217–225 http://dx.doi.org/10.17576/jsm-2019-4801-25 Mapping Lung Cancer Disease in Libya using Standardized Morbidity Ratio, BYM Model and Mixture Model, 2006 to 2011: Bayesian Epidemiological Study (Pemetaan Penyakit Kanser Paru-Paru di Libya menggunakan Nisbah Morbiditi Piawai, Model BYM dan Model Campuran, 2006 hingga 2011: Kajian Bayesian Epidemiologi) MARYAM AHMED ALRAMAH*, NOR AZAH SAMAT & ZULKIFLEY MOHAMED ABSTRACT Cancer represents a significant burden on both patients and their families and their societies, especially in developing countries, including Libya. Therefore, the aim of this study was to model the geographical distribution of lung cancer incidence in Libya. The correct choice of a statistical model is a very important step to producing a good map of disease in question. Therefore, in this study will use three models to estimate the relative risk for lung cancer disease, they are initially Standardized Morbidity Ratio, which is the most common statistic used in disease mapping, BYM model, and Mixture model. As an initial step, this study begins by providing a review of all models are proposed, which we then apply to lung cancer data in Libya. In this paper, we show some preliminary results, which are displayed and compared by using maps, tables, graphics and goodness-of-fit, the last measure of displaying the results is common in statistical modelling to compare fitted models. The main general results presented in this study show that the last two models, BYM and Mixture have been demonstrated to overcome the problem of the first model when there no observed lung cancer cases in certain districts. Also, other results show that Mixture model is most robust and gives a better relative risk estimate across compared it with a range of models. Keywords: BYM model; disease mapping; Libya; lung cancer; mixture model; relative risk; Standardized Morbidity Ratio (SMR) ABSTRAK Kanser merupakan beban besar kepada pesakit dan keluarga mereka serta masyarakat, terutamanya di negara membangun, termasuk Libya. Oleh itu, tujuan kajian ini dijalankan adalah untuk merangka agihan geografi kejadian kanser paru-paru di Libya. Pemilihan model statistik yang betul merupakan satu langkah yang sangat penting untuk menghasilkan satu peta penyakit yang dikaji. Oleh itu, kajian ini akan menggunakan tiga model untuk menganggar risiko relatif bagi penyakit kanser paru-paru iaitu nisbah morbiditi piawai yang merupakan statistik biasa digunakan dalam pemetaan penyakit, model BYM dan model Campuran. Sebagai langkah pemula, kajian ini bermula dengan penyediaan ulasan untuk semua model yang dicadangkan, yang kemudiannya kami gunakan untuk data kanser paru-paru di Libya. Dalam kertas ini, kami tunjukkan beberapa keputusan awal yang dipapar dan dibandingkan dengan menggunakan peta, jadual, grafik dan kebagusan penyuaian yang merupakan langkah biasa terakhir untuk memaparkan keputusan dalam pemodelan statistik untuk membandingkan model suaian. Keputusan umum utama yang dikemukakan dalam kajian ini menunjukkan bahawa dua model terakhir, BYM dan Campuran telah menunjukkan kebolehan mengatasi masalah model pertama apabila tidak terdapat kes kanser paru-paru diperhatikan di daerah tertentu. Selain itu, keputusan lain juga menunjukkan bahawa model Campuran paling memberangsangkan dan memberikan penganggaran risiko relatif lebih baik berbanding model lain. Kata kunci: Kanser paru-paru; Libya; model BYM; model Campuran; nisbah morbiditi dipiawaikan (SMR); pemetaan penyakit; risiko relatif INTRODUCTION Libya is a North African country which lies along the southern coast of the Mediterranean, approximately, between the latitudes 18º and 33º north and 9º and 25º east. In addition, it is literally covered by the Sahara Desert. The only exception is the narrow 1,200-mile coastline bordering the Mediterranean Sea, where almost 80% of its population reside. Its total area is about 1,759,540 km 2 , of which more than 90% Sahara Desert with population is about 5,922,000 (Figure 1). Lung cancer is the most common cancer in the world after skin cancer, breast cancer in women and prostate cancer in men (Siegel et al. 2011), which causes most of the death of cancer (Ferlay et al. 2010). Globally, lung cancer is the most common form of malignant cancer in males and also in females but not common like breast
Transcript of Mapping Lung Cancer Disease in Libya using Standardized ... Maryam Ahmed Alramah.pdf ·...

Sains Malaysiana 48(1)(2019): 217–225 http://dx.doi.org/10.17576/jsm-2019-4801-25
Mapping Lung Cancer Disease in Libya using Standardized Morbidity Ratio, BYM Model and Mixture Model, 2006 to 2011: Bayesian Epidemiological Study
(Pemetaan Penyakit Kanser Paru-Paru di Libya menggunakan Nisbah Morbiditi Piawai, Model BYM dan Model Campuran, 2006 hingga 2011: Kajian Bayesian Epidemiologi)
MARYAM AHMED ALRAMAH*, NOR AZAH SAMAT & ZULKIFLEY MOHAMED
ABSTRACT
Cancer represents a significant burden on both patients and their families and their societies, especially in developing countries, including Libya. Therefore, the aim of this study was to model the geographical distribution of lung cancer incidence in Libya. The correct choice of a statistical model is a very important step to producing a good map of disease in question. Therefore, in this study will use three models to estimate the relative risk for lung cancer disease, they are initially Standardized Morbidity Ratio, which is the most common statistic used in disease mapping, BYM model, and Mixture model. As an initial step, this study begins by providing a review of all models are proposed, which we then apply to lung cancer data in Libya. In this paper, we show some preliminary results, which are displayed and compared by using maps, tables, graphics and goodness-of-fit, the last measure of displaying the results is common in statistical modelling to compare fitted models. The main general results presented in this study show that the last two models, BYM and Mixture have been demonstrated to overcome the problem of the first model when there no observed lung cancer cases in certain districts. Also, other results show that Mixture model is most robust and gives a better relative risk estimate across compared it with a range of models.
Keywords: BYM model; disease mapping; Libya; lung cancer; mixture model; relative risk; Standardized Morbidity Ratio (SMR)
ABSTRAK
Kanser merupakan beban besar kepada pesakit dan keluarga mereka serta masyarakat, terutamanya di negara membangun, termasuk Libya. Oleh itu, tujuan kajian ini dijalankan adalah untuk merangka agihan geografi kejadian kanser paru-paru di Libya. Pemilihan model statistik yang betul merupakan satu langkah yang sangat penting untuk menghasilkan satu peta penyakit yang dikaji. Oleh itu, kajian ini akan menggunakan tiga model untuk menganggar risiko relatif bagi penyakit kanser paru-paru iaitu nisbah morbiditi piawai yang merupakan statistik biasa digunakan dalam pemetaan penyakit, model BYM dan model Campuran. Sebagai langkah pemula, kajian ini bermula dengan penyediaan ulasan untuk semua model yang dicadangkan, yang kemudiannya kami gunakan untuk data kanser paru-paru di Libya. Dalam kertas ini, kami tunjukkan beberapa keputusan awal yang dipapar dan dibandingkan dengan menggunakan peta, jadual, grafik dan kebagusan penyuaian yang merupakan langkah biasa terakhir untuk memaparkan keputusan dalam pemodelan statistik untuk membandingkan model suaian. Keputusan umum utama yang dikemukakan dalam kajian ini menunjukkan bahawa dua model terakhir, BYM dan Campuran telah menunjukkan kebolehan mengatasi masalah model pertama apabila tidak terdapat kes kanser paru-paru diperhatikan di daerah tertentu. Selain itu, keputusan lain juga menunjukkan bahawa model Campuran paling memberangsangkan dan memberikan penganggaran risiko relatif lebih baik berbanding model lain.
Kata kunci: Kanser paru-paru; Libya; model BYM; model Campuran; nisbah morbiditi dipiawaikan (SMR); pemetaan penyakit; risiko relatif
INTRODUCTION
Libya is a North African country which lies along the southern coast of the Mediterranean, approximately, between the latitudes 18º and 33º north and 9º and 25º east. In addition, it is literally covered by the Sahara Desert. The only exception is the narrow 1,200-mile coastline bordering the Mediterranean Sea, where almost 80% of its population reside. Its total area is about
1,759,540 km2, of which more than 90% Sahara Desert with population is about 5,922,000 (Figure 1). Lung cancer is the most common cancer in the world after skin cancer, breast cancer in women and prostate cancer in men (Siegel et al. 2011), which causes most of the death of cancer (Ferlay et al. 2010). Globally, lung cancer is the most common form of malignant cancer in males and also in females but not common like breast

218
cancer. Also, it is contributing to 14-15% of all types of cancer (Ferlay et al. 2010; Siegel et al. 2011). Lung cancer is the leading cancer killer in both men and women in Libya. In recent years, lung cancer becomes the leading cause of cancer deaths in Libyan men. While breast cancer surpassed lung cancer to become the leading cause of cancer deaths in Libyan women (Akhtar et al. 1993; Bodalal et al. 2014). Cancer of the lung is overall the third commonest cancer after breast cancer and prostate cancer in Libya and contributes to 10% of all cancer cases found in this region. This is tobacco-related cancer and second most common cancer in males and fifth most common cancer in females. According to annual reports of the African Oncology Institute (AOI), they clearly showed that cigarette smoking is a prevalent male habit in Libyan society. In Libya, the ratio of females who are smoking is almost negligible (Abusaa 2007). In addition, there are studies confirmed that there is a great variation in the geographical distribution of lung cancer in the world (John & Ross 2010). About 70% of all the new cases of lung cancer occur in the developed countries, especially in the Arabic countries (Salim et al. 2011; Washington 2007). This study discusses and demonstrates the most common models which are used in the field of disease mapping, which are SMR Method, Besag, York and Mollie (BYM) Model and Mixture model, with their application to lung cancer in Libya. First, the classical method, of estimating the relative risk which is SMR method, is described, also its drawbacks are considered (Lawson et al. 2003). Likewise, the definitions and overview for a set of models that are used to improve the estimate of relative risk, are considered. These are BYM model and Mixture model. All these models used to reduce noise from the SMRs method by smoothing tools and modelling tools of relative risk to get estimates. Finally, these methods or models are applied to observed lung cancer data in Libya in order to identify a best method of estimating lung cancer risk by using a common goodness-of-fit called Deviance Information Criterion DIC (Spiegelhalter et al. 2002).
METHODS
Disease maps are important tools in the public health research. In the case of cancer, mapping can be viewed as a descriptive presentation of the cancer burden in some geographical areas and can help point out the areas where health policy should be improved. The maps can also be used for evaluating the performance of public health interventions. In any case, the maps must be designed to communicate effectively with the public, health researchers and decision makers (Bell et al. 2006). The biggest challenge is to ensure the maps are not being misinterpreted. Disease mapping is a process of displaying the geographical variability of disease on maps using different colours or shading. The idea is not new, but the advent of computers and computer graphics has made it simpler to apply and it is now widely used in descriptive epidemiology. For example, to display morbidity or mortality information for an area. Good maps of disease risk have been recognized as an important tool for disease control. Disease maps may be useful, especially for government agencies to allocate resources (Meza 2003). In this study, the analysis of relative risk estimation begins with the common method used in the study of disease mapping which is based on SMR in order to assess the status of an area with respect to disease incidence. This is followed by using three models to estimate the relative risk for lung cancer risk in Libya. These are BYM model and Mixture model.
STANDARDIZED MORBIDITY RATIO (SMR) METHOD
The SMR is the most common method used by researchers in the choice of appropriate measures of relative risk in disease mapping. In this research, SMR basically compares the observed incidence with the expected incidence, which has been used traditionally for the analysis of counts within tracts as described by Lawson (2006). In disease mapping, suppose that the study area to be mapped is divided into m exclusive regions (i=1, 2… m), each region has its own observed number of cases Oi and expected number of cases Ei. Using Oi and Ei as obtained from the available
FIGURE 1. Libya on the Africa Map

219
data, the relative risk Ɵi, which is the SMR, for area i, can be calculated using the following equation.
(1)
A study done by Samat and Percy (2008) used (1) in their discussion of standardized morbidity ratio and its application to dengue disease mapping in Malaysia. Although the SMR has been used commonly as an index to measure relative risk, it has several disadvantages. According to Lawson et al. (2003) since SMR is based on a ratio estimator, the mean and variance of SMR are highly dependent upon Ei. The SMR is very large in areas where the expected number of cases are small and small for areas where the expected number of cases are large. Furthermore, in areas where there are no observed count data or cases, the SMR is necessarily zero.
BESAG, YORK AND MOLLIE MODEL
To overcome the problem of SMRs, in this research the BYM model will be used to demonstrate the data. The main idea of this model is to produce more reliable estimates of relative risks for small areas or rare disease. This is by borrowing required information from the neighbouring areas. In this model of disease mapping to relative risk, area-specific random effects are decomposed which are divided into two components, as followed: The first component is ui that takes into account the effects that vary in a structured manner in space (clustering or correlated heterogeneity). The second component is vi that takes into account the effects that vary in an unstructured way between areas (uncorrelated heterogeneity). The uncorrelated heterogeneities are assumed to follow a normal distribution, as follows:
. For the first component which is the clustering component, a spatial correlation structure is used, where estimation of the risk in any area depends on neighbouring areas. The conditional autoregressive (CAR) model (Besag et al. 1991) is used,
In other words, the conditional distribution of each area-specific spatially structured component if follow a normal distribution with mean and variance (the average of its neighbours, inversely proportional to the number of its neighbours). Therefore, the model, introduced by Clayton and Kaldor (1987) and developed by Besag et al. (1991) is formulated as follows (where α is an overall level of the relative risk, Oi, Ei, Ɵi be the observed count, expected count and relative risk parameter in the ith area, respectively).
(2)
MIXTURE MODEL
In this research, the mixture model which has been proposed by Lawson and Clark (2002) will be considered. This model allows for the smoothness and the discontinuities to be on the map of the disease in question. This model assumed that the log-relative risk can be written as follows.
(3)
where υi follows a Normal distribution ( ), and pi follows a Beta distribution (Beta(a, a)). While υi is a component representing the unstructured heterogeneity to measure the variation in an individual area. The two mixing components are ui i = 1,2,..,m a spatial correlation and φi a component that models discrete jumps. Special cases of this formulation arise depending on the value of pi (Lawson & Clark 2002; Lawson et al. 2000), when pi = 1 we obtain the BYM model (2), and pi = 0 for every i gives a pure jump model arises. Most researchers noticed that the maps produced by the mixture model were very clear and visually closer, compare with maps which were produced by the SMRs and maps produced by the BYM model (Lawson & Clark 2002; Lawson et al. 2003). Therefore, Lawson and Clark (2002) suggested that there is a possibility of using non-smooth models in the map. The output of the analysis includes the posterior expected relative risks for all regions and for all time periods, based on BYM model and Mixture model.
APPLICATION TO LUNG CANCER DATA IN LIBYA
In this section, the results of the applications of relative risk estimation methods corresponding to the classical model based on the standardized morbidity ratio, BYM and Mixture model using observed lung cancer data of Libya are displayed and compared to graphs and maps.
THE DATA SET
In this research, all observed cancer incidence and population data in Libya were provided by AOI, Sabratha for the years 2006 to 2011 (Abusaa 2007; Information and Documentation Center 2011). This data set gives the number of incidences per year in the 22 local authority districts in Libya. These districts include Alnikat, Zawia, Aljafara, Tripoli, Almergaib, Mustrata, Sirt, Benghazi, Almarg, Aljabal Alakhader, Darna, Albatnan, Nalut, Aljabal Algarbi, Wadi Shatee, Aljufra, Ejdabiya, Ghat, Wadi Alhiya, Sabha, Morzuk and Alkufra (Figure 2).
THE RESULTS
The outcomes of the total number of 517 cases of lung cancer by years and districts are displayed in Table 1 and Figure 3, respectively. Table 1 presents the incidence of lung cancer cases in Libya during 6 years from 2006 to 2011. There were minor fluctuations of lung cancer cases between 2009 and 2010, during which period the worst

220
outbreak occurred in 2009 with 104 cases, followed by 2007 with 100 cases. The number of cases decreased in 2011 to 51 cases. It can be seen from the bar graph in Figure 3 that the capital of city, Tripoli, which is located in the northwest of Libya, recorded the highest number of cases in 145, followed by the district of Zawia which recorded the second highest number of lung cancer with 136 cases. The other two districts that recorded the highest number of cases where the district of Alnikat with 40 cases, and the northeast district of Aljabal Algarbi with 38 cases. The total numbers of cases reported in other districts are in the range between 0 and 33 cases.
The outcomes of relative risk estimation based on the SMR method, BYM model and Mixture model for all 22 districts of Libya are displayed in Figures 4 and 5, respectively. It can be seen from both graphs that most districts have the relative risk below one for all years. This means that the observed number of lung cancer cases is smaller than the expected number of cancer cases in those districts by using four models. From Figure 4, among those districts there are ten districts have the relative risk less than one for all four models, which most of them are located in the eastern part of the country. These are Almergaib, Benghazi, Almarg, Aljabal Alakhader, Darna,
TABLE 1. Total number of lung cancer cases in Libya from 2006 to 2011
Year 2006 2007 2008 2009 2010 2011No. of cases 78 100 88 104 96 51
FIGURE 2. 22 authority districts in Libya (Source: Alhdiri et al. 2016)
FIGURE 3. Total number of lung cancer cases for each district in Libya from 2006 to 2011
Tota
l Cas
es

221
Albatnan, Wadi Shatee, Aljufra, Ejdabiyaand Alkufra. While seven districts have a relative risk greater than one, which means that the observed number of cases is larger than the expected number of cases, they are Alnikat,
Zawia, Tripoli, Sirt, Aljabal Algarbi, Wadi Alhiya and Sabha. However, the five districts have less than one for SMR method and BYM model, which have greater than one by using Mixture model. Similar to Figure 4, it can
FIGURE 4. Time series plots of the estimated relative risk based on the SMR method, BYM model and mixture model for each district in Libya from 2006 to 2011
FIGURE 5. SMR method, BYM model and Mixture model for each district in Libya from 2006 to 2011

222
be seen clearly from Figure 5 that the district of Zawia has the highest relative risk of contracting lung cancer by using all models considered. This indicates that susceptible people within these districts are more likely to catch lung cancer compared with people in the overall population. The highest risks in cancer incidence in these districts probably are related to the tendency of oil installations in this particular area such as Mellitah Oil and Gas B.v, the Azawia Oil Refining Company and Bouri Oil Field, as well as the electrical power stations (Alsaker 2013). Estimation based on the selected models also shown that susceptible people within the district of Albatnan have the lowest relative risk of about 0.00, 0.09 and 0.17, respectively. Table 2 shows numeric values for the relative risk based on the classical method and two models, which are SMR, BYM model and Mixture model specifically for six years from 2006 to 2011. This table for lung cancer shows several differences in terms of high and low cancer occurrence areas for the districts in Libya by using five different methods. It can be seen that when using the SMR model, the estimated relative risk becomes exactly zero when there are no observed lung cancer cases in certain district, such as in the both districts of Albatnan and Alkufra have a relative risk equal to zero because there is no report of lung cancer cases during 2006 to 2011. This is the disadvantage of the SMR approach, which has been discussed earlier in the previous section. Conversely, the relative risk estimation based on two other models (BYM model and Mixture model) can overcome the problem of SMR when there are no observed lung cases in certain regions. However, none of the other three models suffers from this problem. The most significant difference is in the district of Zawia, where susceptible people in this district have the highest risk for all models. The corresponding values of relative risk are approximately 5.16, 5.09 and 11.37, respectively. While susceptible people within a district located in the Eastern part of the country have the lowest risk of all models, when compared to the people in the overall population. This district with the lowest risk was in Albatnan. The corresponding values of relative risk are approximately 0.00, 0.09 and 0.17, respectively.
In this study, DIC is used as the goodness of fit measure for the models used. This GOF is used because it can be evaluated easily in the WinBUGS software that we used and Lawson (2013, 2006) showed some disadvantages of the other measures such as AIC and BIC when is involving a model with several random effects. The DIC was proposed by Spiegelhalter et al. (2002) and according to Lawson et al. (2003) and Spiegelhalter et al. (2002), the model with the smallest DIC is the best model for data. Table 2 shows the DIC values for the models for all districts in Libya with lung cancer during the six years 2006 to 2011. From the DIC in Table 3, it can be seen that there are differences in the terms of the DIC value between different types of cancer disease. The Mixture model shows a better model for lung cancer because it gives the smallest DIC, compared to the BYM model. This gives a conclusion that the Mixture model is the best model to be used in the analysis specifically for estimation of relative risk for lung cancer data. This conclusion gives some insight into the possible advantages of collecting other cancer data in the future and which model is the best to use to give better relative risk estimation results.
MAPS OF THE SMR, BYM AND MIXTURE MODELS FOR LUNG CANCER IN LIBYA
In this section, disease maps are used as a means of graphical statistical results for the relative risk estimation based on SMR method, BYM model and Mixture model, the comparison between them by using the DIC method for the number of lung cancer cases reported for each district in Libya. For the purpose of interpretation of this application, thematic maps with multiple colours are used in this analysis in order to display and differentiate between the high-risk and low-risk area. In disease mapping, there is no definitive way to choosing the interval levels of risk, so each district is assigned one of five different levels of relative risk which are very low (the lighter regions), low, medium, high and very high risks (the darker regions), with respective intervals of [0,10), [10, 20), [20, 30), [30,40) and [40, ∞), respectively, for summary map, and [0.0,0.5),
TABLE 2. Relative risk based on the SMR model and posterior expected relative risks based on the BYM model and Mixture model for lung cancer
Model ModelDistrictAlnikatZawia
AljafaraTripoli
AlmergaibMusrata
SirtBenghaziAlmarg
Aljabal AlakhaderDarna
SMR1.535.160.831.510.430.531.150.240.060.050.13
BYM1.495.090.831.510.430.531.110.250.130.110.18
Mixture3.3311.371.813.340.961.172.450.540.260.230.39
DistrictAlbatnan
NalutAljabal Algarbi
Wadi ShateeAljufra
EjdabiyaGhat
Wadi AlhiyaSabha
MorzukAlkufra
SMR0.000.911.350.140.320.230.721.161.640.710.00
BYM0.0920.861.330.240.380.270.681.071.560.670.17
Mixture0.171.882.940.530.840.591.482.393.471.480.33
223
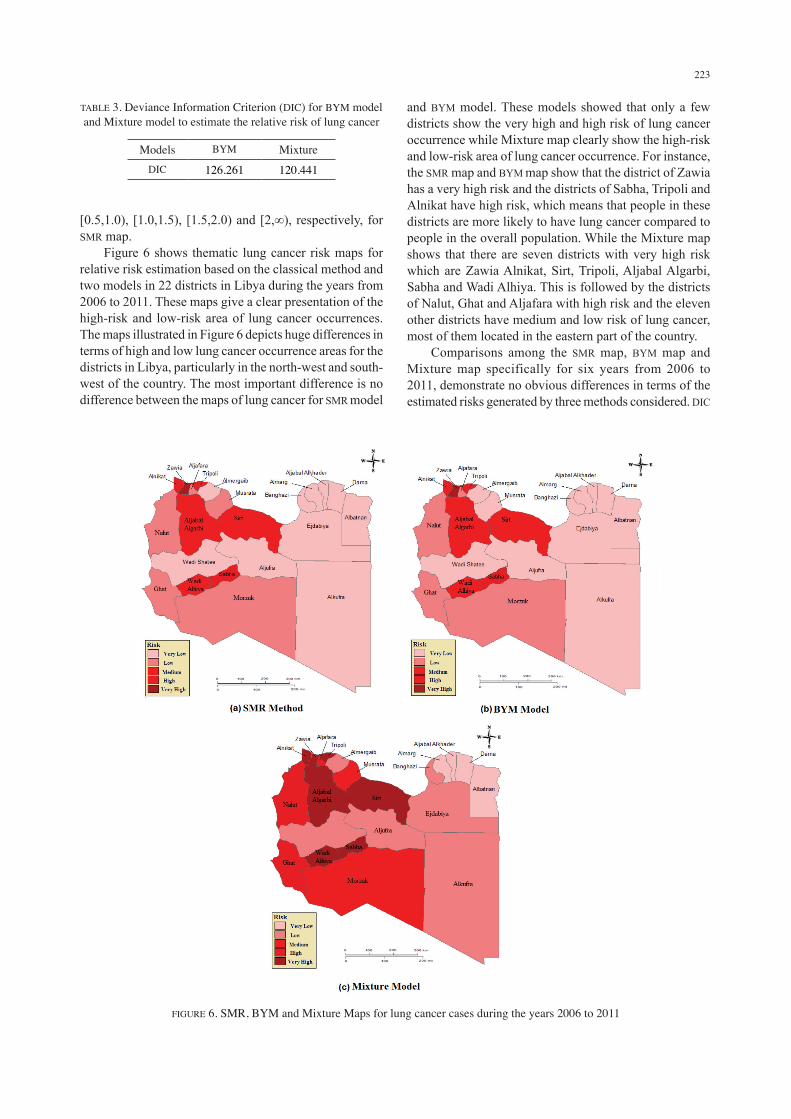
[0.5,1.0), [1.0,1.5), [1.5,2.0) and [2,∞), respectively, for SMR map. Figure 6 shows thematic lung cancer risk maps for relative risk estimation based on the classical method and two models in 22 districts in Libya during the years from 2006 to 2011. These maps give a clear presentation of the high-risk and low-risk area of lung cancer occurrences. The maps illustrated in Figure 6 depicts huge differences in terms of high and low lung cancer occurrence areas for the districts in Libya, particularly in the north-west and south-west of the country. The most important difference is no difference between the maps of lung cancer for SMR model
and BYM model. These models showed that only a few districts show the very high and high risk of lung cancer occurrence while Mixture map clearly show the high-risk and low-risk area of lung cancer occurrence. For instance, the SMR map and BYM map show that the district of Zawia has a very high risk and the districts of Sabha, Tripoli and Alnikat have high risk, which means that people in these districts are more likely to have lung cancer compared to people in the overall population. While the Mixture map shows that there are seven districts with very high risk which are Zawia Alnikat, Sirt, Tripoli, Aljabal Algarbi, Sabha and Wadi Alhiya. This is followed by the districts of Nalut, Ghat and Aljafara with high risk and the eleven other districts have medium and low risk of lung cancer, most of them located in the eastern part of the country. Comparisons among the SMR map, BYM map and Mixture map specifically for six years from 2006 to 2011, demonstrate no obvious differences in terms of the estimated risks generated by three methods considered. DIC
TABLE 3. Deviance Information Criterion (DIC) for BYM model and Mixture model to estimate the relative risk of lung cancer
Models BYM MixtureDIC 126.261 120.441
FIGURE 6. SMR, BYM and Mixture Maps for lung cancer cases during the years 2006 to 2011

224
shows that Mixture model is the best model to estimate the relative risk of lung cancer, compare to other models. These maps are primarily intended to be a good presentation tool for identifying districts with very high and high risk so that further attention could be given to these districts, in the future.
CONCLUSION
This study interested to identify the high-risk and low-risk area of lung cancer occurrences in Libya by displaying the risks using four models. The results of the analysis show that the use of Mixture model in estimating the relative risk in maps provides better high-low risk appearances in maps compared to SMR method, BYM model and Mixture model. These findings suggest that Mixture model can be used as a basic procedure for estimating relative risk instead of using the number of lung cancer cases alone. This study methodology will be helpful in the analysis of geographical disparities in cancer morbidity and incidence that has been revealed in cancer registry data. These maps should be regarded as tools for forming hypotheses leading to the next step of study, for example, attempting to start with investigating and developing further analysis to improve upon current models in order to inform and direct government strategy for monitoring and controlling lung cancer disease.
ACKNOWLEDGEMENTS
The authors would like to thank the staff members of the African Oncology Institute (AOI) Sabratha at the Libyan Cancer Centre and the staff in the Universiti Pendidikan Sultan Idris, Malaysia, for their continued support for completion of this study.
REFERENCES
Abusaa, A. 2007. Second Annual Report Hospital-Based Cancer Registry Introduction and Outline. African Oncology Institute (AOI), Sabratha, African Oncology Institute (AOI). pp. 1-60.
Akhtar Shad, M.A., Abu Bakr, S.A., Dawi, & Huq, I.U. 1993. Cancer in Libya - A retrospective study (1981-1985). African Journal of Medicine and Medical Sciences 22(1): 17-24.
Alhdiri, M.A., Samat, N.A. & Zulkifley, M. 2016. Mapping Libya’s prostate cancer based on the SMR method: A geographical analysis. Geografia Malaysian Journal of Society and Space 12(9): 118-125.
Alsaker, M.H. 2013. Natural human factors plays in the incidence of malignant tumors in the north - west of Libya. PhD Thesis, Department of Geography, University of Tripoli (Unpublished).
Bell, B.S., Hoskins, R.E., Pickle, L.W. & Wartenberg, D. 2006. Current practices in spatial analysis of cancer data: Mapping health statistics to inform policymakers and the public. International Journal of Health Geographics 5(1): 49.
Besag, J., York, J. & Mollie, A. 1991. Bayesian image restoration with two applications in spatial statistics. Annals of the Institute of Statistical Mathematics 43: 1-59.
Bodalal, Z., Raouf, A. & Riyad, B. 2014. Cancers in Eastern Libya: First results from Benghazi Medical Center. World Journal of Gastroenterology 20(20): 6293-6301.
Clayton, D.G. & Kaldor, J. 1987. Empirical Bayes estimates of age-standardised relative risks for use in disease mapping. Biometrics 43: 671-691.
Ermiah, E., Fathi, A., Abdelbaset, B., Entesar, L., Seppo, P. & Yrjö, C. 2012. Diagnosis delay in Libyan female breast cancer. BMC Research Notes 5: 452.
Ferlay, J., Hai, R.S., Freddie, B., David, F., Colin, M. & Donald, M.P. 2010. Estimates of worldwide burden of cancer in 2008: GLOBOCAN 2008. International Journal of Cancer 127(12): 2893-2917.
Information and Documentation Center. 2011. Libyan National Statistics Figures: Annual Statistical Report (in Arabic). Ministry of Health, Tripoli. (in Arabic). pp. 1-113.
John, R. & Hana, R. 2010. The Global Economic Cost of Cancer. Atlanta: American Cancer Society and Livestrong. pp. 1-14.
Lawson, A.B. 2013. Bayesian Disease Mapping: Hierarchical Modeling in Spatial Epidemiology. 2nd ed. Boca Raton: Chapman and Hall/CRC.
Lawson, A.B. 2006. Statistical Methods in Spatial Epidemiology. England: Wiley.
Lawson, A.B. & Clark, A. 2002. Spatial mixture relative risk models applied to disease mapping. Statistics in Medicine 21: 359-370.
Lawson, A.B., Browne, A.B. & Vidal Rodeiro, C.L. 2003. Disease mapping with Win BUGS and MLwiN. England: John Wiley & Sons.
Lawson, A.B., Biggeri, A.B., Boehning, D., Lesare, E., Viel, J.F., Clark, A., Schlattmann, P. & Divino. 2000. Disease mapping models: An empirical evaluation. Statistics in Medicine 19: 2217-2241.
Meza, J.L. 2003. Empirical Bayes estimation smoothing of relative risks in disease mapping. Journal of Statistical Planning and Inference 112(1-2): 43-62.
Salim, E.I., Abdul Rahman, J. & Malcolm, A.M. 2011. Lung cancer incidence in the Arab league countries: Risk factors and control. Asian Pacific Journal of Cancer Prevention 12(1): 17-34.
Samat, N.A. & Percy, D.F. 2008. Standardized mortality and morbidity ratios and their application to dengue disease mapping in Malaysia. Proceedings of the Salford Postgraduate Annual Research Conference. Manchester: Salford University. pp. 200-210.
Siegel, R., Elizabeth, W., Otis, B. & Ahmed, J. 2011. Cancer statistics 2011: The impact of eliminating socioeconomic and racial disparities on premature cancer deaths. CA Cancer J. Clin. 61: 212-236.
Spiegelhalter, D.J., Best, N.G., Carlin, B.P. & Av Der. 2002. Bayesian measures of model complexity and fit (with discussion). Journal of the Royal Statistical Society: Series B 64: 583-640.
Washington, D.C. 2007. Food, Nutrition, Physical Activity, and the Prevention of Cancer: A Global Perspective/World Cancer Research Fund. American Institute for Cancer Research. American Institute for Cancer Research.
Maryam Ahmed Alramah*, Nor Azah Samat & Zulkifley MohamedDepartment of StatisticsFaculty of Science

225
University of TripoliAlfernag TripoliLibya
Department of MathematicsFaculty of Science and MathematicsUniversity Pendidikan Sultan Idris35900 Tanjong Malim, PerakMalaysia
*Corresponding author; email: [email protected]
Received: 17 December 2016Accepted: 7 February 2018