MANAGING THE RISK OF TRANSFORMER BUSHING FAILURE · Project Assessment Conclusions Report. MANAGING...
32
MANAGING THE RISK OF TRANSFORMER BUSHING FAILURE Project Assessment Conclusions Report 11 December 2018
Transcript of MANAGING THE RISK OF TRANSFORMER BUSHING FAILURE · Project Assessment Conclusions Report. MANAGING...
MANAGING THE RISK OF TRANSFORMER BUSHING FAILURE Project Assessment Conclusions Report 11 December 2018

Managing the Risk of Transformer Bushing Failure Project Assessment Conclusions Report
2
Copyright and Disclaimer
Copyright in this material is owned by or licensed to ElectraNet. Permission to publish, modify, commercialise or alter this material must be sought directly from ElectraNet.
Reasonable endeavours have been used to ensure that the information contained in this report is accurate at the time of writing. However, ElectraNet gives no warranty and accepts no liability for any loss or damage incurred in reliance on this information.

Managing the Risk of Transformer Bushing Failure Project Assessment Conclusions Report
3
Executive Summary
This report is the final stage of an investigation of the most economic option to replace transformer bushings at ten substations across South Australia
This Project Assessment Conclusions Report (PACR) is the final consultation report for a Regulatory Investment Test (RIT-T)1 investigating options to manage the risk of transformer bushing failure in ElectraNet’s network.
Specifically, there is a need to replace 101 transformer bushings fitted on 18 power transformers across ElectraNet’s transmission network based on their condition. The bushings were installed in the 1960s and 1970s and are now reaching, or past, the end of their technical lives.
The identified transformer bushings are located at the following ten substations:
• Metropolitan substations – Para, Cherry Gardens and LeFevre; and
• Rural substations – Robertstown, Snuggery, Yadnarie, Murray Bridge/ Hahndorf PS1, Murray Bridge/ Hahndorf PS3, Berri and North West Bend.
We assess the condition and required timing of replacement of transformer bushings as part of our ongoing asset management processes. If the identified bushings are not replaced, there is an increased likelihood that a number of these assets will fail within the next 10 years. For example, on 3 August 2018, one of the transformer bushings identified as requiring replacement as part of this assessment suffered an explosive failure.
The potential consequences of transformer bushing failure include oil-fuelled fire with consequential damage to the transformer and other equipment, as well as safety risk to network personnel and the wider community. In a severe scenario, the failed bushing can result in significant unserved energy for electricity customers because of the transformer itself completely failing.
An initial report was released in August 2018 and received no submissions
A Project Specification Consultation Report (PSCR) for this RIT-T published on 22 August 2018 outlined that there is only one feasible option to be considered, which is to replace the end-of-life transformer bushings on a like-for-like basis. This is because bushings play a very specific role in enabling transformers to operate and, without them, transformers, and hence substations, cannot fulfil their role of transforming electrical voltages to higher or lower levels for efficient electrical power transportation to downstream transmission and distribution end-use customers.
The PSCR assessed different timings of this replacement option and concluded that replacing the identified bushings as soon as practicable is the preferred option because of the avoided risk costs of transformer bushing failure and avoided associated corrective maintenance.
The PSCR also outlined why there is not expected to be a feasible role for network support solutions in addressing the identified need because of the specific role that the identified bushings play in the transmission of electricity and their relatively low replacement cost.
1 The Regulatory Investment Test for Transmission (RIT-T) is the economic cost benefit test that is overseen by the
Australian Energy Regulator (AER) and applies to all major network investments in the National Electricity Market.

Managing the Risk of Transformer Bushing Failure Project Assessment Conclusions Report
4
No submissions were received on the PSCR.
This report maintains the initial conclusion that replacing the identified bushings in the next three years is the preferred option
The preferred option continues to be replacing the identified transformer bushings in the next three years; i.e. as opposed to deferring this expenditure any further. This replacement work is estimated to have a total capital cost of $6.86 million ($2017-18).
We have undertaken a thorough sensitivity testing exercise to investigate the robustness of the RIT-T assessment to underlying assumptions about each of the key variables. For all sensitivity tests undertaken, the preferred option remains replacing the identified bushings in the next three years.
Next steps
ElectraNet intends to commence work on replacing the identified bushings in January 2019.
There are 101 transformer bushings, on 18 power transformers across South Australia that require replacing. We are planning to have all bushings replaced by 2021-22.
Further details in relation to this project can be obtained from:
Rainer Korte Group Executive Asset Management ElectraNet

Managing the Risk of Transformer Bushing Failure Project Assessment Conclusions Report
5
Contents
EXECUTIVE SUMMARY .............................................................................................................. 3
1. INTRODUCTION ............................................................................................................... 8 1.1 WHY WE CONSIDER THIS RIT-T IS NECESSARY ........................................................................... 8 1.2 NEXT STEPS ............................................................................................................................. 8
2. THE IDENTIFIED NEED FOR THIS RIT-T IS TO ENSURE RELIABLE AND SAFE SUPPLY OF ELECTRICITY TO SOUTH AUSTRALIA ..................................................... 9 2.1 BACKGROUND TO THE IDENTIFIED NEED ..................................................................................... 9 2.2 DESCRIPTION OF THE IDENTIFIED NEED FOR THIS RIT-T ............................................................ 13
3. POTENTIAL CREDIBLE OPTIONS TO ADDRESS THE IDENTIFIED NEED ................. 14 3.1 OPTION 1 – REPLACE TRANSFORMER BUSHINGS BY 2021-22 ................................................... 14 3.2 OPTION 2 – DEFER REPLACEMENT OF THE IDENTIFIED BUSHINGS BY FIVE YEARS ........................ 15 3.3 OPTIONS CONSIDERED BUT NOT PROGRESSED ......................................................................... 15
4. ASSESSMENT OF THE CREDIBLE OPTIONS .............................................................. 16 4.1 DESCRIPTION OF THE THREE REASONABLE SCENARIOS ............................................................. 16 4.2 GROSS BENEFITS FOR EACH CREDIBLE OPTION ......................................................................... 17 4.3 ESTIMATED COSTS FOR EACH CREDIBLE OPTION ....................................................................... 18 4.4 NET PRESENT VALUE ASSESSMENT OUTCOMES ........................................................................ 18 4.5 SENSITIVITY TESTING .............................................................................................................. 18
5. FINAL CONCLUSION ON THE PREFERRED OPTION ................................................. 20
APPENDIX A COMPLIANCE CHECKLIST ................................................................................ 22
APPENDIX B DEFINITIONS ...................................................................................................... 23
APPENDIX C PROCESS FOR IMPLEMENTING THE RIT-T ..................................................... 24
APPENDIX D ASSUMPTIONS UNDERPINNING THE IDENTIFIED NEED ............................... 25 D1 THE PROBABILITY OF TRANSFORMER BUSHINGS FAILING ........................................................... 25 D2 THE ADVERSE EFFECTS RESULTING FROM ANY BUSHINGS FAILURE ............................................ 25 D3 THE LIKELIHOOD AND COST OF NEGATIVE CONSEQUENCES OF BUSHING FAILURE ........................ 26 D4 CORRECTIVE AND ROUTINE MAINTENANCE ASSUMPTIONS ......................................................... 27
APPENDIX E MATERIALITY OF MARKET BENEFITS FOR THIS RIT-T ASSESSMENT ........ 28 E1 AVOIDED INVOLUNTARY LOAD SHEDDING IS THE ONLY RELEVANT MARKET BENEFIT ..................... 28 E2 MARKET BENEFITS RELATING TO THE WHOLESALE MARKET ARE NOT MATERIAL .......................... 28

Managing the Risk of Transformer Bushing Failure Project Assessment Conclusions Report
6
E3 OTHER CLASSES OF MARKET BENEFITS ARE NOT EXPECTED TO BE MATERIAL ............................. 29
APPENDIX F DESCRIPTION OF THE MODELLING METHODOLOGIES APPLIED ................ 30 F1 OVERVIEW OF THE RISK COST MODELLING FRAMEWORK ............................................................ 30 F2 THE DISCOUNT RATE AND ASSESSMENT PERIOD ....................................................................... 30
Figures
Figure 1 – Bushings on Para #2 transformer ................................................................................. 9
Figure 2 – Location of the transformer bushings that require replacing ........................................10
Figure 3 – Snuggery substation transformer number 3 after explosive bushing failure .................12
Figure 4 – Breakdown of present value gross economic benefits of Option 1 and Option 2 .........17
Figure 5 – Sensitivity testing of the two credible options ..............................................................19
Figure 6 The RIT-T assessment and consultation process ...........................................................24
TABLES
Table 1 - Number of affected transformers at each substation .....................................................11
Table 2 - Summary of the key assumptions for each scenario .....................................................16
Table 3 Estimated gross market benefit for each option, PV $m ..................................................17
Table 4 - Estimated cost for each option, PV $m .........................................................................18
Table 5 - Estimated net market benefit for each option, PV $m ....................................................18
Table 6 - Reasons why non-wholesale market benefit categories are considered immaterial ......29

Managing the Risk of Transformer Bushing Failure Project Assessment Conclusions Report
7
Glossary of Terms
Term Description
AEMO Australian Energy Market Operator AER Australian Energy Regulator CoC Cost of Consequence ETC Electricity Transmission Code
LoC Likelihood of Consequence NPV Net Present Value
NEM National Electricity Market NER, Rules National Electricity Rules
PACR Project Assessment Conclusions Report PADR Project Assessment Draft Report PoF Probability of Failure PSCR Project Specification Consultation Report RET Renewable Energy Target RIT-T Regulatory Investment Test for Transmission
TNSP Transmission Network Service Provider USE Unserved Energy
VCR Value of Customer Reliability

Managing the Risk of Transformer Bushing Failure Project Assessment Conclusions Report
8
1. Introduction
This Project Assessment Conclusions Report (PACR) represents the final step in the application of the RIT-T to address the risk of transformer bushing failure on the South Australian transmission network.
A Project Specification Consultation Report (PSCR) was released in August 2018 that described the identified need we are seeking to address, set out the technical characteristics that a network support option would be required to deliver to assist and outlined the credible options we consider address the identified need. The PSCR also set-out an economic assessment of the options, along with a draft conclusion on the preferred option, as well as how ElectraNet was intending to apply the NER exemption from preparing a Project Assessment Draft Report (PADR) for this RIT-T.2
No submissions were received on the PSCR.
1.1 Why we consider this RIT-T is necessary
Changes to the National Electricity Rules (NER) in July 2017 extended the application of the RIT-T to replacement capital expenditure commencing from 18 September 2017.3 Accordingly, we have initiated this RIT-T to consult on proposed expenditure related to replacing transformer bushings, as none of the exemptions listed in NER clause 5.16.3(a) apply.
The credible options discussed in this RIT-T have not been foreshadowed in AEMO’s National Transmission Network Development Plan (NTNDP) or Integrated System Plan as they do not play a part in the main transmission flow paths between the NEM regions.
1.2 Next steps
ElectraNet intends to commence work on replacing the identified bushings in January 2019.
There are 101 transformer bushings, on 18 power transformers that require replacing. It is estimated that the construction time for each transformer is around 8 weeks, i.e. around 2.5 to 3 years in total. We are planning to have all bushings replaced by 2021-22.
Further details in relation to this project can be obtained from:
Rainer Korte Group Executive Asset Management ElectraNet [email protected]
2 In accordance with NER clause 5.16.4(z1). 3 The application of the RIT-T to replacement expenditure (‘repex’) commenced on 18 September 2017, however, all
repex projects that were ‘committed’ by 30 January 2018 are exempt. While the planning process for replacing the identified bushings was well-advanced by 30 January 2018, the project was not yet ‘committed’. Accordingly, we initiated this RIT-T to consult on its proposed expenditure related to replacing these bushings.
Managing the Risk of Transformer Bushing Failure Project Assessment Conclusions Report
9
2. The identified need for this RIT-T is to ensure reliable and safe supply of electricity to South Australia
This section outlines the ‘identified need’ for this RIT-T. It first provides some background on the identified bushings and their role in the wider transmission of electricity in South Australia. Appendix D provides additional detail on the assumptions underpinning the identified need.
2.1 Background to the identified need
Bushings are insulated devices that allow an electrical conductor to pass safely through a grounded conducting barrier such as the case of a transformer or circuit breaker. Bushings have traditionally been made from porcelain, although other materials are now used such as polymers, which have a lower risk of exploding (and lower consequential damage if they do explode).
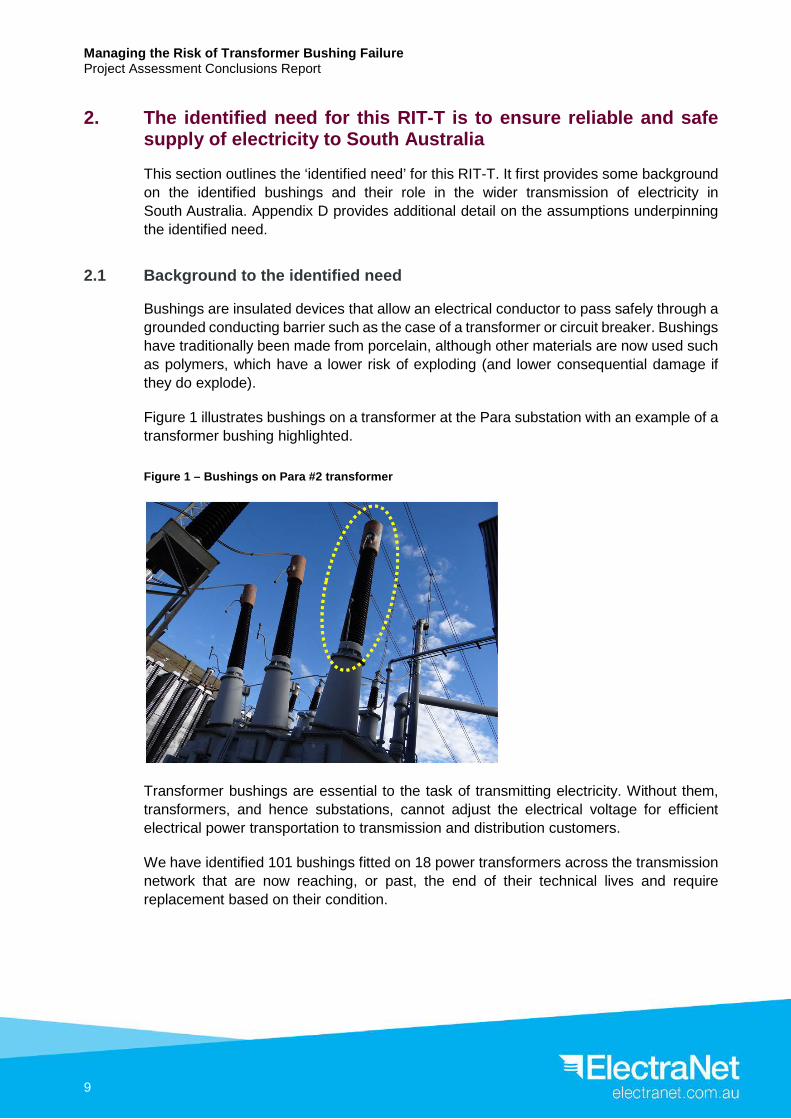
Figure 1 illustrates bushings on a transformer at the Para substation with an example of a transformer bushing highlighted.
Figure 1 – Bushings on Para #2 transformer
Transformer bushings are essential to the task of transmitting electricity. Without them, transformers, and hence substations, cannot adjust the electrical voltage for efficient electrical power transportation to transmission and distribution customers.
We have identified 101 bushings fitted on 18 power transformers across the transmission network that are now reaching, or past, the end of their technical lives and require replacement based on their condition.
Managing the Risk of Transformer Bushing Failure Project Assessment Conclusions Report
10
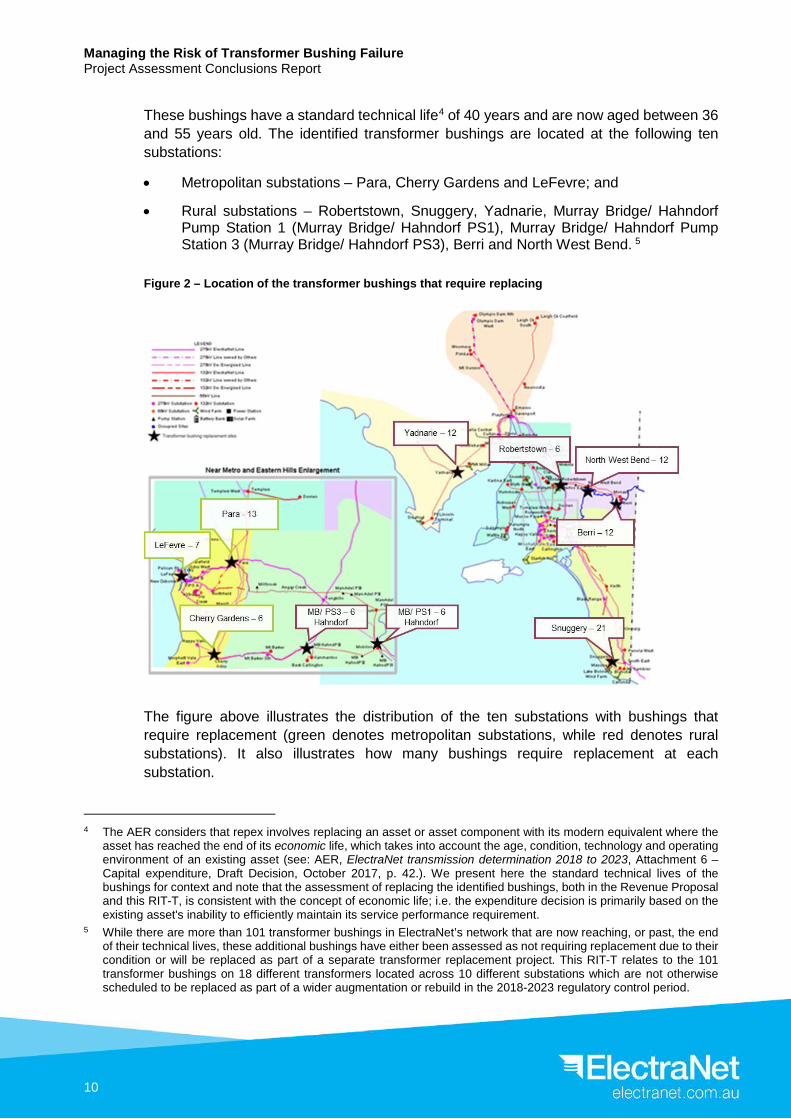
These bushings have a standard technical life4 of 40 years and are now aged between 36 and 55 years old. The identified transformer bushings are located at the following ten substations:
• Metropolitan substations – Para, Cherry Gardens and LeFevre; and
• Rural substations – Robertstown, Snuggery, Yadnarie, Murray Bridge/ Hahndorf Pump Station 1 (Murray Bridge/ Hahndorf PS1), Murray Bridge/ Hahndorf Pump Station 3 (Murray Bridge/ Hahndorf PS3), Berri and North West Bend. 5
Figure 2 – Location of the transformer bushings that require replacing
The figure above illustrates the distribution of the ten substations with bushings that require replacement (green denotes metropolitan substations, while red denotes rural substations). It also illustrates how many bushings require replacement at each substation.
4 The AER considers that repex involves replacing an asset or asset component with its modern equivalent where the
asset has reached the end of its economic life, which takes into account the age, condition, technology and operating environment of an existing asset (see: AER, ElectraNet transmission determination 2018 to 2023, Attachment 6 – Capital expenditure, Draft Decision, October 2017, p. 42.). We present here the standard technical lives of the bushings for context and note that the assessment of replacing the identified bushings, both in the Revenue Proposal and this RIT-T, is consistent with the concept of economic life; i.e. the expenditure decision is primarily based on the existing asset's inability to efficiently maintain its service performance requirement.
5 While there are more than 101 transformer bushings in ElectraNet’s network that are now reaching, or past, the end of their technical lives, these additional bushings have either been assessed as not requiring replacement due to their condition or will be replaced as part of a separate transformer replacement project. This RIT-T relates to the 101 transformer bushings on 18 different transformers located across 10 different substations which are not otherwise scheduled to be replaced as part of a wider augmentation or rebuild in the 2018-2023 regulatory control period.

Managing the Risk of Transformer Bushing Failure Project Assessment Conclusions Report
11
All substations serve a range of electricity customers via SA Power Networks’ distribution network, except for the ‘Murray Bridge/ Hahndorf PS1’ and ‘Murray Bridge/ Hahndorf PS3’ substations, which solely serve SA Water pump stations (i.e. a direct connect customer).
In addition, the transformers at Cherry Gardens and Robertstown with bushings that require replacing are ‘tie transformers’; i.e. they act to facilitate the transfer of electrical power between two different transmission-level voltages and do not step-down to the distribution network.
In total, we have identified 26 transformer bushings fitted on 4 power transformers in metropolitan areas and 75 transformer bushings fitted on 14 power transformers in rural areas for replacement.
The identified bushings cover at a minimum of one transformer at each substation and, in many cases, all transformers at the substation. The table below summarises the distribution of the identified bushings across the transformers at each substation.
Table 1 - Number of affected transformers at each substation
Substation Transformers Number of identified bushings Para TF1 – 120 MVA 6 Bushings
TF2 – 120 MVA 7 Bushings Cherry Gardens TF1 – 160 MVA 6 Bushings Robertstown TF1 – 160 MVA 6 Bushings LeFevre TF5 – 180 MVA 7 Bushings Snuggery * TF1 – 25 MVA 7 Bushings
TF2 – 25 MVA 7 Bushings TF3 – 25 MVA 7 Bushings
Yadnarie TF1 – 20 MVA 6 Bushings TF2 – 20 MVA 6 Bushings
MB/Hahndorf PS1 TF1 – 16.5 MVA 3 Bushings TF2 – 16.5 MVA 3 Bushings
MB/Hahndorf PS3 TF1 – 16.5 MVA 3 Bushings TF2 – 16.5 MVA 3 Bushings
Berri TF1 – 65 MVA 6 Bushings TF2 – 65 MVA 6 Bushings
North West Bend TF1 – 20 MVA 6 Bushings TF2 – 20 MVA 6 Bushings
* Snuggery has 3x25 MVA transformers serving industrial load and 1x25 MVA transformer serving rural load. The transformers selected for bushing replacement serve the industrial loads.
If the identified bushings remain in service, it is likely that a number of these assets will fail during the next 10 years, which may result in unplanned outages on parts of the network.

Managing the Risk of Transformer Bushing Failure Project Assessment Conclusions Report
12
If a transformer bushing fails, the affected transformer can experience an oil-fuelled fire, which causes consequential damage to the transformer and other equipment, as well as safety risk to network personnel and the wider community, and, in a severe scenario, unserved energy for electricity customers because of the transformer itself completely failing.
For example, on 3 August 2018, one of the 132 kV transformer bushings on transformer number 3 at the Snuggery substation suffered an explosive failure. That bushing was one of those identified as requiring replacement as part of this assessment.
The explosive bushing failure at Snuggery substation occurred in the evening while no personnel were on site. On this occasion, the explosive failure did not result in significant collateral damage to the transformer. There were no injuries to personnel and there was no loss of load as a result of the explosive failure of the bushing. Minor collateral damage occurred to the adjacent surge arrestor and transformer bushing.
The figure below illustrates the appearance of transformer number 3 at the Snuggery substation after the explosive failure of one of its 132 kV bushings. The location of the failed bushing on the transformer showing the outer porcelain housing missing is highlighted in Figure 3 below. An intact bushing can be seen to the left-hand side of the failed item.
Figure 3 – Snuggery substation transformer number 3 after explosive bushing failure
Managing the Risk of Transformer Bushing Failure Project Assessment Conclusions Report
13
2.2 Description of the identified need for this RIT-T
The identified need for this project is to manage the risk of failure of individual transformer bushings that are reaching, or have passed, the end of their technical lives based on their condition.
We assess the condition of, and timing of ultimate replacement for, transformer bushings as part of our ongoing asset management processes. There is an increased likelihood that a number of these assets will fail within the next 10 years, resulting in the unplanned unavailability of parts of the network.
We have classified this RIT-T as a market benefits driven RIT-T because, while the aim is to maintain the quality, reliability and security of supply of prescribed transmission services, the economic assessment is not driven by the requirement to meet a mandated reliability standard.
Rather a full cost benefit assessment has been undertaken, comparing the risk cost reduction benefits of asset replacement options with the cost of those options.

Managing the Risk of Transformer Bushing Failure Project Assessment Conclusions Report
14
3. Potential credible options to address the identified need
The analysis has identified that there is only one technically feasible option, which is to replace the end-of-life transformer bushings on a like-for-like basis. This is because bushings play a very specific role in enabling transformers to operate and, without them, transformers, and hence substations, cannot fulfil their role of transforming the electrical voltage for efficient electrical power transportation to transmission and distribution connected electricity customers.
We have investigated two credible options with different timing for the proposed program:
• Option 1 – Replace transformer bushings between 2018-19 and 2021-22; and
• Option 2 – Defer replacement of the transformer bushings to 2023-24 to 2026-27.
Option 2 has a lower cost, in present value terms, than Option 1 but it comes with a higher expected risk associated with keeping the identified bushings in-service for an additional five years.
Both Option 1 and Option 2 are considered to be technically and economically feasible and able to be implemented in sufficient time to meet the identified need.6 In addition, all works under these options are assumed to be completed in accordance with the relevant standards, with bushings being replaced with minimal modification to fit to the power transformers.
The PSCR set out that we do not consider network support solutions can assist with meeting the identified need for this RIT-T, driven by the unique and specific role that the identified bushings play in the transmission of electricity, as well as their relatively low replacement cost (i.e. $68,000 each, or $6.86 million in total to replace all 101 identified bushings). Notwithstanding, the PSCR set out the required technical characteristics for a network support option for completeness, consistent with the requirements of the RIT-T.
We did not receive any submissions on the PSCR.
3.1 Option 1 – Replace transformer bushings by 2021-22
Option 1 involves replacing the identified bushings in the 2018-2023 regulatory control period and replacing the relevant bushings as fitted to each affected transformer across the 10 substation sites in-turn.
The existing bushings would be replaced with a newer technology, which uses polymer instead of porcelain. Polymer bushings have a lower risk of exploding when they fail than porcelain bushings and, if they do explode, the risk of consequential damage and injury is contained and far lower.
6 In accordance with the requirements of NER clause 5.15.2(a).
Managing the Risk of Transformer Bushing Failure Project Assessment Conclusions Report
15
The estimated capital cost of this option is approximately $6.86 million. Routine operating and maintenance costs for bushing tests are approximately $95,000/annum.
It is estimated that the construction time for each transformer is around 8 weeks; i.e. around 2.5 to 3 years in total. We estimate that all bushings could be replaced and commissioned by 2021-22 under this option.
3.2 Option 2 – Defer replacement of the identified bushings by five years
Option 2 is a deferred version of Option 1 and involves replacing the identified bushings in the 2023-2028 regulatory control period.
The scope, estimated cost and construction time remains the same as for Option 1. We estimate that all bushings could be replaced and commissioned by 2026-27 under this option.
3.3 Options considered but not progressed
We have also considered whether there are other credible options that would meet the identified need. However, the identified need to address end-of-life bushings on transformers does not lend itself to any solution other than to replace the bushings as the only technically and economically feasible option given the unique and specific function of these assets. Consequently, we have not identified other feasible options.
One conceivable option, for example, would be to replace the entire power transformer at each site, as opposed to just the bushings. However, the capital cost of this option is expected to be in the order of $27-63 million (i.e. $1.5-3.5 million per transformer), which is significantly more than the option outlined above and does not provide any additional market benefits. In addition, the condition of other transformer assets is such that they do not require replacing in coming years. Therefore, this is not considered to be an economically feasible option.
Managing the Risk of Transformer Bushing Failure Project Assessment Conclusions Report
16
4. Assessment of the credible options
This section outlines the assessment we have undertaken of the two credible network options. Each option is compared against a base case ‘do nothing’ option.
For clarity, this section re-presents the assessment in the PSCR. There were no material changes since the PSCR that would affect the finding that Option 1 is preferred.
4.1 Description of the three reasonable scenarios
The RIT-T analysis is required to incorporate a number of different reasonable scenarios, which are used to estimate expected net market benefits. The number and choice of reasonable scenarios must be appropriate to the credible options under consideration.
For a market benefits driven RIT-T such as this, the choice of reasonable scenarios must reflect any variables or parameters that are likely to affect the ranking of the credible options, or the sign of the net economic benefits of any of the credible options.7
We have developed three scenarios for this RIT-T assessment:
• a ‘central’ scenario reflecting our base set of key assumptions;
• a ‘low benefits’ scenario – reflecting a conservative set of assumptions, which represents a lower bound on reasonably expected potential market benefits that could be realised under each credible option; and
• a ‘high benefits’ scenario – reflecting an optimistic set of assumptions, which represents an upper bound on reasonably expected potential market benefits.
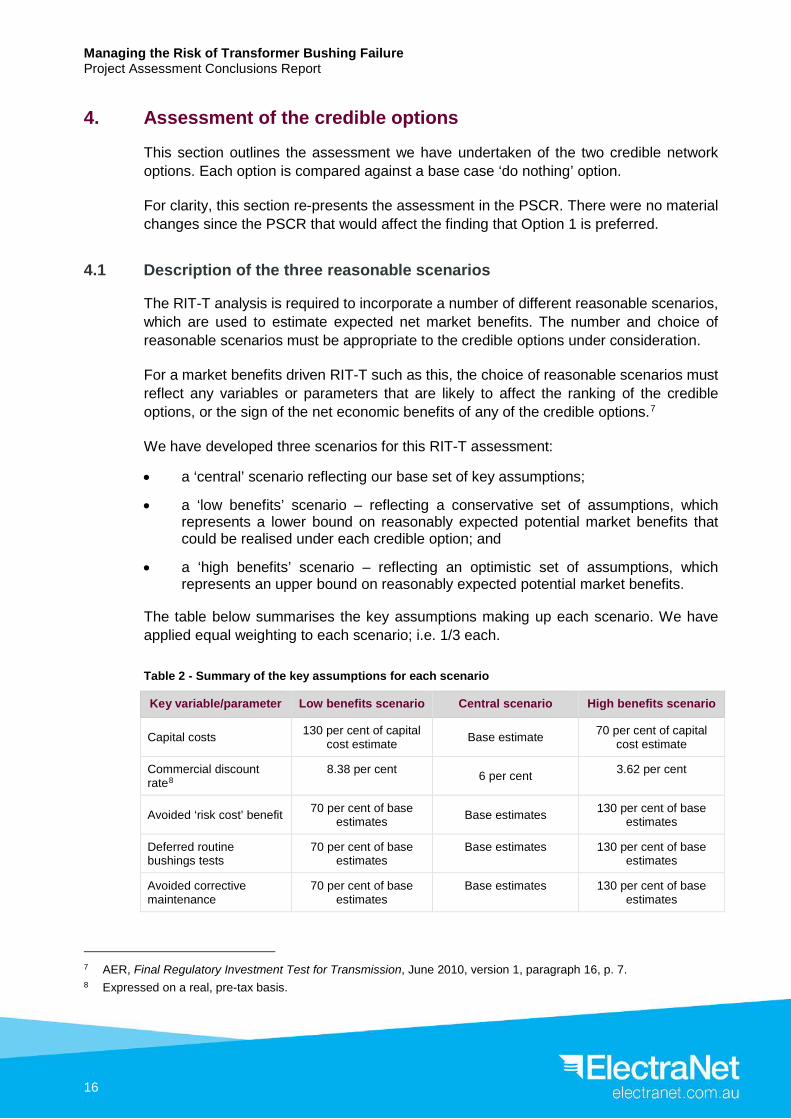
The table below summarises the key assumptions making up each scenario. We have applied equal weighting to each scenario; i.e. 1/3 each.
Table 2 - Summary of the key assumptions for each scenario
Key variable/parameter Low benefits scenario Central scenario High benefits scenario
Capital costs 130 per cent of capital cost estimate Base estimate 70 per cent of capital
cost estimate
Commercial discount rate8
8.38 per cent 6 per cent 3.62 per cent
Avoided ‘risk cost’ benefit 70 per cent of base estimates Base estimates 130 per cent of base
estimates
Deferred routine bushings tests
70 per cent of base estimates
Base estimates 130 per cent of base estimates
Avoided corrective maintenance
70 per cent of base estimates
Base estimates 130 per cent of base estimates
7 AER, Final Regulatory Investment Test for Transmission, June 2010, version 1, paragraph 16, p. 7. 8 Expressed on a real, pre-tax basis.

Managing the Risk of Transformer Bushing Failure Project Assessment Conclusions Report
17
4.2 Gross benefits for each credible option
The table below summarises the gross benefit estimated for each option relative to the ‘do nothing’ base case in present value terms. The gross market benefit for each option has been calculated for each of the scenarios outlined in the section above.
Table 3 Estimated gross market benefit for each option, PV $m
Option Low benefits scenario
Central scenario
High benefits scenario
Option 1 – Replace transformer bushings by 2021-22 7.1 12.5 20.6
Option 2 – Defer replacement of bushings by five years 4.3 8.2 14.4
The figure below provides a breakdown of benefits relating to each credible option.
Option 1 has greater estimated gross benefits than Option 2 because the identified bushings are replaced approximately five years earlier than under Option 2. Most of the benefits are attributable to avoiding the risk costs of transformer bushing failure and avoided corrective maintenance, while avoided routine maintenance costs (i.e. deferred bushing tests) contribute relatively small amounts to the estimated benefits.
Figure 4 – Breakdown of present value gross economic benefits of Option 1 and Option 2
0
5
10
15
20
25
Option 1 Option 2 Option 1 Option 2 Option 1 Option 2
Low benefit Central High benefit
Mill
ions
, 201
8/19
Avoided risk costs Avoided corrective Avoided routine

Managing the Risk of Transformer Bushing Failure Project Assessment Conclusions Report
18
4.3 Estimated costs for each credible option
The table below summarises the costs of each credible option, relative to the base case, in present value terms. The cost of each option has been calculated for each of the scenarios.
Table 4 - Estimated cost for each option, PV $m
Option Low benefits scenario
Central scenario
High benefits scenario
Option 1 – Replace transformer bushings by 2021-22 -7.0 -5.5 -3.9
Option 2 – Defer replacement of bushings by five years -4.1 -3.5 -2.6
While each option has the same cost in real terms in each scenario, Option 1 has a slightly higher cost in present value terms than Option 2 because of the identified bushings being replaced five years earlier than under Option 2.
4.4 Net present value assessment outcomes
The table below summaries the net market benefit in NPV terms for each credible option across the scenarios, as well as on a weighted basis. The net market benefit is the gross benefits (as set out in section 4.2 above) minus the cost of each option (as outlined in section 4.3 above), all expressed in present value terms.
The table shows that Option 1 provides the greatest net economic benefit of the two options on a scenario probability-weighted basis, and that Option 1 provides positive market benefits across all scenarios.
Table 5 - Estimated net market benefit for each option, PV $m
Option Low benefits scenario
Central scenario
High benefits scenario
Weighted
Option 1 – Replace transformer bushings by 2021-22 0.1 7.0 16.7 7.9
Option 2 – Defer replacement of bushings by five years 0.2 4.7 11.8 5.6
The two options are closely ranked in the ‘low benefits’ scenario and Option 1 is the preferred option in both the ‘central’ and ‘high benefits’ scenarios. Given there is no material evidence for assigning a higher probability for one scenario over another in this assessment, the scenarios are weighted equally.9
4.5 Sensitivity testing
We have undertaken a thorough sensitivity testing exercise to understand the robustness of the RIT-T assessment to underlying assumptions about key variables.
9 In accordance with paragraph 4(a) of the RIT-T.

Managing the Risk of Transformer Bushing Failure Project Assessment Conclusions Report
19
In particular, we have looked at the consequences for the credible options of ‘getting it wrong’ if the key underlying assumptions are not accurate.
For example, sensitivity tests have been run on low and high avoided ‘risk cost’ benefits to ensure the robustness of the assessment. These tests investigate avoided aggregate risk cost benefits that are assumed to be 30 per cent higher and 30 per cent lower than avoided risk cost benefits estimated using the risk cost evaluation tool.
The five figures below illustrate the estimated net market benefits for each option if the five separate key assumptions in the central scenario are varied individually.
Importantly, for all sensitivity tests shown below, the estimated net market benefit of Option 1 exceeds that for Option 2. Furthermore, the estimated net market benefits are found to be positive for both options over all sensitivities investigated.
Figure 5 – Sensitivity testing of the two credible options

Managing the Risk of Transformer Bushing Failure Project Assessment Conclusions Report
20
5. Final conclusion on the preferred option
The preferred option that has been identified in this assessment for addressing the identified need is Option 1, i.e. replacing transformer bushings by 2021-22 based on condition. This option is described in section 3 and is estimated to have a capital cost of $6.86 million.
Option 1 is the preferred option in accordance with NER clause 5.16.1(b) because it is the credible option that maximises the net present value of the net economic benefit to all those who produce, consume and transport electricity in the market.
ElectraNet considers that the analysis undertaken and the identification of Option 1 as the preferred option satisfies the RIT-T.
ElectraNet intends to commence work on replacing the identified bushings in January 2019. There are 101 transformer bushings, on 18 power transformers, that require replacing and it is estimated that the construction time for each transformer is around 8 weeks, i.e. around 2.5 to 3 years in total. We are planning to have all bushings replaced by 2021-22.


Managing the Risk of Transformer Bushing Failure Project Assessment Conclusions Report
22
Appendix A Compliance checklist
This section sets out a compliance checklist which demonstrates the compliance of this PACR with the requirements of clause 5.16.4(v) of the National Electricity Rules (NER) version 114.
Rules clause
Summary of requirements Relevant section(s) in the
PACR
5.16.4(v) The project assessment conclusions report must include: -
(1) the matters detailed in the project assessment draft report as required under paragraph (k)
See below.
(2) a summary of, and the RIT-T proponent's response to, submissions received, if any, from interested parties sought under paragraph (q)
NA
5.16.4(k) The project assessment draft report must include: -
(1) a description of each credible option assessed; 3
(2) a summary of, and commentary on, the submissions to the project specification consultation report;
NA
(3) a quantification of the costs, including a breakdown of operating and capital expenditure, and classes of material market benefit for each credible option;
3, 4, Appendix E & Appendix F
(4) a detailed description of the methodologies used in quantifying each class of material market benefit and cost;
Appendix E
(5) reasons why the RIT-T proponent has determined that a class or classes of market benefit are not material;
Appendix E
(6) the identification of any class of market benefit estimated to arise outside the region of the Transmission Network Service Provider affected by the RIT-T project, and quantification of the value of such market benefits (in aggregate across all regions);
NA
(7) the results of a net present value analysis of each credible option and accompanying explanatory statements regarding the results;
4
(8) the identification of the proposed preferred option; 5
(9) for the proposed preferred option identified under subparagraph (8), the RIT-T proponent must provide: (i) details of the technical characteristics; (ii) the estimated construction timetable and commissioning date; (iii) if the proposed preferred option is likely to have a material inter-network impact and if the Transmission Network Service Provider affected by the RIT-T project has received an augmentation technical report, that report; and (iv) a statement and the accompanying detailed analysis that the preferred option satisfies the regulatory investment test for transmission.
3 & 5
Managing the Risk of Transformer Bushing Failure Project Assessment Conclusions Report
23
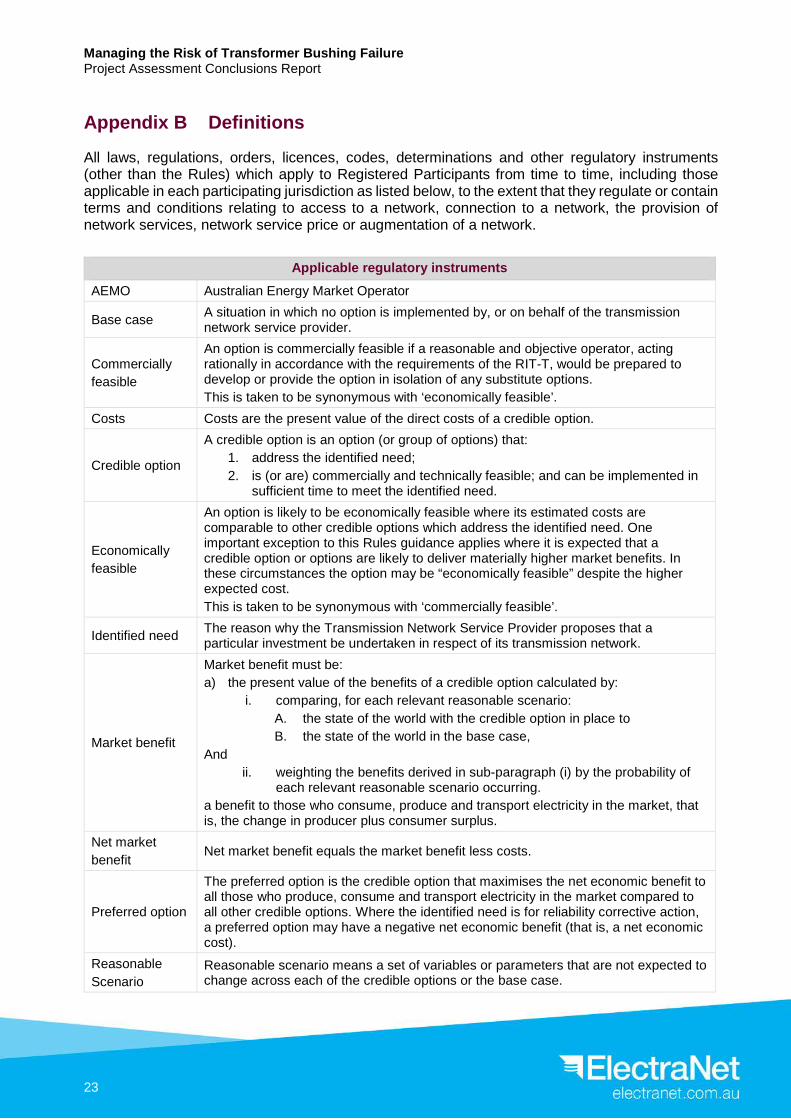
Appendix B Definitions
All laws, regulations, orders, licences, codes, determinations and other regulatory instruments (other than the Rules) which apply to Registered Participants from time to time, including those applicable in each participating jurisdiction as listed below, to the extent that they regulate or contain terms and conditions relating to access to a network, connection to a network, the provision of network services, network service price or augmentation of a network.
Applicable regulatory instruments AEMO Australian Energy Market Operator
Base case A situation in which no option is implemented by, or on behalf of the transmission network service provider.
Commercially feasible
An option is commercially feasible if a reasonable and objective operator, acting rationally in accordance with the requirements of the RIT-T, would be prepared to develop or provide the option in isolation of any substitute options. This is taken to be synonymous with ‘economically feasible’.
Costs Costs are the present value of the direct costs of a credible option.
Credible option
A credible option is an option (or group of options) that: 1. address the identified need; 2. is (or are) commercially and technically feasible; and can be implemented in
sufficient time to meet the identified need.
Economically feasible
An option is likely to be economically feasible where its estimated costs are comparable to other credible options which address the identified need. One important exception to this Rules guidance applies where it is expected that a credible option or options are likely to deliver materially higher market benefits. In these circumstances the option may be “economically feasible” despite the higher expected cost. This is taken to be synonymous with ‘commercially feasible’.
Identified need The reason why the Transmission Network Service Provider proposes that a particular investment be undertaken in respect of its transmission network.
Market benefit
Market benefit must be: a) the present value of the benefits of a credible option calculated by:
i. comparing, for each relevant reasonable scenario: A. the state of the world with the credible option in place to B. the state of the world in the base case,
And ii. weighting the benefits derived in sub-paragraph (i) by the probability of
each relevant reasonable scenario occurring. a benefit to those who consume, produce and transport electricity in the market, that is, the change in producer plus consumer surplus.
Net market benefit Net market benefit equals the market benefit less costs.
Preferred option
The preferred option is the credible option that maximises the net economic benefit to all those who produce, consume and transport electricity in the market compared to all other credible options. Where the identified need is for reliability corrective action, a preferred option may have a negative net economic benefit (that is, a net economic cost).
Reasonable Scenario
Reasonable scenario means a set of variables or parameters that are not expected to change across each of the credible options or the base case.

Managing the Risk of Transformer Bushing Failure Project Assessment Conclusions Report
24
Appendix C Process for implementing the RIT-T
For the purposes of applying the RIT-T, the NER establishes a typically three stage process, i.e. (1) the PSCR; (2) the PADR; and (3) the PACR. This process is summarised in the figure below (in gold), as well as the criteria for PADR exemption that this RIT-T is seeking to apply (in blue).
Figure 6 The RIT-T assessment and consultation process
Source: AER, Final Regulatory investment test for transmission application guidelines, 18 September 2017, p. 42.

Managing the Risk of Transformer Bushing Failure Project Assessment Conclusions Report
25
Appendix D Assumptions underpinning the identified need
This appendix summarises the key assumptions from the risk cost modelling and other key assumptions that underpin the identified need for this RIT-T. Appendix F provides further detail on the general modelling approaches applied, including additional detail on the risk cost modelling framework.
For the purposes of this assessment, the risk cost model focuses on a single mode of failure, an explosive failure of a transformer bushing, due to the potential for wide-ranging consequences including unserved energy, collateral equipment damage and personal injury and environmental costs as explained below.
D1 The probability of transformer bushings failing
The probability of bushing failure is estimated by considering historical data, manufacturers’ specifications, and industry research and experience.
The risk cost model assumes that one transformer bushing will suffer an explosive failure over the next 6 years (corresponding to an annual explosive failure rate of 0.17 per cent). The failure rate is estimated to increase progressively from year 7.
D2 The adverse effects resulting from any bushings failure
The potential adverse consequences resulting from the occurrence of a bushing failure include electricity service interruption, bushfire, personal injury, repair cost, service level breaches and environmental damage. When a transformer bushing fails, the affected transformer can experience an oil-fuelled fire, which causes consequential damage to the transformer and other equipment. In a severe scenario, the failed bushing can result in unserved energy for electricity customers because of the transformer itself completely failing.
Explosive bushing failures can also result in projectiles and oil spills, which present a safety risk to those in the immediate, or potentially wider area. The failure of critical transformers can result in additional costs associated with asset replacement and repair, collateral damage to other plant/equipment, and costs associated with injuries/fatalities to those surrounding the incident.
Our risk cost model defines the following effects that could occur from a transformer bushing failure:
• Unserved energy to electricity customers during the time taken to:
restore (or replace) the transformer(s); and
isolate the affected substation to control any explosion and fire
• Costs associated with having to repair (or replace) damaged transformers, bushings and other equipment;
• Personal injury costs associated with explosive failures; and
• Environmental costs associated with oil leaks, fire start etc.

Managing the Risk of Transformer Bushing Failure Project Assessment Conclusions Report
26
D3 The likelihood and cost of negative consequences of bushing failure
Our risk cost model individually defines a set of assumptions for the adverse effects described above, which allows the ‘likelihood of consequence’ (LoC) and ‘cost of consequence’ (CoC) to be estimated for transformer bushing failures.
The costs associated with service interruption and asset replacement account for more than 80 per cent of the total risk cost resulting from transformer bushing failure in this assessment. Service interruption includes both the unserved energy resulting from the loss of the affected transformer and additional costs associated with isolating the affected substation for a period to control any explosion and fire.
The risk cost model defines a load estimate and outage duration specific for metropolitan and rural transformers. Implicit for service interruption events are load loss estimates that are based on historical consumption information and connection point demand forecasts.
Outage durations for affected transformers are based on the typical time to change out and commission a new transformer. Outage durations of isolated substations are based on the estimated time for an emergency crew to respond to the site and assess and make safe collateral damage to adjacent plant.
For bushing failures at metropolitan substations relevant to this assessment, it is assumed to be possible to maintain supply via the underlying 66 kV distribution network. Therefore, unserved energy resulting from an explosive transformer bushing failure that damages multiple transformers at a metropolitan substation is assumed to be zero. For the same reason, unserved energy resulting from isolation of two of the three metropolitan substations, Para and Cherry Gardens, to control fire is also assumed to be zero.
The third metropolitan substation, LeFevre, provides supply to the local 66/11 kV substation as well as the western suburbs 66 kV transmission network. The unavailability of the 66/11 kV substation would result in an interruption to the supply of some local load which cannot be supplied from other substations. Therefore, for an explosive bushing failure at the LeFevre substation, we assume a 50 per cent probability that supply of 6 MW10 of load is interrupted for 8 hours when isolating the substation to control an explosion and fire.
10 Based on zone substation data published by SA Power Networks, available at
https://www.sapowernetworks.com.au/centric/industry/our_network/zone_substation_data_v1.jsp.

Managing the Risk of Transformer Bushing Failure Project Assessment Conclusions Report
27
When estimating costs associated with service interruption for rural transformers, the likelihood that an explosive transformer bushing failure would cause damage to multiple transformers that results in the loss of all load supplied from the substation is estimated to be 1 per cent. The interruption to supply is estimated to be 5.9 MW11 of mixed load for 8 days to allow for transformer replacement works. We also estimate a 50 per cent probability that 7.4 MW12 of load is interrupted for 8 hours when isolating rural substations to control an explosion and fire.
For both metropolitan and rural substations, we assume a 50 per cent probability that an explosive transformer bushing failure will result in transformer replacement.
These assumptions were revised to take into the account the recent explosive bushing failure at Snuggery substation. In particular, the estimated probability of load loss and transformer replacement as a result of an explosive bushing failure was reduced.
The cost of consequence for all service interruptions is valued at approximately $36,000/MWh, based on the relevant Value of Customer Reliability (VCR) escalated to 2017-18 dollars.
D4 Corrective and routine maintenance assumptions
Corrective and routine maintenance costs are estimated independently of the risk cost modelling framework.
Corrective maintenance estimates take into account all transformer bushing failure modes other than explosive failure (which is captured by the risk cost model). It is estimated that of the bushings identified as requiring replacement in this assessment, 5 per cent will require replacement annually, either as emergency corrective maintenance or in response to condition tests. Corrective maintenance estimates include costs associated with emergency replacement, unserved energy and the deferral of other works due to asset access, loss of redundancy and the redeployment of resources.
Routine maintenance consists of periodic transformer bushing tests. The costs of this testing program are reduced once a credible option is implemented when compared with the base case because the maintenance schedule is reset upon replacement of an asset.
11 5.9 MW is the estimated average load loss over 8 days for the rural substations identified in this assessment. 12 Initial load loss at rural substations is assumed to be 100 per cent of the substation load. The transfer of feeders to
other connection points allows some load to be restored at certain rural substations. Therefore, the average initial load loss at rural transformers (7.4 MW) is greater than the average load loss over 8 days (5.9 MW).

Managing the Risk of Transformer Bushing Failure Project Assessment Conclusions Report
28
Appendix E Materiality of market benefits for this RIT-T assessment
This appendix outlines the categories of market benefits prescribed in the NER and whether they are considered material for this RIT-T.13
The bulk of the benefits associated with each of the options considered in this assessment are captured in the costs avoided by each of the options. As described above, these include avoided corrective maintenance costs, avoided routine maintenance costs (i.e. deferred routine bushing tests) and avoided risk costs.
Of these avoided costs, only unserved energy through involuntary load shedding is considered a market benefit category under the Rules, as discussed further below.
E1 Avoided involuntary load shedding is the only relevant market benefit
We consider that the only relevant market benefit for this RIT-T relates to changes in involuntary load shedding. The expected unserved energy under the base case has been estimated as part of our risk cost modelling framework, which is avoided under both the credible options. The difference between Options 1 and 2 is that Option 1 allows this expected unserved energy to be substantially reduced compared with Option 2.
The benefit associated with the reduction in unserved energy is valued using VCR, expressed in $/MWh. A VCR measure estimates the value customers place on having reliable electricity supplies. The risk cost modelling has applied a VCR value of approximately $36,000/MWh, which has been sourced from AEMO’s 2014 Value of Customer Reliability Review,14 and represents an aggregate VCR (including customers directly connected to the transmission network) for South Australia.
E2 Market benefits relating to the wholesale market are not material
The Australian Energy Regulator (AER) has recognised that if the credible options considered will not have an impact on the wholesale market, then a number of classes of market benefits will not be material in the RIT-T assessment, and so do not need to be estimated.15
Neither credible option addresses network constraints between competing generating centres and are therefore not expected to result in any change in dispatch outcomes and wholesale market prices.
We therefore consider that the following classes of market benefits are not material for this RIT-T assessment for Option 1 and Option 2:
• changes in fuel consumption arising through different patterns of generation dispatch;
13 The NER requires that all categories of market benefit identified in relation to the RIT-T are included in the RIT-T
assessment, unless the TNSP can demonstrate that a specific category (or categories) is unlikely to be material in relation to the RIT-T assessment for a specific option – NER clause 5.16.1(c)(6).
14 AEMO, Value of Customer Reliability Review for South Australia, September 2014, p. 31 and p. 40. 15 AER, Final Regulatory Investment Test for Transmission Application Guidelines, 18 September 2017, pp. 13-14.

Managing the Risk of Transformer Bushing Failure Project Assessment Conclusions Report
29
• changes in voluntary load curtailment (since there is no impact on pool price);
• changes in costs for parties, other than for ElectraNet (since there will be no deferral of generation investment);
• changes in ancillary services costs;
• competition benefits; and
• Renewable Energy Target (RET) penalties.
E3 Other classes of market benefits are not expected to be material
In addition to the classes of market benefits listed above, NER clause 5.16.1(c)(4) requires us to consider the following classes of market benefits in relation to each credible option: differences in the timing of transmission investment; option value; and changes in network losses.
We consider that none of the three classes of market benefits listed above are material for this RIT-T assessment for the reasons set out below.
Table 6 - Reasons why non-wholesale market benefit categories are considered immaterial
Market benefit category Reason(s) why it is considered immaterial Differences in the timing of transmission investment
Neither credible option will affect the timing of other unrelated transmission investments (i.e. transmission investments based on a need that falls outside the scope of that described in section 2). Consequently, the market benefits associated with differences in the timing of unrelated transmission investment are not material to the RIT-T assessment.
Option value The AER has stated that option value is likely to arise where there is uncertainty regarding future outcomes, the information that is available in the future is likely to change and the credible options considered by the TNSP are sufficiently flexible to respond to that change.16 None of these conditions apply to the present assessment. The AER has also stated the view that appropriate identification of credible options and reasonable scenarios captures any option value, thereby meeting the NER requirement to consider option value as a class of market benefit under the RIT-T. Changes in future demand levels are not relevant for this RIT-T, since the need for and timing of the required investment is being driven by asset condition rather than future demand growth. As a result, it is not relevant to consider different future demand scenarios in undertaking the RIT-T analysis.
Changes in network losses
Given both credible options maintain the same network capacity as current at the same location, there are not expected to be any differences in network losses.
We do not consider that there are any other classes of market benefits, which are material for the purposes of this RIT-T assessment.
16 AER, Final Regulatory Investment Test for Transmission Application Guidelines, 18 September 2017, pp. 37 & 74.

Managing the Risk of Transformer Bushing Failure Project Assessment Conclusions Report
30
Appendix F Description of the modelling methodologies applied
This appendix outlines the methodologies and assumptions we have applied to undertake this RIT-T assessment.
F1 Overview of the risk cost modelling framework
We have applied an asset ‘risk cost’ evaluation framework to quantify the risk cost reductions associated with asset replacement and refurbishment projects that are primarily focused on mitigating risk as input to economic evaluation and options analysis.
The ‘risk cost reductions’ have been calculated as the product of:
• probability of failure (PoF) of an asset, which is the probability of a failure occurring based on asset failure history information and industry data;
• likelihood of consequence (LoC), which is the likelihood of an adverse consequence of the failure event based on historical information and statistical factors and assumptions; and
• cost of consequence (CoC), which is the estimated cost of the adverse consequence based on modelled assumptions.
These three variables allow the expected risk cost benefits to be quantified and an assessment against the cost of doing so to be undertaken. Avoided risk cost values are the difference between risk costs incurred under the base case and respective options.
The approach we applied to quantifying risk was presented as part of our Revenue Proposal for the 2018-2023 regulatory control period. The AER has reported it to be consistent with good industry practice and to generally reflect reasonable inputs and assumptions.17
More detail on the key inputs and assumptions made for individual asset risk cost evaluations can be found in ElectraNet’s asset risk cost modelling guideline.18
F2 The discount rate and assessment period
The RIT-T analysis has been undertaken over a 20-year period from 2018 to 2037, which considers the size, complexity and expected life of each option to provide a reasonable indication of its cost.
While the transformer bushings have asset lives greater than 20 years, we have taken a terminal value approach to incorporating capital costs in the assessment, which ensures that the capital cost of each option is appropriately captured in the 20-year assessment period.
17 AER, ElectraNet transmission determination 2018 to 2023, Draft Decision, Attachment 6 – Capital expenditure,
October 2017, p. 4. 18 Available at https://www.aer.gov.au/networks-pipelines/determinations-access-arrangements/electranet-
determination-2018-23/proposal#step-50979.

Managing the Risk of Transformer Bushing Failure Project Assessment Conclusions Report
31
We have adopted a real, pre-tax discount rate of 6 per cent as the central assumption for the NPV analysis presented in this report. We consider that this is a reasonable contemporary approximation of a ‘commercial’ discount rate (a different concept to a regulatory WACC), consistent with the RIT-T.
The RIT-T requires that sensitivity testing be conducted on the discount rate and that the regulated real, pre-tax weighted average cost of capital (WACC) be used as the lower bound discount rate in the sensitivity testing.19
We have therefore tested the sensitivity of the results to changes in this discount rate assumption, and specifically to the adoption of a lower bound discount rate of 3.62 per cent, and an upper bound discount rate of 8.38 per cent (i.e. a symmetrical adjustment upward).
19 AER, Final Regulatory Investment Test for Transmission, June 2010, version 1, paragraph 15, p. 7.

Managing the Risk of Transformer Bushing Failure Project Assessment Conclusions Report
32