Making greening happen in consolidating cities flyers and Docs... · 2019. 7. 3. · City of...
44
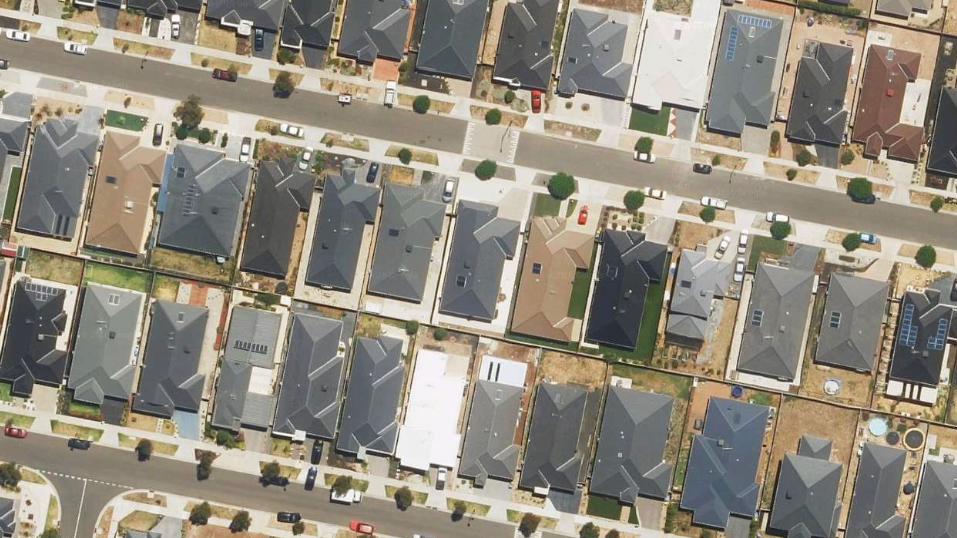
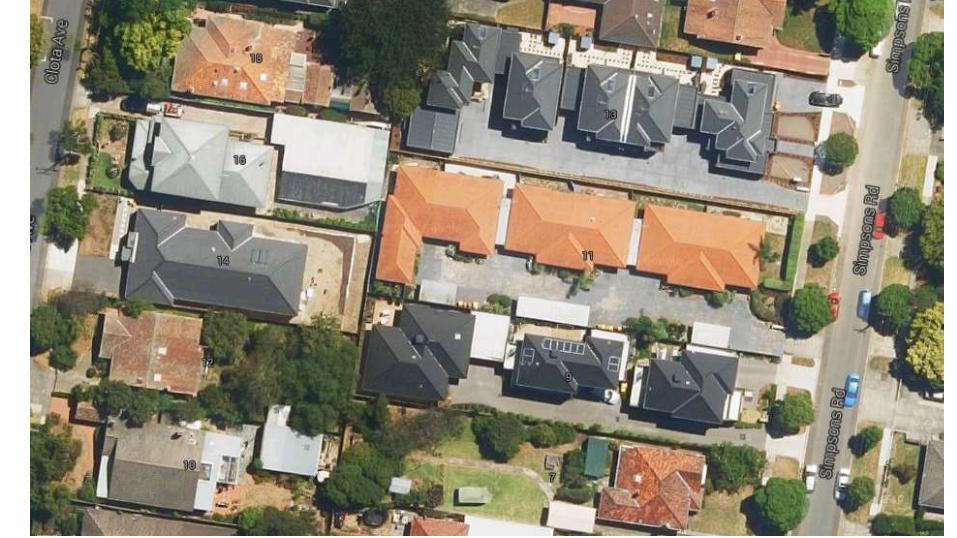
Derrimut Google maps 2016 Making greening happen in consolidating cities Joe Hurley, Kath Phelan, Marco Amati - RMIT University Alex Saunders, Bryan Boruff – University of Western Australia
Transcript of Making greening happen in consolidating cities flyers and Docs... · 2019. 7. 3. · City of...

Derrimut Google maps 2016
Making greening happen in
consolidating cities Joe Hurley, Kath Phelan, Marco Amati - RMIT University
Alex Saunders, Bryan Boruff – University of Western Australia

Clean Air and Urban
Landscapes research hub

Issue Context - Making greening happen in consolidating cities

Issue Context - Making greening happen in consolidating cities
https://urban.melbourne/opinion/2013/11/12/ivan-rijavec-on-a-question-of-urban-character
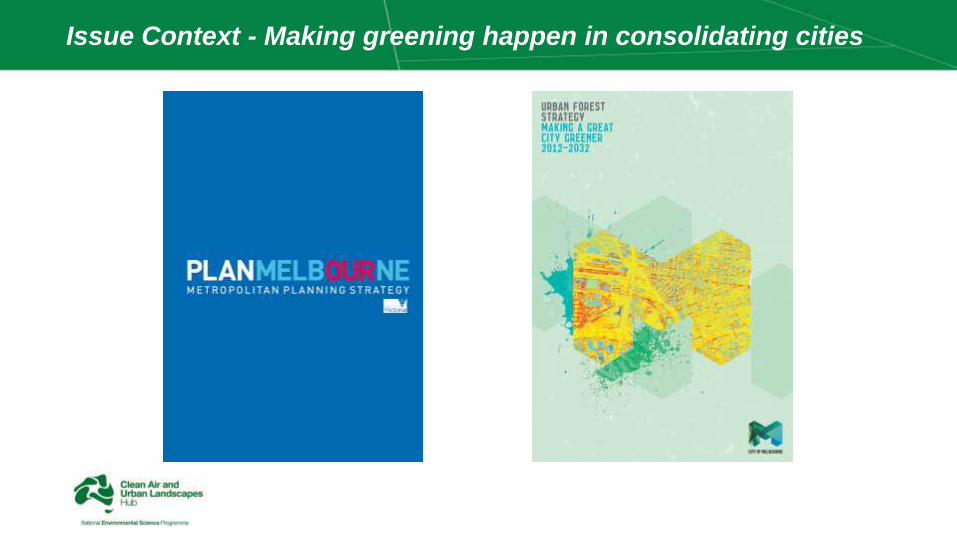
Issue Context - Making greening happen in consolidating cities
Issue Context - Making greening happen in consolidating cities

Work Program - Making greening happen in consolidating cities
Source: Melbourne Urban Forest Strategy
1. Policy Review: • review of current policy and strategy for
urban forest enhancement with respect to land-use planning.
2. Spatial analysis: • Analysing urban development scenarios
under consolidation pressure. • Comprehensive city scale assessment of
urban forest against land-use. 3. Scenario modelling:
• Model land-use and urban forest policy/regulation, and urban development; test implications of different policy and urban development scenarios.

Policy Review
Policy Review
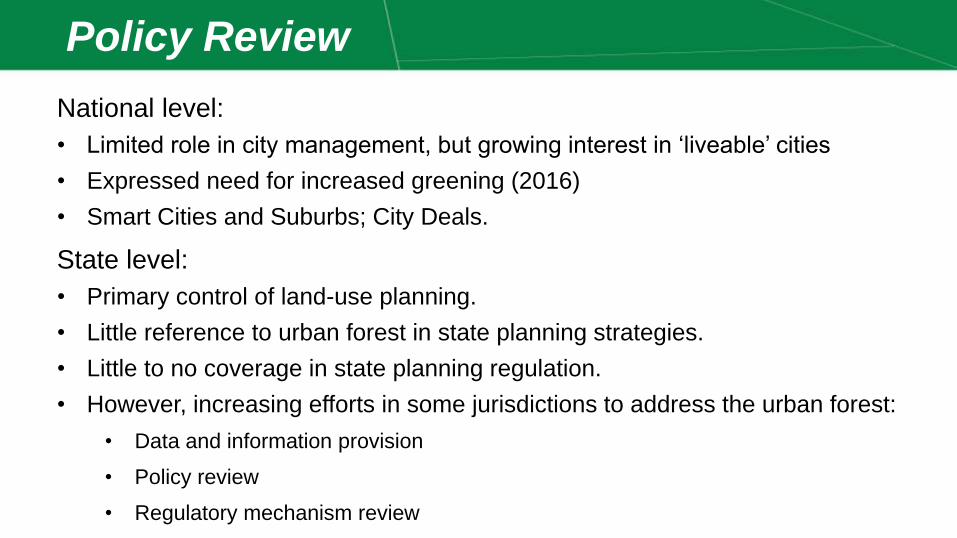
National level:
• Limited role in city management, but growing interest in ‘liveable’ cities
• Expressed need for increased greening (2016)
• Smart Cities and Suburbs; City Deals.
State level:
• Primary control of land-use planning.
• Little reference to urban forest in state planning strategies.
• Little to no coverage in state planning regulation.
• However, increasing efforts in some jurisdictions to address the urban forest:
• Data and information provision
• Policy review
• Regulatory mechanism review
Policy Review
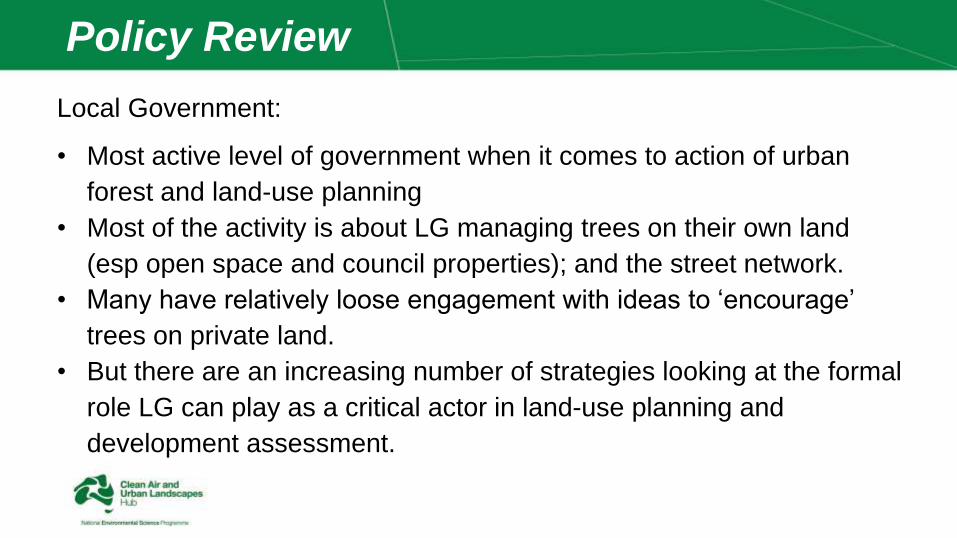
Local Government:
• Most active level of government when it comes to action of urban
forest and land-use planning
• Most of the activity is about LG managing trees on their own land
(esp open space and council properties); and the street network.
• Many have relatively loose engagement with ideas to ‘encourage’
trees on private land.
• But there are an increasing number of strategies looking at the formal
role LG can play as a critical actor in land-use planning and
development assessment.

Policy Review
Research question: To what extent do local government urban forest policies make a clear connection to land use planning policies to protect and enhance the urban forest?
Final sample comprised 18 urban forest strategies produced by local governments since 2008 in four Australian mainland states and available online

Policy Review
Goals:
• Variable: managing their urban trees;
protecting the urban forest; and
protecting and enhancing urban forest.
• One municipality would generally like
its jurisdiction to be “well-treed”
• Others are more comprehensive in
their vision for a resilient, healthy and
diverse urban forest. Defining the
urban forest as an “integrated canopy”.
City of Perth

Policy Review
Framing the problem:
• Most adopt the language of sustainability to describe the value of urban forests.
• A number refer to liveability and health; two refer to spatial social justice, identifying
equitable tree distribution as an important goal.
• Most frame urban development as one of the rationales for producing forest policies.
• 4 talk generally about urbanisation and development pressure;
• 12 cite variations of density, urban consolidation or urban intensification as
impacting negatively on urban forests.
• But framing is variable: prominence variously given to biodiversity, heat island,
amenity, health, equity, urban development pressure.
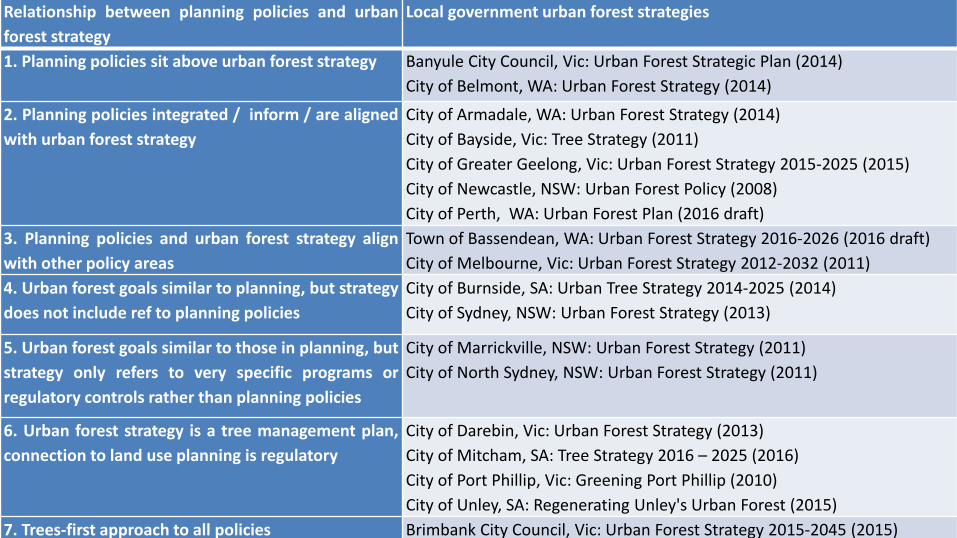
Relationship between planning policies and urban
forest strategy
Local government urban forest strategies
1. Planning policies sit above urban forest strategy Banyule City Council, Vic: Urban Forest Strategic Plan (2014)
City of Belmont, WA: Urban Forest Strategy (2014)
2. Planning policies integrated / inform / are aligned
with urban forest strategy
City of Armadale, WA: Urban Forest Strategy (2014)
City of Bayside, Vic: Tree Strategy (2011)
City of Greater Geelong, Vic: Urban Forest Strategy 2015-2025 (2015)
City of Newcastle, NSW: Urban Forest Policy (2008)
City of Perth, WA: Urban Forest Plan (2016 draft)
3. Planning policies and urban forest strategy align
with other policy areas
Town of Bassendean, WA: Urban Forest Strategy 2016-2026 (2016 draft)
City of Melbourne, Vic: Urban Forest Strategy 2012-2032 (2011)
4. Urban forest goals similar to planning, but strategy
does not include ref to planning policies
City of Burnside, SA: Urban Tree Strategy 2014-2025 (2014)
City of Sydney, NSW: Urban Forest Strategy (2013)
5. Urban forest goals similar to those in planning, but
strategy only refers to very specific programs or
regulatory controls rather than planning policies
City of Marrickville, NSW: Urban Forest Strategy (2011)
City of North Sydney, NSW: Urban Forest Strategy (2011)
6. Urban forest strategy is a tree management plan,
connection to land use planning is regulatory
City of Darebin, Vic: Urban Forest Strategy (2013)
City of Mitcham, SA: Tree Strategy 2016 – 2025 (2016)
City of Port Phillip, Vic: Greening Port Phillip (2010)
City of Unley, SA: Regenerating Unley's Urban Forest (2015)
7. Trees-first approach to all policies Brimbank City Council, Vic: Urban Forest Strategy 2015-2045 (2015)

Policy Review
Key strategies to integrate urban forest and
planning:
• Connect urban forest policies to land use
planning framework.
• Highlight where planning policies do/should
identify the role of trees.
• Address planning’s current treatment of
trees as an “unconsidered back end
constraint”.
• City-wide review of planning policies to
increase urban forest objectives’ integration.
City of Armadale

Policy Review
Brimbank:
• Proposes that trees should be “at the
forefront of Council’s decision making
process, to improve liveability throughout
Brimbank”.
• Proposes a strong planning regulatory
approach to require developers to plant
trees.
• Council should work closely with developers
“to apply a vegetation first approach to
increase canopy cover”.
Policy Review
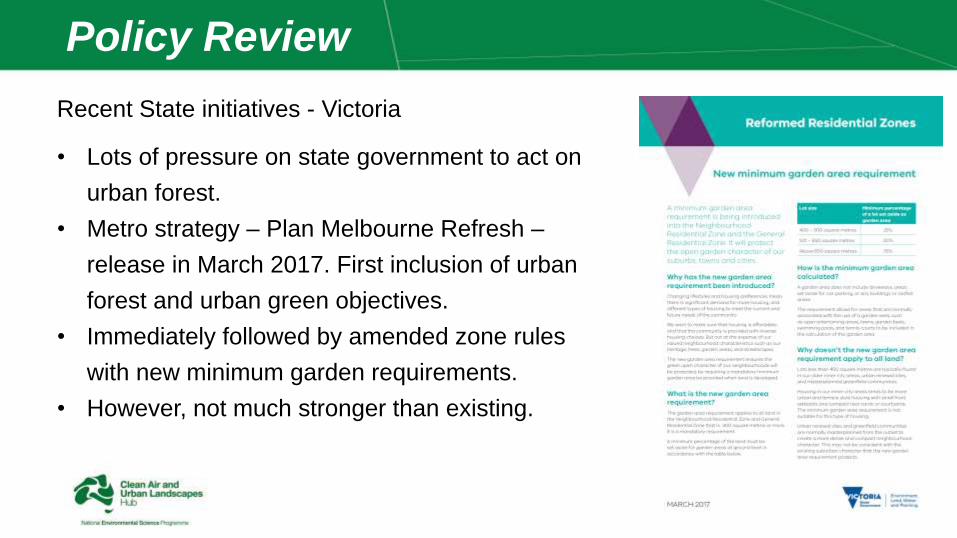
Recent State initiatives - Victoria
• Lots of pressure on state government to act on
urban forest.
• Metro strategy – Plan Melbourne Refresh –
release in March 2017. First inclusion of urban
forest and urban green objectives.
• Immediately followed by amended zone rules
with new minimum garden requirements.
• However, not much stronger than existing.

Policy Review
Key lessons:
• Despite ongoing trend to centralise planning control at state level, a lack of
state engagement on the intersection of urban planning and the urban forest.
• Local government leading strategy and policy innovation, but lack ability to
influence at metro scale.
• Of the leading LGAs, there is significant diversity in approach to objectives,
monitoring, strategy and action.
• Lack of information to inform strategy making, especially for suburban
councils; and a lack of information other than on council controlled land.
• Lack of state support for action though assessment tools; policy frameworks
and regulatory mechanisms.

Spatial Analysis
National framework for green space mapping and monitoring
Our objectives for green space mapping and monitoring:
• Viable as a nationally consistent, comparable approach.
• Scalable from metro to local; with fine grained analysis possible.
• Allocate green cover to major land ownership/use categories and
street networks to inform policy and strategy response.
• Set baselines, benchmarks, targets and allow monitoring and
evaluation over time, based on available data.
• Investigate relationship between urban greening and other spatial
information such as land-use to inform policy and strategy
development.
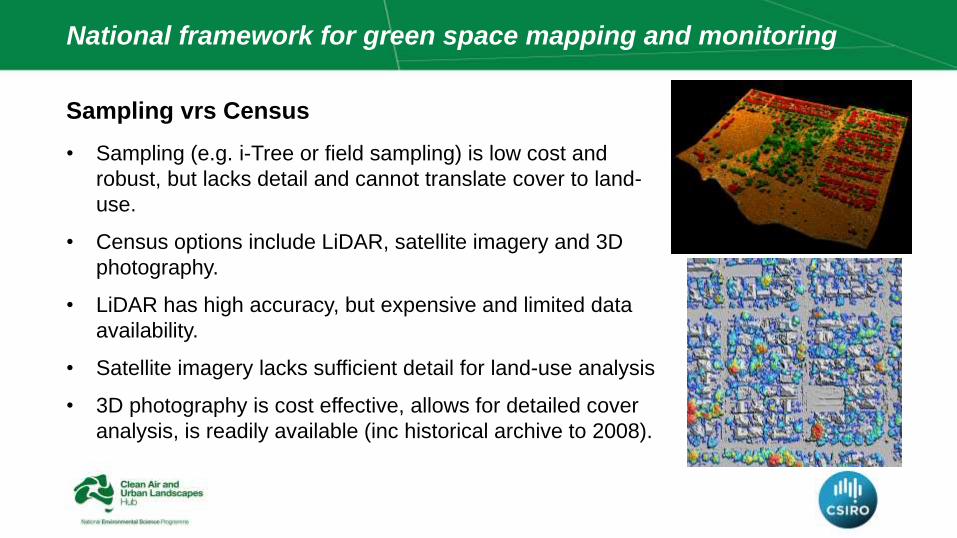
Sampling vrs Census
• Sampling (e.g. i-Tree or field sampling) is low cost and
robust, but lacks detail and cannot translate cover to land-
use.
• Census options include LiDAR, satellite imagery and 3D
photography.
• LiDAR has high accuracy, but expensive and limited data
availability.
• Satellite imagery lacks sufficient detail for land-use analysis
• 3D photography is cost effective, allows for detailed cover
analysis, is readily available (inc historical archive to 2008).
National framework for green space mapping and monitoring
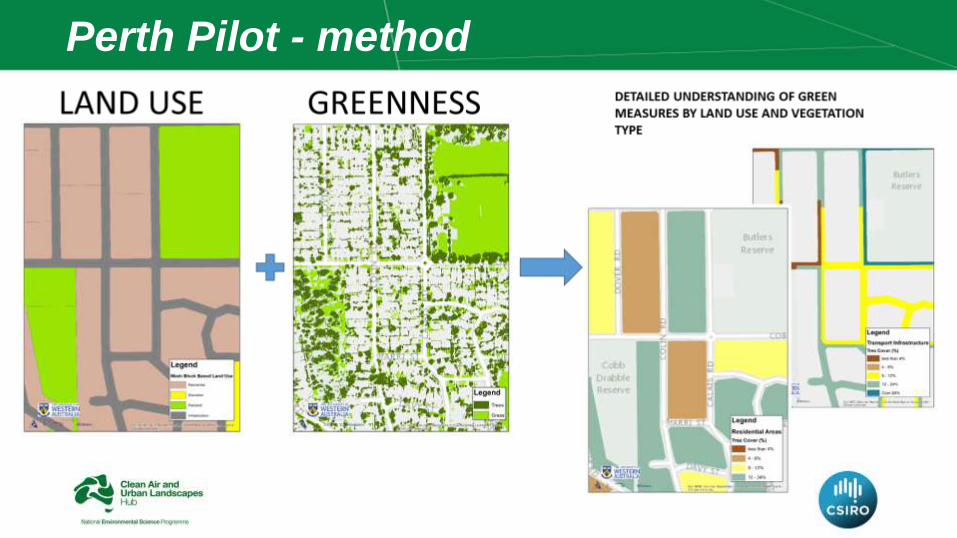
Perth Pilot - method

-
2,000
4,000
6,000
8,000
10,000
12,000
14,000
16,000
18,000
20,000
Grass Shrubs Trees (3 - 10m) Trees (10 - 15m) Trees 15m plus
Area of Greenness by Type (ha)
24
Area (ha) Percentage
Total Study Area (ha)
170,700 100%
Total Measured Green Area (ha)
48,000 28%
Grass (ha)
17,900 10%
Shrubs
11,100 6%
Trees (3 - 10m)
13,700 8%
Trees (10 - 15m)
3,800 2%
Trees (15m Plus)
1,600 1%
Perth Pilot – sample results
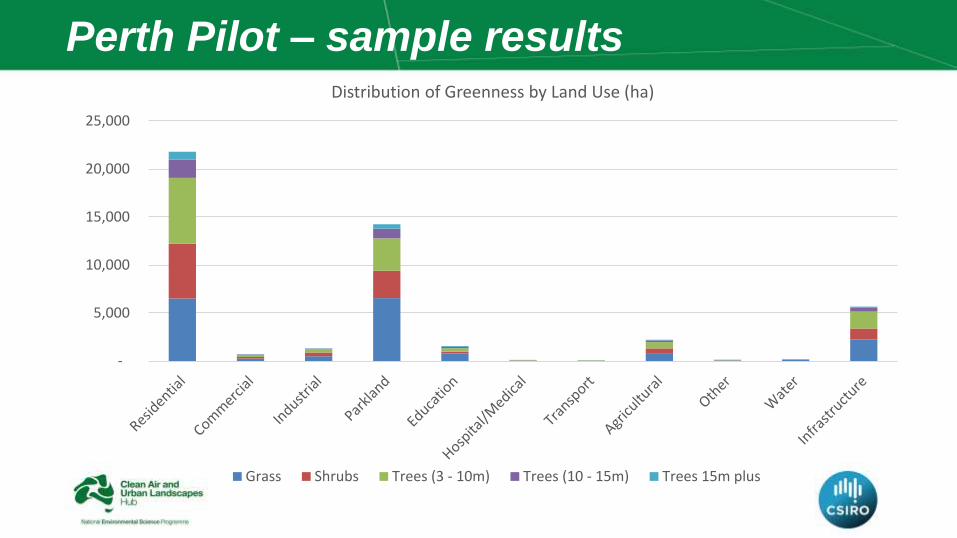
-
5,000
10,000
15,000
20,000
25,000
Distribution of Greenness by Land Use (ha)
Grass Shrubs Trees (3 - 10m) Trees (10 - 15m) Trees 15m plus
Perth Pilot – sample results

- 10 20 30 40 50
Mundaring (S)
Armadale (C)
Kalamunda (S)
Peppermint Grove (S)
Cambridge (T)
Nedlands (C)
Claremont (T)
Waroona (S)
South Perth (C)
Subiaco (C)
East Fremantle (T)
Mosman Park (T)
Melville (C)
Victoria Park (T)
Bassendean (T)
Perth (C)
Stirling (C)
Bayswater (C)
Wanneroo (C)
Cottesloe (T)
Joondalup (C)
Rockingham (C)
Gosnells (C)
Serpentine-Jarrahdale (S)
Mandurah (C)
Cockburn (C)
Swan (C)
Kwinana (T)
Murray (S)
Vincent (T)
Canning (C)
Fremantle (C)
Belmont (C)
LGA Comparison
Tree Percentage Shrub Percentage Grass Percentage
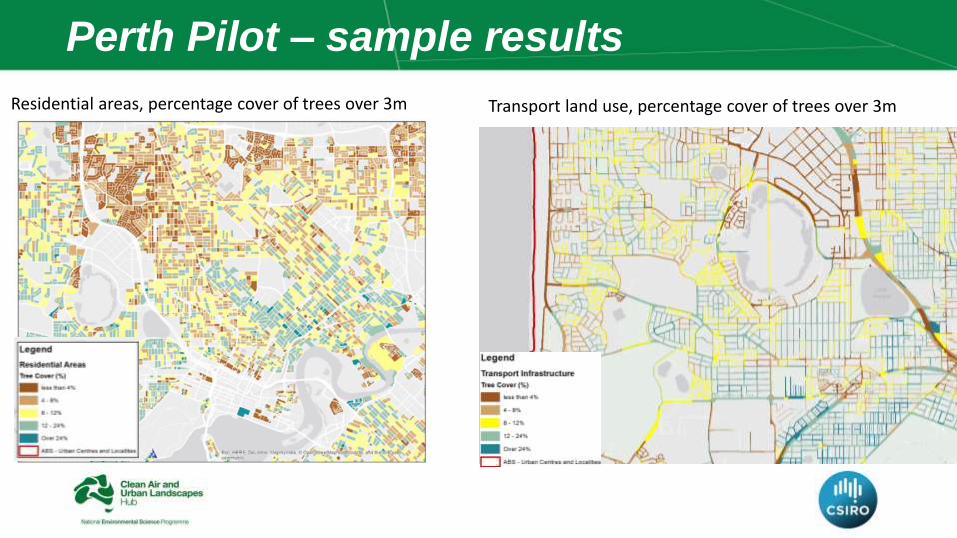
Perth Pilot – sample results
Residential areas, percentage cover of trees over 3m Transport land use, percentage cover of trees over 3m
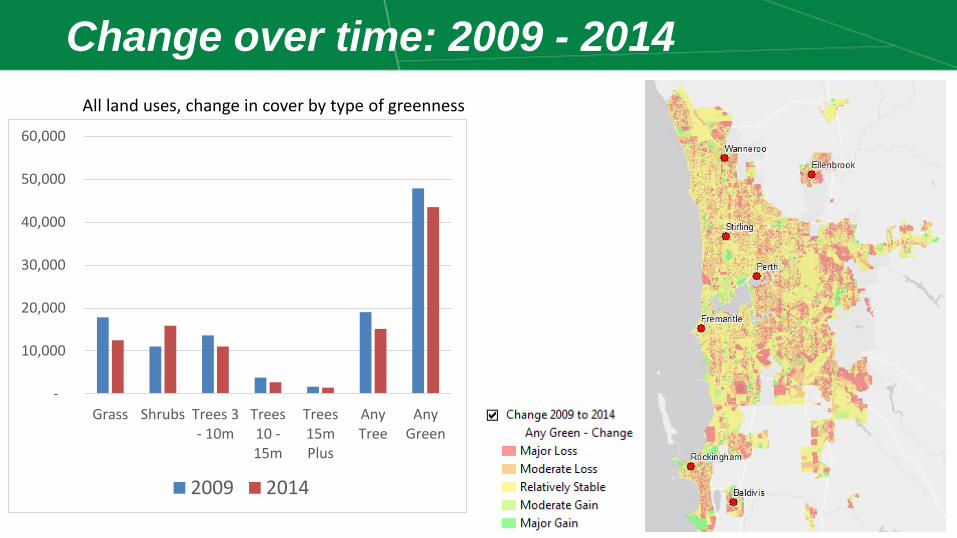
Change over time: 2009 - 2014
All land uses, change in cover by type of greenness
-
10,000
20,000
30,000
40,000
50,000
60,000
Grass Shrubs Trees 3- 10m
Trees10 -15m
Trees15mPlus
AnyTree
AnyGreen
2009 2014
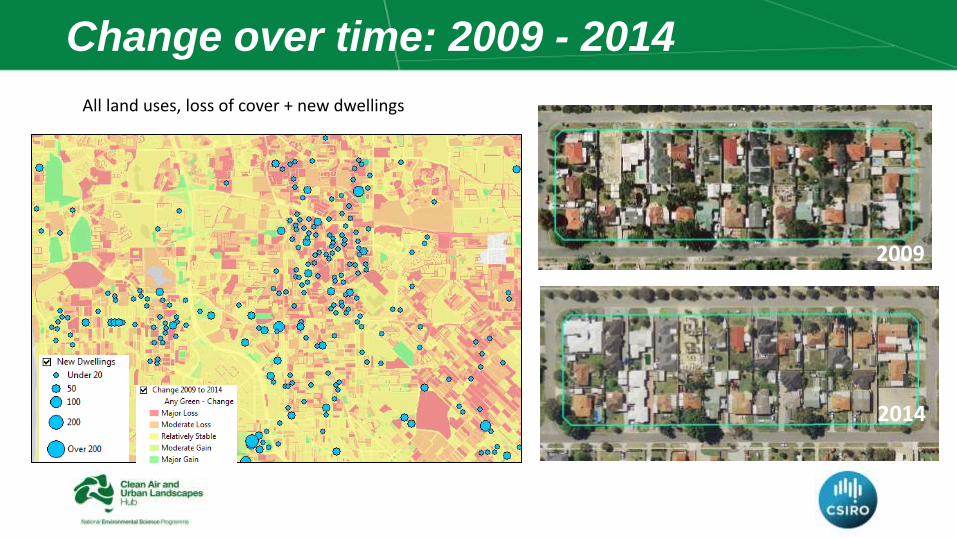
2009
2014
Change over time: 2009 - 2014
All land uses, loss of cover + new dwellings

Work in progress

Proximity Analysis
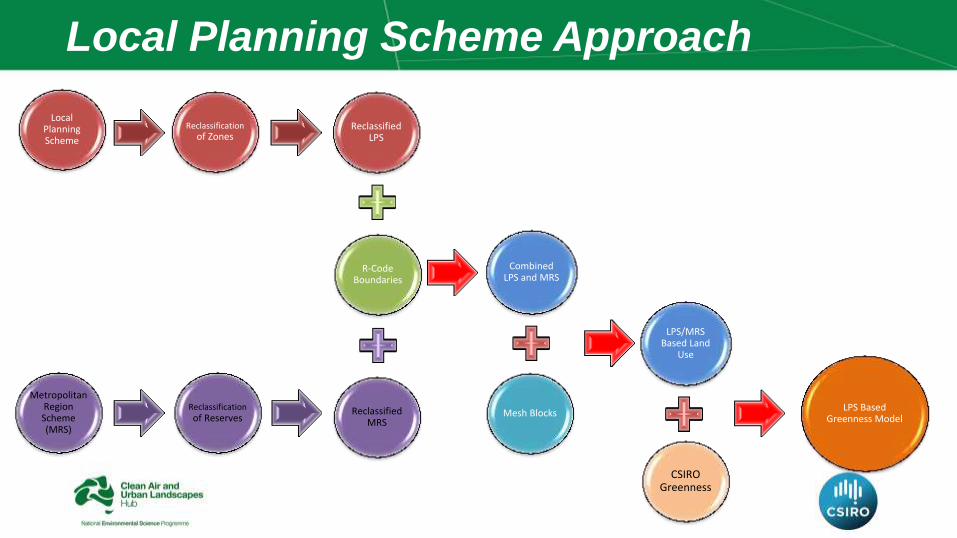
Local Planning Scheme
R-Code Boundaries
Metropolitan Region Scheme (MRS)
Mesh Blocks
Combined LPS and MRS
Reclassification of Zones
Reclassification of Reserves
Reclassified LPS
Reclassified MRS
LPS Based Greenness Model
LPS/MRS Based Land
Use
CSIRO Greenness
Local Planning Scheme Approach

Alex Saunders, Centre for the Built Environment and Health, University of Western Australia 34
LPS in Original format Simplified Local Planning Scheme
Local Planning Scheme Approach

4: Local Level Data Comparison of Mesh Block and LPS Land-use
35
-
200
400
600
800
1,000
1,200
City of Stirling – Local Model
Grass Area (ha) Shrubs Area (ha) Trees (3 - 10m) Area (ha) Trees (10 - 15m) Area (ha) Trees (15m Plus) Area (ha)
-
200
400
600
800
1,000
1,200
Residential Commercial Industrial Education Hospital/Medical Parkland TransportInfrastructure
Other Water
City of Stirling - Regional Model
Grass Area (ha) Shrub Area (ha) Trees (3 - 10m) Area (ha) Trees (10 - 15m) Area (ha) Trees (15m Plus) Area (ha)

• Uses mean property age less 1.5 standard deviations to designate age of street blocks (Mesh Blocks)
• Then uses these defined street blocks as the basis of defining the age of SA1s. Uses Mean MB less 1.5 SDs.
• Use defined SA1s to define age of SA2.
• Ages a neighbourhood by the age of the street block rather than the property.
• Ages a larger neighbourhood by the age of sub-neighbourhoods rather than current property age profile.
Stratified Aging of Street Blocks, then neighbourhoods
Aging of suburbs

• Pre 1955
• Stevenson-Hepburn Plan 1955
• Corridor Plan – 1970
• Metroplan - 1990
• Liveable Neighbourhoods - 1997
Aging suburbs based around major planning eras
Aging of suburbs

Modelling policy scenarios
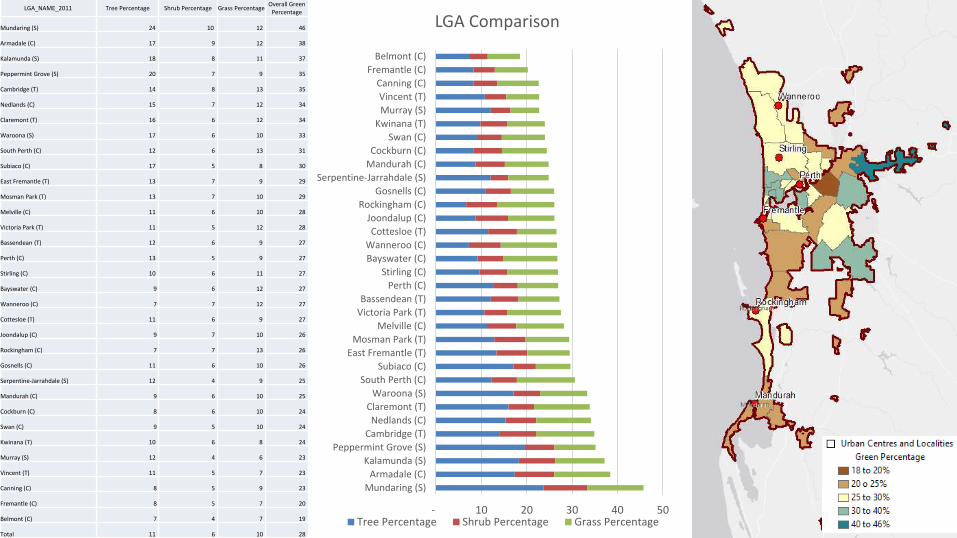
3a: LGA Level Analysis
Comparisons by vegetation type
LGA_NAME_2011 Tree Percentage Shrub Percentage Grass Percentage Overall Green
Percentage
Mundaring (S) 24 10 12 46
Armadale (C) 17 9 12 38
Kalamunda (S) 18 8 11 37
Peppermint Grove (S) 20 7 9 35
Cambridge (T) 14 8 13 35
Nedlands (C) 15 7 12 34
Claremont (T) 16 6 12 34
Waroona (S) 17 6 10 33
South Perth (C) 12 6 13 31
Subiaco (C) 17 5 8 30
East Fremantle (T) 13 7 9 29
Mosman Park (T) 13 7 10 29
Melville (C) 11 6 10 28
Victoria Park (T) 11 5 12 28
Bassendean (T) 12 6 9 27
Perth (C) 13 5 9 27
Stirling (C) 10 6 11 27
Bayswater (C) 9 6 12 27
Wanneroo (C) 7 7 12 27
Cottesloe (T) 11 6 9 27
Joondalup (C) 9 7 10 26
Rockingham (C) 7 7 13 26
Gosnells (C) 11 6 10 26
Serpentine-Jarrahdale (S) 12 4 9 25
Mandurah (C) 9 6 10 25
Cockburn (C) 8 6 10 24
Swan (C) 9 5 10 24
Kwinana (T) 10 6 8 24
Murray (S) 12 4 6 23
Vincent (T) 11 5 7 23
Canning (C) 8 5 9 23
Fremantle (C) 8 5 7 20
Belmont (C) 7 4 7 19
Total 11 6 10 28
40 - 10 20 30 40 50
Mundaring (S)
Armadale (C)
Kalamunda (S)
Peppermint Grove (S)
Cambridge (T)
Nedlands (C)
Claremont (T)
Waroona (S)
South Perth (C)
Subiaco (C)
East Fremantle (T)
Mosman Park (T)
Melville (C)
Victoria Park (T)
Bassendean (T)
Perth (C)
Stirling (C)
Bayswater (C)
Wanneroo (C)
Cottesloe (T)
Joondalup (C)
Rockingham (C)
Gosnells (C)
Serpentine-Jarrahdale (S)
Mandurah (C)
Cockburn (C)
Swan (C)
Kwinana (T)
Murray (S)
Vincent (T)
Canning (C)
Fremantle (C)
Belmont (C)
LGA Comparison
Tree Percentage Shrub Percentage Grass Percentage
41
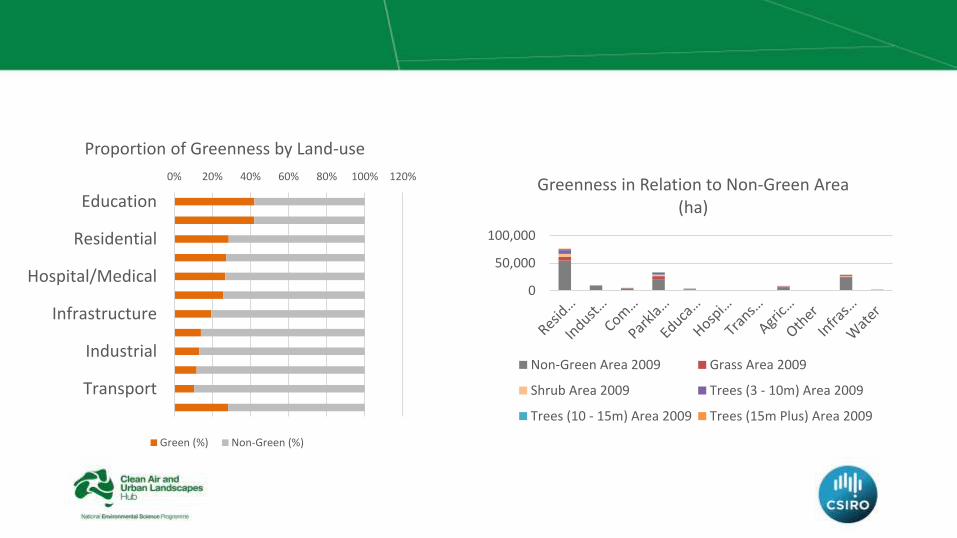
0
50,000
100,000
Greenness in Relation to Non-Green Area (ha)
Non-Green Area 2009 Grass Area 2009
Shrub Area 2009 Trees (3 - 10m) Area 2009
Trees (10 - 15m) Area 2009 Trees (15m Plus) Area 2009
0% 20% 40% 60% 80% 100% 120%
Education
Residential
Hospital/Medical
Infrastructure
Industrial
Transport
Proportion of Greenness by Land-use
Green (%) Non-Green (%)
Monitoring and mapping

Monitoring and mapping

Issue Context - Making greening happen in consolidating cities
NRZ 17%
GRZ 46%
RGZ 1%
LDRZ, MUZ 36%
Proportion of municipalities’ residential areas zoned NRZ, GRZ and RGZ