Low Carbon Frameworks: Transport GREENHOUSE GAS...
12
Low Carbon Frameworks: Transport 2016 BRIEF GREENHOUSE GAS EMISSIONS FROM PASSENGER TRANSPORT IN GAUTENG AN INVESTIGATION PER INCOME GROUP South Africa’s National Climate Change Response Policy outlines the country’s commitment to moving to a lower carbon economy (Republic of South Africa, 2011). Within that White Paper, the transport sector is identified as a significant greenhouse gas (GHG) emitting sector. The latest South African Greenhouse Gas Inventory (DEA, 2013), suggests that in 2010 energy used in transportation contributed a total of 47.4 Mt CO2e, or 8.4% of South Africa’s direct greenhouse gas emissions. Passenger transport is thought to make up slightly over half of these emissions. If indirect emissions were included from the upstream extraction, refining and distribution of fuels and generation of electricity, the emissions attributable to the transport sector would be larger. At the urban scale, direct emissions from transport are far more significant. In Johannesburg, transport accounts for 70% of energy use and 38% of the City’s emissions (SEA, 2015). PHOTO: SHUTTERSTOCK Contents Introduction 2 Review of existing data source 2 Methodology for assessing transport related GHG emissions per income band 4 Outcomes of the modelling: passenger kilometres 6 Outcomes of the modelling: GHG kilometres 8 Summary 11 References 11
Transcript of Low Carbon Frameworks: Transport GREENHOUSE GAS...

Low Carbon Frameworks: Transport
2016
BRIEF
GREENHOUSE GAS EMISSIONS FROM PASSENGER
TRANSPORT IN GAUTENG AN INVESTIGATION
PER INCOME GROUPSouth Africa’s National Climate Change Response Policy outlines the country’s commitment to moving to a lower carbon economy (Republic of South Africa, 2011). Within that White Paper, the transport sector is identified as a significant greenhouse gas (GHG) emitting sector. The latest South African Greenhouse Gas Inventory (DEA, 2013), suggests that in 2010 energy used in transportation contributed a total of 47.4 Mt CO2e, or 8.4% of South Africa’s direct greenhouse gas emissions. Passenger transport is thought to make up slightly over half of these emissions. If indirect emissions were included from the upstream extraction, refining and distribution of fuels and generation of electricity, the emissions attributable to the transport sector would be larger. At the urban scale, direct emissions from transport are far more significant. In Johannesburg, transport accounts for 70% of energy use and 38% of the City’s emissions (SEA, 2015).
PHOTO: SHUTTERSTOCK
Contents
Introduction 2
Review of existing data source 2
Methodology for assessing transport related GHG emissions per income band 4
Outcomes of the modelling: passenger kilometres 6
Outcomes of the modelling: GHG kilometres 8
Summary 11
References 11

Page 2 | Greenhouse gas emissions from passenger transport in Gauteng
Low Carbon Frameworks: Transport
This briefing document was prepared under WWF’s low carbon frameworks transport project, which seeks to document the different sources of emissions from the sector, and to explore the implications of greenhouse gas emission reduction strategies. The document provides an overview of passenger transport demand and greenhouse gas emissions in the passenger transport sector, using Gauteng as a case study. Given how demand for transport, possible intervention strategies and thus the opportunities for mitigation, differs between income levels, an attempt is made based on available data to unpack passenger kilometres and emissions according to income level. Gauteng is selected as a case study for two key reasons. Firstly, it is the most populous province and hence has the largest share of transport emissions. Secondly, there is a substantial amount of information available on passenger transport and associated emissions, which has been gathered through transport surveys, transport planning efforts and associated modelling. In a separate paper, the mitigation opportunities, initiatives and measures available to the passenger sector are summarised.
Introduction
Passenger transport in Gauteng’s city region is characteristic of all South African cities, where transport behaviour is tied to the sprawling urban spatial form and unsustainable land use patterns; the legacy of apartheid separating people from opportunities and thus entrenching the reliance on automobiles. Recent analysis commissioned by the Gauteng City Region Observatory (GCRO) shows that within the Gauteng city region, public transport is primarily used by low income groups, with public transport use dropping off significantly as income level rises, with high and middle income groups predominantly using private vehicles (Simpson et al., 2011). Public transport is also dominated by minibus taxis, while more efficient buses and trains do not hold a significant mode share in the region (Simpson et al., 2011).
Review of existing data sources
To quantify the greenhouse gas emissions associated with passenger transport in Gauteng and to investigate the impact of these usage trends by income band on GHG emissions, a number of studies and data sources were reviewed, including:
� Gauteng greenhouse gas inventory 2007 – 2009
� Gauteng 25 year integrated transport master plan (ITMP25)
� Gauteng 2011 Quality of Life (QoL) survey
� National household travel survey (NHTS) 2014
� Energy Research Centre (ERC) / SANEDI transport model
These data sources/models are summarised below, along with a note regarding whether or not it is possible to develop a picture of passenger kilometres and associated GHG emissions by income level based on these data sources.
PHO
TO: ELSA
BE GELD
ERBLO
M
8.1 Mt CO2 ANNUAL ESTIMATED
PASSENGER TRANSPORT EMISSIONS
IN GAUTENG

Greenhouse gas emissions from passenger transport in Gauteng | Page 3
Low Carbon Frameworks: Transport
Table 1: Data sources related to passenger transport for Gauteng
Study Brief description Potential for analysis by income level
Gauteng GHG inventory 2007-2009
The Gauteng GHG inventory is an outcome of the EnerKey project, which developed an integrated urban energy supply and demand energy strategy and greenhouse gas mitigation options for Gauteng (EnerKey, 2012). The TIMES-GEECO (Gauteng Energy and Emission Cost-Optimisation) energy model was used to calculate GHG emissions associated with energy demand and supply in the province. In the model, transport energy demand was determined for different transport modes and different end-user profiles. The eNATIS vehicle registration data for 2009 was used to determine the numbers and types of vehicles on the roads, and the 2003 National Household Travel Survey (DoT, 2003) was used for defining end-user profiles. Fuel sales statistics from SAPIA (South African Petroleum Industry Association) were used as a top-down calibration for the model.
All results from this model are aggregated across the province, and there is only an emissions breakdown for the different modes of transport for 2007. Hence no insights can be obtained from this study on emissions for different income groups.
ITMP25 The ITMP25 was commissioned by the Gauteng Department of Roads and Transport (DRT) in 2012. The purpose of ITMP25 was to update transport data for the province and to support medium to long-term transport regulation and planning, towards ultimately supporting the development of “...an efficient and integrated transport system that serves the public interest by enhancing mobility and delivering safe, secure and environmentally responsible transportation” (Gauteng DRT, 2013). The first phase of the ITMP25 was the development of the 5-year Gauteng Transport Implementation Plan (GTIP5), which was designed to address the need for short-term road network and public transport improvements (Gauteng DRT, 2012b; Gauteng DRT, 2012a). The GTIP5 identifies transport initiatives and projects for implementation by local municipalities in the short- to medium-term.The ITMP25 model is focused on longer term transport planning, and includes consideration of: spatial development and land use changes in terms of recent urban development and likely future changes; and demographic and economic forecasts, which includes consideration of current and likely future household income and employment.In addition to considering spatial plans, the ITMP25 study also considered an airports and aviation plan, as well as cross cutting transport system elements such as non-motorised transport (NMT), Intelligent Transport Systems (ITS) and sustainable (“green”) transport.
In terms of GHG emissions associated with transport in the province, the ITMP25 models four scenarios. GHG emission calculations were based on trip modelling done for the ITMP25, which is only for the 3-hour morning peak demand in Gauteng. While it is possible to extrapolate this peak to obtain whole day emissions, this was not the approach taken here.
2011 Quality of Life survey
The Gauteng City-Region Observatory (GCRO), founded in 2008, gathers data and utilizes the information to make comparisons to other city-regions worldwide, provides policy support to government and publishes academic work specific to the city-region’s development. The GCRO is a partnership between a number of tertiary education institutions including the University of Johannesburg (UJ), the University of the Witwatersrand (Wits) as well as the local and provincial government in Gauteng.
The Gauteng City Region Review for 2013 reports on transport trends in Gauteng. The data in this review is not sufficient for the requirements of disaggregated energy and GHG modelling, but can be used to calibrate the outputs of models.
NHTS 2014 The NHTS was conducted between January and March 2013 by Statistics South Africa (Stats SA) and the Department of Transport (DoT). Data was collected from a total of 51,341 households and/or dwelling units (StatsSA, 2014).
The findings in this report are representative of the national population and are reported on at provincial level. The data is disaggregated per income class, mode of travel and reason for travel. This survey represents the most recent and comprehensive travel data to date.
ERC/ SANEDI model
The Energy Research Centre (ERC) at the University of Cape Town developed a model (funded by SANEDI) for long-term projections (up to 2050) of energy demand and GHG emissions from the transport sector in South Africa (Merven et al., 2012). The model uses data on vehicles sales and annual vehicle mileage, as well as estimates of scrapping rates for each vehicle class and decay of mileage as the vehicles age to make the projections. The majority of the data is from 2006/2007, with data sources including eNATIS, the National Association of Automobile Manufacturers of South Africa (NAAMSA), the Department of Transport and SAPIA.
Although emission breakdown per income class and mode of transport is calculated in the model, this information is not reported explicitly for Gauteng province.
Page 4 | Greenhouse gas emissions from passenger transport in Gauteng
Low Carbon Frameworks: Transport
Methodology for assessing transport related GHG emissions per income band
The review of available data summarised above identified that no single study explicitly presents a detailed breakdown of passenger transport emissions disaggregated per income group. However, sufficient data is available from existing studies to calculate this breakdown. In particular, the NHTS provides sufficient information to develop a bottom-up estimate of passenger kilometres travelled in Gauteng, disaggregated by different transport modes and for household income quintiles. Relevant data in the NHTS includes:
� Population per province;
� Passenger transport numbers for education, work, business trips, and other travel;
� Trips disaggregated based on geographic location, income groups, and mode of travel;
� Modes of transport: Car (driver); Car (passenger); Taxi; Bus; Metrorail and Walking; and
� Additional information on travel times, walking time to motorised transport, and waiting times for transport.
To determine the GHG emissions associated with these trips, the main additional data and assumptions are:
� Additional modes for bus rapid transit (BRT) and the Gautrain were added based on the public transport trip fractions that these transport modes represented in the ITMP25. It was assumed that these modes would account for the same share of public transport as assumed in the ITMP25.
� Average travel times from the NHTS were used to estimate average distance travelled per trip, using the average speed of cars and buses obtained from the ERC/SANEDI transport model. Assumptions on travel speed for all other modes are presented in table below.
� Emission factors and occupancy for transport modes were mostly taken from the ITMP25 study. Only the emission factor for passenger cars was taken from the ERC/SANEDI transport model, as that of the ITMP25 did not correlate well with other studies (such as those of the Intergovernmental Panel on Climate Change and the Department for Environment, Food and Rural Affairs).
� The NHTS only supplies a modal breakdown for travel for the purposes of education and commuting to work. Travel for business trips and other purposes was disaggregated by mode based on the modal distribution per income bracket as for work travel.
� The bottom two income quintiles were assumed to never use the Gautrain and it was also assumed that the Gautrain is not used for travel to educational institutions or for short business travel (<20 km).
� For the BRT the assumption was made that it is not used for over-night trips, and also not for short business travel (<20 km).
Other assumptions are outlined in the table below.
Greenhouse gas emissions from passenger transport in Gauteng | Page 5
Low Carbon Frameworks: Transport
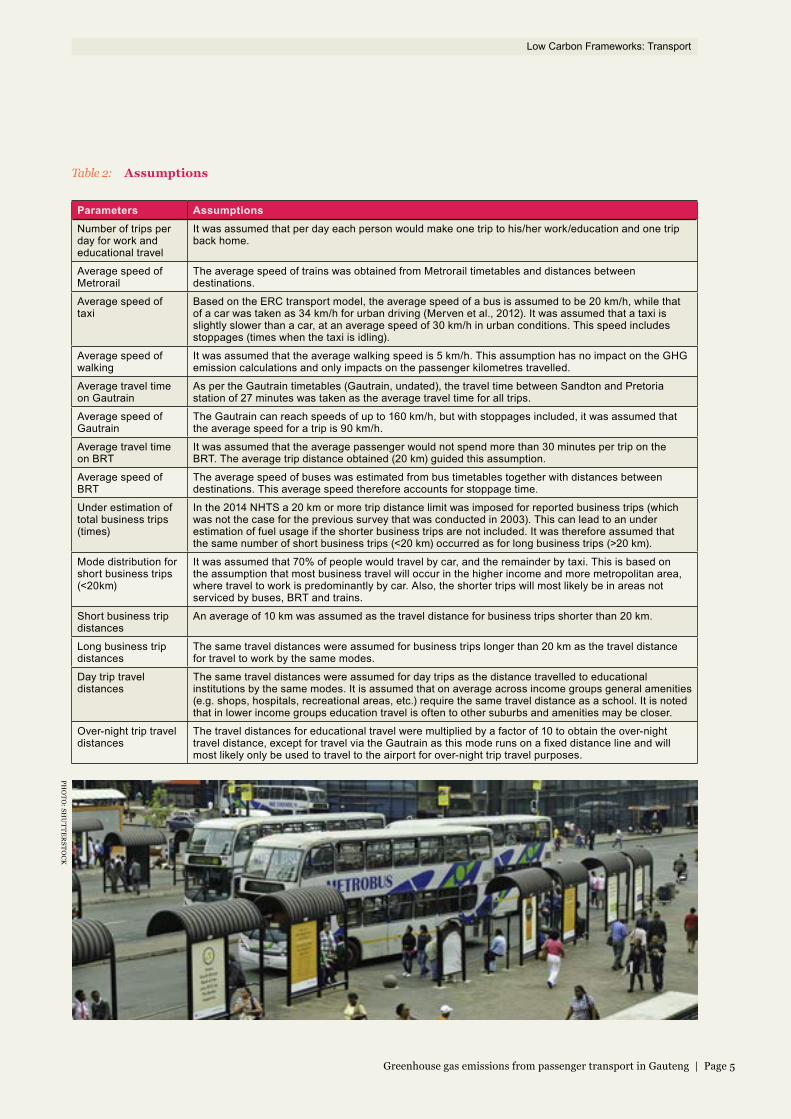
Table 2: Assumptions
Parameters AssumptionsNumber of trips per day for work and educational travel
It was assumed that per day each person would make one trip to his/her work/education and one trip back home.
Average speed of Metrorail
The average speed of trains was obtained from Metrorail timetables and distances between destinations.
Average speed of taxi
Based on the ERC transport model, the average speed of a bus is assumed to be 20 km/h, while that of a car was taken as 34 km/h for urban driving (Merven et al., 2012). It was assumed that a taxi is slightly slower than a car, at an average speed of 30 km/h in urban conditions. This speed includes stoppages (times when the taxi is idling).
Average speed of walking
It was assumed that the average walking speed is 5 km/h. This assumption has no impact on the GHG emission calculations and only impacts on the passenger kilometres travelled.
Average travel time on Gautrain
As per the Gautrain timetables (Gautrain, undated), the travel time between Sandton and Pretoria station of 27 minutes was taken as the average travel time for all trips.
Average speed of Gautrain
The Gautrain can reach speeds of up to 160 km/h, but with stoppages included, it was assumed that the average speed for a trip is 90 km/h.
Average travel time on BRT
It was assumed that the average passenger would not spend more than 30 minutes per trip on the BRT. The average trip distance obtained (20 km) guided this assumption.
Average speed of BRT
The average speed of buses was estimated from bus timetables together with distances between destinations. This average speed therefore accounts for stoppage time.
Under estimation of total business trips (times)
In the 2014 NHTS a 20 km or more trip distance limit was imposed for reported business trips (which was not the case for the previous survey that was conducted in 2003). This can lead to an under estimation of fuel usage if the shorter business trips are not included. It was therefore assumed that the same number of short business trips (<20 km) occurred as for long business trips (>20 km).
Mode distribution for short business trips (<20km)
It was assumed that 70% of people would travel by car, and the remainder by taxi. This is based on the assumption that most business travel will occur in the higher income and more metropolitan area, where travel to work is predominantly by car. Also, the shorter trips will most likely be in areas not serviced by buses, BRT and trains.
Short business trip distances
An average of 10 km was assumed as the travel distance for business trips shorter than 20 km.
Long business trip distances
The same travel distances were assumed for business trips longer than 20 km as the travel distance for travel to work by the same modes.
Day trip travel distances
The same travel distances were assumed for day trips as the distance travelled to educational institutions by the same modes. It is assumed that on average across income groups general amenities (e.g. shops, hospitals, recreational areas, etc.) require the same travel distance as a school. It is noted that in lower income groups education travel is often to other suburbs and amenities may be closer.
Over-night trip travel distances
The travel distances for educational travel were multiplied by a factor of 10 to obtain the over-night travel distance, except for travel via the Gautrain as this mode runs on a fixed distance line and will most likely only be used to travel to the airport for over-night trip travel purposes.
PHO
TO: SH
UTTER
STOCK

Page 6 | Greenhouse gas emissions from passenger transport in Gauteng
Low Carbon Frameworks: Transport
Outcomes of the modelling: passenger kilometres
A spreadsheet model was used to develop estimates of annual passenger kilometres for Gauteng at 86 billion1 in 2014. Almost half of this travel demand is undertaken by the richest fifth of the population as shown in the figure below, which breaks down this total in terms of income quintile and mode.
Figure 1 Total passenger Kilometres by quintile and mode for Gauteng
0
5000
10000
15000
20000
25000
30000
35000
40000 Car
Taxi
Metrorail
Bus
Gautrain
BRT
Quintile 5 (highest income)
Quintile 4Quintile 3Quintile 2Quintile 1 (lowest income)
PASS
ENGE
NER K
ILOME
TERS
(millio
ns)
While the GCRO observation that lower income groups use public transport more than private modes of transport is sound (see graph below), in absolute terms all modes of transport are used more by the highest income quintile. The exception is walking and other forms of non-motorised transport, which in relative and absolute terms is used more in lower income quintiles. This reflects the inequalities prevalent in South African society, with a likely correlation to unemployment.
The graph also reiterates the GCRO finding that the dominant public transport mode is taxis, which account for almost twice the number of passenger kilometres than all other public transport options combined. Furthermore, it shows that mode choice is relatively constant for the four lower income quintiles, but is dominated by private vehicle usage in the highest income quintile.
1 This is consistent with the estimates of national passenger kilometre demand as projected in the ERC transport mode scaled to Gauteng using population and transport user statistics provided in the NHTS.
PHO
TO: ELSA
BE GELD
ERBLO
M
8.4% OF SOUTH AFRICA’S DIRECT GREENHOUSE GAS EMISSIONS IN 2010 WAS CONTRIBUTED BY ENERGY USED IN TRANSPORTATION

Greenhouse gas emissions from passenger transport in Gauteng | Page 7
Low Carbon Frameworks: Transport
Figure 2 Mode choice by quintile
0
20%
40%
60%
80%
100% Car
Taxi
Metrorail
Bus
Gautrain
BRT
Walking
Quintile 5 (highest income)
Quintile 4Quintile 3Quintile 2Quintile 1 (lowest income)
MODE
CHOIC
E
Note: Data labels not shown for BRT or Gautrain modes (all less than or equal to 1%)
Given the relatively high transport demand of quintile 5, the overall passenger kilometres for Gauteng are also dominated by car travel, followed by taxis as shown in graph below.
Figure 3 Total passenger kilometers by mode for Gauteng
Car – 42.9%
Taxi – 33.8%
Metrorail – 9.6%
Bus – 8.8%
Gautrain – 0.4%
BRT – 0.3%
Walking – 4.0%
Note: 0% indicates values between 0% and 0.5%

Page 8 | Greenhouse gas emissions from passenger transport in Gauteng
Low Carbon Frameworks: Transport
Outcomes of the modelling: GHG emissions
In terms of greenhouse gas emissions, passenger transport emissions in Gauteng are estimated at 8.1 Mt CO2 per annum2. From the emission intensity values for the different transport modes given in the graph below it is evident that the emission intensity of cars is more than twice that of taxis and over three times larger than passenger rail. Buses are the most efficient mode of motorised transport in terms of GHG emissions. As a result, the emissions picture per income quintile largely follows that of passenger kilometres, but with even greater disparity between income groups, as shown in the graph “total GHG emissions by Quintile and mode for Gauteng’’ on the next page. Here, the highest quintile is responsible for almost 60% of passenger transport emissions, while nearly 70% of emissions are associated with private car travel, as is evident from the next graph ‘’ total GHG emissions by mode for Gauteng’’.
Figure 4 Emission intensities of passenger transport modes
0
0.50
0.100
0.150
0.200
CarTaxiMetrorail &Gautrain
Bus & BRTWalking
EMISS
IONS F
ACTO
R (KG
CO2/P
ASSE
NGER
.KM)
2 This figure is consistent with estimates of national passenger greenhouse gas emissions as projected in the ERC transport mode scaled to Gauteng using population and transport user statistics provided in the NHTS.
PHO
TO: ELSA
BE GELD
ERBLO
M

Greenhouse gas emissions from passenger transport in Gauteng | Page 9
Low Carbon Frameworks: Transport
Figure 5 Total GHG emissions by quintile and mode for Gauteng
0
5000
10000
15000
20000
25000
30000
35000
40000 Car
Taxi
Metrorail
Bus
Gautrain
BRT
Quintile 5 (highest income)
Quintile 4Quintile 3Quintile 2Quintile 1 (lowest income)
PASS
ENGE
NER K
ILOME
TERS
(millio
ns)
Figure 6 Total GHG emissions by mode for Gauteng
Car – 68.8%
Taxi – 22.8%
Metrorail – 4.7%
Bus – 3.2%
Gautrain – 0.2%
BRT – 0.1%
Note: 0% indicates values between 0% and 0.5%
To put the emissions in context, the graph ‘’Average Per capita passenger transport emissions per income quintile” presents the average per capita passenger transport emissions per income quintile together with an indicative level of direct per capita emissions considered necessary to fulfil “basic transport needs” of just over 200 kg CO2 per capita (Chakravary et al., 2009). This indicative level equates to a person travelling a total of 15 km per day split equally between the following modes: a two-
Page 10 | Greenhouse gas emissions from passenger transport in Gauteng
Low Carbon Frameworks: Transport
wheeler, a bus and a (high occupancy) shared car (Chakravary et al., 2009). Implicit in this level is the assumption of a sustainable urban system, where all opportunities requiring transport fall within an average 7.5 km radius and public transport is available and accessible. This assumption does not necessarily hold at present for South African cities, where people are located far away from their places of work. Thus, this figure is likely an underestimate of the emissions currently required to fulfil basic transport needs in the current South African context. However, assuming the mode split as above and increasing the average trip distance from 15 km per day to 28 km per day (as taken from the model developed for this work) yields a basic transport needs emissions of roughly 750 kg CO2
per capita in South Africa.
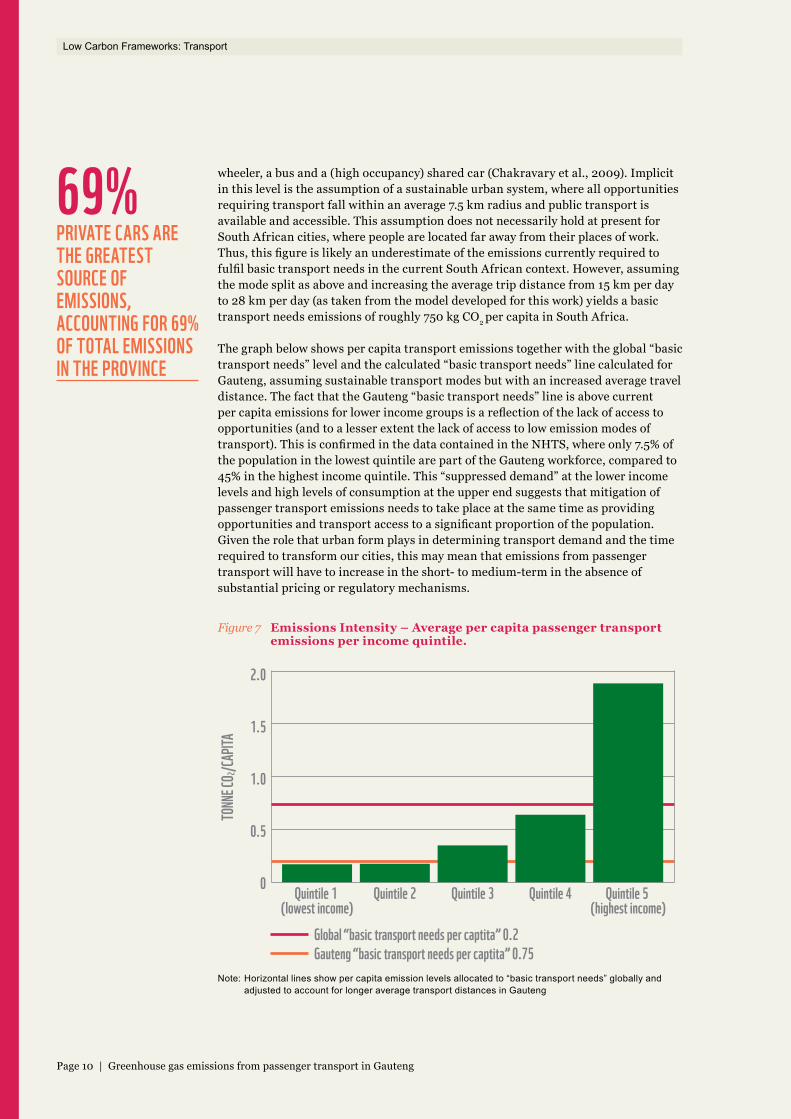
The graph below shows per capita transport emissions together with the global “basic transport needs” level and the calculated “basic transport needs” line calculated for Gauteng, assuming sustainable transport modes but with an increased average travel distance. The fact that the Gauteng “basic transport needs” line is above current per capita emissions for lower income groups is a reflection of the lack of access to opportunities (and to a lesser extent the lack of access to low emission modes of transport). This is confirmed in the data contained in the NHTS, where only 7.5% of the population in the lowest quintile are part of the Gauteng workforce, compared to 45% in the highest income quintile. This “suppressed demand” at the lower income levels and high levels of consumption at the upper end suggests that mitigation of passenger transport emissions needs to take place at the same time as providing opportunities and transport access to a significant proportion of the population. Given the role that urban form plays in determining transport demand and the time required to transform our cities, this may mean that emissions from passenger transport will have to increase in the short- to medium-term in the absence of substantial pricing or regulatory mechanisms.
Figure 7 Emissions Intensity – Average per capita passenger transport emissions per income quintile.
0
0.5
1.0
1.5
2.0
Quintile 5 (highest income)
Quintile 4Quintile 3Quintile 2Quintile 1 (lowest income)
TONN
E CO 2/
CAPIT
A
Global “basic transport needs per captita” 0.2Gauteng “basic transport needs per captita” 0.75
Note: Horizontal lines show per capita emission levels allocated to “basic transport needs” globally and adjusted to account for longer average transport distances in Gauteng
69%PRIVATE CARS ARE THE GREATEST SOURCE OF EMISSIONS, ACCOUNTING FOR 69% OF TOTAL EMISSIONS IN THE PROVINCE

Greenhouse gas emissions from passenger transport in Gauteng | Page 11
Low Carbon Frameworks: Transport
Summary
The analysis presented in this paper provides an indication of the transport demand and greenhouse gas emissions in Gauteng Province, disaggregated per income band, based on available information. The analysis indicates the large discrepancy between the highest and lowest income quintiles in terms of kilometres driven, private car usage and greenhouse gas emissions, which is as would be expected. Private cars are the greatest source of emissions, accounting for 69% of total emissions in the Province. In terms of greenhouse gas mitigation from the sector, therefore, it is clear that mitigation efforts should be focussed on the highest income quintiles, and in particular shifting away from private car usage. At the same time, it needs to be recognised that emissions from the lowest income quintiles may need to grow as opportunities are created and basic transport needs are met.
Further publications in the WWF low carbon frameworks series include those that document mitigation interventions available to the passenger sector to reduce greenhouse gas emissions, address greenhouse gas mitigation in the freight sector and present a series of low carbon transport case studies from around the world. To download these publications go to http://www.wwf.org.za/what_we_do/transport/.
ReferencesChakravary, S., Chikkatur, A., de Coninck, H., Pacala, S., Socolow, R. and Tavoni, M. (2009) Supporting information for: One Billion High Emitters: A New Approach for Sharing Global CO2 Emission Reductions. Proceedings of the National Academy of Sciences of the United States of America, 106(29), pp.11884-88.DEA (2013) GHG Inventory for South Africa: 2000 - 2010. [Online] Pretoria: Department of Environmental Affairs Available at: https://www.environment.gov.za/sites/default/files/docs/greenhousegas_invetorysouthafrica.pdf [Accessed June 2015].DoT (2003) The first South African National Household Travel Survey. [Online] Pretoria: Department of Transport Available at: https://www.arrivealive.co.za/document/household.pdf [Accessed June 2015].EnerKey (2012) Energy related GHG inventory and energy balance Gauteng: 2007-2009. [Online] Stuttgart: University of Stuttgart Available at: http://www.enerkey.info/index.php/News/gauteng-ghg-inventory-2007-2009.html [Accessed June 2015].
Gauteng DRT (2012a) Media Statements. [Online] Available at: http://www.gautengonline.gov.za/MediaStatements/Pages/Gautengsnew5-yearTransportPlan.aspx [Accessed 16 April 2014].Gauteng DRT (2012b) Gauteng 25-Year Integrated Transport Master Plan, 5-Year Transport Implementation Plan. [Online] Available at: http://www.itmp25.gpg.gov.za/documents/Part-A-5-Year-Implementation-Plan.pdf [Accessed June 2015].Gauteng DRT (2013) Gauteng 25-Year Integrated Transport Master Plan. [Online] Available at: http://www.itmp25.gpg.gov.za/documents/ITMP25-Main-Report-Final-Draft-1-13-Nov13.pdf [Accessed June 2015].Gautrain (undated) Route Map. [Online] Available at: http://join.gautrain.co.za/map.aspx [Accessed 17 April 2014].Merven, B., Stone, A., Hughes, A. and Cohen, B. (2012) Quantifying the energy needs of the transport sector for South Africa: A bottom-up model. [Online] Cape Town: SANEDI Available at: http://www.erc.uct.ac.za/sites/default/files/image_tool/images/119/Papers-2012/12-Merven-etal_Quantifying_energy_needs_transport%20sector.pdf [Accessed July 2016].Onderwater, P. (2012) Make Metrorail Work Better: Dutch measures for Durban MetroRail. [Online] Pretoria: Document Transformation Technologies cc Available at: http://repository.up.ac.za/handle/2263/20030 [Accessed June 2015].
Republic of South Africa (2011) National Climate Change Response White Paper. [Online] Available at: https://www.environment.gov.za/sites/default/files/legislations/national_climatechange_response_whitepaper.pdf [Accessed July 2016].SEA (2015) State of Energy in South African Cities. [Online] Sustainable Energy Africa Available at: http://www.sustainable.org.za/uploads/resources/resource_25.pdf [Accessed September 2015].Simpson, Z., McKay, T., Patel, N., Sithole, A., van den Berg, R. and Chipp, K. (2011) Past and present travel patterns in the Gauteng City-Region. [Online] Report commissioned by the Gauteng City Region Observatory Available at: http://www.uj.ac.za/EN/Faculties/science/departments/geography/research/rgtp/Documents/PAST%20AND%20PRESENT%20TRAVEL%20PATTERNS%20IN%20THE%20GAUTENG%20CITY-REGION.pdf [Accessed June 2015].StatsSA (2014) National Household Travel Survey February to March 2013 [Statistical Release P0320]. [Online] Pretoria: Statistics South Africa Available at: http://www.statssa.gov.za/publications/P0320/P03202013.pdf [Accessed June 2015].
PHO
TO: SH
UTTER
STOCK

LOW CARBON FRAMEWORKS: TRANSPORT
This publication is funded by The Green Trust, a partnership between WWF and Nedbank.
100%RECYCLED
WWF.ORG.ZA
Commissioned by WWF South Africa from The Green House.
The Green House authorsDr Yvonne Lewis, AB van der Merwe and Dr Brett Cohen
Reviewed by Dr Lisa Kane
To download this publication, visit:www.wwf.org.za/passenger_ghg
For WWF South Africa:Head: Policy and Futures UnitSaliem Fakiremail: [email protected]: +27-21-657 6600
DesignFarm Designwww.farmdesign.co.za
DisclaimersThe professional advice of The Green House contained in this report is prepared for the exclusive use of WWF South Africa and for the purposes specified in the report. The report is supplied in good faith and reflects the knowledge, expertise and experience of the consultants involved. The report must not be published, quoted or disseminated to any other party without appropriately referencing The Green House as authors of the work. The Green House accepts no responsibility for any loss occasioned by any person acting or refraining from action as a result of reliance on the report, other than the addressee.
In conducting the analysis in the report The Green House has endeavoured to use the best information available at the date of writing, including information supplied by the client. The Green House’s approach is to develop analyses from first principles, on the basis of logic and available knowledge. Unless stated otherwise, The Green House does not warrant the accuracy of any forecast or prediction in the report. Although The Green House exercises reasonable care when making forecasts and predictions, factors such as future market behaviour are uncertain and cannot be forecast or predicted reliably.
CopyleftYou are welcome to quote the information in this paper provided that you acknowledge the source as follows: Greenhouse Gas Emissions Mitigation Opportunities and Measures in Passenger Transport, commissioned by WWF South Africa from The Green House, published 2016. If you would like to share copies of this paper, please do so in this printed or electronic PDF format.
This is one in a series of publications produced by WWF South Africa’s Transport Low-Carbon Frameworks programme. Other publications in the series include those that document transport greenhouse gas emissions in Gauteng by income band, address greenhouse gas mitigation in the freight sector, and present a series of low carbon transport case studies from around the world. To download these publications go to http://www.wwf.org.za/what_we_do/transport/.
The transport project aims to provide a platform, expertise and perspectives to support labour, business and government in engaging with the challenges implicit in the shift to a low-carbon economy. Consideration is given to the three tiers of interventions which will be required to effect the transition of this sector, being to reduce movement of goods and people, shift to low-carbon modes of transport, from private to public, from road to rail, and improve mobility services, and energy and fuel efficiency. We seek solutions for emitting fewer greenhouse gas emissions and enabling a flourishing South Africa, which delivers developmental outcomes and social equity, located within the context of South Africa’s economic geography.
WWF
WWF South Africa’s Policy and Futures Unit undertakes enquiry into the possibility of a new economy that advances a sustainable future. The unit convenes, investigates, demonstrates and articulates for policymakers, industry and other players the importance of lateral and long term systemic thinking. The work of the unit is oriented towards solutions for the future of food, water, power and transport, against the backdrop of climate change, urbanisation and regional dynamics. The overarching aim is to promote and support a managed transition to a resilient future for South Africa’s people and environment. The organisation also focuses on natural resources in the areas of marine, freshwater, land, species and agriculture.
www.wwf.org.za
The Green House
The Green House is a technical sustainability consulting firm with experience working on a wide range of energy, carbon and sustainability-related projects, including strategic energy planning, carbon footprinting, and life cycle assessment. The Green House has significant experience in energy, transport, urban systems, bioenergy, biofuels, industry, commerce, agriculture, municipal waste management, mining and minerals.
www.tgh.co.za