Legal Restrictions on Physician Ownership of Non...
34
Legal Restrictions on Physician Ownership of Non-Physician Medical Services BRIAN K. CHEN PAUL J. GERTLER CHUN-YUH YANG November 7, 2010 Preliminary: Do not Quote Abstract Self-referrals, or the practice of referring patients to an entity in which physicians have a financial interest, give physicians an incentive to order more medical services than necessary. Laws such as the federal Stark Law and its state equivalents have been passed to control perceived abuses of physician self-referrals, but these laws often provide “safe harbor” exceptions that permit physicians to continue making profitable self-referrals. One such exception, the “in-office ancillary services” exemption, is commonly held responsible for the dramatic growth of diagnostic and imaging services furnished within physician offices. Using comprehensive claims data from Taiwan, we investigate the impact of a prohibition against self referrals with an “in-office services- like” exception, and find that: (1) the “in-office” exemption allows physicians to circumvent the policy and continue to induce demand for prescription drugs; (2) physicians who cannot circumvent the policy using the exemption reduce drug prescription but induce demand for diagnostic tests instead; and (3) the exception changes the organization of primary care clinics, with the great majority of physicians choosing to vertically integrate pharmacists into clinics to escape the self-referrals prohibition. These results have important implications for Stark Law and the continued application of the “in-office ancillary services” exception. * This paper has benefited from comments and suggestions made by Catherine Wolfram, Steve Tadelis, and John Morgan. This study is based in part on data from the National Health Insurance Research Database provided by the Bureau of National Health Insurance, Department of Health and managed by National Health Research Institutes. The interpretation and conclusions contained herein do not necessarily represent those of Bureau of National Health Insurance, Department of Health or National Health Research Institutes.
-
Upload
trinhkhanh -
Category
Documents
-
view
219 -
download
0
Transcript of Legal Restrictions on Physician Ownership of Non...
Legal Restrictions on Physician Ownership of Non-Physician Medical Services
BRIAN K. CHEN PAUL J. GERTLER CHUN-YUH YANG
November 7, 2010
Preliminary: Do not Quote
Abstract
Self-referrals, or the practice of referring patients to an entity in which physicians have a financial interest, give physicians an incentive to order more medical services than necessary. Laws such as the federal Stark Law and its state equivalents have been passed to control perceived abuses of physician self-referrals, but these laws often provide “safe harbor” exceptions that permit physicians to continue making profitable self-referrals. One such exception, the “in-office ancillary services” exemption, is commonly held responsible for the dramatic growth of diagnostic and imaging services furnished within physician offices. Using comprehensive claims data from Taiwan, we investigate the impact of a prohibition against self referrals with an “in-office services-like” exception, and find that: (1) the “in-office” exemption allows physicians to circumvent the policy and continue to induce demand for prescription drugs; (2) physicians who cannot circumvent the policy using the exemption reduce drug prescription but induce demand for diagnostic tests instead; and (3) the exception changes the organization of primary care clinics, with the great majority of physicians choosing to vertically integrate pharmacists into clinics to escape the self-referrals prohibition. These results have important implications for Stark Law and the continued application of the “in-office ancillary services” exception.
* This paper has benefited from comments and suggestions made by Catherine Wolfram, Steve Tadelis, and John Morgan. This study is based in part on data from the National Health Insurance Research Database provided by the Bureau of National Health Insurance, Department of Health and managed by National Health Research Institutes. The interpretation and conclusions contained herein do not necessarily represent those of Bureau of National Health Insurance, Department of Health or National Health Research Institutes.
1
I. Introduction
Physician ownership of ancillary medical service facilities such as diagnostic clinical
laboratories and imaging centers (i.e. x-rays, CAT scans and MRIs) has the potential to lead to
costly and inefficient over-provision of care. The provision of medical care typically involves a
physician who combines her time and effort with ancillary medical services to diagnose and treat
her patients. In most cases, insurance plans pay for physician and ancillary services separately.
Therefore, while physicians choose what ancillary medical services are to be inputs into the
production of medical care, they do not bear the cost of these inputs. However, Physicians do
stand to gain financially by referring patients to an ancillary entity in which the physician has a
financial interest. And patients, who rely on their physicians for medical advice, have little
incentive to reject the referred treatment when insurance covers most of the cost.
To combat these perceived “self referral” abuses, the U.S. Congress passed the Stark Law1
in 1989 amended it in 1993 and 2007 to prohibit physician referrals of Medicare and Medicaid
patients to ancillary care facilities in which the physicians or members of the physician’s group
have a financial interest.2 However, the Stark Law has a “safe harbor” exception that allows
physicians to escape regulatory prohibition if the self-referral for ancillary services is made
within physician offices to a “bona fide employee.” More generally, the Stark Law draws a
distinction between permissible referrals made within a vertically integrated firm and
impermissible referrals made to outside entities. Presumably, the Law takes into account
potential economies of scope from the integration of services within a single entity. However,
this exception allows physicians to circumvent the intent of the Stark law by vertically
integrating ancillary services such as laboratory and imaging services directly into their practices.
There is concern that the vertical integration exception has rendered the Stark Law
ineffective in limiting the costly overtreatment of patients. Medicare spending for imaging
1 42 U.S.C.S. §1395nn in §1877 of the Social Security Act. Additional regulations can be found at 42 C.F.R. §411.350 through §411.389 2 The list of ancillary services covered under the Stark Law include clinical laboratory services; physical therapy services; occupational therapy services; radiology services, including magnetic resonance imaging, computerized axial tomography scans, and ultrasound services; radiation therapy services and supplies; durable medical equipment and supplies; parenteral and enteral nutrients, equipment, and supplies; prosthetics, orthotics, and prosthetic devices and supplies; home health services; outpatient prescription drugs; inpatient and outpatient hospital services.
2
services more than doubled from $6.89 billion to $14.11 billion annually between 2000 and
2006 – a 13% per annum average increase. And over two-thirds of the spending occurred in
physician office settings.3 This suggests that physicians may have been able to bypass the intent
of the Stark Law by taking advantage of the exemption allowing them to provide onsite ancillary
medical services. It also may explain the massive integration of ancillary services into physician
groups in the last two decades (A Tynan et al., 2008). From 2000 to 2006, the share of Medicare
Part B spending on imaging services furnished within physician offices rose from 58% to 64%,
and that 27% of physicians expanded in-office ancillary services.4 These concerns have led the
Medicare Patient Advisory Commission (MedPAC) to recommend extensive changes5 to the in-
office ancillary services exception to the Stark Law.
In this paper, we examine these issues using data generated from the quasi-experimental
introduction of a Stark-type policy in Taiwan prohibiting physician from owning pharmacies and
dispensing drugs unless they had an onsite pharmacist. Specifically, we examine the extent to
which the Taiwanese policy reduced over prescription, the extent to which physicians responded
by increasing the use of services not covered by the policy, and the extent to which the policy
lead to physicians hiring in-house pharmacist employees to circumvent the intent of the National
Health Insurance Bureau.
We estimate that policy reduced drug expenditures by 26 percent among physicians that
did not have an onsite pharmacist. However, these physicians responded by increasing the
overprovision of other services not covered by the policy, thereby reducing the effectiveness of
the policy on reducing overtreatment in general. In addition, many of the physician groups
(clinics) among those that did not have an onsite physician group prior to the policy, hired onsite
pharmacists subsequent to the implementation of the policy, thereby substantially mitigating its
3 Medicare: Trends in Fees, Utilization, Expenditures for Imaging Services before and after Implementation of the Deficit Reduction Act of 2005, GAO-08-1102R, September 26, 2008. 4 Medicare Part B Imaging Services: Rapid Growth and Shift to Physician Offices Indicate Need for CMS to Consider Additional Management Practices, GAO-08-452, June 2008. See also “MedPAC Seeks to Further Stop In-Office Imaging Incentives,” HealthImaging.com, June 21, 2010, http://www.healthimaging.com/index.php?option=com_articles&view=article&id=22832:medpac-seeks-to-further-stop-in-office-imaging-incentives, accessed July 12, 2010. 5 MedPAC is considering three proposals: (1) Total exclusion from in-office exception, (2) exclusion unless a more stringent requirement for clinical integration is satisfied; (3) payment accuracy that better reflects the costs of providing the diagnostic and imaging services. Further, as part of the Patient Protection and Affordable Care Act of 2010, the Center for Medicare/Medicaid Services recommended, in a June, 2010 Report to Congress, that physicians who make self-referrals must disclose their financial interests to patients.
3
effectiveness. Specifically, 41% of the clinics that did not have a pharmacist prior to the policy
vertically integrated after the policy. Overall, after vertical integration, the policy only applied to
only 17% of clinics providing care to 10% of patients.
Our work makes several significant contributions to the literature. First, to our knowledge
one, this is one of the first to establish a causal role of self-referral incentives in the
overprovision of ancillary medical care services. Virtually all of the empirical work to date
produced cross-sectional correlations that are suggestive of the overtreatment hypothesis. A
number of studies show that patients who receive care at a physician’s office with onsite imaging
services are more likely to receive imaging services as patients at an office without onsite
services.6 These types of correlations have subsequently been replicated in the context of
physician-owned physical therapy offices (J. M. Mitchell and T. R. Sass, 1995) and physician-
owned specialty hospitals (J. M. Mitchell, 2005). Secondly, no study to our knowledge has
examined the effect allowing physicians to vertically integrate to escape regulatory scrutiny.
Our work also informs policy in a number of specific ways. First, policymakers are correct
to be concerned about physicians referring patients to an entity in which they have a financial
interest because of the potential for overtreatment. However, prohibiting self-referrals may lead
physicians to increase the quantity of a related service, particularly when no limit is placed on
the other discretionary service. Finally, the bright-line “bona fide employee” or “in office
ancillary services” exception may be misguided when the referring physicians derive profits
from the referral of patients to the employee of an integrated practice. In other words, providing
safe harbor exceptions may ultimately void the very purpose of the original prohibition as
physicians exploit these loopholes to continue to engage in profitable self-referrals. This study
empirically validates that “an in-office” exemption not only facilitates overutilization of medical
care, it also has a profound impact on the industrial organization of health care services.
The remainder of this paper is set up as follows: In Section II, we draw upon a physician
utility maximization model to provide the theoretical framework to generate testable hypotheses
for our empirical investigation; in Section Error! Reference source not found., we outline the
major features of the health care system in Taiwan and the details of the anti-self-referrals policy
(known as the “separating policy”); in Section Error! Reference source not found., we
6 For example see Childs and Hunter (1972), Strasser et al (1987), Hillman et al (1990), Hillman et al (1992), Aronovitz (1994), Hillman et al (1995), Gazelle et al (2007), and Mitchell (2008).
4
describe the data and methodology that we use to answer our research questions; in Section V.C,
we discuss the effects of the policy on drug and non-drug expenditures; in Section VI, we report
the effect of the policy on clinics’ decision to integrate and on their post-policy expenditures; and
in Section Error! Reference source not found., we conclude and highlight open questions for
future research.
II. Conceptual Framework Our theoretical framework draws from a rich literature that analyzes the impact of fee
changes on physician treatment decisions7. We model the Stark Law-like prohibition against
self-referrals in a price-regulated industry as a fee reduction. The prohibition against self-
referrals reduced physician fees from ancillary services referrals to zero for physicians working
in clinics without onsite ancillary services. However, this fee reduction did not apply to
physicians in clinics with onsite ancillary services. We use this framework to model the effect of
the policy on the use of ancillary services covered by the law, other medical services exempt
from the law, and the decision to vertically integrate by providing ancillary services onsite.
Following Gruber and Owings (1996) we construct a model that permits physicians to gain
income from over-treating patient paying the cost in terms of disutility. Specifically, we assume
that the physician’s utility function is , where Y denotes income and I is the degree
of the overtreatment of patients. Overtreatment is defined as providing more clinical services
than is medically necessary, including the provision of ancillary medical care. We assume that
utility is increasing in income and decreasing in overtreatment. Physicians can increase their
income by over-treating patients at the cost of some disutility.
We assume that the physician provides two types of clinical services to patients. The first
consists of services that are subject to the Stark Law-like prohibition and the second includes all
other services that are not subject to the policy. For ease of exposition and to be consistent with
the empirical case, we will define drug prescriptions as the service subject to the prohibition. The
policy then prohibits physicians to make profits from filling drug prescriptions unless they have
an onsite pharmacist.
7 For example see Evan (1974), Fuchs (1978), McGuire and Pauly (1991), Gruber and Owings (1996), Gazelle et al., (2007), and Mitchell (2008).
5
We assume, as is the case for the main Medicare program and most Medicaid programs,
that both types of services are paid on a fee for service basis8. We can then write the physician’s
income as
(1)
where N is the number of patients she sees, m1 and m2 are the physician’s profit margins of the
services, x1 and x2 are the quantities of the respective services provided, which depend on i1 and
i2 – the levels of overtreatment for these services.
If the physician provides the clinically appropriate level of treatment, then the level of
overtreatment is zero. We assume that the physician provides at least the clinically appropriate
level of treatment and that the quantities x1 and x2 are increasing in the level of over-treatment.
Finally, we assume that patients are fully insured so that they bear none of the cost of treatment
out of pocket, and therefore follow the instructions of their physicians without question.
The physician chooses the degree of overtreatment to maximize utility subject to the
constraints that overtreatment is weakly positive. Assuming an interior solution, the first order
conditions:
(2)
The physician chooses the amount of overtreatment of service 1 and service 2 so that the
marginal income from overtreatment of each service is equal to the marginal disutility cost from
total overtreatment – i.e. the sum of the overprovision of service 1 and service 2.
We define service 1 to be drug prescriptions that are subject to the prohibition and service
2 to be an aggregate of all other clinical services not subject to the policy. Consider the
implications of the implementation of the Stark Law-like prohibition policy for clinics without
an onsite pharmacy. The policy reduces the physician’s income from filling drug prescriptions to
zero. In this case, the physician will prescribe only the amount of drugs needed and
overprovision of service 1 will fall to zero. However, the physician will increase the over-
8 Medicare and most Medicaid programs pay physicians and ancillary providers fee for service. However, many private insurers pay physicians a capitated payment for beneficiary care. A large number of Medicare and Medicaid beneficiaries are also enrolled in Medicare HMOs where physicians are also paid on a capitated basis. However, in the majority of these cases, ancillary services continue to be paid on a fee for service basis. Our model easily extends to these cases. Our model does not apply to cases where ancillary services are covered in the capitation rate such as fully integrated systems like Kaiser.
6
provision of service 2 from which she still makes a positive return until the marginal income
from the overtreatment of service 2 equals the marginal disutility cost from the overprovision of
service 2.
Physicians with an onsite pharmacist are de jure exempt from the application of the law
and there should be not impact of the policy on the overprovision of drugs. Therefore, one option
for those that do not have onsite pharmacy is for them to legally circumvent the prohibition
policy by hiring a pharmacist. However, hiring a pharmacist requires paying the fixed costs that
include salary, space and equipment. A physician (or physician group) will choose to vertically
integrate if the profits from hiring a pharmacist are larger than without. The income generated
from hiring a pharmacist is , where F is the fixed cost of hiring a
pharmacist and is the optimal overprovision of service s from the first order conditions in
equations (1). The income generated without a pharmacist is where is the
utility-maximizing overprovision of service 2 when the law is in force. In this case the physician
does not have to pay the fixed cost, but cannot charge for service 1.
Then a physician will hire a pharmacist if
(3)
Equation (3) shows that a physician will hire a pharmacist if the difference in additional profit
from overtreatment with an onsite pharmacist is larger than the fixed costs of hiring the
pharmacist. More importantly, the larger the number of patients, the more likely that hiring a
pharmacist will be profitable.
In other words, physicians need to have sufficient scale to be able to cover the fixed costs.
Specifically, the physician will hire an onsite pharmacist if
, (4)
or if the number of patients is larger than the fixed cost divided by the per-patient additional
profit from hiring an onsite pharmacist. The larger the fixed costs and the lower the return to
overprovision, the larger the number of patients required to make vertical integration profitable.
The model provides us with a number of empirically testable predictions. First, the model
predicts that the prohibition policy will reduce drug prescriptions by physicians in clinics that do
not have a pharmacist on site. One can interpret the reduction as the degree of over-prescription
7
of drugs due to the perverse financial incentives inherent in self-referrals. Second, the policy will
increase the over-provision of other services. This implies that any efficiency gains from
reducing unnecessary drug prescriptions will be at least partially offset by increases in other
services. Third, physicians working in groups (clinics) with a pharmacist on site will be
unaffected by the law, providing us with a placebo test of our identification strategy. Fourth,
physician clinics without a pharmacist on site prior to the policy have an incentive to vertically
integrate (i.e. hire an onsite pharmacist) to circumvent the prohibition. However, only clinics that
have sufficient patient volume will be able to cover the fixed costs of having pharmacist will
choose to vertically integrate. This implies that the policy will only have an impact on small
clinics. Moreover, it provides us with a plausible instrument for vertical integration after the
policy. Finally, smaller clinics may consolidate with other clinics to achieve sufficient scale to as
to be able to cover the fixed costs of hiring a pharmacist and thereby profit from pharmacy self-
referrals.
The policy implications of these hypotheses are quite important. First, the degree to which
the policy reduces costs and improves the efficiency of health care services depends on the
extent to which physicians increase the over-provision of other services not covered by the
policy and the extent to which physicians find it profitable to vertically to get around the
prohibition. In addition, the extensive vertical integration in which physician groups are
purchasing outpatient surgical centers, diagnostic imaging centers, and other ancillary medical
services maybe causing large inefficient increases in medical care expenditures in the US and
other countries with similar health care systems. Finally, physician groups may be consolidating
into larger groups in order to be able to afford the fixed costs of the direct provision of ancillary
medical services in order to circumvent the intent of the Stark Law.
III. Institutional Context Taiwan is composed of a collection of islands off the southeastern Chinese coast with a
total population of approximately twenty three million. At the beginning of the study period in
1997, Taiwan already boasted an advanced market economy with a per capita GDP of
US$14,200 (purchasing power parity).9 Taiwan’s health indicators were on par with OECD
9 CIA World Factbook (1997), http://www.umsl.edu/services/govdocs/wofact97/country-frame.html, accessed
September 21, 2010
8
nations: Life expectancy in Taiwan in 1998 was 72 for men and 78 for women, with an infant
mortality rate of 6.14 per 1,000 live births.10 Taiwan’s health care infrastructure was also
comparable to that of many OECD countries, with 5.7 hospital beds per 1,000 people and 8.7
medical professionals per 1,000 (Lu, 2003). By 2007, total health expenditures represented 6.3%
of Taiwan’s GDP, of which 21% consisted of prescription drug expenditures
Taiwan’s health care system is modeled after Canada’s national health insurance program. It
is publicly financed through a payroll tax on all employees, with medical care being delivered
through a mixture of private and public providers. Taiwan’s National Health Insurance provides
for a comprehensive package of medical services that include almost all aspects of in- and out-
patient care (including prescription medication and diagnostic services), dental care, traditional
Chinese medicine, and home nurse visits. Patients in Taiwan are given complete freedom of
choice as to providers.
Virtually all health care providers in Taiwan are under contract with the National Health
Insurance Bureau (NHIB), and are paid on a fee-for-service basis. (Tsung-Mei Cheng, 2003).
The NHIB pays physicians on a fee-for-service basis according to a standardized schedule,
which includes a per-visit consultation fee, a per-test fee for diagnostic tests, a per-prescription
fee for the service of dispensing drugs, and or the sale (dispensing) of drugs. NHIB reimburses
both physicians and pharmacies the same standard formulary price for dispensing drugs.
However, pharmacies and physician groups are able to procure the drugs directly from
manufacturers at a much lower cost than the NHI formulary prices (Karen Eggleston, 2009). As
a result, medical providers reap handsome profits from the sale of drugs, creating a powerful
financial incentive for physicians to overprescribe medication.
In 1997, facing rapidly rising prescription drug expenditures, Taiwan instituted a “Stark
Law” like policy designed to separate physicians’ diagnosis and treatment decisions from the
financial incentive to prescribe drugs (Y. J. Chou et al., 2003). Prior to 1997, Taiwan’s
physicians, like those in many other East Asian nations, dispensed the drugs that they prescribed
to their patients directly out of their offices (Adam Wagstaff, 2007). This “separating” policy
prevented clinics from dispensing drugs directly from onsite physician-owned pharmacies and
allowed patients to fill their prescriptions at outside independent pharmacies. However, there
were a number of exceptions to this rule. First, like the Stark-Law, clinics that had an onsite
10 Index China.com, http://www.index-china.com/index-english/taiwan-f.htm, accessed September 21, 2010.
9
pharmacist were allowed to continue to dispense drugs from a physician-owned onsite pharmacy.
Second, all clinics were allowed dispense drugs from an onsite pharmacy to children, the elderly,
or for acute medical conditions for which quick dispensing of drugs is important.
While the separating policy reduced physician income from dispensing drugs, the policy
did try to partially compensate them for this loss in two ways. The NHIB increased the drug
prescription fee and the per-visit consultation fee paid to physicians working on clinics without
and onsite pharmacist.
The separating policy was rolled out on a geographical basis over the course of four years,
beginning on March 1, 1997 (Appendix Table A1). Before enforcing the policy in a jurisdiction,
the NHIB had to ascertain that there were sufficient numbers of independent pharmacies where
patients could fill their prescriptions. Jurisdictions became subject to the policy as soon as the
NHIB determined there were at least 1 independent pharmacy for every 500 residents.
IV. Data and Descriptive Evidence
We use data provided by Taiwan’s National Health Research Institute, which maintains an
uncensored population of all medical claims filed with the National Health Insurance Bureau.
Our data consists of a 0.2 percent random sample of claims from 1997 to 2004. The data include
all outpatient visit claims to clinics, all outpatient ancillary services ordered during these office
visits including drugs, and all prescription medications filled.11
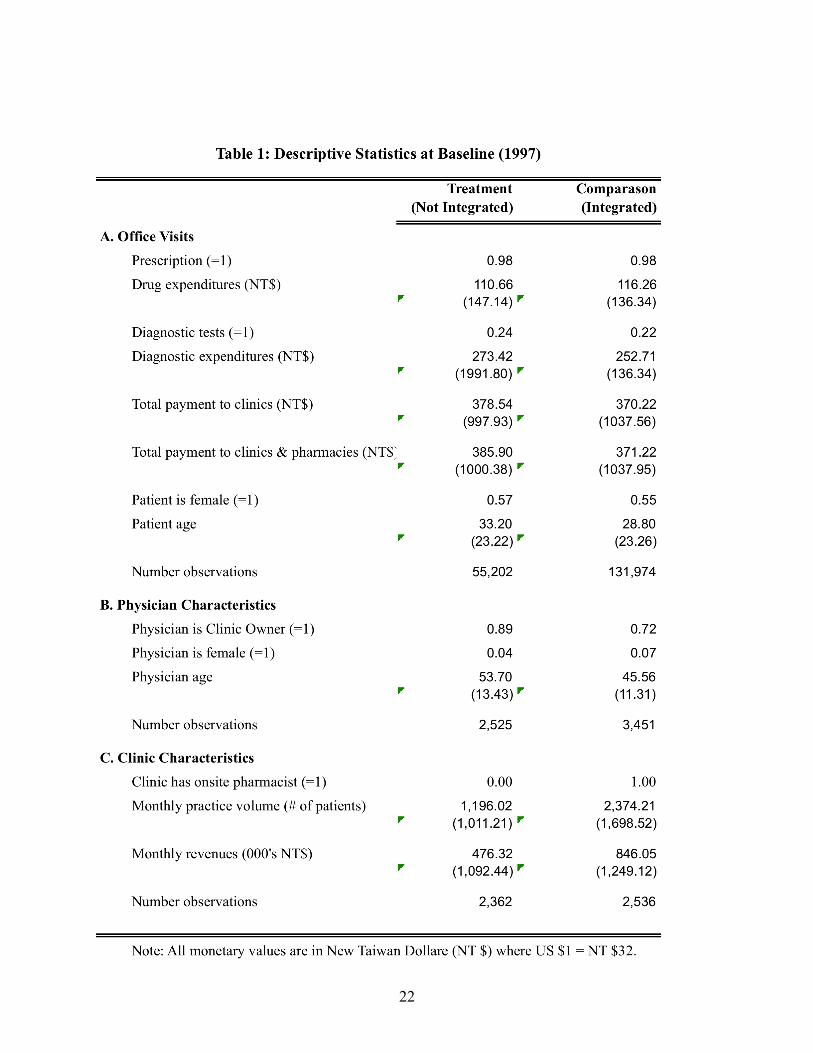
Table 1 provides descriptive statistics of the variables used in the analysis at baseline
(1997) and at endline (2004). We disaggregate the statistics by clinics that were and were not
subject to the separating policy. Specifically, the data are presented separately for clinics that did
not have an onsite pharmacist at baseline and (Not Integrated) and for those clinics that did have
an onsite pharmacist (Integrated) at baseline. The fist panel in Table 2 reported characteristics of
office visits, while the second and third reports characteristics at the physician and clinic level,
respectively.
At baseline prior to the implementation of the policy, 52 percent of clinics providing
services to 58 percent of patients had an onsite pharmacist and where therefore exempt from the
11 The separating policy was implemented at the village level. However, data provide geographic identification information only at the less-fine township level that includes multiple villages. Hence, we drop all observations (approximately 25% of the data) of clinics located in townships with mixed implementation dates.

10
policy. Hence the policy could at best have an impact on less than half of patient care due to the
exemption. The clinics that did not have a pharmacist onsite (Not Integrated) were substantially
smaller in terms practice volume (number of visits) and revenues than those clnics the who were
exempt from the policy because they had an onsite pharmacist at baseline (Integrated). Despite
this, office visits to clinics with and without an onsite pharmacist are similar at baseline. The
total cost of a visit is NT$ 386 in clinics without a pharmacist compared to NT$ 370 in clinics
with a pharmacist. Almost all patients receive drug prescriptions during every office visit, with
the average drug expenditure is about NT$ 111 in clinics without pharmacists compared to NT$
116 with pharmacists. Similarly, 24 percent and 22 percent of patients have diagnostic tests in
clinics without and with pharmacists, respectively, and the associated diagnostic expenditures are
NT$ 273 and NT$ 253, respectively.
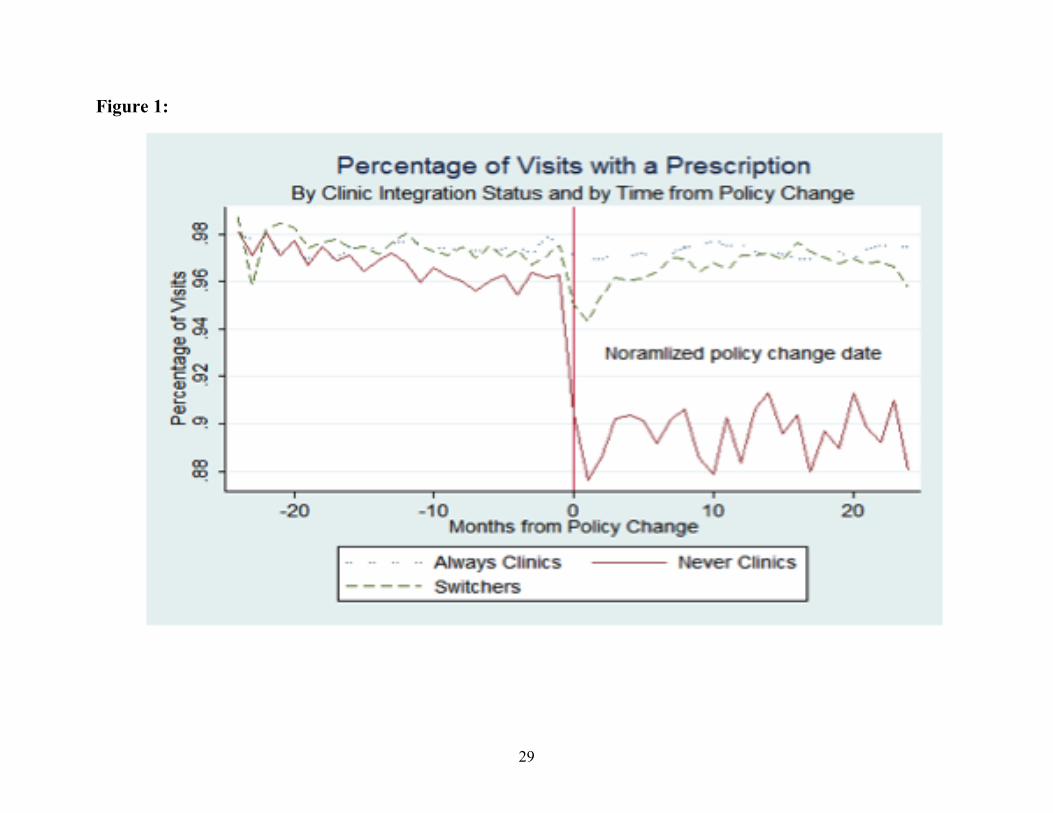
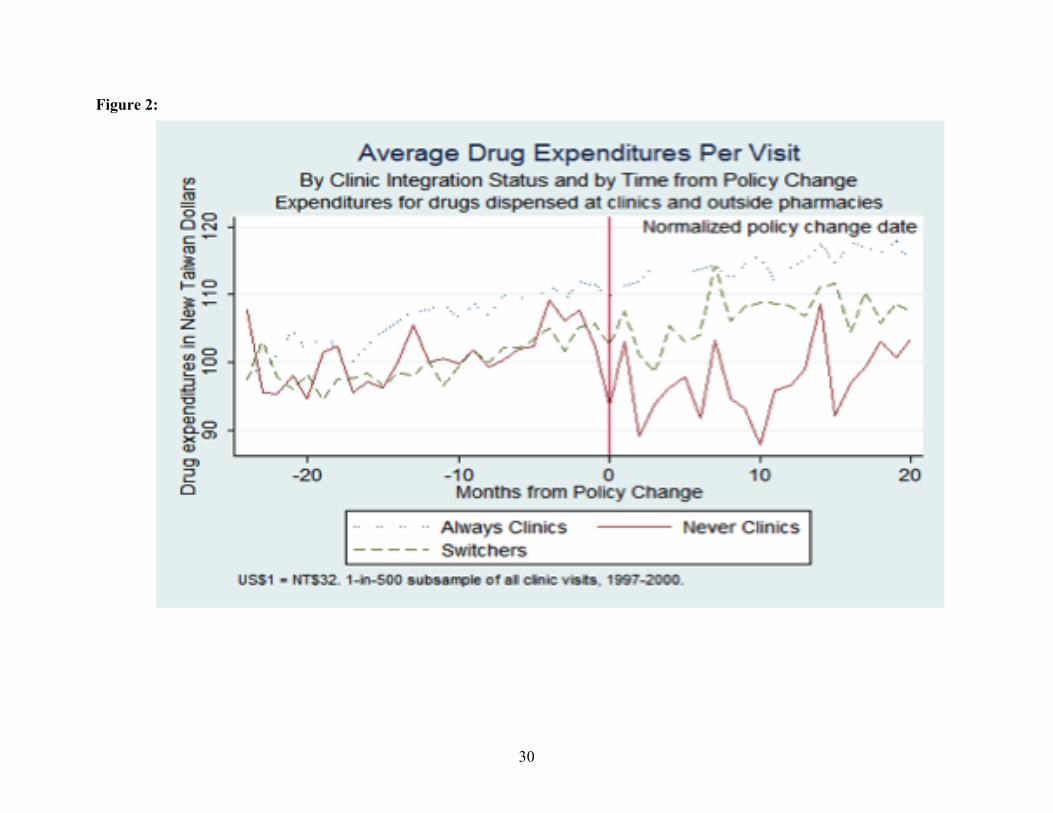
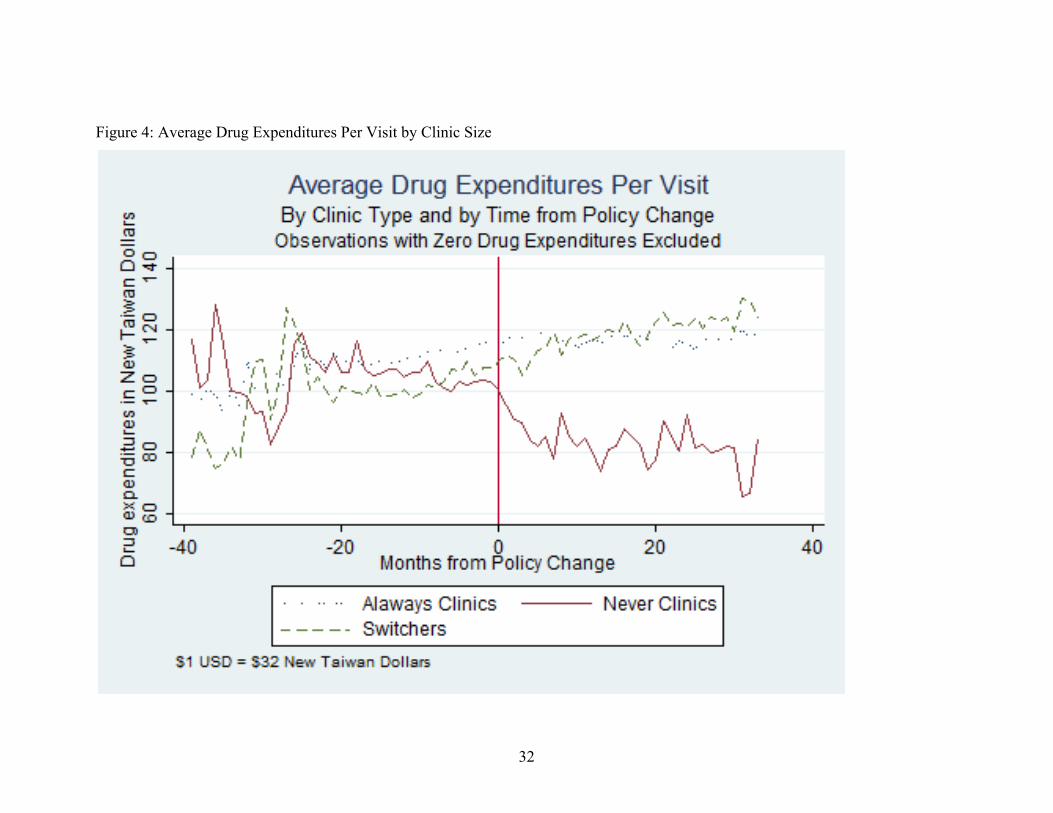
The descriptive patterns patterns displayed in Figures 1 and 2 are consistent with the basic
theoretical predications – that the policy should reduce drug prescription expenditures and
increase diagnostic expenditures. Figures 1 and 2 plot the share of visits that receive drug
prescriptions and the average drug expenditure per visit over time. We plot these averages for
three types of physicians: those that never had an onsite pharmacist, those that had an onsite
pharmacist prior to the implementation of the policy, and those that did not have an onsite
pharmacist prior to the policy but hired one after the implementation of the policy in their
community. The data are plotted over time centered at zero in the month in which the separating
policy became effective in the jurisdiction in which in which the clinic is located. Hence, zero on
the horizontal axis refers to the period in which the policy was implemented in the physician’s
community, observations to the right of zero refer to the number of quarters post implementation,
and observations to the left refer to quarters prior to implementation.
Prior to the implementation of the separating policy, the levels and trends of drug
prescriptions are similar for all 3 types of clinics. However, after the implementation of the
policy, drug prescriptions fall in clinics that did not have an onsite pharmacist prior to the policy
and did not hire one after the policy – i.e. did not integrate. However, drug prescriptions in
clinics that had onsite pharmacist prior to policy or hired one subsequent to the policy continued
on trend after the implementation of the policy.
11
V. Reduced-Form Effects
In this section we estimate the reduced-form impact of the implementation of the
separating policy on drug prescription expenditures, ancillary services expenditures and total
expenditures for visits to clinics that did not have a pharmacist onsite at baseline prior to the
implementation of the separating policy. The estimated effect is reduced form in the sense that it
is an average of the effects on visits to clinics that choose to and choose not to vertically
integrate by hiring an onsite pharmacist in reaction to the policy. In the next section, we unpack
the reduced form impact of the policy explicitly taking into account the vertical integration
decision.
V.A. Identification Strategy We would, in principle, like to compare expenditures for patients whose physicians were
subject to the separating policy to the counterfactual—i.e. expenditures for the same patients if
their physicians were not subject to the separating policy. Since we do not have a controlled
randomized experiment to estimate the counterfactual, we turn to a difference in differences
approach that controls for many of the types of (unobservable) characteristics that may confound
identification vary across physicians, but are fixed over time.
Difference-in-differences models compare the change in outcomes in the treatment group
to the change in outcomes in the comparison group. By comparing changes, we control for
observed and unobserved time-invariant characteristics at the physician level as well as time-
varying factors common to both comparison and treatment physicians that might be
simultaneously correlated with the separating policy and with medical care expenditures. The
change in the comparison group is an estimate of the true counterfactual – that is, what would
have happened to the treatment group if there were no intervention. Another way to state this is
that the change in outcomes in the treatment group controls for fixed characteristics and the
change in outcomes in the comparison group controls for time-varying factors that are common
to both comparison and treatment groups.
Our treatment group is the set of visits to clinics that did not have an onsite pharmacist at
baseline and hence were subject to the separating policy. Our comparison group is the set of
visits to physicians who had onsite pharmacists at baseline and therefore were not subject to the
separating policy. The advantage of this control group is that they are located in the same
12
communities as the treatment group allowing us to better control for time-varying factors that
may have been introduced contemporaneously with the introduction of the separating policy and
are correlated with drug and diagnostic expenditures. Examples include the introduction of new
local health policies, differential economic growth, and differing changes in the epidemiological
environment.
The differences in differences model can be specified in regression form as:
€
yijkt = α j + γ ktvkqt + δ l Xill∑ + βTjkt +ε it (5)
where
• yijkt is the dependent variable (e.g. drug or other ancillary expenditures) for patient i who
is treated by physician j living in community k in period t;
• αj is a fixed effect for physician j;
• γkt is a fixed effect for community k in time period t;
• qt is a dummy variable that takes on the value 1 in period t;
• vt is a dummy variable that takes on the value 1 for community k;
• xil is a vector of individual characteristics including age, sex and 65 indicators of the
patient’s illness diagnosis;
• Tikt is an indicator that takes on the value 1 when the patient is treated in clinic j that did
not have an onsite pharmacist at baseline in a community k in period t after the separating
policy has been implemented; and
• εit is a zero mean random error.
The coefficient β is the difference and difference estimate of the effect of the policy on
drug expenditures and nondrug ancillary expenditures. The inclusion of fixed effects controls for
unobserved heterogeneity between physicians, between treatment regimes for different diseases,
and for factors that change over time but are common to both treatment and comparison groups
within each community. We also control for patient age and gender to account for potentially
different treatments based on these characteristics. The standard errors are clusters at the
community level to account for correlation in the error term across patients and over time.
V.B. Comparison group validity A concern with this comparison group is that the clinics without an onsite pharmacist at
baseline are substantially smaller than clinics with an onsite pharmacist at baseline (Table 1), and
13
that this difference in clinic size could be related to the outcomes of interest. However, the key
outcome variables -- probability that a patient is prescribed drugs, drug expenditures, the
probability of having diagnostic tests, diagnostic test expenditures, and total costs -- are on
average equal for the treatment and comparison groups at baseline (Table 1). Moreover, the
physician fixed effects should control for this type of heterogeneity bias to the extent that these
differences in the characteristics of the groups are fixed over time.
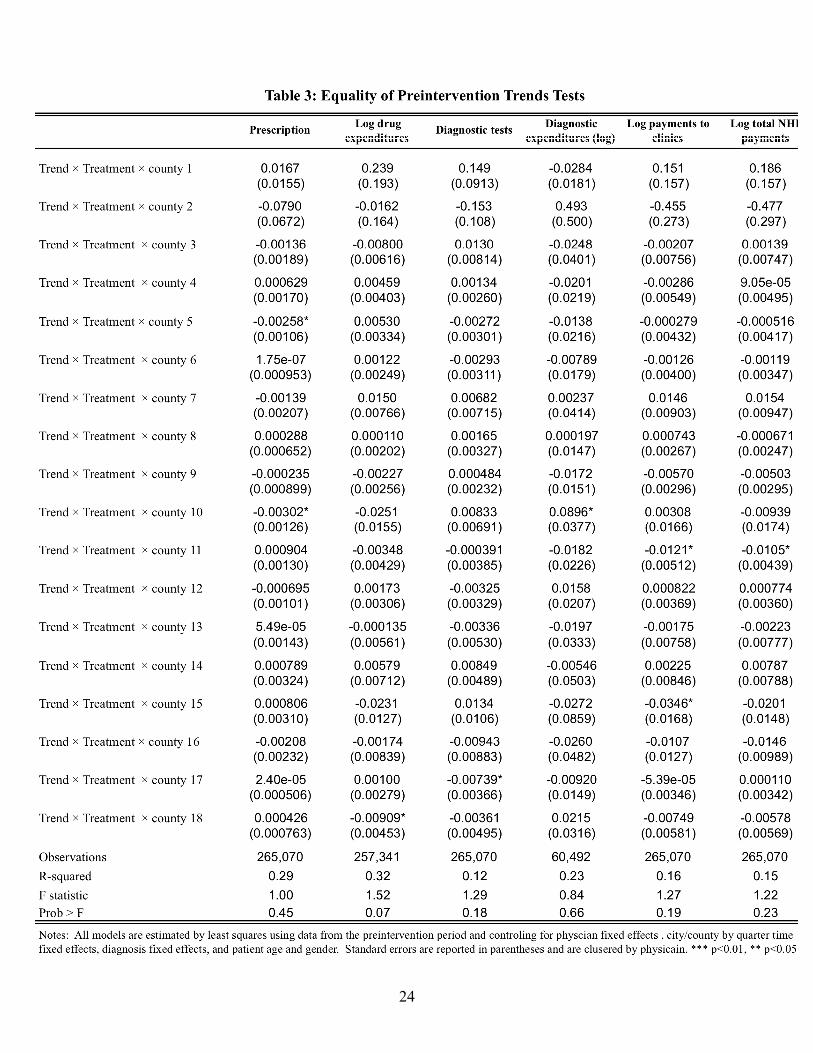
A second potential challenge to the causal interpretation of our results is the change in the
control group is not a valid estimate of what the change in the treatment group would have been
without the introduction of the separating policy. While we cannot directly test this assumption,
we can employ the Heckman-Hotz test (Heckman and Hotz 1995) that asks whether the pre-
intervention trends of the treatment group are different than those of the control group. If they
are not different, there would be no reason to assume that they would be different in the post
period without the intervention.
We implement the test by dropping all post-policy observations from our sample, and
running the following model:
€
yijkt = α j + γ ktvkqt + λkvkTjTrendt + δ l Xill∑ +ε it (6)
where Tj is a dummy variable indicating whether the physician will be in the treatment group in
the post period, Trendt is a continuous time variable indicating quarter, and all variables are as
defined for equation (5). The coefficients of interest are the λk’s on the interaction terms
consisting of the community, treatment dummy and time trend. If these are jointly zero, then we
reject the hypothesis that the pre-intervention trends are different for the treatment and control
groups. We estimate equation (6) for each of the dependent variables. The F-statistics for the
hypothesis that all of the coefficient interaction terms are jointly zero cannot be rejected at
conventional significance levels (Table 3).
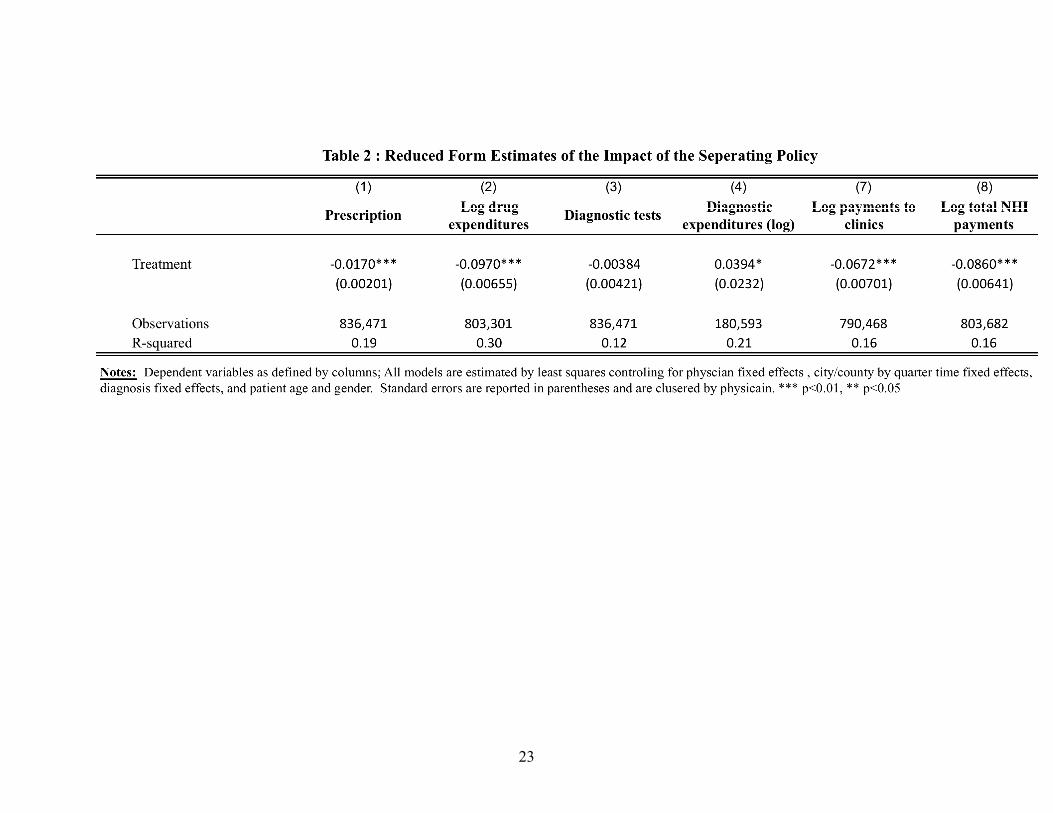
V.C. Results The estimation results for equation (5) are presented in Table 2 and are consistent with our
theoretical predictions, After the separating policy, physicians reduced the likelihood of
prescription by 1.7 percent and reduced the amount of drugs prescribed (expenditures) by close
to 9.7 percent. However, physicians did compensate by increasing diagnostic tests. While the
probability of having a diagnostic test unaffected, the average expenditures on diagnostic tests
14
increased by 3.9 percent. Overall, the policy reduced payments to physicians who were not
integrated at baseline by close to 6.7 percent and overall health care costs for patients cared for
by this group of physicians by about 8.6 percent. However, the law only applied to physicians
who at did not have an onsite pharmacist. Since these physicians provided 42 percent of care (i.e.
patients who visited clinics that were not integrated at baseline), the overall effect on reducing
total expenditures is estimated to be a 4.2 percent in total costs of care.
V.D. Patient Sorting An alternative that might confound the causal interpretation of the result is that there could
have been patient sorting, i.e. healthier patients who required less drugs switched to the treatment
physicians as a results of the policy. While we directly control for patient age, sex and diagnosis,
there could have been some changes in unobservable patient severity of illness within diagnosis
categories or with a higher preference for drugs. For example, if patients with a greater demand
for prescription drugs switch from clinics with no onsite pharmacists to vertically integrated
clinics, there would be a spurious correlation between a fall in prescribing behavior at “never”
clinics and the separating policy.
We address this concern first by noting that the separating policy does not impose any
additional cost on physicians who wish to prescribe drugs to satisfy patient demand. The policy
merely removes the financial incentive on the supply side to overprescribe drugs. Thus, the only
difference to the patients who seek medical care at clinics with no onsite pharmacists is that they
must fill their prescription at an outside pharmacy rather than at the clinic itself. Generally,
however, these outside pharmacies tend to be in close proximity to the clinics.
Using a 200,000 patient panel data set, we also examine actual patient behavior before and
after the separating policy becomes effective in their area. Of the 200,000 randomly selected
individuals for whom we possess their entire medical history from 1997 to 2004, 155,343
individuals sought care at a clinic at least once between January 1, 1997 and December 31, 2000.
On average, these patients seek medical care eleven times per year. Of these, 347 actually
switched from consistently patronizing clinics without an onsite pharmacist before the policy to
visiting clinics with an onsite pharmacist after the change. The extremely small population of
patients who switched demonstrates that patient self-selection is of limited concern.
15
VI. Vertical Integration
Like the Stark Law, Taiwan’s separating policy provides “safe harbor” exceptions that
allow physicians to escape regulatory prohibition if the self-referral is made within physician
offices and/or to a “bona fide employee.” In fact, a large number of clinic that did not have a
pharmacist onsite prior to the policy, appeared to take advantage of this loophole and hired one
shortly thereafter. Specifically, 45 percent of these clinics were vertically integrated by 2000
(Table 1). In this section we investigate the effect of the Law on vertical integration.
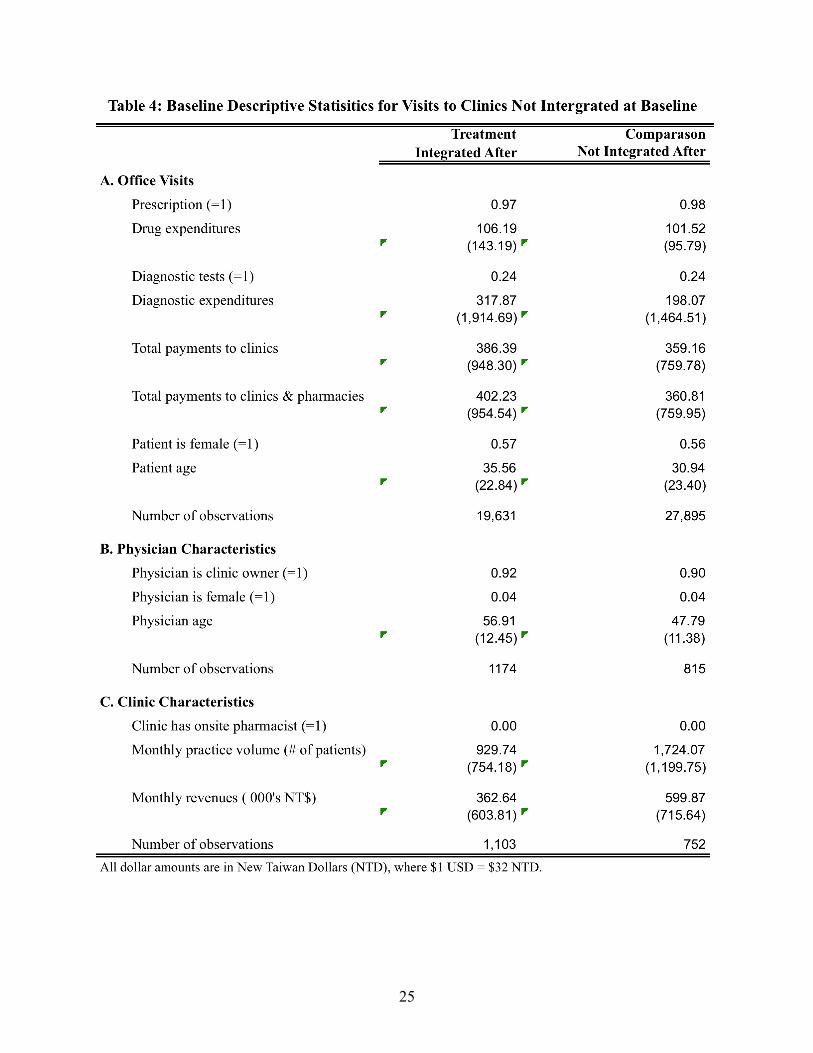
In this section, we analyze the integration decision using the sample of clinics that were
not integrated at baseline. Table 4 provides descriptive statistics for the sample of patient visits to
clinics that were not integrated at baseline split by those that integrated and those did not after
the implementation of the policy. In our conceptual framework, we hypothesize that the clinic
will exploit this exception if their practice has sufficient scale for the profits from self-referrals to
exceed the cost of hiring a pharmacist. In other words, clinics with a sufficiently large patient
base (practice volume) will be more likely than smaller clinics to hire a pharmacist and
circumvent the application of the separating policy. In fact, clinics that integrated had patient
volumes double to those that did not. Despite the difference in size, patient care appeared to be
about the same in both types of groups at baseline in terms of average drug, diagnostic and total
expenditures.
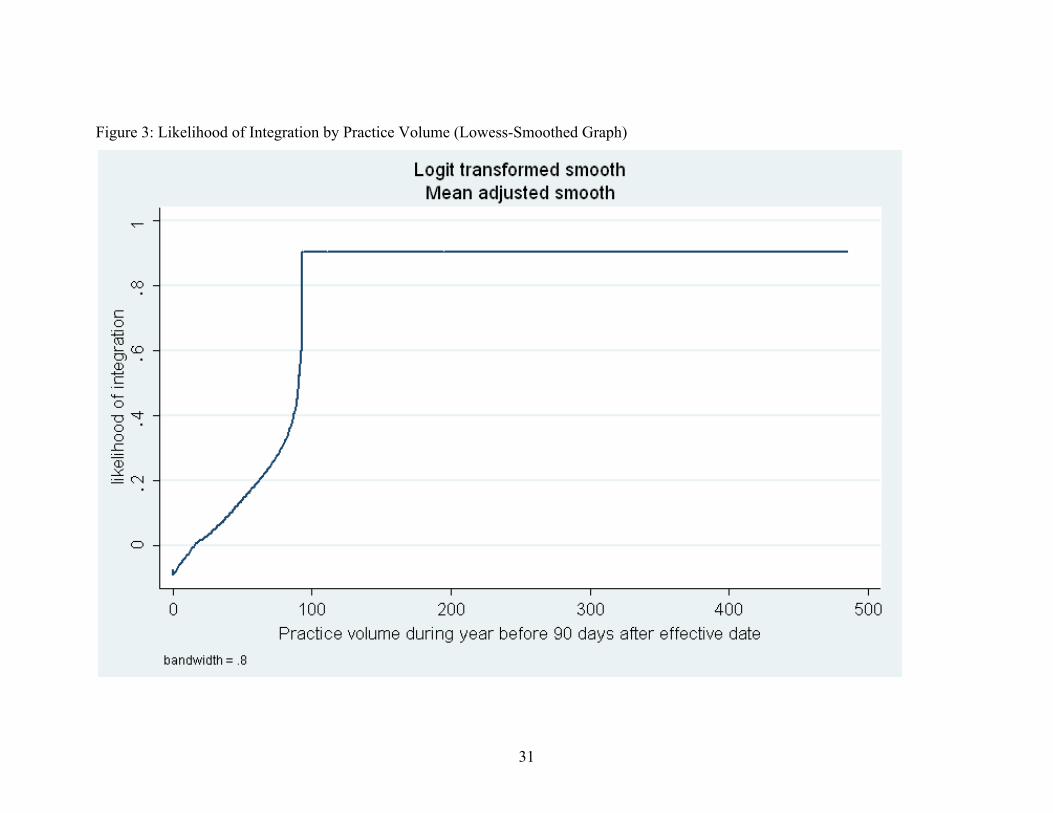
The relationship between the decision to integrate and baseline clinic size is size is
displayed in Figure 3. We plot the share of clinics that have an onsite pharmacist over time with
the horizontal axis re-centered at zero – the year in which the separating policy became effective
community in which the clinic is located. We plot this relationship for three groups based on
baseline practice volume (i.e. number of patient visits to the clinic in the baseline year). We
consider 3 groups: small – those with practice volumes less than the median, medium – those
with practice volume between the median and the 75th percentile, and large – those with practice
volume greater than the 75th percentile. We show the high degree of correlation between
baseline practice volume and post-policy integration status. The probability of is effectively zero
up until the separating policy becomes effective and increases dramatically shortly thereafter
with larger increases for the medium and large clinics.
16
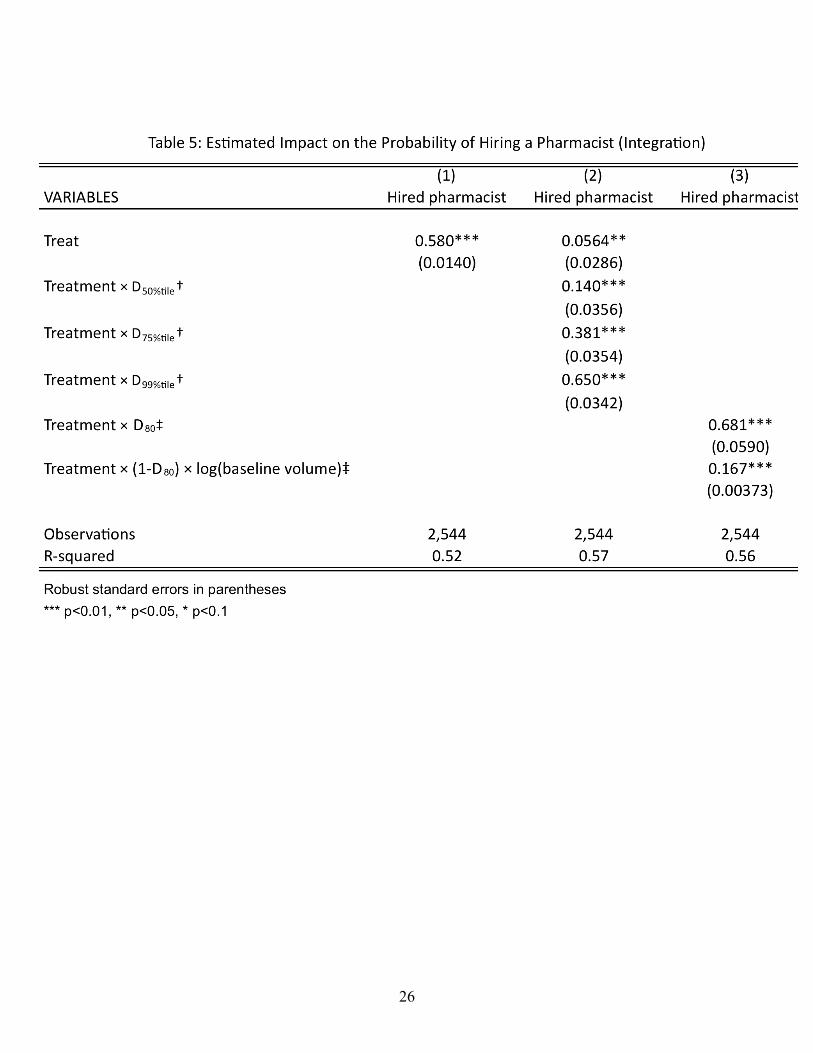
Finally, we use the sample of clinics that were not integrated at baseline to estimate the
effect of the policy on integration using a difference in difference approach. In this case, we take
advantage of the fact the separating policy phased in geographically over time. Hence, our
treatment group is the set of clinic in jurisdictions that was phased in early and our comparison
group is the set of clinics in jurisdiction that were phased in later. Specifically, we estimate the
following specification:
€
I jkt = α j + γ t + βTkt +ε jkt (7)
where Ijkt takes on the value 1 if clinic j in community k has an onsite pharmacist in period t; αj is
a fixed effect for clinic j, γt is a fixed effect for period t, Tkt is an indicator of whether
community k was subject to the policy in period t, and εjkt is a random error. The coefficient β
is the difference in difference effect of the impact of the policy on integration.
The results are presented in Table 5. The first model estimates that separating policy
increased the probability that a clinic hired a pharmacist by 58 percentage points. In the second
model with interact the treatment effect by dummies for clinic practice volume at baseline. We
find the effect of the separating policy on integration grows substantially the larger baseline
practice volume.
VII. Restricting Ownership with Endogenous Integration
We now turn to estimating the effect of the policy on physician behavior taking into
account the integration decision. Specifically we are interesting in estimating the effect on
physician treatment decisions in clinic that chose not to integrate and those that did chose to
integrate. We take two approaches to identification. The first is a triple difference in differences
strategy that assumes that the decision to integrate was based purely on fixed characteristics at
the time the implementation of the separating policy. The second is an instrumental variables
fixed effects approach that uses baseline practice volume as an instrument for integration and
allows for time varying factors the influence the integration decision as well.
17
VII.A. Triple difference identification strategy
We adjust the difference in difference specification in (5) to allow the effect of the
separating policy to differ depending on whether the clinic chooses to integrate or not. Hence,
we rewrite (6) as follows
€
yijkt = α j + γ ktvkqtt∑ + δ l Xill
∑ + βTjkt + φTjktPharm jt +δPharm jt +ε it (8)
where Pharmjt is an indicator that equals 1 if clinic j has an onsite pharmacist in period t. This
specification differs from (5) by added terms for whether the clinic has a pharmacist and
pharmacist interacted with treatment. The coefficient on pharmacist times treatment, φ, estimates
the difference in the effect of the policy on visits to clinics with onsite pharmacists and visits to
clinics without onsite pharmacists. The effect of the policy on visits to clinics that integrated is
therefore β + φ.
In practice, the main effect of pharmacist is not identified separately from the fixed effect.
This because the all of the clinics that had an onsite pharmacist at baseline continue to do so
through the whole sample period and almost all of those that did not have an onsite pharmacist at
baseline did not add one until after the separating policy was implemented in the jurisdiction in
which the clinic is located.
The specification is (6) identifies the effect of the separating policy on clinics that choose
to integrate separately from the effect of the policy on clinics that did not integrate using a triple
difference in difference strategy. Specifically, we compare the difference in difference estimate
of the impact of the policy on clinics that did not integrate to the difference in difference estimate
of the impact on clinics that did integrate.
VII.A.1. Comparison group validity
The treatment groups is the visits to clinics not integrated at baseline who hired a
pharmacist post intervention and the comparison group is the visits to clinics not integrated at
baseline who did not hire a pharmacist post intervention. We can see from Table 3, which
presented the descriptive statistics for these two groups, that there is no difference in the means
of the outcome variables at baseline for these two groups. This suggests that the comparison
group is likely to be a valid comparison.
18
The identifying assumption is that the change in clinics that did not integrate is an
unbiased estimate of the counterfactual, i.e. what would have been expenditures if the clinics that
hired onsite pharmacists had not integrated. One can see in Figures 1 and 2 that the pre-
intervention trends as well as levels are equal for these two groups for drug expenditures.
Moreover, after the separating policy is introductions, drug expenditures for visits to clinics that
did not integrate fall relative to drug expenditures for visits to clinics that did integrate.
Again, while we cannot directly test this assumption, we can test to see if the pre-
intervention trends are the same for the treatment and comparison group by using the pre-
intervention observations to estimate the following equation a version of (6) for equation (8):
€
yijkt = α j + γ ktvkqtt∑ + λkTrendtPharm j + δ l Xill
∑ +ε it (9)
where Pharmj is a dummy variable that takes on the value 1 if the clinic hires a pharmacist in the
post intervention period and the rest of the variables are defined as in equation (6). The results
show that there is no difference in the pre-intervention trends.
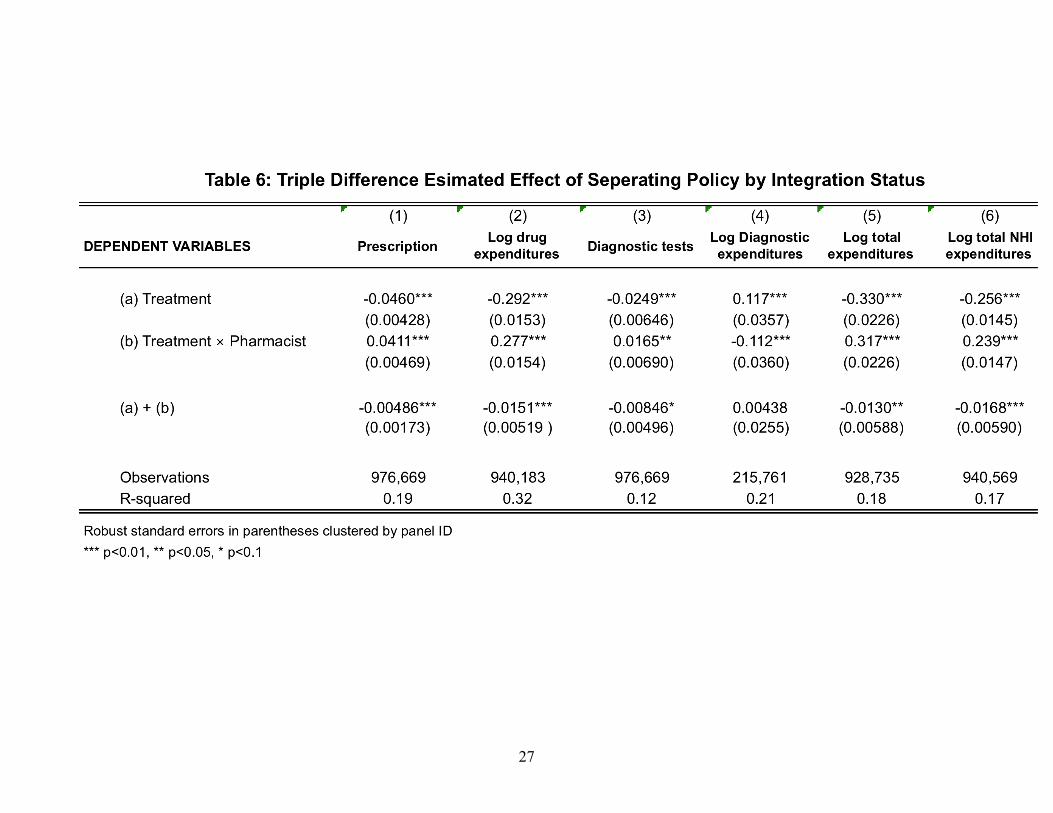
VII.A.2. Results
The results are presented in Table 6. We find that separating policy reduced the
probability that a physician working in a non-integrated clinic gave a patient drug prescription
being by 4.6 percentage points and reduced average drug expenditures per visit by 29.2 percent
(Table 6, row a). We also find that these physicians also reduced the probability of a diagnostic
test by 2.5 percentage points but increased the average expenditures on tests by 11.7 percent.
Overall, the separating policy reduced patient to physicians working in non-integrated clinics by
33 percent and reduced overall expenditures for this group by 25.6 percent. As expected, the
separating policy had little effect on physicians who worked in clinics that integrated and, as a
result, were exempt from the separating policy (Row a + b).
19
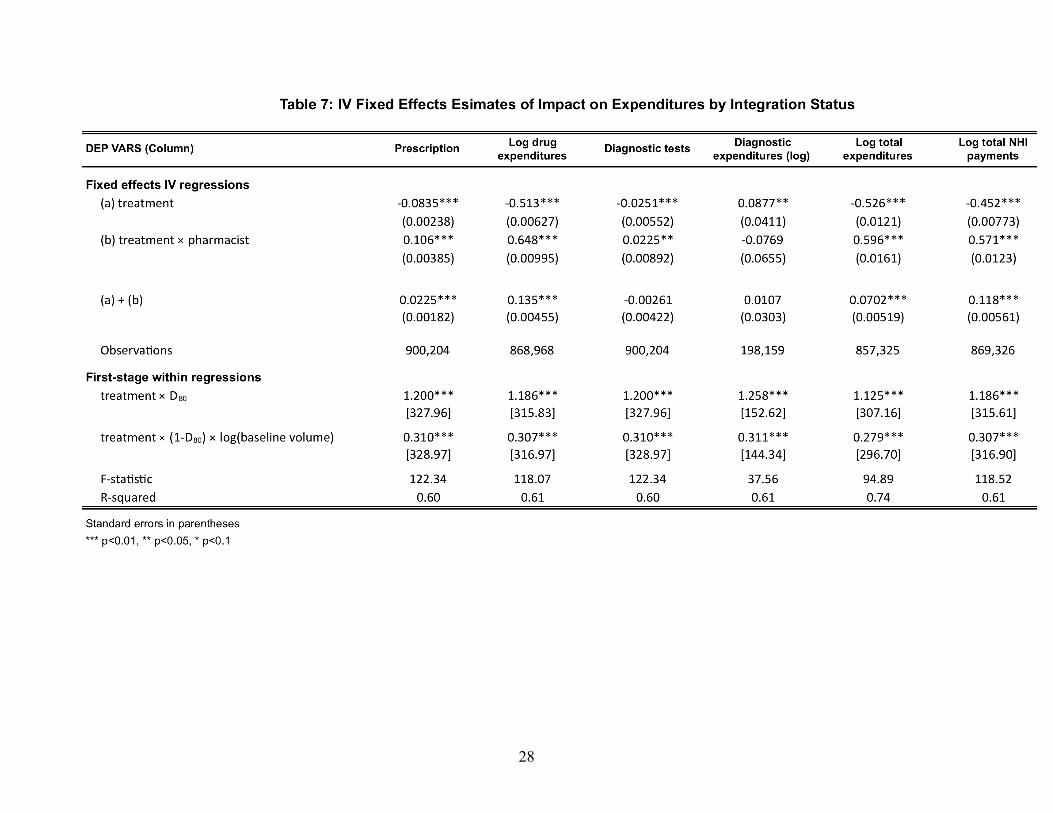
VII.B. Instrumental variable fixed effects identification strategy (TBA)
VIII. Discussion (TBA)
20
References Aronovitz, L. G. 1994. "Referrals to Physician-Owned Imaging Facilities Warrant Hcfa’s Scrutiny: General Accounting Office (Gao) Report to the Us House of Representatives." Washington, DC: GAO, 5, 95–2.
Cheng, Tsung-Mei. 2003. "Taiwan's New National Health Insurance Program: Genesis and Experience So Far." Health Aff, 22(3), 61-76.
Childs, A. W. and E. D. Hunter. 1972. "Non-Medical Factors Influencing Use of Diagnostic X-Ray by Physicians." Med Care, 10(4), 323-35.
Chou, Y. J.; W. C. Yip; C. H. Lee; N. Huang; Y. P. Sun and H. J. Chang. 2003. "Impact of Separating Drug Prescribing and Dispensing on Provider Behaviour: Taiwan's Experience." Health Policy and Planning, 18(3), 316-29.
Eggleston, Karen ed. 2009. Prescribing Cultures and Pharmaceutical Policy in the Asia-Pacific. Brookings Institution Press.
Evans, R. G. 1974. "Supplier-Induced Demand: Some Empirical Evidence and Implications." The Economics of Health and Medical Care, 162-73.
Fuchs, V. R. 1978. "The Supply of Surgeons and the Demand for Operations." Journal of Human Resources, 13(0), 35-56.
Gazelle, GS; EF Halpern; HS Ryan and AC Tramontano. 2007. "Utilization of Diagnostic Medical Imaging: Comparison of Radiologist Referral Versus Same-Specialty Referral1." Radiology, 245(2), 517.
Gruber, Jonathan and Maria Owings. 1996. "Physician Financial Incentives and Cesarean Section Delivery." Rand Journal of Economics, 27(1), 99-123.
Hillman, B. J.; C. A. Joseph; M. R. Mabry; J. H. Sunshine; S. D. Kennedy and M. Noether. 1990. "Frequency and Costs of Diagnostic Imaging in Office Practice--a Comparison of Self-Referring and Radiologist-Referring Physicians." New England Journal of Medicine, 323(23), 1604.
Hillman, B. J.; G. T. Olson; R. W. Colbert and L. B. Bernhardt. 1995. "Responses to a Payment Policy Denying Professional Charges for Diagnostic Imaging by Nonradiologist Physicians." JAMA, 274(11), 885-87.
Hillman, B. J.; G. T. Olson; P. E. Griffith; J. H. Sunshine; C. A. Joseph; S. D. Kennedy; W. R. Nelson and L. B. Bernhardt. 1992. "Physicians' Utilization and Charges for Outpatient Diagnostic Imaging in a Medicare Population." JAMA, 268(15), 2050-54.
McGuire, T. G. and M. V. Pauly. 1991. "Physician Response to Fee Changes with Multiple Payers." Journal of Health Economics, 10(4), 385-410.
Mitchell, J. M. 2005. "Effects of Physician-Owned Limited Service Hospitals: Evidence from Arizona." Health Affairs, 24, 481-90.
Mitchell, J. M. and T. R. Sass. 1995. "Physician Ownership of Ancillary Services: Indirect Demand Inducement or Quality Assurance?" Journal of Health Economics, 14(3), 263-89.
Mitchell, JM. 2008. "Utilization Trends for Advanced Imaging Procedures: Evidence from Individuals with Private Insurance Coverage in California." Medical Care, 46(5), 460.
Orszag, PR and EJ Emanuel. 2010. "Health Care Reform and Cost Control." New England Journal of Medicine.
Strasser, R. P.; M. J. Bass and M. Brennan. 1987. "The Effect of an on-Site Radiology Facility on Radiologic Utilization in Family Practice." J Fam Pract, 24(6), 619-23.
21
Tynan, A; RA Berenson and JB Christianson. 2008. "Health Plans Target Advanced Imaging Services: Cost, Quality and Safety Concerns Prompt Renewed Oversight." Issue brief (Center for Studying Health System Change), (118), 1.
Wagstaff, Adam. 2007. "Health Systems in East Asia: What Can Developing Countries Learn from Japan and the Asian Tigers?" Health Economics, 16(5), 441-56.
22
23
24
25
26
27
28
29
Figure 1:
30
Figure 2:
31
Figure 3: Likelihood of Integration by Practice Volume (Lowess-Smoothed Graph)
32
Figure 4: Average Drug Expenditures Per Visit by Clinic Size

33