
Least square support vector machine based Multiclass ... · Least square support vector machine...
9
Least square support vector machine based Multiclass classification of EEG signals Deepesh Kumar a , Rajesh Kumar Tripathy b , Ashutosh Acharya c a,c Department of Electronics & Communication Engineering b Department of Biomedical Engineering a,b National Institute of Technology, Rourkela, India c Silicon Institute of Technology,Bhubaneswar,India Email-deepesh[email protected] Abstract:- This paper describes the pattern recognition technique based on multiscale discrete wavelet transform(MDWT) and least square support vector machine (LS-SVM) for the classification of EEG signals. The different statistical features are extracted from each EEG signal corresponding to various seizer and nonsiezer brain functions, using MDWT. Further these sets of features are fed to the LS-SVM multiclass classifier for the classification. At the output, the required classifier predicts the output level corresponding to the given test features. The actual output levels are compared with the classifier’s predicted output levels and the performance of classifier determined using classification rate (CR). The outcome of our result confirms that the LS-SVM multiclass classifier with linear kernel function, “One VS All” coding algorithm and 10 fold cross validation scheme gives better performance in terms of CR of 98.07% than other algorithm based LS-SVM multiclass classifier for the required EEG signal classification. Keywords: - Electroencephalogram (EEG), multiscale discrete wavelet transforms (MDWT), statistical features, least square support vector machine (LS-SVM), RBF kernel, Linear Kernel, Polynomial kernel, Classification rate (CR). 1. Introduction The recording of spontaneous electrical activity of the brain over a small period of time is called as Electroencephalography and the one dimensional electrical signal obtained during this process, called as EEG signal[1]. Not only the EEG signal provides more valuable information regarding the brain functions but also we can see it in the form of the recorded waveform. This waveform is further analyzed by various digital signal processing algorithms to detect various diseases and neurological disorder. Electroencephalography is a noninvasive Method of acquiring the brain signals and after that we can use pattern recognition techniques to recognize and understand the electroencephalographic changes. The human Brain is a complex organ with approximately 100 billion nerve cells called neurons. Neurons gather and transmit electrochemical signals. No matter what state we are in, whether asleep, awake or anesthetized, our brain produces some kind of waves which can be observed and used for the research[2]. One of the most widely used methods of capturing brain activity is using EEG. These EEG signals measured voltage fluctuations between different parts of the brain in a non- invasive manner. In clinical contexts, EEG refers to the recording of the brain's spontaneous electrical activity over a short period of time. In neurology, the main diagnostic application of EEG is the epileptic seizer activity which creates clear abnormalities and changes in the standard EEG waveform [3]. Real time automated EEG signal analysis in clinical settings is of great assistance to neurologist in detecting neurobiological diseases and prevention of the possibility of missing information. However, WSEAS TRANSACTIONS on SIGNAL PROCESSING Deepesh Kumar, Rajesh Kumar Tripathy, Ashutosh Acharya E-ISSN: 2224-3488 86 Volume 10, 2014
Transcript of Least square support vector machine based Multiclass ... · Least square support vector machine...

Least square support vector machine based Multiclass classification of EEG signals
Deepesh Kumara, Rajesh Kumar Tripathyb, Ashutosh Acharyac
a,cDepartment of Electronics & Communication Engineering bDepartment of Biomedical Engineering
a,bNational Institute of Technology, Rourkela, India cSilicon Institute of Technology,Bhubaneswar,India
Abstract:- This paper describes the pattern recognition technique based on multiscale discrete wavelet transform(MDWT) and least square support vector machine (LS-SVM) for the classification of EEG signals. The different statistical features are extracted from each EEG signal corresponding to various seizer and nonsiezer brain functions, using MDWT. Further these sets of features are fed to the LS-SVM multiclass classifier for the classification. At the output, the required classifier predicts the output level corresponding to the given test features. The actual output levels are compared with the classifier’s predicted output levels and the performance of classifier determined using classification rate (CR). The outcome of our result confirms that the LS-SVM multiclass classifier with linear kernel function, “One VS All” coding algorithm and 10 fold cross validation scheme gives better performance in terms of CR of 98.07% than other algorithm based LS-SVM multiclass classifier for the required EEG signal classification. Keywords: - Electroencephalogram (EEG), multiscale discrete wavelet transforms (MDWT), statistical features, least square support vector machine (LS-SVM), RBF kernel, Linear Kernel, Polynomial kernel, Classification rate (CR).
1. Introduction The recording of spontaneous electrical activity of the brain over a small period of time is called as Electroencephalography and the one dimensional electrical signal obtained during this process, called as EEG signal[1]. Not only the EEG signal provides more valuable information regarding the brain functions but also we can see it in the form of the recorded waveform. This waveform is further analyzed by various digital signal processing algorithms to detect various diseases and neurological disorder. Electroencephalography is a noninvasive Method of acquiring the brain signals and after that we can use pattern recognition techniques to recognize and understand the electroencephalographic changes. The human Brain is a complex organ with approximately 100 billion nerve cells called
neurons. Neurons gather and transmit electrochemical signals. No matter what state we are in, whether asleep, awake or anesthetized, our brain produces some kind of waves which can be observed and used for the research[2]. One of the most widely used methods of capturing brain activity is using EEG. These EEG signals measured voltage fluctuations between different parts of the brain in a non-invasive manner. In clinical contexts, EEG refers to the recording of the brain's spontaneous electrical activity over a short period of time. In neurology, the main diagnostic application of EEG is the epileptic seizer activity which creates clear abnormalities and changes in the standard EEG waveform [3]. Real time automated EEG signal analysis in clinical settings is of great assistance to neurologist in detecting neurobiological diseases and prevention of the possibility of missing information. However,
WSEAS TRANSACTIONS on SIGNAL PROCESSING Deepesh Kumar, Rajesh Kumar Tripathy, Ashutosh Acharya
E-ISSN: 2224-3488 86 Volume 10, 2014

automated classification of EEG signals is a challenging problem as the morphological and temporal characteristics of EEG signals show significant variations for different subjects and under different temporal and physical conditions. The features that distinguish the ERPs may be extracted at the time, frequency, or both in time-frequency domain. There are many techniques proposed in literature for EEG signal classification that includes Artificial Neural Network (ANN), Adaptive neuro fuzzy interface system (ANFIS), Decision based tree classifier [4] [5].Nigam et al. proposed the classification technique by considering Nonlinear preprocessing filter and diagnostic artificial neural network combined to get accuracy of 97%[6].However, they have taken only two classes of data. Similarly the same two class of data also taken by Srinivasan et al. to propose another method by considering Time & frequency domain features and recurrent neural network (RNN) to classify the EEG signal on the basis of seizer and non seizer functions and they achieve an accuracy of 99.6%[7].Further Guler et al. considering the three class of EEG signal and used the Lyapunov exponents and recurrent neural network (RNN) to predict the accuracy as 96.79%[8].However in this research we have taken five classes of EEG signals corresponding to various seizer and nonseizer functions. For the tasks of nonlinear multi class classification and multi output function estimation in the field of machine learning, the SVM and LS-SVM are widely used. Both these methods are belongs to the class of supervised learning paradigm. For the binary classification task, SVM and LS-SVM builds an optimized Hyperplane, which can separate two classes[9]. For multi class classification methods as in current research the different multiclass coding used to divide the problem into several binary class and use of cross validation scheme to get better accuracy of classification[10].The LSSVM is mainly the simplified version of SVM .In this case the sets of linear equations are solved in simpler approach instead of more complex (quadratic programming) approaches in SVM [11, 12].
In this research we proposed the method by considering Wavelet based statistical features and LS-SVM multiclass classifiers to classify various EEG signals. After classification, we compared the classification rates of different kernel based multi class coded LS-SVM classifiers. 2. Materials and Methods
In this work we have taken the EEG signal dataset, which is publicly available in online[13]. After taking these EEG signals we designed a decision making approach, which is basically based on three steps i.e. (I)To segment each class signal to 500 samples. (II)To extract multiscale wavelet based statistical features in different levels of decomposition. (III)To use the multiclass LS-SVM classifier to classify the five different classes EEG signals. The flowchart of the decision based classification system is given in figure-1.Here the dataset consists of five sets, each set contains 100 single channel EEG signals having duration of each one is 23.6sec.Sets A and B are taken from surface EEG recording with eyes are open and close respectively. Similarly the sets C and D measured in seizer free intervals for patients in epileptogenic zone and the hippocampus formation of the opposite hemisphere of the brain respectively. Finally the Set E contains seizure activity, which is selected from all recording sites exhibiting ictus activity. The Table-1 shows various class levels of EEG signal corresponding to the seizer and nonseizer activity of the brain. The EEG signal corresponding to each class shown in figure-2 to figure-6.Further these classes of signal are segmented according to the sample size. Initially the signal has 4097 numbers of samples. So by segmenting each signal to 500 samples we can extract 8 signals from the each EEG signal class corresponding to desired seizer and nonsiezer brain functions. After segmentation each class is having 800 numbers of EEG signals. These set of signals further used in feature extraction stage to calculate the multi resolution analysis based statistical features. These features are further
WSEAS TRANSACTIONS on SIGNAL PROCESSING Deepesh Kumar, Rajesh Kumar Tripathy, Ashutosh Acharya
E-ISSN: 2224-3488 87 Volume 10, 2014

used by LS-SVM multiclass classifier as training and testing purpose. After prediction, the performance of the classifier is determined in terms of classification Rate (CR).
Figure-1 Decision based system for EEG signal classification 3. Multi scale discrete wavelet transform based Statistical feature extraction
Discrete wavelet transform (DWT) of EEG signal is obtained by passing it to the series of filters. These filters are both low pass and high pass filters. Here the DWT analyze the EEG signal at various frequency bands by decomposing the signal. It employs the two set of functions like scaling and wavelet functions, which are associated with the low pass and high pass filters respectively[14].
The original EEG signal is passing through the half band high pass and low pass filters. Then the signal sub sampled by factor 2, simply to discard other samples present in the signal.
The decomposition of signal into different levels can be mathematically expressed as:
( ) ( ) (2 )hn
Y k x n P k n= −∑ (1)
( ) ( ) (2 )ln
Y k x n Q k n= −∑ (2)
After the decomposition we calculate four numbers of features for each wavelet coefficients. These features are given as
Energy:- It measures the square of the amplitude of EEG signal at different level for different wavelet coefficient.
Energy (E) = 2
1
[ ( )]N
jk
d k=∑ (3)
Where, ( )jd k is the different wavelet coefficient
associated with the levels.
Variance:- it measures the variation in electrical potential with respect to the wavelet coefficients for various diseases.
Variance (V) = 2
1
1( ( ) )
N
jk
d kN
µ=
−∑ (4)
Where µ is the mean values of the wavelet coefficients associated with different levels and ‘k’ is the number of wavelet coefficients varies from 1to N.
Standard Deviation:- it measures the deviation of electrode potential from its mean value for the different wavelet coefficients associated with the EEG signal.
Standard deviation (SD)
= 1
( ( ) ( ))
1
N
j jk
d k d k
k=
−
−
∑ (5)
( )jd k is the mean value of wavelet coefficient
corresponding to the EEG signal at different levels.
WSEAS TRANSACTIONS on SIGNAL PROCESSING Deepesh Kumar, Rajesh Kumar Tripathy, Ashutosh Acharya
E-ISSN: 2224-3488 88 Volume 10, 2014

Waveform Length:-It measures the length of each coefficient at different level during wavelet decomposition.
In this research we use four levels EEG signal wavelet based decomposition, which means we have a total of 11 numbers of approximate and details coefficients. For each wavelet coefficient, we found out four different features as (energy,
waveform length, standard deviation and variance), and hence there are a sum total of 44 features for each EEG signal of a different classes. Further these features are fed to multiclass LS-SVM classifier. At the output, the multiclass LS-SVM classifier classifies different seizer and nonsiezer brain functions corresponding to the required test EEG signals.
Table-1. Different classes of EEG signals for classification
Different seizer and nonsiezer function corresponding to EEG signals
Assigned class
Surface EEG recording with eyes are open
Class-1
Surface EEG recording with eyes are closed
Class-2
EEG signal recording in seizer free intervals from patients in epileptogenic zone.
Class-3
EEG signal recording in seizer free intervals from patients in the hippocampus formation of the opposite hemisphere of the brain respectively.
Class-4
Seizure activity, which is selected from all recording sites exhibiting ictus activity.
Class-5
Figure-2 Segmented EEG signal for class 1(Z).
WSEAS TRANSACTIONS on SIGNAL PROCESSING Deepesh Kumar, Rajesh Kumar Tripathy, Ashutosh Acharya
E-ISSN: 2224-3488 89 Volume 10, 2014

Figure-3 Segmented EEG signal for class 2(O).
Figure-4 Segmented EEG signal for class 3(N).
Figure-5 Segmented EEG signal for class 4(F).
Figure-6 Segmented EEG signal for class 5(S).
WSEAS TRANSACTIONS on SIGNAL PROCESSING Deepesh Kumar, Rajesh Kumar Tripathy, Ashutosh Acharya
E-ISSN: 2224-3488 90 Volume 10, 2014

4. LS-SVM Multiclass Classifier
The multiclass classification task is solved by dividing M classes to L binary classification tasks. The various coding algorithms such as ‘one vs all’ and ‘one vs one’ are used to represent the output of this LS-SVM classifier. As we seen from literature that LS-SVM classifier is the simplified version of SVM classifier [15]. Here the optimization problem is solved in a more simplified manner and computationally more efficient. Let’s consider a
given a training set 1{ , } ni i im t = where the
nim R∈ and it corresponds to the class labels.
The following multi class Classification model can be built by using the kernel function ψ(m).For this multiclass problem we use certain coding mechanisms like ‘one vs. one’ coding and ‘one vs. all’ coding to evaluate the new class for testing data same as that of SVM. The decision function associated with LS-SVM Hyperplane given by [12]:
( )Tt p m bψ= + (12)
Where the weight p is a vector and b is the bias term associated with the Hyperplane. Almost in every classification methodologies it is necessary to minimize the cost function C for the binary target. This minimization in LS-SVM is given as follows:
( ) 2
1
1 1min ,
2 2
NT
ii
C p e p p eγ=
= + ∑ (13)
This Subjected to the addition of an equality constraint in the right side of eq (12).
( ) ,Ti it p m b eψ= + + 1,2,....,i n= (14)
Different parameters associated with the cost functions which are the weight decay, which is used to scale the weights in a similar value. Due to the excessive variance the large weights there
will be the decrease in the generalization ability of the LS-SVM, so we tune the weights converge to similar value to get better prediction. The second parameter in the eq-13 is the regression error for all training data corresponding to the classification task. To minimize this regression error, the parameterγ is to be optimized by the user. To solve the optimization problem in the cost equation, the Lagrange function is constructed as
( ) 2 2
1
1, , ,
2
N
ii
L p b e p eα γ=
= + ∑� �
( ){ }1
Ti i i i
i
p m b e tα ψ=
− + + −∑ (15)
The parameters used in this Lagrange function as αi which is also called as Lagrange multipliers. By partially differentiating the (eq-15) with respect to w, b, ei and αi we obtained the optimized weight as
( ) ( )1 1
n n
i i i ii i
p m e mα ψ γ ψ= =
= =∑ ∑ (16)
Where the Kernel function is used as same that of SVM which is given by
( ) ( ) ( ),T
i j i jm m m mψ ψ ψ= (17)
Now the output is assigned by considering updated weight and bias value as:
( ) ( )1
nT
i ii
t m m bα ψ ψ=
= +∑ (18)
Algorithim-1: “One VS One” coding for multiclass classification [16] Initialize class [] = 0; For each L1 from 1 to 5 do For each L2 from 1 to 5 do if (L1 ≠ L2) then L = classify (L1, L2); class [L]++; end
WSEAS TRANSACTIONS on SIGNAL PROCESSING Deepesh Kumar, Rajesh Kumar Tripathy, Ashutosh Acharya
E-ISSN: 2224-3488 91 Volume 10, 2014

end end Algorithim-2: “One VS All” coding for multiclass classification [16] For each L from 1 to 5 do //L stands for level [Score, L] = classify (L,-L) output [L] = score; end [Score, Label] = max (output); For the case of “one vs. one” coding based multiclass classification, the voting strategy is used to find out the resulted output. Each of the binary class provides a vote for output classified level. Finally the output class is determined by maximum number of votes, which is given in algorithim-1.Similarly the “one vs. all” coding based multiclass classification is done by simply assigning one score to each class level. The final score in that method is determined by the maximum value for each level which is given in algorithim-2. 5. Results and Discussion In this research the proposed pattern recognition system is developed by considering 4000 EEG signals from different categories of neurological disorder. The discrete wavelet transform based statistical features were extracted from each of the EEG signal. Then the extracted features and the respective output level are arranged in a row format to make the dataset. Further we have considered 50% of instances of the dataset for training and the rest 50% are used for testing of the LS-SVM multi class classifiers. We have used LS-SVM toolbox for the modeling [17]. At the beginning the LS-SVM multiclass classifiers are trained using Linear and RBF kernel functions with different coding algorithms and different optimization function like ‘simplex’ and ‘grid search’. The different validation schemes such as ‘leave one out’ and ’10 fold cross validation’ is also used to compare the classification rates. The Table-2 shows the performance of the various LS-SVM multiclass classifiers in terms of classification rate.
From this above comparison the Linear kernel LS-SVM multiclass classifier with the ‘one vs all’ multiclass coding algorithm, with optimization function as grid search and 10 fold cross validation scheme, gives an accuracy of 98.07%.The curve shown in figure-8 is the variation of classification accuracy with respect to number of classifiers used.
6. Conclusion In this paper, we use LS-SVM as multiclass classifier for the classification of EEG signal. The result obtain suggests that the LS-SVM multiclass classifier is one of the better machine learning method than other classification algorithms. This may help neurologist in diagnosing the disease and neural disorders and provide better treatment within a shorter period of time. Further this work can be extended by considering Ensemble based LS-SVM classifiers with suitable voting or stacking methodologies to improve the classification accuracy.
References [1] J. Wenchuan, H. Dandan, L. Xin, P.
Huayan, C. Xuedong, and B. Ou, "Electroencephalography(EEG)-based instinctive brain-control of a quadruped locomotion robot," in Engineering in Medicine and Biology Society (EMBC), 2012 Annual International Conference of the IEEE, 2012, pp. 1777-1781.
[2] D. Suh-Yeon and L. Soo-Young,
"Understanding human implicit intention based on frontal electroencephalography (EEG)," in Neural Networks (IJCNN), The 2012
WSEAS TRANSACTIONS on SIGNAL PROCESSING Deepesh Kumar, Rajesh Kumar Tripathy, Ashutosh Acharya
E-ISSN: 2224-3488 92 Volume 10, 2014

International Joint Conference on, 2012, pp. 1-5.
[3] D. Garrett, D. A. Peterson, C. W. Anderson, and M. H. Thaut, "Comparison of linear, nonlinear, and feature selection methods for EEG signal classification," Neural Systems and Rehabilitation Engineering, IEEE Transactions on, vol. 11, pp. 141-144, 2003.
[4] M. Alipoor, M. Pooyan, and A. A. Suratgar, "Classification of EEG signals in four groups, including healthy subjects with open/closed eyes and epilepsy subjects with/without seizure by PSD estimate (using the multitaper method) and ANN," in Health Informatics and Bioinformatics (HIBIT), 2010 5th International Symposium on, 2010, pp. 98-103.
[5] I. Guler and E. D. Ubeyli, "Adaptive neuro-fuzzy inference system for classification of EEG signals using wavelet coefficients," J Neurosci Methods, vol. 148, pp. 113-21, Oct 30 2005.
[6] V. P. Nigam and D. Graupe, "A neural-network-based detection of epilepsy," Neurol Res, vol. 26, pp. 55-60, Jan 2004.
[7] V. Srinivasan, C. Eswaran, and N. Sriraam, "Approximate Entropy-Based Epileptic EEG Detection Using Artificial Neural Networks," Information Technology in Biomedicine, IEEE Transactions on, vol. 11, pp. 288-295, 2007.
[8] E. D. Übeyli and Đ. Güler, "Features extracted by eigenvector methods for detecting variability of EEG signals," Pattern Recognition Letters, vol. 28, pp. 592-603, 2007.
[9] V. Bajaj and R. B. Pachori, "Classification of Seizure and Nonseizure EEG Signals Using Empirical Mode Decomposition," Information Technology in Biomedicine, IEEE Transactions on, vol. 16, pp. 1135-1142, 2012.
[10] H. B. Zheng, R. J. Liao, S. Grzybowski, and L. J. Yang, "Fault diagnosis of
power transformers using multi-class least square support vector machines classifiers with particle swarm optimisation," Electric Power Applications, IET, vol. 5, pp. 691-696, 2011.
[11] B. Baesens, S. Viaene, T. Van Gestel, J. A. K. Suykens, G. Dedene, B. De Moor, and J. Vanthienen, "An empirical assessment of kernel type performance for least squares support vector machine classifiers," in Knowledge-Based Intelligent Engineering Systems and Allied Technologies, 2000. Proceedings. Fourth International Conference on, 2000, pp. 313-316 vol.1.
[12] R. K. Tripathy, A.Acharaya, and S. K. Choudhary, "Gender classification from ECG signal analysis using least square support vector machines," American Journal of Signal Processing, vol. 2, pp. 145-149, 2012.
[13] EEG time series download page. Available:http://epileptologie-bonn.de/cms/front_content.php?idcat=193&lang=3&changelang=3
[14] Z. Xiaolan, W. Zuguo, X. Jiren, W. Keren, and N. Jihai, "Speech Signal Feature Extraction Based on Wavelet Transform," in Intelligent Computation and Bio-Medical Instrumentation (ICBMI), 2011 International Conference on, 2011, pp. 179-182.
[15] N. Pochet, F. De Smet, J. A. Suykens, and B. L. De Moor, "Systematic benchmarking of microarray data classification: assessing the role of non-linearity and dimensionality reduction," Bioinformatics, vol. 20, pp. 3185-95, Nov 22 2004.
[16] R. G. Mihalyi, "Handwritten Digit Classication," Jacobs University Bremen, Germany2011.
[17] K. De Brabanter, P. Karsmakers , F. Ojeda, C. Alzate, J. De Brabanter, K. Pelckmans, B. De Moor, J. Vandewalle J.A.K.Suykens, " LS-SVMlab Toolbox User's Guide version 1.8", Internal Report 10-146, ESAT-SISTA, K.U.Leuven (Leuven, Belgium), 2010.
WSEAS TRANSACTIONS on SIGNAL PROCESSING Deepesh Kumar, Rajesh Kumar Tripathy, Ashutosh Acharya
E-ISSN: 2224-3488 93 Volume 10, 2014
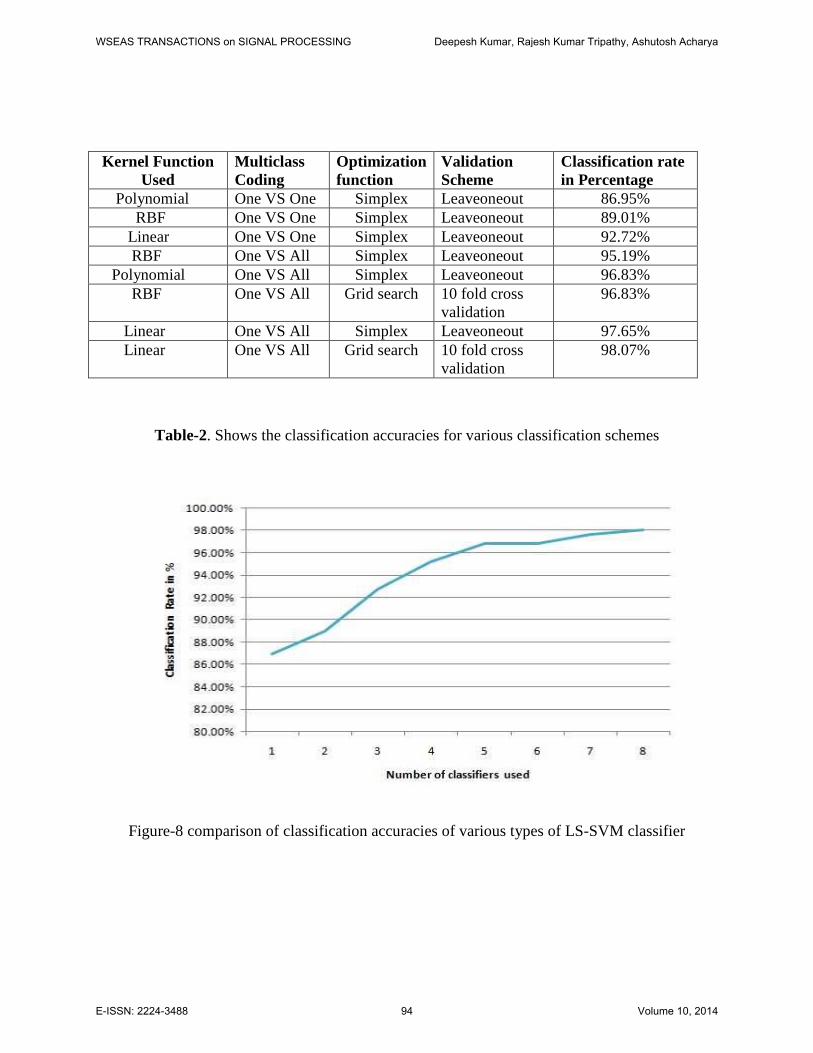
Table-2. Shows the classification accuracies for various classification schemes
Figure-8 comparison of classification accuracies of various types of LS-SVM classifier
Kernel Function Used
Multiclass Coding
Optimization function
Validation Scheme
Classification rate in Percentage
Polynomial One VS One Simplex Leaveoneout 86.95% RBF One VS One Simplex Leaveoneout 89.01% Linear One VS One Simplex Leaveoneout 92.72% RBF One VS All Simplex Leaveoneout 95.19% Polynomial One VS All Simplex Leaveoneout 96.83% RBF One VS All Grid search 10 fold cross
validation 96.83%
Linear One VS All Simplex Leaveoneout 97.65% Linear One VS All Grid search 10 fold cross
validation 98.07%
WSEAS TRANSACTIONS on SIGNAL PROCESSING Deepesh Kumar, Rajesh Kumar Tripathy, Ashutosh Acharya
E-ISSN: 2224-3488 94 Volume 10, 2014


![IEEE TRANSACTIONS ON NEURAL NETWORKS 1 Multiclass ...€¦ · original Relevance Vector Machine to the multi-class multi-kernel setting [6]. These algorithms achieve sparsity without](https://static.fdocuments.in/doc/165x107/5f0755f87e708231d41c7a37/ieee-transactions-on-neural-networks-1-multiclass-original-relevance-vector.jpg)


![Position-BasedFeatureSelectionforBodySensorsregardingDaily ... · our previous work [6], a multiclass support vector machine (SVM) algorithm demonstrated 97.3% accuracy when we used](https://static.fdocuments.in/doc/165x107/611804e07e069b41353cfd6e/position-basedfeatureselectionforbodysensorsregardingdaily-our-previous-work.jpg)