Kellogg Companyinvestor.kelloggs.com/~/media/Files/K/Kellogg-IR/reports-and... · Kellogg Company...
14
Kellogg Company Page 1 of 14 February 9, 2017 Kellogg Company 2016 FOURTH QUARTER FINANCIAL RESULTS February 9, 2017 Forward - Looking Statements This presentation contains, or incorporates by reference, “forward-looking statements” with projections concerning, among other things, the Company’s global growth and efficiency program (Project K), the integration of acquired businesses, the Company’s strategy, zero-based budgeting, and the Company’s sales, earnings, margin, operating profit, costs and expenditures, interest expense, tax rate, capital expenditure, dividends, cash flow, debt reduction, share repurchases, costs, charges, rates of return, brand building, ROIC, working capital, growth, new products, innovation, cost reduction projects, workforce reductions, savings, and competitive pressures. Forward-looking statements include predictions of future results or activities and may contain the words “expects,” “believes,” “should,” “will,” “anticipates,” “projects,” “estimates,” “implies,” “can,” or words or phrases of similar meaning. The Company’s actual results or activities may differ materially from these predictions. The Company’s future results could also be affected by a variety of factors, including the ability to implement Project K (including the exit from its Direct Story Delivery system) as planned, whether the expected amount of costs associated with Project K will differ from forecasts, whether the Company will be able to realize the anticipated benefits from Project K in the amounts and times expected, the ability to realize the anticipated benefits from Revenue Growth Management, the ability to realize the anticipated benefits and synergies from the acquisitions in the amounts and at the times expected, the impact of competitive conditions; the effectiveness of pricing, advertising, and promotional programs; the success of innovation, renovation and new product introductions; the recoverability of the carrying value of goodwill and other intangibles; the success of productivity improvements and business transitions; commodity and energy prices; labor costs; disruptions or inefficiencies in supply chain; the availability of and interest rates on short-term and long-term financing; actual market performance of benefit plan trust investments; the levels of spending on systems initiatives, properties, business opportunities, integration of acquired businesses, and other general and administrative costs; changes in consumer behavior and preferences; the effect of U.S. and foreign economic conditions on items such as interest rates, statutory tax rates, currency conversion and availability; legal and regulatory factors including changes in food safety, advertising and labeling laws and regulations; the ultimate impact of product recalls; business disruption or other losses from war, terrorist acts or political unrest; and other items. Forward-looking statements speak only as of the date they were made, and the Company undertakes no obligation to update them publicly. Non-GAAP Financial Measures. This presentation includes non‐GAAP financial measures. Please refer to the Appendices for a reconciliation of these non‐GAAP financial measures to the most directly comparable GAAP financial measures. Management believes that the use of such non-GAAP measures assists investors in understanding the underlying operating performance of the company and its segments. February 9, 2017 KELLOGG COMPANY | Q4 2016 EARNINGS 2
Transcript of Kellogg Companyinvestor.kelloggs.com/~/media/Files/K/Kellogg-IR/reports-and... · Kellogg Company...

Kellogg Company
Page 1 of 14
February 9, 2017
Kellogg Company2016 FOURTH QUARTER
FINANCIAL RESULTSFebruary 9, 2017
Forward-Looking Statements
This presentation contains, or incorporates by reference, “forward-looking statements” with projections concerning, among other things, the Company’s global growth and efficiency program (Project K), the integration of acquired businesses, the Company’s strategy, zero-based budgeting, and the Company’s sales, earnings, margin, operating profit, costs and expenditures, interest expense, tax rate, capital expenditure, dividends, cash flow, debt reduction, share repurchases, costs, charges, rates of return, brand building, ROIC, working capital, growth, new products, innovation, cost reduction projects, workforce reductions, savings, and competitive pressures. Forward-looking statements include predictions of future results or activities and may contain the words “expects,” “believes,” “should,” “will,” “anticipates,” “projects,” “estimates,” “implies,” “can,” or words or phrases of similar meaning.
The Company’s actual results or activities may differ materially from these predictions. The Company’s future results could also be affected by a variety of factors, including the ability to implement Project K (including the exit from its Direct Story Delivery system) as planned, whether the expected amount of costs associated with Project K will differ from forecasts, whether the Company will be able to realize the anticipated benefits from Project K in the amounts and times expected, the ability to realize the anticipated benefits from Revenue Growth Management, the ability to realize the anticipated benefits and synergies from the acquisitions in the amounts and at the times expected, the impact of competitive conditions; the effectiveness of pricing, advertising, and promotional programs; the success of innovation, renovation and new product introductions; the recoverability of the carrying value of goodwill and other intangibles; the success of productivity improvements and business transitions; commodity and energy prices; labor costs; disruptions or inefficiencies in supply chain; the availability of and interest rates on short-term and long-term financing; actual market performance of benefit plan trust investments; the levels of spending on systems initiatives, properties, business opportunities, integration of acquired businesses, and other general and administrative costs; changes in consumer behavior and preferences; the effect of U.S. and foreign economic conditions on items such as interest rates, statutory tax rates, currency conversion and availability; legal and regulatory factors including changes in food safety, advertising and labeling laws and regulations; the ultimate impact of product recalls; business disruption or other losses from war, terrorist acts or political unrest; and other items.
Forward-looking statements speak only as of the date they were made, and the Company undertakes no obligation to update them publicly.
Non-GAAP Financial Measures. This presentation includes non‐GAAP financial measures. Please refer to the Appendices for a reconciliation of these non‐GAAP financial measures to the most directly comparable GAAP financial measures. Management believes that the use of such non-GAAP measures assists investors in understanding the underlying operating performance of the company and its segments.
February 9, 2017 KELLOGG COMPANY | Q4 2016 EARNINGS 2

Kellogg Company
Page 2 of 14
February 9, 2017
Q4 2016 – Good Finish, Good Progress
*All metrics except Cash Flow are on a currency-neutral comparable basis; all metrics except EPS and Cash Flow also exclude Venezuela.
• Good Results: Sequential improvement in net sales Gross Margin Expansion Better-than-expected OP, EPS and Cash Flow
• Good Progress: On 2016 Priorities Toward 2020 Growth Plan Toward +350-bp Margin Expansion Target
3February 9, 2017 KELLOGG COMPANY | Q4 2016 EARNINGS
*
*
Looking Ahead – Improving Our Performance
* On a currency-neutral comparable basis
4February 9, 2017 KELLOGG COMPANY | Q4 2016 EARNINGS
• Gradual improvement in top-line trends• Confidence in +350-bp Margin Expansion Target• Increasing Cash Flow
And…
• Transforming U.S. Snacks
*
*
**
** Please refer to appendices for reconciliation of non-GAAP measures to the most directly comparable GAAP measure.

Kellogg Company
Page 3 of 14
February 9, 2017
U.S. Snacks – From DSD* to Warehouse
5February 9, 2017 KELLOGG COMPANY | Q4 2016 EARNINGS
U.S. Snacks
DSD Warehouse
• Grocery & Mass Channels• Crackers, Cookies,
Wholesome Snacks, Fruit-Flavored Snacks
• All other channels• Crackers, Cookies,
Wholesome Snacks, Fruit-Flavored Snacks
• Pringles
Total Kellogg U.S.
DSD Warehouse
• All Other Business Units• U.S. Snacks’ Pringles + non-DSD
channels
• U.S. Snacks’ DSD categories/channels
Today, more than 3/4 of our U.S. sales, including more than 1/3 of U.S. Snacks,
are already sold through warehouse distribution.
* “DSD” refers to Direct Store Delivery
U.S. Snacks – From DSD to Warehouse
6February 9, 2017 KELLOGG COMPANY | Q4 2016 EARNINGS
ChangingShopperHabits
ShiftingResources• Millennials
• More trips, smaller baskets• Mobile, social media
• Perimeter of store• More channels• Emerging E-Commerce
To:• Pack Formats• Brand Building,
Innovation, Shopper Marketing
• Broader Brand supportEvolvingRetail
Landscape
From:• Trucks• Distribution
Centers

Kellogg Company
Page 4 of 14
February 9, 2017
U.S. Snacks – From DSD to Warehouse
7February 9, 2017 KELLOGG COMPANY | Q4 2016 EARNINGS
• Scale
• Joint value creation with retailers
Effectiveness Efficiency• Redeployed resources to
“pull” investment
• Better service
• Cross-category execution
Exiting DSD in U.S. Snacks – Timeline & Impact
8February 9, 2017 KELLOGG COMPANY | Q4 2016 EARNINGS
• Announce in Q1, transition in Q2-Q3, running in Q4
• Some volume disruption during transition
• Adjusted list prices re-set gross profit margin
• Overhead savings
• Neutral impact to comparable-basis Operating Profit in 2017, accretive in 2018

Kellogg Company
Page 5 of 14
February 9, 2017
Summary of Financial Results
* Please refer to appendices for reconciliation of non-GAAP measures to the most directly comparable GAAP measure.
Change Versus Prior Year
Net Sales
Reported (1.4)% (3.8)%
Currency-Neutral Comparable * 1.1% 4.0%
Currency-Neutral Comparable
x-Venezuela * 0.5% (1.1)%
OperatingProfit
Reported 353.5% 27.8%
EarningsPerShare
Reported (25.0)% 14.0%
Comparable * 16.5% 5.9%
Currency-Neutral Comparable* 25.3% 22.1%
Currency-Neutral Comparable * 16.7% 17.7%
Currency-Neutral Comparable
x-Venezuela * 16.0% 6.7%
Full Year 2016Q4
9February 9, 2017 KELLOGG COMPANY | Q4 2016 EARNINGS
Project K Update
10February 9, 2017 KELLOGG COMPANY | Q4 2016 EARNINGS
Thru 2016 2017-2019 Cumulative
Up-Front Costs $(1.1)billion
$(0.4)-$(0.5) billion
$(1.5)-$(1.6)billion
Previous Guidance $(1.0)-$(1.2) billion
$(0.2)-$(0.4) billion
$(1.2)-$(1.4) billion
Cash Portion $(0.7)billion
$(0.4)-$(0.5) billion
~ $(1.1)billion
Previous Guidance ~ $(0.7)billion
$(0.2)-$(0.4) billion
$(0.9)-$(1.1)billion
Savings $296million
$300-400million
$600-700million
Previous Guidance ~ $280million
$145-195million
$425-475million
Extending Project K:$(0.80)-(0.90) per share of UFCs excluded from Comparable-Basis EPS in 2017
Increased ratio of savings to UFCs

Kellogg Company
Page 6 of 14
February 9, 2017
2017 Outlook – Net Sales and Operating ProfitCurrency-neutral comparable performance,* excluding Venezuela, year-over-year change
Net Sales
Operating Profit
~ (2)%
+ 7-9%
* Guidance for net sales and operating profit is on a currency-neutral comparable basis, which means it excludes the impact of acquisitions, dispositions, currency translation, mark-to-market adjustments, integration costs, costs related to Project K, and other items that could affect comparability. These targets also exclude Venezuela.
• DSD transition impacts U.S. Snacks’ volume and prices• RGM drives higher price/mix
• Productivity actions, Project K savings, ZBB savings• Modest input deflation• Cost headwinds: Transactional FX, investment in food,
volume impact• DSD exit is neutral to Operating Profit
• Gross Margin up modestly, as DSD exit partially offsets underlying expansion
• SG&A down as % of sales, led by ZBB, DSD exit• Strong OP margin expansion
11February 9, 2017 KELLOGG COMPANY | Q4 2016 EARNINGS
2017 Outlook – Earnings Per ShareCurrency-neutral comparable performance,* excluding Venezuela, year-over-year change
2017
• Guidance for operating profit is on a currency-neutral comparable basis, which means it excludes the impact of acquisitions, dispositions, currency translation, mark-to-market adjustments, integration costs, costs related to Project K, and other items that could affect comparability. These targets also exclude Venezuela.
• Guidance for EPS is on a currency-neutral basis, which means it excludes the impact of currency translation, mark-to-market adjustments, integration costs, costs related to Project K, and other items that could affect comparability. This target also excludes Venezuela.
12February 9, 2017 KELLOGG COMPANY | Q4 2016 EARNINGS
EPS(Comparable-basis)
2016
$3.74
Venezuela(Deconsolidation)
$(0.02)
$3.72
OP Growth(Currency-Neutral Comparable-basis)
+7-9%
Below the Line ~ 1%
EPS Growth(Currency-Neutral Comparable-basis)
+8-10%
$4.03-4.09
Currency Translation ~ $(0.12)
EPS (Comparable-basis)
$3.91-3.97
Restated Base(Currency-Neutral Comparable-basis)
Kellogg Company
Page 7 of 14
February 9, 2017
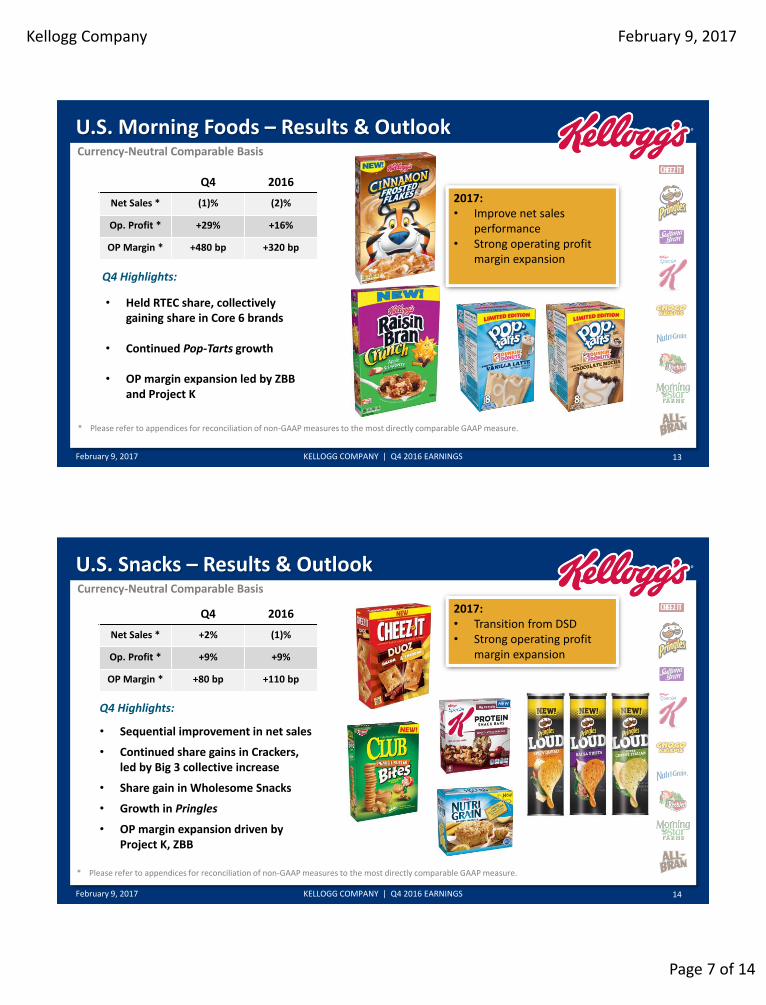
U.S. Morning Foods – Results & Outlook
• Held RTEC share, collectively gaining share in Core 6 brands
• Continued Pop-Tarts growth
• OP margin expansion led by ZBB and Project K
Q4 2016
Net Sales * (1)% (2)%
Op. Profit * +29% +16%
OP Margin * +480 bp +320 bp
* Please refer to appendices for reconciliation of non-GAAP measures to the most directly comparable GAAP measure.
2017:• Improve net sales
performance • Strong operating profit
margin expansion
13
Currency-Neutral Comparable Basis
February 9, 2017 KELLOGG COMPANY | Q4 2016 EARNINGS
Q4 Highlights:
U.S. Snacks – Results & Outlook
• Sequential improvement in net sales
• Continued share gains in Crackers, led by Big 3 collective increase
• Share gain in Wholesome Snacks
• Growth in Pringles
• OP margin expansion driven by Project K, ZBB
Q4 2016
Net Sales * +2% (1)%
Op. Profit * +9% +9%
OP Margin * +80 bp +110 bp
* Please refer to appendices for reconciliation of non-GAAP measures to the most directly comparable GAAP measure.
14
Currency-Neutral Comparable Basis
February 9, 2017 KELLOGG COMPANY | Q4 2016 EARNINGS
2017:• Transition from DSD• Strong operating profit
margin expansion
Q4 Highlights:

Kellogg Company
Page 8 of 14
February 9, 2017
U.S. Specialty Channels – Results & Outlook
Q4 2016
Net Sales * +5% +3%
Op. Profit * +13% +9%
OP Margin * +160 bp +130 bp
* Please refer to appendices for reconciliation of non-GAAP measures to the most directly comparable GAAP measure.
• Growth in key channels
• Held or gained share in most channel/categories
• Gaining new category captaincies
• Strong operating profit margin expansion
15
Currency-Neutral Comparable Basis
February 9, 2017 KELLOGG COMPANY | Q4 2016 EARNINGS
2017:• Steady sales and
operating profit growth
Q4 Highlights:
North America Other – Results & Outlook
• Eggo consumption and share growth
• Canada sequential sales improvement
• Extended transitions: Kashi portfolio, Morningstar Farms packaging, SKU prioritization in frozen handhelds
Q4 2016
Net Sales * (4)% (5)%
Op. Profit * +9% (8)%
OP Margin * +210 bp (40) bp
* Please refer to appendices for reconciliation of non-GAAP measures to the most directly comparable GAAP measure.
16
Currency-Neutral Comparable Basis
February 9, 2017 KELLOGG COMPANY | Q4 2016 EARNINGS
2017:• Gradual improvement in
sales performance• Growth in operating profit
Canada
Q4 Highlights:
Kellogg Company
Page 9 of 14
February 9, 2017
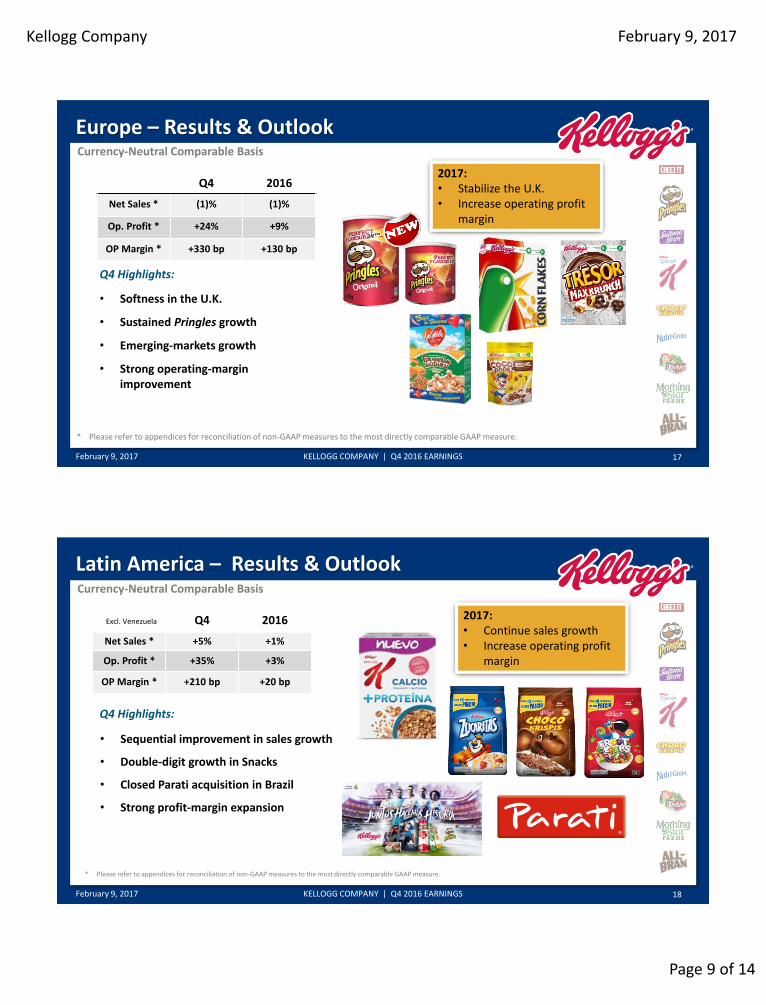
Europe – Results & Outlook
• Softness in the U.K.
• Sustained Pringles growth
• Emerging-markets growth
• Strong operating-margin improvement
Q4 2016
Net Sales * (1)% (1)%
Op. Profit * +24% +9%
OP Margin * +330 bp +130 bp
* Please refer to appendices for reconciliation of non-GAAP measures to the most directly comparable GAAP measure.
17
Currency-Neutral Comparable Basis
February 9, 2017 KELLOGG COMPANY | Q4 2016 EARNINGS
2017:• Stabilize the U.K.• Increase operating profit
margin
Q4 Highlights:
Latin America – Results & Outlook
• Sequential improvement in sales growth
• Double-digit growth in Snacks
• Closed Parati acquisition in Brazil
• Strong profit-margin expansion
Q4 2016
Net Sales * +5% +1%
Op. Profit * +35% +3%
OP Margin * +210 bp +20 bp
Excl. Venezuela
* Please refer to appendices for reconciliation of non-GAAP measures to the most directly comparable GAAP measure.
18
Currency-Neutral Comparable Basis
February 9, 2017 KELLOGG COMPANY | Q4 2016 EARNINGS
2017:• Continue sales growth• Increase operating profit
margin
Q4 Highlights:

Kellogg Company
Page 10 of 14
February 9, 2017
Asia Pacific – Results & Outlook
Q4 Year
Net Sales * +1% +2%
Op. Profit * (4)% +2%
OP Margin * (50) bp +10 bp
• Australia: Sequential improvement in net sales
• Strong growth in Korea, Sub-Saharan Africa
• Pringles momentum and expansion
• Economic disruptions in India, Thailand
• Joint ventures performing well
19
* Please refer to appendices for reconciliation of non-GAAP measures to the most directly comparable GAAP measure.
Currency-Neutral Comparable Basis
February 9, 2017 KELLOGG COMPANY | Q4 2016 EARNINGS
2017:• Continued net sales
growth• Improved operating profit
margins
Q4 Highlights:
CFO Transition
Thanks, Ron! Welcome, Fareed!
20February 9, 2017 KELLOGG COMPANY | Q4 2016 EARNINGS

Kellogg Company
Page 11 of 14
February 9, 2017
Summary
• Better-than-expected finish to 2016
• Exiting DSD to transform U.S. Snacks
• Strong earnings growth in 2017
• Confidence in 2018 profit margin goals
21
* Guidance is on a currency-neutral comparable basis, excluding Venezuela
February 9, 2017 KELLOGG COMPANY | Q4 2016 EARNINGS
February 9, 2017
Kellogg CompanyFOURTH QUARTER 2016 FINANCIAL RESULTS
Q&A
Kellogg Company
Page 12 of 14
February 9, 2017
February 9, 2017
Kellogg CompanyFOURTH QUARTER 2016 FINANCIAL RESULTS
SUPPLEMENTAL SLIDES
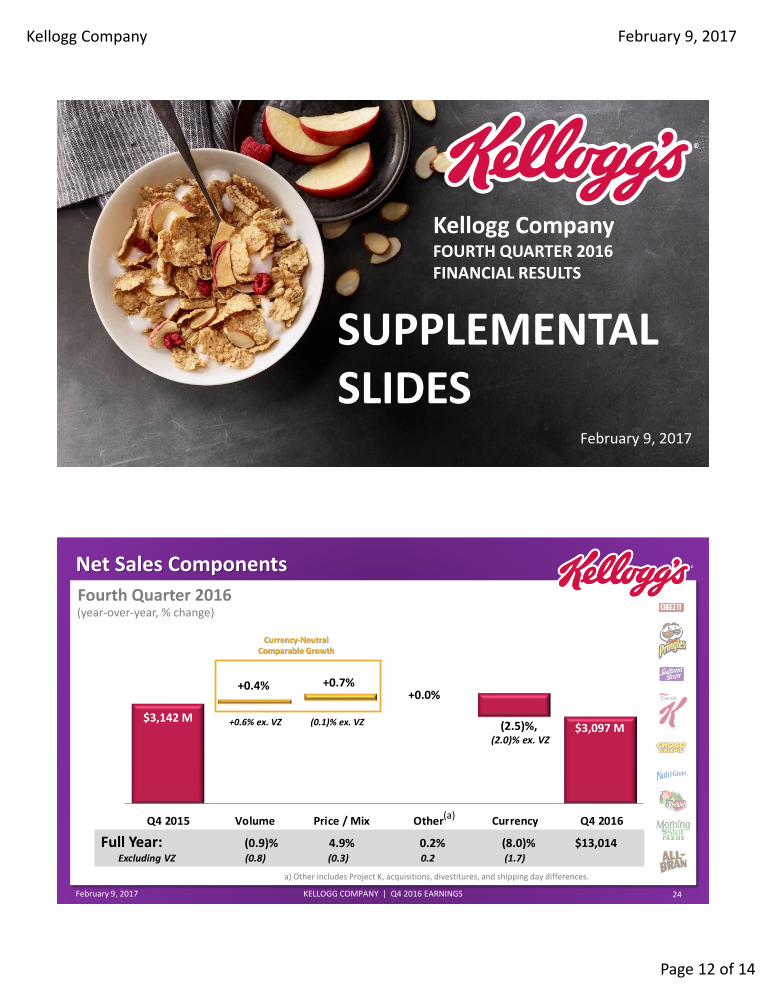
Net Sales Components
Fourth Quarter 2016
Q4 2015 Volume Price / Mix Other Currency Q4 2016
$3,142 M
+0.7%
$3,097 M
+0.4%
(2.5)%, (2.0)% ex. VZ
Currency-NeutralComparable Growth
+0.0%
Full Year: (0.9)% 4.9% 0.2% (8.0)% $13,014 Excluding VZ (0.8) (0.3) 0.2 (1.7)
(year-over-year, % change)
a) Other includes Project K, acquisitions, divestitures, and shipping day differences.
(a)
24February 9, 2017 KELLOGG COMPANY | Q4 2016 EARNINGS
+0.6% ex. VZ (0.1)% ex. VZ
Kellogg Company
Page 13 of 14
February 9, 2017
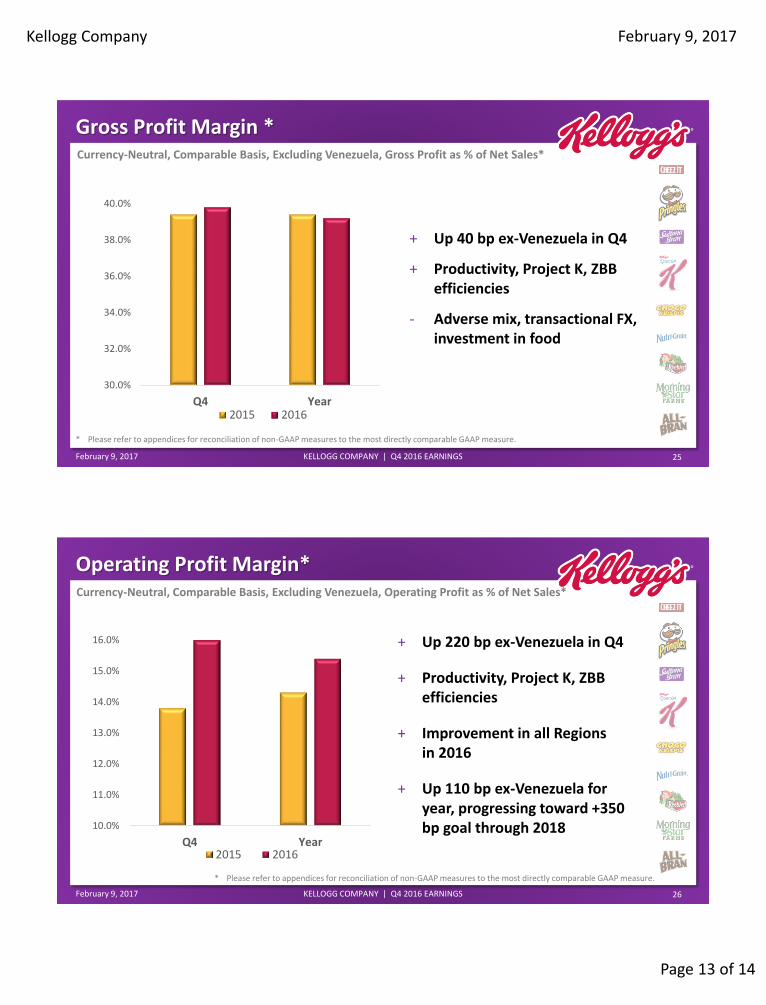
Gross Profit Margin *
* Please refer to appendices for reconciliation of non-GAAP measures to the most directly comparable GAAP measure.
Currency-Neutral, Comparable Basis, Excluding Venezuela, Gross Profit as % of Net Sales*
+ Up 40 bp ex-Venezuela in Q4
+ Productivity, Project K, ZBB efficiencies
- Adverse mix, transactional FX, investment in food
30.0%
32.0%
34.0%
36.0%
38.0%
40.0%
Q4 Year2015 2016
25February 9, 2017 KELLOGG COMPANY | Q4 2016 EARNINGS
Operating Profit Margin*
* Please refer to appendices for reconciliation of non-GAAP measures to the most directly comparable GAAP measure.
+ Up 220 bp ex-Venezuela in Q4
+ Productivity, Project K, ZBB efficiencies
+ Improvement in all Regions in 2016
+ Up 110 bp ex-Venezuela for year, progressing toward +350 bp goal through 2018
Currency-Neutral, Comparable Basis, Excluding Venezuela, Operating Profit as % of Net Sales*
10.0%
11.0%
12.0%
13.0%
14.0%
15.0%
16.0%
Q4 Year2015 2016
26February 9, 2017 KELLOGG COMPANY | Q4 2016 EARNINGS
Kellogg Company
Page 14 of 14
February 9, 2017
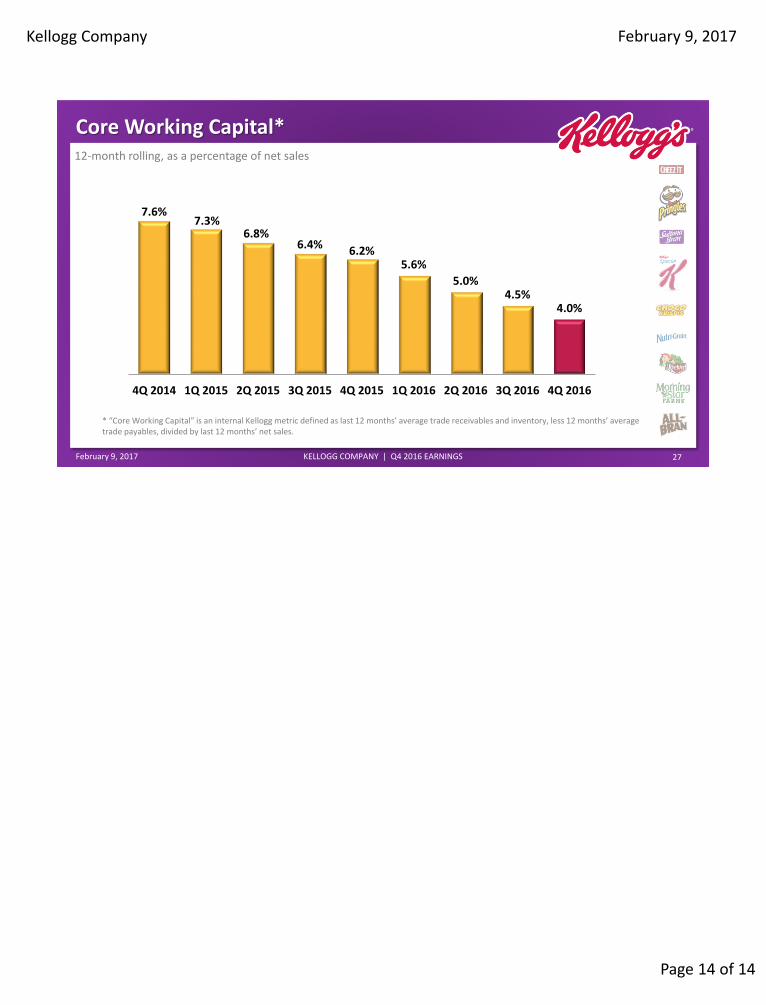
Core Working Capital*
* “Core Working Capital” is an internal Kellogg metric defined as last 12 months’ average trade receivables and inventory, less 12 months’ average trade payables, divided by last 12 months’ net sales.
27February 9, 2017 KELLOGG COMPANY | Q4 2016 EARNINGS
12-month rolling, as a percentage of net sales
7.6%7.3%
6.8%6.4%
6.2%5.6%
5.0%4.5%
4.0%
4Q 2014 1Q 2015 2Q 2015 3Q 2015 4Q 2015 1Q 2016 2Q 2016 3Q 2016 4Q 2016