Kellogg Company Case Study: Food Waste in Global Manufacturing · Kellogg Company Case Study: Food...
18
Kellogg Company Case Study: Food Waste in Global Manufacturing Erin Augustine Senior Sustainability Manager, Natural Resource Conservation, Kellogg Company
Transcript of Kellogg Company Case Study: Food Waste in Global Manufacturing · Kellogg Company Case Study: Food...

Kellogg Company Case Study: Food Waste in Global Manufacturing Erin Augustine
Senior Sustainability Manager, Natural Resource Conservation, Kellogg Company
Food Loss and Waste
Tracking and Reporting November 2017
Provision Coalition
2

3

1,600 foods, produced in 21 countries,
marketed in more than 180 countries
Bringing Our Best to the World
4
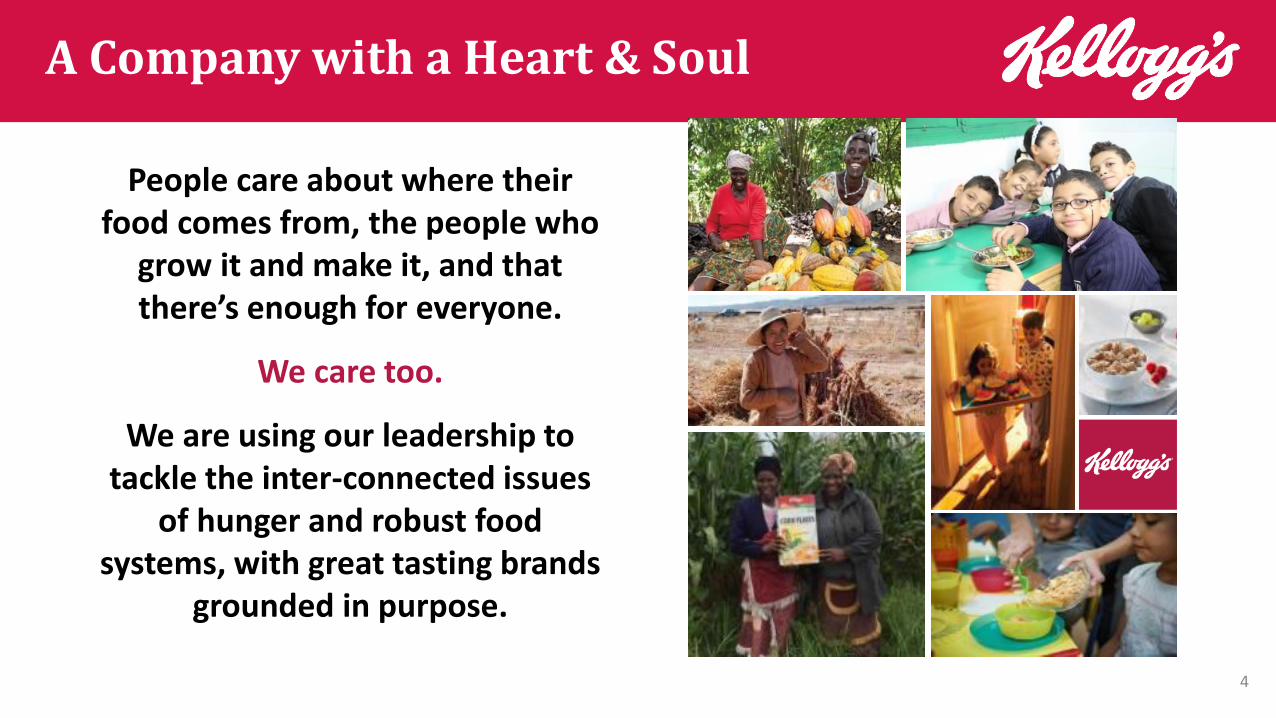
People care about where their
food comes from, the people who
grow it and make it, and that
there’s enough for everyone.
We care too.
We are using our leadership to
tackle the inter-connected issues
of hunger and robust food
systems, with great tasting brands
grounded in purpose.
A Company with a Heart & Soul
4

AgWater Challenge:
Steward
Most Improved Brand
Pa
lm O
il
A - Climate, Water, Forests
Response
Influencers & Stakeholders Recognize Kellogg Leadership
Kellogg Ranked #1
US-Based Company for
Human Rights Performance
2030 Food Waste &
Loss Champion
Recognized Leadership
Robust commitments and external reporting and validation are the
foundation for communication about food credentials and social purpose
5

2020 Growth Plan
6

8
Who We Are
A Company With a Heart and Soul
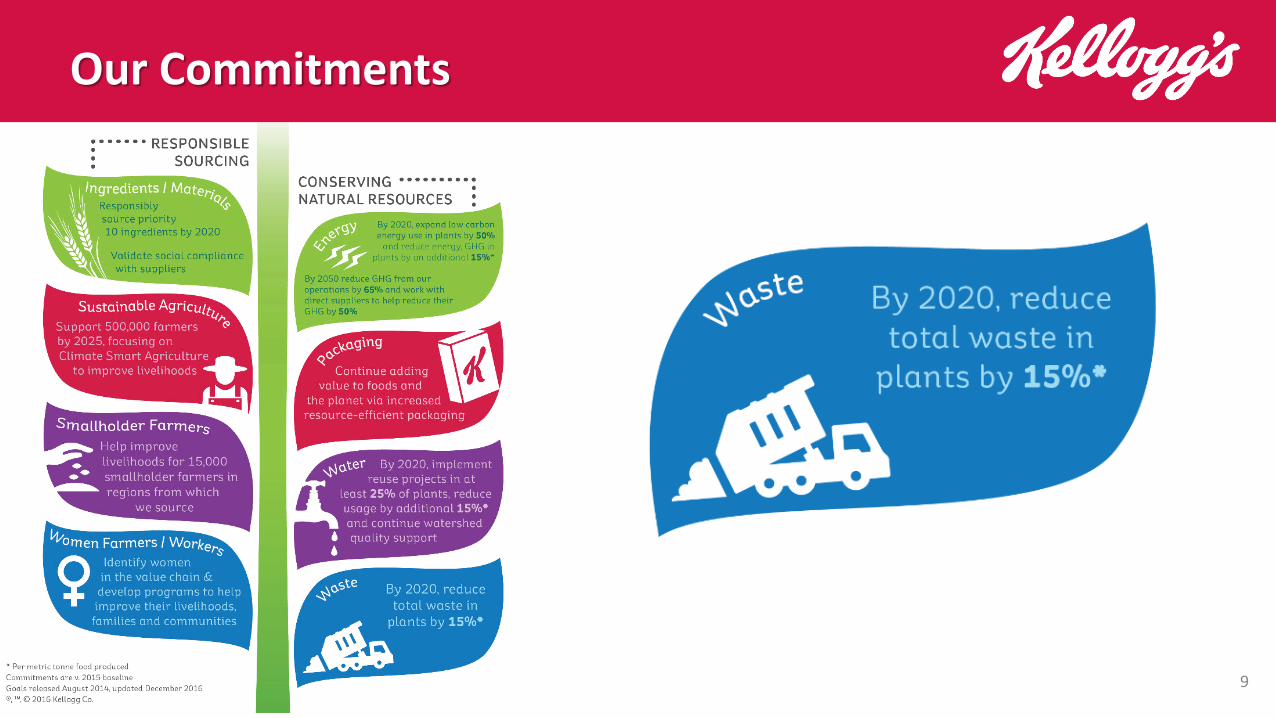
Our Commitments
9

7.1M Gallons of water reduced in just one plant per
year through conservation initiatives
15,200 Smallholder farmers supported through
Kellogg programs from 2014-2016
1,000,000 pounds of packaging avoided in just one of
dozens packaging reduction initiatives in 2016
294,000 farmers supported directly and indirectly
Through programs from 2014-2017
$28M 2005-2015 in Energy and Water Cost Savings
in our manufacturing sites
$30M Potential cost savings from 15% food waste
reduction
10,000 Women farmers and workers supported
through Kellogg programs from 2014-2017
35+ 35 Kellogg’s OriginsTM Projects in 5 continents to support best practices in sustainable agriculture
10

Benefits of FLW Protocol
1. Consistent language for measurement and benchmarking
2. Increased awareness and alignment of reporting
requirements

Food Loss and Waste Inventory

Food Loss and Waste Public Reporting

Challenge: Data collection
Our first challenge was to
identify which Kellogg
facilities needed
1. New ways to record
food waste data in our
internal tracking system
2. To split apart food waste
that was previously
being reported in a
combined fashion.
Incineration
Waste - incineration
Food waste - incineration
General waste - incineration
Sludge - incineration
Sludge - incineration
New
Category
Anaerobic digestion
Sludge - recycled
Sludge – Anaerobic digestion
Sludge - Recycled
Food Waste – Anaerobic digestion
New
Category
New
Category
Before FLW Standard

Challenge: Assumptions and Calculations
Anaerobic digestion
Sludge - recycled
Sludge – Anaerobic digestion
Sludge - Recycled
Food Waste – Anaerobic digestion
Assumption
*Qualitative estimate based on a scale of 1–10,
with 10 signifying very accurate data
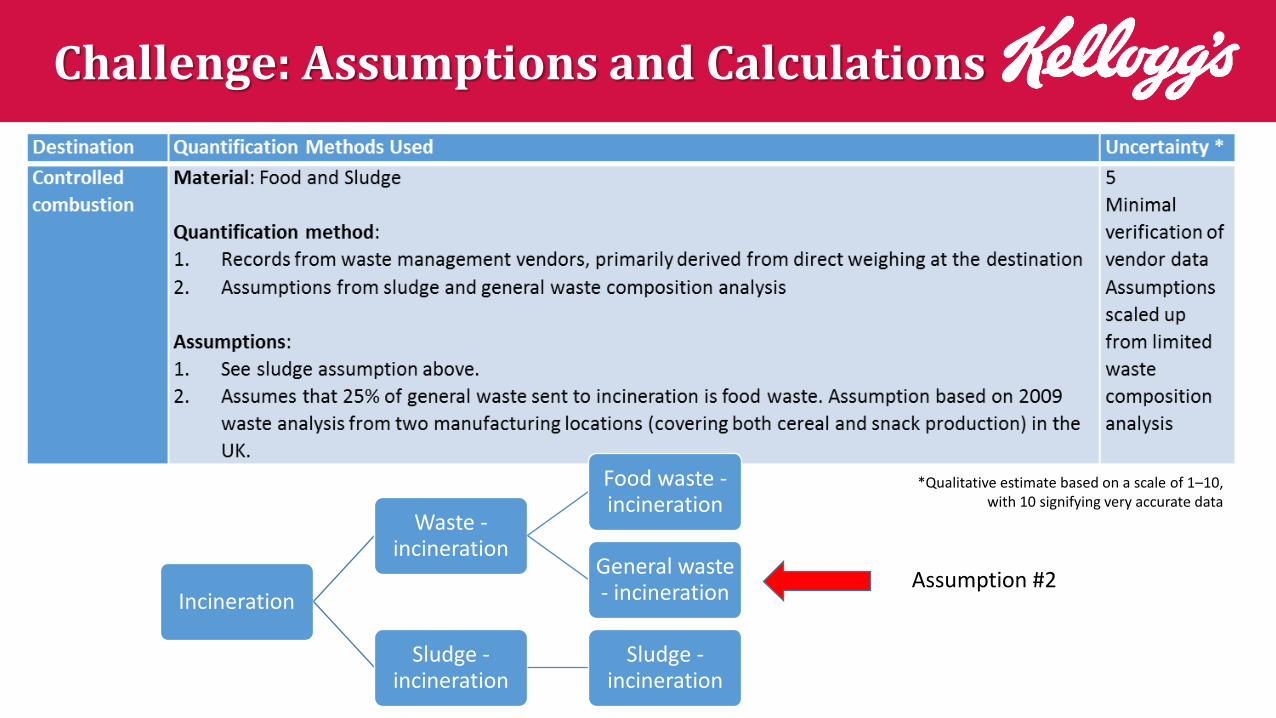
Challenge: Assumptions and Calculations
Incineration
Waste - incineration
Food waste - incineration
General waste - incineration
Sludge - incineration
Sludge - incineration
Assumption #2
*Qualitative estimate based on a scale of 1–10,
with 10 signifying very accurate data
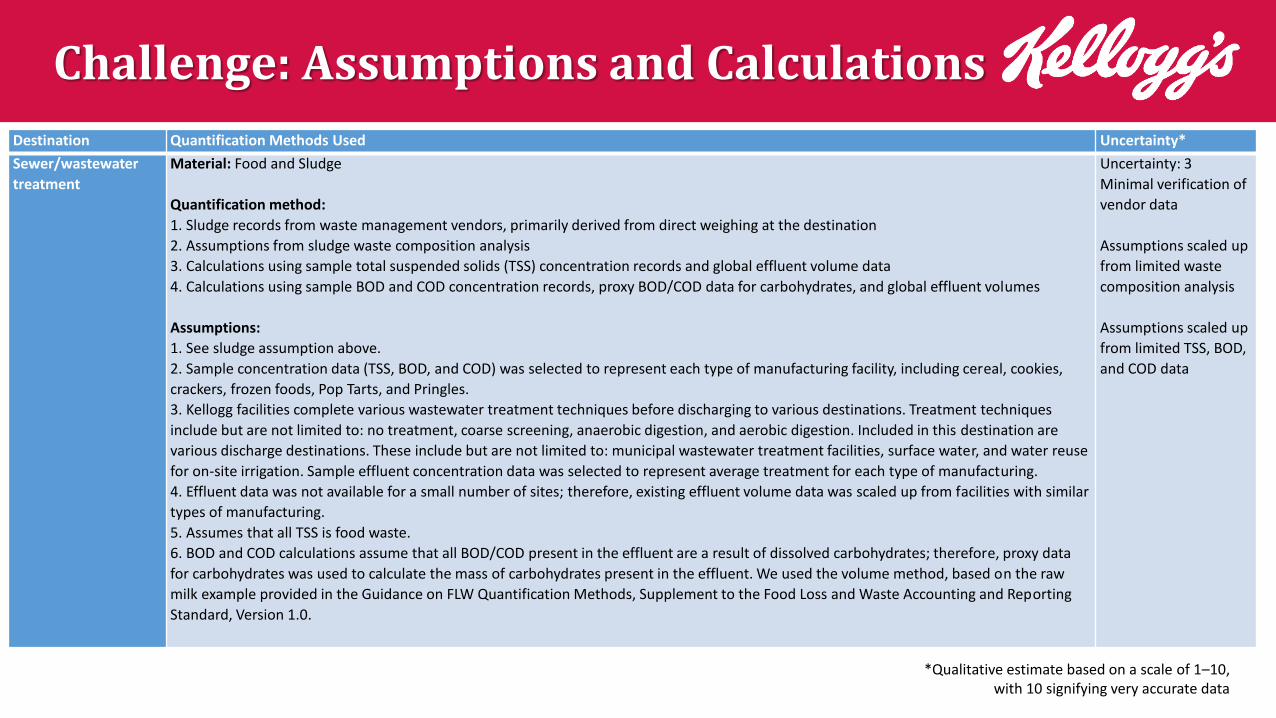
Challenge: Assumptions and Calculations
*Qualitative estimate based on a scale of 1–10,
with 10 signifying very accurate data
Destination Quantification Methods Used Uncertainty*
Sewer/wastewater
treatment
Material: Food and Sludge
Quantification method:
1. Sludge records from waste management vendors, primarily derived from direct weighing at the destination
2. Assumptions from sludge waste composition analysis
3. Calculations using sample total suspended solids (TSS) concentration records and global effluent volume data
4. Calculations using sample BOD and COD concentration records, proxy BOD/COD data for carbohydrates, and global effluent volumes
Assumptions:
1. See sludge assumption above.
2. Sample concentration data (TSS, BOD, and COD) was selected to represent each type of manufacturing facility, including cereal, cookies,
crackers, frozen foods, Pop Tarts, and Pringles.
3. Kellogg facilities complete various wastewater treatment techniques before discharging to various destinations. Treatment techniques
include but are not limited to: no treatment, coarse screening, anaerobic digestion, and aerobic digestion. Included in this destination are
various discharge destinations. These include but are not limited to: municipal wastewater treatment facilities, surface water, and water reuse
for on-site irrigation. Sample effluent concentration data was selected to represent average treatment for each type of manufacturing.
4. Effluent data was not available for a small number of sites; therefore, existing effluent volume data was scaled up from facilities with similar
types of manufacturing.
5. Assumes that all TSS is food waste.
6. BOD and COD calculations assume that all BOD/COD present in the effluent are a result of dissolved carbohydrates; therefore, proxy data
for carbohydrates was used to calculate the mass of carbohydrates present in the effluent. We used the volume method, based on the raw
milk example provided in the Guidance on FLW Quantification Methods, Supplement to the Food Loss and Waste Accounting and Reporting
Standard, Version 1.0.
Uncertainty: 3
Minimal verification of
vendor data
Assumptions scaled up
from limited waste
composition analysis
Assumptions scaled up
from limited TSS, BOD,
and COD data
Questions
Erin Augustine
Senior Sustainability Manager
Kellogg Company
269-961-6368