Kellogg Company February 18, 2009investor.kelloggs.com/.../Kelloggs-2009-CAGNY-slides.pdfFebruary...
43
Kellogg Company February 18, 2009 Kellogg Company February 18, 2009
-
Upload
truonghanh -
Category
Documents
-
view
218 -
download
2
Transcript of Kellogg Company February 18, 2009investor.kelloggs.com/.../Kelloggs-2009-CAGNY-slides.pdfFebruary...
Kellogg CompanyFebruary 18, 2009Kellogg CompanyFebruary 18, 2009
Forward-Looking StatementsForward-Looking Statements
This presentation contains, or incorporates by reference, “forward-looking statements” withprojections concerning, among other things, the Company’s strategy, and the Company’s sales, earnings, margin, operating profit, costs and expenditures, interest expense, tax rate, capital expenditure, dividends, cash flow, debt reduction, share repurchases, costs, brand building, ROIC, working capital, growth, new products, innovation, cost reduction projects, and competitive pressures. Forward-looking statements include predictions of future results or activities and may contain the words “expects,” “believes,” “should,” “will,” “will deliver,”“anticipates,” “projects,” “estimates,” or words or phrases of similar meaning.
The Company’s actual results or activities may differ materially from these predictions. The Company’s future results could also be affected by a variety of other factors, including competitive conditions and their impact; the effectiveness of pricing, advertising, and promotional spending programs; the success of productivity improvements and business transitions; the success of innovation and new product introductions; the recoverability of carrying amounts of goodwill and other intangibles; the availability of and interest rates on short-term financing; changes in consumer behavior and preferences; commodity and energy prices and labor costs; actual market performance of benefit plan trust investments; the levels of spending on systems initiatives, properties, business opportunities, integration of acquired businesses, and other general and administrative costs; U.S. and foreign economic conditions including interest rates, taxes and tariffs, and currency rate translations or unavailability; legal and regulatory factors; the ultimate impact of product recalls; the underlying price and volatility of the Company’s common stock and the impact of equity-based employee awards; business disruption or other losses from terrorist acts or political unrest; and other items.
Forward-looking statements speak only as of the date they were made, and the Company undertakes no obligation to publicly update them.
President and Chief Executive Officer
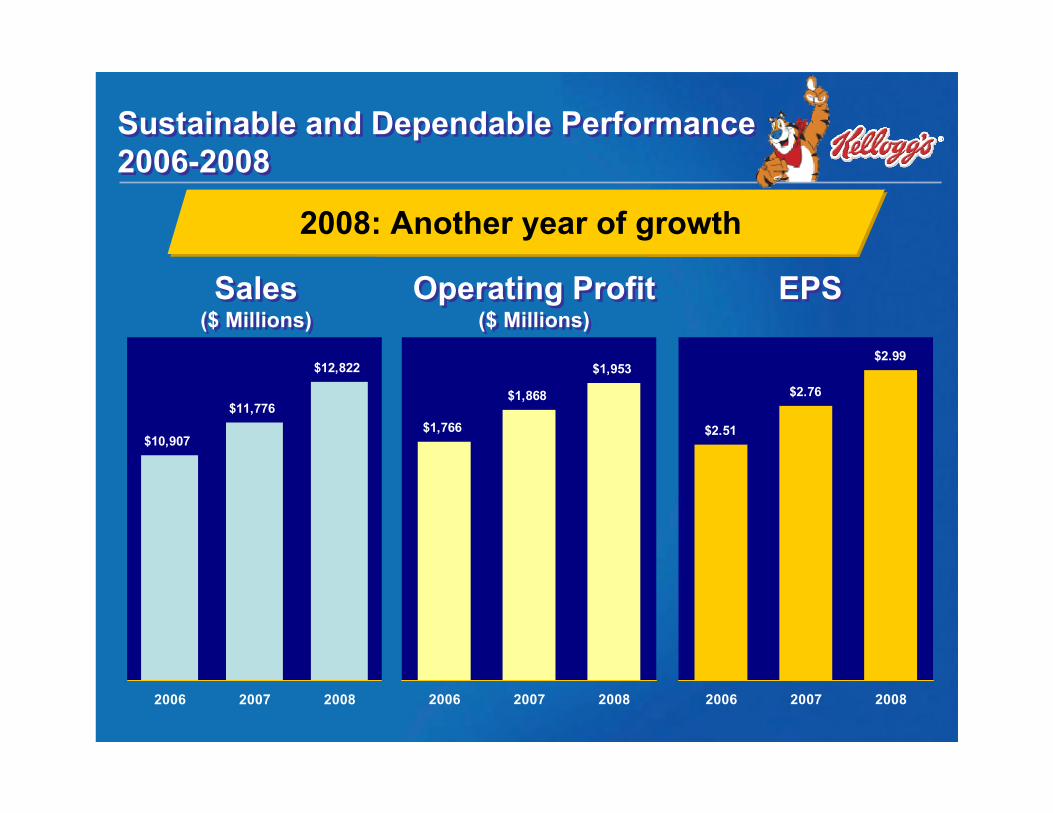
Sustainable and Dependable Performance2006-2008Sustainable and Dependable Performance2006-2008
2008: Another year of growth
$10,907
$11,776
$12,822
2006 2007 2008
Sales($ Millions)Sales
($ Millions)
$1,766
$1,868
$1,953
2006 2007 2008
$2.51
$2.76
$2.99
2006 2007 2008
Operating Profit($ Millions)
Operating Profit($ Millions)
EPSEPS
What Has Not Changed What Has Not Changed
● Focused Strategy
● Business Model
● Operating Principles
● Focused Strategy
● Business Model
● Operating Principles
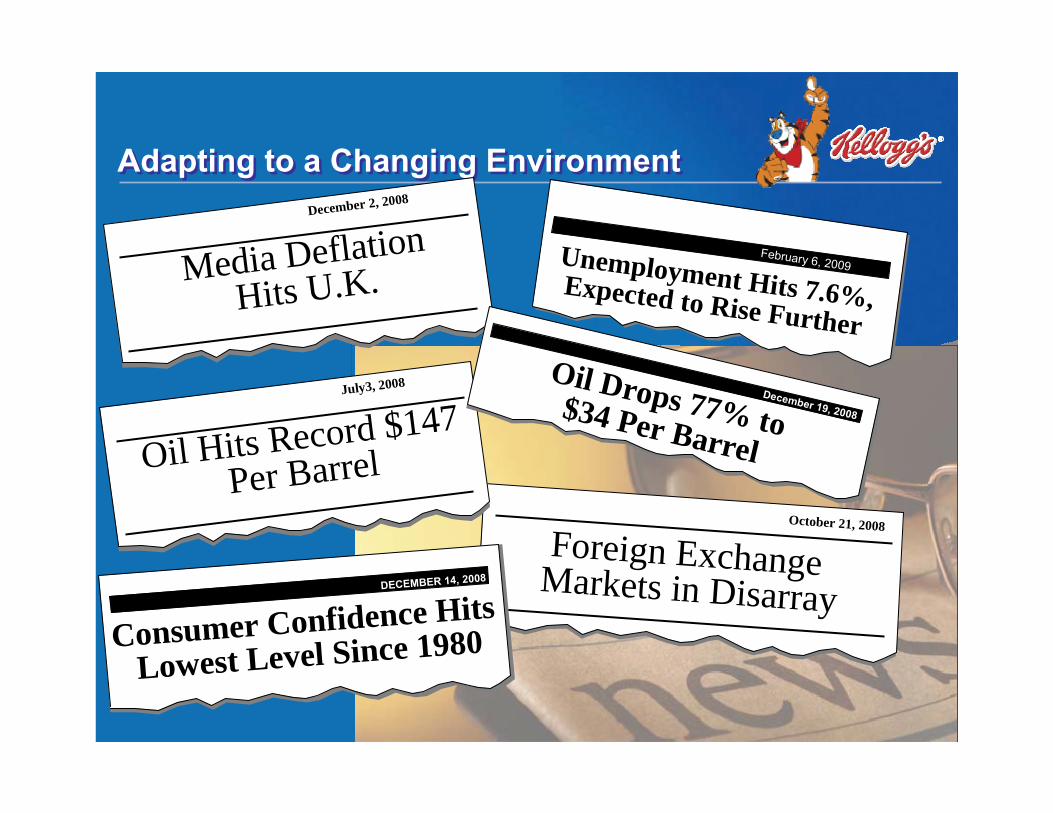
Adapting to a Changing EnvironmentAdapting to a Changing Environment
October 21, 2008
Foreign ExchangeMarkets in Disarray
Unemployment Hits 7.6%,Expected to Rise Further
December 2, 2008
Media DeflationHits U.K.
July3, 2008
Oil Hits Record $147
Per Barrel
Oil Drops 77% to $34 Per Barrel
December 19, 2008
Consumer Confidence Hits
Lowest Level Since 1980
DECEMBER 14, 2008
February 6, 2009
Adapting to a Changing EnvironmentAdapting to a Changing Environment
●Consumers are more value conscious
●Our customers are more value and cash focused
●Cash is king
●Consumers are more value conscious
●Our customers are more value and cash focused
●Cash is king
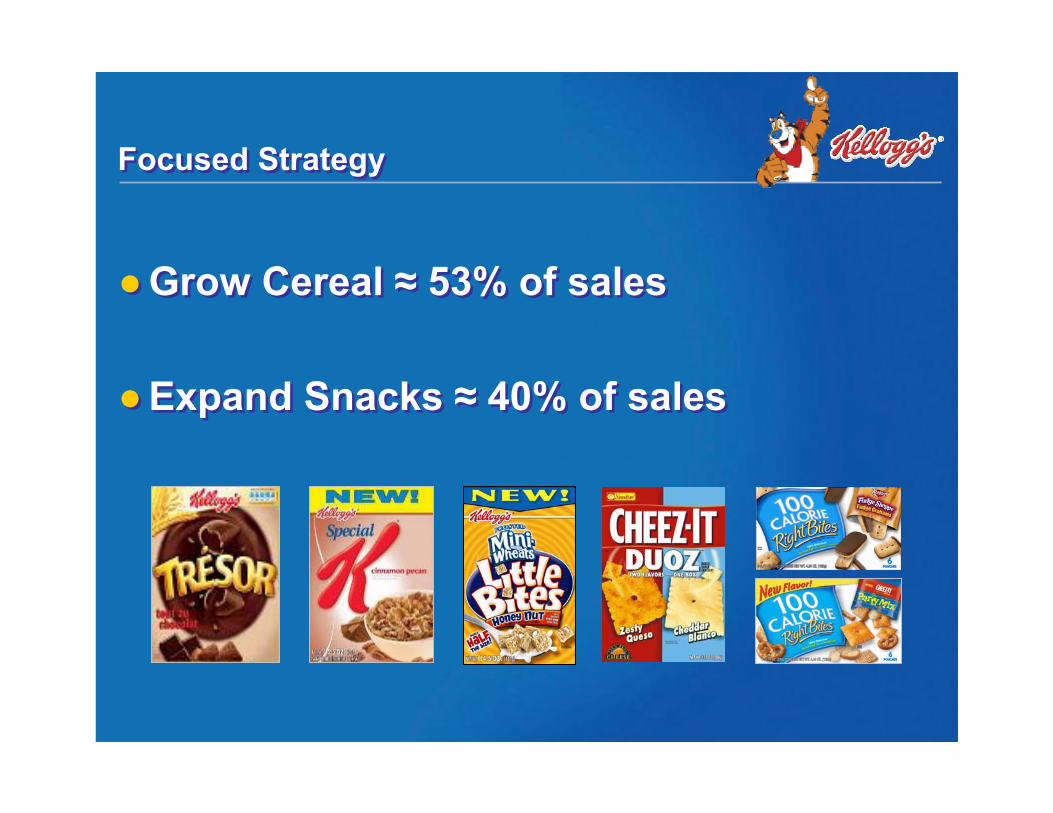
Focused StrategyFocused Strategy
●Grow Cereal ≈ 53% of sales
●Expand Snacks ≈ 40% of sales
●Grow Cereal ≈ 53% of sales
●Expand Snacks ≈ 40% of sales
$0
$2
$4
$6
$8
$10
$12
CarbonatedBeverages
Salty Snacks Cold Cereal TotalChocolate
Candy
Soup Bottled Juices- SS
Cookies Crackers Bottled Water Coffee
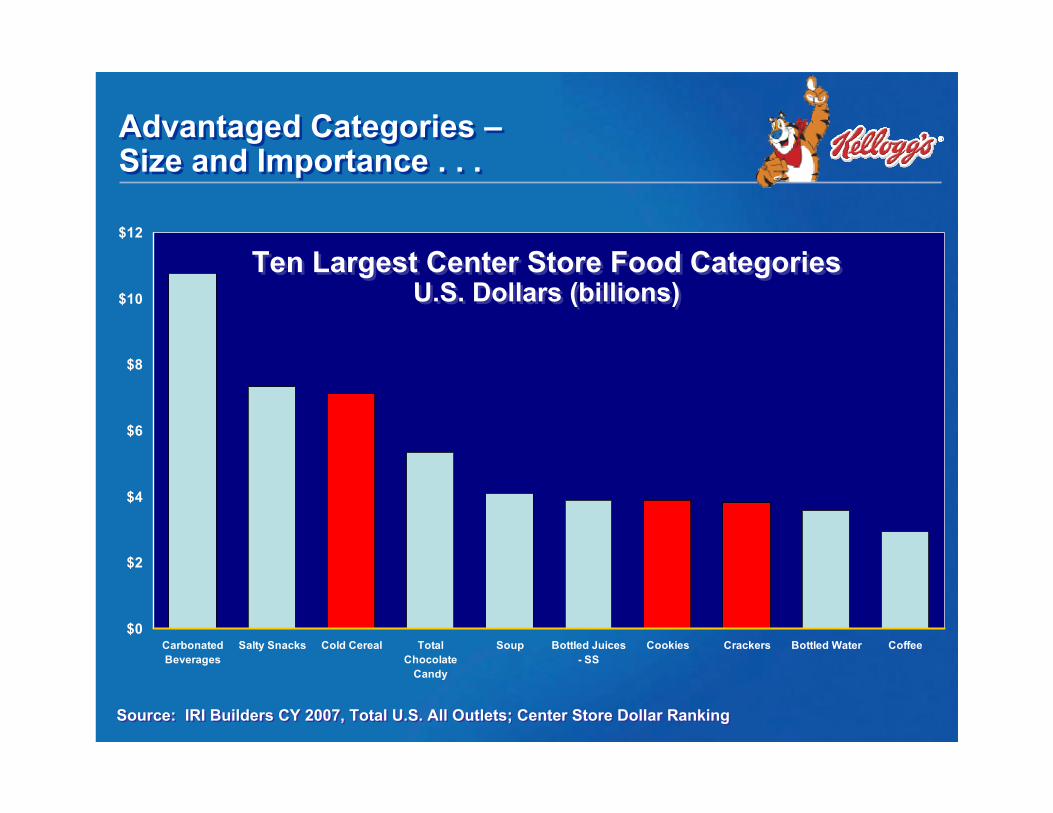
Ten Largest Center Store Food CategoriesU.S. Dollars (billions)
Ten Largest Center Store Food CategoriesU.S. Dollars (billions)
Advantaged Categories –Size and Importance . . . Advantaged Categories –Size and Importance . . .
Source: IRI Builders CY 2007, Total U.S. All Outlets; Center Store Dollar Ranking Source: IRI Builders CY 2007, Total U.S. All Outlets; Center Store Dollar Ranking
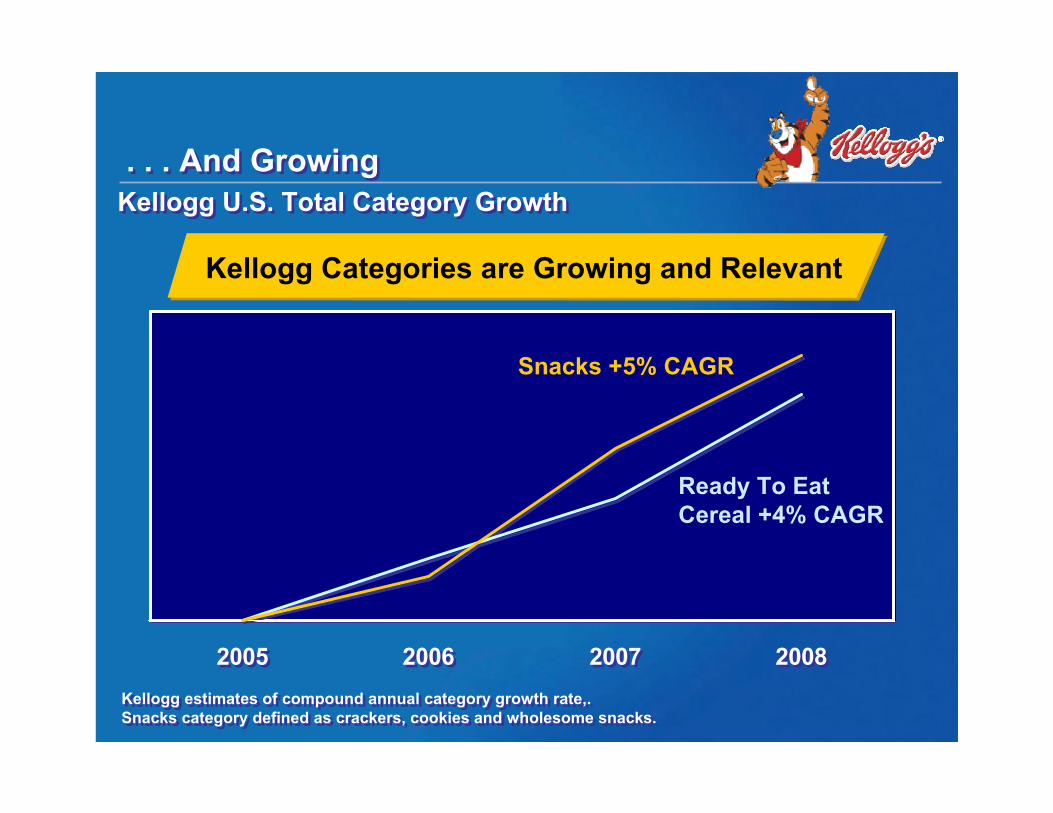
2005 2006 2007 20082005 2006 2007 2008
. . . And Growing Kellogg U.S. Total Category Growth. . . And Growing
Kellogg U.S. Total Category Growth
Kellogg Categories are Growing and Relevant
Kellogg estimates of compound annual category growth rate,.Snacks category defined as crackers, cookies and wholesome snacks.Kellogg estimates of compound annual category growth rate,.Snacks category defined as crackers, cookies and wholesome snacks.
Ready To Eat Cereal +4% CAGR
Snacks +5% CAGR
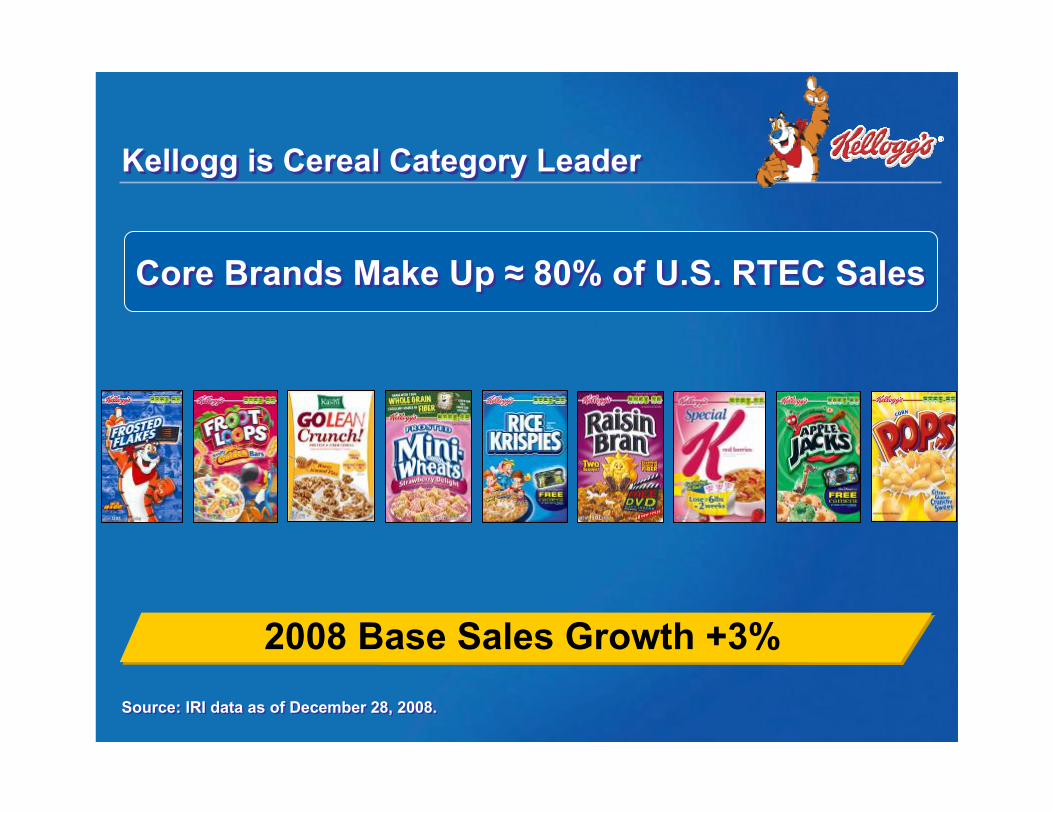
Kellogg is Cereal Category LeaderKellogg is Cereal Category Leader
Core Brands Make Up ≈ 80% of U.S. RTEC Sales Core Brands Make Up ≈ 80% of U.S. RTEC Sales
Source: IRI data as of December 28, 2008. Source: IRI data as of December 28, 2008.
2008 Base Sales Growth +3%
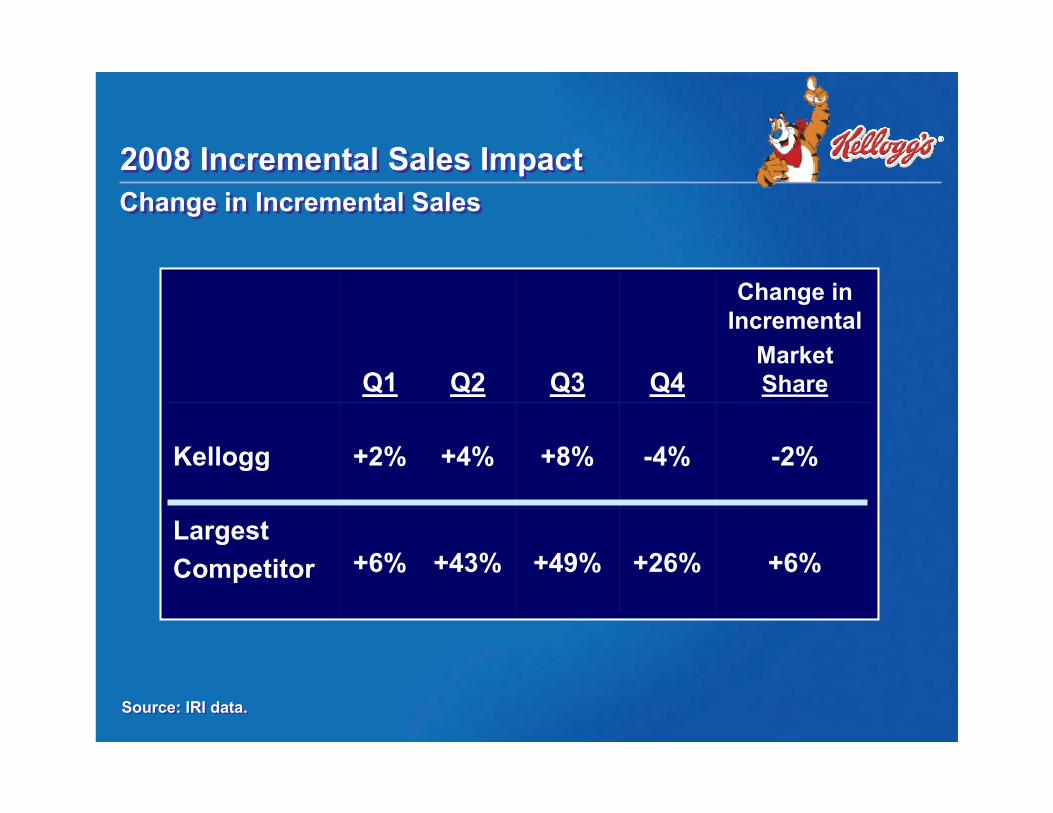
+49%
+8%
Q3
+26%
-4%
Q4
+6%+43%+6%LargestCompetitor
-2%+4%+2%Kellogg
Change in Incremental
Market ShareQ2Q1
2008 Incremental Sales Impact2008 Incremental Sales ImpactChange in Incremental SalesChange in Incremental Sales
Source: IRI data.Source: IRI data.
Focused StrategyFocused Strategy
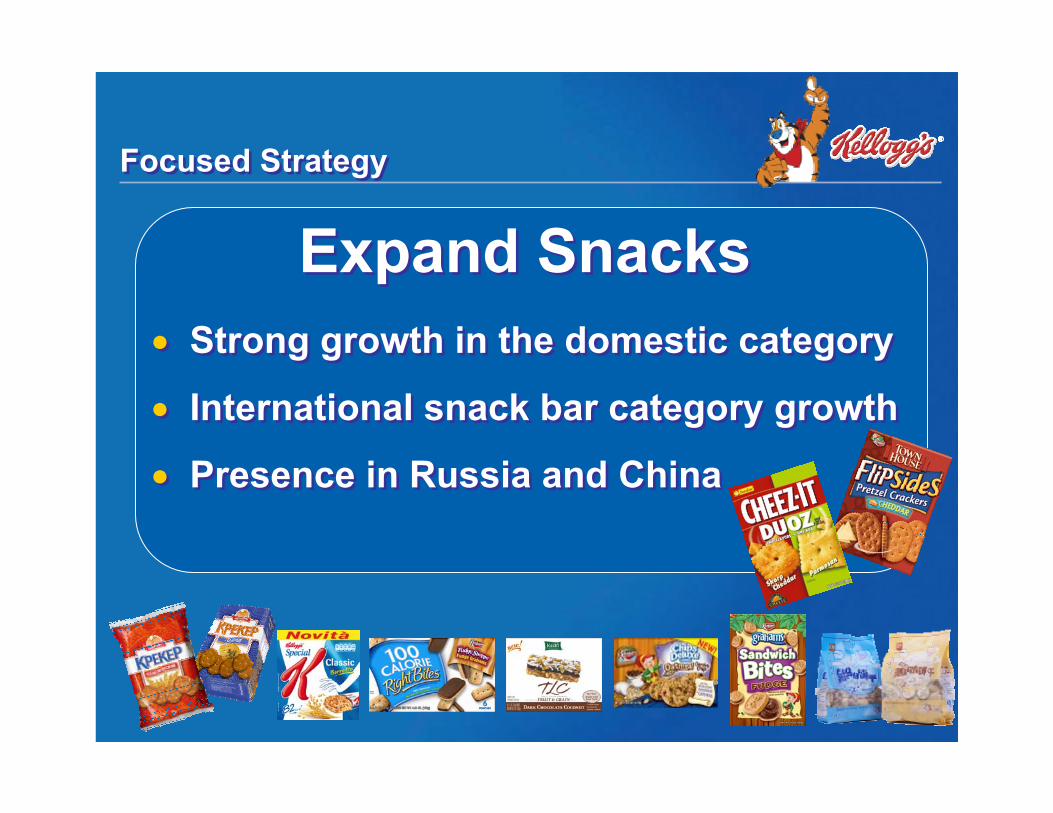
• Strong growth in the domestic category
• International snack bar category growth
• Presence in Russia and China
• Strong growth in the domestic category
• International snack bar category growth
• Presence in Russia and China
Expand SnacksExpand Snacks
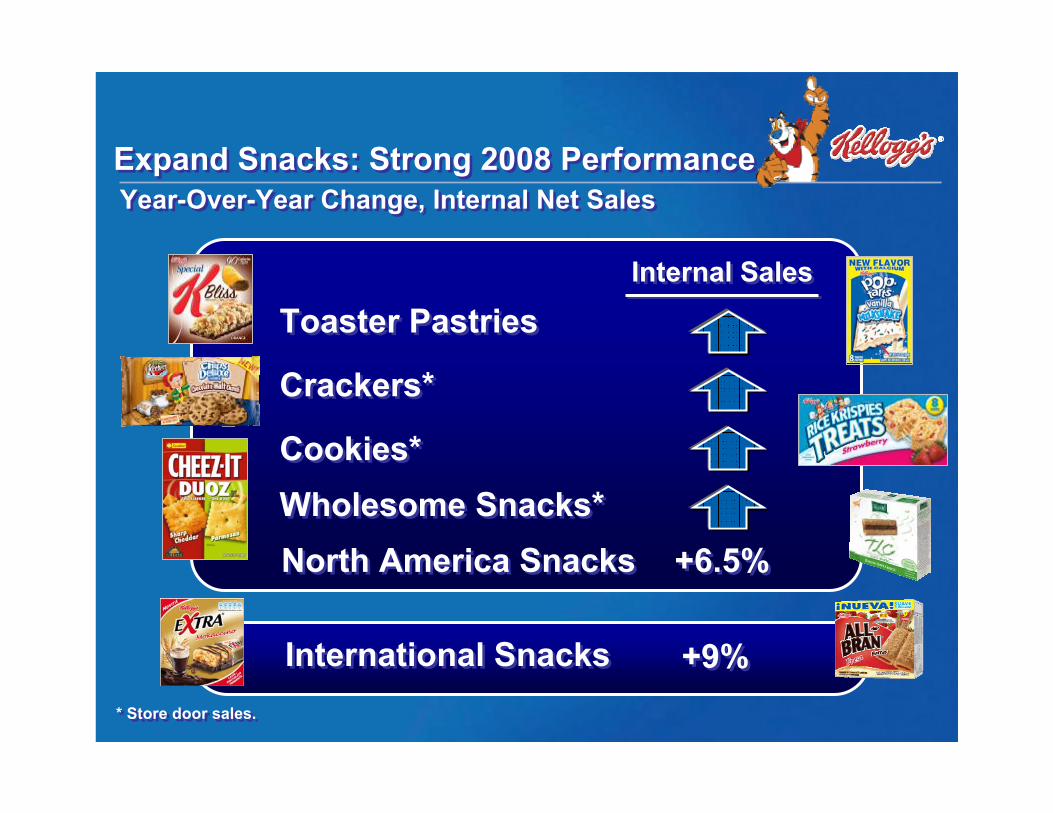
Expand Snacks: Strong 2008 PerformanceExpand Snacks: Strong 2008 PerformanceYear-Over-Year Change, Internal Net SalesYear-Over-Year Change, Internal Net Sales
Toaster PastriesToaster Pastries
Crackers*Crackers*
Cookies*Cookies*
Wholesome Snacks*Wholesome Snacks*
* Store door sales.* Store door sales.
+6.5%+6.5%
Internal SalesInternal Sales
North America SnacksNorth America Snacks
International Snacks International Snacks +9%+9%
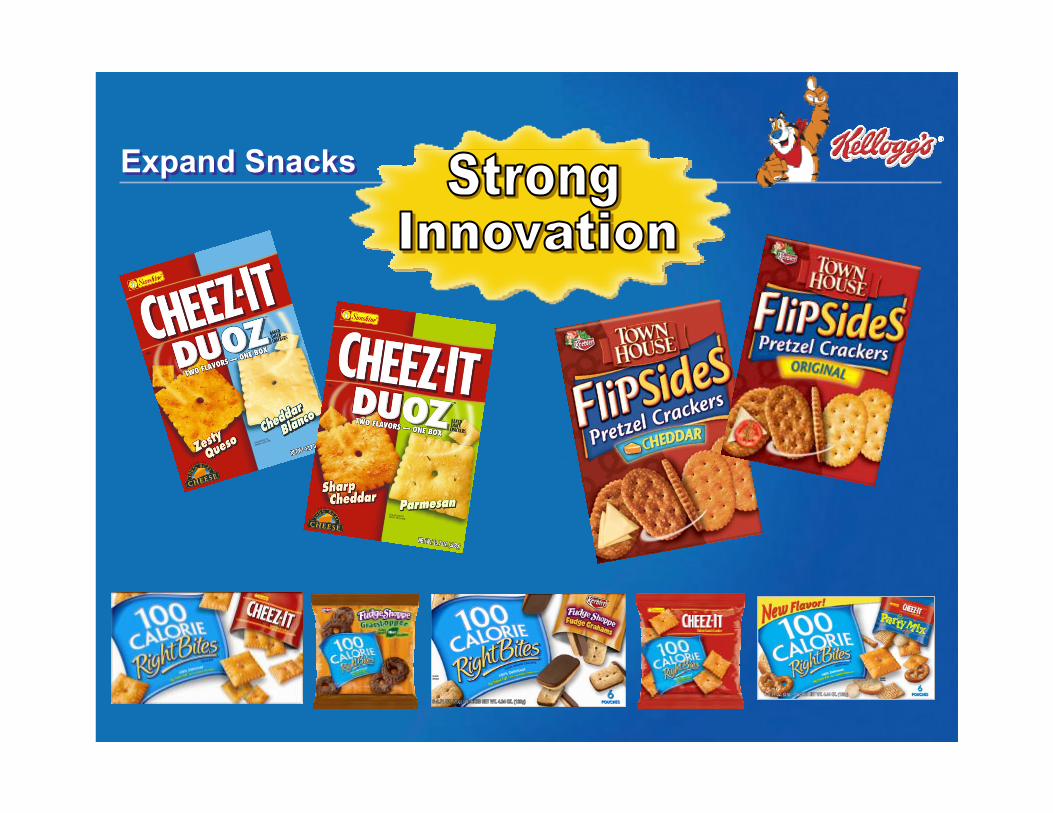
Expand SnacksExpand Snacks
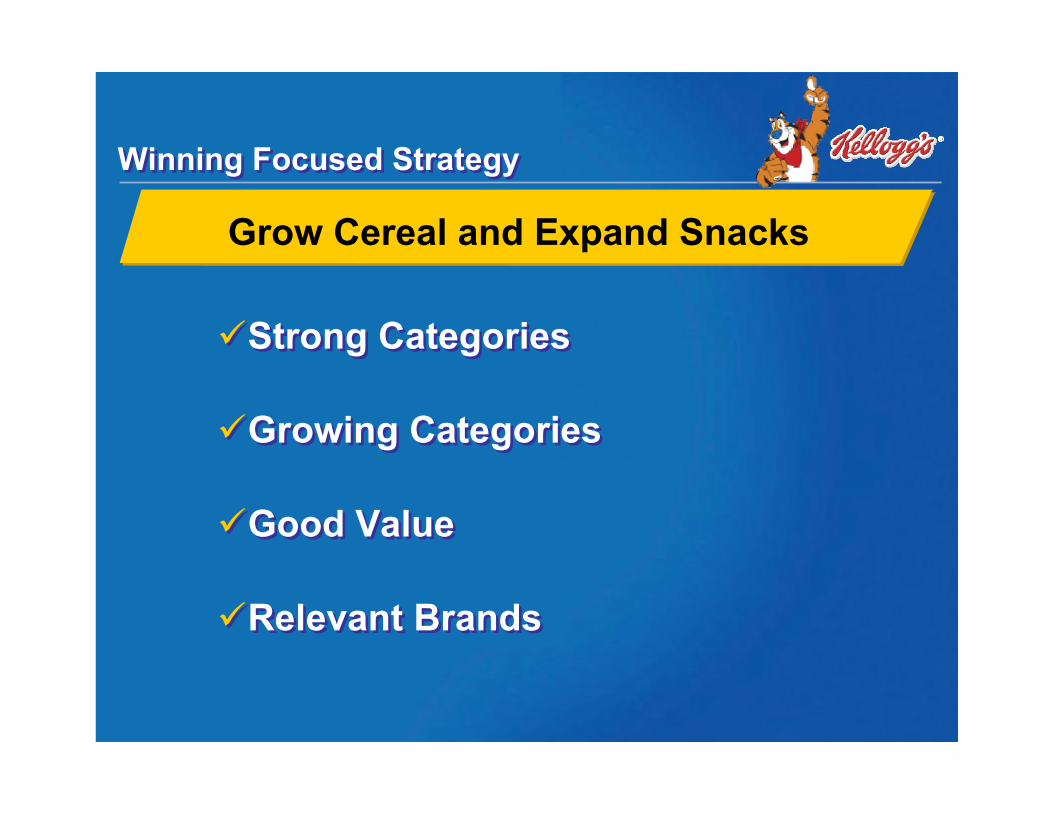
Winning Focused StrategyWinning Focused Strategy
Grow Cereal and Expand Snacks
Strong Categories
Growing Categories
Good Value
Relevant Brands
Strong Categories
Growing Categories
Good Value
Relevant Brands

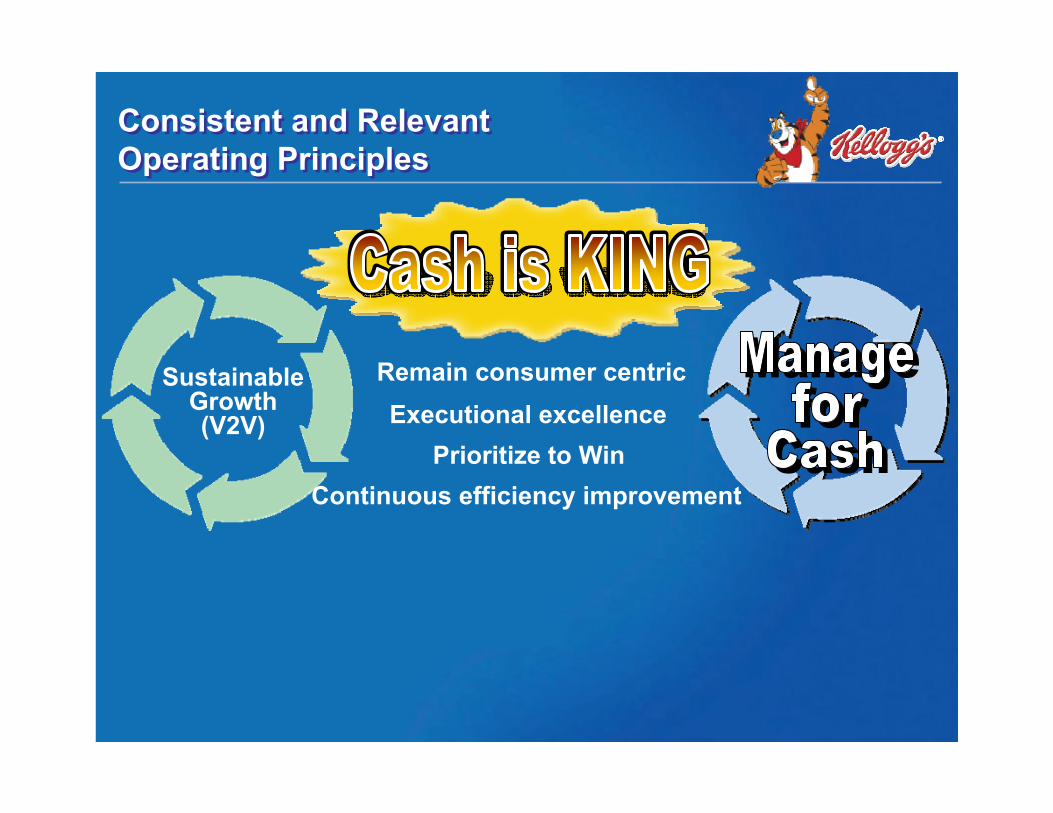
SustainableGrowth(V2V)
Remain consumer centricExecutional excellence
Prioritize to Win
Managefor
Cash
Consistent and Relevant Operating PrinciplesConsistent and Relevant Operating Principles

Consistent and Relevant Business ModelConsistent and Relevant Business Model
● Realistic targets
● Invest in brand building
● Strong innovation
●
● Realistic targets
● Invest in brand building
● Strong innovation
●
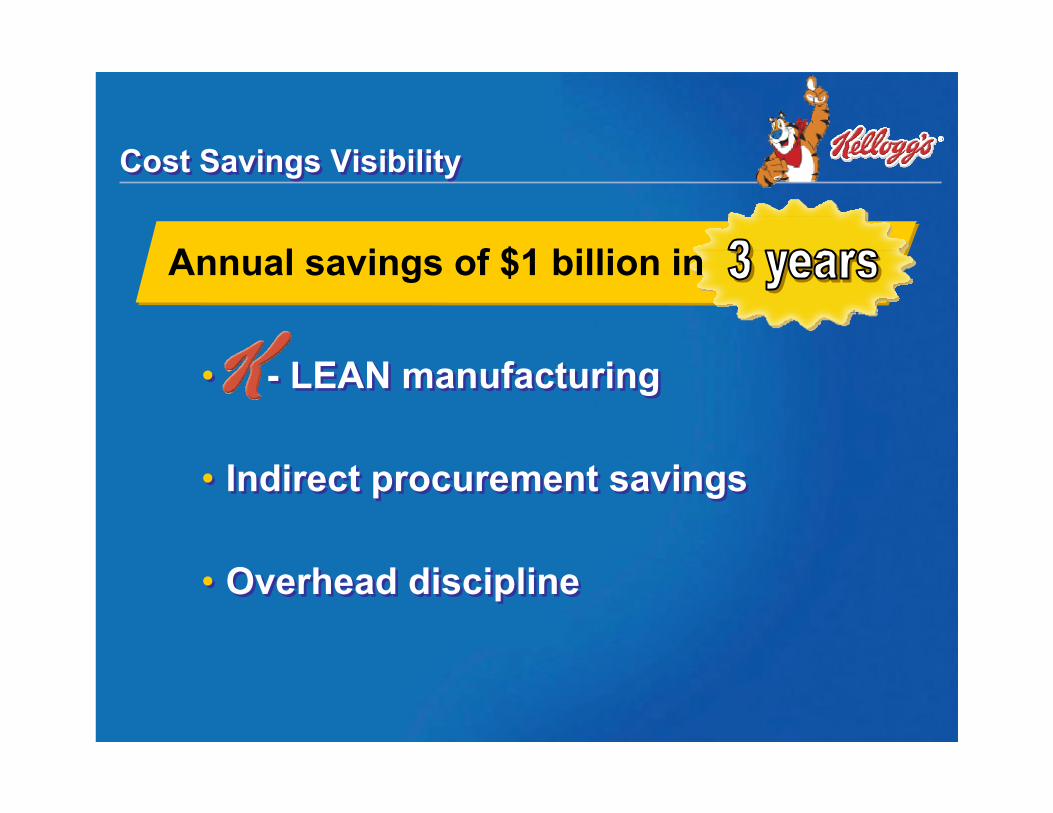
Cost Savings VisibilityCost Savings Visibility
• - LEAN manufacturing
• Indirect procurement savings
• Overhead discipline
• - LEAN manufacturing
• Indirect procurement savings
• Overhead discipline
Annual savings of $1 billion in
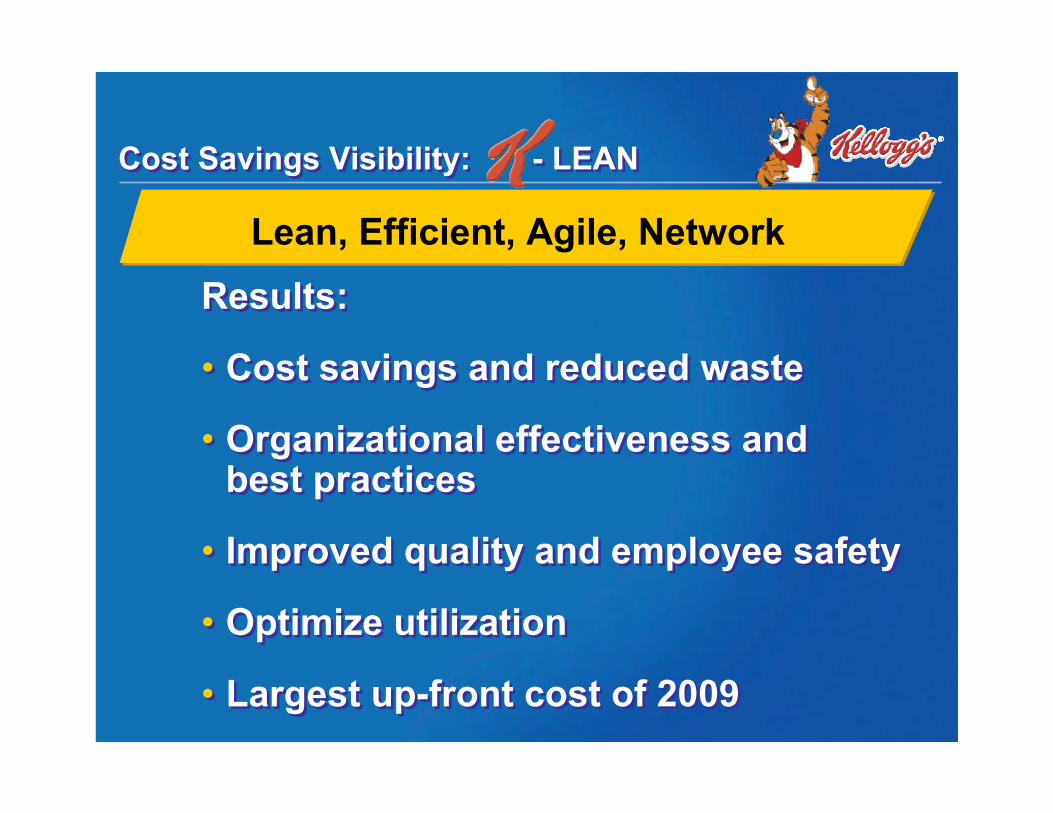
Cost Savings Visibility: - LEANCost Savings Visibility: - LEAN
Lean, Efficient, Agile, Network
Results:
• Cost savings and reduced waste
• Organizational effectiveness and best practices
• Improved quality and employee safety
• Optimize utilization
• Largest up-front cost of 2009
Results:
• Cost savings and reduced waste
• Organizational effectiveness and best practices
• Improved quality and employee safety
• Optimize utilization
• Largest up-front cost of 2009
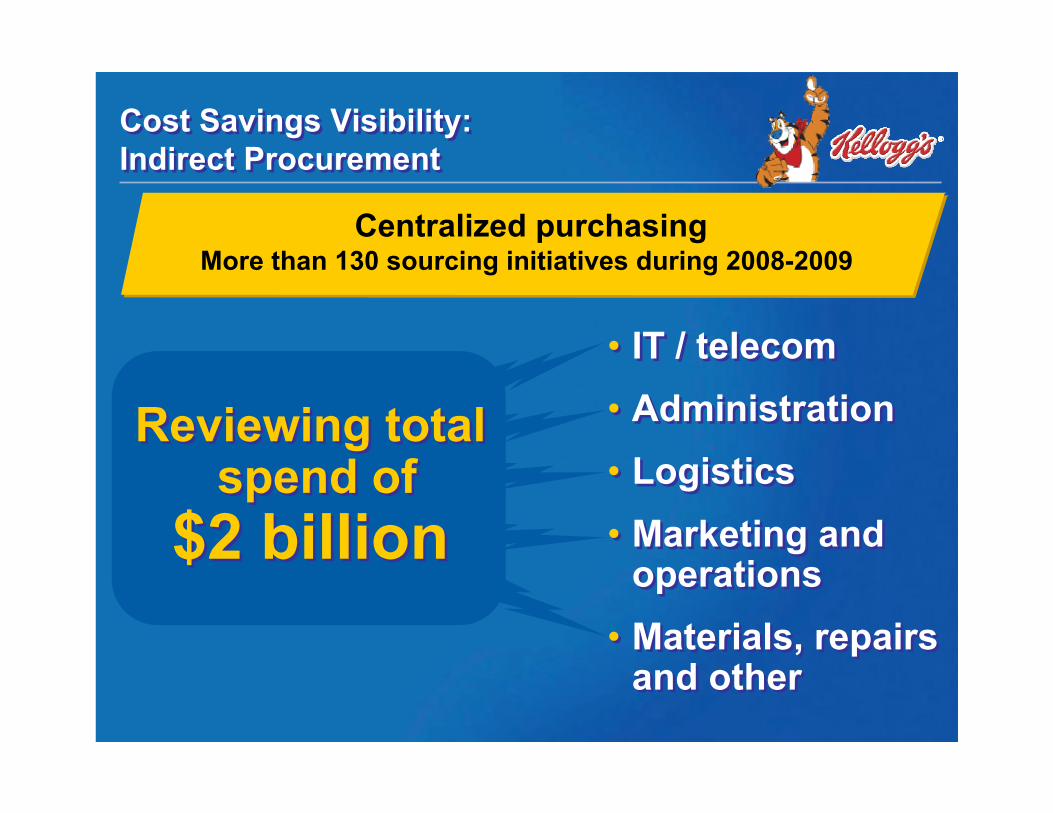
Centralized purchasingMore than 130 sourcing initiatives during 2008-2009
• IT / telecom• Administration• Logistics• Marketing and
operations• Materials, repairs
and other
• IT / telecom• Administration• Logistics• Marketing and
operations• Materials, repairs
and other
Reviewing totalspend of
$2 billion
Reviewing totalspend of
$2 billion
Cost Savings Visibility: Indirect ProcurementCost Savings Visibility: Indirect Procurement
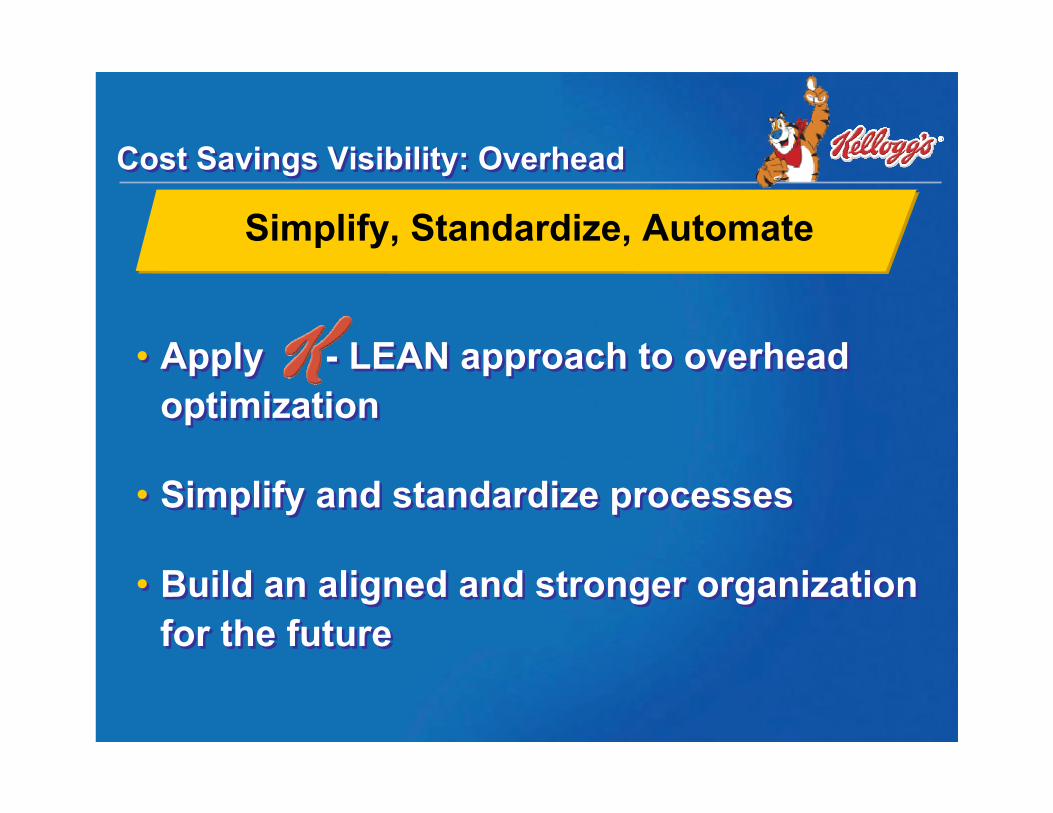
Simplify, Standardize, Automate
• Apply - LEAN approach to overhead optimization
• Simplify and standardize processes
• Build an aligned and stronger organization for the future
• Apply - LEAN approach to overhead optimization
• Simplify and standardize processes
• Build an aligned and stronger organization for the future
Cost Savings Visibility: Overhead Cost Savings Visibility: Overhead
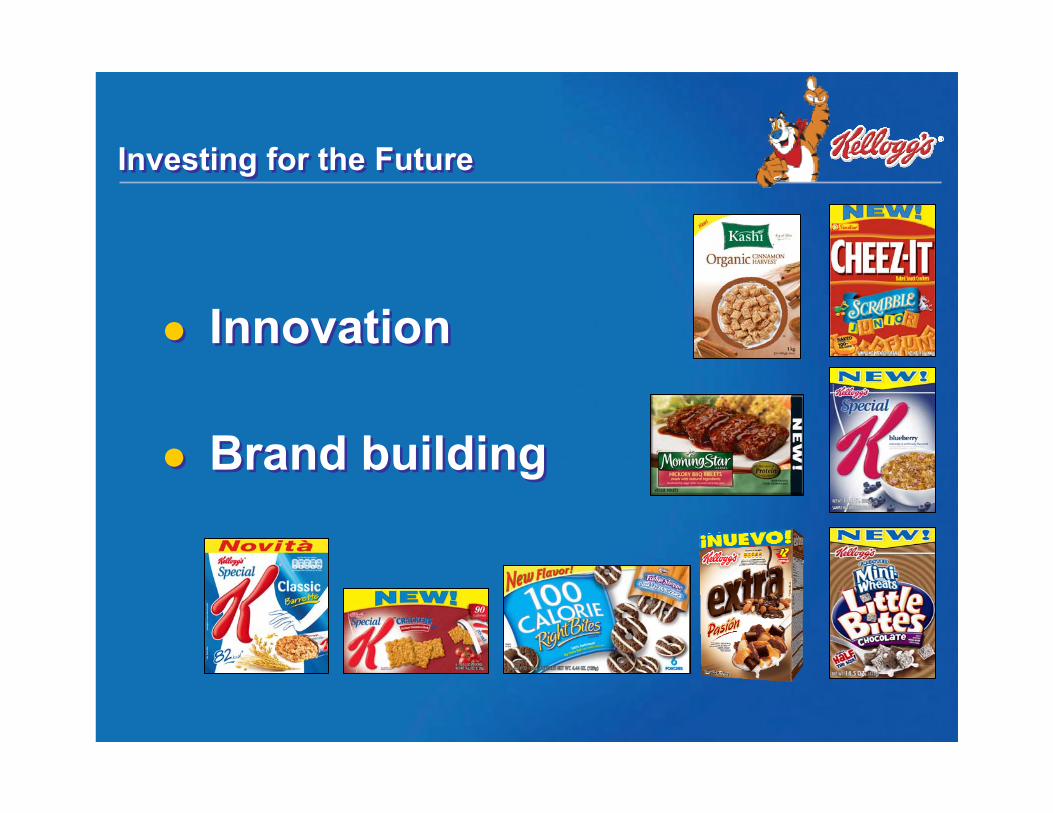
Investing for the FutureInvesting for the Future
● Innovation
● Brand building
● Innovation
● Brand building
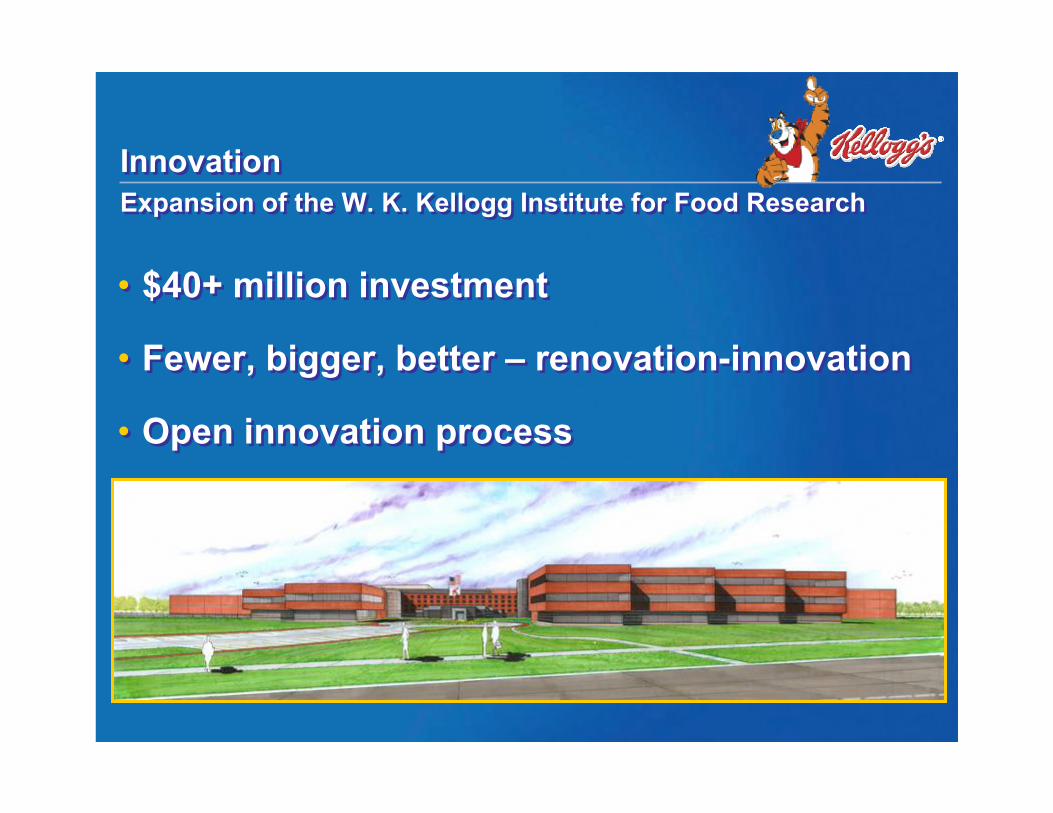
Innovation Expansion of the W. K. Kellogg Institute for Food ResearchInnovation Expansion of the W. K. Kellogg Institute for Food Research
• $40+ million investment
• Fewer, bigger, better – renovation-innovation
• Open innovation process
• $40+ million investment
• Fewer, bigger, better – renovation-innovation
• Open innovation process
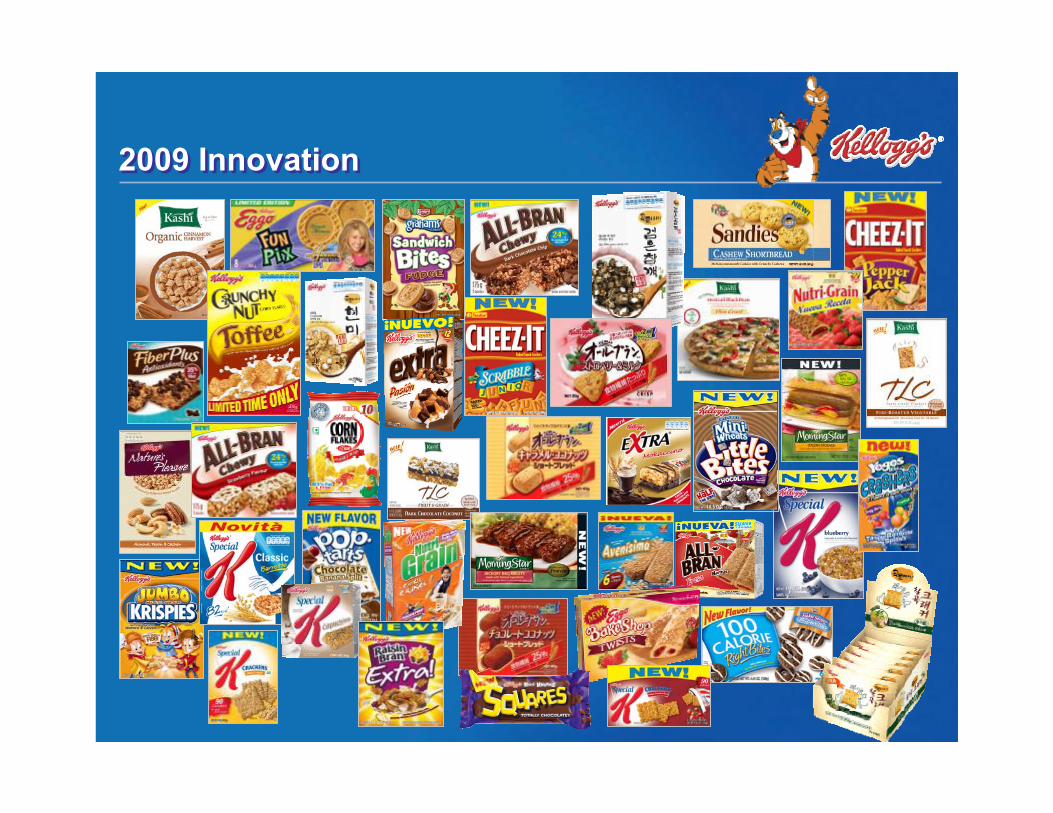
2009 Innovation2009 Innovation
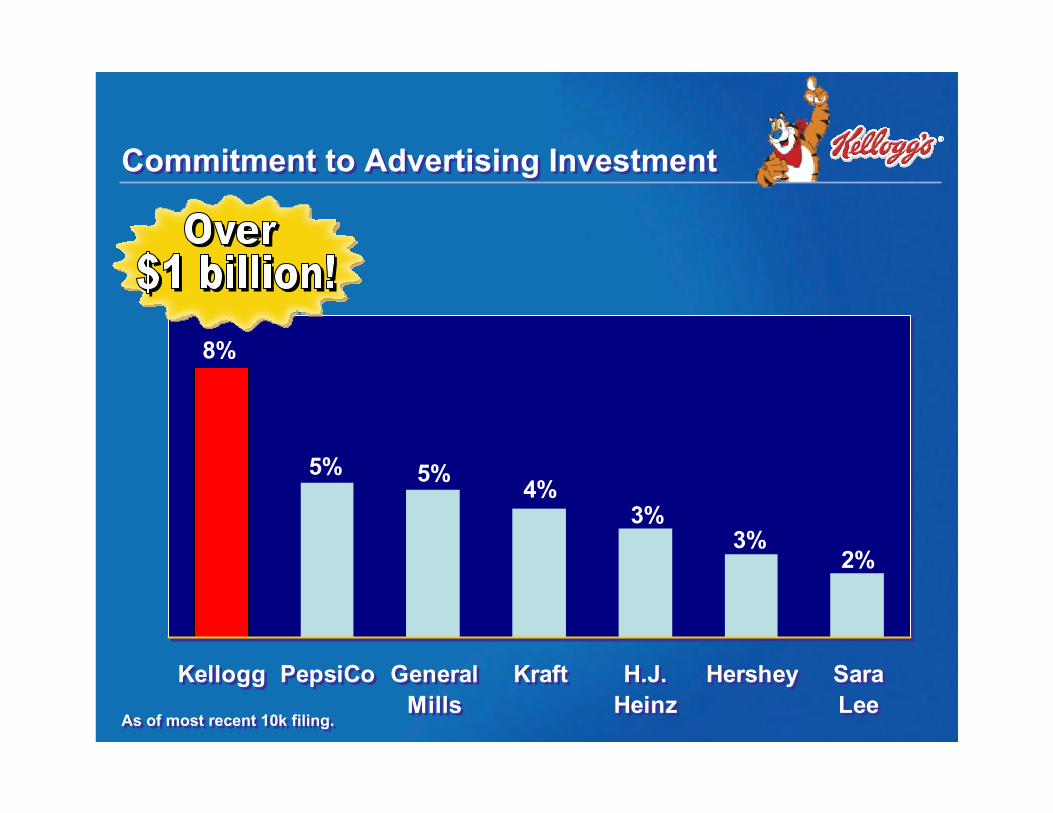
2%3%
3%4%5%5%
8%
Kellogg PepsiCo GeneralMills
Kraft H.J.Heinz
Hershey SaraLee
2%3%
3%4%5%5%
8%
Kellogg PepsiCo GeneralMills
Kraft H.J.Heinz
Hershey SaraLee
Commitment to Advertising InvestmentCommitment to Advertising Investment
As of most recent 10k filing.As of most recent 10k filing.
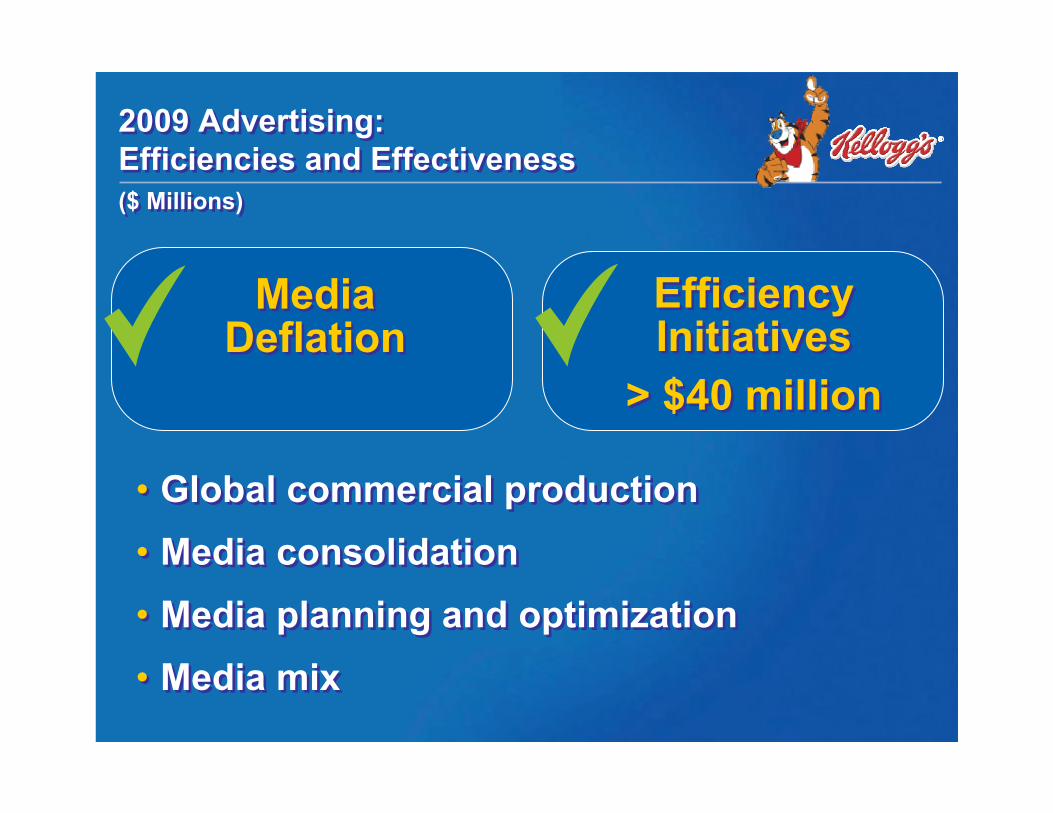
2009 Advertising: Efficiencies and Effectiveness2009 Advertising: Efficiencies and Effectiveness($ Millions)($ Millions)
Media Deflation
Media Deflation
Efficiency Initiatives
> $40 million
Efficiency Initiatives
> $40 million
• Global commercial production• Media consolidation• Media planning and optimization• Media mix
• Global commercial production• Media consolidation• Media planning and optimization• Media mix
Chief Operating and Financial Officer

SustainableGrowth(V2V)
Remain consumer centricExecutional excellence
Prioritize to WinContinuous efficiency improvement
Consistent and Relevant Operating PrinciplesConsistent and Relevant Operating Principles
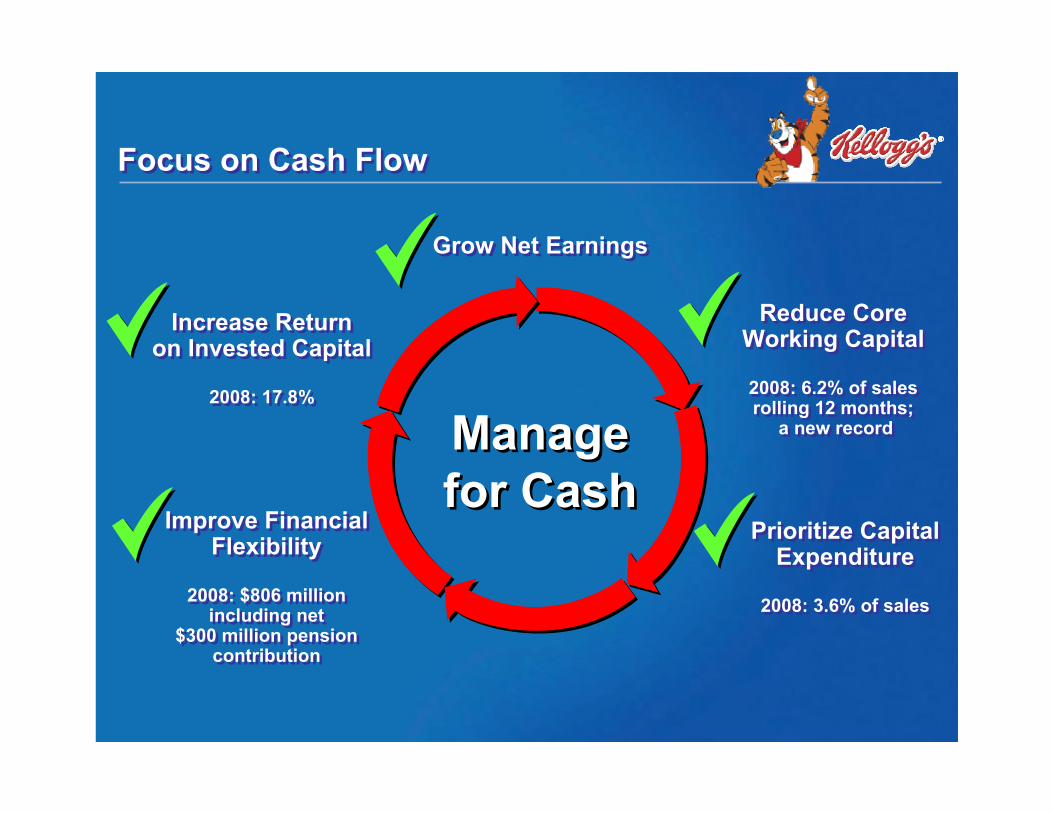
Managefor CashManagefor Cash
Grow Net EarningsGrow Net Earnings
Reduce CoreWorking Capital
2008: 6.2% of sales rolling 12 months;
a new record
Reduce CoreWorking Capital
2008: 6.2% of sales rolling 12 months;
a new record
Prioritize Capital Expenditure
2008: 3.6% of sales
Prioritize Capital Expenditure
2008: 3.6% of sales
Improve Financial Flexibility
2008: $806 million including net
$300 million pension contribution
Improve Financial Flexibility
2008: $806 million including net
$300 million pension contribution
Increase Return on Invested Capital
2008: 17.8%
Increase Return on Invested Capital
2008: 17.8%
Focus on Cash FlowFocus on Cash Flow
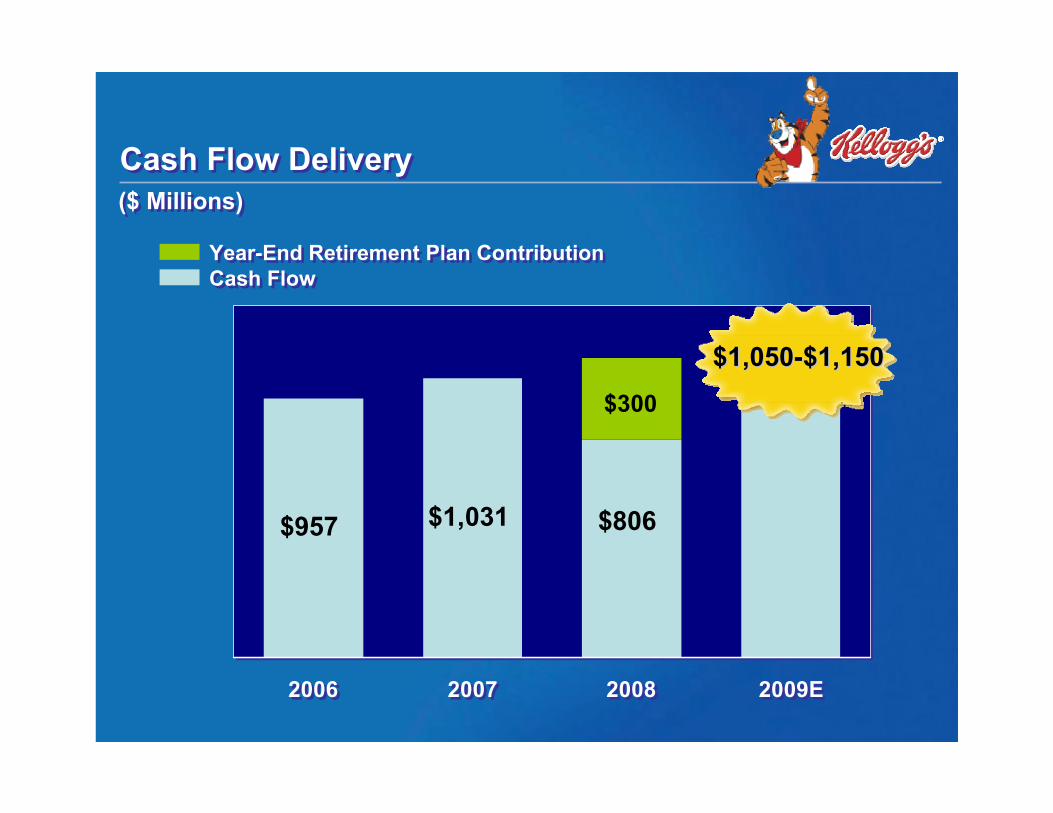
$957 $1,031 $806
2006 2007 2008 2009E
$957 $1,031 $806
2006 2007 2008 2009E
Cash Flow DeliveryCash Flow Delivery
Year-End Retirement Plan ContributionCash FlowYear-End Retirement Plan ContributionCash Flow
($ Millions)($ Millions)
$1,050$1,050--$1,150$1,150$300
• Maintain liquidity
• Manage retirement plan
• Return cash to shareholders
• Bolt-on acquisitions
• Maintain liquidity
• Manage retirement plan
• Return cash to shareholders
• Bolt-on acquisitions
Uses of CashUses of Cash
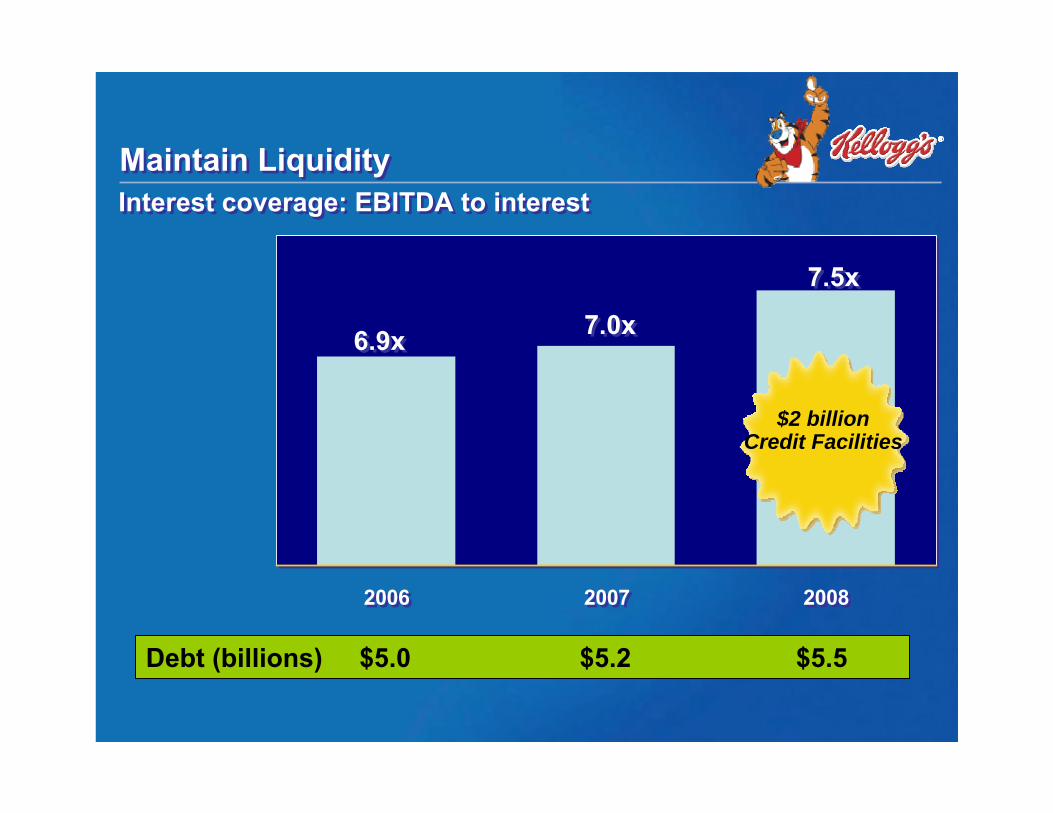
2006 2007 20082006 2007 2008
Maintain LiquidityMaintain LiquidityInterest coverage: EBITDA to interestInterest coverage: EBITDA to interest
7.0x7.0x7.5x7.5x
Debt (billions) $5.0 $5.2 $5.5
6.9x6.9x
$2 billionCredit Facilities
Retirement PlansRetirement Plans
• S&P 500 declined 37% during 2008
• Philosophy to fund ahead of requirements to maximize financial flexibility
• Discretionary funding of $450 million, $300 million after tax
• S&P 500 declined 37% during 2008
• Philosophy to fund ahead of requirements to maximize financial flexibility
• Discretionary funding of $450 million, $300 million after tax
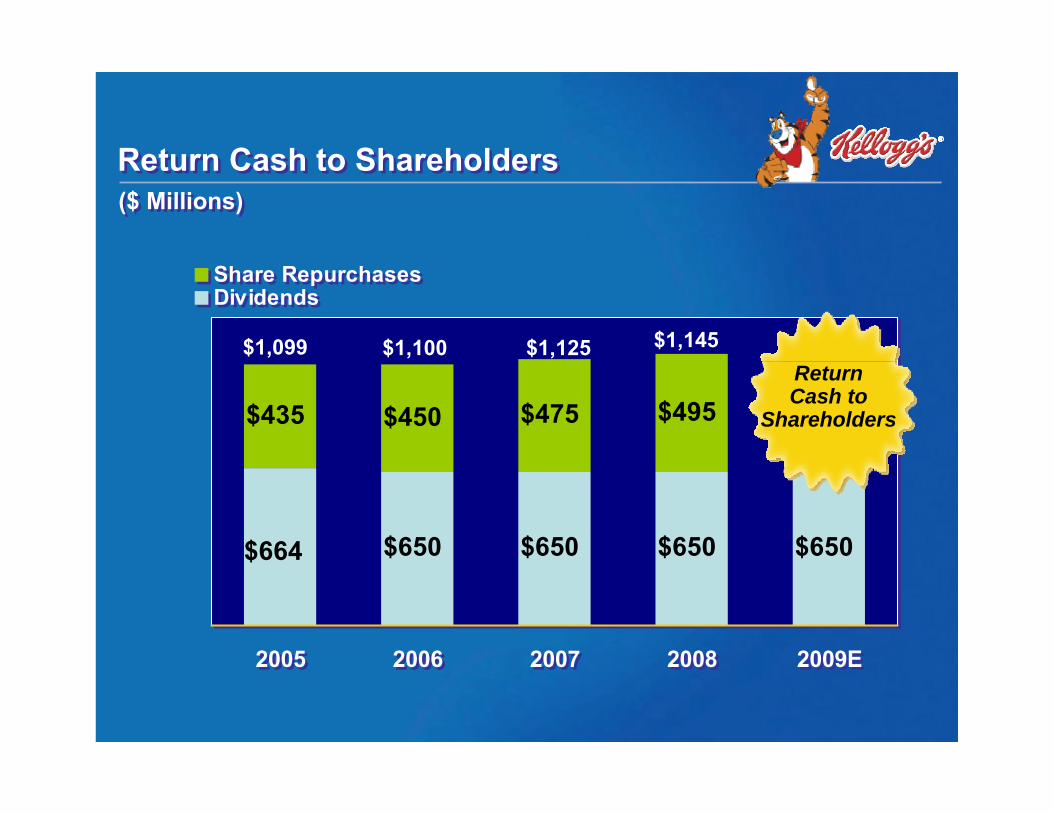
$650
$435 $450 $475
$650$664 $650 $650
$495
2005 2006 2007 2008 2009E
Share RepurchasesDividends
$650
$435 $450 $475
$650$664 $650 $650
$495
2005 2006 2007 2008 2009E
Share RepurchasesDividends
$1,099 $1,100 $1,125 $1,145
($ Millions)($ Millions)Return Cash to ShareholdersReturn Cash to Shareholders
Return Cash to
Shareholders
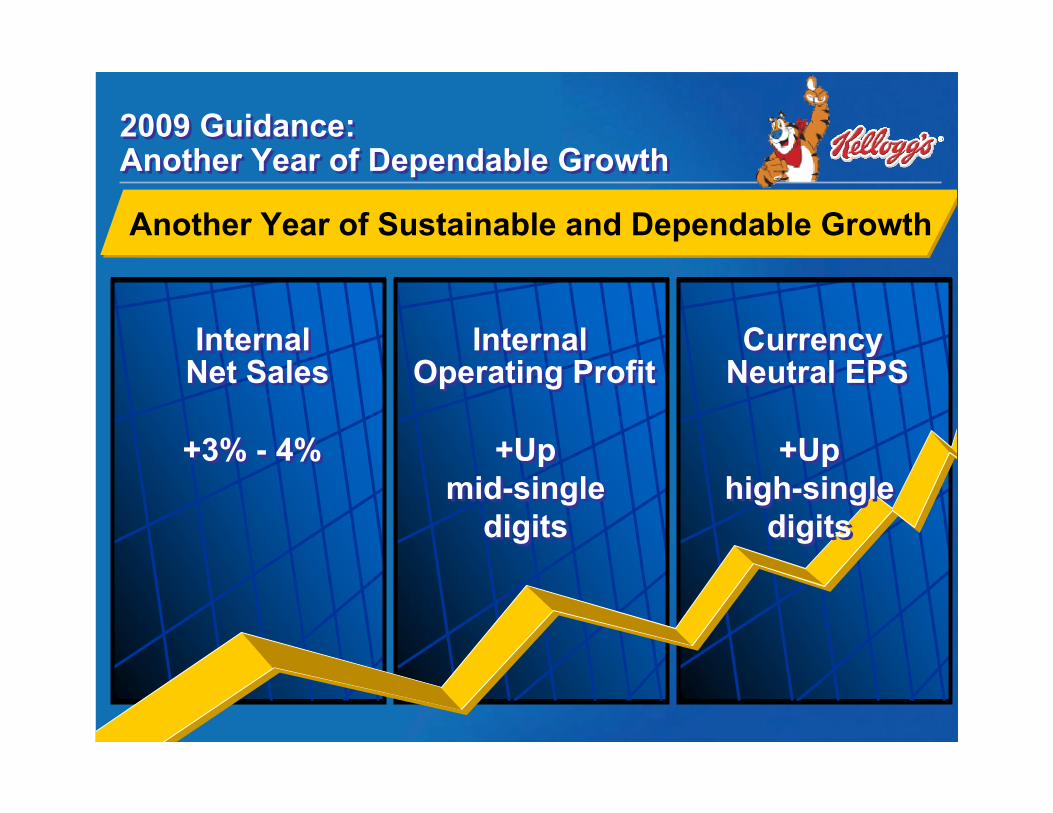
Another Year of Sustainable and Dependable Growth
2009 Guidance: Another Year of Dependable Growth2009 Guidance: Another Year of Dependable Growth
Internal Net SalesInternal
Net SalesInternal
Operating ProfitInternal
Operating ProfitCurrency
Neutral EPSCurrency
Neutral EPS
+3% - 4%+3% - 4% +Up high-single
digits
+Up high-single
digits
+Up mid-single
digits
+Up mid-single
digits
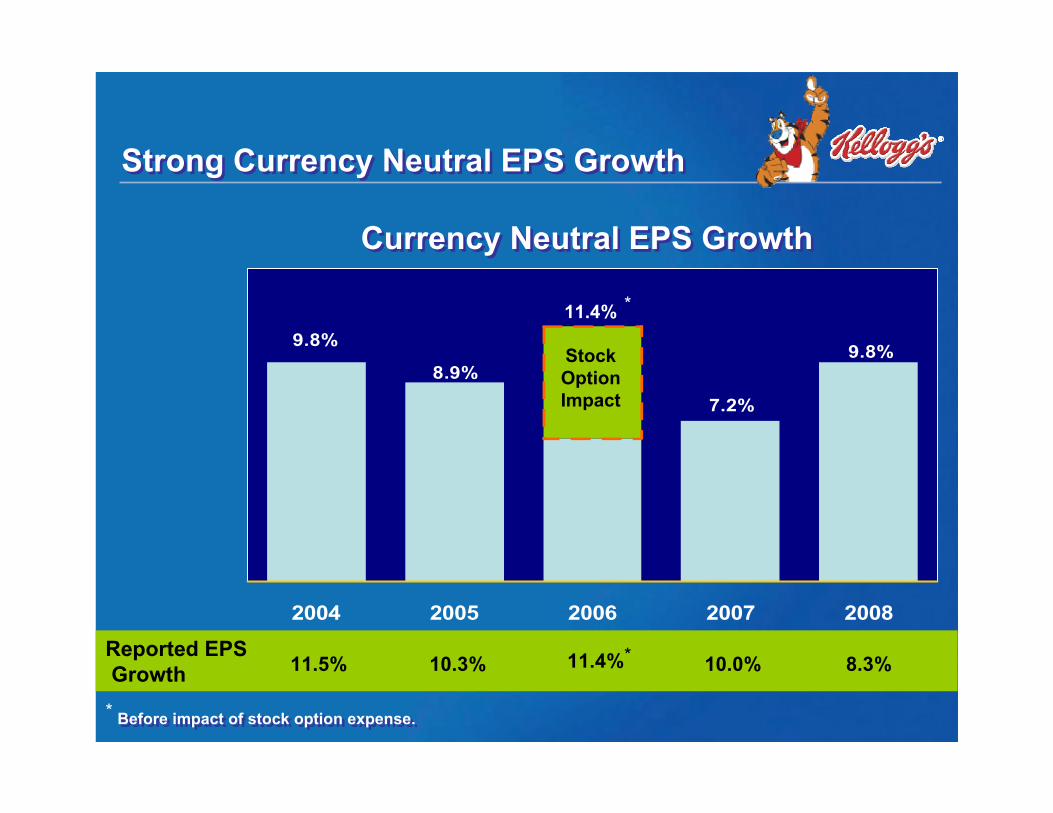
8.9%
9.8%
7.2%
9.8%
2004 2005 2006 2007 2008
Strong Currency Neutral EPS GrowthStrong Currency Neutral EPS Growth
Reported EPSGrowth 11.5% 10.3%
11.4%
10.0% 8.3%11.4%
Stock Option Impact
Currency Neutral EPS GrowthCurrency Neutral EPS Growth
Before impact of stock option expense.Before impact of stock option expense.
*
*
*
SustainableGrowth(V2V)
Remain consumer centricExecutional excellence
Prioritize to WinContinuous efficiency improvement
Consistent and Relevant Operating PrinciplesConsistent and Relevant Operating Principles

President and Chief Executive Officer
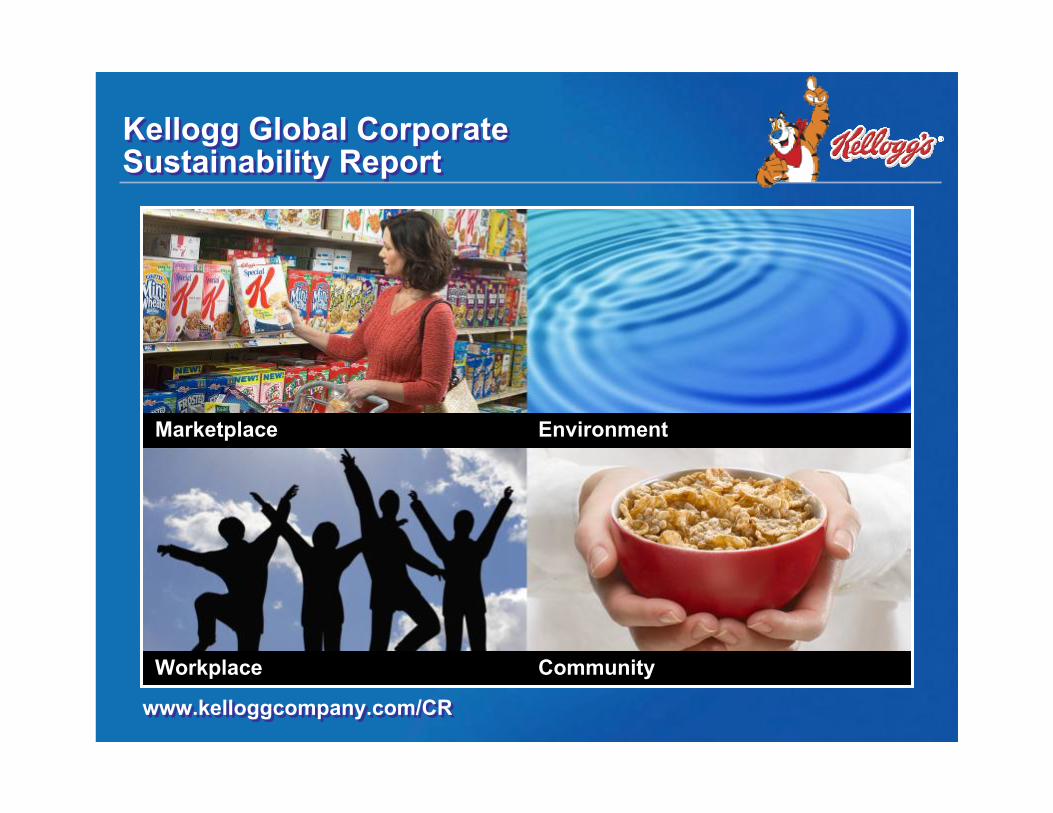
www.kelloggcompany.com/CRwww.kelloggcompany.com/CR
Marketplace Environment
Workplace Community
Kellogg Global Corporate Sustainability ReportKellogg Global Corporate Sustainability Report
SummarySummary
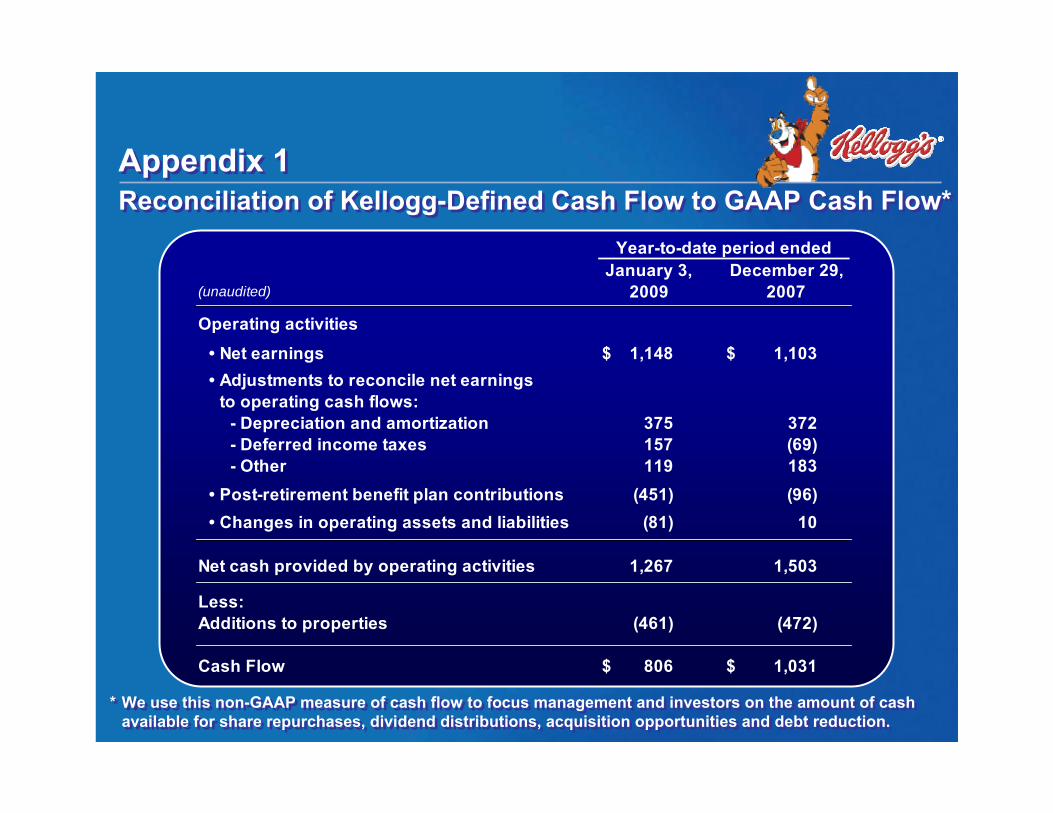
Appendix 1Appendix 1Reconciliation of Kellogg-Defined Cash Flow to GAAP Cash Flow*Reconciliation of Kellogg-Defined Cash Flow to GAAP Cash Flow*
* We use this non-GAAP measure of cash flow to focus management and investors on the amount of cash available for share repurchases, dividend distributions, acquisition opportunities and debt reduction.
* We use this non-GAAP measure of cash flow to focus management and investors on the amount of cash available for share repurchases, dividend distributions, acquisition opportunities and debt reduction.
(unaudited)
Operating activities
• Net earnings $ 1,148 $ 1,103• Adjustments to reconcile net earnings
to operating cash flows:- Depreciation and amortization 375 372- Deferred income taxes 157 (69)- Other 119 183
• Post-retirement benefit plan contributions (451) (96)• Changes in operating assets and liabilities (81) 10
Net cash provided by operating activities 1,267 1,503
Less:Additions to properties (461) (472)
Cash Flow $ 806 $ 1,031
Year-to-date period endedJanuary 3,
2009December 29,
2007