Kalori normal dr brain gantoro m gizi spgk 090116
58
Energy Balance & Weight Control Dr Brain Gantoro, M.Gizi, SpGK
-
Upload
imelda-wijaya -
Category
Health & Medicine
-
view
447 -
download
13
Transcript of Kalori normal dr brain gantoro m gizi spgk 090116

Energy Balance & Weight
Control
Dr Brain Gantoro, M.Gizi, SpGK

Energy Balance
• Body weight is determined by the balance between body requirements & energy intake
• Total Energy Expenditure (TEE) depends on:
1) BMR (basal metabolic rate), REE (resting energy expenditure), RMR (resting metabolic rate)
2) DIT
3) exercise/physical activity
dr. Brain Gantoro, M.Gizi, SpGK @ Awal Bros Hospital Batam

Definitions in Energy
Metabolism1. Calorie: Amount of heat required to raise the temp
of 1kg H20 for 1°C (in nutrition = 1000 calories or 1
kcal)
2. Energy balance: Attained when intake equals total
energy expenditure (TEE) & body stores are stable
3. Thermogenesis: Heat production associated with
ATP hydrolysis. Synonymous with energy
expenditure or caloric expenditure
4. Energy expenditure: The amount of energy used by
the body for a given function or activitydr. Brain Gantoro, M.Gizi, SpGK @ Awal Bros Hospital Batam

BMR, REE, RMR• BMR is determined by O2 consumed & CO2
produced
• It’s measured most accurately under controlled
conditions:
– under post-absorptive (no food intake for at least 12
hours),
– lying down,
– very relaxed,
– preferably very shortly after awakening from sleep in
the morning,
– at a comfortable room temperature
dr. Brain Gantoro, M.Gizi, SpGK @ Awal Bros Hospital Batam

REE
• REE isn’t measured under basal conditions
– it is at rest &
– in a comfortable environment,
– but no fasting needed
• REE is usually higher than BMR (about
10%)
• REE is about 65-75% of daily TEE (total
energy expenditure)
dr. Brain Gantoro, M.Gizi, SpGK @ Awal Bros Hospital Batam

Determinants of RMR—first
component of energy expenditure
1. Body composition
2. Thyroid function
3. Sympathetic Nervous System function
dr. Brain Gantoro, M.Gizi, SpGK @ Awal Bros Hospital Batam
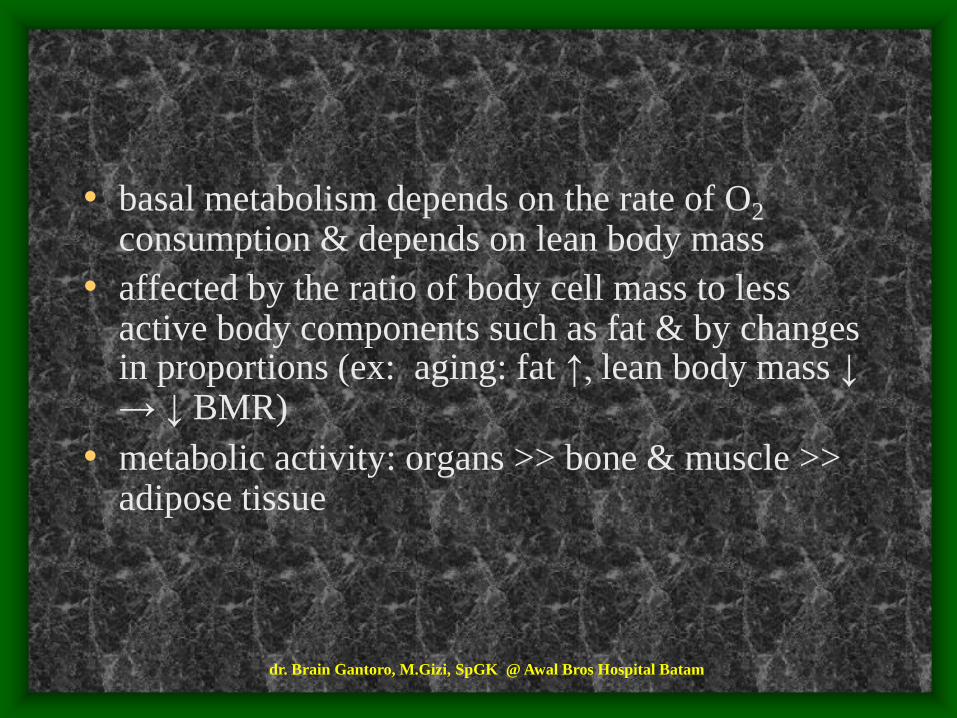
• basal metabolism depends on the rate of O2
consumption & depends on lean body mass
• affected by the ratio of body cell mass to less active body components such as fat & by changes in proportions (ex: aging: fat ↑, lean body mass ↓→ ↓ BMR)
• metabolic activity: organs >> bone & muscle >> adipose tissue
dr. Brain Gantoro, M.Gizi, SpGK @ Awal Bros Hospital Batam

Body Composition:LBM Major Determinant of RMR
Fat
Extracellular
Viscera
Skeletal
Muscle
(BCM)
Fat
Extracellular
Viscera
Skeletal
Muscle (BCM)
20
%
Male BMI 25 Female BMI 25
30
%
LBM
50%
30
%
FFM
70%
25
%
LBM
45%
FFM
80%
dr. Brain Gantoro, M.Gizi, SpGK @ Awal Bros Hospital Batam

LBM & RMR
• LBM determines RMR
• Differences body size → differences LBM
• The differences in ages, gender, races →
differences LBM
dr. Brain Gantoro, M.Gizi, SpGK @ Awal Bros Hospital Batam
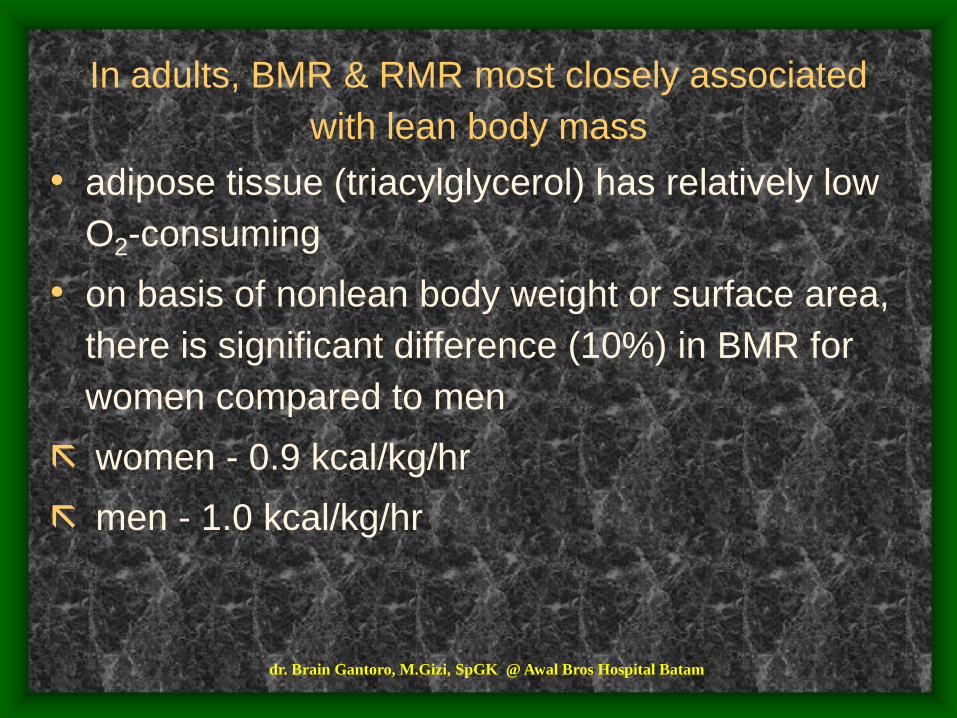
In adults, BMR & RMR most closely associated
with lean body mass
• adipose tissue (triacylglycerol) has relatively low
O2-consuming
• on basis of nonlean body weight or surface area,
there is significant difference (10%) in BMR for
women compared to men
women 0.9 kcal/kg/hr
men 1.0 kcal/kg/hr
dr. Brain Gantoro, M.Gizi, SpGK @ Awal Bros Hospital Batam

• This difference reflects higher average proportion of
body fat in women vs men ~ (25% vs 15%)
• Because of body fat component, BMR values
based on total body weight are lower (0.9 - 1.0
kcal/kg/hr) than those based on lean body mass (~
1.3 kcal/kg/hr)
dr. Brain Gantoro, M.Gizi, SpGK @ Awal Bros Hospital Batam

Body tissues do not contribute equally to BMR
• brain & liver total ~ 4% of body weight yet
consume >40% of basal state O2 (18 - 22% for
liver alone)
• muscle constitutes up to 40% of body weight, but
accounts for only ~ 25% of basal energy needs
dr. Brain Gantoro, M.Gizi, SpGK @ Awal Bros Hospital Batam

Variables having effect on BMR
Variables of note include
• age
• gender
• pregnancy or lactation
• stress
• hormonal status
• illiness or injury
• smoking
dr. Brain Gantoro, M.Gizi, SpGK @ Awal Bros Hospital Batam

• Smoking increases BMR
• Thyroid status: plus / minus 50% for
hyperthyroidism / hypothyroidism.
– Early in the 20th Century Measurements of RMR were used
to diagnose thyroid disease
dr. Brain Gantoro, M.Gizi, SpGK @ Awal Bros Hospital Batam
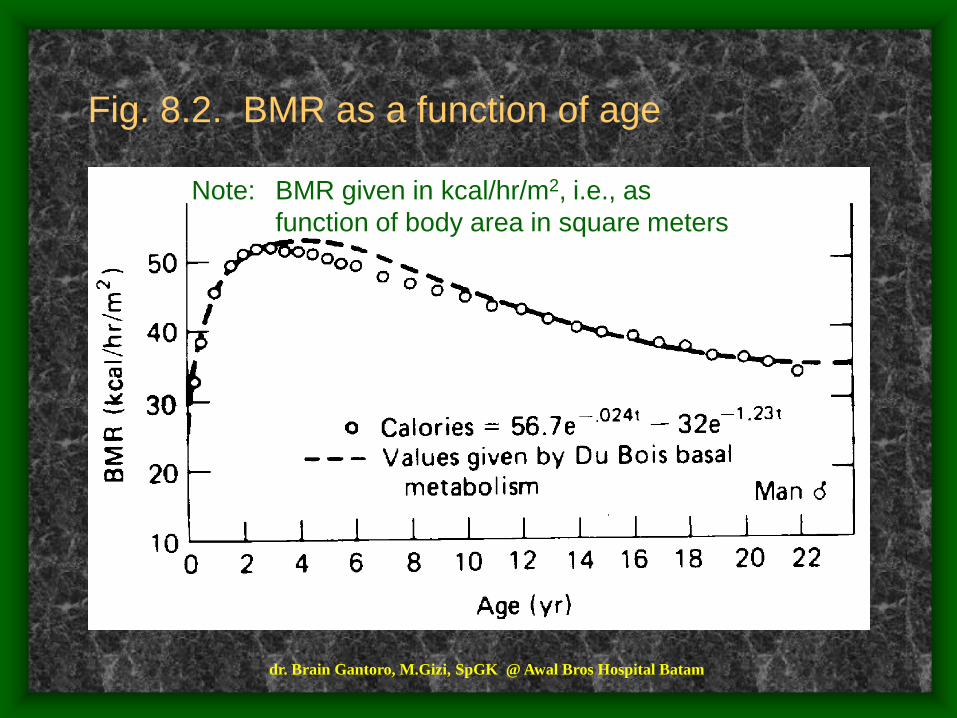
Fig. 8.2. BMR as a function of age
Note: BMR given in kcal/hr/m2, i.e., as
function of body area in square meters
dr. Brain Gantoro, M.Gizi, SpGK @ Awal Bros Hospital Batam
dr. Brain Gantoro, M.Gizi, SpGK @ Awal Bros Hospital Batam

Sources of Energy:
• Exogenous:
– Food: Fat (9kcal/g) > Protein (4kcal/g) > CHO
(3.4kcal/g)
• Endogenous:
– Adipose Tissue (total 15 kg or 135,000 kcal)
– Glycogen (total = 1200 kcals)
– Protein stores (gluconeogenic reserve for brain &
RBCs during starvation)
dr. Brain Gantoro, M.Gizi, SpGK @ Awal Bros Hospital Batam
Energy Balance & Body Weight
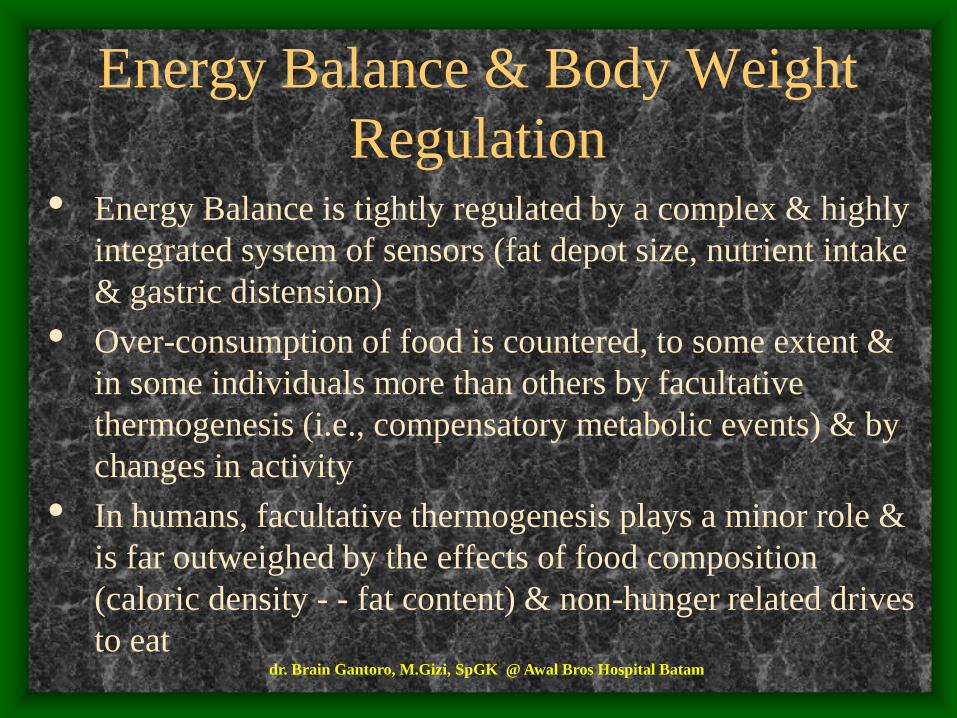
Regulation• Energy Balance is tightly regulated by a complex & highly
integrated system of sensors (fat depot size, nutrient intake
& gastric distension)
• Over-consumption of food is countered, to some extent &
in some individuals more than others by facultative
thermogenesis (i.e., compensatory metabolic events) & by
changes in activity
• In humans, facultative thermogenesis plays a minor role &
is far outweighed by the effects of food composition
(caloric density - - fat content) & non-hunger related drives
to eatdr. Brain Gantoro, M.Gizi, SpGK @ Awal Bros Hospital Batam
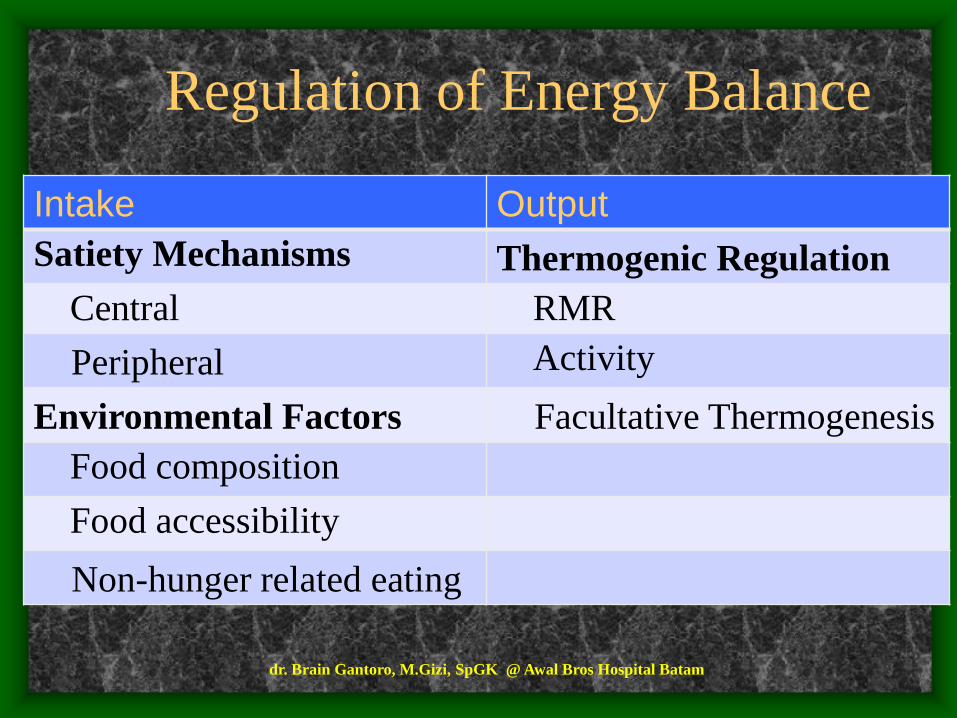
Regulation of Energy Balance
Intake Output
Satiety Mechanisms Thermogenic Regulation
Central RMR
Peripheral Activity
Environmental Factors Facultative Thermogenesis
Food composition
Food accessibility
Non-hunger related eating
dr. Brain Gantoro, M.Gizi, SpGK @ Awal Bros Hospital Batam
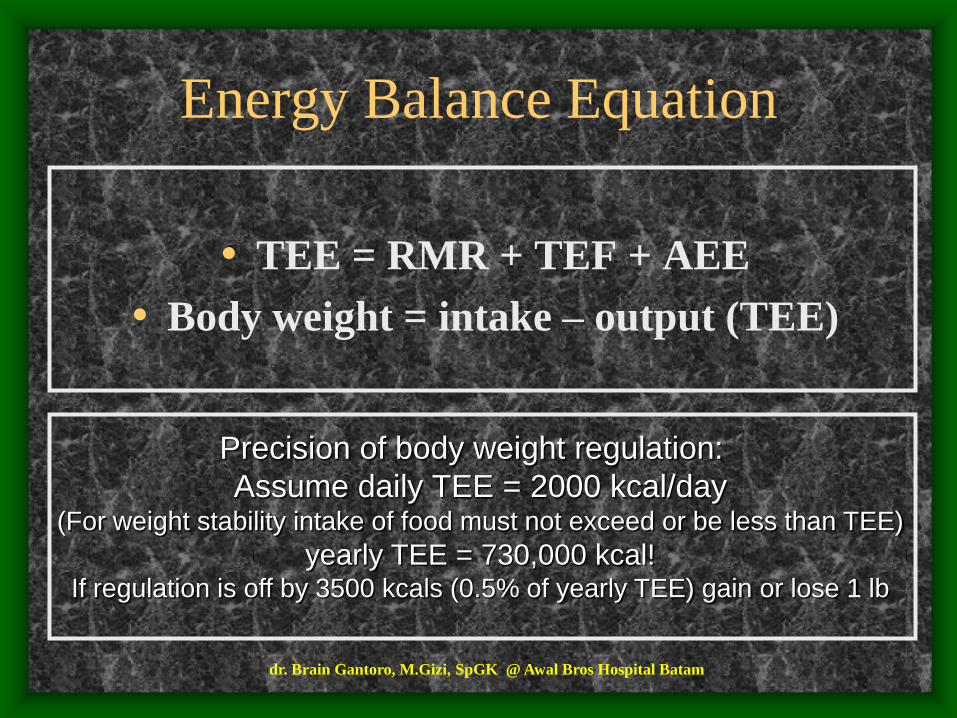
Energy Balance Equation
• TEE = RMR + TEF + AEE
• Body weight = intake – output (TEE)
Precision of body weight regulation:
Assume daily TEE = 2000 kcal/day(For weight stability intake of food must not exceed or be less than TEE)
yearly TEE = 730,000 kcal!If regulation is off by 3500 kcals (0.5% of yearly TEE) gain or lose 1 lb
dr. Brain Gantoro, M.Gizi, SpGK @ Awal Bros Hospital Batam
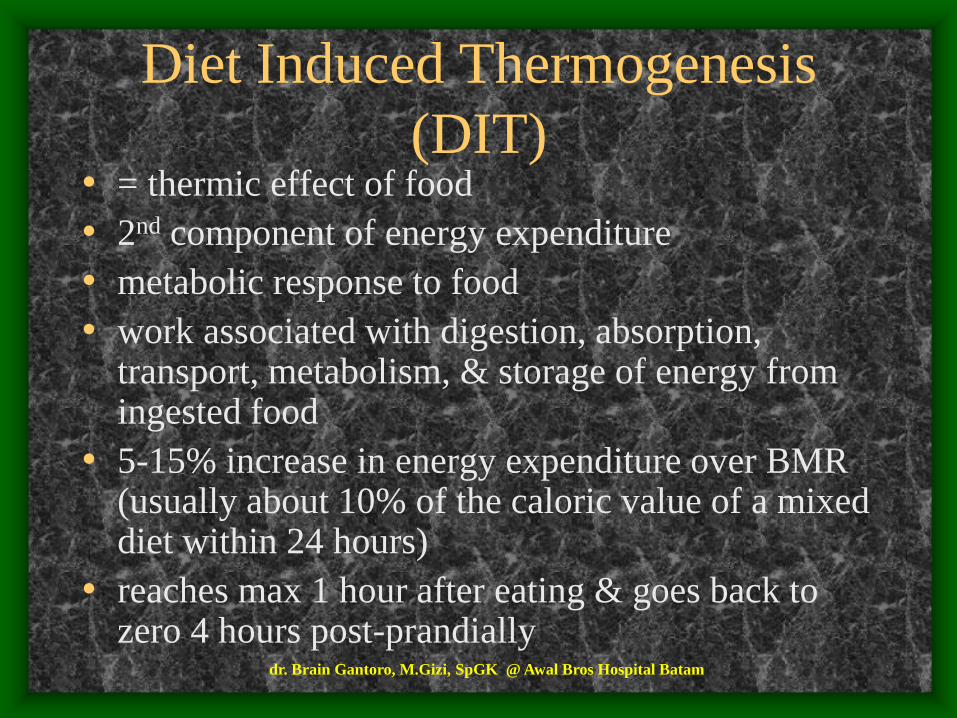
Diet Induced Thermogenesis
(DIT)• = thermic effect of food
• 2nd component of energy expenditure
• metabolic response to food
• work associated with digestion, absorption, transport, metabolism, & storage of energy from ingested food
• 5-15% increase in energy expenditure over BMR (usually about 10% of the caloric value of a mixed diet within 24 hours)
• reaches max 1 hour after eating & goes back to zero 4 hours post-prandially
dr. Brain Gantoro, M.Gizi, SpGK @ Awal Bros Hospital Batam

Physical Activity & Exercise
• 3rd component of energy expenditure
• the most variable component
• also the most easily altered of all the components
• accounts for 20-40% of the TEE, ↓↓ in sedentary & ↑↑ in physically active person
• includes intensity, duration, & frequency of the activity, the body mass of the person, efficiency at performing the activity
dr. Brain Gantoro, M.Gizi, SpGK @ Awal Bros Hospital Batam

dr. Brain Gantoro, M.Gizi, SpGK @ Awal Bros Hospital Batam

Activity
•Daily Activity – Activity consumes calories in proportion to expenditure:
• Bedridden 10-20% above RMR (200-400kcals)
• Marathon runners ~5000 kcals
• Mountain climbers ~10,000 kcals
•Energy expended with repeated activities declines over time due to enhanced efficiency
•Resistance training builds muscle & increases LBM & therefore increases RMR
dr. Brain Gantoro, M.Gizi, SpGK @ Awal Bros Hospital Batam
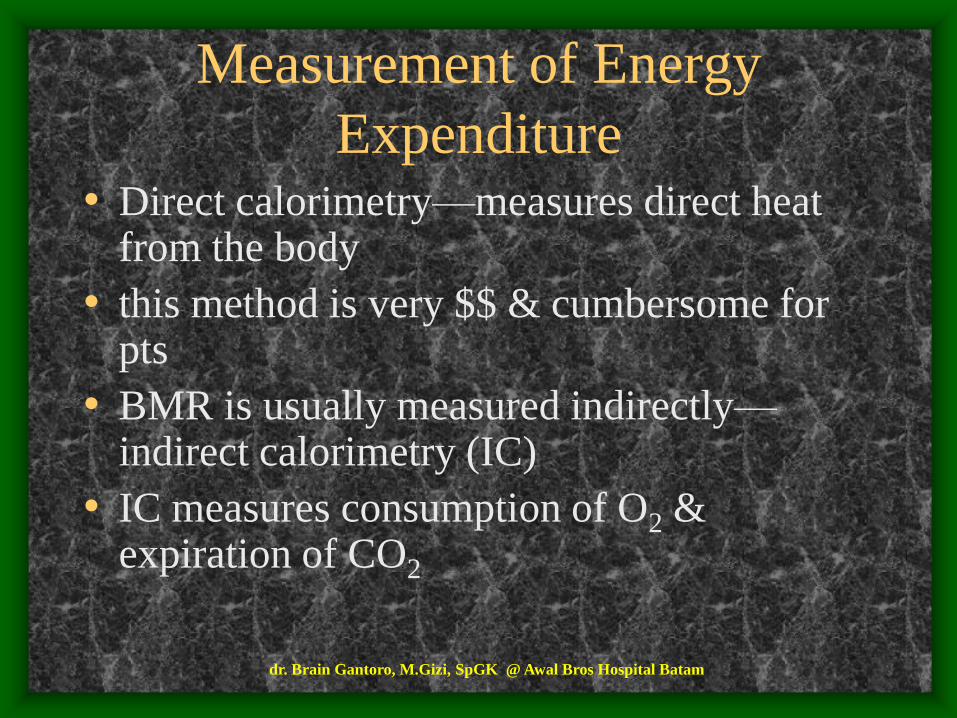
Measurement of Energy
Expenditure• Direct calorimetry—measures direct heat
from the body
• this method is very $$ & cumbersome for pts
• BMR is usually measured indirectly—indirect calorimetry (IC)
• IC measures consumption of O2 & expiration of CO2
dr. Brain Gantoro, M.Gizi, SpGK @ Awal Bros Hospital Batam

RQ
• respiratory quotient
• amount of heat produced
• RQ: CO2 expired / O2 inhaled– RQ=1 suggests CHO is being oxidized
– RQ<1 (0.7) suggests fat, because it is less oxidized
– RQ=0.8 suggests protein, because of the more complicated oxidation of AA (requires removing N & some O2 & C as urea)
dr. Brain Gantoro, M.Gizi, SpGK @ Awal Bros Hospital Batam
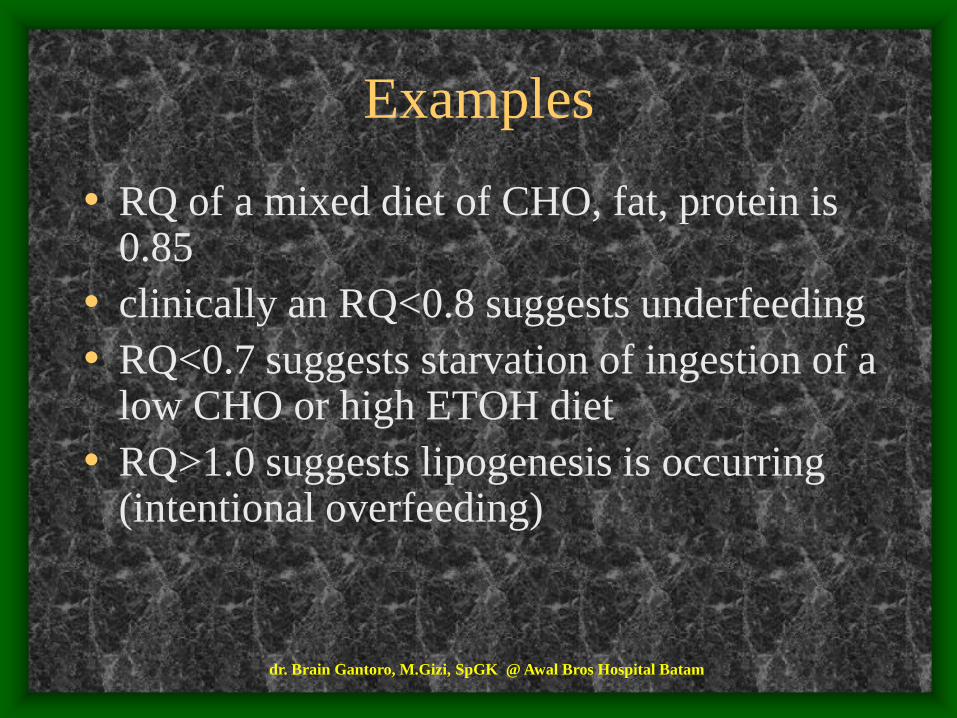
Examples
• RQ of a mixed diet of CHO, fat, protein is 0.85
• clinically an RQ<0.8 suggests underfeeding
• RQ<0.7 suggests starvation of ingestion of a low CHO or high ETOH diet
• RQ>1.0 suggests lipogenesis is occurring (intentional overfeeding)
dr. Brain Gantoro, M.Gizi, SpGK @ Awal Bros Hospital Batam

• clinically, this is important because many
pulmonary diseases are worsened by work
of expelling CO2 produced from energy
metabolism---so, for these pts, need to give
them a fuel with a lower RQ & less CO2
produced (use higher fat formula with RQ-
0.7 vs. CHO-1.0 or protein-0.8)
dr. Brain Gantoro, M.Gizi, SpGK @ Awal Bros Hospital Batam

Energy Intake & Regulation
• newborns are an example of individuals whose appetite is probably regulated solely by internal control
• as people age, food becomes associated with rituals
• even the smell & sight of food gets the digestive process started
dr. Brain Gantoro, M.Gizi, SpGK @ Awal Bros Hospital Batam

GI peptides
• released for the GI tract to the brain to
affect appetite
• somatostatin & cholecystokinin (CCK)
provide satiety signals
• bombesin acts alone to inhibit hunger &
acts to stimulate CCK which with glucagon
has a synergistic effect on satiety
dr. Brain Gantoro, M.Gizi, SpGK @ Awal Bros Hospital Batam

Neurotransmitters
• opiods & neuropeptide Y are primary stimulants of food intake
• galanin stimulates food intake
• serotonin & corticotropin releasing factor (CRF) decrease appetite
• nutrients & their metabolic products also influence appetite
dr. Brain Gantoro, M.Gizi, SpGK @ Awal Bros Hospital Batam

Hormones
• insulin released from the pancreas & levels
rise in the blood & CSF after eating to
stimulate hunger
• but increased levels in the brain stem
stimulate satiety by allowing tryptophan to
cross the BBB > serotonin > stimulate
satiety & suppress NE & opiods (both
which stimulate food intake)
dr. Brain Gantoro, M.Gizi, SpGK @ Awal Bros Hospital Batam

The Role of the SNS in Energy
Balance• Drug Effects
• SNS stimulation ( 3-agonists, terbutaline) increase
RMR
• SNS inhibition ( & -blockers, propranolol)
have no effect on RMR
dr. Brain Gantoro, M.Gizi, SpGK @ Awal Bros Hospital Batam

Weight Loss Rate &
Composition• first few days: wt loss is rapid & about 70%
water with about 25% from fat & 5% from water
• after about 3 wks: wt loss is slower with 85% from fat & 15% from protein
• wt loss regardless of duration is a combination of lean body mass & fat
• calories restriction → ↓ BMR• ↓ 1kg BW with a hypocaloric diet, energy
expenditure ↓ ± 20 kcal• ↓ BW → ↓ energy cost of physical activity &
then slows down the rate of wt lossdr. Brain Gantoro, M.Gizi, SpGK @ Awal Bros Hospital Batam

• energy conservation occurs in response to a diet & repeated caloric restrictions
• these restrictions result in the body becoming very efficient in the use of food
• each time wt reduction is attempted, wt comes off more slowly & with refeeding, wt is gained more rapidly—”yo-yo effect”
• → fad diets don’t work, weight maintenance is much more important than weight loss
dr. Brain Gantoro, M.Gizi, SpGK @ Awal Bros Hospital Batam

The Set Point
0
50
100
150
200
250
300
10 15 20 25
Weeks
Bod
y W
eig
ht
(gm
)
Overfeeding
Ad Lib
Underfeeding
Ad lib
Ad lib
dr. Brain Gantoro, M.Gizi, SpGK @ Awal Bros Hospital Batam
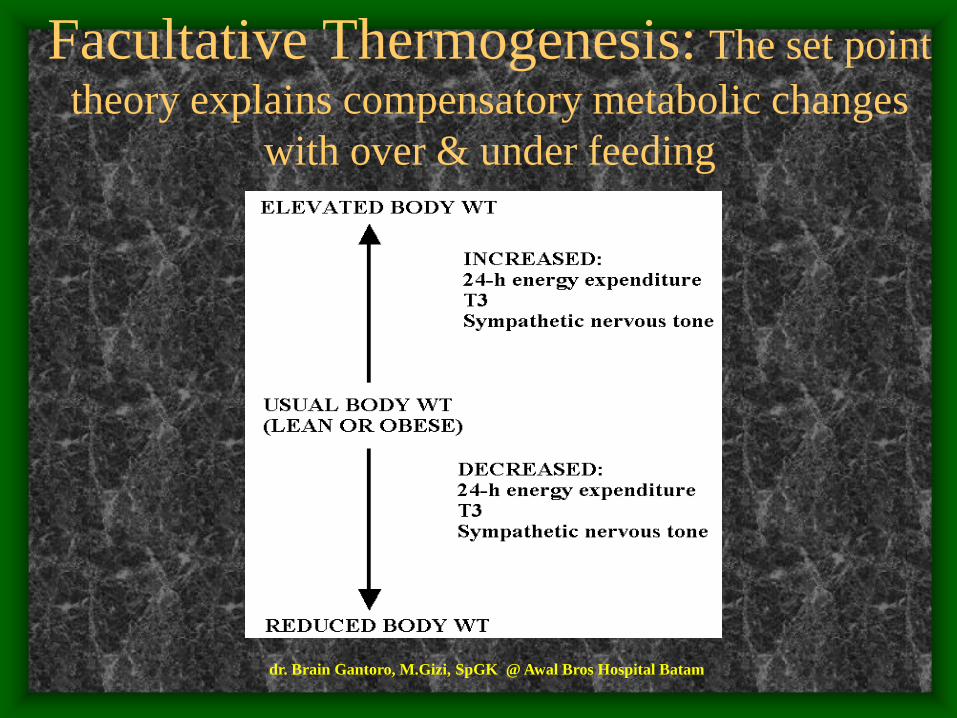
Facultative Thermogenesis: The set point
theory explains compensatory metabolic changes
with over & under feeding
dr. Brain Gantoro, M.Gizi, SpGK @ Awal Bros Hospital Batam

CNS Control of Food Intake
• Brain lesioning studies performed 60 years ago implicated
the hypothalamus as the feeding center
• Paraventricular hypothalamic nucleus (PVN) = satiety
center ablation results in hyperphagia & obesity
• Lateral hypothalamic area (LHA) = hunger center ablation
results in anorexia & weight loss
• These centers are highly integrated with brainstem centers
mediated by nerves that produce serotonin, norepinephrine
& dopamine.
dr. Brain Gantoro, M.Gizi, SpGK @ Awal Bros Hospital Batam

University of North Carolina
study on food portion sizes• 1977 - 1996, portion sizes for food groups grew in
the US (in fast-food restaurants, homes & restaurants)
• → ↑ obesity in US children & adults
– JAMA (January 22-29. 2003) Samara Joy Nielsen & Dr Barry M. Popkin, professor of nutrition at UNC school of public health & medicine
dr. Brain Gantoro, M.Gizi, SpGK @ Awal Bros Hospital Batam

• Sample: 63,380 people ages 2 & older
• between 1977 & 1996, portion sizes increased for salty snacks, desserts, soft drinks, fruit drinks, french fries, hamburgers, cheeseburgers, & Mexican food
• the quantity of salty snacks increased by 93 calories or 0.6 ounces, soft drinks by 49 calories or 6.8 ounces, hamburgers by 97 calories or 1.3 ounces, french fries by 68 calories or 0.5 ounces, & Mexican food by 133 calories or 1.7 ounces
dr. Brain Gantoro, M.Gizi, SpGK @ Awal Bros Hospital Batam

• ↑ caloric intake + more sedentary lifestyle → ↑ the risk of heart disease, stroke, HTN, DM
• ↑↑ snacks—in 1977, snacks provided 11.3% of the average American’s energy intake, in 1996, the figure had ↑ to 17.7% (> a 50% ↑)
• elderly people snack the least of all age groups,
their consumption has ↑ from 7.7% in 1977 to
14%
• in people under age 39, pizza & salty snack foods
↑ 143%
dr. Brain Gantoro, M.Gizi, SpGK @ Awal Bros Hospital Batam

Kebuthan Gizi orang sehat ditentukan:
• TB
• BB
• U
• Jenis Kelamin
• Aktivitas
• Kondisi khusus: Hamil, Menyusui
Kebutuhan Energi ditentukan:
• Basal Metabolic Rate (BMR)
• Activity
• Specific Dynamic Action of Food
dr. Brain Gantoro, M.Gizi, SpGK @ Awal Bros Hospital Batam

dr. Brain Gantoro, M.Gizi, SpGK @ Awal Bros Hospital Batam

dr. Brain Gantoro, M.Gizi, SpGK @ Awal Bros Hospital Batam

dr. Brain Gantoro, M.Gizi, SpGK @ Awal Bros Hospital Batam

dr. Brain Gantoro, M.Gizi, SpGK @ Awal Bros Hospital Batam
dr. Brain Gantoro, M.Gizi, SpGK @ Awal Bros Hospital Batam

dr. Brain Gantoro, M.Gizi, SpGK @ Awal Bros Hospital Batam

Kebutuhan Makronutrien
utk kebutuhan total 2450 kcal/hari
Nutrien % dr
kebutuhan
energi total
Energi
(kcal)
Jumlah
(gram)
Protein 10-15 245-368 61-92
Lemak 10-25 245-613 27-68
Karbohidrat 60-75 1470-1838 368-460
Total 100 2450
dr. Brain Gantoro, M.Gizi, SpGK @ Awal Bros Hospital Batam

dr. Brain Gantoro, M.Gizi, SpGK @ Awal Bros Hospital Batam

dr. Brain Gantoro, M.Gizi, SpGK @ Awal Bros Hospital Batam
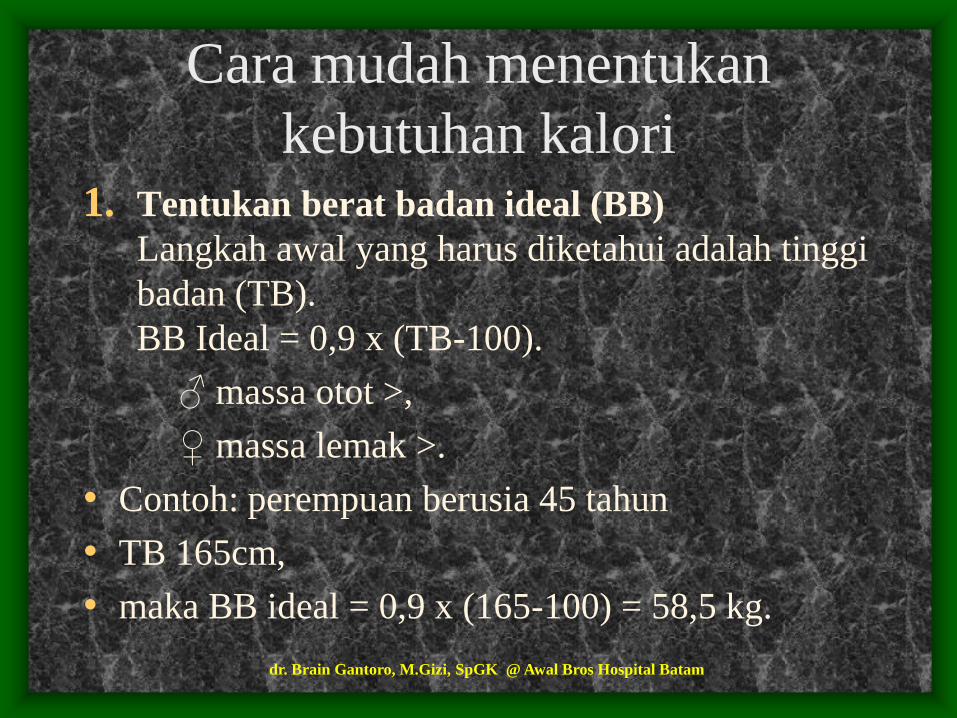
Cara mudah menentukan
kebutuhan kalori1. Tentukan berat badan ideal (BB)
Langkah awal yang harus diketahui adalah tinggi
badan (TB).
BB Ideal = 0,9 x (TB-100).
♂ massa otot >,
♀ massa lemak >.
• Contoh: perempuan berusia 45 tahun
• TB 165cm,
• maka BB ideal = 0,9 x (165-100) = 58,5 kg.
dr. Brain Gantoro, M.Gizi, SpGK @ Awal Bros Hospital Batam

Cara mudah menentukan
kebutuhan kalori..
2. Hitung kebutuhan basal (KB)
= kebutuhan minimal saat tidur / istirahat,
untuk menggerakan jantung, paru, usus
dan pencernaan saja.
• KB ♀ = BB Ideal x 25 KKal
KB ♂ = BB Ideal x 30 KKal
• Contoh:
• KB ♀ = 58,5 x 25 Kkal = 1462,5 Kkal
dr. Brain Gantoro, M.Gizi, SpGK @ Awal Bros Hospital Batam
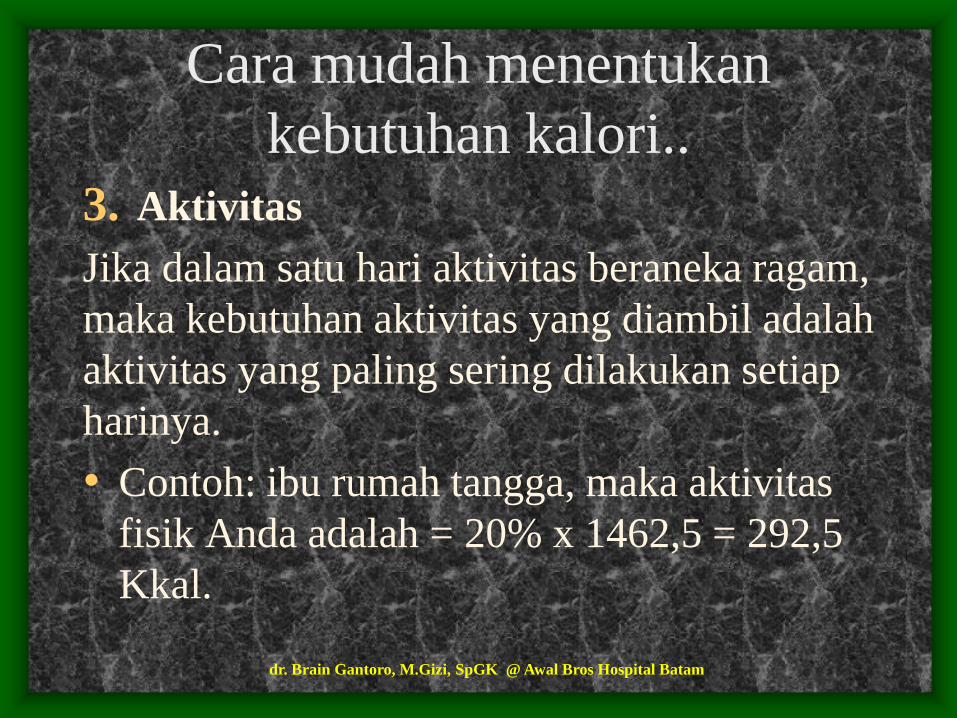
3. Aktivitas
Jika dalam satu hari aktivitas beraneka ragam,
maka kebutuhan aktivitas yang diambil adalah
aktivitas yang paling sering dilakukan setiap
harinya.
• Contoh: ibu rumah tangga, maka aktivitas
fisik Anda adalah = 20% x 1462,5 = 292,5
Kkal.
Cara mudah menentukan
kebutuhan kalori..
dr. Brain Gantoro, M.Gizi, SpGK @ Awal Bros Hospital Batam

• Aktivitas ringan (10-20 %)
• Aktivitas sedang (20-30 %)
• Aktivitas berat (40-50 %)
• Menyetir mobil 10 %
• Kerja rumah tangga 20 %
• Aerobik 40 %
• Mengajar 20 %
• Bersepeda 30 %
• Bersepeda mendaki 40 %
• Mengajar 20 %
• Bowling 20 %
• Panjat tebing 50 %
• Kerja kantoran 10 %
• Berjalan cepat 30 %
• Dansa 40 %
• Memancing 20 %
• Berkebun 30 %
• Jogging 40 %
• Membaca 10 %
• Atlit 50 %
dr. Brain Gantoro, M.Gizi, SpGK @ Awal Bros Hospital Batam
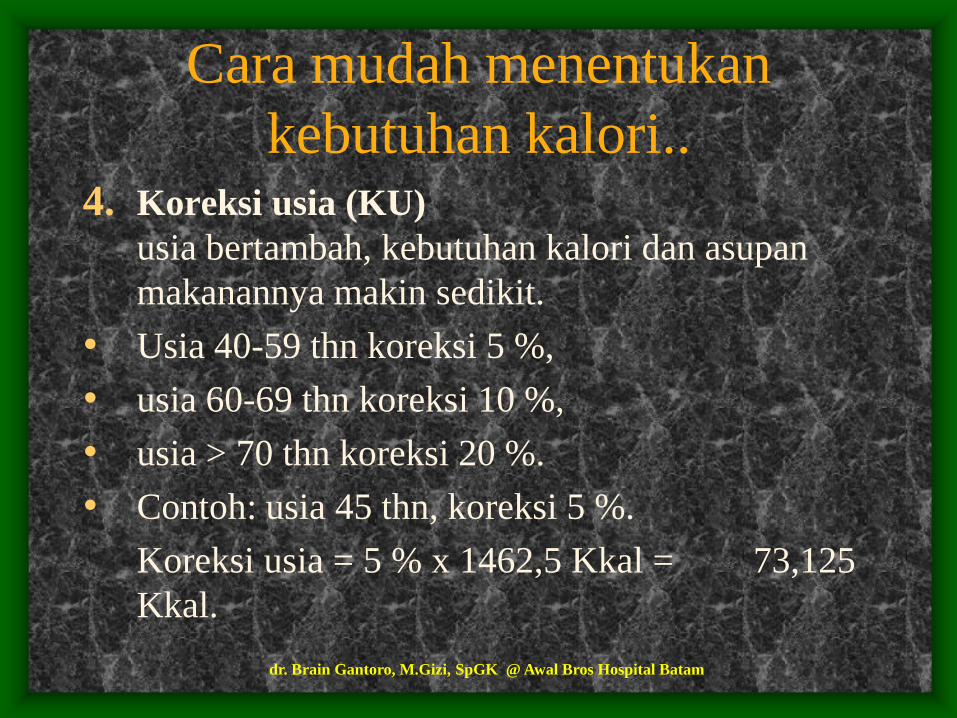
Cara mudah menentukan
kebutuhan kalori..4. Koreksi usia (KU)
usia bertambah, kebutuhan kalori dan asupan
makanannya makin sedikit.
• Usia 40-59 thn koreksi 5 %,
• usia 60-69 thn koreksi 10 %,
• usia > 70 thn koreksi 20 %.
• Contoh: usia 45 thn, koreksi 5 %.
Koreksi usia = 5 % x 1462,5 Kkal = 73,125
Kkal.
dr. Brain Gantoro, M.Gizi, SpGK @ Awal Bros Hospital Batam

Cara mudah menentukan
kebutuhan kalori5. Total kalori yang dibutuhkan (TK)
TK = KB + AF - KU
• Contoh: dari perhitungan di atas diperoleh data,
BB = 58,5 kg, KB = 1462,5 Kkal, AF = 292,5
Kkal, KU = 73,125 Kkal.
• TK = 1462,5 + 292.5 -73,125 = 1681,875 Kkal
per hari.
• Kebutuhan kalori ini dibagi dalam enam kali
makan
dr. Brain Gantoro, M.Gizi, SpGK @ Awal Bros Hospital Batam

dr. Brain Gantoro, M.Gizi, SpGK @ Awal Bros Hospital Batam