IS PAKISTAN MANUFACTURING SECTOR … PAKISTAN MANUFACTURING SECTOR...IS PAKISTAN MANUFACTURING...
28
1 IS PAKISTAN MANUFACTURING SECTOR COMPETITIVE? Iffat Ara 1. INTRODUCTION The manufacturing sector of any country bears significant importance. Globalisation, and in particular, enhanced exports are generally believed to benefit developing countries. And with Pakistan’s exports concentrated largely in textile and semi-manufactures, the country needs to strengthen this sector. Since the foreign-currency dominated export prices for developing countries are largely determined in the international market, any downward slide in them exerts a downward slide in foreign-exchange export earnings. It is therefore imperative, for a country like Pakistan, to prevent the decline in manufacturing output, not only to sustain but also to increase the export share and hence to gain external competitiveness in this sector. More than 75 percent of Pakistan’s exports now comprised of manufactured goods but the data over the period 1974-03, unfortunately, show that real growth in manufactured exports bears a declining trend and very high volatility around the trend (see figure 1). The data on manufacturing sector GDP (value added) and overall GDP, too, narrates an analogous pattern over the same period (see figures 2 and 3, respectively). However, in the last three years, there seems slight improvement in the growth of manufacturing output and overall GDP, contrary to the growth of manufactured exports, which continues to show a persistent decline. A number of studies of have been conducted to assess the performance of the manufacturing sector of Pakistan (section 2 below gives more detail). The findings of these studies generally attribute the lacklustre performance of the manufacturing sector to several problems, including too much concentration in industrial products, lack of quality products, less exposure to foreign markets and thus to competition, slow growth of human development,
Transcript of IS PAKISTAN MANUFACTURING SECTOR … PAKISTAN MANUFACTURING SECTOR...IS PAKISTAN MANUFACTURING...
1
IS PAKISTAN MANUFACTURING SECTOR COMPETITIVE?
Iffat Ara 1. INTRODUCTION
The manufacturing sector of any country bears significant importance. Globalisation, and in
particular, enhanced exports are generally believed to benefit developing countries. And with
Pakistan’s exports concentrated largely in textile and semi-manufactures, the country needs to
strengthen this sector. Since the foreign-currency dominated export prices for developing
countries are largely determined in the international market, any downward slide in them
exerts a downward slide in foreign-exchange export earnings. It is therefore imperative, for a
country like Pakistan, to prevent the decline in manufacturing output, not only to sustain but
also to increase the export share and hence to gain external competitiveness in this sector.
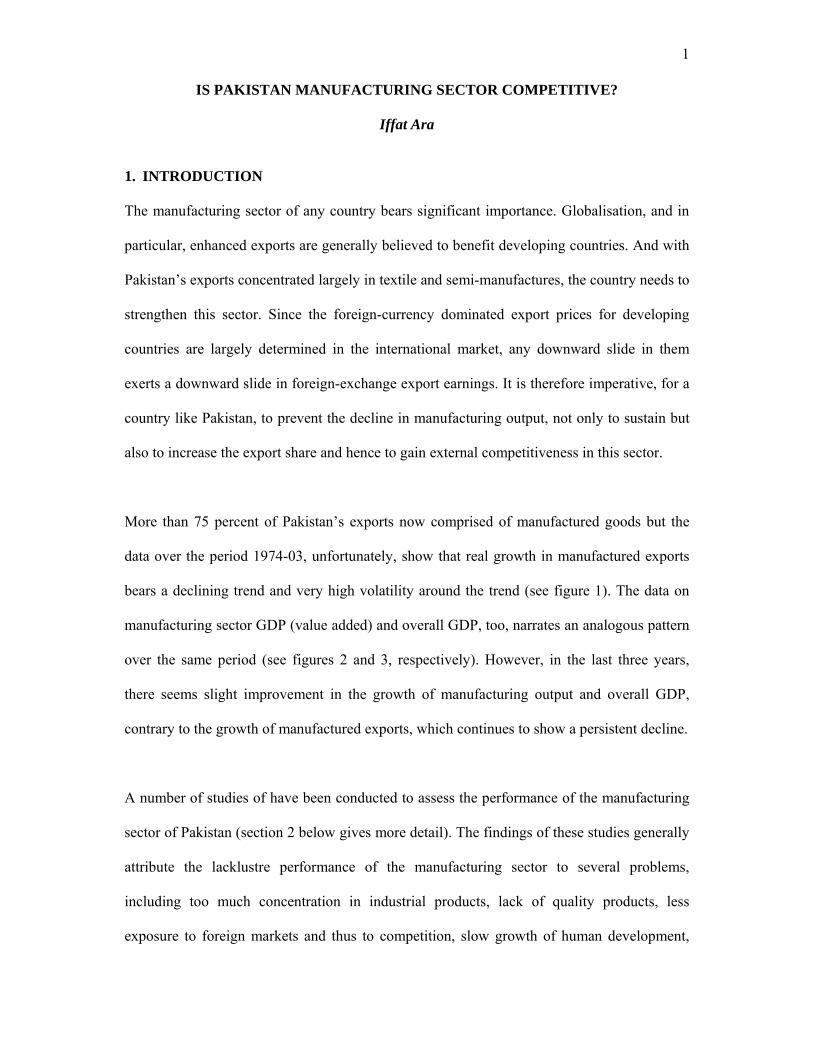
More than 75 percent of Pakistan’s exports now comprised of manufactured goods but the
data over the period 1974-03, unfortunately, show that real growth in manufactured exports
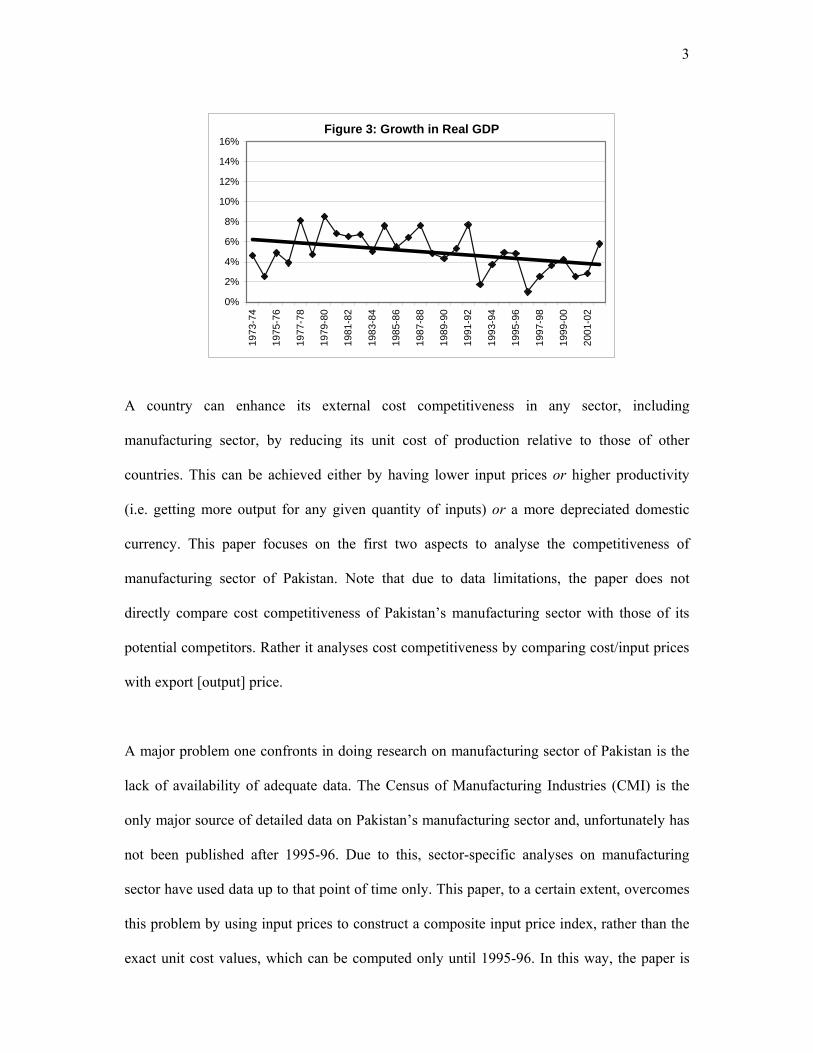
bears a declining trend and very high volatility around the trend (see figure 1). The data on
manufacturing sector GDP (value added) and overall GDP, too, narrates an analogous pattern
over the same period (see figures 2 and 3, respectively). However, in the last three years,
there seems slight improvement in the growth of manufacturing output and overall GDP,
contrary to the growth of manufactured exports, which continues to show a persistent decline.
A number of studies of have been conducted to assess the performance of the manufacturing
sector of Pakistan (section 2 below gives more detail). The findings of these studies generally
attribute the lacklustre performance of the manufacturing sector to several problems,
including too much concentration in industrial products, lack of quality products, less
exposure to foreign markets and thus to competition, slow growth of human development,

2
inadequate investment, and lack of research and development. None of these studies
explicitly discusses the implications of the problems for cost competitiveness of the
manufacturing sector. The present paper attempts to look at the Pakistan’s manufacturing
sector from this perspective.
Figure 1: Growth in Real Manufacturing Export
-20%
-10%
0%
10%
20%
30%
40%
50%
1973
-74
1975
-76
1977
-78
1979
-80
1981
-82
1983
-84
1985
-86
1987
-88
1989
-90
1991
-92
1993
-94
1995
-96
1997
-98
1999
-00
2001
-02
Figure 2: Growth in Manufacturing Real Value Added
-2%0%2%4%6%8%
10%12%14%16%
1973
-74
1975
-76
1977
-78
1979
-80
1981
-82
1983
-84
1985
-86
1987
-88
1989
-90
1991
-92
1993
-94
1995
-96
1997
-98
1999
-00
2001
-02
3
A country can enhance its external cost competitiveness in any sector, including
manufacturing sector, by reducing its unit cost of production relative to those of other
countries. This can be achieved either by having lower input prices or higher productivity
(i.e. getting more output for any given quantity of inputs) or a more depreciated domestic
currency. This paper focuses on the first two aspects to analyse the competitiveness of
manufacturing sector of Pakistan. Note that due to data limitations, the paper does not
directly compare cost competitiveness of Pakistan’s manufacturing sector with those of its
potential competitors. Rather it analyses cost competitiveness by comparing cost/input prices
with export [output] price.
A major problem one confronts in doing research on manufacturing sector of Pakistan is the
lack of availability of adequate data. The Census of Manufacturing Industries (CMI) is the
only major source of detailed data on Pakistan’s manufacturing sector and, unfortunately has
not been published after 1995-96. Due to this, sector-specific analyses on manufacturing
sector have used data up to that point of time only. This paper, to a certain extent, overcomes
this problem by using input prices to construct a composite input price index, rather than the
exact unit cost values, which can be computed only until 1995-96. In this way, the paper is
Figure 3: Growth in Real GDP
0%
2%
4%
6%
8%
10%
12%
14%
16%
1973
-74
1975
-76
1977
-78
1979
-80
1981
-82
1983
-84
1985
-86
1987
-88
1989
-90
1991
-92
1993
-94
1995
-96
1997
-98
1999
-00
2001
-02
4
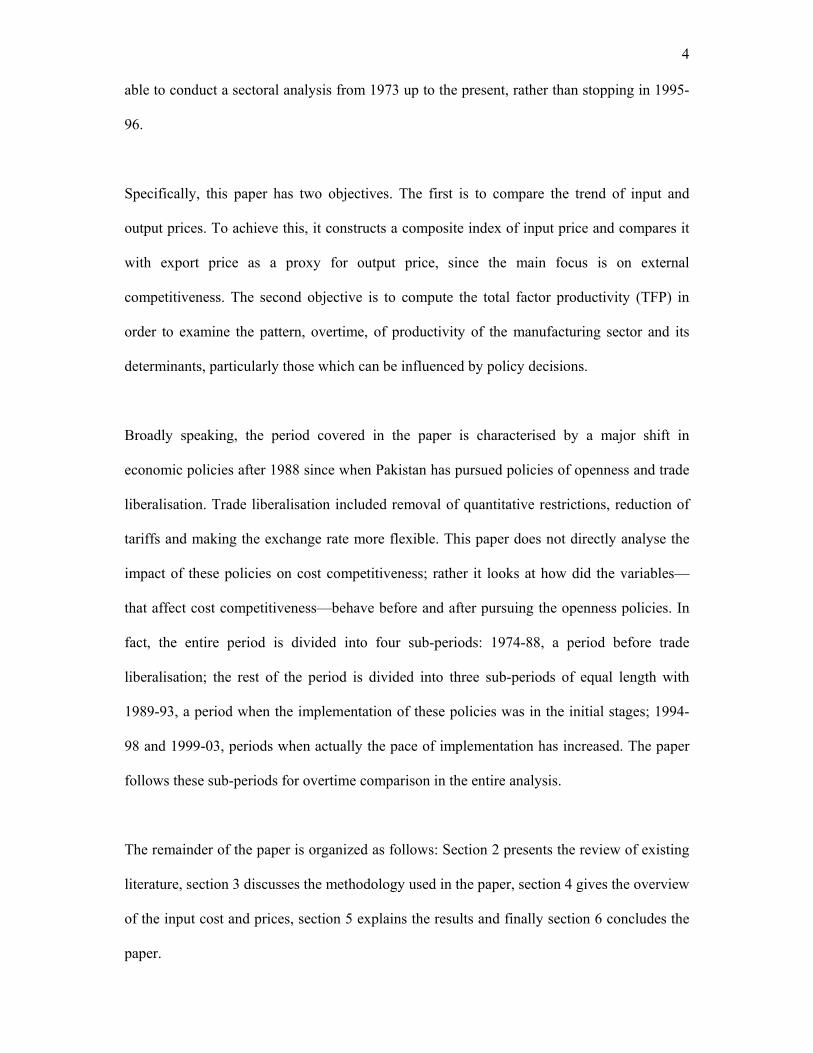
able to conduct a sectoral analysis from 1973 up to the present, rather than stopping in 1995-
96.
Specifically, this paper has two objectives. The first is to compare the trend of input and
output prices. To achieve this, it constructs a composite index of input price and compares it
with export price as a proxy for output price, since the main focus is on external
competitiveness. The second objective is to compute the total factor productivity (TFP) in
order to examine the pattern, overtime, of productivity of the manufacturing sector and its
determinants, particularly those which can be influenced by policy decisions.
Broadly speaking, the period covered in the paper is characterised by a major shift in
economic policies after 1988 since when Pakistan has pursued policies of openness and trade
liberalisation. Trade liberalisation included removal of quantitative restrictions, reduction of
tariffs and making the exchange rate more flexible. This paper does not directly analyse the
impact of these policies on cost competitiveness; rather it looks at how did the variables—
that affect cost competitiveness—behave before and after pursuing the openness policies. In
fact, the entire period is divided into four sub-periods: 1974-88, a period before trade
liberalisation; the rest of the period is divided into three sub-periods of equal length with
1989-93, a period when the implementation of these policies was in the initial stages; 1994-
98 and 1999-03, periods when actually the pace of implementation has increased. The paper
follows these sub-periods for overtime comparison in the entire analysis.
The remainder of the paper is organized as follows: Section 2 presents the review of existing
literature, section 3 discusses the methodology used in the paper, section 4 gives the overview
of the input cost and prices, section 5 explains the results and finally section 6 concludes the
paper.
5
2. PREVIOUS RESEARCH
Most of the research conducted on the manufacturing sector of Pakistan conducted, over the
last two decades estimates a production function that allows the analysis of elasticities of
substitution between different inputs, particularly between capital and labour. These include
Khan and Burki (1999), Khan and Rafiq (1993), Zahid et al. (1993), Chisti and Mahmood
(1991), Batttese and Malik (1988, 1987), Khan (1989, 1988), Kemal (1981). Studies have
also focused on protection structure and industrial inefficiencies (Kemal, 1998), analysis of
capacity utilisation and its major determinants [Kalim (2001a), Pasha and Qureshi (1984)],
exploration of employment potential in different industrial categories [Kalim (2001b)]. Little
attempt, however, has been made, so far, to directly study the pattern of production cost of
the manufacturing sector and to analyse changes that have occurred in this pattern overtime.
Moreover, as far as in TFP is concerned, little research has been done on analysing its trend
and on integrating the sources of growth in it. Wizarat (2002) computed TFP of the large-
scale manufacturing (LSM) sector for the period 1955-91. Her results show an increase in
TFP trend in the period 1955-65, stagnation in the period 1966-70 and a decline in the
decades of 1970s and 1980s. Moreover, she found that the contribution of TFP to economic
growth has been negative (-27 percent), on average, during the period 1955-91. according to
her study economic growth was largely driven by capital (88 percent) and labour (40
percent). IMF (2002) has also computed TFP of the overall economy of Pakistan for the
period 1961-2001. The findings indicate that, on average, TFP experienced negative growth
in the 1960s (-2.2 percent), positive in the 1970s and 1980s when it peaked to 2.4 percent.
However, in the 1990s the growth declined to just 0.6 percent per annum. Furthermore,
human and physical capital have primarily bolstered the GDP growth during this period.
Pasha et. al (2002) pointed out that the growth of TFP of the manufacturing sector shows a
persistence declining trend during the period 1973-98; average annual growth rate of TFP
6
declined from 9.4 percent during 1978-83 to a meagre 1.4 percent during 1993-98. Per annum
contribution of TFP in overall economic growth that was 55 percent during 1978-83 declined
to as low as 16 percent. They further concluded that human capital has played a leading role
in the growth of TFP of manufacturing sector; of the 4.6 percent per annum growth of TFP
during 1973-98, 1.8 percent was the contribution by human capital. Sabir and Ahmed (2002)
studied the impact of structural adjustment policies on TFP, concluded that, although, the
average growth in overall TFP of the overall economy has declined from 2.8 percent in the
pre-reform period (1973-88) to 0.7 percent in the post-reform period (1988-02), in the
manufacturing sector it declined from 5.9 percent to 1.9 percent, respectively during these
two periods. In addition, their results indicate that during pre- and post-reform periods, the
relative contribution of TFP to overall value added has declined from 48 percent per annum
to 16 percent per annum whereas in the manufacturing value added its contribution has
declined from 79 percent per annum to 45 percent per annum. They also noticed that human
capital has been the major factor that contributed to TFP growth during these periods.
3. METHODOLOGY
This section discusses the methodologies that are employed to meet the objectives of the
paper.
3.1 Composite Input Price Index
The paper analyses the trend in input cost of the manufacturing sector of Pakistan by focusing
on input prices. For this, it constructs composite price indices for factor and non-factor inputs
separately. The composite input price index is the aggregate index of different input prices,
where each input price is weighted by the share of that input in total cost of the selected
sectors of manufacturing. These shares are obtained from the Census of Manufacturing
Industries (CMI), which provides data on large-scale manufacturing constituting over 72
7
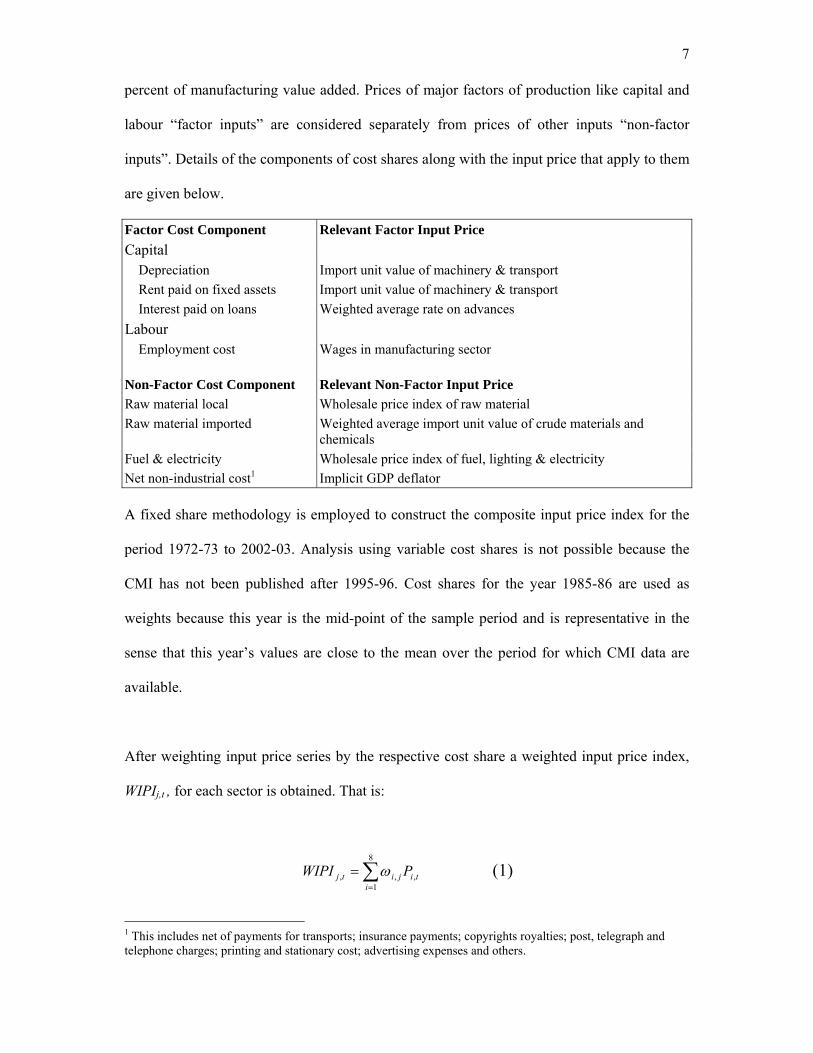
percent of manufacturing value added. Prices of major factors of production like capital and
labour “factor inputs” are considered separately from prices of other inputs “non-factor
inputs”. Details of the components of cost shares along with the input price that apply to them
are given below.
Factor Cost Component Relevant Factor Input Price Capital Depreciation Import unit value of machinery & transport Rent paid on fixed assets Import unit value of machinery & transport Interest paid on loans Weighted average rate on advances Labour Employment cost Wages in manufacturing sector Non-Factor Cost Component
Relevant Non-Factor Input Price
Raw material local Wholesale price index of raw material Raw material imported Weighted average import unit value of crude materials and
chemicals Fuel & electricity Wholesale price index of fuel, lighting & electricity Net non-industrial cost1 Implicit GDP deflator A fixed share methodology is employed to construct the composite input price index for the
period 1972-73 to 2002-03. Analysis using variable cost shares is not possible because the
CMI has not been published after 1995-96. Cost shares for the year 1985-86 are used as
weights because this year is the mid-point of the sample period and is representative in the
sense that this year’s values are close to the mean over the period for which CMI data are
available.
After weighting input price series by the respective cost share a weighted input price index,
WIPIj,t , for each sector is obtained. That is:
∑=
=8
1,,,
itijitj PWIPI ω (1)
1 This includes net of payments for transports; insurance payments; copyrights royalties; post, telegraph and telephone charges; printing and stationary cost; advertising expenses and others.
8
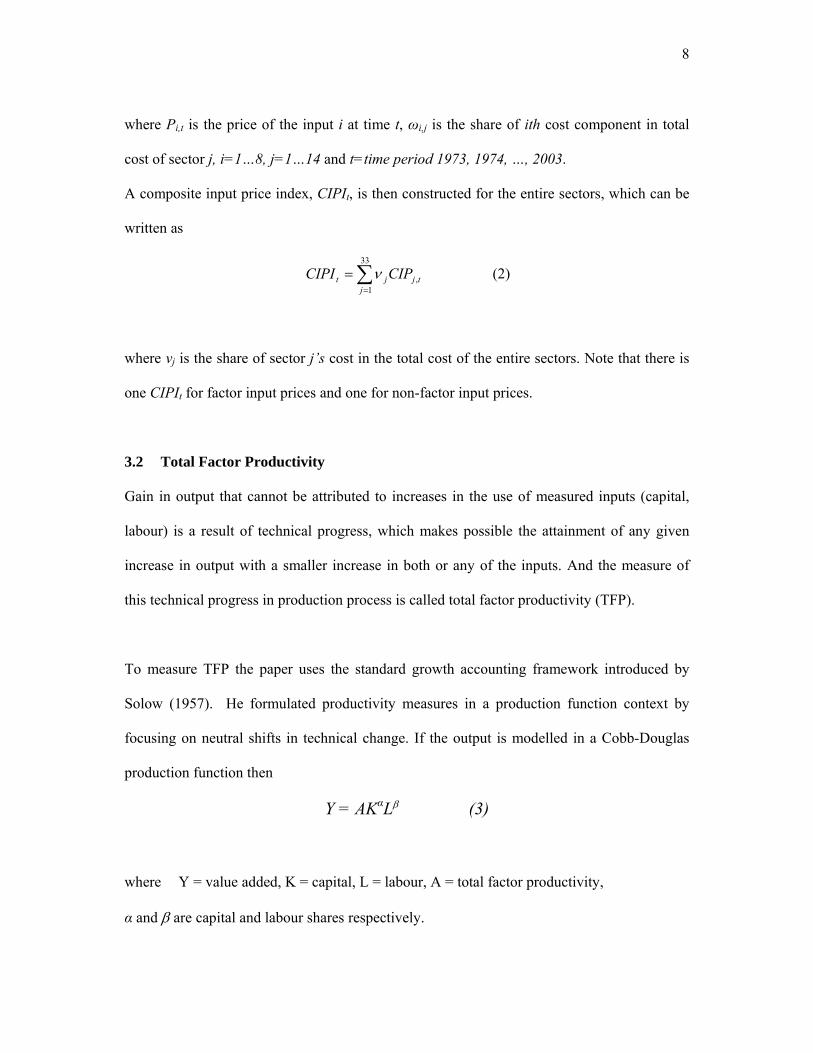
where Pi,t is the price of the input i at time t, ωi,j is the share of ith cost component in total
cost of sector j, i=1…8, j=1…14 and t=time period 1973, 1974, …, 2003.
A composite input price index, CIPIt, is then constructed for the entire sectors, which can be
written as
∑=
=33
1,
jtjjt CIPCIPI ν (2)
where νj is the share of sector j’s cost in the total cost of the entire sectors. Note that there is
one CIPIt for factor input prices and one for non-factor input prices.
3.2 Total Factor Productivity
Gain in output that cannot be attributed to increases in the use of measured inputs (capital,
labour) is a result of technical progress, which makes possible the attainment of any given
increase in output with a smaller increase in both or any of the inputs. And the measure of
this technical progress in production process is called total factor productivity (TFP).
To measure TFP the paper uses the standard growth accounting framework introduced by
Solow (1957). He formulated productivity measures in a production function context by
focusing on neutral shifts in technical change. If the output is modelled in a Cobb-Douglas
production function then
Y = AKαLβ (3)
where Y = value added, K = capital, L = labour, A = total factor productivity,
α and β are capital and labour shares respectively.

9
With constant returns to scale, that is β =1-α, it is apparent from this equation that TFP is the
quantity of output per unit of a geometrically weighted quantity of all inputs used in the
production process. Put differently, technical change (the growth rate of TFP) can also be
measured as a rate at which production function shifts overtime. For this, equation (3) can be
rearranged to give:
LKAY gggg βα ++= (4)
where g is the growth rate
Since all the variables are observed except gA, it therefore can be computed by rearranging
the production function as follows:
LKYA gggg βα −−= (5)
The postulated shares of capital and labour, α and 1-α respectively, are obtained from the
production function estimates of SPDC (2002) Integrated Social Policy and Macroeconomic
(ISPM) Model. The Model estimates a production function subject to the constraint that α and
β add up to 1.
3.3 Determinants of Total Factor Productivity
The paper also investigates what factors derive the growth in TFP of manufacturing sector.
Previous studies on developing countries in this regard have taken capital structure, labour,
education and training, demand intensity, economic restructuring, economies of scale, trade
openness, fiscal expenditures and foreign direct investment as the determinants of TFP
growth [see Wizarat (2002), Pasha et.al (2002), Sabir and Ahmed (2002), IMF (2002),
Chumacero and Fuentes (2002)]. In this spirit and given the constraints to the availability of
10
data for the period 1973-03, this paper concentrates on the following notable determinants of
manufacturing sector TFP growth.
Index of skill adjustment of labour input (SAL) is the ratio of total employment adjusted for
education levels to the unadjusted total employment. It is expected that, for a given level of
employment and hours worked, the more skilled the labour force is the higher is the growth
in TFP.
Investment (INV) in manufacturing reflects the productive capital investment in physical
plants, buildings, advanced machinery and equipment. This helps make workers more
productive and is a way of embodying new technology in the production process. Clearly, in
the long-run this variable should enhance TFP growth. However, in the short-run its impact is
ambiguous because of gestation lags. The empirical proxy for this variable is the share of new
investment in the capital stock.
Openness of the economy (OPEN) can enhance TFP through such channels as efficiency
gains from speicalisation and global competition and through raising the scope for learning-
by-doing and greater access to larger markets. The paper follows the conventional procedure
of taking total trade as a percentage of GDP to represent openness of the economy.
Economic restructuring (ER) refers to the movement of resources from less productive
sectors towards the more productive sectors of the economy. Theory posits a favourable
impact of this variable on overall TFP growth as resources in the more productive sectors are
utilised in a more efficient manner than resources in a less productive sectors. This variable
can be proxied by taking the ratio of value added of manufacturing sector to the value added
of the economy, as a whole.
11
Availability of infrastructure (IFR) leads to the improvement in the accessibility of transport
and communication, electricity and gas, etc. This is assumed to enhance TFP growth.
Infrastructure availability can be captured by taking the value added in transport and
communication, and electricity and gas sectors.
The paper thus estimates the following equation for TFP, of manufacturing sector, using OLS
estimation technique. The contribution of these factors to the change in TFP can then be
quantified using the estimated regression coefficients.
IFRbERbOPENbNIbSALbbTFP o 54321 +++++= (6)
Data Sources
The series for capital stock has been computed by using the following evolution identity for
the capital stock and an initial level of capital stock Ko.
GIKK tt +−= − )1(1 δ (7)
where Kt is current capital stock, Kt-1 is the initial capital stock, GI is gross investment, δ is
rate of depreciation (2.5 percent in this case).
Data for input price indices, manufactured export price index, value added, gross investment,
manufactured exports and the exchange rate are taken from GOP, Economic Survey (various
issues); interest rate on advances from SBP, Statistical Bulletin (various issues); labour force
and wages from FBS, Labour force Survey (various issues).
4. OVERVIEW OF THE INPUT COST AND PRICES
As has already been discussed, output depends on capital, labour and other intermediate
inputs and the cost depends on the amount spent on employing these inputs to produce a
12
certain level of output. In this connection, the paper first looks at the share of different cost
components in the manufacturing sector. The paper then analyses the changes that have
occurred over time in the prices of the inputs.
4.1 Input Cost Structure
To explain the cost structure the variables used are obtained from CMI. According to CMI,
the cost of production incurred on capital is depreciation, rent paid to fixed assets and interest
paid; that incurred on labour is the employment cost; and the cost of intermediate input it is
the expenditure on raw-material (local and imported), fuel and electricity, transportation, etc.
Different sectors are selected at the 3-digit and 5-digit levels, which are then classified into
two broad categories. One is the textile and apparel sector and the other non-textile sectors.
The non-textile sectors are comprised of those industries that are already exporting part of
their output, as well as those where export potential can be created in order to diversify
Pakistan’s exports (see appendix for the list of sectors).
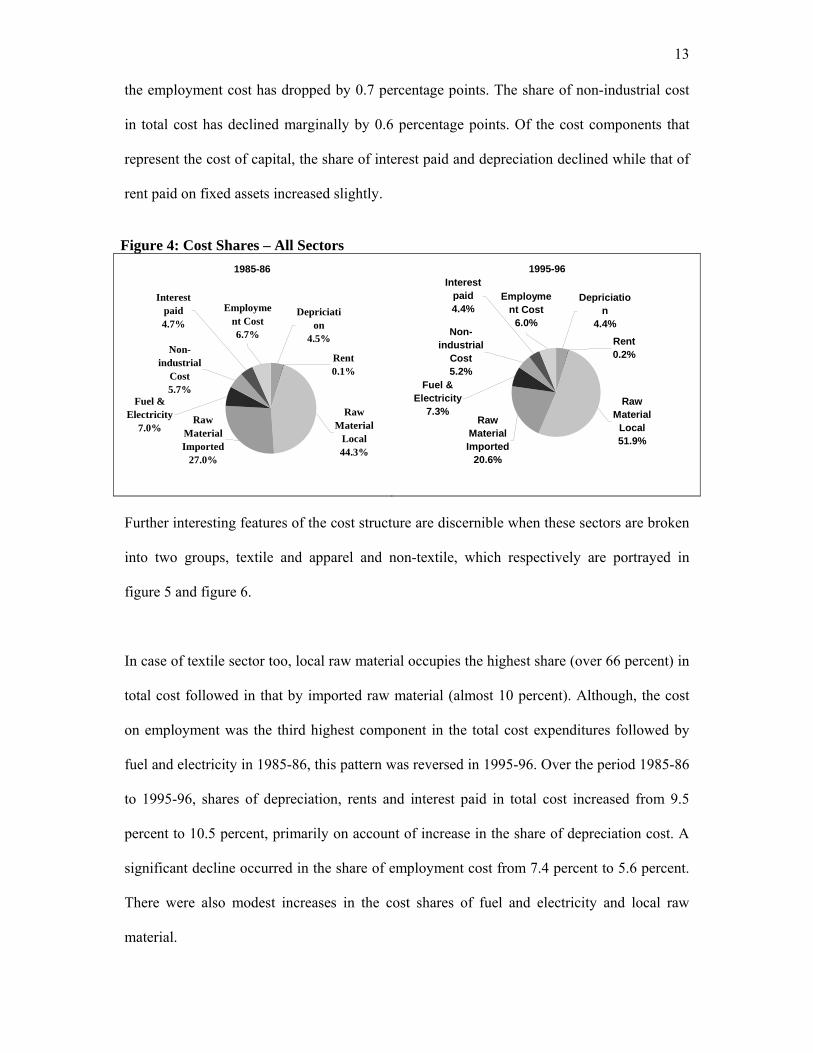
To begin with, the paper explains the aggregate cost structure of these selected sectors. The
pie charts in figure 4, which show a comparison of 1985-86 and 1995-96, gives the
expenditure (cost) share of each of these components in total production cost. In both the
sub-periods, most of the cost expenditure falls within the category of raw materials, as
evident from their cost shares. The highest share in the cost of production is occupied by the
cost of local raw material followed by imported raw material. Over the period of ten years,
the former shows an increase (from 44 percent to 52 percent) while the latter a decline (from
27 percent to nearly 21 percent). However, the combined share of local and imported raw
material has not changed much over this period (about 72 percent in both sub-periods). Fuel
and electricity is the third largest cost expenditure followed by employment cost. The share
of fuel and electricity in total cost rose slightly from 7 percent to 7.2 percent whereas that of
13
the employment cost has dropped by 0.7 percentage points. The share of non-industrial cost
in total cost has declined marginally by 0.6 percentage points. Of the cost components that
represent the cost of capital, the share of interest paid and depreciation declined while that of
rent paid on fixed assets increased slightly.
Figure 4: Cost Shares – All Sectors
Further interesting features of the cost structure are discernible when these sectors are broken
into two groups, textile and apparel and non-textile, which respectively are portrayed in
figure 5 and figure 6.
In case of textile sector too, local raw material occupies the highest share (over 66 percent) in
total cost followed in that by imported raw material (almost 10 percent). Although, the cost
on employment was the third highest component in the total cost expenditures followed by
fuel and electricity in 1985-86, this pattern was reversed in 1995-96. Over the period 1985-86
to 1995-96, shares of depreciation, rents and interest paid in total cost increased from 9.5
percent to 10.5 percent, primarily on account of increase in the share of depreciation cost. A
significant decline occurred in the share of employment cost from 7.4 percent to 5.6 percent.
There were also modest increases in the cost shares of fuel and electricity and local raw
material.
1985-86
Raw Material Imported
27.0%
Employment Cost6.7%
Interest paid4.7%
Non-industrial
Cost 5.7%
Fuel & Electricity
7.0%
Depriciation
4.5%
Rent 0.1%
Raw Material
Local44.3%
1995-96
Raw Material
Local51.9%
Rent 0.2%
Depriciation
4.4%
Fuel & Electricity
7.3%
Non-industrial
Cost 5.2%
Interest paid4.4%
Employment Cost
6.0%
Raw Material Imported
20.6%
14
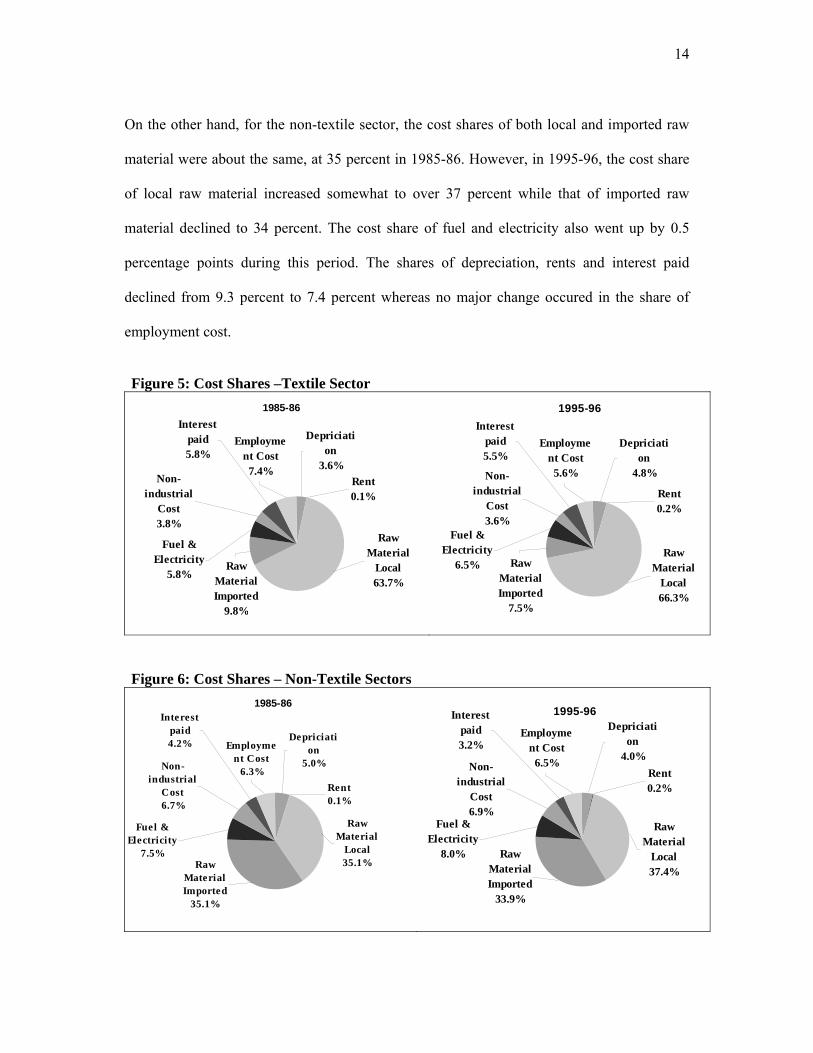
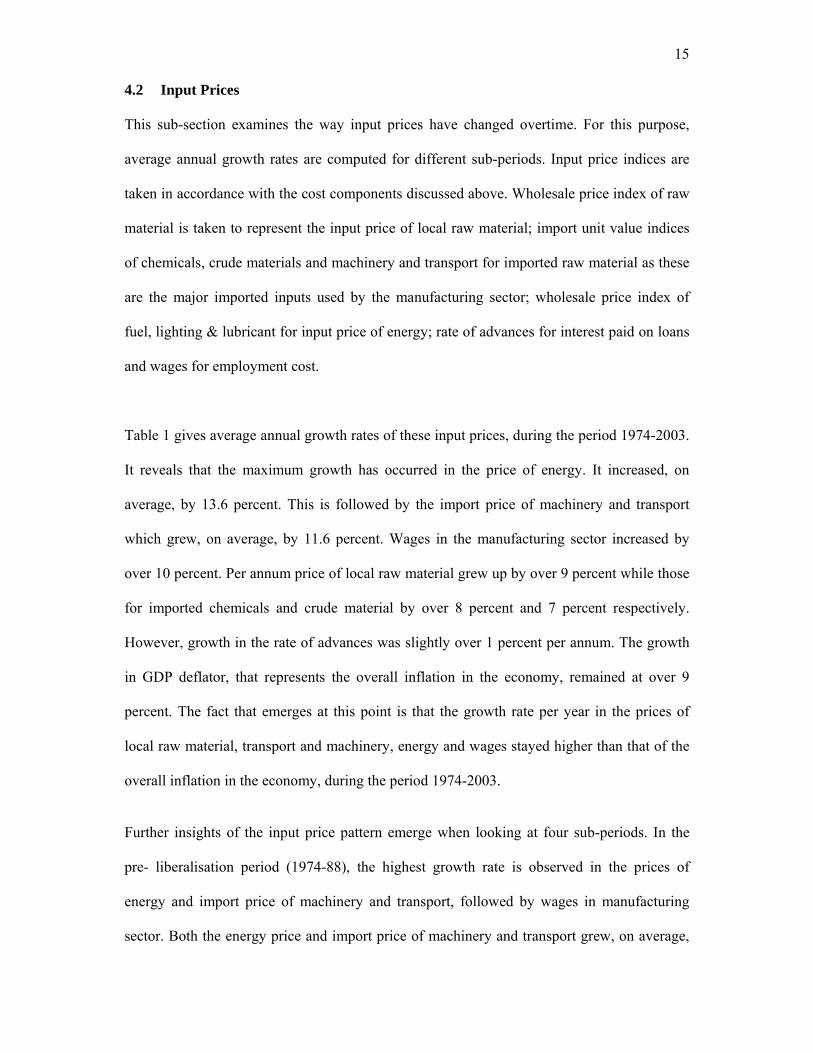
On the other hand, for the non-textile sector, the cost shares of both local and imported raw
material were about the same, at 35 percent in 1985-86. However, in 1995-96, the cost share
of local raw material increased somewhat to over 37 percent while that of imported raw
material declined to 34 percent. The cost share of fuel and electricity also went up by 0.5
percentage points during this period. The shares of depreciation, rents and interest paid
declined from 9.3 percent to 7.4 percent whereas no major change occured in the share of
employment cost.
Figure 5: Cost Shares –Textile Sector
Figure 6: Cost Shares – Non-Textile Sectors
1985-86
Raw Material
Local63.7%
Rent 0.1%
Depriciation
3.6%
Fuel & Electricity
5.8%
Non-industrial
Cost 3.8%
Interest paid5.8%
Employment Cost
7.4%
Raw Material Imported
9.8%
1995-96
Raw Material Imported
7.5%
Employment Cost
5.6%
Interest paid5.5%
Non-industrial
Cost 3.6%
Fuel & Electricity
6.5%
Depriciation
4.8%
Rent 0.2%
Raw Material
Local66.3%
1985-86
Raw Material
Local35.1%
Rent 0.1%
Depriciation
5.0%
Fuel & Electricity
7.5%
Non-industrial
Cost 6.7%
Interest paid4.2% Employme
nt Cost6.3%
Raw Material Imported
35.1%
1995-96
Raw Material
Local37.4%
Rent 0.2%
Depriciation
4.0%
Fuel & Electricity
8.0%
Non-industrial
Cost 6.9%
Interest paid3.2%
Employment Cost
6.5%
Raw Material Imported
33.9%
15
4.2 Input Prices
This sub-section examines the way input prices have changed overtime. For this purpose,
average annual growth rates are computed for different sub-periods. Input price indices are
taken in accordance with the cost components discussed above. Wholesale price index of raw
material is taken to represent the input price of local raw material; import unit value indices
of chemicals, crude materials and machinery and transport for imported raw material as these
are the major imported inputs used by the manufacturing sector; wholesale price index of
fuel, lighting & lubricant for input price of energy; rate of advances for interest paid on loans
and wages for employment cost.
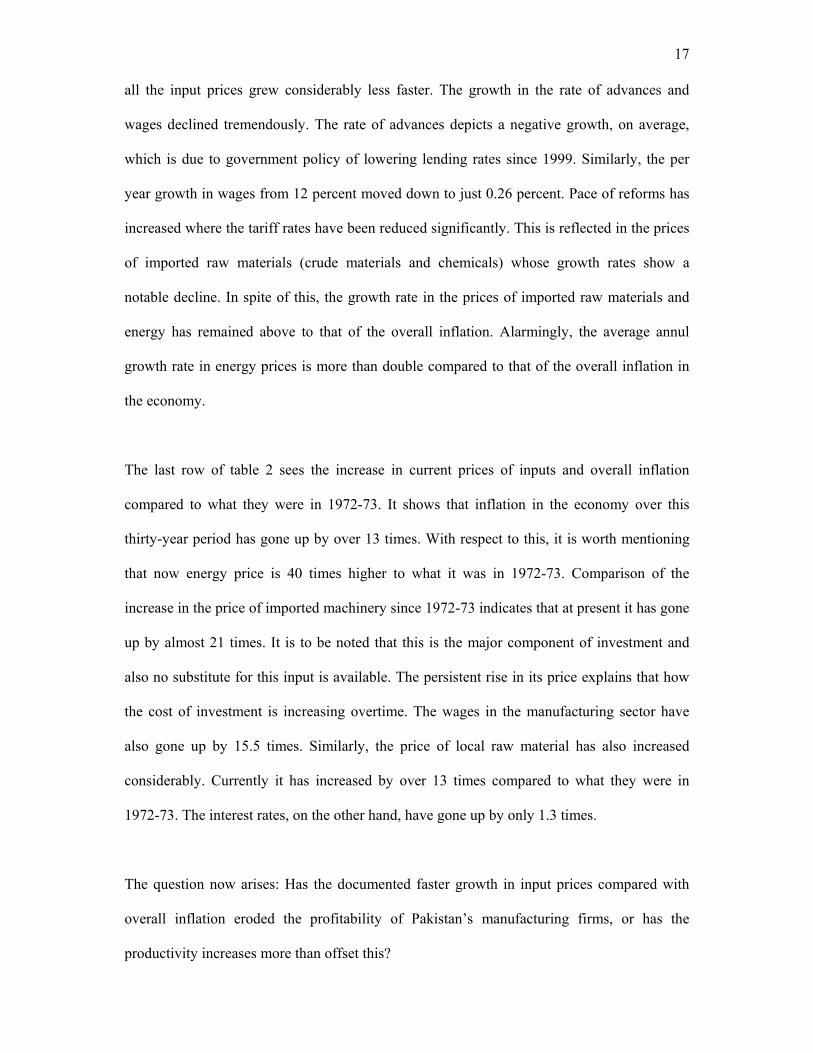
Table 1 gives average annual growth rates of these input prices, during the period 1974-2003.
It reveals that the maximum growth has occurred in the price of energy. It increased, on
average, by 13.6 percent. This is followed by the import price of machinery and transport
which grew, on average, by 11.6 percent. Wages in the manufacturing sector increased by
over 10 percent. Per annum price of local raw material grew up by over 9 percent while those
for imported chemicals and crude material by over 8 percent and 7 percent respectively.
However, growth in the rate of advances was slightly over 1 percent per annum. The growth
in GDP deflator, that represents the overall inflation in the economy, remained at over 9
percent. The fact that emerges at this point is that the growth rate per year in the prices of
local raw material, transport and machinery, energy and wages stayed higher than that of the
overall inflation in the economy, during the period 1974-2003.
Further insights of the input price pattern emerge when looking at four sub-periods. In the
pre- liberalisation period (1974-88), the highest growth rate is observed in the prices of
energy and import price of machinery and transport, followed by wages in manufacturing
sector. Both the energy price and import price of machinery and transport grew, on average,
16
by almost 16 percent and growth in wages remained at 12.5 percent per annum. Moreover,
the growth rate of these prices was higher than that of the overall inflation in the economy,
which grew at 10 percent per annum.
TABLE 1 MAJOR INPUT PRICES AND GDP DEFLATOR
(Average Annual Growth Rates)
Factor Inputs Non-Factor Inputs Capital Labour Raw Material Imported
Period Machinery
&Transport Rate on
Advances Wages
Raw
Material Local
Chemicals Crude Materials
Energy GDP
Deflator
1974-03 11.64 1.10 10.18 9.36 8.16 7.04 13.57 9.21 1974-88 15.75 3.26 12.42 9.86 8.41 5.62 15.71 10.06 1989-93 10.98 2.18 10.69 8.71 7.78 10.37 8.03 9.37 1994-98 5.44 2.91 12.86 14.30 10.20 10.40 14.91 11.21 1999-03 6.17 -8.27 0.26 3.57 5.74 4.59 11.32 4.49
Prices in 2003 as a Ratio of Prices in 1973 2003/1973 20.82 1.27 15.49 13.33 9.36 7.25 40.24 13.65 Source: GOP, Economic Survey (various issues); SBP, Statistical Bulletin (various issues); FBS, Labour Force Survey (various issues).
In the initial post-liberalisation period, 1989-93, average annual growth in the prices of all
inputs slowed, except those of crude materials. A massive increase, almost a doubling
occurred in the growth rate of crude materials price. Although, the growth in the price
machinery and transport and wages went down in this sub-period, these were still
outstripping the growth in overall inflation. During the period, 1994-98, when the functioning
of liberalisation policies got speeded up, the per annum growth in the prices of energy, local
raw materials, import price of chemicals and wages went up sharply. A big jump is seen in
the average annual growth rates in the price of energy, which on average, grew up by 6.9
percentage point higher than that in the period 1988-93. This is followed by the increase in
the rate of growth of local raw material price, which on average rose by 5.6 percentage points
higher as compared to that in the period 1989-93. Compared to growth of overall inflation in
the economy, the growth in energy price was 3.7 percentage points higher and that of local
raw material was 3.1 percentage points higher. Finally, in the recent period 1999-03, almost
17
all the input prices grew considerably less faster. The growth in the rate of advances and
wages declined tremendously. The rate of advances depicts a negative growth, on average,
which is due to government policy of lowering lending rates since 1999. Similarly, the per
year growth in wages from 12 percent moved down to just 0.26 percent. Pace of reforms has
increased where the tariff rates have been reduced significantly. This is reflected in the prices
of imported raw materials (crude materials and chemicals) whose growth rates show a
notable decline. In spite of this, the growth rate in the prices of imported raw materials and
energy has remained above to that of the overall inflation. Alarmingly, the average annul
growth rate in energy prices is more than double compared to that of the overall inflation in
the economy.
The last row of table 2 sees the increase in current prices of inputs and overall inflation
compared to what they were in 1972-73. It shows that inflation in the economy over this
thirty-year period has gone up by over 13 times. With respect to this, it is worth mentioning
that now energy price is 40 times higher to what it was in 1972-73. Comparison of the
increase in the price of imported machinery since 1972-73 indicates that at present it has gone
up by almost 21 times. It is to be noted that this is the major component of investment and
also no substitute for this input is available. The persistent rise in its price explains that how
the cost of investment is increasing overtime. The wages in the manufacturing sector have
also gone up by 15.5 times. Similarly, the price of local raw material has also increased
considerably. Currently it has increased by over 13 times compared to what they were in
1972-73. The interest rates, on the other hand, have gone up by only 1.3 times.
The question now arises: Has the documented faster growth in input prices compared with
overall inflation eroded the profitability of Pakistan’s manufacturing firms, or has the
productivity increases more than offset this?

18
5. RESULTS AND EXPLANATION
This section discusses the results of the comparison of input prices to the export price and of
the computation of TFP.
5.1 Composite Input Price Index and Export Price Index
This analysis relies on input and output price indices to examine the trend in input cost and
return on output, respectively, which obviously cannot provide any information about
absolute cost and return. However, these indices do provide a comparison, in relation to a
base year, of the movement of cost and return over the period 1972-73 to 2002-03.
The cost shares and input price indices are used to construct the composite or weighted factor
and non-factor input price index, separately, in order to see how the input prices faced by the
manufacturing sector have changed overtime. Since this paper attempts to assess the external
competitiveness of manufacturing sector it, therefore, focuses on export price (rather than
output price) of manufactured goods, which is determined in the international market. Export
price index in Pak-rupee terms is considered here.
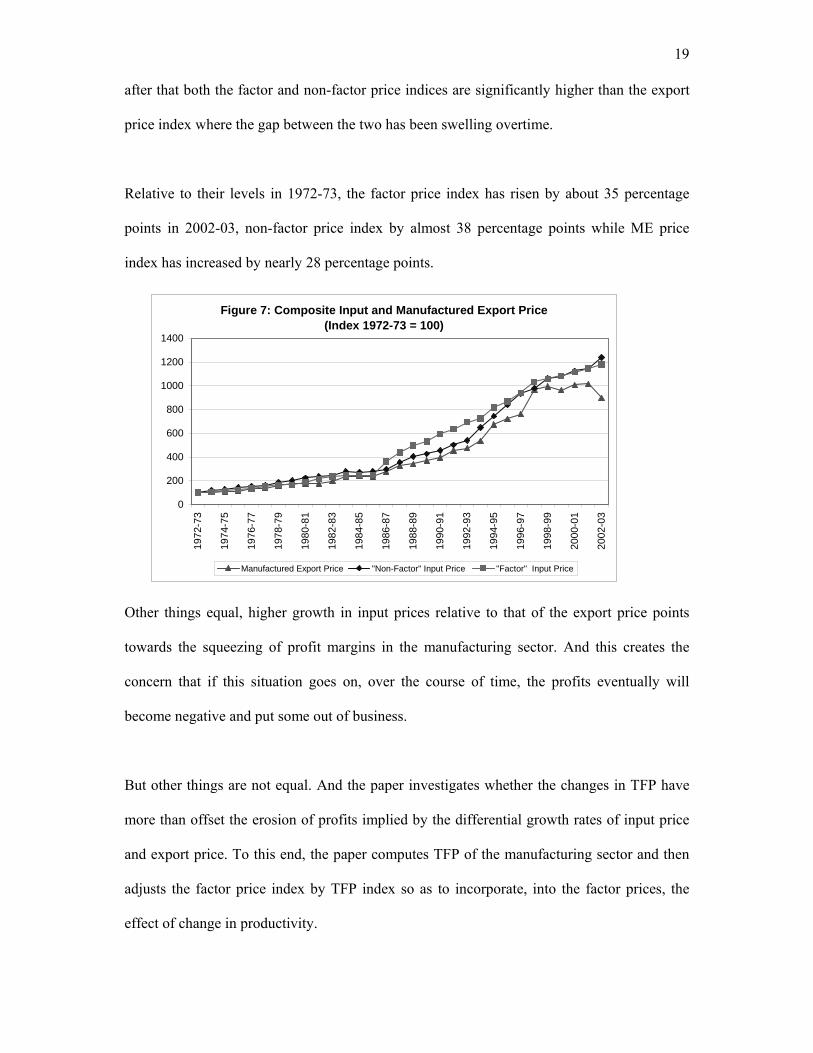
Figure 7 depicts the composite price index of both factor and non-factor inputs along with
manufactured export (ME) price index for the period 1972-73 to 2002-03. It is telling that in
almost all the years of this period the index of both factor and non-factor input price has
remained higher than the index of export price. This indicates that the growth rate of input
prices, both factor and non-factor has been higher than that in the export price during this
period. More than that it says that at each point in time after 1972-73 “cumulative growth” in
factor and non factor prices has been greater than that in manufactured export price. This
difference in the indices of input and export price was somewhat marginal up till 1986-87 but
19
after that both the factor and non-factor price indices are significantly higher than the export
price index where the gap between the two has been swelling overtime.
Relative to their levels in 1972-73, the factor price index has risen by about 35 percentage
points in 2002-03, non-factor price index by almost 38 percentage points while ME price
index has increased by nearly 28 percentage points.
Other things equal, higher growth in input prices relative to that of the export price points
towards the squeezing of profit margins in the manufacturing sector. And this creates the
concern that if this situation goes on, over the course of time, the profits eventually will
become negative and put some out of business.
But other things are not equal. And the paper investigates whether the changes in TFP have
more than offset the erosion of profits implied by the differential growth rates of input price
and export price. To this end, the paper computes TFP of the manufacturing sector and then
adjusts the factor price index by TFP index so as to incorporate, into the factor prices, the
effect of change in productivity.
Figure 7: Composite Input and Manufactured Export Price (Index 1972-73 = 100)
0
200
400
600
800
1000
1200
1400
1972
-73
1974
-75
1976
-77
1978
-79
1980
-81
1982
-83
1984
-85
1986
-87
1988
-89
1990
-91
1992
-93
1994
-95
1996
-97
1998
-99
2000
-01
2002
-03
Manufactured Export Price "Non-Factor" Input Price "Factor" Input Price
20
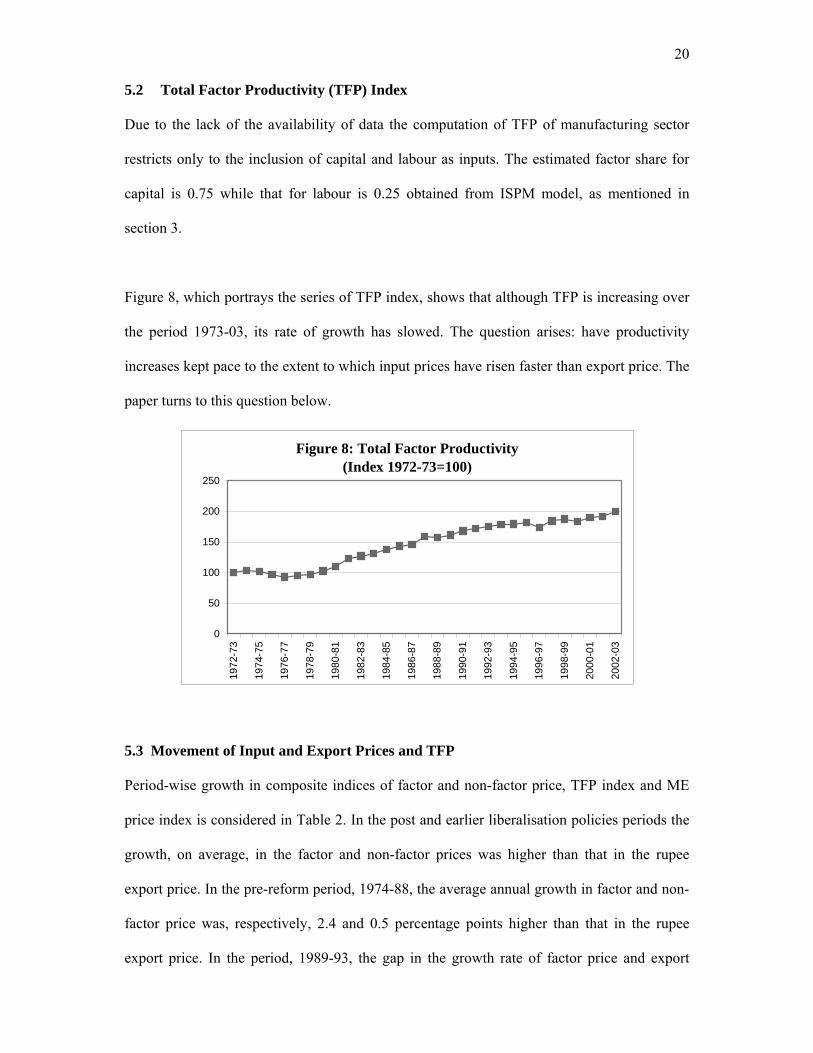
5.2 Total Factor Productivity (TFP) Index
Due to the lack of the availability of data the computation of TFP of manufacturing sector
restricts only to the inclusion of capital and labour as inputs. The estimated factor share for
capital is 0.75 while that for labour is 0.25 obtained from ISPM model, as mentioned in
section 3.
Figure 8, which portrays the series of TFP index, shows that although TFP is increasing over
the period 1973-03, its rate of growth has slowed. The question arises: have productivity
increases kept pace to the extent to which input prices have risen faster than export price. The
paper turns to this question below.
Figure 8: Total Factor Productivity (Index 1972-73=100)
0
50
100
150
200
250
1972
-73
1974
-75
1976
-77
1978
-79
1980
-81
1982
-83
1984
-85
1986
-87
1988
-89
1990
-91
1992
-93
1994
-95
1996
-97
1998
-99
2000
-01
2002
-03
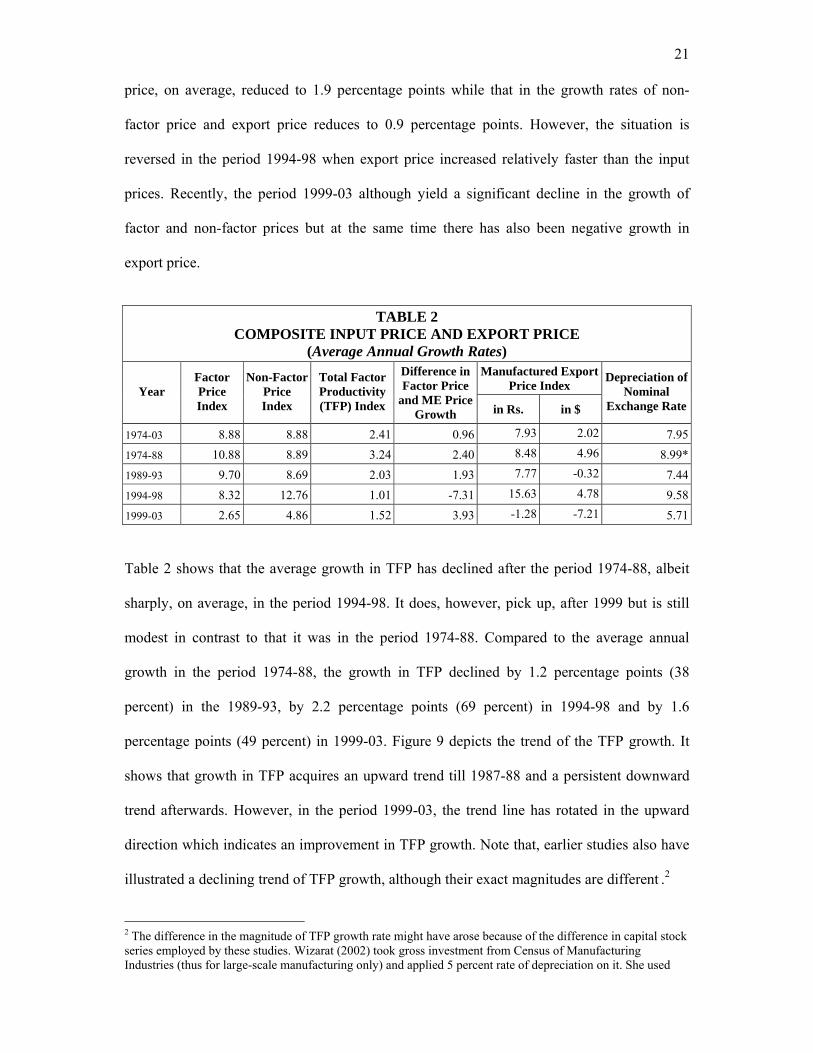
5.3 Movement of Input and Export Prices and TFP
Period-wise growth in composite indices of factor and non-factor price, TFP index and ME
price index is considered in Table 2. In the post and earlier liberalisation policies periods the
growth, on average, in the factor and non-factor prices was higher than that in the rupee
export price. In the pre-reform period, 1974-88, the average annual growth in factor and non-
factor price was, respectively, 2.4 and 0.5 percentage points higher than that in the rupee
export price. In the period, 1989-93, the gap in the growth rate of factor price and export
21
price, on average, reduced to 1.9 percentage points while that in the growth rates of non-
factor price and export price reduces to 0.9 percentage points. However, the situation is
reversed in the period 1994-98 when export price increased relatively faster than the input
prices. Recently, the period 1999-03 although yield a significant decline in the growth of
factor and non-factor prices but at the same time there has also been negative growth in
export price.
TABLE 2
COMPOSITE INPUT PRICE AND EXPORT PRICE (Average Annual Growth Rates)
Manufactured Export Price Index Year
Factor Price Index
Non-Factor Price Index
Total Factor Productivity (TFP) Index
Difference in Factor Price
and ME Price Growth in Rs. in $
Depreciation of Nominal
Exchange Rate
1974-03 8.88 8.88 2.41 0.96 7.93 2.02 7.951974-88 10.88 8.89 3.24 2.40 8.48 4.96 8.99*1989-93 9.70 8.69 2.03 1.93 7.77 -0.32 7.441994-98 8.32 12.76 1.01 -7.31 15.63 4.78 9.581999-03 2.65 4.86 1.52 3.93 -1.28 -7.21 5.71 Table 2 shows that the average growth in TFP has declined after the period 1974-88, albeit
sharply, on average, in the period 1994-98. It does, however, pick up, after 1999 but is still
modest in contrast to that it was in the period 1974-88. Compared to the average annual
growth in the period 1974-88, the growth in TFP declined by 1.2 percentage points (38
percent) in the 1989-93, by 2.2 percentage points (69 percent) in 1994-98 and by 1.6
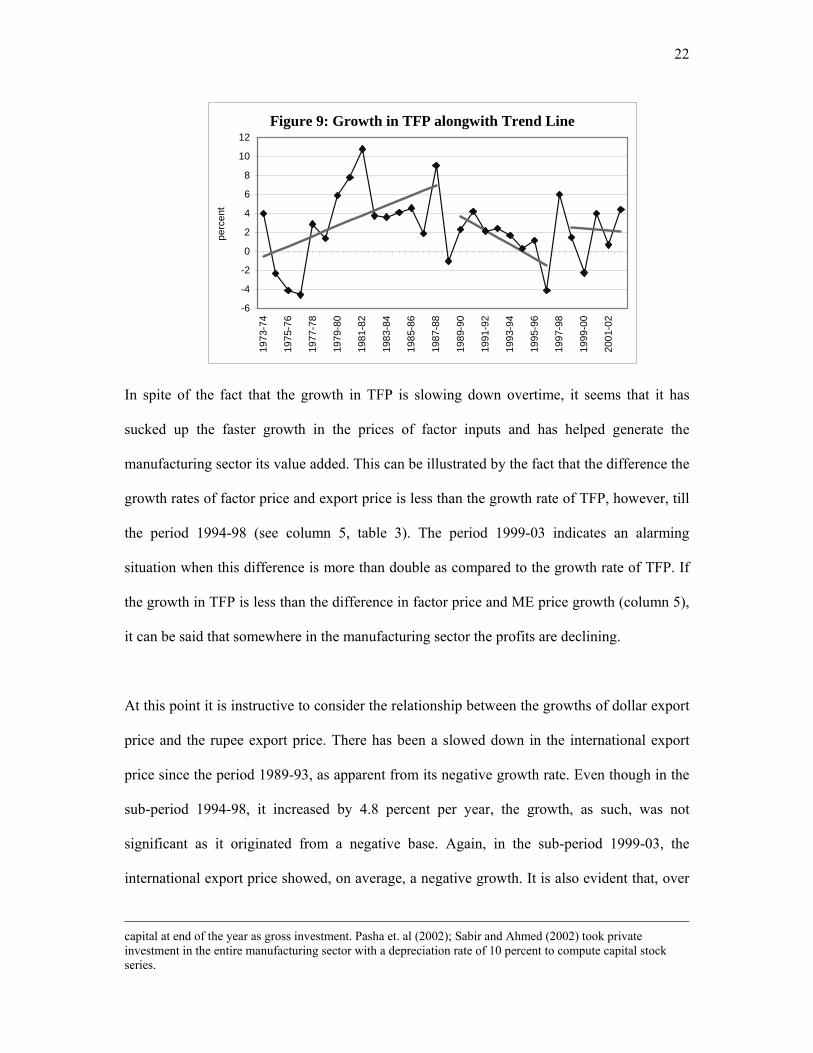
percentage points (49 percent) in 1999-03. Figure 9 depicts the trend of the TFP growth. It
shows that growth in TFP acquires an upward trend till 1987-88 and a persistent downward
trend afterwards. However, in the period 1999-03, the trend line has rotated in the upward
direction which indicates an improvement in TFP growth. Note that, earlier studies also have
illustrated a declining trend of TFP growth, although their exact magnitudes are different .2
2 The difference in the magnitude of TFP growth rate might have arose because of the difference in capital stock series employed by these studies. Wizarat (2002) took gross investment from Census of Manufacturing Industries (thus for large-scale manufacturing only) and applied 5 percent rate of depreciation on it. She used
22
In spite of the fact that the growth in TFP is slowing down overtime, it seems that it has
sucked up the faster growth in the prices of factor inputs and has helped generate the
manufacturing sector its value added. This can be illustrated by the fact that the difference the
growth rates of factor price and export price is less than the growth rate of TFP, however, till
the period 1994-98 (see column 5, table 3). The period 1999-03 indicates an alarming
situation when this difference is more than double as compared to the growth rate of TFP. If
the growth in TFP is less than the difference in factor price and ME price growth (column 5),
it can be said that somewhere in the manufacturing sector the profits are declining.
At this point it is instructive to consider the relationship between the growths of dollar export
price and the rupee export price. There has been a slowed down in the international export
price since the period 1989-93, as apparent from its negative growth rate. Even though in the
sub-period 1994-98, it increased by 4.8 percent per year, the growth, as such, was not
significant as it originated from a negative base. Again, in the sub-period 1999-03, the
international export price showed, on average, a negative growth. It is also evident that, over
capital at end of the year as gross investment. Pasha et. al (2002); Sabir and Ahmed (2002) took private investment in the entire manufacturing sector with a depreciation rate of 10 percent to compute capital stock series.
Figure 9: Growth in TFP alongwith Trend Line
-6
-4
-2
0
2
4
6
8
10
12
1973
-74
1975
-76
1977
-78
1979
-80
1981
-82
1983
-84
1985
-86
1987
-88
1989
-90
1991
-92
1993
-94
1995
-96
1997
-98
1999
-00
2001
-02
perc
ent
23
this period, rupee has been depreciated considerably to enhance the external competitiveness.
In the sub-period 1994-98 when rupee was massively devalued, over 9 percent per annum,
the growth in rupee export price was very high, over 15 percent per annum, compared to that
in the dollar export price. In the next sub-period, when the exchange rate depreciation was
maintained at a relatively low level, 5.7 percent per annum, the rupee export prices could not
be prevented from the effect of unprecedented slow down in the international export prices.
5.4 Trend in TFP and Manufacturing Value Added
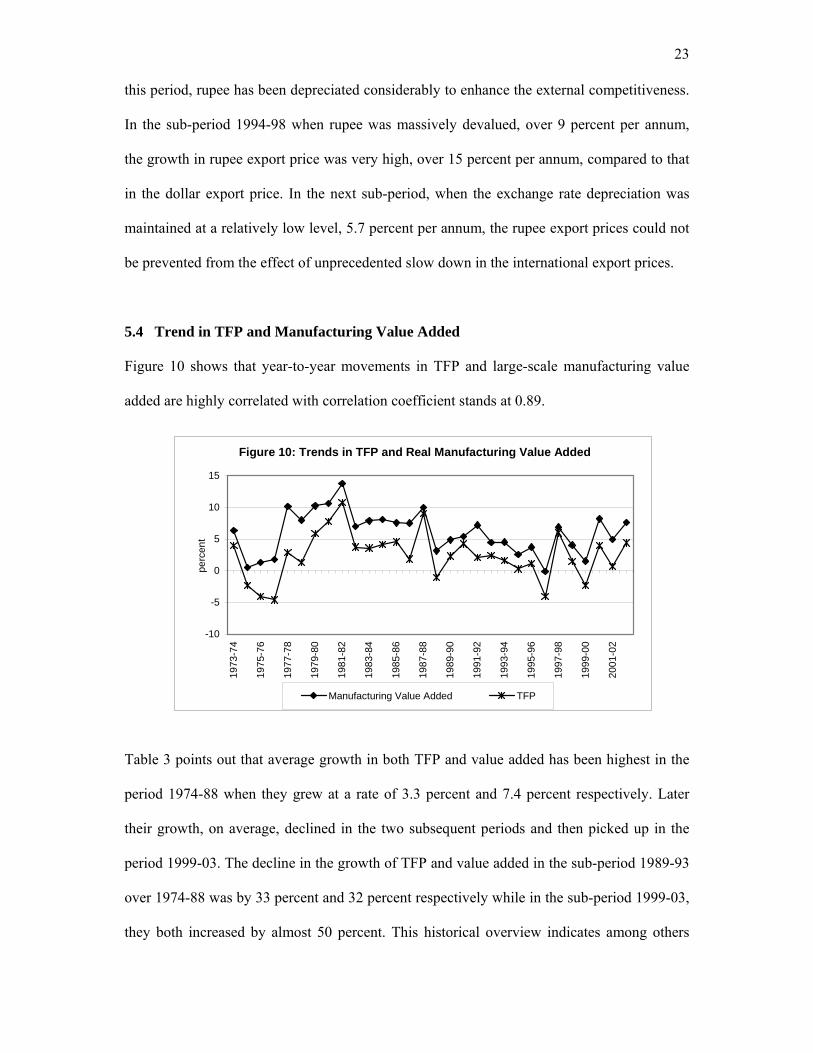
Figure 10 shows that year-to-year movements in TFP and large-scale manufacturing value
added are highly correlated with correlation coefficient stands at 0.89.
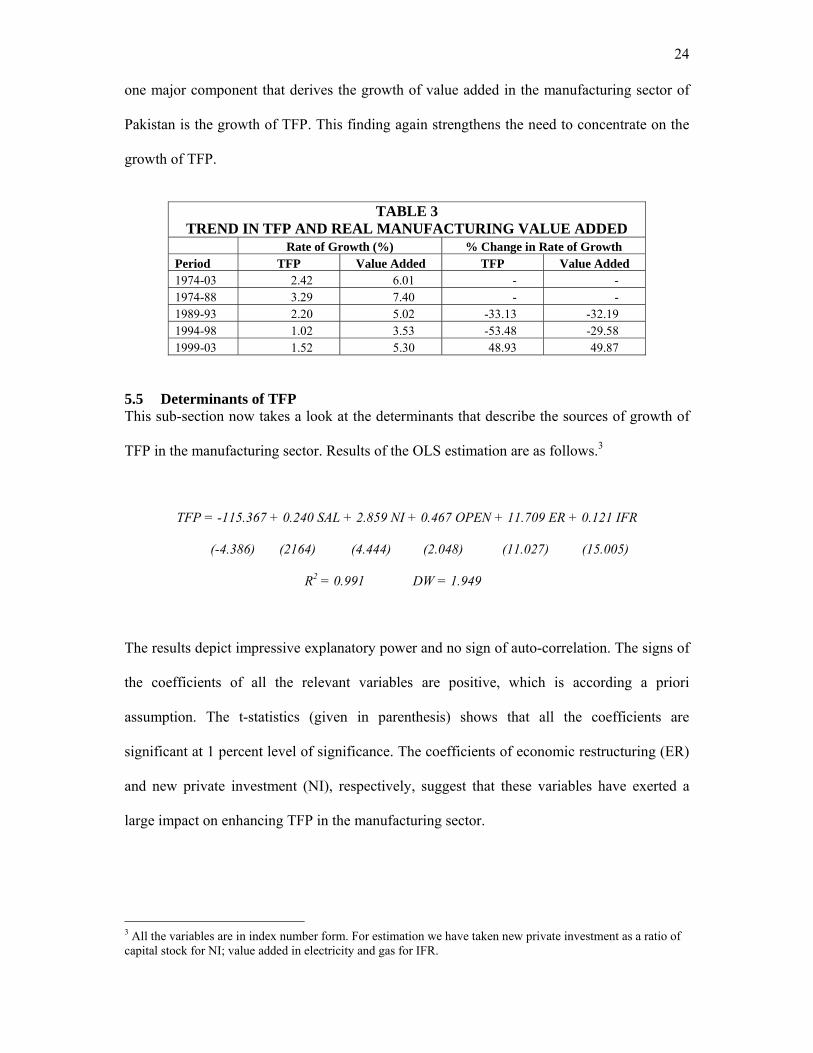
Table 3 points out that average growth in both TFP and value added has been highest in the
period 1974-88 when they grew at a rate of 3.3 percent and 7.4 percent respectively. Later
their growth, on average, declined in the two subsequent periods and then picked up in the
period 1999-03. The decline in the growth of TFP and value added in the sub-period 1989-93
over 1974-88 was by 33 percent and 32 percent respectively while in the sub-period 1999-03,
they both increased by almost 50 percent. This historical overview indicates among others
Figure 10: Trends in TFP and Real Manufacturing Value Added
-10
-5
0
5
10
15
1973
-74
1975
-76
1977
-78
1979
-80
1981
-82
1983
-84
1985
-86
1987
-88
1989
-90
1991
-92
1993
-94
1995
-96
1997
-98
1999
-00
2001
-02
perc
ent
Manufacturing Value Added TFP
24
one major component that derives the growth of value added in the manufacturing sector of
Pakistan is the growth of TFP. This finding again strengthens the need to concentrate on the
growth of TFP.
TABLE 3
TREND IN TFP AND REAL MANUFACTURING VALUE ADDED Rate of Growth (%) % Change in Rate of Growth Period TFP Value Added TFP Value Added 1974-03 2.42 6.01 - - 1974-88 3.29 7.40 - - 1989-93 2.20 5.02 -33.13 -32.19 1994-98 1.02 3.53 -53.48 -29.58 1999-03 1.52 5.30 48.93 49.87
5.5 Determinants of TFP This sub-section now takes a look at the determinants that describe the sources of growth of
TFP in the manufacturing sector. Results of the OLS estimation are as follows.3
TFP = -115.367 + 0.240 SAL + 2.859 NI + 0.467 OPEN + 11.709 ER + 0.121 IFR
(-4.386) (2164) (4.444) (2.048) (11.027) (15.005)
R2 = 0.991 DW = 1.949
The results depict impressive explanatory power and no sign of auto-correlation. The signs of
the coefficients of all the relevant variables are positive, which is according a priori
assumption. The t-statistics (given in parenthesis) shows that all the coefficients are
significant at 1 percent level of significance. The coefficients of economic restructuring (ER)
and new private investment (NI), respectively, suggest that these variables have exerted a
large impact on enhancing TFP in the manufacturing sector.
3 All the variables are in index number form. For estimation we have taken new private investment as a ratio of capital stock for NI; value added in electricity and gas for IFR.
25
CONCLUSION
The paper has assessed the competitiveness of manufacturing sector of Pakistan by
comparing the trend in the growth of factor and non-factor input prices with that of export
price. However, this comparison is less meaningful without incorporating the productivity
aspect of the manufacturing sector. Therefore, it also has looked at the trend in the growth of
productivity. It has found that over the period 1972-73 to 2002-03, both the factor and non-
factor prices have grown at a rate higher than that of general price level as well as of export
price. In this regard steps should be taken to curtail the growth in input prices, particularly the
price of energy and raw material. For instance, growth in energy prices can be addressed
through proper government policies. It can be said that increase in petroleum price, to an
extent, comes from outside (as linked to international price) but increase in electricity price is
a burden created as a result of domestic policies, which creates a burden on manufacturing
sector.
The analysis further suggests that even though the growth in productivity is offsetting the
negative impact of the growth in input factor prices, over the sample period as a whole, the
growth in productivity itself depicts a declining trend. For the most recent period, 1999-03,
TFP growth has failed to even offset the extent to which input price increases have outpaced
increase in the export price index.
26
REFERENCES Batttese G. E and Malik S. J. (1988) “Estimatipn of Elasticites of Substitution for CES and
VES Production Function using Firm-Level Data for Food Processing Industries”, The Pakistan Development Review, Vol. 27, No.1, pp.59-71.
Batttese G. E and Malik S. J. (1987) “Estimates of Elasticites of Substitution for CES
Production Function using Data on Selected Manufacturing Industries of Pakistan”, The Pakistan Development Review, Vol. 26, No.2, pp.161-77.
Chisti Salim and Mahmood F. (1991) “the Energy Demand in the Industrial Sector of
Pakistan”, The Pakistan Development Review, Vol. 30, No.1, pp.83-88. Chumacero Romulo A. and Fuentes J. Rodrigo (2003) “ On the Determinants of Chilean
Economic Growth”, http: International Monetary Fund (2002) “Pakistan: Selected Issues and Statistical Appendix”,
Country Report, No. 02/247. Kalim Rukhsana (2001a) “Capacity Utilisation in the Large-scale Manufacturing Sector: An
Empirical Analysis” The Lahore Journal of Economics, Vol.6, No.1, pp. 145-60. Kalim Rukhsana (2001b) “A Measure of the Elasticity of Substitution in the Manufacturing
Sector of Pakistan” The Lahore Journal of Economics, Vol.6, No.2, pp.43-56. Kemal A.R. (1981) “Substitution Elasticities in the Large-Scale Manufacturing Sector of
Pakistan” The Pakistan Development Review, Vol. 20, No.1, pp.1-36. Kemal A.R. (1998) “Industrial Development in Pakistan”, Pakistan Journal of Applied
Economics, Vol. 14, No.1 & 2, pp.107-19. Khan Ashfaque H. (1989), “The Two-level CES Production Function for the Manufacturing
Sector of Pakistan”, The Pakistan Development Review, Vol. 28, No.1, pp. Khan Ashfaque H. (1988) “Factor Demand in Pakistan’s Manufacturing, International
Economic Journal, Vol. 2, No.3, Khan Mahmood-ul-Hassan and Burki Abid A., 1999, “Technological Change and
Substitution Possibilities in Pakistan’s Large-scale Manufacturing: some Evidence”, Pakistan Economic and Social Review, Vol.27, No.2, pp.123-38.
Khan Ashfaque H and Rafiq Mohammad (1993) “Substitution among Labour, Capital,
Imported Raw Materials, and Bank Credit in Pakistan’s Manufacturing”, The Pakistan Development Review, Vol. 32, No.4, pp.1259-66.
Pasha, H. A., Pasha A.G. and Hyder Kalim (2002) “The Slowing Down of the Growth of
Total Factor Productivity in Pakistan”, Social Policy and Development Centre, Research Report No. 44.
Pasha H.A. and T. Qureshi (1984) “Capacity Utilisation in Selected Industries of Pakistan”,
Pakistan Journal of Applied Economics, Vol. 3, No.1, pp.29-56.
27
Sabir Mohammad and Ahmed Qazi Masood (2003) “Macroeconomic Reforms and Total
Factor Productivity Growth in Pakistan: An Empirical Analysis” SPDC Conference Paper No. 55, presented at 56th International Atlantic Economic Conference held Quebec City, Canada, 16-19 October 2003.
SPDC (2002) “Integrated Social Policy and Macroeconomic (ISPM) Model”, Social Policy
and Development Centre. Solow R.M. (1957) “Technical Change and the Aggregate Production Function”, Review of
Economics and Statistics, Vol 39, No 3, pp 312-20. Wizarat Shahida (2002) “The Rise and Fall of Industrial Productivity in Pakistan”, Oxford
University Press, Karachi. Zahid Shahid N., Akbar Mohammad and Jaffry Shabbar A. (1993) “Technical Change,
Efficiency and Capital-Labour Substitution in Pakistan’s Large-scale Manufacturing Sector”, The Pakistan Development Review, Vol. 31, No.2, pp.165-188.
28
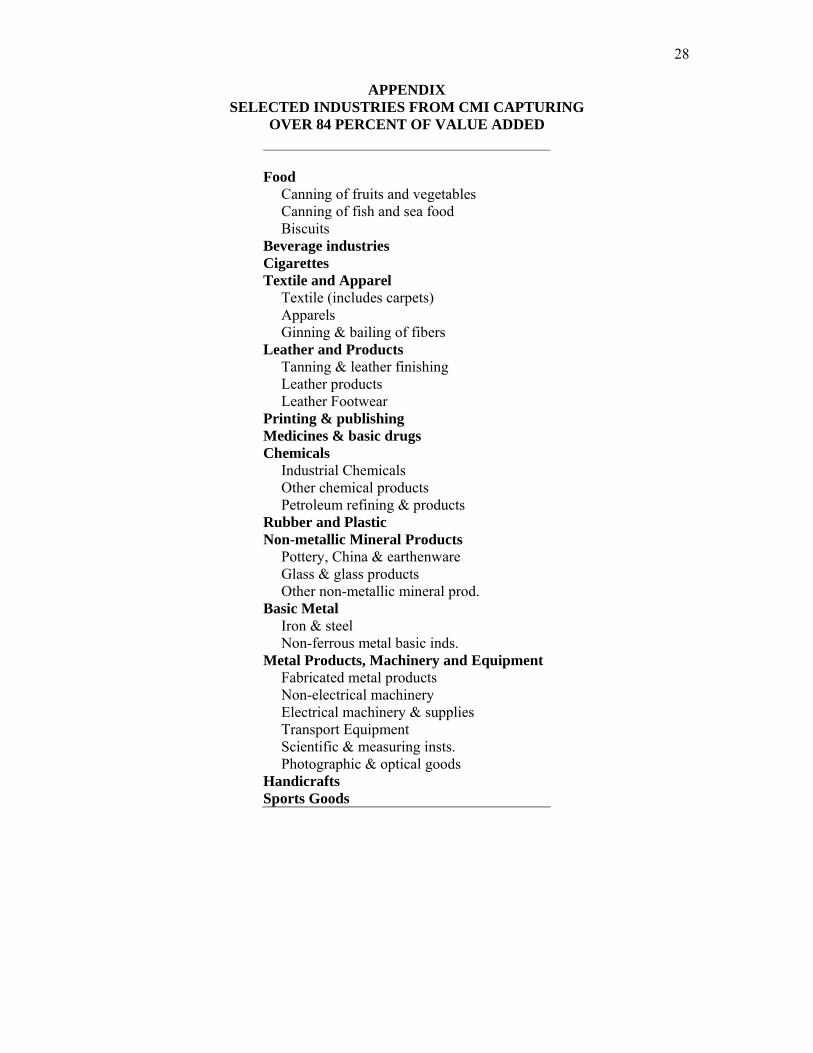
APPENDIX SELECTED INDUSTRIES FROM CMI CAPTURING
OVER 84 PERCENT OF VALUE ADDED
Food
Canning of fruits and vegetables Canning of fish and sea food Biscuits
Beverage industries Cigarettes Textile and Apparel
Textile (includes carpets) Apparels Ginning & bailing of fibers
Leather and Products Tanning & leather finishing Leather products Leather Footwear
Printing & publishing Medicines & basic drugs Chemicals
Industrial Chemicals Other chemical products Petroleum refining & products
Rubber and Plastic Non-metallic Mineral Products
Pottery, China & earthenware Glass & glass products Other non-metallic mineral prod.
Basic Metal Iron & steel Non-ferrous metal basic inds.
Metal Products, Machinery and Equipment Fabricated metal products Non-electrical machinery Electrical machinery & supplies Transport Equipment Scientific & measuring insts. Photographic & optical goods
Handicrafts Sports Goods