Fertilizers Sector of Pakistan
43
This document produced by the Punjab Board of Investment and Trade (PBIT) contains information from sources believed reliable; we do not guarantee that the matter is accurate or complete. Our Transactions Team compiled this document based on opinions and judgments, which may vary and be revised at any time without notice. This document is for information only and is not an offer to buy or sell, or solicitation of any offer to buy or sell and is for information purposes only. It is published for the use of our clients and may not be reproduced, distributed or published by any person for any purpose whatsoever. Action will be taken for unauthorized reproduction, distribution or publication. The views expressed in this document are those of Transactions Team at PBIT and do not necessarily reflect those of PBIT or its senior management. Punjab Board of Investment & Trade | Projects & Policy Research Department Fertilizers Sector of Pakistan 1 Analysis by Projects & Policy Research Department | PBIT | Nov 2018
Transcript of Fertilizers Sector of Pakistan

This document produced by the Punjab Board of Investment and Trade (PBIT) contains information from sources believedreliable; we do not guarantee that the matter is accurate or complete. Our Transactions Team compiled this documentbased on opinions and judgments, which may vary and be revised at any time without notice. This document is forinformation only and is not an offer to buy or sell, or solicitation of any offer to buy or sell and is for information purposesonly. It is published for the use of our clients and may not be reproduced, distributed or published by any person for anypurpose whatsoever. Action will be taken for unauthorized reproduction, distribution or publication. The views expressedin this document are those of Transactions Team at PBIT and do not necessarily reflect those of PBIT or its seniormanagement.
Punjab Board of Investment & Trade | Projects & Policy Research Department
Fertilizers
Sector of
Pakistan
1
Analysis by Projects & Policy Research Department | PBIT | Nov 2018

CONTENT
2
Economic Overview …………………………………….…4
Agriculture Sector Of Pakistan……………………………5
Manufacturing Sector Overview……………………….….7
Executive Summary…………………………………….….8
Crop-wise Of Usage Of Fertilizer……………………..….9
Types Of Fertilizer Used In Pakistan………………,…..12
Fertilizer Nutrients…………………………………,,……14
Province Wise Nutrients Balance Sheet………,,……...16
Fertilizer Off Take Province Wise Per Hectare……...…17
Seasons Wise Balance Sheet (Nutrients)……………...18
Local Outlook/Forecast Of 2017-18………………….…19
Global Fertilizer Consumption………………………..….20
Global Fertilizer Outlook…………………………….…...21
Fertilizer Products…………………………………..…….22
Province Wise Fertilizer Products Balance Sheet…….24
Seasons Wise Balance Sheet Fertilizer Products……..25
Products Vs. Capacity…………………………………….26
Agriculture Credit / Fertilizer Sector Share……………..31
Gas Supply To The Fertilizer Sector………………….....32
Fertilizer Prices In Pakistan……………………………....34
International Fertilizer Prices In Pakistan………………..35
Marketing Agencies In Pakistan For Fertilize………..….36
Financial Highlights/Company Analysis Of The Sector...37
Source……………………………………………………… 42
About Us………………………………………….............. 43
2018 Punjab Board of Investment and Trade I Transaction Department. All rights reserved

AS Ammonium SulphateCAN Calcium Ammonium NitrateDAP Diammonium PhosphateDHCL Dawood Hercules Chemical LimitedEFERT Engro Fertilizer LimitedFFC Fauji Fertilizer Company LimitedFFBL Fauji Fertilizer Bin Qasim LimitedJBL Jaffer Brothers (Pvt) LimitedK Symbol of Potash fertilizer expressed as K2O or Potash nutrient (K x 1.20 =K2O)KP Khyber PakhtunkhwaMAF Million Acre FeetMMCF Million Cubic FeetMAP Monoammonium PhosphateMM Milli MeterMOP Muriate of PotashN NitrogenNFDC National Fertilizer Development CentreNFML National Fertilizer Marketing LimitedNP Nitro phosphateP Symbol of phosphate fertilizer expressed as P2O5phosphate nutrient (P x 2.29 = P2O5)PAFL Pak-American Fertilizer (Private) LimitedPAR Pak-Arab Fertilizer (Private) LimitedPSFL Pak-Saudi Fertilizer Limited (Mirpur Mathelo)SBP State Bank of PakistanSOP Sulphate of PotashSSP Single SuperphosphateTCP Trading Corporation of PakistanTSP Triple SuperphosphateZTBL Zari Taraqiati Bank Limited
ABBREVIATIONS USED
32018 Punjab Board of Investment and Trade I Transaction Department. All rights reserved

Economic
Overview
Pakistan has seen a visible economic turnaround over the last
five years, due to successful implementation of a
comprehensive program of economic revival aimed at higher
economic growth and macro-economic stability.
“The growth momentum ranged above 5 % for the last two
years in a row and reached 5.79 % in FY2018 which is 13
years high on account of a strong performance in
agriculture, industry and services sectors which grew by
3.81 %, 5.80 % and 6.43 %, respectively.”
The highest growth in agriculture sector in last 13 years was
achieved on the back of initiatives taken to improve the sector
such as expansion in credit to agriculture sector along with
agriculture Kissan Package, provision of better quality seeds
including hybrid and high yield varieties and timely availability of
agriculture inputs including fertilizer, pesticides etc.
42018 Punjab Board of Investment and Trade I Transaction Department. All rights reserved
Source : Economic Survey of Pakistan 2017-18

Agriculture Sector of PakistanPakistan’s agriculture sector plays a central role in the economy as it contributes 18.9
percent to GDP and absorbs 42.3 % of labor force. According to the 6th Population and
Housing Census of Pakistan 2017, the country’s population is growing at the rate of 2.4 %
per annum. This rapid increase in population is raising demand for agricultural products. The
government of Pakistan over the period is focused on developing this sector and in this
connection initiated a number of measures such as crop diversification, efficient use of
water and promotion of high value crops including biotechnology, reducing mark-up rates,
agriculture credit enhancement, subsidized fertilizer, pesticides prices and cheap electricity
for agritube wells. Further, there was a 197.6 % growth in credit to agriculture sector, which
reached Rs. 1,001 billion (budget estimate) in FY 2018, compared to Rs. 336.3 billion in FY
2013 along with, relief of Rs. 341 billion provided to the farmers under Prime Minister’s
Kissan Package. All these measures helped in achieving 13 years high growth of 3.8 % in
agricultural sector during 2017-18.
As a result, the sector’s performance improved after witnessing a moderate and subdued
growth in last 13 years.
During 2017-18, agriculture sector recorded a remarkable growth of 3.81 % and surpassed
its targeted growth of 3.5 % and last year’s growth of 2.07 %. This stemmed from higher
yields, attractive output prices and supportive government policies, better availability of
certified seeds, pesticides, agriculture credit and intensive fertilizers off-take.
52018 Punjab Board of Investment and Trade I Transaction Department. All rights reserved
Source : Economic Survey of Pakistan 2017-18

6
AbstractAgriculture is an important sector of Pakistan’s economy, accounting forapproximately 26 percent of the country’s gross domestic product (GDP). ThePurpose of this study was to explore different fertilizer nutrients & products withprospective to cropped area, fertilizer consumption, credit distribution and Gassupply to the. We found that fertilizer consumption, improved seed distribution,and credit distribution had a positive and significant influence on agricultural grossdomestic product (AGDP). Independent economic analysts suggest that theGovernment of Pakistan should formulate policies and funding schemes for thedevelopment and improvement of water availability including irrigation systems.

1.9%
Manufacturing Sector
Large-scale Small-scale Slaughtering(80%) (13.8%) (6.5%)
10.8% 0.9%
Contribution to GDP
Manufacturing Sector Overview
Manufacturing sector is the
backbone of Pakistan’s
economy and constitutes the
second largest sector of
economy contributing 13.6 % to
Gross Domestic Product (GDP)
It comprises mainly of Large
Scale Manufacturing (LSM) with
80 % share in Manufacturing
and 10.8 % in GDP, whereas
small scale manufacturing
accounts for 1.9 % in total GDP
and 13.8 % share in
manufacturing.2.
6%
7.0%
2.1%
5.8%
4.5%
2.0%
7.3%
2.4%
7.7%
1.8% 2.
5%
1.3%
2.5%
7.5%
7.2%
1.4%
9.2%
10.5
%
0.0%
2.0%
4.0%
6.0%
8.0%
10.0%
12.0%
July August September October November December January February March
LSM- YOY Growth
2015 2016
During July-Feb 2018, Manufacturing sector
recorded an impressive growth of 6.2 %
against 4.4% in same period of last year.
The Year on Year (YoY), LSM recorded
significant growth of 5.52 % in Feb 2018
compared to 9.4% in Feb 2017.
Growth in Sub sectors and sectors weights in
LSM for the period of July-Feb FY 2018
versus July-Feb FY 2018 are below. The
performance of Electronics having highest
weight of 38.79% vs. 16.15% in
corresponding year. The sectors which
recorded negative growth are wood products
(27.32%) and fertilizer (7.36%). However
chemical and leather products also recorded
negative growth. The downturn witnessed in
fertilizer sectors is on account of domestic
piped natural gas from small scale urea
producers.
5%5%
5%
21%
6%
58%
Sectors weights of LSM
Iron & Steel Products
Automobiles
Non-Metallic MineralProducts
Textile
Coke & PetroleumProducts
Other 72018 Punjab Board of Investment and Trade I Transaction Department. All rights reserved
Source : Economic Survey of Pakistan 2017-18

The fertilizer industry of Pakistan has enormous potential and is well on its way to becoming one of the biggest fertilizerexporters in the region in the coming years. Factors that are directly contributing to these forecasts are the recentissuance of LNG regasification licenses and the establishment of new fertilizer plants by prominent organizations withinthe country.
Being primarily an agrarian state, Pakistan's growth is heavily dependent on the fertilizer industry. According to reports,Pakistan's fertilizer demand has always remained higher than its supply. However, with the advancement of technologyand increased number of players in the industry, production capacity has increased to approx. 9 million tons per year,which has consistently surpassed the national demand over the last few years. (refer section production vs. capacity)
Furthermore, the consumption of fertilizer has increased manifold due to heightened awareness among farmers that itsusage in good quantity is fruitful for higher yields and a significant increase in their income as the commodity is providedsubsidized rates.
During FY 2018, cumulative sales of urea increased by 40% to 6.3 million tons and DAP sales edged to 6% to 2.3 milliontons. Moreover, a further pick-up in demand for urea can be foreseen. Also, comfortable inventory levels of urea andDAP have reduced pricing power for local fertilizer manufacturers and as a result, average urea price has increased by10-11% year-on-year. At present, international urea and DAP prices were hovering around $218 and $335 per ton(avg.annual price), respectively, and are expected to remain steady which, along with removal of price cap (Rs 1,400 per bag)from urea, would provide an added advantage to local manufacturers. In fact, for farmer the government of Pakistan hasprovided subsidy.
Government SubsidyThe government in order to enhance productivity in agriculture sector provided the following subsidies:• Tax relief on phosphate fertilizer equivalent to Rs. 300 per 50 kg bag of DAP.• Reduction in GST on urea from 17 to 5 percent/voluntary price reduction by the fertilizers manufactures.• Cash subsidy of Rs. 100 per 50 kg bag of urea.• Subsidy of Rs. 800 and Rs. 500 per bag of SOP and MOP respectively, by the Government of Punjab in order to promote
the use of Potash.
Besides passing on the benefits of tax incentives and gas subsidy to farmers, we must appreciate that the fertilizerindustry has always looked beyond profitability.
Currently, in Pakistan, there are six major producers of fertilizers which include Fauji Fertilizer, Engro Fertilizer Company,Dawood Hercules, and Fatima Fertilizers. Media reports suggest that the Chinese government is keenly looking foravenues to enter Pakistan's agriculture and fertilizer sector. The Chinese state and banks are expected to provide capitaland loans to Chinese companies interested in setting up ventures in Pakistan. There are rumors that China is going to setup a fertilizer plant that will produce 800,000 tons per year.
In order to keep the graph of the fertilizer industry stable, the government should and must avoid knee-jerk decisionspertaining to GIDC and GST, as it has displayed in the past. Over the years, this essential industry has been suffering dueto these unfavorable policies and decisions. Thus, the government should strategically extend more support for thefertilizer sector, enabling it to play a more authoritative role in national food-security. The government should expediteremedy of cash-flow challenges caused by large amounts mired in overdue refunds and sluggish reimbursement ofsubsidy to the fertilizer companies.
Executive Summary
Source: Business Recorder: Fertilizer Industry in Pakistan
82018 Punjab Board of Investment and Trade I Transaction Department. All rights reserved

Crop-wise of usage of Fertilizer Pakistan has two cropping seasons, "Kharif“ being the first sowing season starting from
April-June and is harvested during October- December. Rice, sugarcane, cotton, maize,
moong, mash, bajra and jowar are “Kharif“ crops. "Rabi", the second sowing season, begins
in October-December and is harvested in April- May. Wheat, gram, lentil (masoor), tobacco,
rapseed, barley and mustard are "Rabi" crops. Pakistan’s agricultural productivity is
dependent upon the timely availability of water.
The total cropped area in Pakistan is about 22.2 million ha. The share of food grain crops is
54 percent, followed by cotton and sugar cane 20 %; pulses 6 %; oilseed crops 3 %;
fruit/vegetables 4 % and other crops about 13 %. Wheat is the main food crop. It occupies
about 36.3 % of the total cropped area, followed by cotton with 14 %, paddy with 9.5 %,
sugar cane with 4.5 % , maize with 4.5 % and other crops with 20.8 %.
According to the fertilizer use survey five major crops: wheat, cotton, sugar cane, rice and
maize account for about 87 % of fertilizer consumption. Wheat accounts for about 45 %
followed by cotton with a share of 23 %. Sugar cane is the third crop; nutrient use per ha is
highest on this crop. The share of fruit and vegetables is 5.6 %.
The yields of the major crops are below their agronomic and genetic potential. There is a
consensus among researchers, extensionists and policy planners that, given the necessary
resources and inputs, yields could be increased by 30 to 40 %.
92018 Punjab Board of Investment and Trade I Transaction Department. All rights reserved
Source : Annual Fertilizer Review 2016-17

10

50%
6%2%
25%
8%
Fertilizer Usage by Crop in 2016-17
Wheat
Rice
Maize
Cotton
Sugarcane
Usage of Fertilizer by major crops produced in Pakistan (000 nutrients tonnes)
2012-13 2013-14 2014-15 2015-16 2016-17
Wheat 1810.5 2044.5 2158.5 1849.5 2520Rice 217.26 245.34 259.02 221.94 302.4Maize 54.32 61.34 64.76 55.49 75.6Cotton 905.25 1022.25 1079.25 924.75 1260Sugarcane 289.68 327.12 345.36 295.92 403.2Others 344 388.46 410.12 351.41 478.8
Total 3621.01 4089.01 4317.01 3699.01 5040
Source: Pakistan Bureau of Pakistan
Less than two percent of the
farmers apply potash whereas
92 percent apply nitrogen and 83
percent apply phosphate. Half of
the farmers apply FYM. Almost
five percent apply micronutrients.
The use of green manures, crop
residues and bio-fertilizers is
negligible.
Almost all farmers having access
to canal or tube well irrigation
water use fertilizers. In rain fed
areas scarcely 50 percent of the
farmers use fertilizers. About 92
percent of small-scale farmers (<
5 ha) use fertilizers. Application
rates decrease with an increase
in farm size (rain fed and
irrigated). In rain fed areas the
difference between application
rates for small and large farms is
very wide.
112018 Punjab Board of Investment and Trade I Transaction Department. All rights reserved

Types of
Fertilizer
used in
Pakistan
Types of Fertilizer Nitrogen (N)
Phosphorous (P)
Potassium (K)
Urea P O O
Calcium Ammonium Nitrate (CAN) P O O
Ammonium Sulphate (AS) P O O
Nitro Phosphate (NP) P P O
Nitrogen-Phosphorous-Potassium (NPK)
P P P
Di-Ammonium Phosphate (DAP) O P O
Single Super Phosphate (SSP) O P O
Triple Super Phosphate (TSP) O P O
Nitro Phosphate (NP) P P O
Monoammonium Phosphate (MAP)
P P O
Sulphate of Potash (SOP) O O P
Nitrogen-Phosphorous-Potassium (NPK)
O O P
Muriate of Potash (MOP) O O P
“
122018 Punjab Board of Investment and Trade I Transaction Department. All rights reserved
Source : Transaction department Analysis

These are classified into three categories according to their element (nutrient) structure:
1. Nitrogen (N): Increases the protein content of plants, gives them color and accelerates growth
2. Phosphorous (P): Promotes strong, healthy root development and helps plants mature morerapidly and thus aids in blooming and seed formation. It is critical for the synthesis of energyregulating substances in plants
3. Potassium (K): Raises the resistance of plants to diseases and promotes growth from root tostack. It increases the plumpness of grains and seeds, and provides winter hardiness to legumesand other crops.
These fertilizer which come in a myriad of mixes and composition, are regularly applied according tosoil conditions, weather conditions, crop type and the desired productivity. There are eleven types offertilizers that are used in Pakistan.
Urea - More than 90% of the world’s production is destined for use as a nitrogen-release fertilizer.Urea has the highest nitrogen content of all solid nitrogenous fertilizers in common use (46.7%).
Di-Ammonium Phosphate (DAP) - It contains 46% P2O5 and 18% N. it is water soluble. It is agood source of P fertilizer for all crops. Good source for problem soils. Overall, it suits to about90% soil of the country.
Calcium Ammonium Nitrate (CAN) – It contains 27% N and 20% of ground limestone. This hasa rapid as well as permanent effect. The granulation of this fertilizer ensures a quick and exactdosing
Ammonium Sulphate (AS) - (NH4)2SO4 is an inorganic salt. It is used largely . as an artificialfertilizer for alkaline soils. It lowers the pH balance of the soil, while contributing essential nitrogenfor plant growth
Single Super Phosphate (SSP) - Superphosphate is a fertilizer produced by the action ofconcentrated sulfuric acid on powdered phosphate rock.
Triple Super Phosphate (TSP) - Triple Super Phosphate (TSP) fertilizer is composed ofinorganic nutrients that are used to restore soil components essential for farming.
Nitro phosphate (NP) - It provides 22% nitrogen, and 20% phosphorus. Nitrogen is a primarynutrient that really makes plants "grow”. Phosphorus is a primary nutrient that encouragesrooting, blooming and fruit production in plants.
Sulphate of Potash (SOP) - Potassium Sulphate (K2SO4) is a non-flammable white crystallinesalt which is soluble in water. This chemical is commonly used in fertilizers, providing bothpotassium and sulphur.
Nitrogen-Phosphorus-Potassium (NPK) - NPK fertilizer is a complex fertilizer comprisedprimarily of the three primary nutrients required for healthy plant growth. The agriculture industryrelies heavily on the use of NPK fertilizer to meet global food supply and ensure healthy crops.
Muriate of Potash (MOP) - used extensively for fertilizing pastures, sugar cane, fruit trees,vegetables, and other field crops.
Monoammonium Phosphate (MAP) - is a widely used source of phosphorus (P) and nitrogen(N). It’s made of two constituents common in the fertilizer industry and contains the mostphosphorus of any common solid fertilizer
132018 Punjab Board of Investment and Trade I Transaction Department. All rights reserved
Source : Transaction department Analysis

Fertilizer NutrientsFertilizer is the most important and expensive input contributing 30 to 50 %, on average, to
the crop yield.
The domestic production of fertilizers during 2017-18 (July-March) decreased slightly by 5.4
% over the corresponding period last year due to diversion of domestic piped natural gas from
small scale urea producers, while imported fertilizer increased by 21.1 %.
Total off take of fertilizer nutrients witnessed a decline by 3.6 %. Nitrogen off take decreased
by 5.0 % and phosphate by 1.4 %. Potash off take recorded a significant increase of 31.5 %
during 2017-18 (July-March).
Historical Comparison - YOY
Nutrients Productions
Domestic industry witnessed a positive trend in fertilizer production in nutrient terms. The
production in nutrient terms increased from 3675 thousand tonnes during 2015-16 to 3775
thousand tonnes during 2016-17 showing an increase of 2.7 %. Nitrogen production was
3206 thousand tonnes and recorded an increase of 2.7 % (84.9 % share in total nutrients
production), phosphate 556 thousand tonnes (14.7 % share in total nutrients production),
which increased by 2.8 %. Potash production (in NPKs) was about 12 thousand tonnes (0.3
% share in total nutrients production) and recorded decrease of 0.4 %, over the same time
frame of last year 2015-16.
Off-take
Overall, nutrient off-take during fiscal year 2016-17 was 5040 thousand tonnes, which
represented an increase of 36.2 % over the previous year 2015-16. Nitrogen Off-take
registered an increase of 39.6 % while phosphate Off-take increased by 26 %. Potassium Off-
take also witnessed an increase of 106.7 %.
Nutrients Availability (includes imports)
Overall fertilizer nutrients availability during 2016-17 was 5925 thousand nutrient tonnes,
which witnessed an increase of 21.2 % over last year 2015-16. Total availability of nitrogen,
phosphate and potash was 4429, 1443 and 53 thousand nutrient tonnes respectively.
142018 Punjab Board of Investment and Trade I Transaction Department. All rights reserved
Source: Economic Survey of Pakistan 2017-18

Nutrient Availability (000’ Tonnes) Nitrogen Phosphate Potash
2016-17
2015-16
2016-17
2015-16
2016-17
2015-16
Opening Balance 958 175 219 127 12 12
Domestic Production 3,206 3,121 556 541 12 12
Imports 264 337 668 556 29 8
Total Availability 4,428 3,633 1,443 1,224 53 32
Off-take 3,730 2,672 1,269 1,007 41 20
Exports 58 - - - - -
Adjustment (1) - 4 - - -
National Inventory 640 958 178 219 12 12
60%
5%
8%
24%
3%
61%
7%
7%
23%
2%
Production-Wise Fertilizer Off take during 2015-16 and 2016-17
Urea Can NP DAP Others
2016
2017
152018 Punjab Board of Investment and Trade I Transaction Department. All rights reserved
Source: Pakistan Bureau of Statistics

(000' Tonnes) Years % Change YOY
Province 2012-13 2013-14 2014-15 2015-16 2016-17 2013-14 2014-15 2015-16 2016-17Percentage Change
in 2016-17 over 2015-16
Provincial Share (%)
5year
NP ratio
Nitrogen Punjab 1,988 2,164 2,252 1,772 2,537 9% 4% -21% 43% 43% 68.00%% Change- Value 176 88 -480 765Sindh 523 731 788 715 924 40% 8% -9% 29% 29% 23.40%% Change- Value 208 57 -73 209KP 213 177 168 133 173 -17% -5% -21% 30% 30% 5.50%% Change- Value -36 -9 -35 40Balochistan 130 112 101 52 96 -14% -10% -49% 85% 85% 3.10%% Change- Value -18 -11 -49 44Total 2,854 3,184 3,309 2,672 3,730 12% 4% -19% 40% 39.60%
Phosphate Punjab 537 623 714 718 930 16% 15% 1% 30% 30% 72.20%% Change- Value 86 91 4 212Sindh 123 187 182 227 255 52% -3% 25% 12% 12% 20.00%% Change- Value 64 -5 45 28KP 51 48 54 39 50 -6% 13% -28% 28% 28% 5.00%% Change- Value -3 6 -15 11Balochistan 36 23 26 23 34 -36% 13% -12% 48% 48% 2.90%% Change- Value -13 3 -3 11Total 747 881 976 1,007 1,269 18% 11% 3% 26% 26%
PotashPunjab 15 17 23 13 31 13% 35% -43% 138% 138% 72.30%% Change- Value 2 6 -10 18Sindh 3 4 6 5 7 33% 50% -17% 40% 40% 18.20%% Change- Value 1 2 -1 2KP 2 1 2 1 2 -50% 100% -50% 100% 100% 5.80%% Change- Value -1 1 -1 1Baluchistan 1 1 1 1 1 0% 0% 0% 0% 0% 3.60%
% Change- Value- -
- -
Total 21 23 32 20 41 10% 39% -38% 105% 105%Pakistan
Punjab 2,540 2,804 2,989 2,503 3,498 10% 7% -16% 40% 40% 69.00% 2.73% Change- Value 264 185 -486 995Sindh 649 922 976 947 1,186 42% 6% -3% 25% 25% 22.50% 3.62% Change- Value 273 54 -29 239KP 266 226 224 173 225 -15% -1% -23% 30% 30% 5.40% 3.46% Change- Value -40 -2 -51 52Baluchistan 167 136 128 76 131 -19% -6% -41% 72% 72% 3.10% 2.82
% Change- Value -31 -8 -52 55
Total 3,622 4,088 4,317 3,699 5,040 13% 6% -14% 36% 36% 2.94
16
Province Wise Nutrients Off-Take (YOY
comparison)
2018 Punjab Board of Investment and Trade I Transaction Department. All rights reserved
Source: National Fertilizer Development centre, Data
Fertilizer Off Take Province Wise (Per
Hectare)
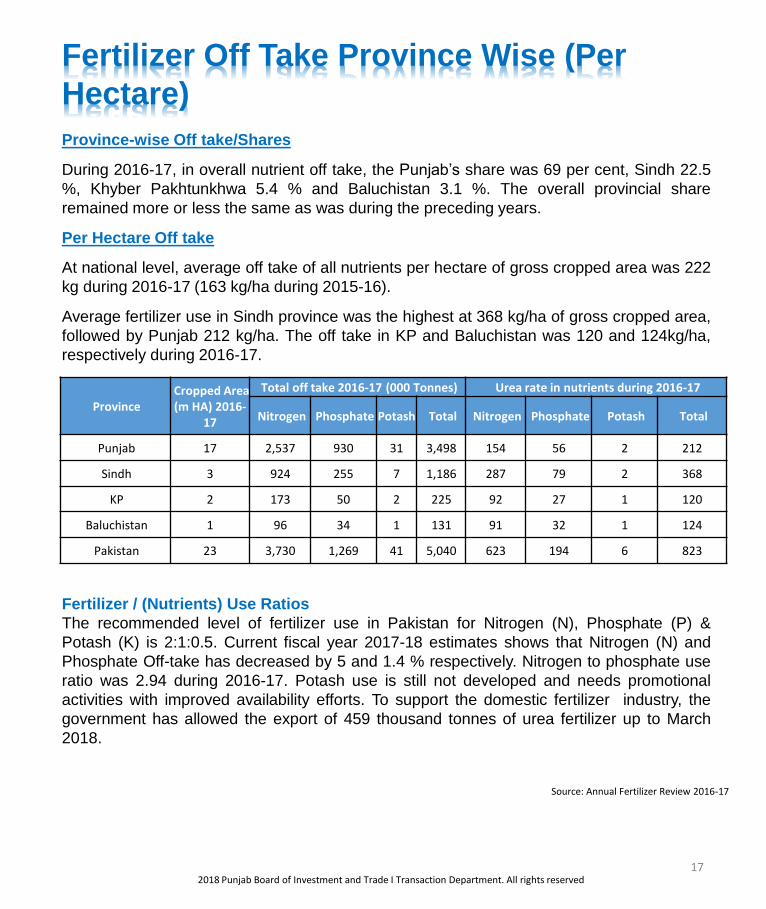
Province-wise Off take/Shares
During 2016-17, in overall nutrient off take, the Punjab’s share was 69 per cent, Sindh 22.5
%, Khyber Pakhtunkhwa 5.4 % and Baluchistan 3.1 %. The overall provincial share
remained more or less the same as was during the preceding years.
Per Hectare Off take
At national level, average off take of all nutrients per hectare of gross cropped area was 222
kg during 2016-17 (163 kg/ha during 2015-16).
Average fertilizer use in Sindh province was the highest at 368 kg/ha of gross cropped area,
followed by Punjab 212 kg/ha. The off take in KP and Baluchistan was 120 and 124kg/ha,
respectively during 2016-17.
Province Cropped Area (m HA) 2016-
17
Total off take 2016-17 (000 Tonnes) Urea rate in nutrients during 2016-17
Nitrogen Phosphate Potash Total Nitrogen Phosphate Potash Total
Punjab 17 2,537 930 31 3,498 154 56 2 212
Sindh 3 924 255 7 1,186 287 79 2 368
KP 2 173 50 2 225 92 27 1 120
Baluchistan 1 96 34 1 131 91 32 1 124
Pakistan 23 3,730 1,269 41 5,040 623 194 6 823
Fertilizer / (Nutrients) Use Ratios
The recommended level of fertilizer use in Pakistan for Nitrogen (N), Phosphate (P) &
Potash (K) is 2:1:0.5. Current fiscal year 2017-18 estimates shows that Nitrogen (N) and
Phosphate Off-take has decreased by 5 and 1.4 % respectively. Nitrogen to phosphate use
ratio was 2.94 during 2016-17. Potash use is still not developed and needs promotional
activities with improved availability efforts. To support the domestic fertilizer industry, the
government has allowed the export of 459 thousand tonnes of urea fertilizer up to March
2018.
172018 Punjab Board of Investment and Trade I Transaction Department. All rights reserved
Source: Annual Fertilizer Review 2016-17

There was a substantial increase of 22.8
% in nutrients off-take during Kharif 2016
and an increase of 15.7 % during Rabi
2016-17 over the preceding seasons.
Among major products, urea off-take
during Rabi 2016-17 went up by 18.8 %,
while DAP Off-take increased by 11.1 per
cent as compared with Rabi 2015-16.
In nutrient terms, fertilizer production
increased by 6.1 per cent from 1806 to
1917 thousand tonnes during Kharif
2016. While in nutrient terms, it increased
by 0.4 per cent from 1812 thousand
tonnes to 1819 thousand tonnes. In Rabi
2016-17.
Note: Balance Sheet includes opening balance, domestic
production and imports which after consolidating is
considered as total availability of each nutrient during the
season. Furthermore the national inventory at the end of each
season is calculated by deducting Off-take and exports of that
season.
Nutrient-wise supply/demand situation during Rabi FY 2015-16 & FY 2016-17
Rabi Season Nitrogen Phosphate Potash
Rabi2015-16Rabi 2016-17
Rabi 2015-16
Rabi 2016-17
Rabi 2015-16
Rabi 2016-17
Opening Balance 539 935 300 273 15 13
Domestic Production 1,538 1,549 265 265 8 5
Imports 175 150 386 380 2 16
Total Availability 2,252 2,634 951 918 25 34
Off-take 1,527 1,807 774 847 14 24
Exports - 15 - - - -
Adjustment (0) 1 - 3 0 (0)
National Inventory 725 813 177 74 11 10
Nutrient-wise supply/demand situation during Kharif FY 2015-16 & FY 2016-17
Nitrogen Phosphate Potash
Kharif 2015-16
Kharif 2016-17
Kharif 2015-16
Kharif 2016-17
Kharif 2015-16
Kharif 2016-17
Opening Balance 140 725 76 177 9 11
Domestic Production 1,506 1,637 296 274 5 6
Imports 204 89 174 223 12 8
Total Availability 1,850 2,451 546 674 26 25
Off-take 1,312 1,512 246 402 11 12
Exports - - - - - -
Adjustment (1) (4) - 1 0 -
National Inventory 539 935 300 273 15 13
Seasons Wise Balance Sheet (Nutrients)
182018 Punjab Board of Investment and Trade I Transaction Department. All rights reserved
Source: Annual Fertilizer Review 2016-17
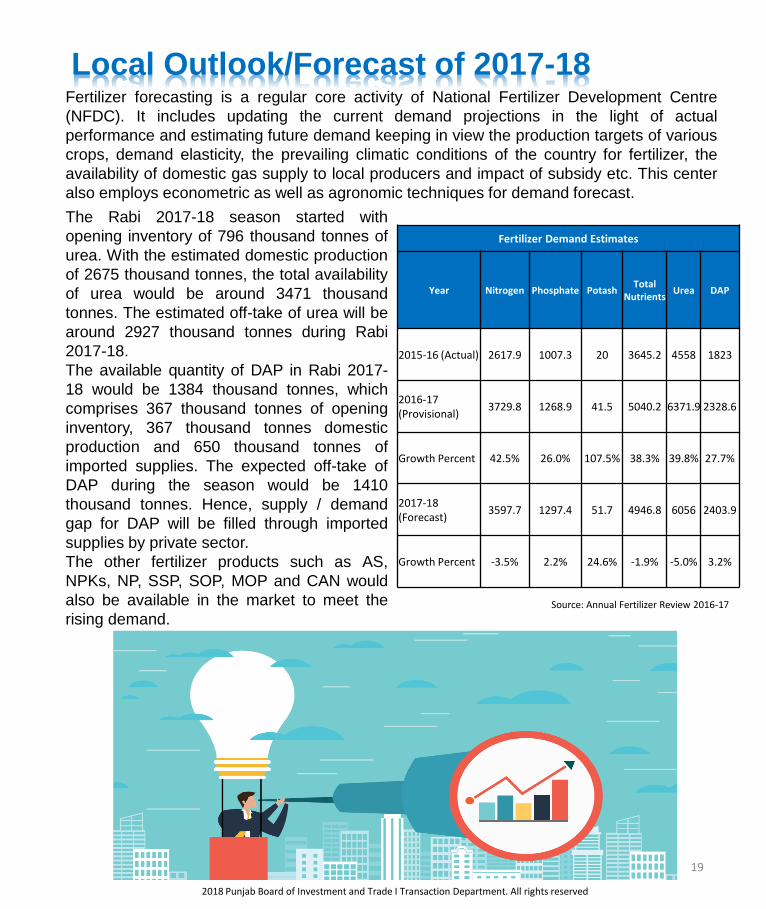
Fertilizer forecasting is a regular core activity of National Fertilizer Development Centre
(NFDC). It includes updating the current demand projections in the light of actual
performance and estimating future demand keeping in view the production targets of various
crops, demand elasticity, the prevailing climatic conditions of the country for fertilizer, the
availability of domestic gas supply to local producers and impact of subsidy etc. This center
also employs econometric as well as agronomic techniques for demand forecast.
Fertilizer Demand Estimates
Year Nitrogen Phosphate PotashTotal
NutrientsUrea DAP
2015-16 (Actual) 2617.9 1007.3 20 3645.2 4558 1823
2016-17 (Provisional)
3729.8 1268.9 41.5 5040.2 6371.9 2328.6
Growth Percent 42.5% 26.0% 107.5% 38.3% 39.8% 27.7%
2017-18 (Forecast)
3597.7 1297.4 51.7 4946.8 6056 2403.9
Growth Percent -3.5% 2.2% 24.6% -1.9% -5.0% 3.2%
The Rabi 2017-18 season started with
opening inventory of 796 thousand tonnes of
urea. With the estimated domestic production
of 2675 thousand tonnes, the total availability
of urea would be around 3471 thousand
tonnes. The estimated off-take of urea will be
around 2927 thousand tonnes during Rabi
2017-18.
The available quantity of DAP in Rabi 2017-
18 would be 1384 thousand tonnes, which
comprises 367 thousand tonnes of opening
inventory, 367 thousand tonnes domestic
production and 650 thousand tonnes of
imported supplies. The expected off-take of
DAP during the season would be 1410
thousand tonnes. Hence, supply / demand
gap for DAP will be filled through imported
supplies by private sector.
The other fertilizer products such as AS,
NPKs, NP, SSP, SOP, MOP and CAN would
also be available in the market to meet the
rising demand.
Local Outlook/Forecast of 2017-18
19
2018 Punjab Board of Investment and Trade I Transaction Department. All rights reserved
Source: Annual Fertilizer Review 2016-17

Global fertilizer demand grew firmly in 2016-17 to an estimated 185.8 million tonnes
nutrient, a 2.4% rise due to favorable weather, strong El Nino event and prospects for
improving returns from farming in countries with supportive exchange rates.
During Fiscal Year 2016-17, total demand is estimated to rose by 2.4 %, to 185.8 million
tonnes. Demand for nitrogen and phosphate would increase by 2.0 and 2.8 %, respectively.
Potash demand is seen to increased by 3.1 %. With optimistic outlook, would fertilizer
consumption in 2017-18 is projected to grow modestly by 1.2 per cent, to 188 million
tonnes, while growth rates for nitrogen (N) and phosphate (P) demand are seen as
marginally i.e. + 0.9 % for N and 1.0 % for P, whereas potash (K) demand would increase
modestly at a level of 2.3 %.
Year Nitrogen PhosphatePotash Total
2015-16 (Actual) 104.2 43.7 33.5 181.4
2016-17 (Provisional)
106.3 44.9 34.6 185.8
Growth Percent 2.0% 2.7% 3.3% 2.7%
2017-18 (Forecast)
107.3 45.3 35.4 188
Growth Percent 0.90% 1.00% 2.30% 1.20%
Global Fertilizer Consumption
In the medium term, global fertilizers demand
would show moderate annual growth of 1.5% to
reach 199 million tonnes nutrients in 2021-22.
Demand for all three major nutrients are expected
to surge with annual growth rates of 1.2% for
nitrogen, 1.5% for phosphorus and 2.1% for
potassium.
The medium-term outlook for world agriculture
remains mixed overall, with flat real prices for
agricultural commodities and tight market
conditions. The prevailing market fundamentals
would moderately support fertilizer use in coming
two to three years.
202018 Punjab Board of Investment and Trade I Transaction Department. All rights reserved
Source: Annual Fertilizer Review 2016-17

Global fertilizer demand forecast to remain
slightly below 200 Mt by 2021/22
Under the baseline scenario, global fertilizer
demand is seen as growing on average by
1.5% per annum (p.a.) between the base year
(average of the three-year period 2014/15 to
2016/17) and 2021/22.1 Aggregate world
demand is projected to reach 199 Mt at the end
of the outlook period. Reflecting the progressive
adoption by farmers of best management
practices that result in N use efficiency
improvements, as well as the increasing
recycling of organic nutrient sources, K demand
is forecast to grow more firmly (2.1% p.a.) than
demand for P (1.5% p.a.) and N (1.2% p.a.).
The highest growth rate is anticipated in Africa,
followed by Eastern Europe & Central Asia and
Latin America. These three regions have the
greatest agricultural growth potential in the
decade to come. Demand in South Asia is seen
as rising below the historical trend, as neem
coated urea, up scaling of Direct Benefit
Transfer to farmers, and rapid adoption of
water-soluble fertilizers will influence the
outlook. West Asian demand growth is very
speculative, as it is highly dependent on the
evolution of regional geopolitical tensions. In
East Asia fertilizer usage is forecast to expand
modestly, as Chinese N and P demand is seen
as reaching a plateau during the outlook period.
Demand growth in developed regions is seen
as weak, with better prospects in Oceania than
in North America and Western & Central
Europe. In volume terms, Latin America, South
Asia and East Asia together would account for
three-fourths of the projected increase in global
fertilizer demand in the next five years.
Global Fertilizer Supply
Modest growth rate of fertilizer
nutrient demand up to 2021
In 2021 world total nutrient sales are
projected at 266 Mt nutrients, for an
average annual growth rate of about
1.4%. Nutrient fertilizer sales in 2021
would total 198 Mt nutrients, growing at
1.3% p.a. and representing 74% of total
sales. The near future appears to show a
growing imbalance between rapidly
increasing supply and moderate demand
growth. Massive new capacity additions
will be commissioned over the next five
years, driven by investment decisions
made four to eight years ago. Supply will
be ample, if not abundant, at least up to
2021.
Other challenges confronting the fertilizer
sector include more stringent
environmental regulations, increasingly
volatile energy prices, competing uses of
feedstock, and rising trade protectionism.
In response to these, the fertilizer
industry is actively seeking new markets,
diversifying product ranges and striving
for operational excellence.
Large capacity expansions in 2017-
2021
Between 2017 and 2021 the fertilizer
industry will invest close to US$ 110
billion in more than 65 new production
units, increasing global capacity by 90
million tonnes products. Based on
current market conditions and a modest
1.4% demand growth projection during
the next five years, the industry will face
a supply driven market, with growing
structural imbalances.
Global Fertilizer Outlook
212018 Punjab Board of Investment and Trade I Transaction Department. All rights reserved
Source: World fertilizer trends and Outlook to 2018

Fertilizer industry is important for economic development and the prosperity of farming
community. The industry produce, imports and distributes fertilizer throughout the country.
As fertilizer is an important input for agriculture growth; the government’s intervention in
the shape of subsidy and tax relaxations has improved the performance of the agriculture
sector.
Fertilizer Products/ Local Production
There are ten urea manufacturing plants, one DAP, three NP, three SSP, two CAN and one
plant of blended NPKs having a total production capacity of 8,983 thousand product tonnes
per annum. Although, the installed production capacity for all products has attained the
level of 8,983 thousand tonnes per annum, the actual production for year 2016-17 for all
products remained at 8,245 thousand production tonnes. The estimated production for
2017-18 is about 7866 thousand products tonnes. The entire fertilizer products are
manufactured by the private sector.
The total domestic production of all fertilizer products during 2016-17 was 8245 thousand
tonnes compared to 8015 thousand tonnes during 2015-16, showing an increase of 2.9 %.
Urea production during 2016-17 was 5916 thousand tonnes (5770 thousand tonnes in
2015-16) followed by DAP 802, NP 703, CAN 674, SSP 78 and NPK of various grades 72
thousand tonnes respectively.
Fertilizer Availability (includes imports)
Product-wise availability was; urea 7588, DAP 2644, and Nitrophos 809 thousand product
tonnes. Domestic production met about 80 % of the country’s requirements during 2016-
17. The deficit of 20 % between production and off take was met through imports and carry
over inventory.
Fertilizer-wise Demand and Supply during FY 2015-16 & FY 2016-17
UREA DAP Nitrophos
2016-
17
2015-
16
2016-
17 2015-16
2016-
17 2015-16
Opening Balance 1,672 213 391 223 106 59
Domestic
Production 5,916 5,770 802 788 703 647
Imports - 253 1,450 1,201 - 5
Total Availability 7,588 6,236 2,643 2,212 809 712
Off-take 6,372 4,558 2,329 1,823 759 605
Exports 115 - - - - -
Adjustment (5) - 8 - (1) -
National
Inventory 1,096 1,672 4,980 389 49 106
National Fertilizer Development centre, Data
Fertilizer Products
Fertilizer Off take
The off take of urea increased
from 4558 thousand tonnes in
2015-16 to 6372 thousand tonnes
in 2016-17, registering an
increase of 39.8 per cent. The off
take of DAP increased from 1823
thousand tonnes in 2015-16 to
2329 thousand tonnes in 2016-17
registering a growth of 27.7 per
cent over last year. The off take of
other products during 2016-17
was: CAN 750, NP 759, NPK’s
70, SSP 84, SOP 25, MOP 28
and AS 18 thousand tonnes.22
Source: Annual Fertilizer Review 2016-17

Balance Sheet of Fertilizer in crop
seasons
UREA
Total availability of urea during Kharif 2017
was 4,445 thousand tonnes comprising of
1,489 thousand tonnes of opening
inventory and 2,956 thousand tonnes of
domestic production. Urea Off-take was
about 3,234 thousand tonnes, leaving
inventory of 796 thousand. tonnes for Rabi
2017-18.
Rabi 2017-18 started with an opening
balance of 796 thousand tonnes of urea.
Domestic production during Rabi 2017-18
was estimated around 2,698 thousand
tonnes. Urea Off-take during current Rabi
2017-18 is projected around 3,003
thousand tonnes, against 3,494 thousand
tonnes of total availability, leaving a closing
balance of 307 thousand tonnes for next
season.
Total availability of urea during Kharif 2018
will be around 3,229 thousand tonnes
comprising of 307 thousand tonnes of
opening balance and 2,922 thousand
tonnes of domestic production. Urea Off-
take is expected to be around 2,959
thousand tonnes, reflecting a closing
balance of 270 thousand tonnes.
DAP
Availability of DAP was 1,360 thousandtonnes comprising of 59 thousand tonnesof opening inventory, 867 thousand tonnesof imported supplies and 434 thousandtonnes of local production. DAP Off-takewas 992 thousand tonnes leaving aninventory of 367 thousand tonnes forupcoming Rabi 2017-18. About 422thousand tonnes of urea was exportedduring Kharif 2017.
DAP availability during Rabi 2017-18 willbe around 1,531 thousand tonnes, whichinclude 367 thousand tonnes of openinginventory, 787 thousand tonnes ofimported supplies and domesticproduction of 377 thousand tonnes. Off-take of DAP during Rabi season isestimated at 1,403 thousand tonnes,leaving a balance of 135 thousand tonnesfor next season.
Total availability of DAP will be 557thousand tonnes against the expected Off-take of 782 thousand tonnes. Thus, thereis a gap of 225 thousand tonnes of DAPwhich will be met through imports byprivate sector.
(000 Tonnes)
Description Kharif (Apr-Sep) 2017 Rabi (Oct - Mar) 2017-18 Kharif (Apr-Sep) 2018
Urea DAP Urea DAP Urea DAP Openting Stock 1489 59 796 367 307 135Imported Supplies 0 867 0 787 0 0DomesticProduction 2956 434 2698 377 2922 422Total Availability 4445 1360 3494 1531 3229 557Off-take/Demand 3234 992 3003 1403 2959 782Export 422 0 184 0 0 0Write on/ off 7 -0.6 0 7 0 0Closing stock 796 367.4 307 135 270 -225
Source: Pakistan Bureau of Statistics
Fertilizer Products (Contd.)
23
Note: Balance Sheet includes opening balance,
domestic production and imports which after
consolidating is considered as total availability of each
Product during the season. Furthermore the national
inventory at the end of each season is calculated by
deducting Off-take and exports of that season.

(000 Tonnes)Province-wise off take of Urea and DAP during 2016-17 compared with previous years
2012-13 2013-14 2014-15 2015-16 2016-17
Percentage Change in
2016-17 over 2015-16
Provincial Share (average 5
years)
UREAPunjab 3607 3854 3971 2949 4233 43.5% 67%Change % 247 117 -1022 1284Sindh 933 1334 1458 1271 1646 29.5% 24%Change % 401 124 -187 375KP 410 338 313 251 323 28.7% 6%Change % -72 -25 -62 72Balochistan 248 221 194 87 171 96.6% 3%Change % -27 -27 -107 84Pakistan 5198 5747 5936 4558 6373 39.8% 0%Change % 549 189 -1378 1815DAPPunjab 971 1149 1320 1296 1723 32.9% 72%Change % 178 171 -24 427Sindh 203 342 333 415 462 11.3% 20%Change % 139 -9 82 47KP 99 86 97 70 84 20.0% 5%Change % -13 11 -27 14Balochistan 72 46 51 43 60 39.5% 3%Change % -26 5 -8 17Pakistan 1345 1623 1801 1824 2329 27.7% 0%Change % 278 178 23 505
24
Province Wise Fertilizer Products (YOY
comparison)
2018 Punjab Board of Investment and Trade I Transaction Department. All rights reserved
Source: National Fertilizer Development centre, Data

Seasons
In product terms, fertilizer production
increased from 3967 thousand tonnes to
4165 thousand tonnes during Kharif 2016
compared with Kharif 2015.
Fertilizer industry experienced positive
growth during Rabi 2016-17 as compared
to Rabi 2015-16. In product terms fertilizer
production increased by 0.3 % from 3967
thousand tonnes to 3979 thousand tonnes
1
3
3
2
1
DAP
NP
SSP
CAN
NPK
Types of Fertilizer Plants in Pakistan 2017-18
Nutrient-wise supply/demand situation during Kharif 2016
(000’ Tonnes) Urea DAP Nitrophos
Kharif
2015-16
Kharif
2016-17
Kharif
2015-16
Kharif
2016-17
Kharif
2015-16
Kharif
2016-17
Opening Balance 212 1,202 141 280 12 168
Domestic Production 2,686 3,085 420 416 404 297
Imports 294 - 376 484 - -
Total Availability 3,192 4,287 937 1,180 416 465
Off-take 2,424 2,703 413 697 217 323
Exports - - - - - -
Adjustment (3) (9) (1) 2 (11) -
National Inventory 769 1,575 525 485 188 142
Seasons Wise Balance Sheet Fertilizer
ProductsNutrient-wise supply/demand situation during Rabi 2016
(000 Tonnes) Urea DAP Nitrophos
Rabi 2015-16
Rabi 2016-17
Rabi 2015-16
Rabi 2016-17
Rabi 2015-16
Rabi 2016-17
Opening Balance 769 1,575 525 485 188 142
Domestic Production
2,817 2,849 369 377 339 338
Imports 50 - 833 824 - 5
Total Availability 3,636 4,424 1,727 1,686 532 480
Off-take 2,435 2,892 1,447 1,608 364 392
Exports - 31 - - - -
Adjustment (1) (0) - 7 - -
National Inventory
1,202 1,501 280 85 168 89
Source : National Fertilizer development centre, DATA
Source : Economic Survey of Pakistan of FY 17-18
25
2018 Punjab Board of Investment and Trade I Transaction Department. All rights reserved
Note: Balance Sheet includes opening balance,
domestic production and imports which after
consolidating is considered as total availability of each
Product during the season. Furthermore the national
inventory at the end of each season is calculated by
deducting Off-take and exports of that season.

4%
13%
0%
3%
29%
7%
15%
8%
21%
5%
10%
1%
3%
29%
7%
14%
8%
22%
DH…
EF…
Pa…
Ag…
FFC
FFBL
FFC
Fat…
EF…
0% 5% 10% 15% 20% 25% 30% 35%
Market Share Production Wise (FY 2016 & 2017)
Market shareProduction Wise
Market shareProduction Wise
44
5
97
0
12
0
42
9
13
30
55
1 71
8
50
0
12
60
22
3
74
5
1
19
8
16
72
42
7
86
1
44
8
11
95
31
1
60
6
83 1
77
17
00
43
5
85
1
45
7
12
96
DHCL EFERT(old)
Pak Arab AgriTech(Pvt.) Ltd
FFC FFBL FFC FatimaFert. Co.
EFERT(new)
in 0
00
to
nn
es
Source: National Fertilizer Development Corporation
Total Urea Production in PakistanAnnual Production Capacity Production FY 2015-16
Products Vs. Capacity “UREA”
26
Largest Market Share:Fauji Fertilizer company :29%Engro Fertilizer: 22%Fauji fertilizer Bin Qasim: 14%
Growth in Production: 2.5%(YOY-2015-16, 2016-17)
Urea: 72% share in total local production (5,916 Vs 8,245 ‘000 Tons(FY 2016-17)
Production Capacity UtilizationTotal UREA:Fauji Fertilizer company : 128%Engro Fertilizer: 62% Fauji fertilizer Bin Qasim: 79%
2018 Punjab Board of Investment and Trade I Transaction Department. All rights reserved
Source: National Fertilizer Development Centre, DATA
• Out of total fertilizer Products Urea has the highest market share in Production i.e. 72%.
• Among largest player in Urea Production FFC leads the market with 29%.
• Importantly FFC is also has the highest capacity utilization and exceed maximum production
capacity 100%

Products Vs. Capacity “CAN”
37%
63%
35%
65%
Pak Arab
Fatima Fertilizer Co.
0% 20% 40% 60% 80%
Market Share Production Wise (FY 2016 & 2017)
Market share Production Wise
Market share Production Wise
340 340237
410
236
438
Pak Arab Fatima Fertilizer Co.
in 0
00
to
nn
es
Source: National Fertilizer Development Corporation
Total CAN Production in Pakistan
Annual Production Capacity
Production FY 2015-16
Production FY 2016-17
27
Largest Market Share in FY 2016-17:Fatima Fertilizer company : 63 %Pak Arab : 37 %
Growth in Production: 4.2 %(YOY-2015-16, 2016-17)
CAN: 8 % share in total local production (5,916 Vs 8,245 ‘000 TonsFY 2016-17)
Production Capacity UtilizationTotal CAN :Pak Arab : 69%Fatima Fertilizer company : 129%
2018 Punjab Board of Investment and Trade I Transaction Department. All rights reserved
Source: National Fertilizer Development Centre, DATA
• Out of total fertilizer Products CAN has the highest market share in Production i.e. 8%.
• Among largest player in Urea Production Fatima Fertilizer Limited leads the market with
63%.
• Importantly Fatima Fertilizer Limited is also has the highest capacity utilization and
exceed maximum production capacity 100%

Products Vs. Capacity “NP”
34%
8%
58%
40%
9%
51%
Pak Arab
EFL
Fatima Fertilizer Co.
0% 10% 20% 30% 40% 50% 60% 70%
Market Share Production Wise (FY 2016 & 2017)
Market share Production Wise Market share Production Wise
350
40
350
219
53
375
282
65
356
Pak Arab EFL Fatima Fertilizer Co.
in 0
00
to
nn
es
Source: National Fertilizer Development Corporation
Total NP Production in Pakistan
Annual Production Capacity Production FY 2015-16
Production FY 2016-17
28
Largest Market Share:Fatima Fertilizer company : 51 %Pak Arab : 40 %
Growth in Production: 8.7 %(YOY-2015-16, 2016-17)
NP: 9 % share in total local production (703 Vs 8,245 ‘000 TonsFY 2016-17)
Production Capacity UtilizationTotal NP:Pak Arab : 81%EFL : 163%Fatima Fertilizer company : 102%
2018 Punjab Board of Investment and Trade I Transaction Department. All rights reserved
Source: National Fertilizer Development Centre, DATA
• Out of total fertilizer Products NP has the highest market share in Production i.e. 9%.
• Among largest player in Urea Production Fatima Fertilizer Limited leads the market with
51%.
• Importantly Fatima Fertilizer Limited is also has the highest capacity utilization and exceed
maximum production capacity 100%

Products Vs. Capacity “DAP & SSP”
90%
1%
6%
3%
1%
91%
0%
7%
2%
0%
FFC
LCFL (Al Hamd)
Agritech Limited
Suraj Fertilizer
Safi Chemical
0% 20% 40% 60% 80% 100%
Market Share Production Wise (FY 2016 & 2017)
Market share Production Wise
Market share Production Wise
675
108 147 15040
788
10 52 23 5
802
061 17 0
FFC LCFL (AlHamd)
AgritechLimited
SurajFertilizer
SafiChemical
in 0
00
to
nn
es
Source: National Fertilizer Development Corporation
Total DAP Production in Pakistan
Annual Production Capacity
Production FY 2015-16
Production FY 2016-17
29
Largest Market Share in FY 2016-17:FFC : 90% Agritech : 7%
Growth in Production: 0.2 %(YOY-2015-16, 2016-17)
DAP & SSP : 11 % share in total local production (880 Vs. 8,245 ‘000 TonsFY 2016-17)
Production Capacity UtilizationTotal DAP & SSP:FFC : 119%Agritech Limited : 41%
2018 Punjab Board of Investment and Trade I Transaction Department. All rights reserved
Source: National Fertilizer Development Centre, DATA
• Out of total fertilizer Products DAP & SSP has the highest market share in Production i.e.
11%.
• Among largest player in Urea Production Fauji Fertilizer Limited leads the market with
63%.
• Importantly Fauji Fertilizer Limited is also has the highest capacity utilization.

120
40
65
9
66
6
0
20
40
60
80
100
120
140
EFERT Safi Chemicals
In 0
00
to
nn
es
Total NPK Production in Pakistan
Annual Production Capacity
Production FY 2015-16
Production FY 2016-17
88%
12%
92%
8%
EFERT
Safi Chemicals
0% 20% 40% 60% 80% 100%
Market Share of Production Wise of FY 2016 & 2017
Market share Production Wise
Market share Production Wise
Products Vs. Capacity “NPK”
30
Largest Market Share in FY 2016-17:EFL : 92%Safi Chemicals : 8%
Growth in Production: 1 %(YOY-2015-16, 2016-17)
NPK: 1 % share in total local production (72 Vs. 8,245 ‘000 TonsFY 2016-17)
Production Capacity UtilizationTotal DAP & SSP:EFL : 55%Safi Chemicals : 15%
2018 Punjab Board of Investment and Trade I Transaction Department. All rights reserved
Source: National Fertilizer Development Centre, DATA

Agricultural credit is one of the most important instruments to achieve higher productivity. Its
availability at the time when needed is crucial for gaining maximum benefits. Credit
requirements of the farming community have been increasing continuously over the period
of time. This might be due to rise in the prices and use of costly agricultural inputs. State
Bank of Pakistan is the main governing body in the country, which ensures the availability of
agricultural credit to farmers. Zari Taraqiati Bank Limited (ZTBL), Commercial banks,
Cooperatives and Domestic private banks are providing credit facility to the farmers for
meeting their credit needs.
Supply of institution-wise agricultural credit disbursement during 2015-16 and 2016-17 is
presented. Agricultural loans of Rs. 704.5 billion were disbursed during 2016-17 as against
Rs. 598.3 billions during the last year (2015-16), thereby registering an impressive increase
of 17.8 %. The share of commercial banks and ZTBL was 48.6 and 13.1 %, whereas the
share of private Banks was 19.7 %. Share Micro Finance Banks, Islamic Banks and Rural
Support Programmes was 12.5, 1.7 and 2.8 %respectively.
Agriculture Credit / Fertilizer Sector
Share
It may be observed that out of the total disbursement during 2016-17, 92 per cent was for
production loan and 8 % for development loan. Production loan is for short term of 6 to 18
months for farm inputs seed, fertilizer, pesticides, POL, Labour and Poultry feed chick’s etc.
Of the total production loan, about 40 % goes to fertilizer. Therefore, it is estimated that
about Rs. 260 billion have been provided for fertilizer sector. The data presented also
indicate that almost the all banks have achieved their targets. Overall target achievement
was 100.6 %.
31
Institution-wise Agriculture Credit Disbursements During FY 2015-16 & 2016-17
(Million PKR) Disbursement
Description 2015-16 2016-17 % Change Share %
Total Commercial Bank 311,401 342,068 9.0% 48.6%
ZTBL 90,977 92,450 2.0% 13.0%
PPCBL 10,335 10,880 5.0% 1.5%
Total Domestic Private Banks 123,097 139,061 11.0% 19.7%
Total Mirco Finance 53,938 87,772 39.0% 12.5%
Total Islamic Banks 8,540 12,326 31.0% 1.7%
Total MFIs/RSPs - 19,930 100% 2.80%
Grand Total 598,288 704,487 100%
2018 Punjab Board of Investment and Trade I Transaction Department. All rights reserved
Source: National Fertilizer Development Centre, DATA

Natural gas is a major contributing fuel in country’s energy mix. The country has a hugenetwork of gas pipelines providing natural gas to domestic, industrial, commercial andtransport sectors. The use of natural gas as a fuel of choice has also contributed incontrolling environmental degradation. There is a significant rise in demand/consumption ofgas by residential/domestic consumers owing to price differential vis-a-vis other competingfuels, i.e. LPG, fire wood and coal. On average, during the last 5 years, more than 0.3million consumers were added/connected to gas network annually by the Gas UtilityCompanies. The positive growth of sectors, such as power, commercial, residential andfertilizer has resulted in natural gas availability constraint. The increase in demand of naturalgas will amplify further in the next coming years.
During the period under review, power sector (including captive power) has remained themain consumer of gas, accounting for around 43 % share followed by residential andfertilizer sectors with a share of 21 % each.
It is forecasted that due to ever increasing demand for gas, Pakistan will face an increasingdeficit in gas supply. The shortfall in gas is expected to reach 3,999 MMcfd by FY 2019-20and the gap will reach 6,611 MMcfd without imported gas by FY 2029-30. The Governmentof Pakistan (GoP) has initiated various measures to bridge the gap between demand andsupply which includes incentivizing of local gas production, import of natural gas in the formof Liquefied Natural Gas (LNG) and cross country pipelines from Iran and Turkmenistan.
During FY 2016-17, total supply of natural gas in the country, including imported RLNG, hasreached 4,131 MMcfd.
The share of Regasified Liquid Natural Gas(RLNG) in the gas supply was 16 percent.
Natural gas demand in the country has beenincreasing day by day. Some 20 years back, in1996-1997, overall consumption of natural gas inthe country was around 1,700 MMcfd whereasthe same has increased to 4,131 MMcfd in FY2016-17.
During FY 2016-17, the Power Sectorconsumed the highest volume, i.e. 1,180 MMcfdof natural gas while the residential sectorconsumed about 796 MMcfd of natural gas.However fertilizer sector at third in the totalcountry consumption with volume 771 MMcfd ofnational gas.
424
527
181 20
4
172
11
4
62
1
222 2
69
59
189
154
70
28
534
531
0%
5%
10%
15%
20%
25%
30%
35%
0
100
200
300
400
500
600
per
cen
tage
of
sup
ply
in M
illio
n M
cfd
Natural Gas Distribution of Pakistan
Gas Supply To The Fertilizer Sector
322018 Punjab Board of Investment and Trade I Transaction Department. All rights reserved
Source: Annual Fertilizer Review 2016-17

in (MMCFT)
Company Consumption FY15-16 FY16-17Sui Northern gas Pipelines Limited
Pak- Arab Feed - 222 Fuel - 674 Total - 896
Dawood Hercules Feed 1,881 189 Fuel 437 570 Total 2,318 759
Pak- American Feed 4,881 4,310 Fuel 920 895 Total 5,801 5,205
EFERT (new) Feed 33,536 34,257 Fuel 2,420 2,935 Total 35,956 37,192
Hazara Phosphate Feed - -Fuel 61 -Total 61 -
Oil & Gass Development Company Limited EFERT Feed - -
Fuel - 3,710 Total - 3,710
Liquefied Nqtural Gas (LNG) Pak- Arab Feed 170 9,829
Fuel 349 2,535 Total 519 12,364
Dawood Hercules Feed 4,227 8,251 Fuel 849 1,380 Total 5,076 9,631
Sui Northern Gas Pipelines Limited FFC Jordon Feed 19,240 17,755
Fuel 4,470 3,807 Total 23,710 21,562
Mari Gas Pipelines Limited EFERT- 1 & 2 Feed 54,525 31,145
Fuel 5,442 3,898 Total 59,967 35,043
FFC - 1& 2 Feed 49,736 50,449 Fuel 11,505 12,096 Total 61,241 62,545
FFC 3 (MM) Feed 28,054 27,903 Fuel 4,579 4,446 Total 32,633 32,349
Fatima Fertilizer Feed 29,227 30,385 Fuel 6,938 5,498 Total 36,165 35,883
Grand Total 263,386 257,139
Gas supply to the fertilizer sector
332018 Punjab Board of Investment and Trade I Transaction Department. All rights reserved
Source: Annual Fertilizer Review 2016-17

Domestic retail prices during Kharif 2016
Fertilizer market is deregulated and prices vary from place to place. Generally prices arehigher in North of the country than South due to transport charges. The following tablepresents the average fertilizer market prices collected from 12 cities of the country during2016-17. The average market prices of all fertilizer products decreased during Kharif 2016.Urea (sona), and urea (other) prices witnessed a decrease of 25.8 and 23.5 per cent,respectively. DAP and NP prices also decreased through out the season. Price of DAPdecreased by 11.9 per cent while that of NP decreased by 8.6 per cent. Prices of CAN andSOP decreased by 21.3, and 13.2 per cent, respectively.
Domestic retail prices during Rabi 2016-17
Prices of all fertilizer products decreased during Rabi 2016-17. Average prices of sona ureadecreased by 0.3 per cent while prices of other brands of urea decreased by 1.2 per cent.The average prices of DAP and NP also decreased by 2.8 and 6 per cent, respectively.Average prices of CAN and SOP decreased by 0.4 and 7.1 per cent during Rabi 2016-17.
Domestic prices during 2016-17
Prices of all the fertilizers decreased significantly during current fiscal year 2016-17. Theaverage price of urea (other) decreased by 11.1 per cent, while that of urea sona decreasedby 10.7 per cent. The prices of DAP, NP, CAN and SOP (G) decreased by 6.2, 6, 10.4 and15.8per cent, respectively.
Average Fertilizer Retail Prices from April 2016 to June 2017
(Rs. Per 50 Kg bag)
Month Urea SonaUrea
(other) DAP NP CAN SOP SSP(G) NPK
Apr-16 1,855 1,827 3,011 2,140 1,537 4,970 927 2,804
Sep-16 1,377 1,398 2,654 1,956 1,210 4,315 894 2,579
Kharif Avg Price 1,603 1,599 2,816 2,023 1,377 4,608 927 2,804
% Change -26% -24% -12% -9% -21% -13% -4% -8%
Oct-16 1,371 1,387 2,603 1,925 1,188 4,226 888 2,559
Mar-17 1,367 1,370 2,531 1,810 1,183 3,928 879 2,490
Rabi Avg Price 1,369 1,379 2,544 1,827 1,176 4,101 881 2,508
% Change 0% -1% -3% -6% 0% -7% -1% -3%
Jul-16 1,482 1,476 2,771 1,976 1,314 4,489 896 2,638
Jun-17 1,323 1,312 2,598 1,857 1,178 3,778 883 2,536
Fiscal Year 2017 1,376 1,379 2,596 1,869 1,198 4,100 886 2,533
% Change -10.7% -11.1% -6.2% -6.0% -10.4% -15.8% -1.5% -3.9%
Source : Annual Fertilizer Review 2016-17
Fertilizer Prices In Pakistan
342018 Punjab Board of Investment and Trade I Transaction Department. All rights reserved

Average International fertilizer prices During 2016-17 (FOB Prices US $/ton)
Urea (Mid. East) Urea China DAP Us Gulf DAP China TSP Tunisia
Apr-16 209.9 215.9 366.6 334.6 312.5
Sep-16 192.5 195.3 320.1 320.6 277.5
Kharif Avg Price 200 203.6 333.4 330 286.8
% Change -8.3% -9.6% -12.7% -4.2% -11.2%
Oct-16 201.6 203.9 309.1 301 277.5
Mar-17 237.5 232.3 322.8 367.5 282.5
Rabi Avg Price 233.1 229.9 311.7 333.1 278.8
% Change 17.8% 13.9% 4.4% 22.1% 1.8%
Jul-16 193.8 194.6 305.6 329.8 287
Jun-17 205 226.9 311 340 282.5
Fiscal Year 2017 217.1 218.3 312.2 335.2 279.4
% Change 5.8% 16.6% 1.8% 3.1% 1.6%
Source : Annual Fertilizer Review 2016-17
The average fertilizer prices of urea, DAP and TSP prevalent in international markets duringKharif 2016, Rabi 2016-17 and FY 2016-17.
Kharif 2016
Urea prices in international market during Kharif 2016 decreased by 8.3 % in Middle East.DAP prices in international market decreased by 12.7 % in US Gulf and decreased 9.6 % inChina market. The prices of TSP also witnessed a decrease by 11.2 %.
Rabi 2016-17
During Rabi 2016-17, average monthly urea prices in Middle East market ranged betweenUS $ 201.6 to 256.3/t fob while China market ranged between US $ 203.9 to 242.5 fob/t.Urea prices in Middle East increased by 17.8 per cent while in China market, it increased by13.9 %. DAP prices in US Gulf increased by 4.4 %. The prices of TSP, in Tunisia alsoincreased by 1.8 % during Rabi 2016-17.
Fiscal year 2016-17
During 2016-17, urea fob prices fluctuated between US $ 192.5 to 256.3/t in Middle East andUS$ 192.5 to 242.5/t in China market. DAP prices witnessed an increase of 1.8 per cent inUS Gulf and quoted prices for DAP increases from US $ 296.9 in December 2016 to US $331.5/t fob in February 2017 in US Gulf. TSP prices decreased slightly by 1.6 per cent. DAPprice in China market increased by 3.1 %.
International Fertilizer Prices in
Pakistan
352018 Punjab Board of Investment and Trade I Transaction Department. All rights reserved
Source : Food and Agriculture Organization

During 2016-17, a total quantity of about 10435 thousand tonnes of various productsdomestically produced as well as imported, were handled by marketing agencies. Theprivate sector manufacturing/marketing agencies (including importers) share was 99 percent in total fertilizer distribution (98 per cent during 2015-16). FFC, EFERT, Pak-Arab,DHCL, Agritech Limited and Fatima market share was 40, 25, 7, 4, 3 and 14 per cent,respectively. The share of other private importers was 5 per cent (Figure 16). Public sectoragency (NFML) share was 1 per cent (2 per cent during 2015-16) in total fertilizer quantitieshandled.
- 50.00 100.00 150.00 200.00 250.00 300.00
NFML
EFERT
PAK ARAB
Fatima Fertilizer Co. Ltd
Market share of various agencies in fertilizer offtake during 2016-17
UREA CAN NP SSP DAP NPKs
TSP SOP MOP MAP AS
36
Marketing agencies in Pakistan for
Fertilizer
Private sector handled about 98 per cent of
urea (97 per cent during 2015-16). FFC,
EFERT, DHCL, Fatima and Agritech shares
in urea marketing were 48, 31, 6, 9 and 3
per cent, respectively. The shares of FFC,
EFERT, Pak-Arab and DHCL in DAP off
take were 49, 22, 5 and 2 percent,
respectively. CAN was moved by Pak Arab
(28 per cent) and Fatima Fertilizer
Company (72 per cent). Market shares of
the various fertilizer distributing agencies
and the detailed product-wise and agency-
wise market shares. The share of
Regasified Liquid Natural Gas (RLNG) in
the gas supply was 16 percent.
2018 Punjab Board of Investment and Trade I Transaction Department. All rights reserved
Source : Annual Fertilizer Review 2016-17

The sector comprises 7 companies with the total paid up capital was Rs 71,004.69
million and market capitalization is Rs 561,170.4 million. The profit after tax of this sector
is Rs. 50,072.09 million.
Among fertilizer manufacturing companies, top 2 players represents more than 50% of
the sales in 2016-17 (FFCL 34% & EFL 23%).
List of Market Players in Pakistan
1.Arif Habib Corporation Limited
2.Dawood Hercules Corporation Limited
3.Engro Fertilizer Limited
4.Engro Corporation Limited
5.Fatima Fertilizer Company limited
6.Fauji Fertilizer Bin Qasim Limited
7.Fauji Fertilizer Company Limited
1% 2%
23%
7%
14%19%
34%
Industry Share according to Revenue in FY 2016-17
Arif HabibCorporationLimited
DawoodHerculesCorporationLimitedEngro FertilizersLimited
EngroCorporationLimited
37
5,783 7,435 21,932
1,653 939
63
,01
0
69
,51
9
87
,61
5
61
,42
5
50
,12
9
18,125
64,719 16,676
4,288 4,878
37,612
33,765 29,733
36,169 33,496
52
,73
3
45
,01
1
52
,18
2
49
,44
5
54
,45
5
90
,71
4 72
,87
7
84
,83
1
81
,24
0
74
,48
1
2 0 1 7 2 0 1 6 2 0 1 5 2 0 1 4 2 0 1 3
IN M
ILLI
ON
S
REVENUE TREND OF THE FERTILIZER SECTOR
Fauji Fertilizer Company Limited
Fauji Fertilizer Bin Qasim Limited
Fatima Fertilizer Company Limited
Engro Corporation Limited
Engro Fertilizers Limited
Dawood Hercules Corporation Limited
Arif Habib Corporation Limited
Financial Highlights/Company Analysis of
the sector
2018 Punjab Board of Investment and Trade I Transaction Department. All rights reserved
Source : Pakistan Stock Exchange

EFL
Year 2017 2016 2015
Gross Profit 23% 17% 0%
Net profit to sales 15% 13% 17%
Return on Equity (PAT) 27% 22% 39%
Return o capital employed 26% 22% 33%
Interest Coverage Ratio 7.3 Times 5.3 Times 5.6 Times
EPS 8.4 7.0 11.1
Sales (PKR- million) 77,129.0 69,537.0 88,033.0
Operating Profit (PKR- million) 19,312.0 16,821.0 25,694.0
Net Profit (PAT) (PKR- million) 11,156.0 9,283.0 14,818.0
Net Profit (PBT) (PKR- million) 16,664.0 13,634.0 21,067.0
Other Income (PKR- million) 5,866.0 8,143.0 1,781.0
Total Assets (PKR- million) 111,816.0 102,803.0 -
Long term Debt (PKR- million) 32,411.0 370,976.0 -
38
Financial Highlights of the SectorEngro Fertilizer Limited
2018 Punjab Board of Investment and Trade I Transaction Department. All rights reserved
Revenue in 2017 : PKR 77B Sales Growth YOY: 11%Improved from previously
Interest Coverage: 7.3TimesHigher the better(improved over the period) 2017 vs. 2016
Profit Margins: 14.46Growth in revenue (+ ly correlated) improved
Financial Leverage: 42.1lower the better (Debt decreasing YOY)
Source : Engro Fertilizer Limited Annual Report 2017-18

FFBQL
2017 2016 2015
Gross Profit 11% 3% 14%
Net profit to sales 2% 3% 8%
Return on Equity (PAT) 8% 10% 28%
Return o capital employed 3% 5% 17%
Interest Coverage Ratio (times) 1.74 1.74 3.88
EPS 1.1 1.4 4.4
Sales (PKR- million) 52,733.0 45,011.0 52,182.0
Net Profit (PAT) (PKR- million) 1,004.0 1,338.0 -
Net Profit (PBT) (PKR- million) 1,441.0 1,601.0 -
Other Income (PKR- million) 4,377.0 8,726.0
Total Assets (PKR- million) 65,652.0 63,795.0 59,407.0
Long term Debt (PKR- million) 15,858.0 18,027.0 12,109.0
39
Financial Highlights of the SectorFauji Fertilizer Bin Qasim Limited
2018 Punjab Board of Investment and Trade I Transaction Department. All rights reserved
Source : Fauji Fertilizer Bin Qasim Limited Annual Report 2017-18
Revenue : PKR 52B Sales Growth YOY: 17.2%improve
Interest Coverage: 1.74 times(Higher the better) Decreased over the period 2017 vs. 2016 due to increase in debt
Profit Margins: 1.9%Improved (2017 Vs 2016)
Financial Leverage: 2.17 (lower the better)Debt has increased over the period

FFC
2017 2016 2015
Gross Profit 20% 25% 34%
Net profit to sales 12% 16% 20%
Return on Equity (PAT) 35% 42% 39%
Return o capital employed 41% 44% 60%
Interest Coverage Ratio 7.37 8.23 17.61
EPS 8.4 9.3 13.2
Sales (PKR- million) 90,714.0 72,877.0 84,831.0
Operating Profit (PKR- million) 9,519.0 10,896.0 22,068.0
Net Profit (PAT) (PKR- million) 10,711.0 11,782.0 16,766.0
Net Profit (PBT) (PKR- million) 15,741.0 17,394.0 24,503.0
Other Income (PKR- million) 10,324.0 10,665.0 6,194.0
Total Assets (PKR- million) 49,621.0 49,676.0 47,804.0
Long term Debt (PKR- million) 15,572.0 16,653.0 15,893.0
40
Financial Highlights of the SectorFauji Fertilizer Company
2018 Punjab Board of Investment and Trade I Transaction Department. All rights reserved
Source : Fauji Fertilizer Company Annual Report 2017-18
Revenue : 90BSales Growth YOY: 24.5%improve
Interest Coverage: 7.37 Times(Higher the better) Decreased over the period 2017 vs. 2016 due to increase in debt
Profit Margins: decreased over the period.25%
Financial Leverage: 0.82lower the better (Debt decreasing YOY)

FatFCL
2017 2016 2015
Gross Profit 54% 53% 56%
Net profit to sales 28% 29% 31%
Return on Equity (PAT) 20% 3% 23%
Return o capital employed 16% 15% 17%
Interest Coverage Ratio 6.79 5.40 5.85
EPS 5.0 4.7 4.4
Sales (PKR- million) 37,612.0 33,765.0 30,226.0
Operating Profit (PKR- million) 12,736.0 11,626.0 11,548.0
Net Profit (PAT) (PKR- million) 10,576.0 9,782.0 9,254.0
Net Profit (PBT) (PKR- million) 168.0 107.0 (142.0)
Other Income (PKR- million) 526.9 702.6 683.8
Total Assets (PKR- million) 78,380.0 78,327.0 73,409.0
Long term Debt (PKR- million) 19,005.0 31,188.0 25,948.0
41
Financial Highlights of the SectorFatima Fertilizer Company Limited
2018 Punjab Board of Investment and Trade I Transaction Department. All rights reserved
Source : Fatima Fertilizer Company Limited Annual Report 2017-18
Revenue : 37BSales Growth YOY: 11.4%improve
Interest Coverage: 1.31Times(Higher the better) Decreased over the period 2017 vs. 2016 due to increase in debt
Profit Margins: 28.1% decreased over the period.
Financial Leverage: 76%lower the better (Debt decreasing YOY)

42
SOURCES• Pakistan Economic Survey 2017-18• Pakistan Bureau of Statistics• National Fertilizer development center • Business Recorder• Annual Fertilizer Report 2016-17 (Pakistan)• FAO: World Fertilizer Trends and Outlook To 2018
2018 Punjab Board of Investment and Trade I Transaction Department. All rights reserved

Punjab board of investment & trade is a provincial trade
and investment promotion agency established by the
Government of Punjab in 2009. In today′s global economy,
trade and investment play an increasingly important role in
generating means for transformative change. At PBIT, we
strive to ensure that this transformative change is
sustainable and more impactful. PBIT is committed to
enhancing the global competitiveness of Punjab and its
business. To this end, we work to attract new investments
in the region and strengthen the existing ones by
promoting local investment opportunities, facilitating
businesses and highlighting the distinct advantages of
Punjab as a business location.
Incorporated under Section 42 under the Companies
Ordinance of 1984, Punjab Board of Investments & Trade
(PBIT) assists companies which intend to invest in the
manufacturing and services sectors of Punjab. The wide
range of services provided by PBIT include providing
information on the opportunities for investments, as well
as facilitating companies which are looking for joint
venture partners. PBIT acts as Punjab's marketing arm
and actively promotes the province worldwide as one of
the best investment hubs in Asia. PBIT as Special
Economic Zone Authority Punjab also evaluates the
applications/proposals from Developers to declare their
Industrial Parks as Special Economic Zones. For granting
one time import duty exemption on machinery, equipment,
spare parts, consumables in Special Economic Zones,
PBIT is responsible to issue a confirmation Letter on the
status of the applicant prior to seeking the permission from
the relevant department/agencies to claim for the
exemption. Investors are always encouraged to discuss
their project interests with PBIT officers, wherein
Information can be obtained on major public/private
projects, prevailing sectoral policy framework, existing
incentive regime, financing options, trade statistics etc.
Punjab Board of Investment & Trade is a Steering
Committee Member and the Director of South Asia at the
World Association of Investment Promotion Agencies
(WAIPA) - a prestigious world association of organizations
similar to PBIT created by UNCTAD.
ABOUT US
Punjab Board of Investment &
Trade
23 – Aikman Road, GOR 1, Lahore.
Pakistan
PABX: +92 (042) 9920 5201-06
Fax: +92 (0) 42 9920 5171
Web: https://www.pbit.gop.pk
Punjab Board of Investment and Trade targets a
socio-economic growth through its P&PR. The
department plans to fortify its deep roots, both
locally and internationally, by
reaching out to leading businesses for
discussing the panoramic commercial
opportunities. As per the initiative ofinventiveness, the department plans to provide a
transaction advisory as defined in its role to
bring-in the investments and establish new
businesses. For this purpose, Pitch books of
different identified sectors are a new
resourcefulness of this department which would
target to develop the in-house capacity of
production by connecting the local andinternational market players. This would not only
ensure the technology transfer but also create
several jobs in the province. The department
plans to connect through the regional IPAs,
financial institutions, the embassies in different
countries and local chambers as well so as to
fast-track the process of economic growth and
industrialization in Punjab in regard to its
recognition as ‘The Land of Opportunities
Projects
and
Policy
Research
Department