Investor Day Presentation - Avis Budget Group
130
Investor Day Presentation November 2016
Transcript of Investor Day Presentation - Avis Budget Group
Investor Day Presentation
November 2016
Agenda
2
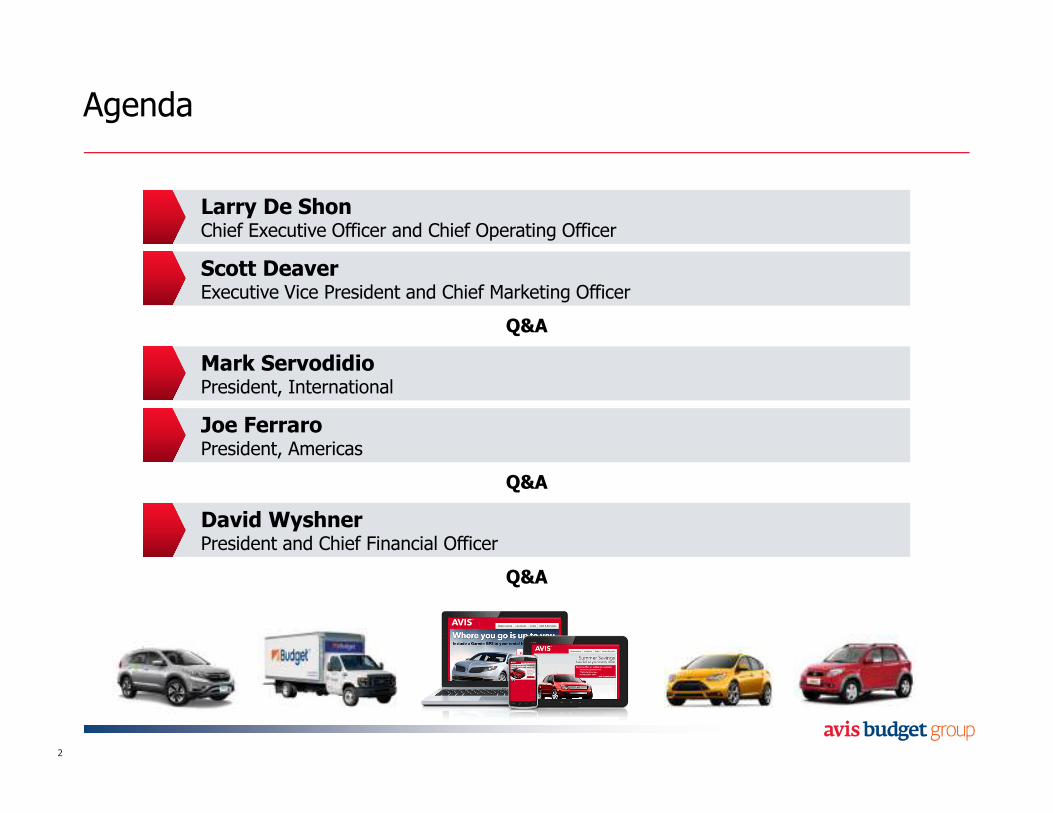
Larry De ShonChief Executive Officer and Chief Operating Officer
Scott DeaverExecutive Vice President and Chief Marketing Officer
Mark ServodidioPresident, International
Joe FerraroPresident, Americas
David WyshnerPresident and Chief Financial Officer
Q&A
Q&A
Q&A
Forward-Looking Statements
Statements about future results made in this presentation constitute forward-looking statements within the meaning of the Private Securities Litigation Reform Act of 1995. Such forward-looking statements include projections.
These statements are based on current expectations and the current economic environment. Forward-looking statements and projections are inherently subject to significant economic, competitive and other uncertainties and contingencies, many of which are beyond the control of management. The Company cautions that these statements are not guarantees of future performance. Actual results may differ materially from those expressed or implied in the forward-looking statements.
Important assumptions and other important factors that could cause actual results to differ materially from those in the forward-looking statements and projections are specified in the Company’s most recently filed Form 10-K and other SEC filings.
You are cautioned not to place undue reliance on these forward-looking statements, which speak only as of the date stated, or if no date is stated, the date of our last earnings conference call.
This presentation includes certain non-GAAP financial measures as defined under SEC rules. Important information regarding reconciliation of such measures is contained within this presentation, including in the Glossary section, which is available on the Investor Relations section of our website at ir.avisbudgetgroup.com
Our outlook includes non-GAAP financial measures. Due to the forward-looking nature of these forecasted adjusted earnings metrics, the Company believes that it is impracticable to provide a reconciliation to the most comparable GAAP measures due to the degree of uncertainty associated with forecasting the reconciling items and amounts. The Company further believes that providing estimates of the amounts that would be required to reconcile the forecasted adjusted measures to forecasted GAAP measures would imply a degree of precision that would be confusing or misleading to investors. The after-tax effect of reconciling items could be significant to the Company’s future quarterly or annual results.
3

Larry De Shon
Chief Executive Officer
Key Messages Today
5
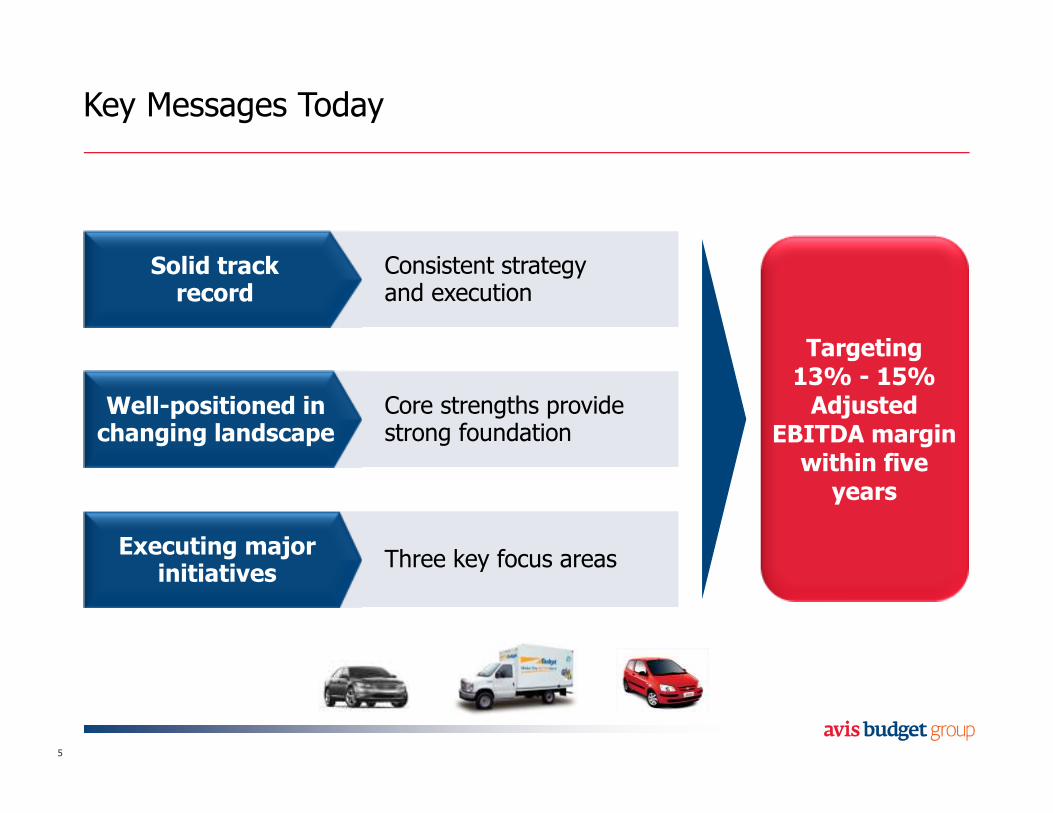
Solid trackrecord
Well-positioned in changing landscape
Executing major initiatives
Consistent strategy and execution
Core strengths provide strong foundation
Three key focus areas
Targeting 13% - 15% Adjusted
EBITDA marginwithin five
years
Agenda
The Business Today
Industry Fundamentals
Five-Year Vision
6
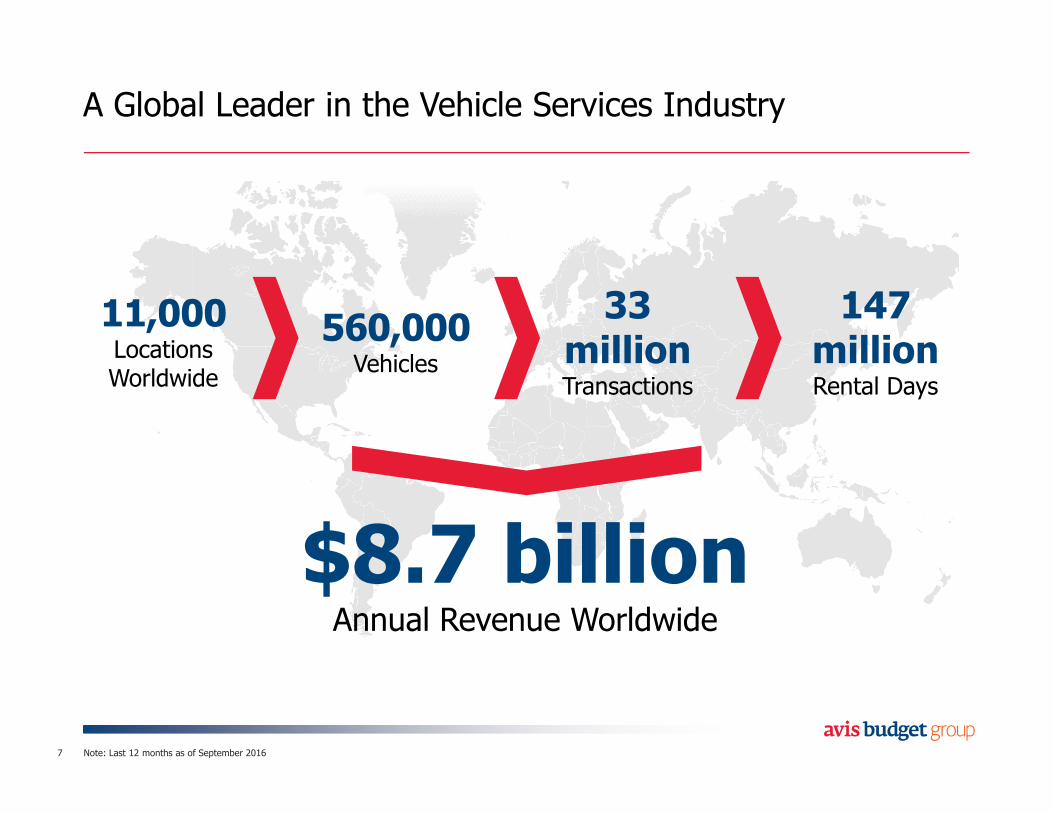
A Global Leader in the Vehicle Services Industry
Note: Last 12 months as of September 20167
11,000LocationsWorldwide
560,000Vehicles
33 millionTransactions
147 millionRental Days
$8.7 billionAnnual Revenue Worldwide
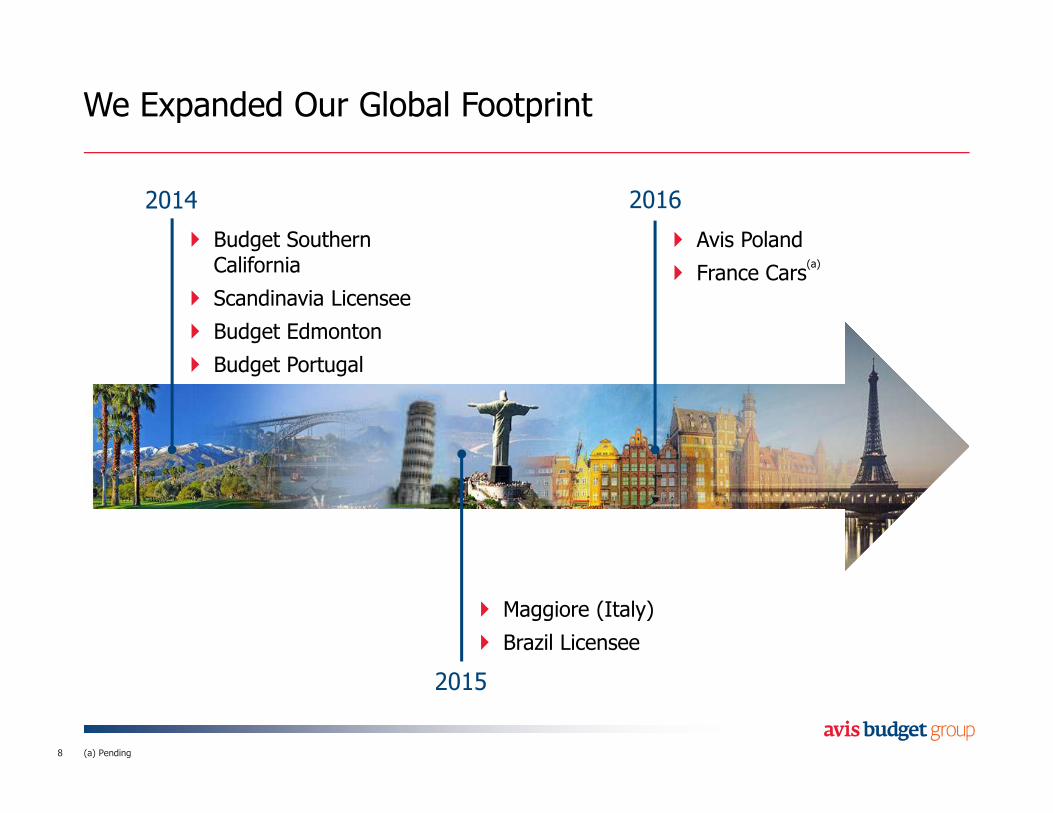
We Expanded Our Global Footprint
8
� Budget Southern California
� Scandinavia Licensee
� Budget Edmonton
� Budget Portugal
2014
� Avis Poland
� France Cars(a)
2016
(a) Pending
� Maggiore (Italy)
� Brazil Licensee
2015
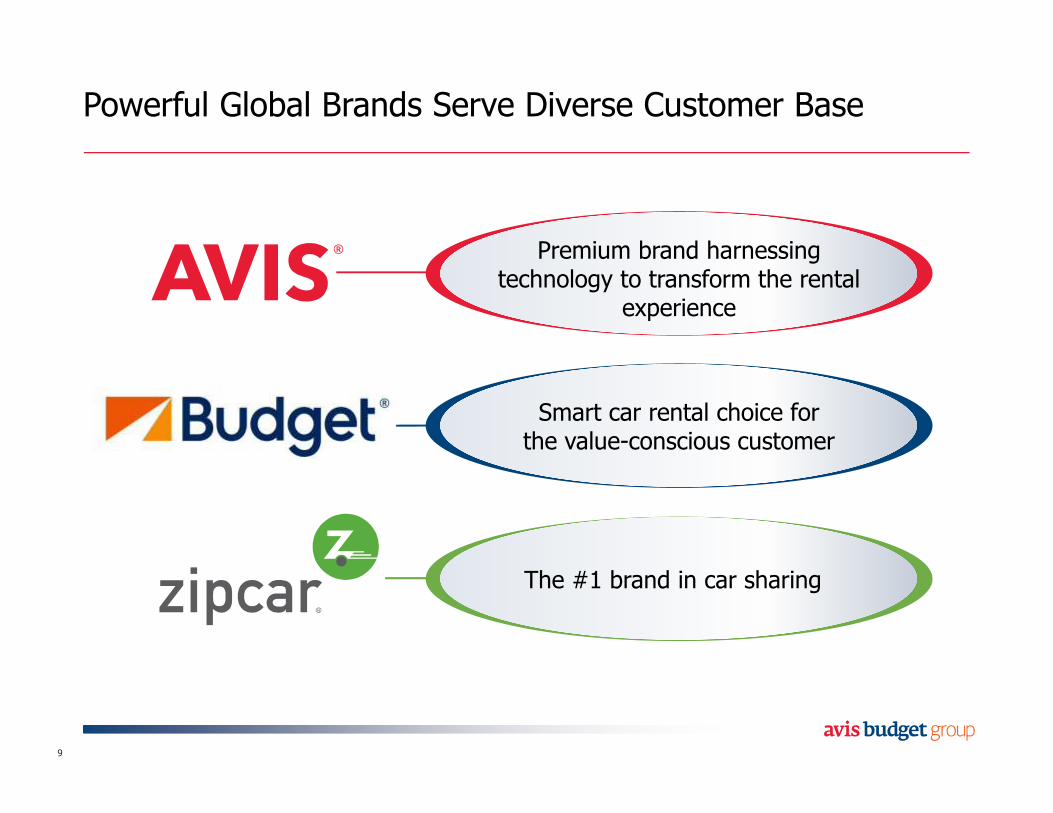
Powerful Global Brands Serve Diverse Customer Base
9
The #1 brand in car sharing
Premium brand harnessing technology to transform the rental
experience
Smart car rental choice forthe value-conscious customer
Agenda
The Business Today
Industry Fundamentals
Five-Year Vision
10
2015 2016
(a)Third Quarter Fourth Quarter First Quarter Second Quarter Third Quarter
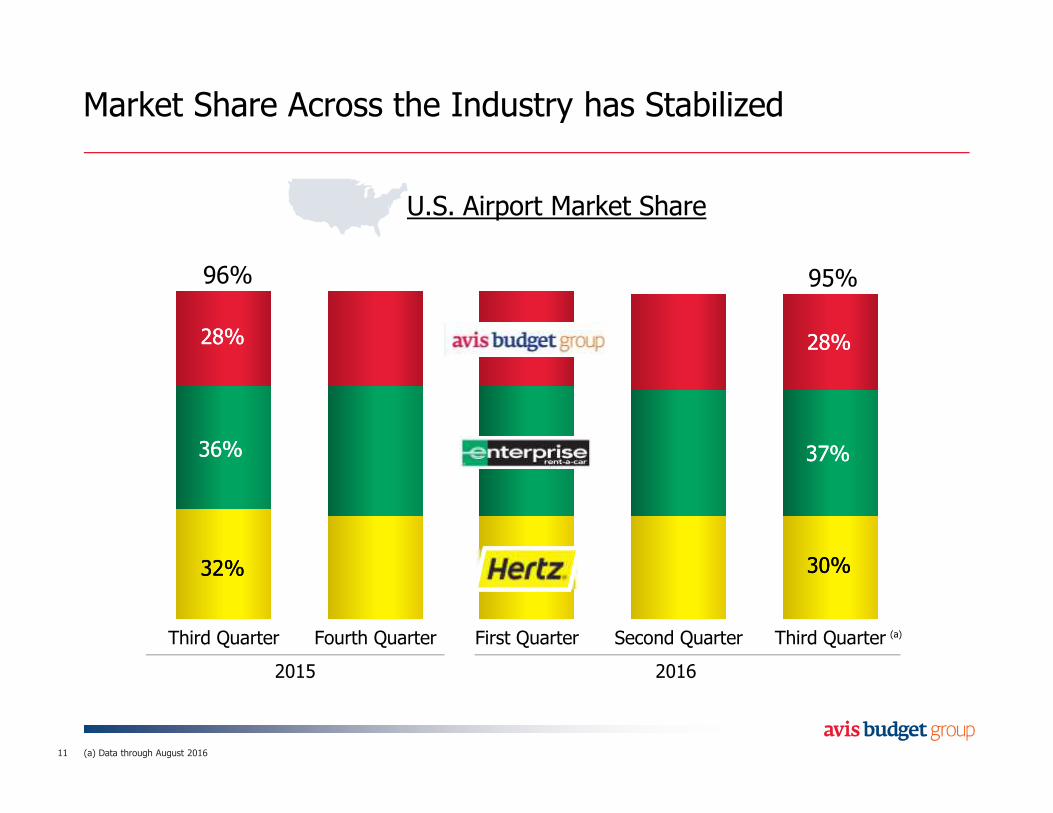
Market Share Across the Industry has Stabilized
11
U.S. Airport Market Share
96% 95%
28%28%28%28%
37%37%36%36%
30%30%32%32%
(a) Data through August 2016
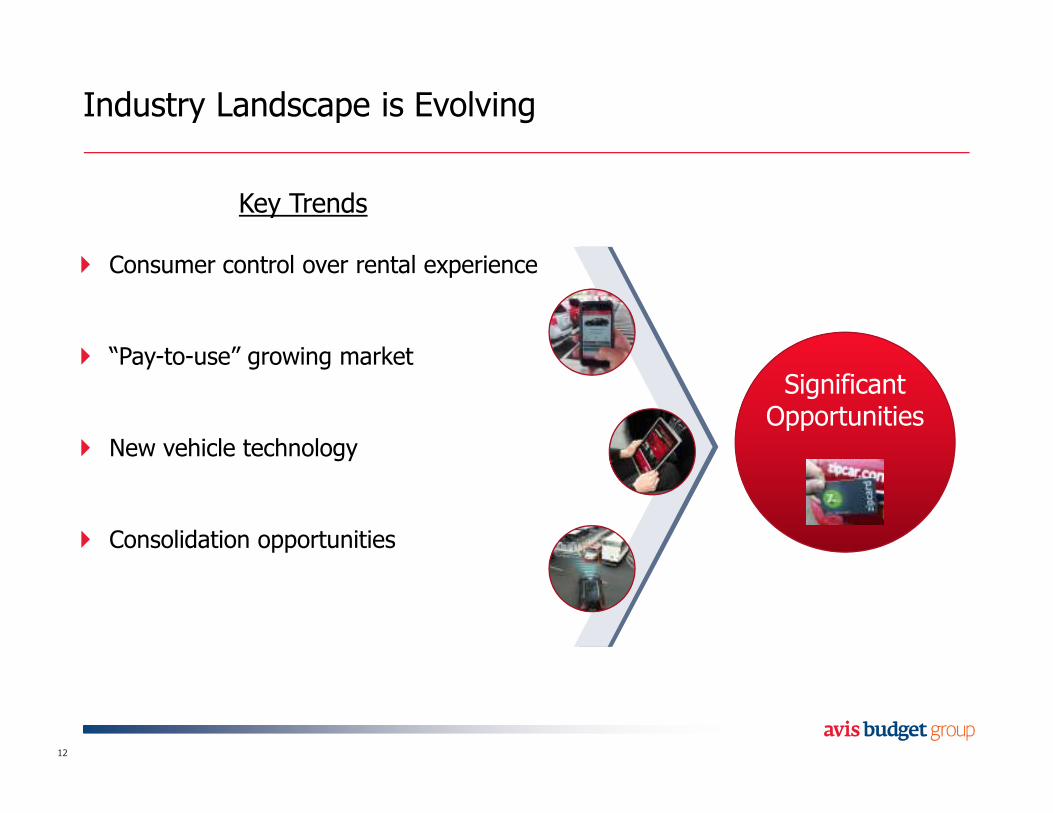
Industry Landscape is Evolving
12
Key Trends
Significant Opportunities
� Consumer control over rental experience
� “Pay-to-use” growing market
� New vehicle technology
� Consolidation opportunities
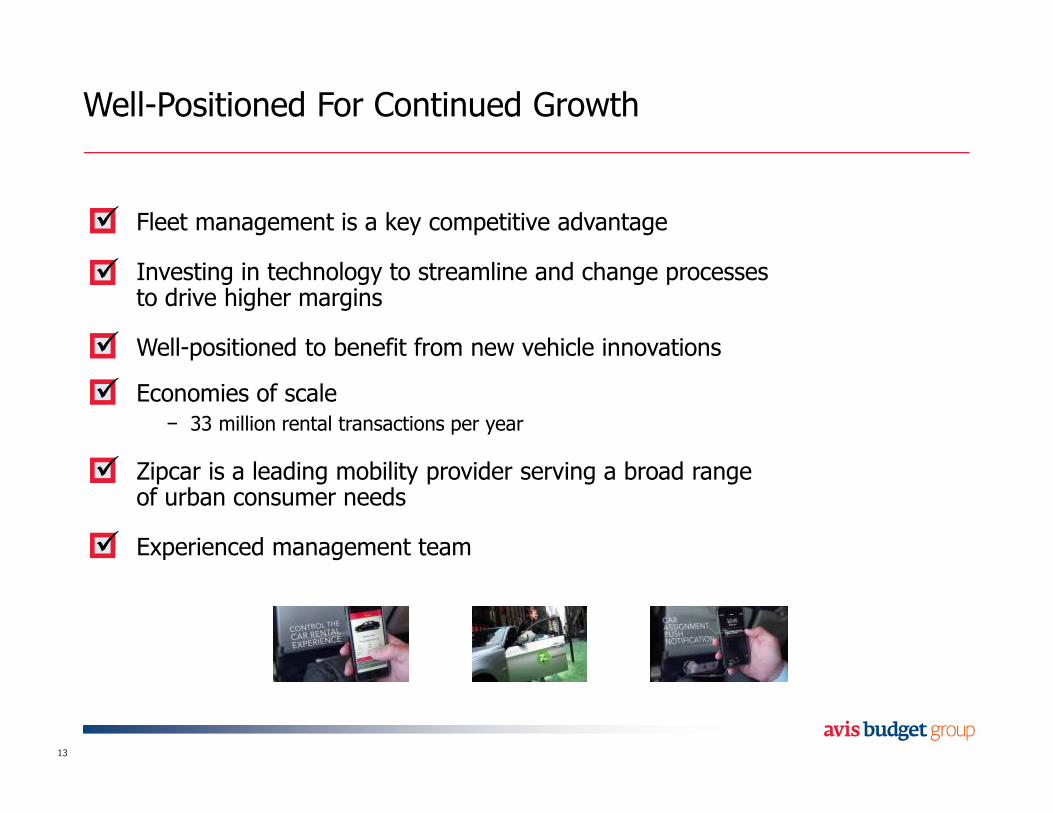
Well-Positioned For Continued Growth
Fleet management is a key competitive advantage
Investing in technology to streamline and change processes to drive higher margins
Well-positioned to benefit from new vehicle innovations
Economies of scale− 33 million rental transactions per year
Zipcar is a leading mobility provider serving a broad range of urban consumer needs
Experienced management team
13
�
�
�
�
�
�
Agenda
The Business Today
Industry Fundamentals
Five-Year Vision
14

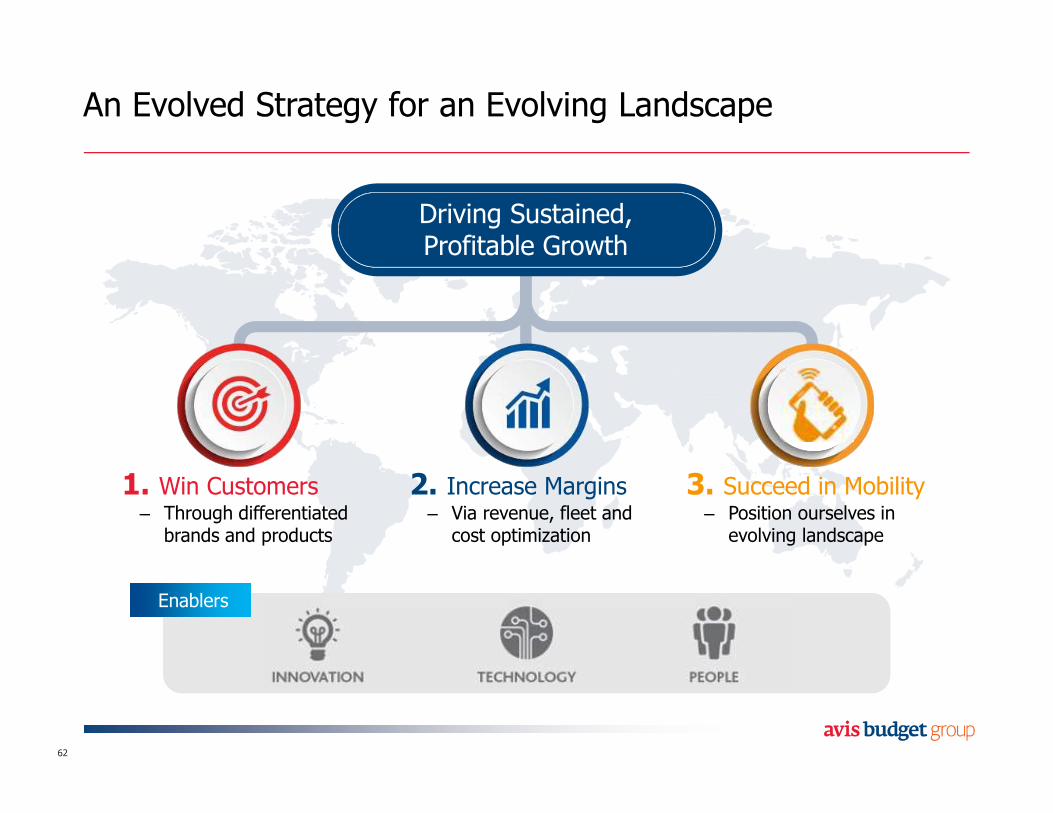
An Evolved Strategy for an Evolving Landscape
15
1. Win Customers– Through differentiatedbrands and products
2. Increase Margins– Via revenue, fleet and cost optimization
EnablersEnablers
Driving Sustained,Profitable Growth
3. Succeed in Mobility– Position ourselves in evolving landscape
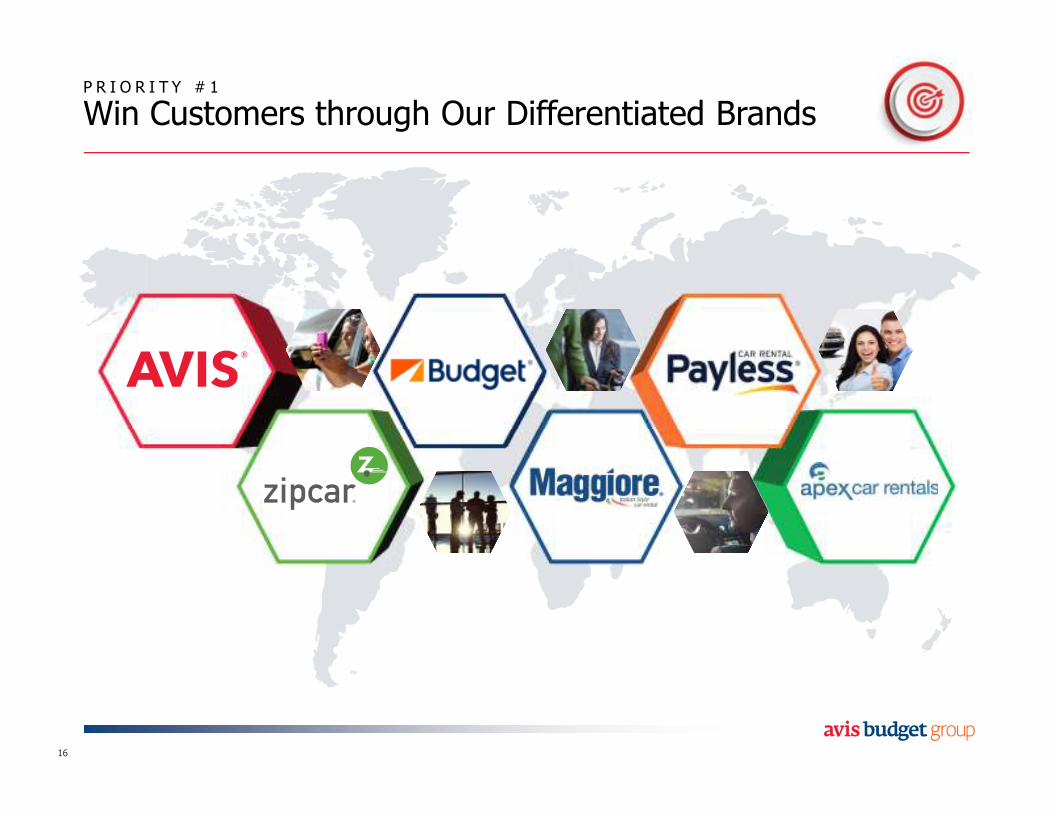
P R I O R I T Y # 1
Win Customers through Our Differentiated Brands
16
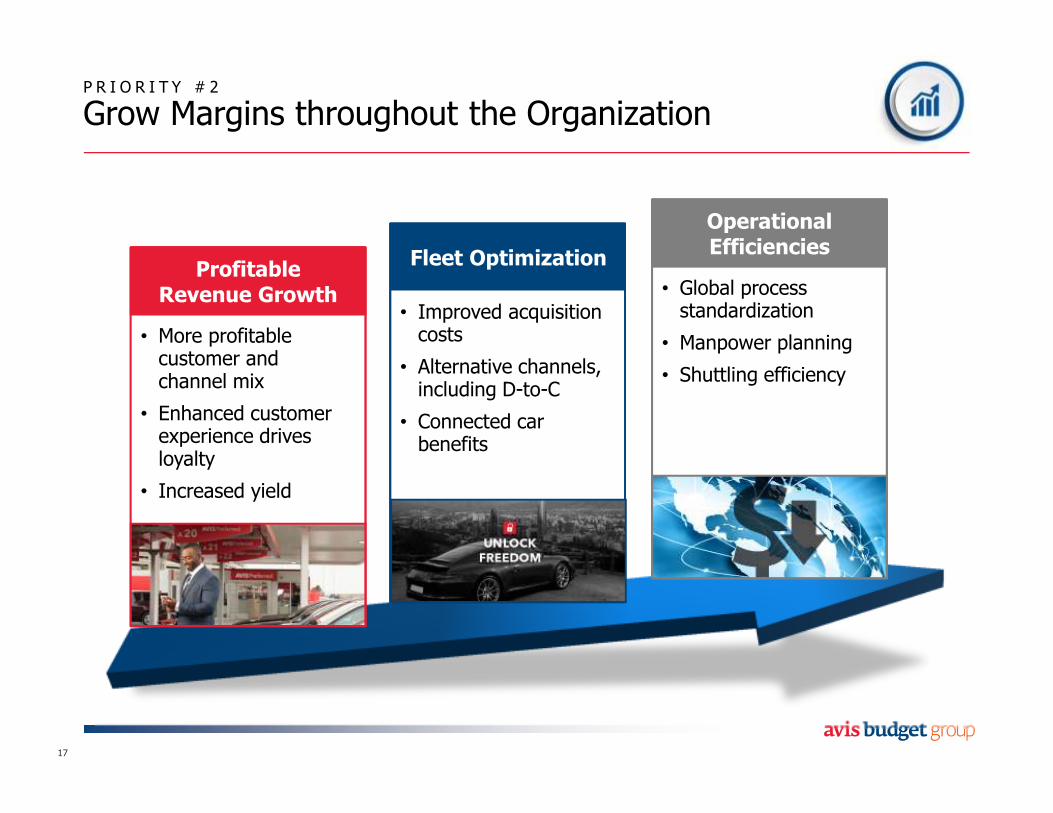
P R I O R I T Y # 2
Grow Margins throughout the Organization
17
• Global process standardization
• Manpower planning
• Shuttling efficiency
Operational Efficiencies
• Improved acquisition costs
• Alternative channels, including D-to-C
• Connected car benefits
Fleet Optimization
• More profitable customer and channel mix
• Enhanced customer experience drives loyalty
• Increased yield
ProfitableRevenue Growth
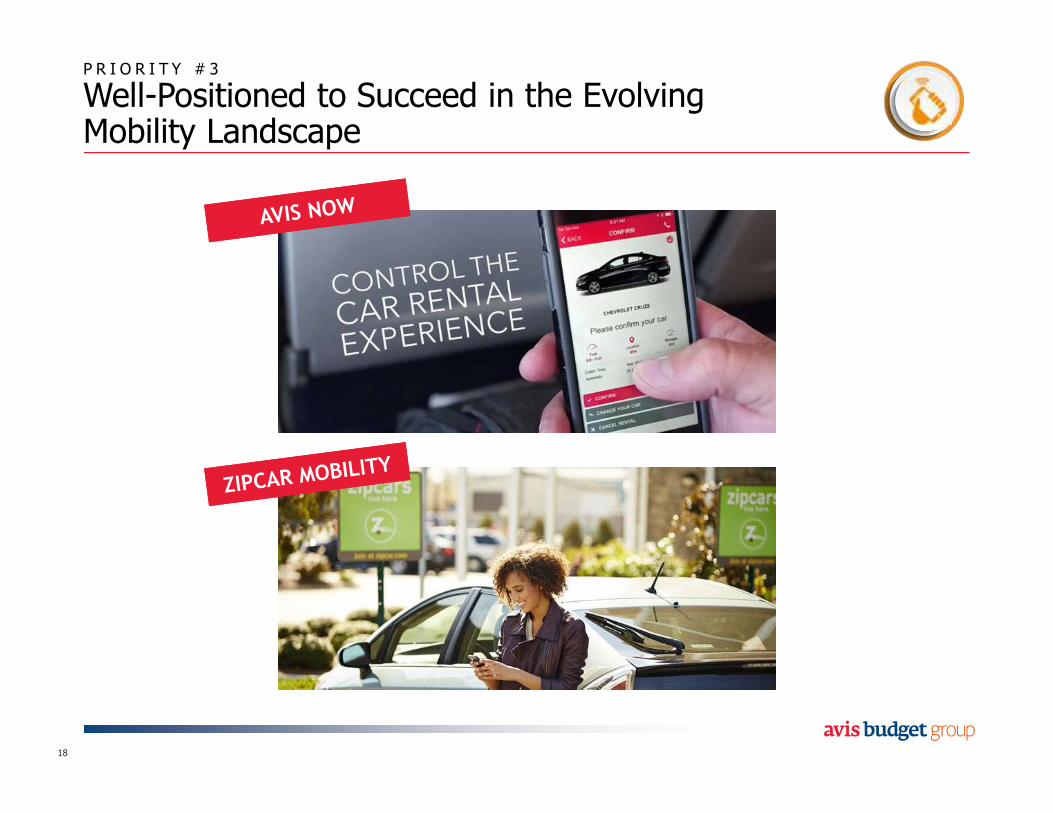
P R I O R I T Y # 3
Well-Positioned to Succeed in the Evolving Mobility Landscape
18
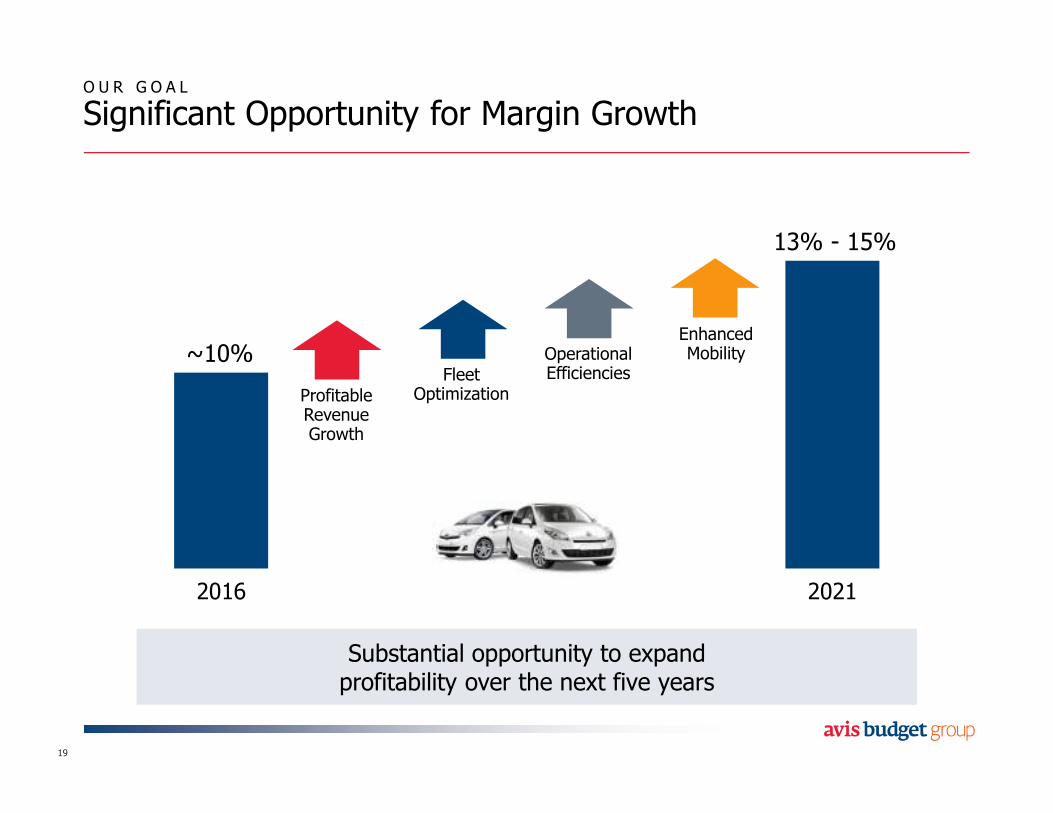
O U R G O A L
Significant Opportunity for Margin Growth
19
2016 2021
~10%
13% - 15%
Substantial opportunity to expandprofitability over the next five years Substantial opportunity to expandprofitability over the next five years
Fleet Optimization
Operational Efficiencies
Enhanced Mobility
Profitable Revenue Growth
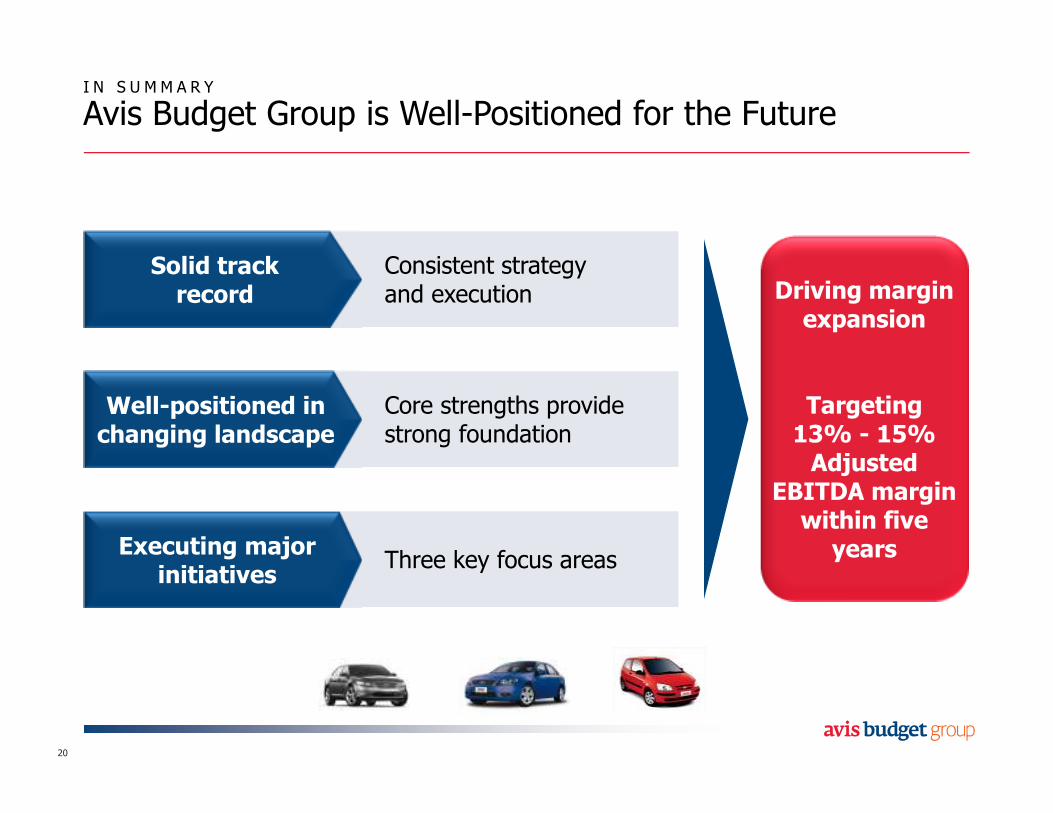
I N S U M M A R Y
Avis Budget Group is Well-Positioned for the Future
20
Solid trackrecord
Well-positioned in changing landscape
Executing major initiatives
Consistent strategy and execution
Core strengths provide strong foundation
Three key focus areas
Driving margin expansion
Targeting 13% - 15% Adjusted
EBITDA margin within five
years

Scott Deaver
Chief Marketing Officer
Agenda
The Evolving Mobility Landscape
Well-Positioned for the Future
Key Competitive Advantages
Leveraging Our Leading Global Brands
22
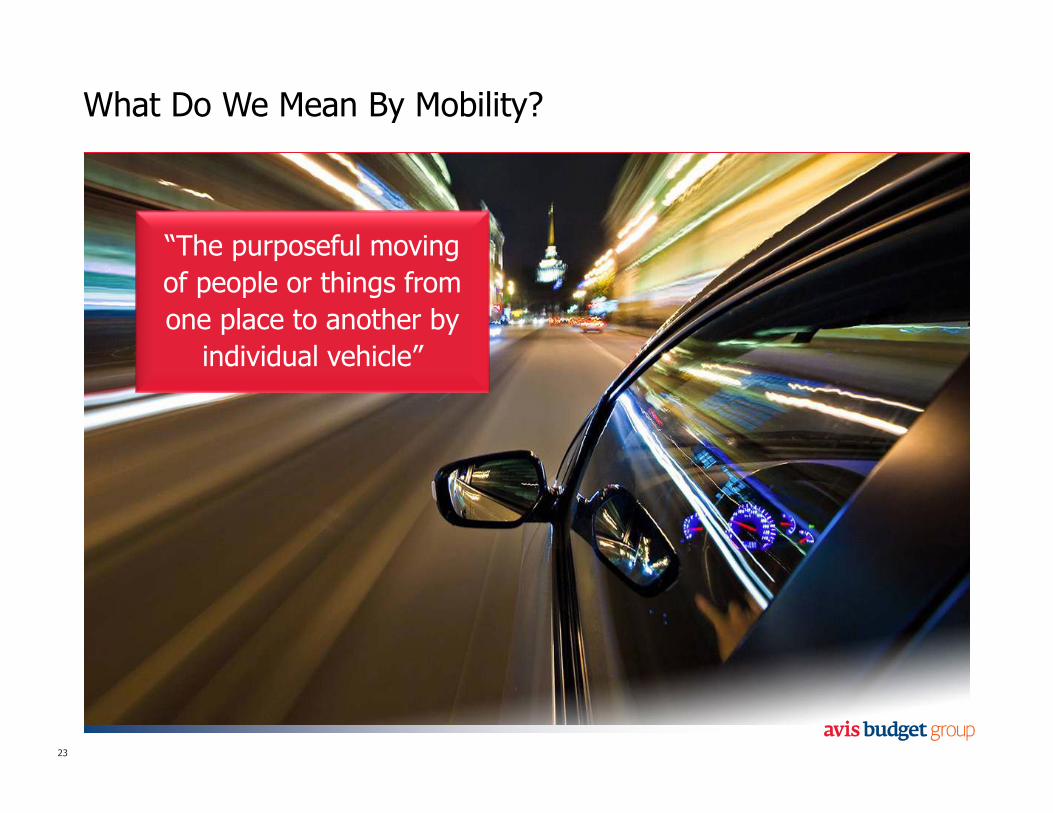
What Do We Mean By Mobility?
23
“The purposeful moving
of people or things from
one place to another by
individual vehicle”
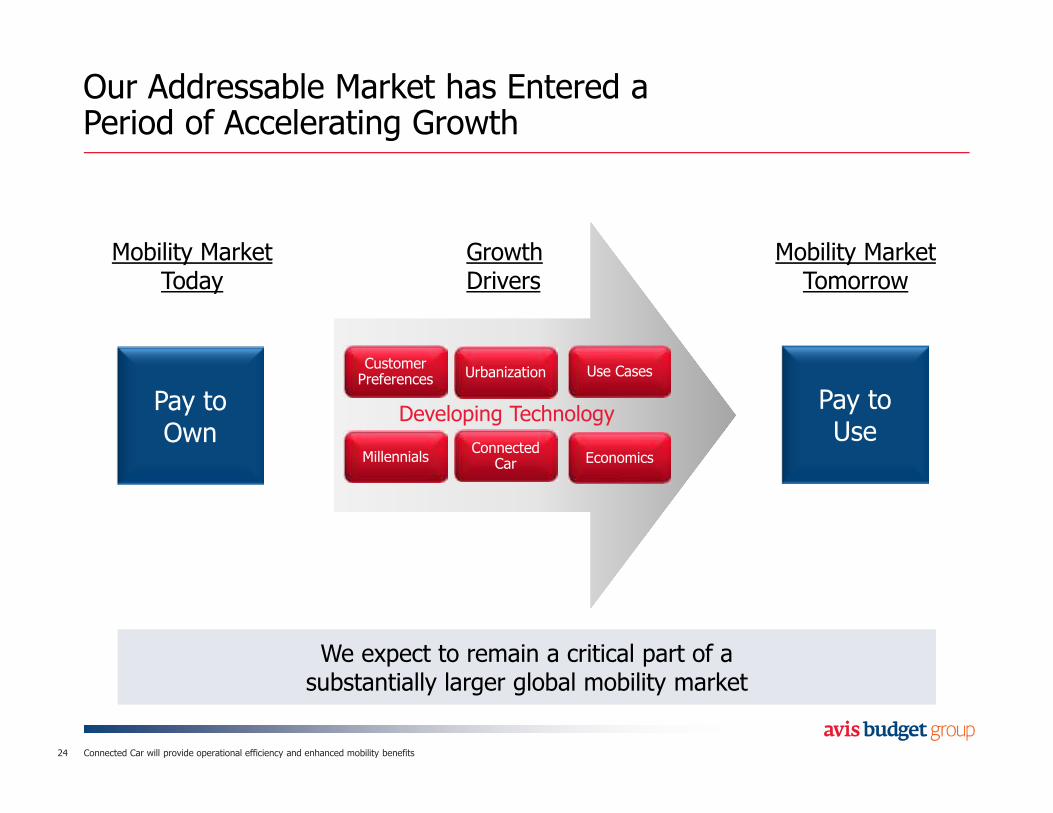
Our Addressable Market has Entered a Period of Accelerating Growth
24
Pay toOwn
Mobility MarketToday
Mobility MarketTomorrow
We expect to remain a critical part of a substantially larger global mobility marketWe expect to remain a critical part of a substantially larger global mobility market
Developing Technology
GrowthDrivers
Customer Preferences
Millennials
Urbanization
Connected Car
Use Cases
Economics
Pay toUse
Connected Car will provide operational efficiency and enhanced mobility benefits
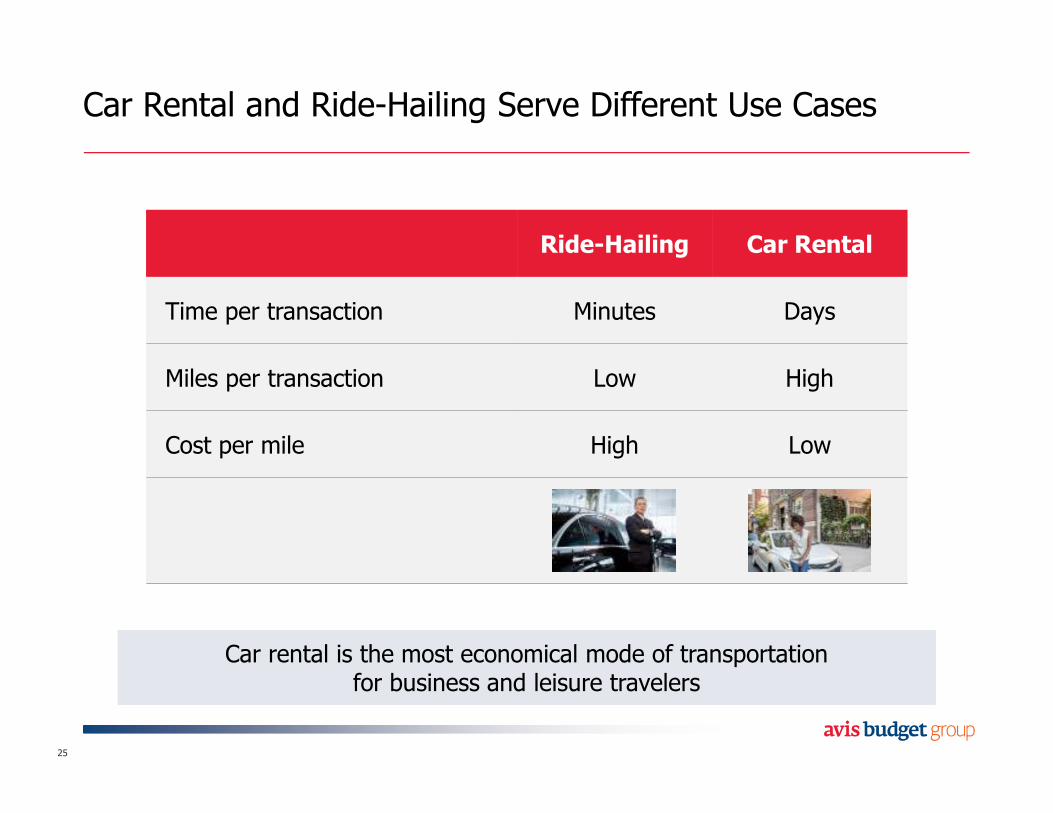
Ride-Hailing Car Rental
Time per transaction Minutes Days
Miles per transaction Low High
Cost per mile High Low
Car Rental and Ride-Hailing Serve Different Use Cases
25
Car rental is the most economical mode of transportation for business and leisure travelers
Car rental is the most economical mode of transportation for business and leisure travelers
Agenda
The Evolving Mobility Landscape
Well-Positioned for the Future
Key Competitive Advantages
Leveraging Our Leading Global Brands
26
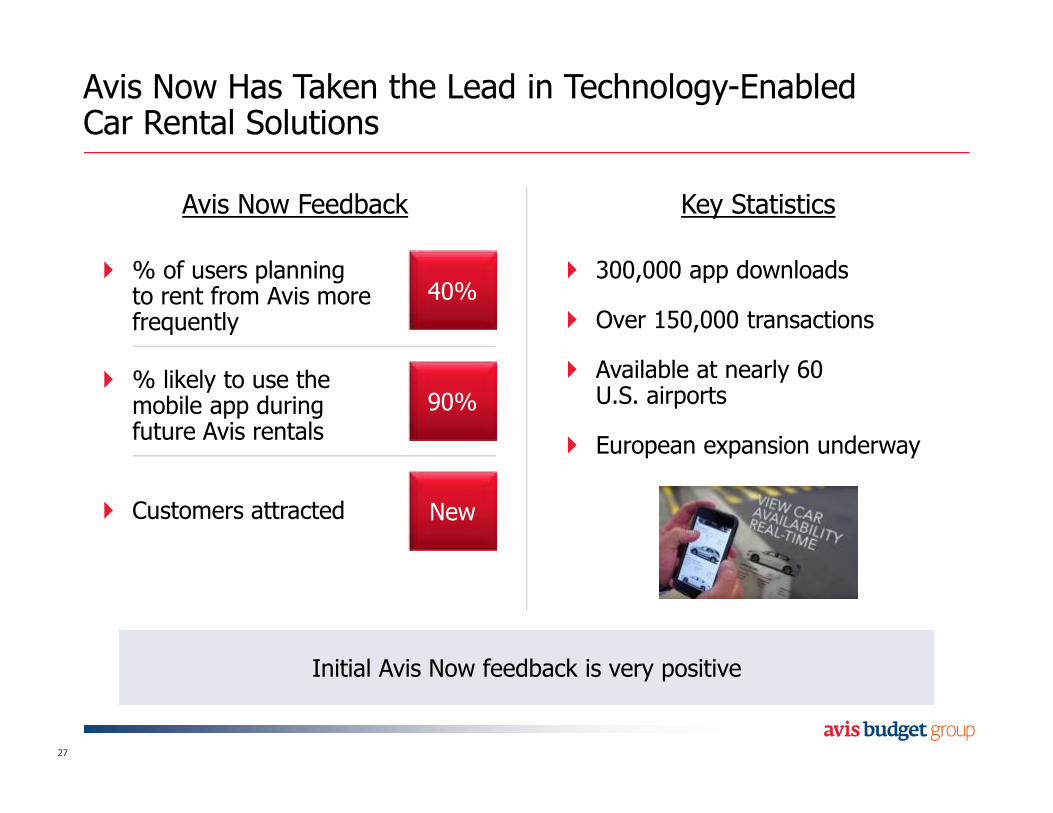
Avis Now Has Taken the Lead in Technology-Enabled Car Rental Solutions
27
Avis Now Feedback
� % of users planning to rent from Avis more frequently
� % likely to use the mobile app during future Avis rentals
� Customers attracted
� 300,000 app downloads
� Over 150,000 transactions
� Available at nearly 60 U.S. airports
� European expansion underway
Key Statistics
40%
90%
New
Initial Avis Now feedback is very positiveInitial Avis Now feedback is very positive
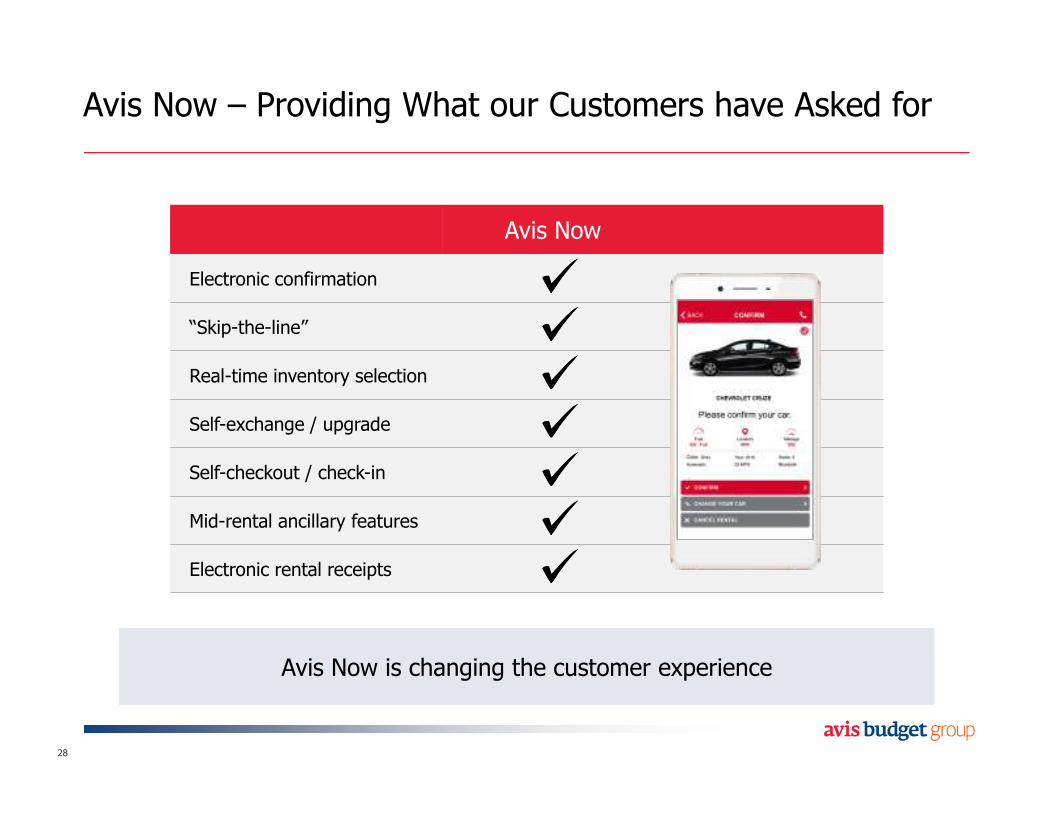
Avis Now – Providing What our Customers have Asked for
28
Avis Now
Electronic confirmation
“Skip-the-line”
Real-time inventory selection
Self-exchange / upgrade
Self-checkout / check-in
Mid-rental ancillary features
Electronic rental receipts
Avis Now is changing the customer experienceAvis Now is changing the customer experience
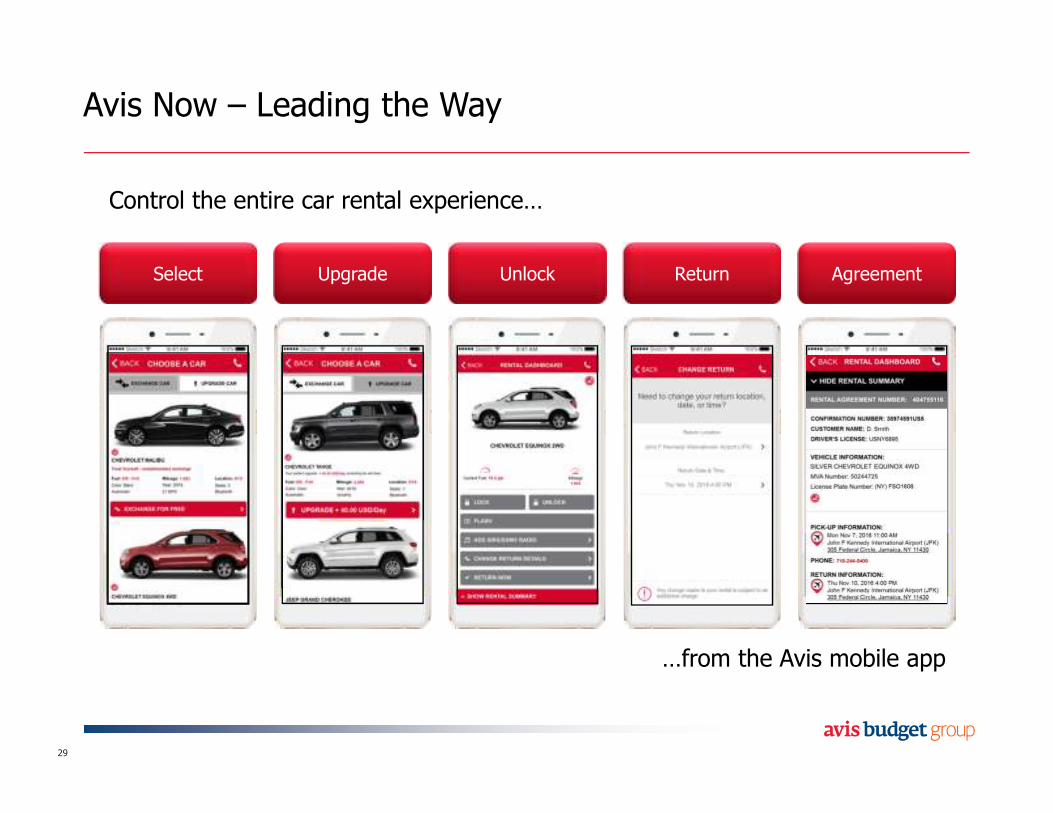
Avis Now – Leading the Way
29
Control the entire car rental experience…
…from the Avis mobile app
Select Upgrade Unlock Return Agreement
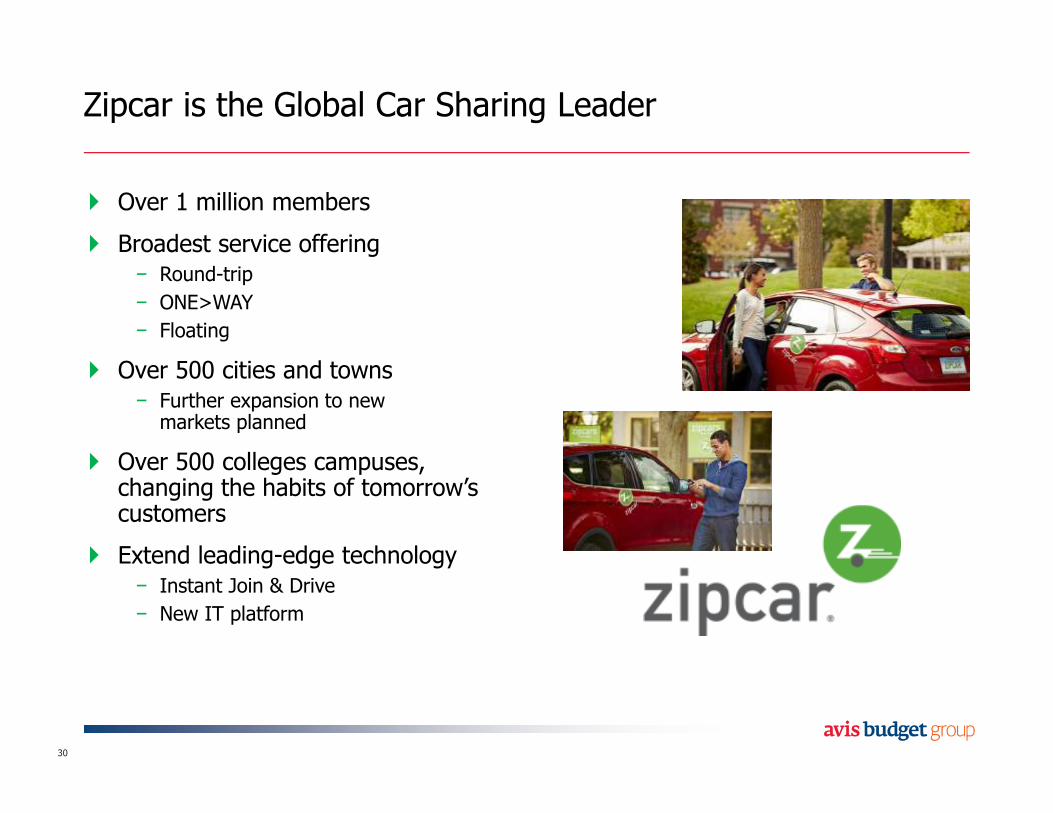
Zipcar is the Global Car Sharing Leader
30
� Over 1 million members
� Broadest service offering− Round-trip
− ONE>WAY
− Floating
� Over 500 cities and towns− Further expansion to new markets planned
� Over 500 colleges campuses, changing the habits of tomorrow’s customers
� Extend leading-edge technology− Instant Join & Drive
− New IT platform
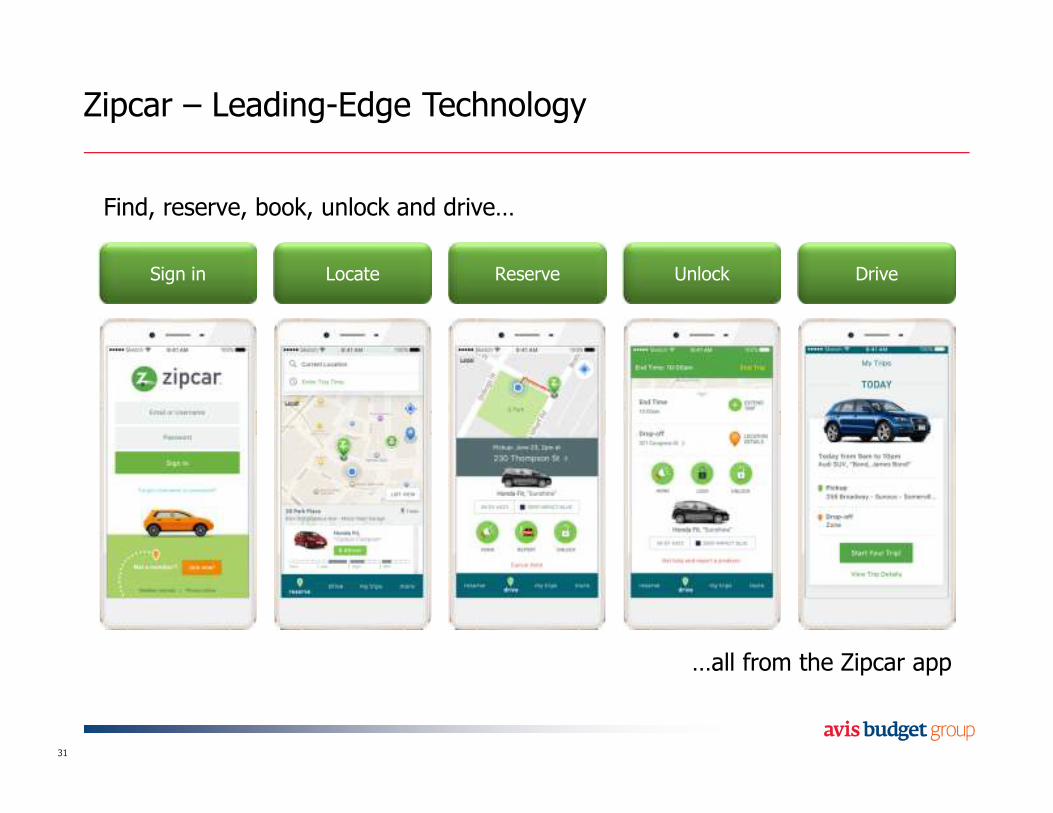
Zipcar – Leading-Edge Technology
31
Find, reserve, book, unlock and drive…
…all from the Zipcar app
Sign in Locate Reserve Unlock Drive
Agenda
The Evolving Mobility Landscape
Well-Positioned for the Future
Key Competitive Advantages
Leveraging Our Leading Global Brands
32

An Evolved Strategy for an Evolving Landscape
33
1. Win Customers– Through differentiatedbrands and products
2. Increase Margins– Via revenue, fleet and cost optimization
EnablersEnablers
Driving Sustained,Profitable Growth
3. Succeed in Mobility– Position ourselves in evolving landscape
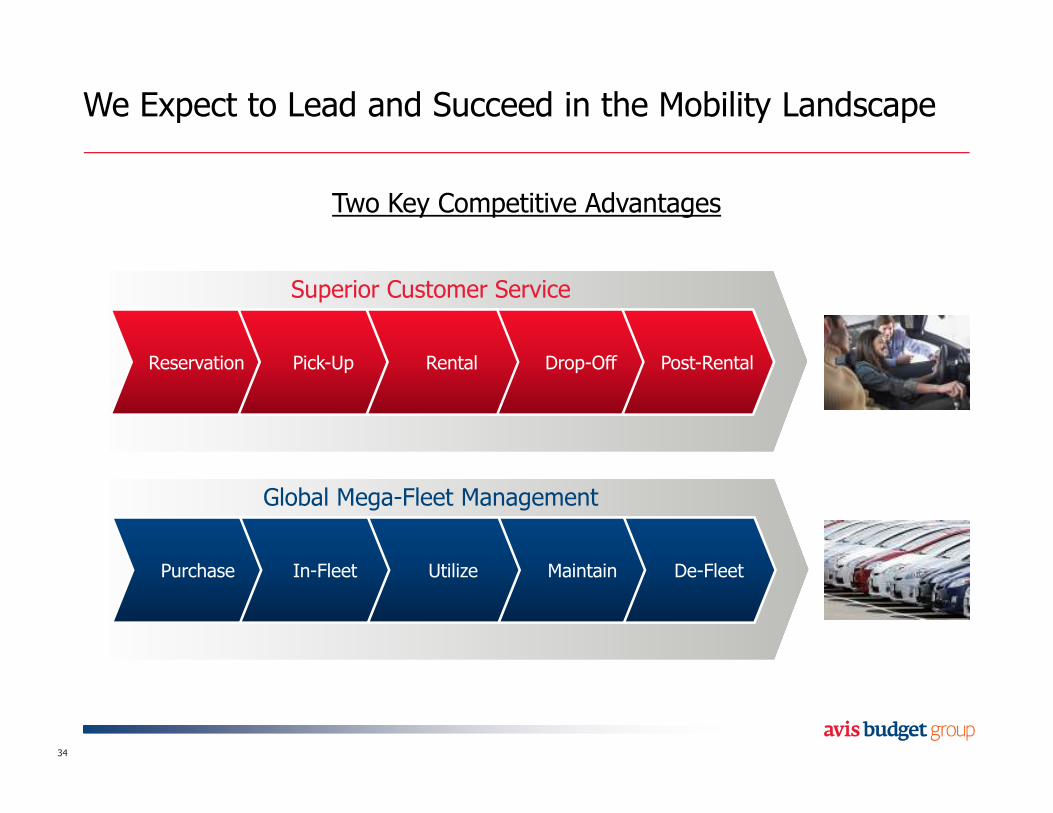
We Expect to Lead and Succeed in the Mobility Landscape
34
Reservation Pick-Up Rental Drop-Off Post-Rental
Superior Customer Service
Purchase In-Fleet Utilize Maintain De-Fleet
Global Mega-Fleet Management
Two Key Competitive Advantages
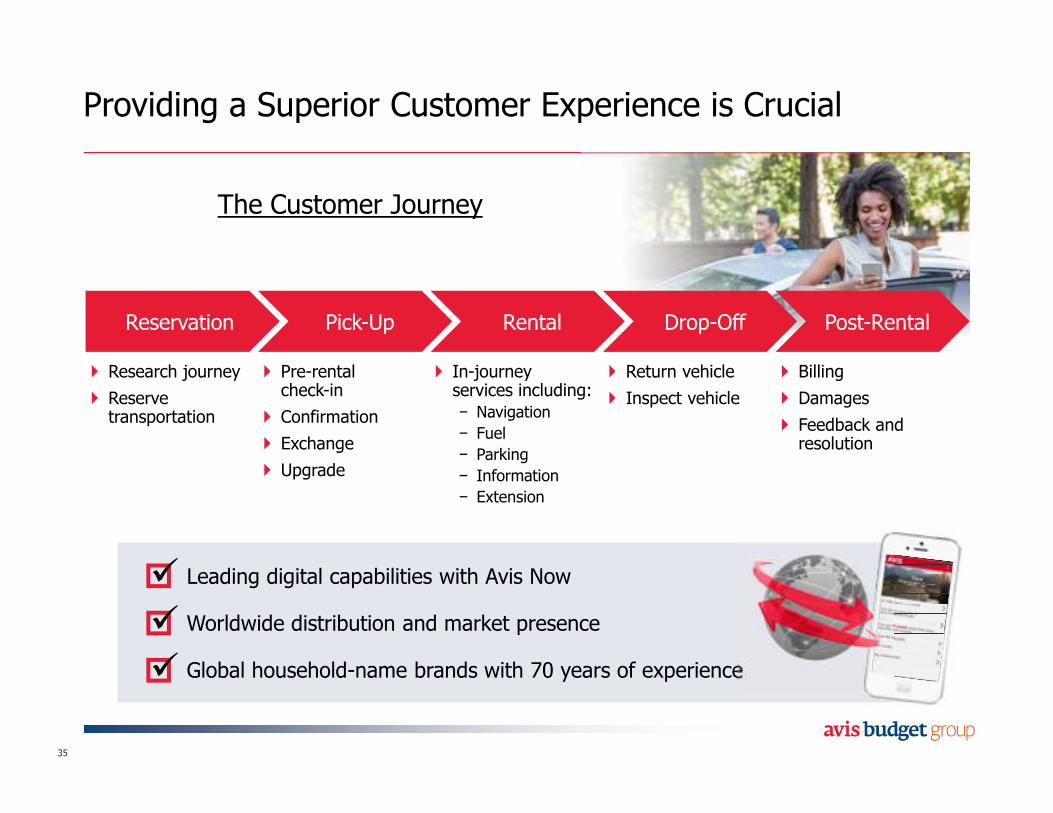
Providing a Superior Customer Experience is Crucial
35
Reservation Pick-Up Rental Drop-Off Post-Rental
� Research journey
� Reserve transportation
� Pre-rental check-in
� Confirmation
� Exchange
� Upgrade
� In-journey services including:
− Navigation
− Fuel
− Parking
− Information
− Extension
� Return vehicle
� Inspect vehicle
� Billing
� Damages
� Feedback and resolution
Leading digital capabilities with Avis Now
Worldwide distribution and market presence
Global household-name brands with 70 years of experience
The Customer Journey
�
�
�
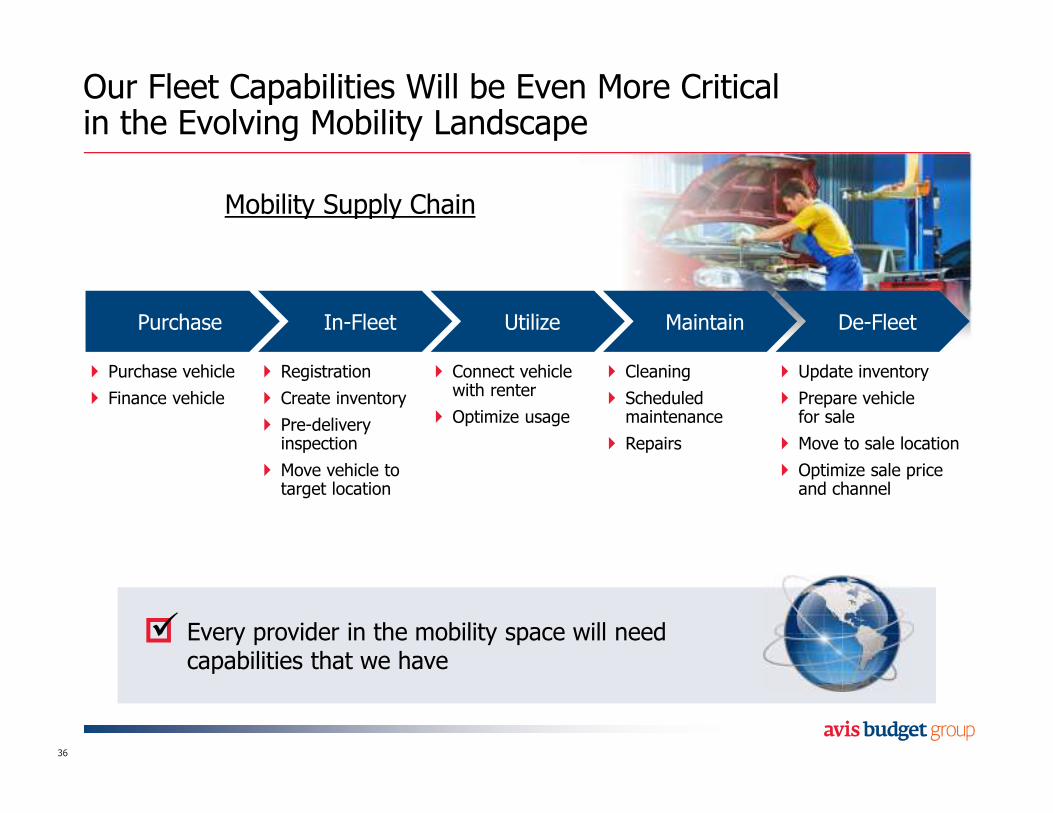
Our Fleet Capabilities Will be Even More Critical in the Evolving Mobility Landscape
36
� Purchase vehicle
� Finance vehicle
� Registration
� Create inventory
� Pre-delivery inspection
� Move vehicle to target location
� Connect vehicle with renter
� Optimize usage
� Cleaning
� Scheduled maintenance
� Repairs
� Update inventory
� Prepare vehicle for sale
� Move to sale location
� Optimize sale price and channel
Every provider in the mobility space will need capabilities that we haveEvery provider in the mobility space will need capabilities that we have
Purchase In-Fleet Utilize Maintain De-Fleet
�
Mobility Supply Chain
Agenda
The Evolving Mobility Landscape
Well-Positioned for the Future
Key Competitive Advantages
Leveraging Our Leading Global Brands
37
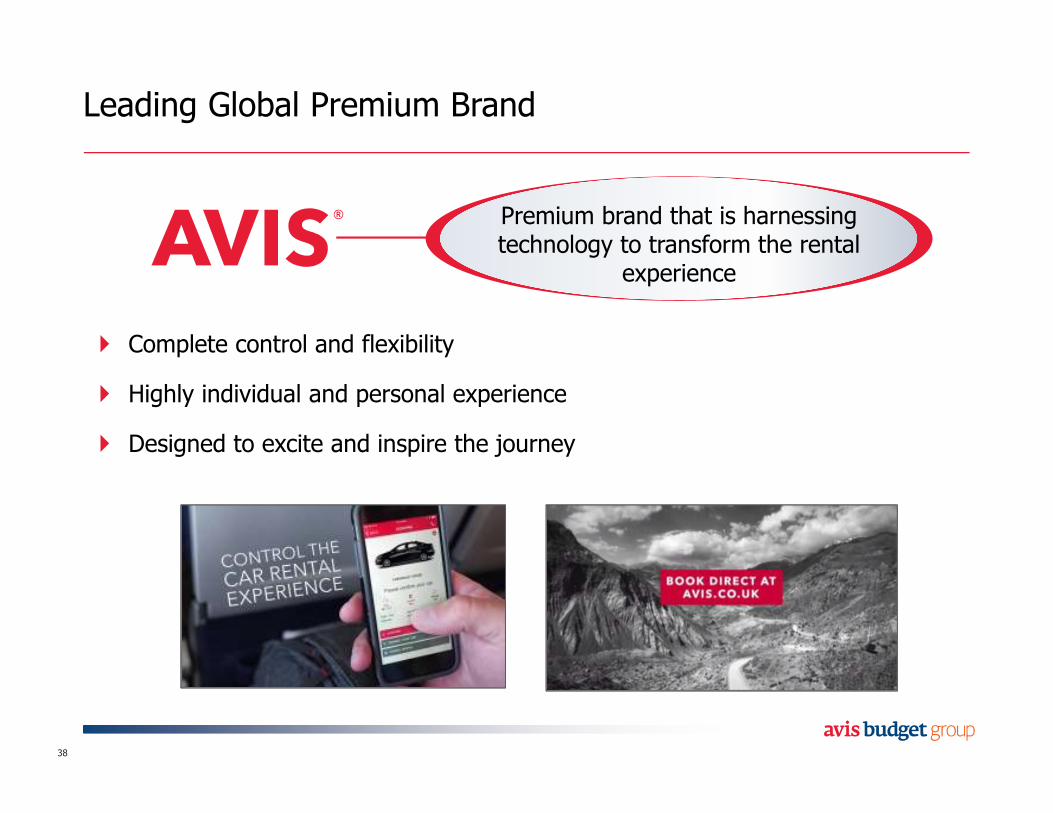
Leading Global Premium Brand
38
� Complete control and flexibility
� Highly individual and personal experience
� Designed to excite and inspire the journey
Premium brand that is harnessing technology to transform the rental
experience
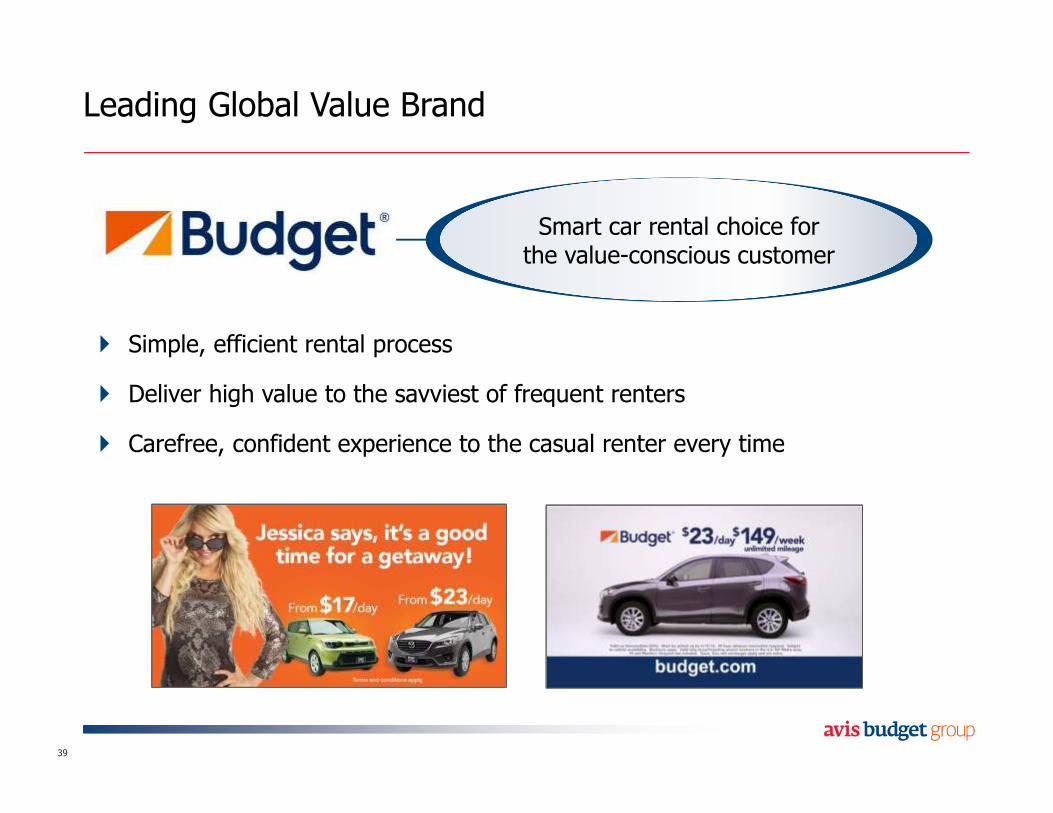
Leading Global Value Brand
39
� Simple, efficient rental process
� Deliver high value to the savviest of frequent renters
� Carefree, confident experience to the casual renter every time
Smart car rental choice forthe value-conscious customer
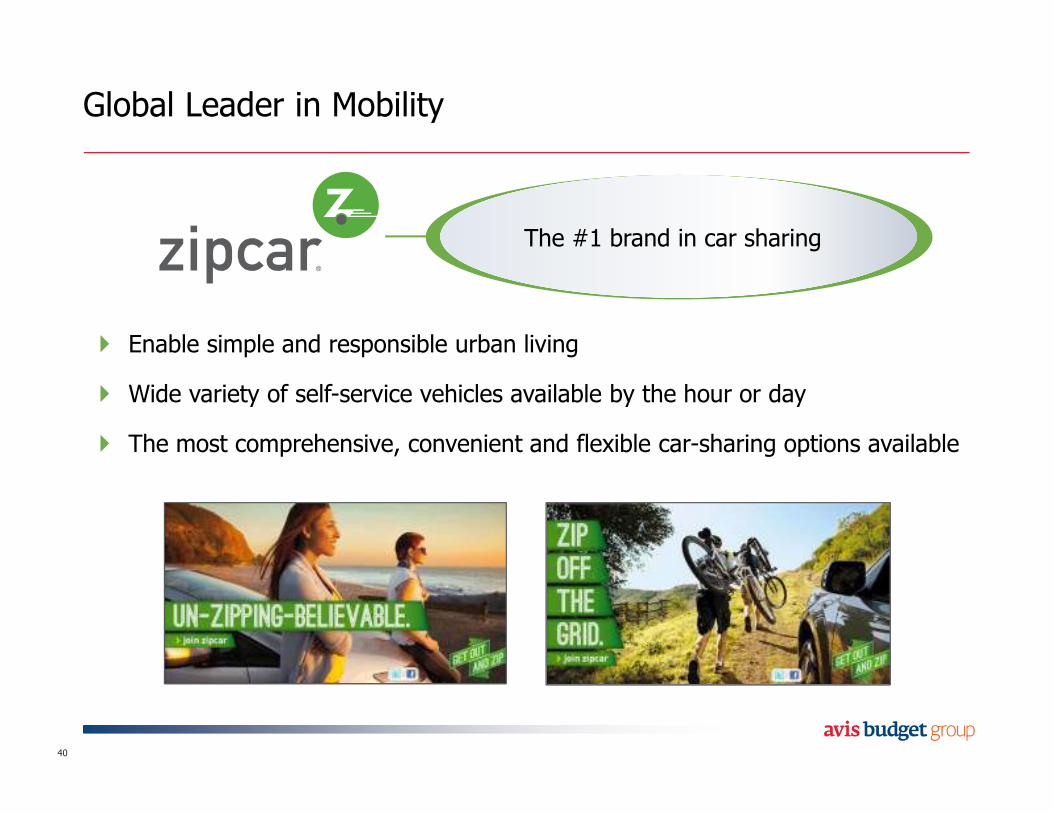
Global Leader in Mobility
40
� Enable simple and responsible urban living
� Wide variety of self-service vehicles available by the hour or day
� The most comprehensive, convenient and flexible car-sharing options available
The #1 brand in car sharing
2016 2021
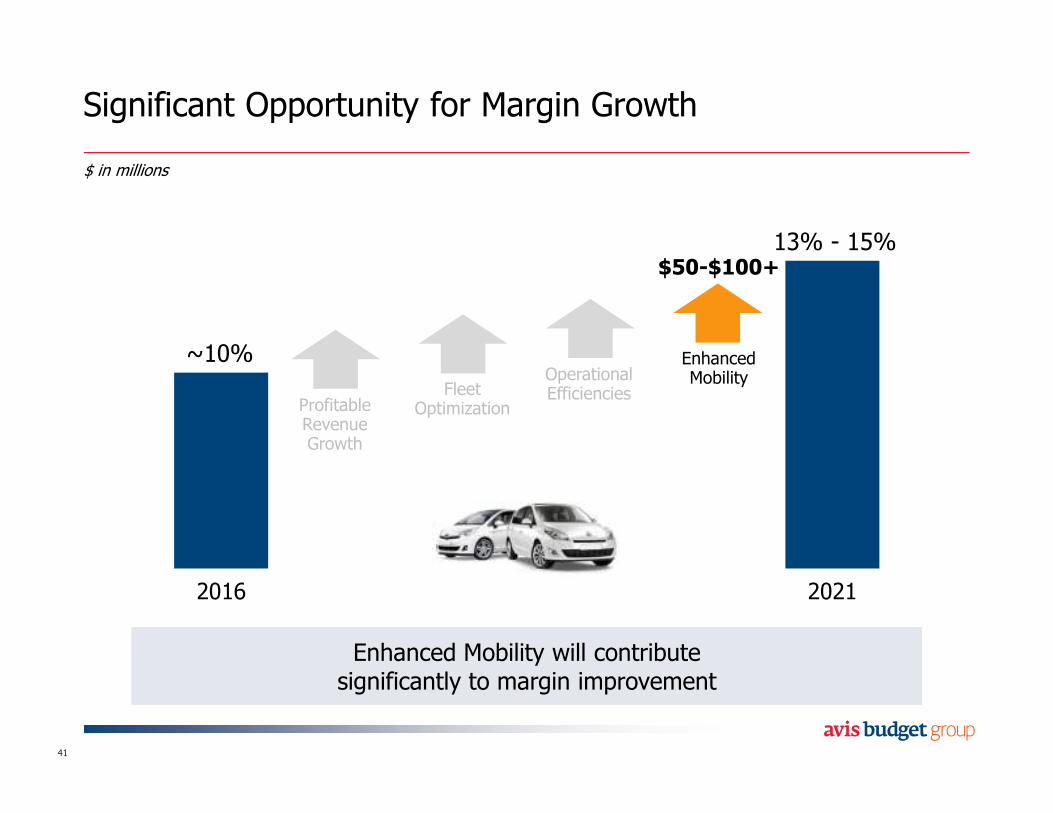
Significant Opportunity for Margin Growth
Enhanced Mobility will contribute significantly to margin improvementEnhanced Mobility will contribute significantly to margin improvement
Fleet Optimization
Operational Efficiencies
Profitable Revenue Growth
Enhanced Mobility
$50-$100+
$ in millions
~10%
13% - 15%
41
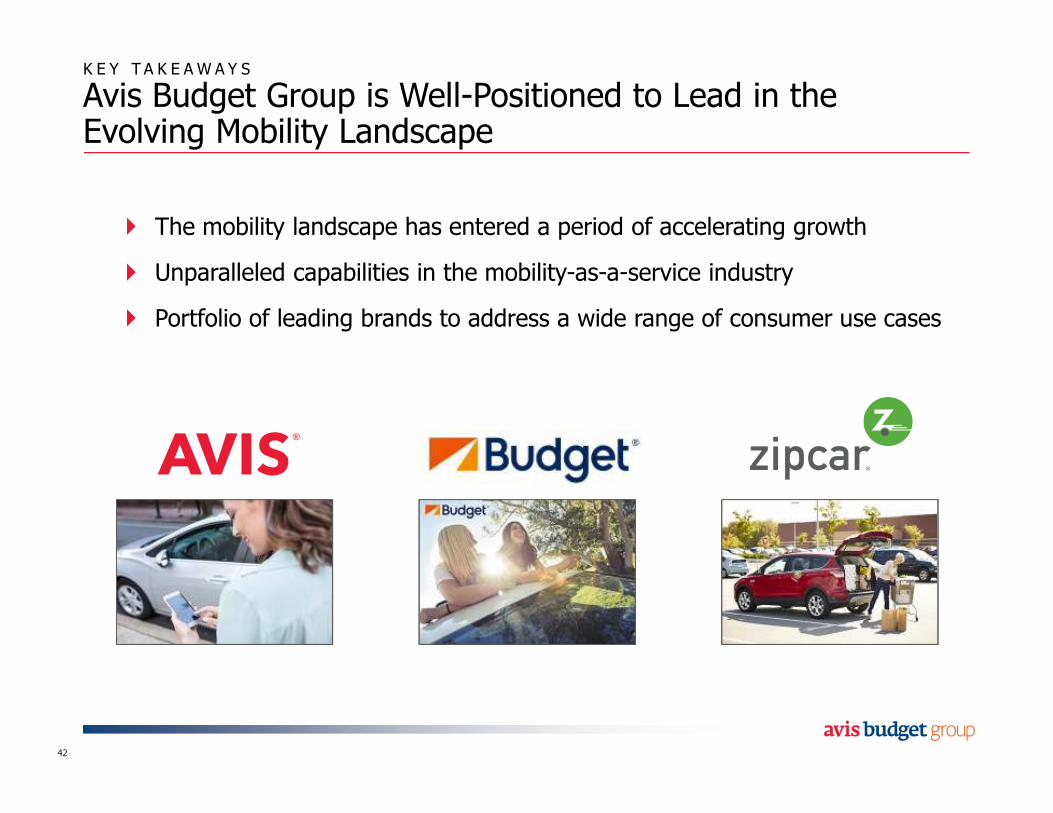
K E Y T A K E A W A Y S
Avis Budget Group is Well-Positioned to Lead in the Evolving Mobility Landscape
� The mobility landscape has entered a period of accelerating growth
� Unparalleled capabilities in the mobility-as-a-service industry
� Portfolio of leading brands to address a wide range of consumer use cases
42

Mark Servodidio
President, International
Agenda
The International Business Today
Future International Opportunities
Global Revenue Growth
44
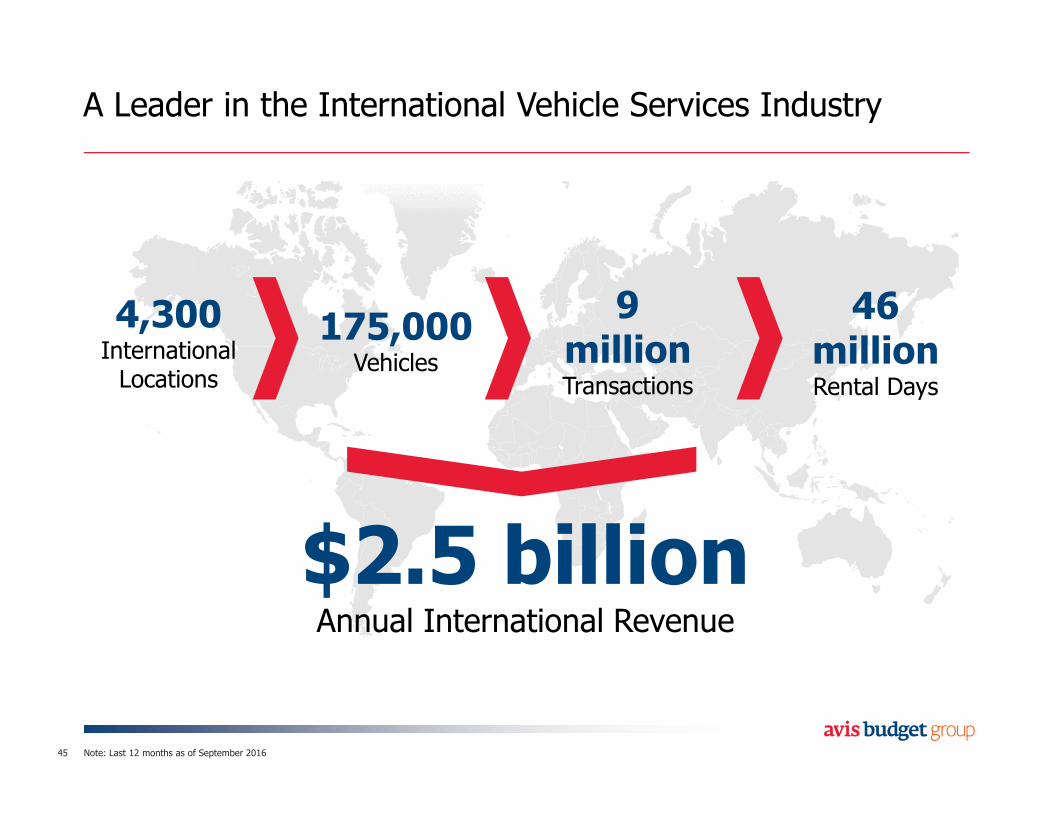
A Leader in the International Vehicle Services Industry
45
4,300International Locations
175,000Vehicles
9millionTransactions
46 millionRental Days
$2.5 billionAnnual International Revenue
Note: Last 12 months as of September 2016
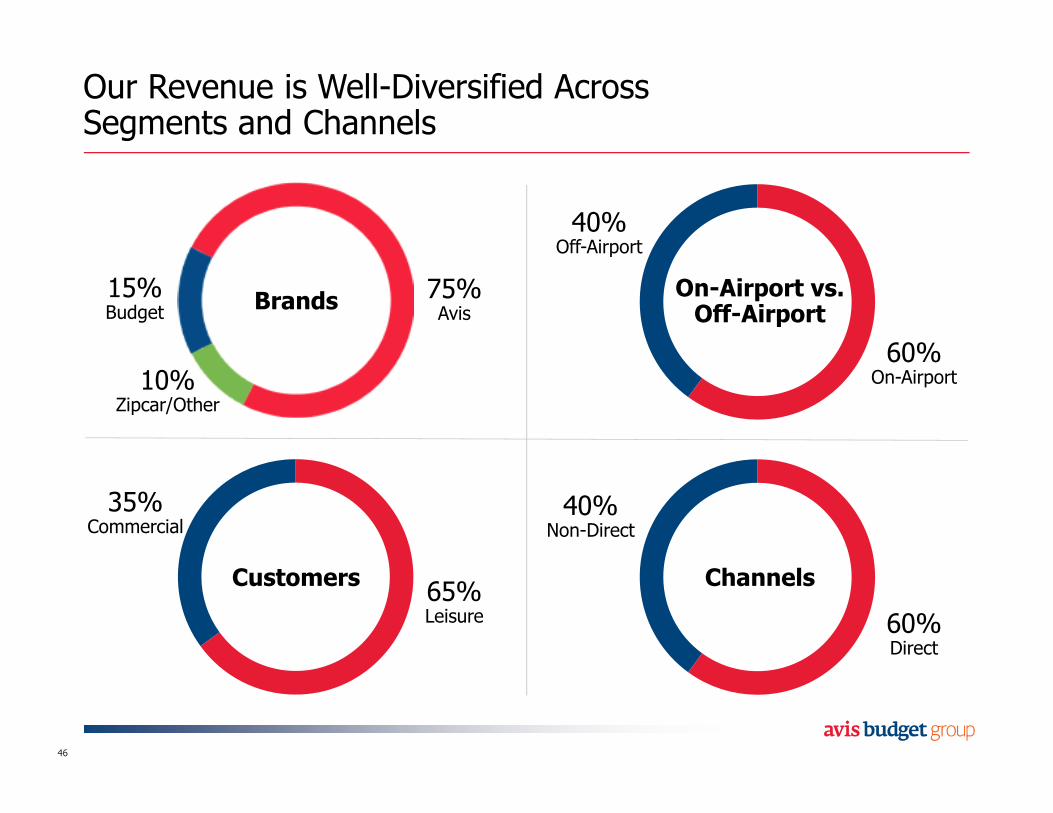
Our Revenue is Well-Diversified Across Segments and Channels
60%On-Airport
BrandsOn-Airport vs. Off-Airport
Customers Channels
40%Off-Airport
60%Direct
40%Non-Direct
65%Leisure
35%Commercial
75%Avis
15%Budget
10%Zipcar/Other
46
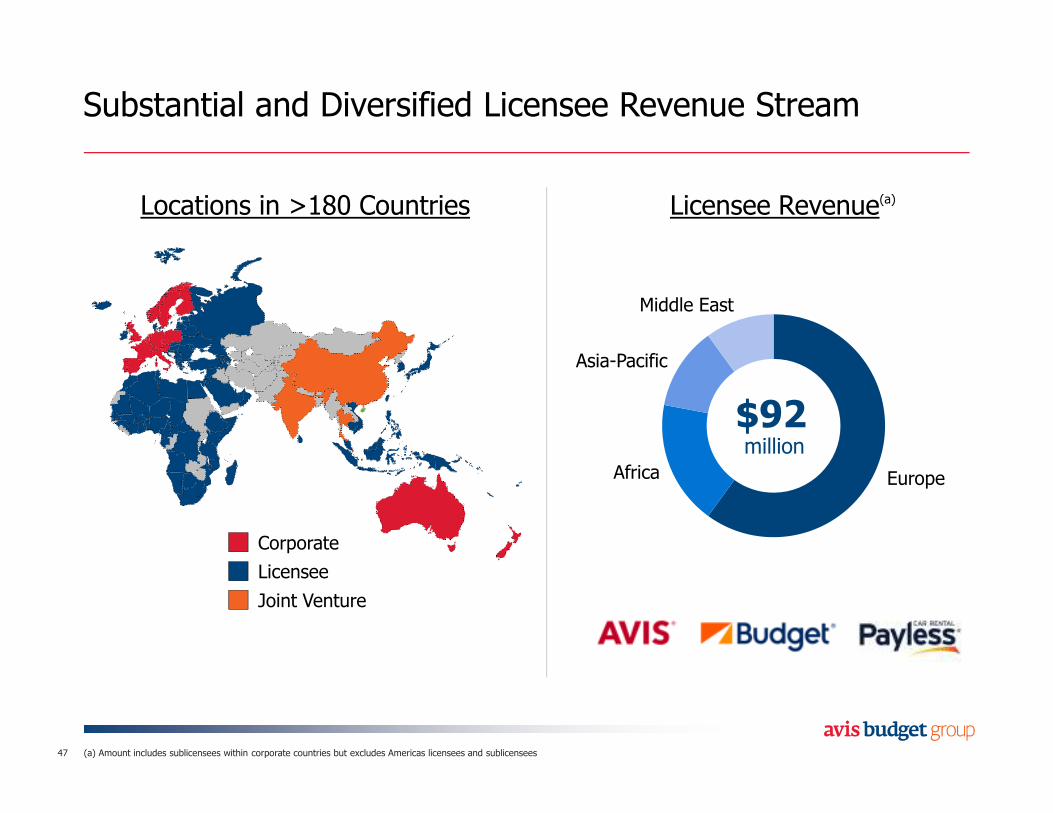
Substantial and Diversified Licensee Revenue Stream
(a) Amount includes sublicensees within corporate countries but excludes Americas licensees and sublicensees47
Europe
Middle East
Corporate
Joint Venture
Licensee
Licensee Revenue(a)
$92million
Locations in >180 Countries
Africa
Asia-Pacific
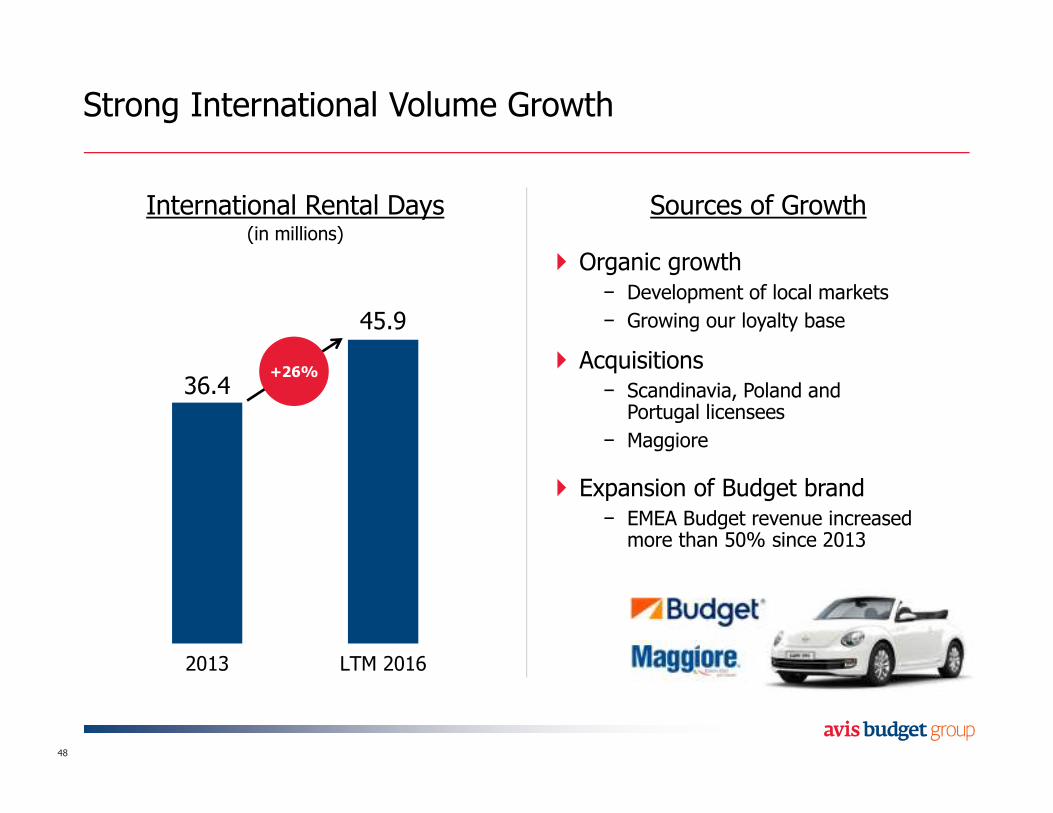
Strong International Volume Growth
48
International Rental Days(in millions)
36.4
45.9
2013 LTM 2016
+26%
Sources of Growth
� Organic growth− Development of local markets
− Growing our loyalty base
� Acquisitions− Scandinavia, Poland and Portugal licensees
− Maggiore
� Expansion of Budget brand− EMEA Budget revenue increased more than 50% since 2013
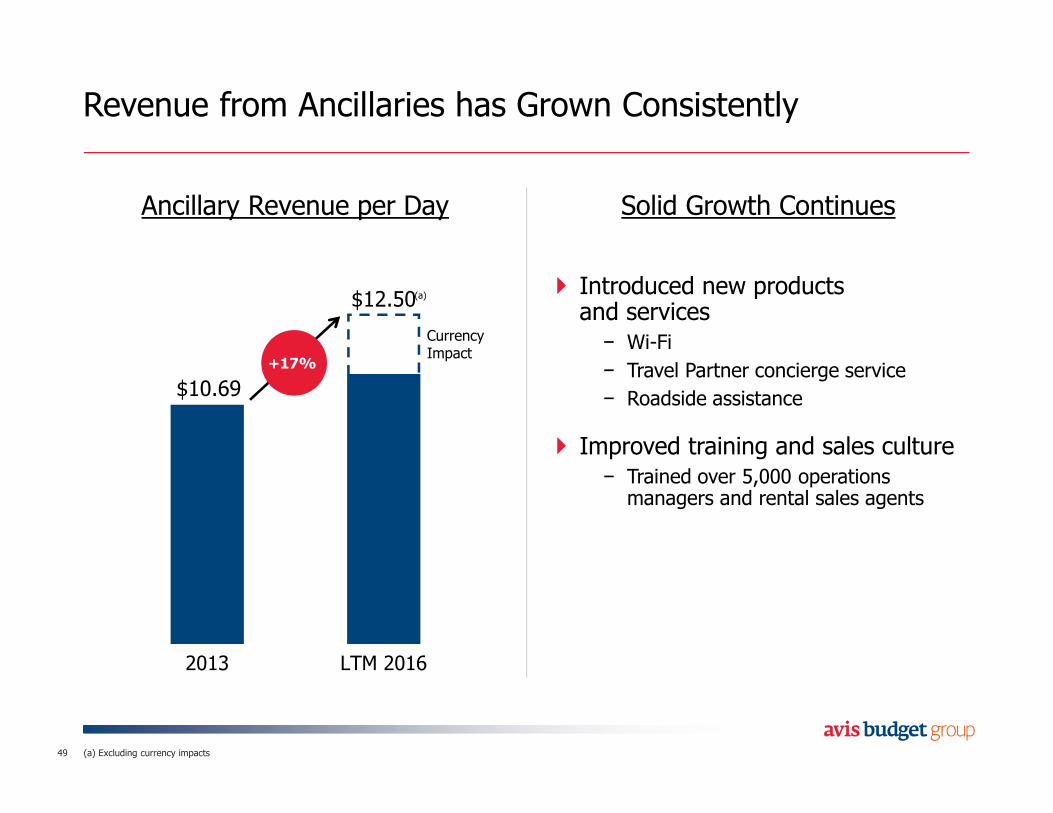
$10.69
$12.50
2013 LTM 2016
Revenue from Ancillaries has Grown Consistently
49
Ancillary Revenue per Day
+17%
Solid Growth Continues
� Introduced new products and services− Wi-Fi
− Travel Partner concierge service
− Roadside assistance
� Improved training and sales culture− Trained over 5,000 operations managers and rental sales agents
Currency Impact
(a)
(a) Excluding currency impacts
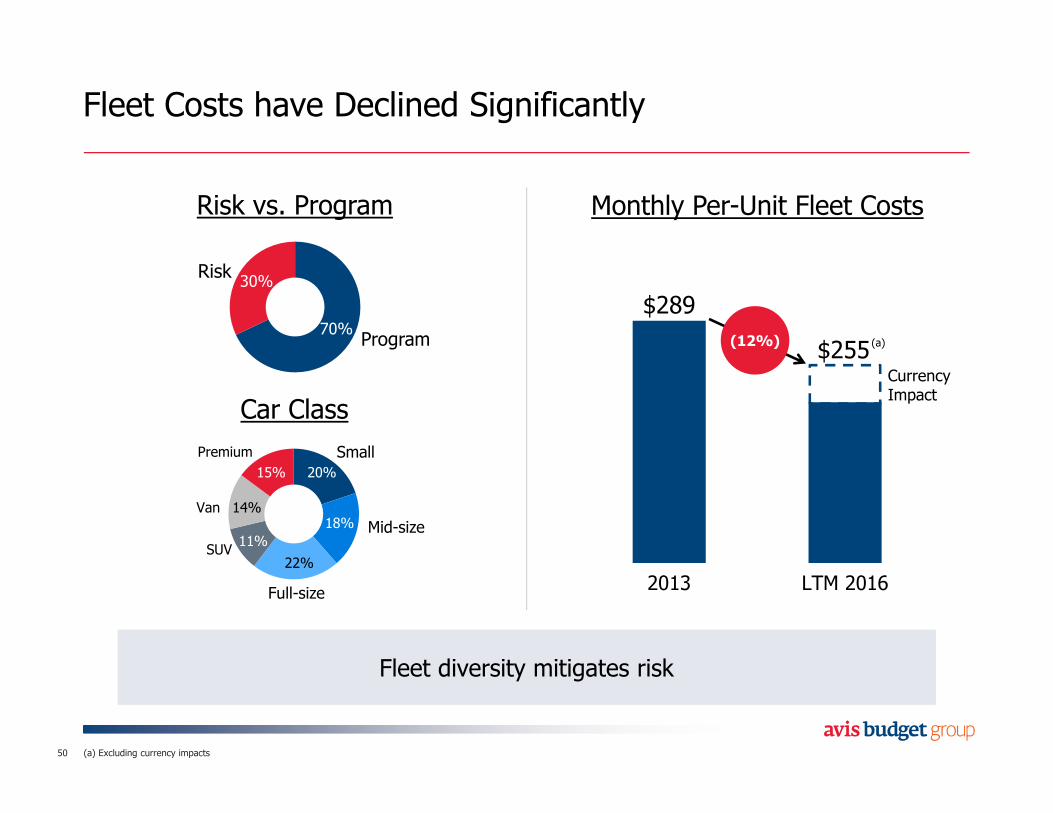
Fleet Costs have Declined Significantly
50
$289
$255
2013 LTM 2016
(12%)
Currency Impact
(a)
(a) Excluding currency impacts
Program
Risk
Car Class
Small
30%
70%
20%
18%
22%
11%
14%
15%
Mid-size
Full-size
SUV
Van
Premium
Risk vs. Program
Fleet diversity mitigates riskFleet diversity mitigates risk
Monthly Per-Unit Fleet Costs
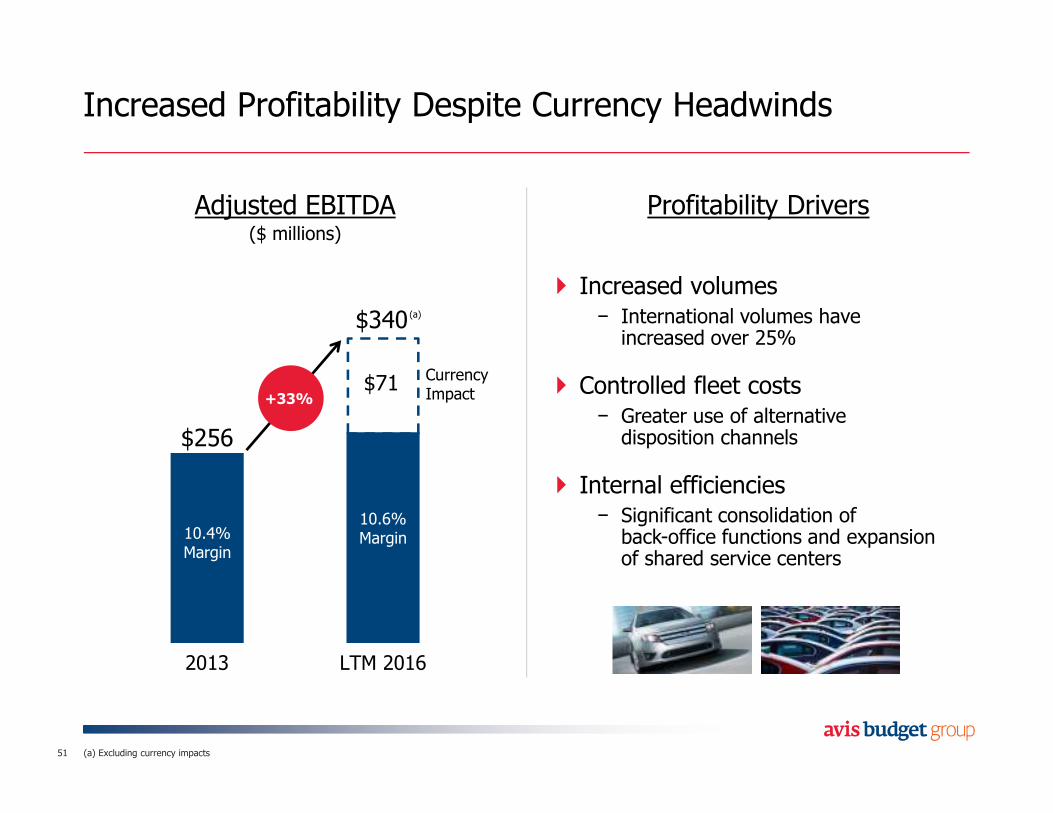
Increased Profitability Despite Currency Headwinds
51
Adjusted EBITDA($ millions)
$256
$340
2013 LTM 2016
$71
Profitability Drivers
� Increased volumes− International volumes have increased over 25%
� Controlled fleet costs− Greater use of alternative disposition channels
� Internal efficiencies− Significant consolidation of back-office functions and expansion of shared service centers
10.4% Margin
10.6% Margin
Currency Impact
(a)
+33%
(a) Excluding currency impacts
Agenda
The International Business Today
Future International Opportunities
Global Revenue Growth
52
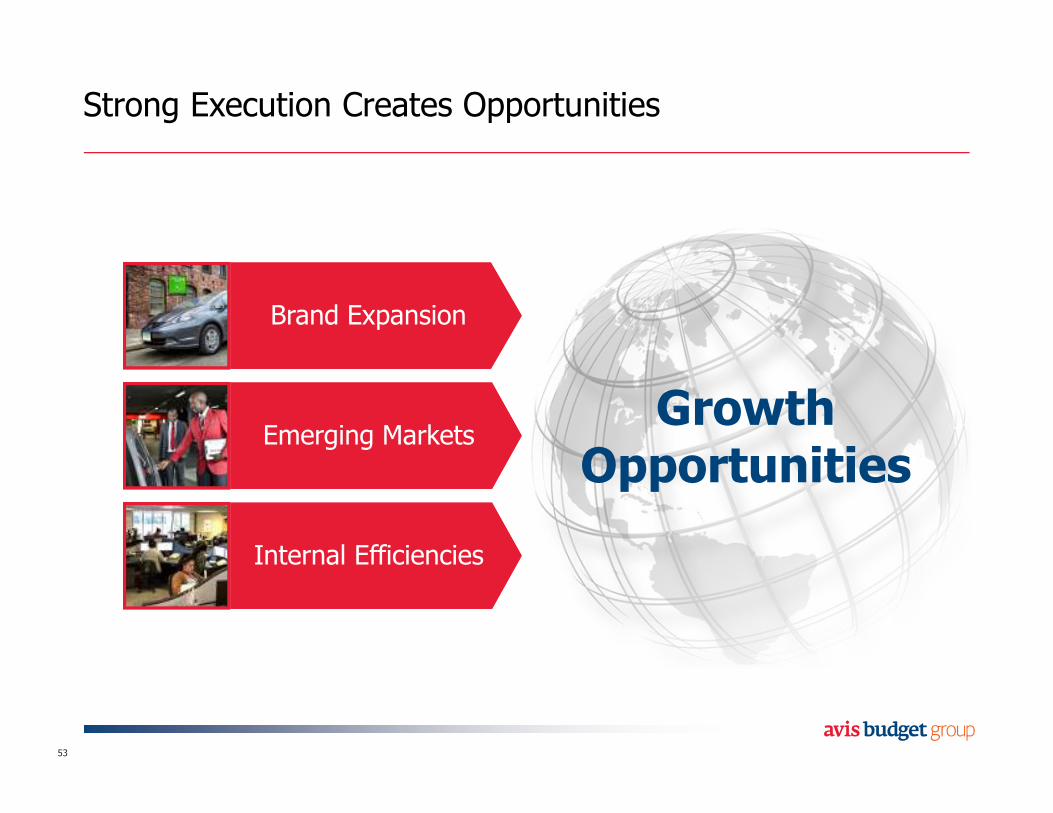
Brand Expansion
Emerging Markets
Internal Efficiencies
Strong Execution Creates Opportunities
53
GrowthOpportunities
B R A N D E X P A N S I O N
Expansion of Existing Brands Remains an Opportunity
� Redesigned and expanded loyalty program
� Budget brand has strong penetration in Pacific region but remains under-represented in Europe
� Opportunity for Apex expansion in Asia-Pacific region
� Maggiore and France Cars offer complementary revenue streams
54
B R A N D E X P A N S I O N
Significant Opportunity for Zipcar Expansion
� Zipcar now available in six international markets− Future expansions planned across EMEA and Asia-Pacific
− Licensee model
� New Zipcar product offerings will open access to more potential expansion− Pilot of driver offering with Uber Marketplace underway
� Growth in existing markets through continued evolution of member value proposition and product offering
� New markets selected with a focus on clear path to profitability
55
E M E R G I N G M A R K E T S
New Routes to Participate in the Asia Mobility Market
� Strategic partnership agreement signed with Didi Chuxing for outbound car rental
� Didi Chuxing is the world’s largest ride-hailing service in China with ~300 million registered users
� Complements Avis Budget Group’s domestic presence in the growing Chinese market and strategically important Asia-Pacific region
� We are uniquely positioned to deliver this based on the most developed network globally
56
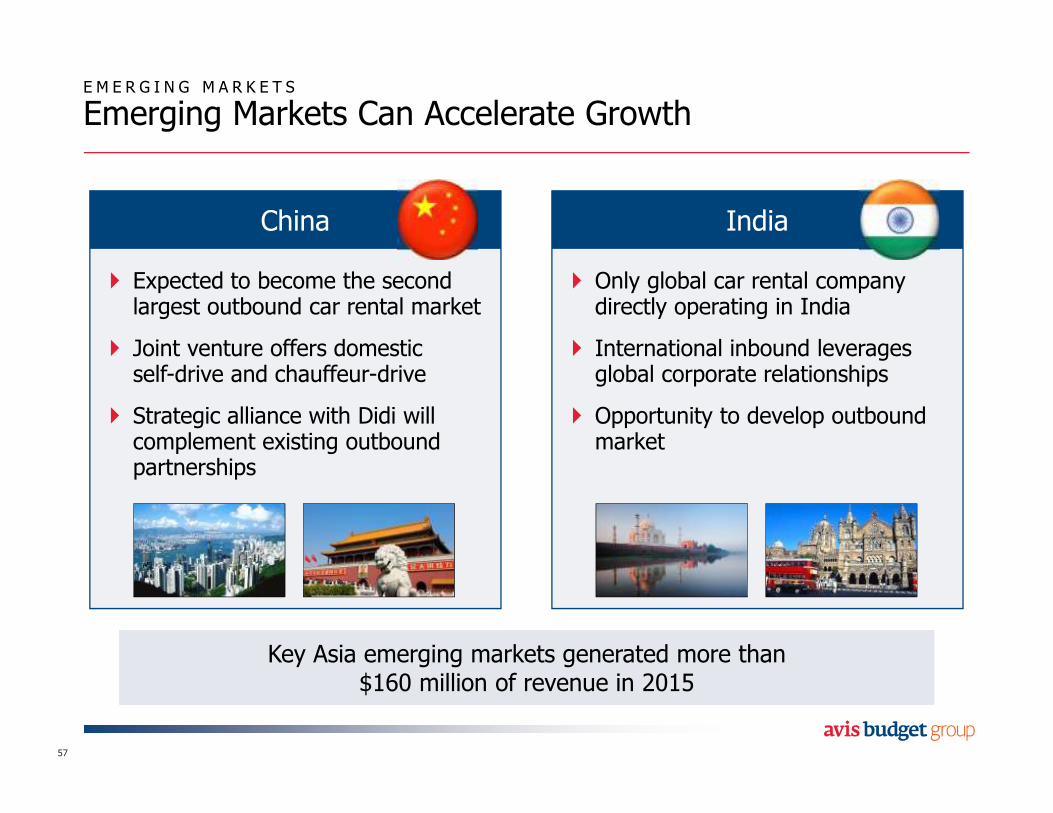
E M E R G I N G M A R K E T S
Emerging Markets Can Accelerate Growth
57
� Expected to become the second largest outbound car rental market
� Joint venture offers domestic self-drive and chauffeur-drive
� Strategic alliance with Didi will complement existing outbound partnerships
China
� Only global car rental company directly operating in India
� International inbound leverages global corporate relationships
� Opportunity to develop outbound market
India
Key Asia emerging markets generated more than $160 million of revenue in 2015
Key Asia emerging markets generated more than $160 million of revenue in 2015
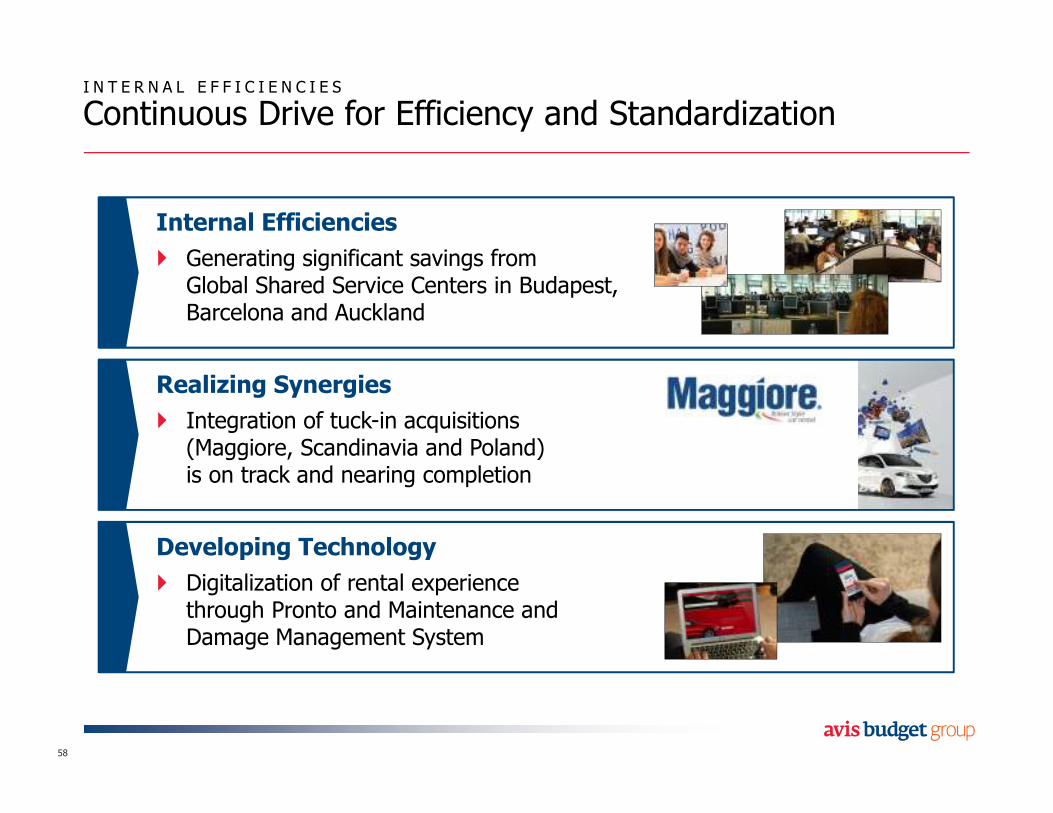
I N T E R N A L E F F I C I E N C I E S
Continuous Drive for Efficiency and Standardization
58
Internal Efficiencies
� Generating significant savings from Global Shared Service Centers in Budapest, Barcelona and Auckland
Realizing Synergies
� Integration of tuck-in acquisitions (Maggiore, Scandinavia and Poland) is on track and nearing completion
Developing Technology
� Digitalization of rental experience through Pronto and Maintenance and Damage Management System
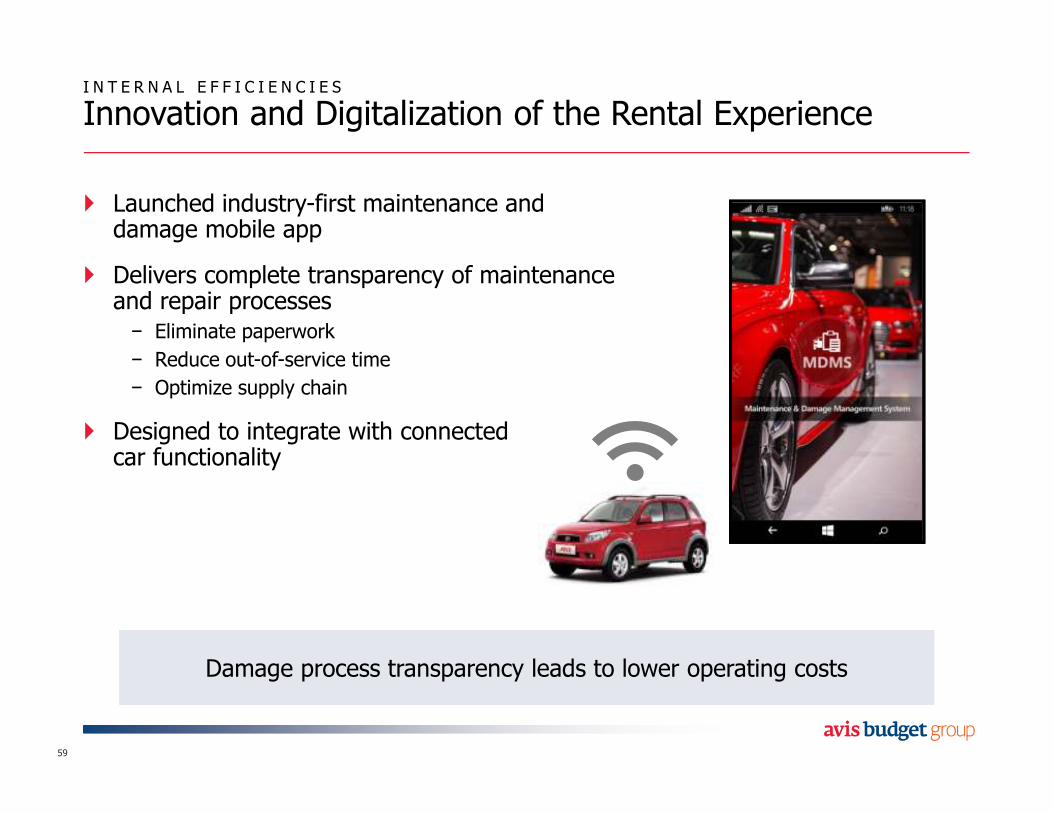
I N T E R N A L E F F I C I E N C I E S
Innovation and Digitalization of the Rental Experience
� Launched industry-first maintenance and damage mobile app
� Delivers complete transparency of maintenance and repair processes− Eliminate paperwork
− Reduce out-of-service time
− Optimize supply chain
� Designed to integrate with connected car functionality
59
Damage process transparency leads to lower operating costsDamage process transparency leads to lower operating costs
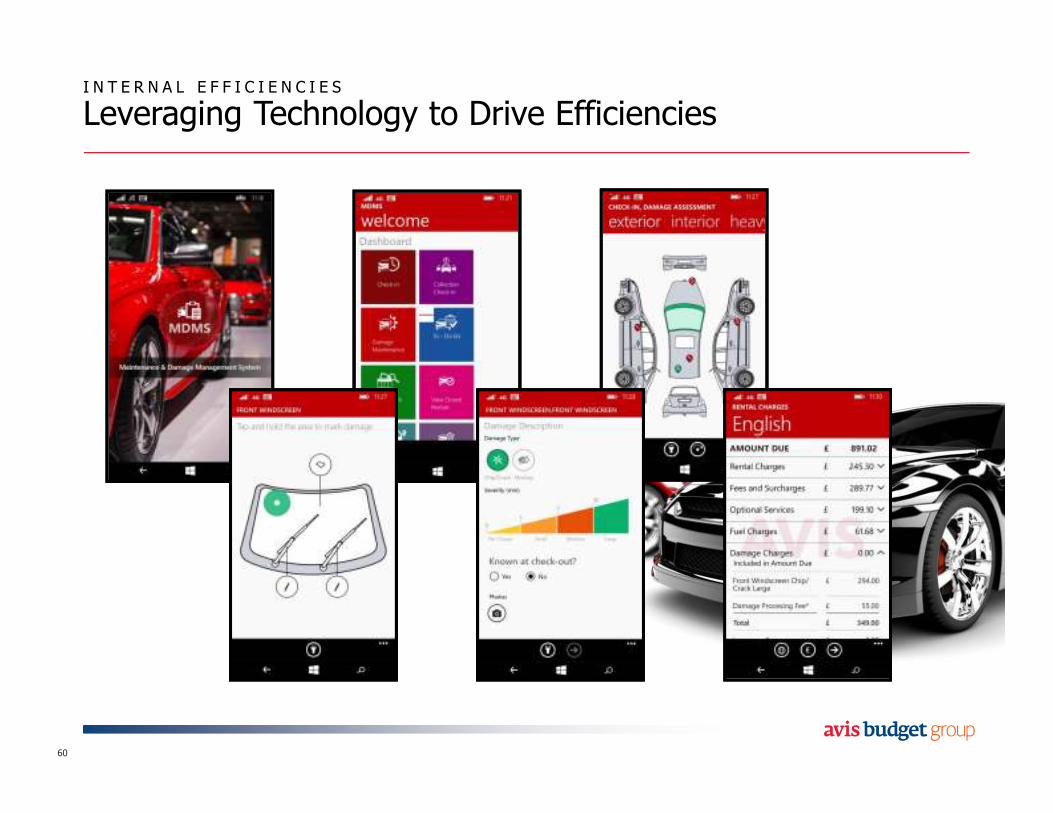
I N T E R N A L E F F I C I E N C I E S
Leveraging Technology to Drive Efficiencies
60
Agenda
The International Business Today
Future International Opportunities
Global Revenue Growth
61
An Evolved Strategy for an Evolving Landscape
62
1. Win Customers– Through differentiatedbrands and products
2. Increase Margins– Via revenue, fleet and cost optimization
EnablersEnablers
Driving Sustained,Profitable Growth
3. Succeed in Mobility– Position ourselves in evolving landscape
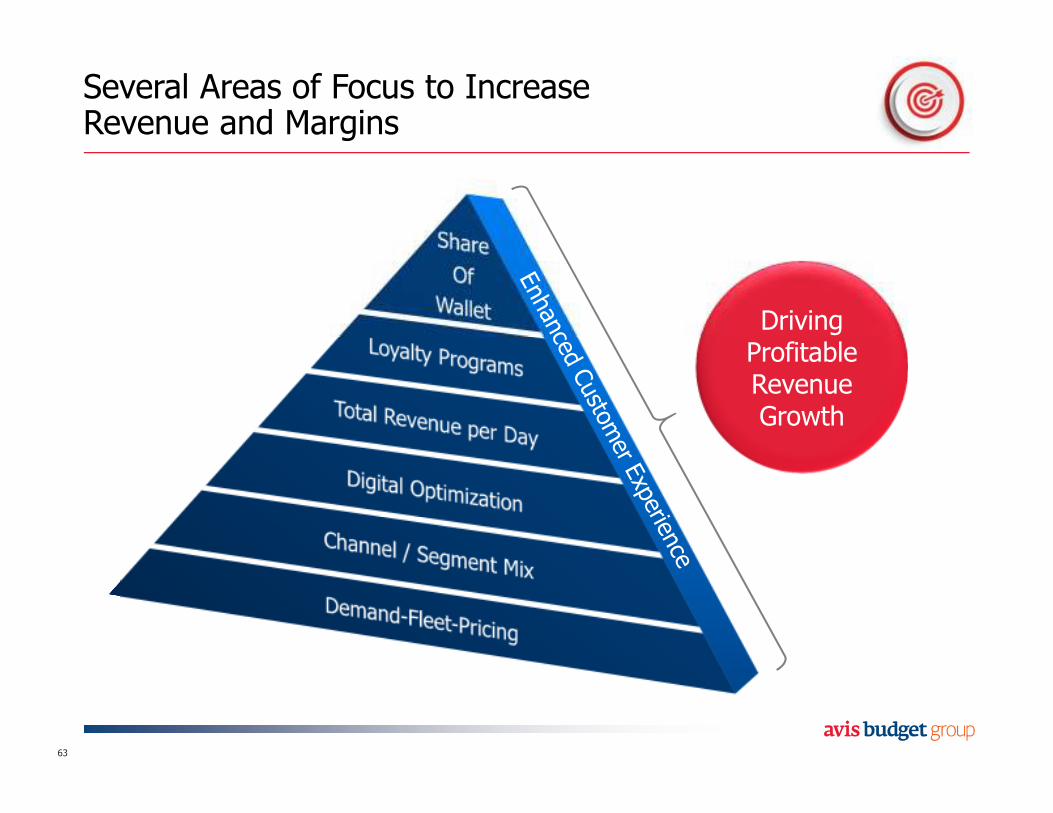
Several Areas of Focus to Increase Revenue and Margins
63
DrivingProfitableRevenueGrowth
D E M A N D - F L E E T - P R I C I N G
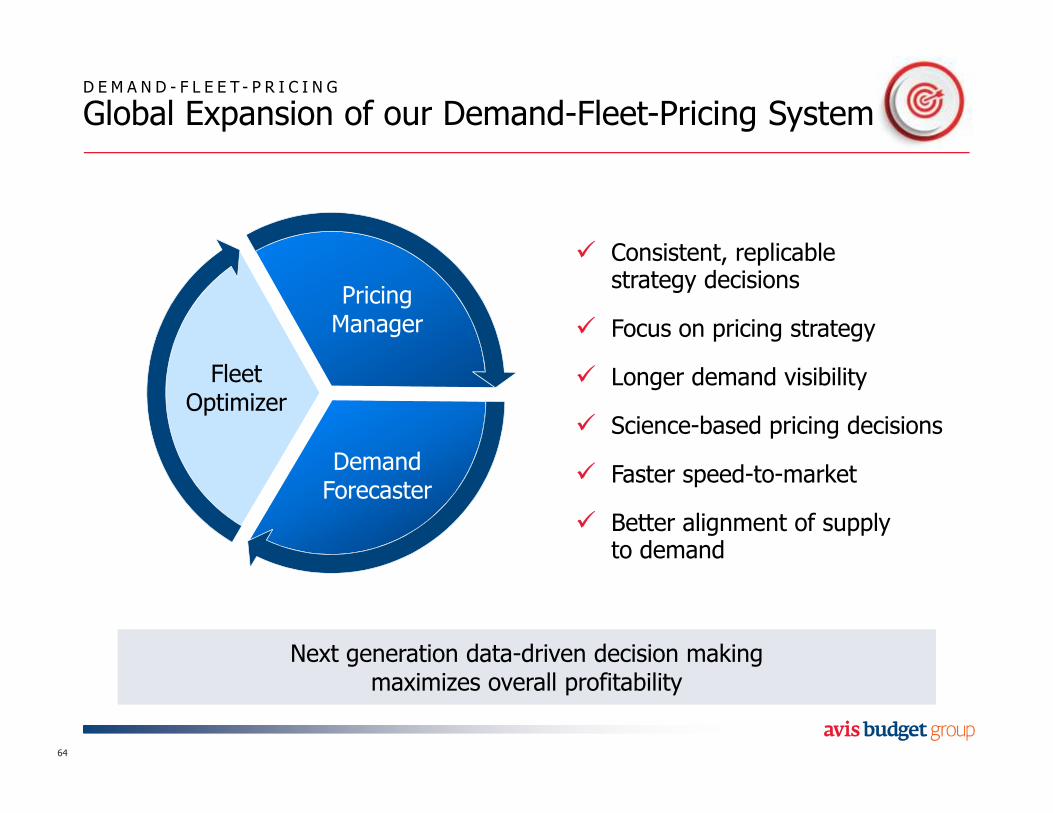
Global Expansion of our Demand-Fleet-Pricing System
64
� Consistent, replicable strategy decisions
� Focus on pricing strategy
� Longer demand visibility
� Science-based pricing decisions
� Faster speed-to-market
� Better alignment of supply to demand
PricingManager
DemandForecaster
FleetOptimizer
Next generation data-driven decision making maximizes overall profitability
Next generation data-driven decision making maximizes overall profitability
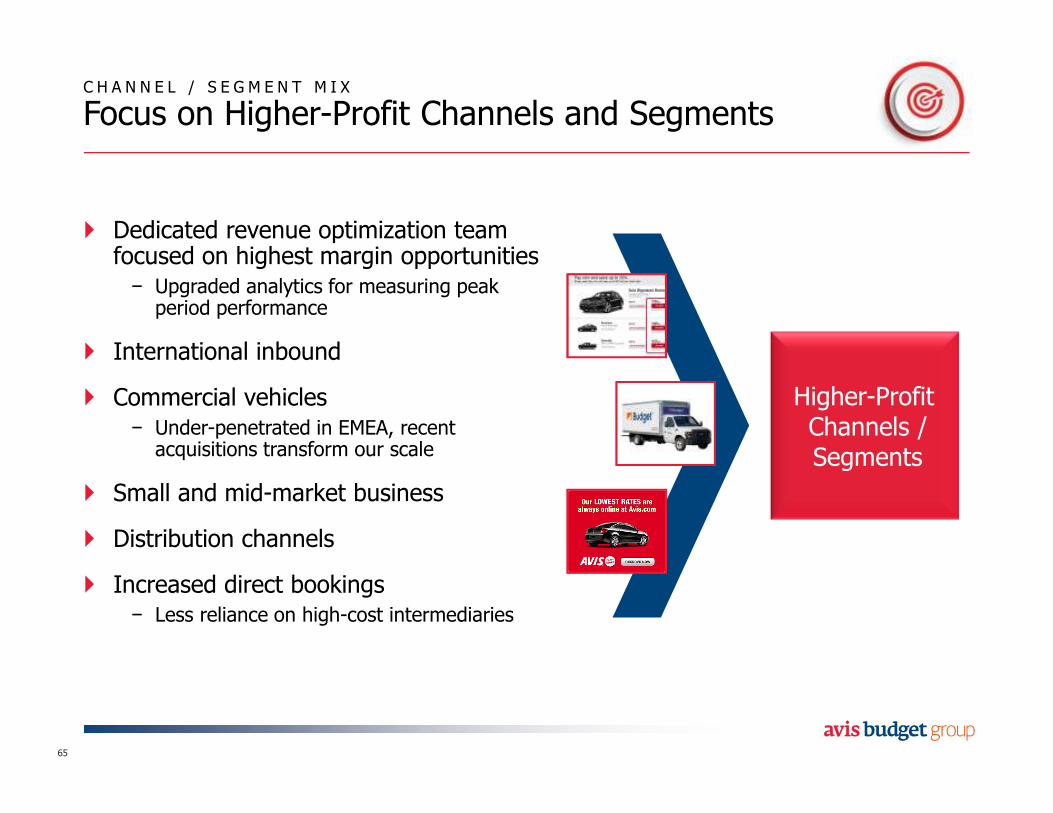
� Dedicated revenue optimization team focused on highest margin opportunities− Upgraded analytics for measuring peak period performance
� International inbound
� Commercial vehicles− Under-penetrated in EMEA, recent acquisitions transform our scale
� Small and mid-market business
� Distribution channels
� Increased direct bookings− Less reliance on high-cost intermediaries
C H A N N E L / S E G M E N T M I X
Focus on Higher-Profit Channels and Segments
65
Higher-ProfitChannels / Segments
D I G I T A L O P T I M I Z A T I O N
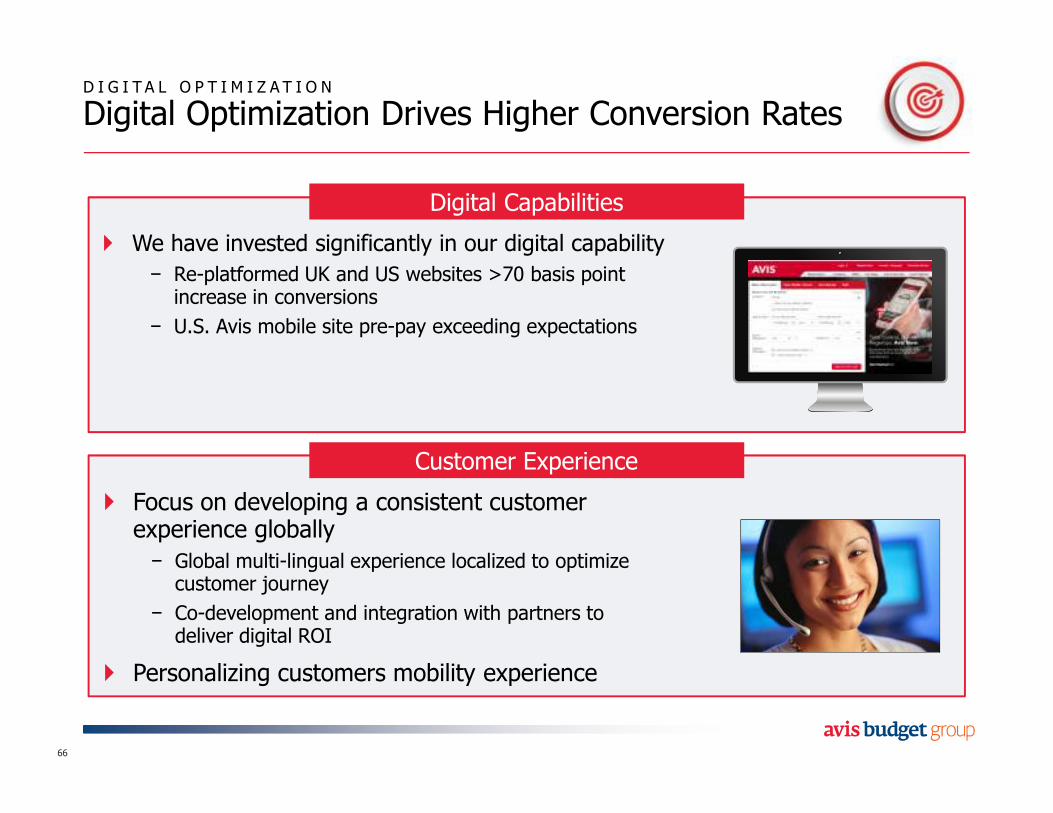
Digital Optimization Drives Higher Conversion Rates
� We have invested significantly in our digital capability
− Re-platformed UK and US websites >70 basis point increase in conversions
− U.S. Avis mobile site pre-pay exceeding expectations
66
� Focus on developing a consistent customer experience globally
− Global multi-lingual experience localized to optimize customer journey
− Co-development and integration with partners to deliver digital ROI
� Personalizing customers mobility experience
Digital Capabilities
Customer Experience
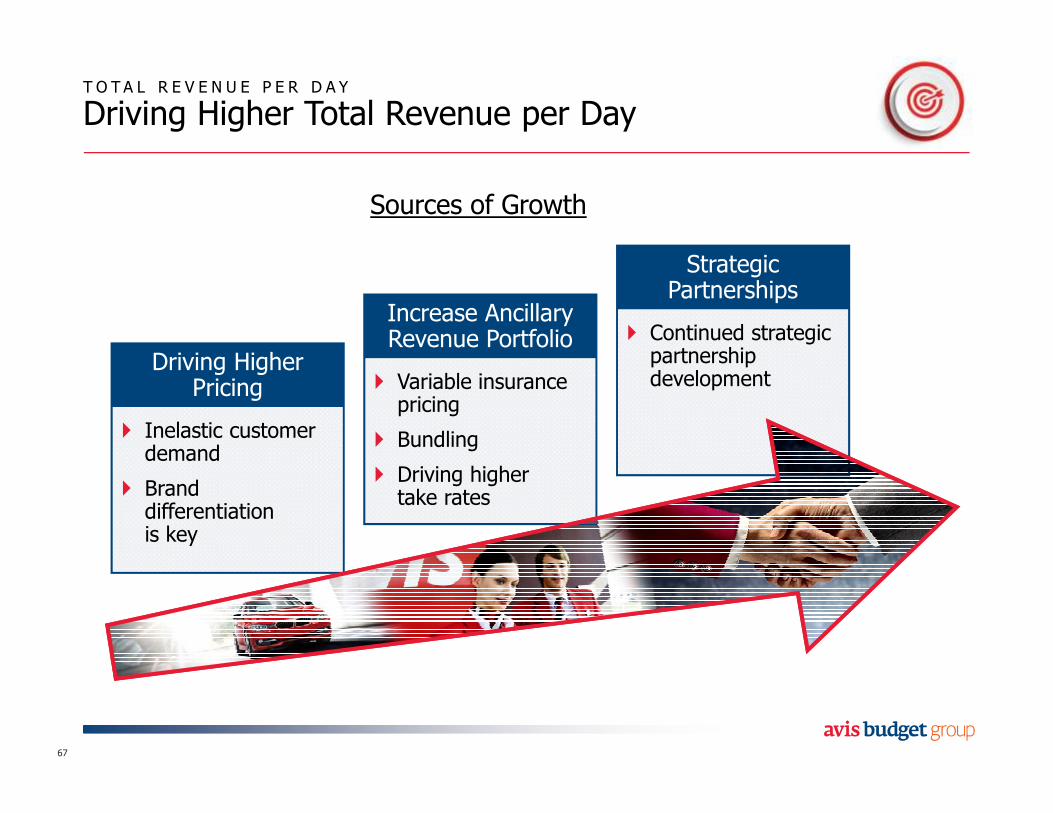
T O T A L R E V E N U E P E R D A Y
Driving Higher Total Revenue per Day
67
Driving HigherPricing
� Inelastic customer demand
� Brand differentiation is key
Increase AncillaryRevenue Portfolio
� Variable insurance pricing
� Bundling
� Driving higher take rates
StrategicPartnerships
� Continued strategic partnership development
Sources of Growth
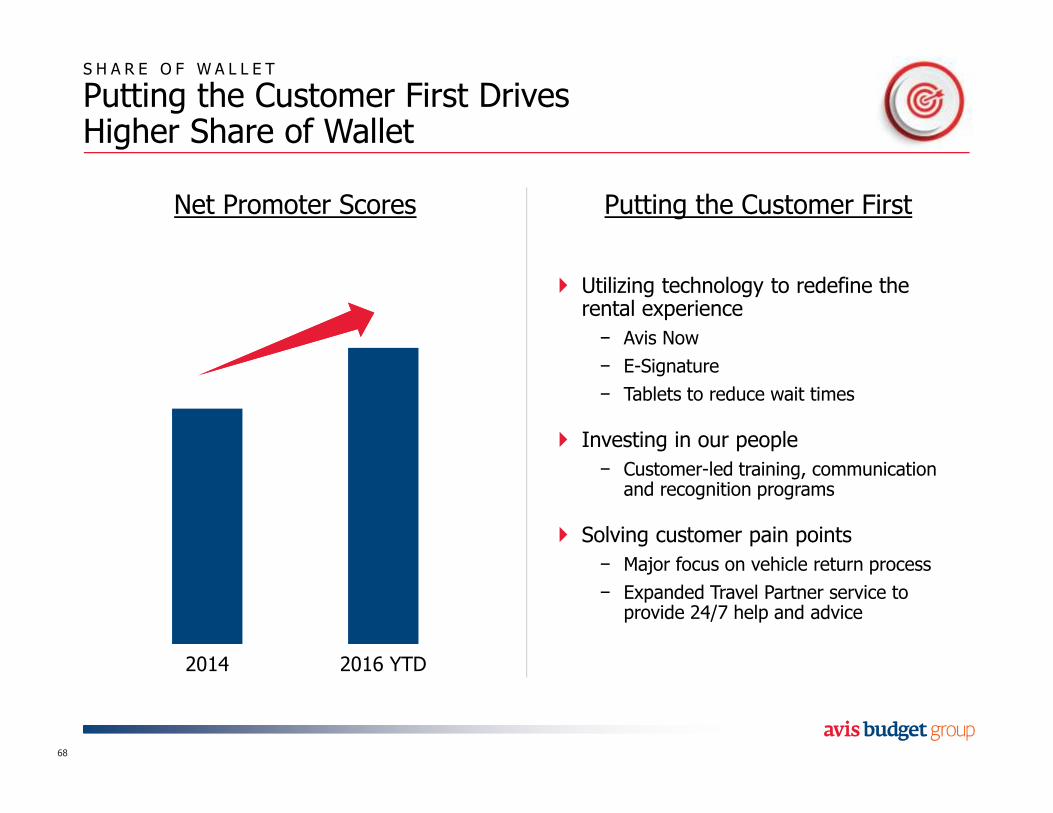
S H A R E O F W A L L E T
Putting the Customer First Drives Higher Share of Wallet
68
Putting the Customer FirstNet Promoter Scores
2014 2016 YTD
� Utilizing technology to redefine the rental experience
− Avis Now
− E-Signature
− Tablets to reduce wait times
� Investing in our people
− Customer-led training, communication and recognition programs
� Solving customer pain points
− Major focus on vehicle return process
− Expanded Travel Partner service to provide 24/7 help and advice
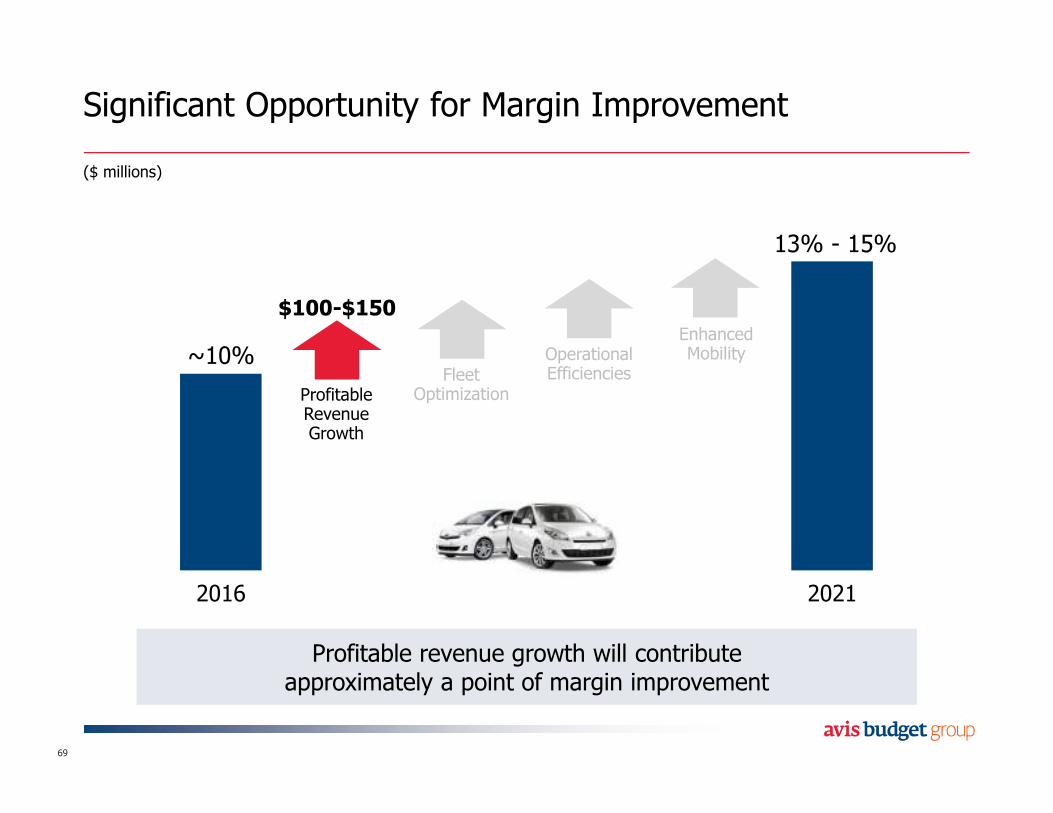
2016 2021
FleetOptimization
OperationalEfficiencies
Profitable Revenue Growth
Enhanced Mobility
$100-$150
Significant Opportunity for Margin Improvement
69
~10%
13% - 15%
Profitable revenue growth will contribute approximately a point of margin improvementProfitable revenue growth will contribute
approximately a point of margin improvement
($ millions)
K E Y T A K E A W A Y S
International – A Powerful Growth Driver
� Proven track record of driving transformational change
� Global revenue growth provides significant opportunity for margin improvement
� Driving international growth through brand expansion, enhanced mobility and growing emerging markets
70

Joe Ferraro
President, Americas
Agenda
The Americas Business Today
Optimizing Fleet Costs
Driving Operational Efficiencies
72
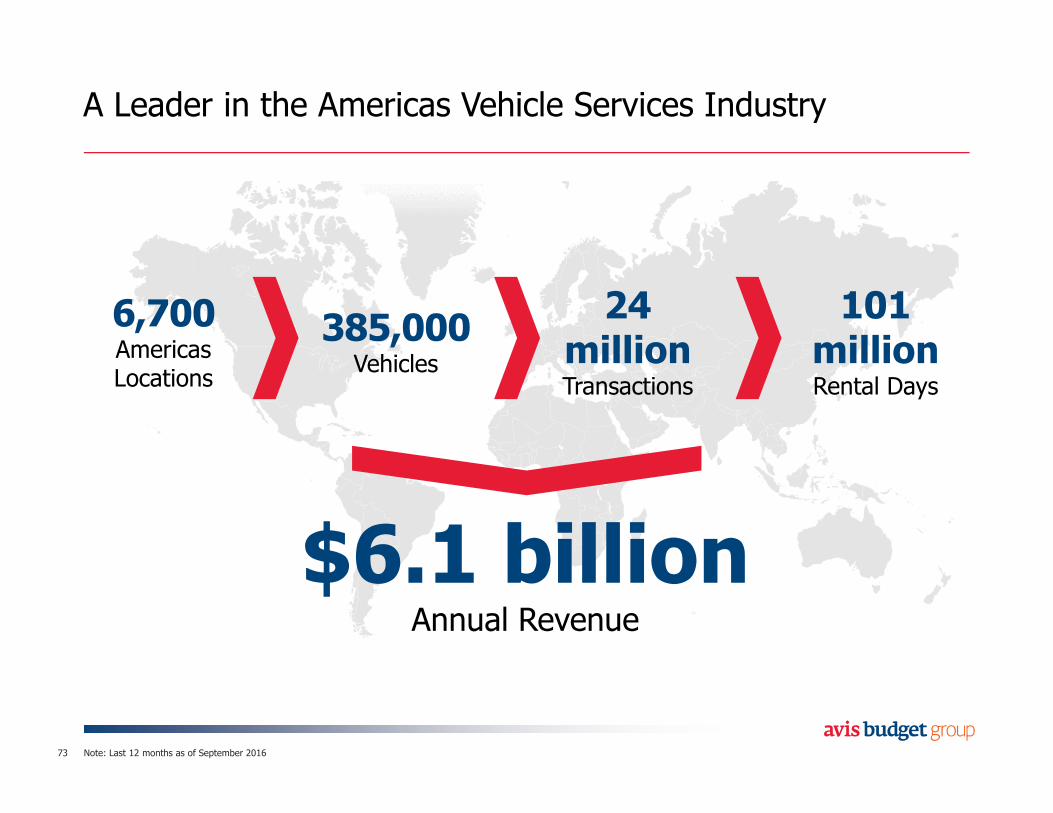
A Leader in the Americas Vehicle Services Industry
73
6,700Americas Locations
385,000Vehicles
24 millionTransactions
101 millionRental Days
$6.1 billionAnnual Revenue
Note: Last 12 months as of September 2016
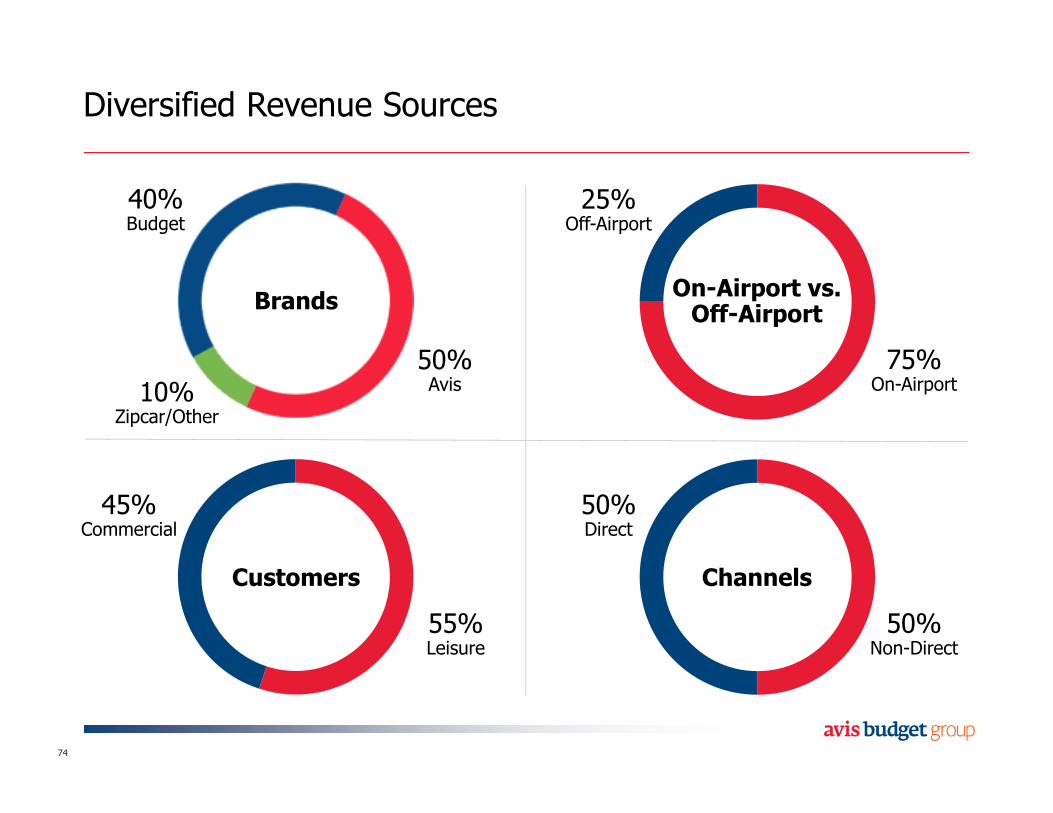
Diversified Revenue Sources
74
75%On-Airport
BrandsOn-Airport vs. Off-Airport
Customers Channels
25%Off-Airport
50%Non-Direct
50%Direct
55%Leisure
45%Commercial
50%Avis
40%Budget
10%Zipcar/Other
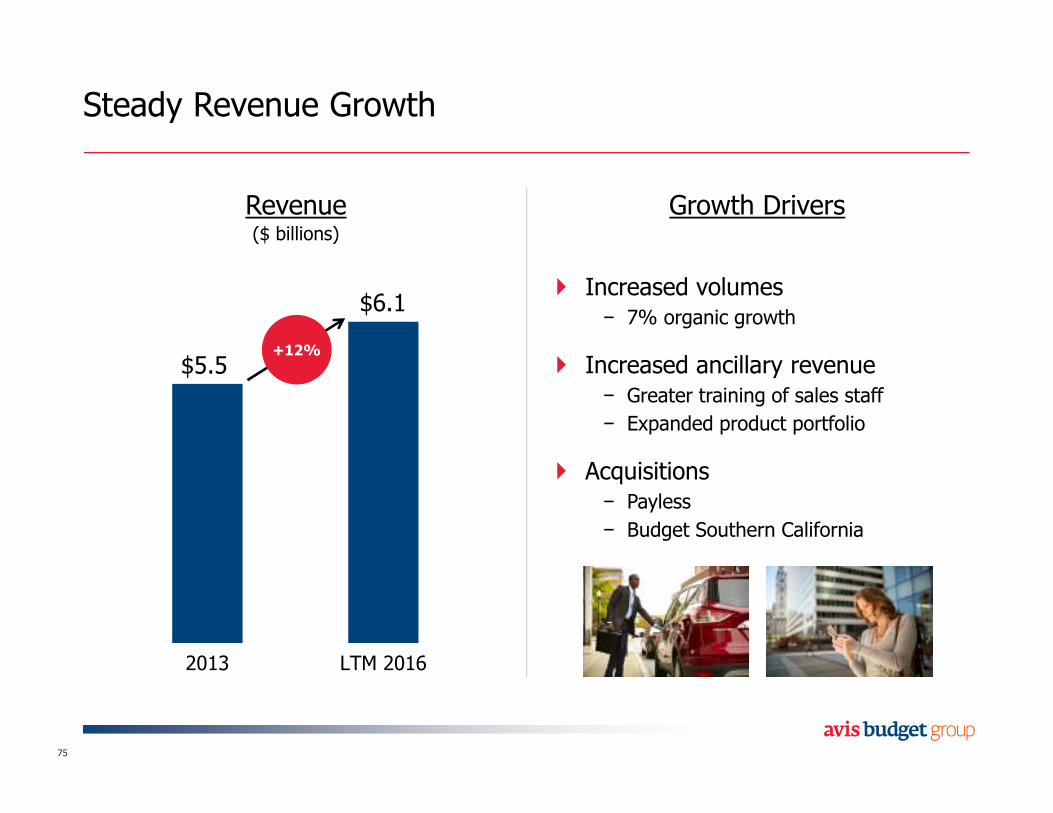
Steady Revenue Growth
75
Revenue($ billions)
2013 LTM 2016
+12%
$5.5
$6.1
Growth Drivers
� Increased volumes− 7% organic growth
� Increased ancillary revenue− Greater training of sales staff
− Expanded product portfolio
� Acquisitions− Payless
− Budget Southern California
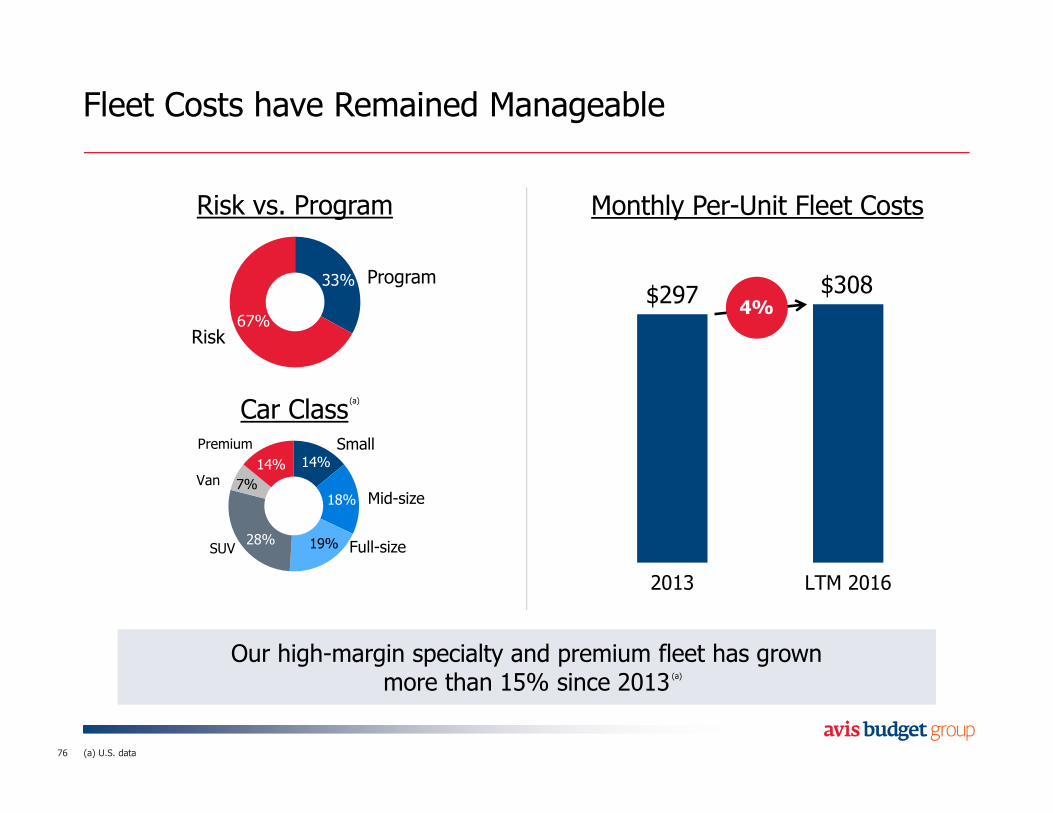
Fleet Costs have Remained Manageable
76
Program
Risk
Car ClassSmall
67%
33%
14%
18%
19%28%
7%
14%
Mid-size
Full-sizeSUV
Van
Premium
Monthly Per-Unit Fleet Costs
$297 $308
2013 LTM 2016
Our high-margin specialty and premium fleet has grown more than 15% since 2013
Our high-margin specialty and premium fleet has grown more than 15% since 2013
Risk vs. Program
4%
(a)
(a)
(a) U.S. data
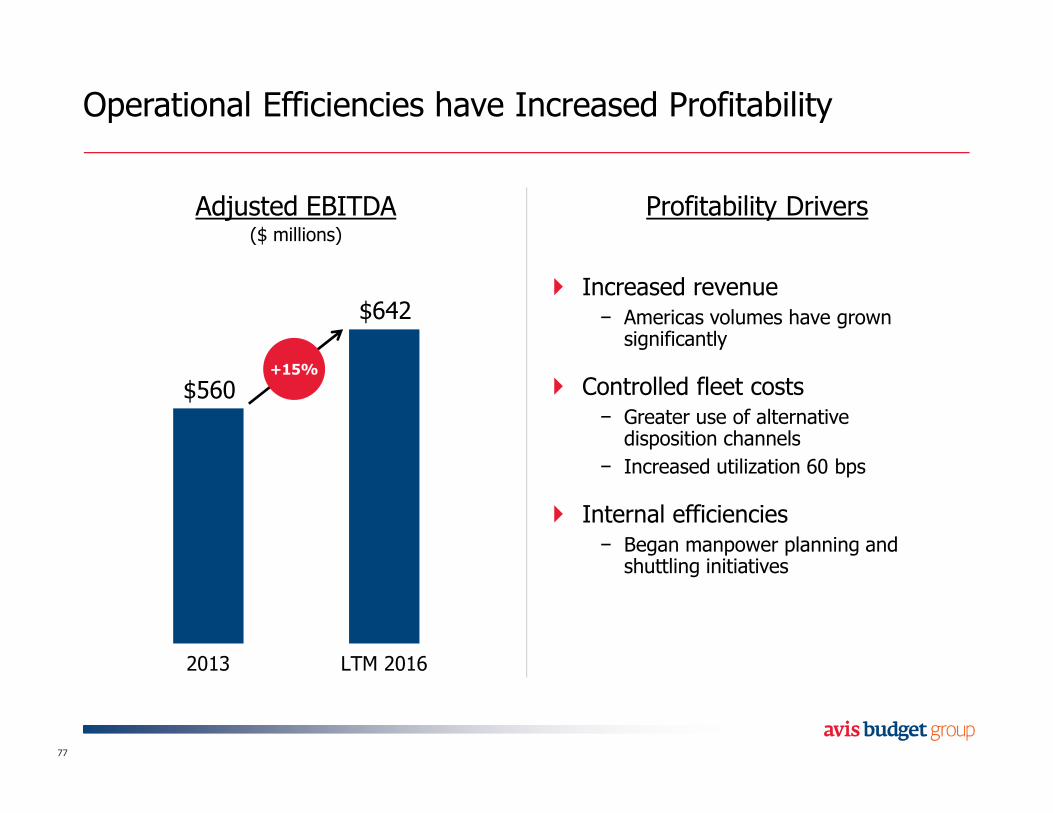
Operational Efficiencies have Increased Profitability
77
Adjusted EBITDA($ millions)
$560
$642
2013 LTM 2016
+15%
Profitability Drivers
� Increased revenue− Americas volumes have grown significantly
� Controlled fleet costs− Greater use of alternative disposition channels
− Increased utilization 60 bps
� Internal efficiencies− Began manpower planning and shuttling initiatives
Agenda
The Americas Business Today
Optimizing Fleet Costs
Driving Operational Efficiencies
78

An Evolved Strategy for an Evolving Landscape
79
1. Win Customers– Through differentiatedbrands and products
2. Increase Margins– Via revenue, fleet and cost optimization
EnablersEnablers
Driving Sustained,Profitable Growth
3. Succeed in Mobility– Position ourselves in evolving landscape
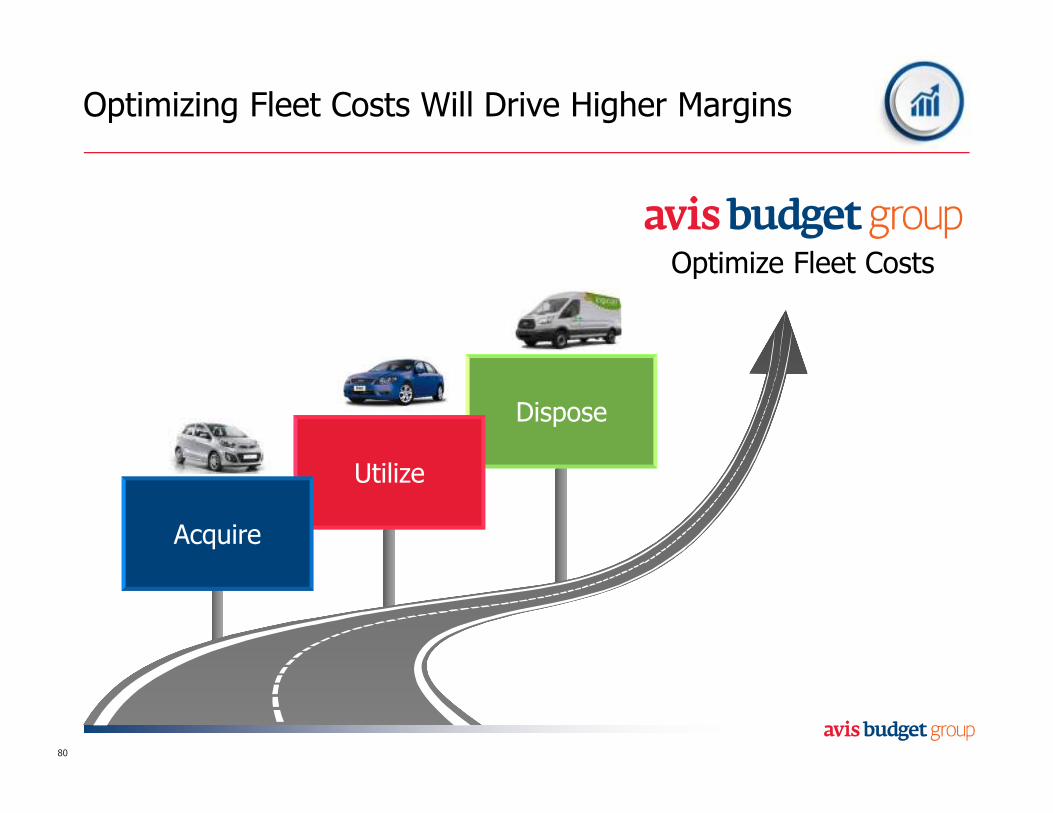
Optimizing Fleet Costs Will Drive Higher Margins
80
Dispose
Utilize
Acquire
Optimize Fleet Costs
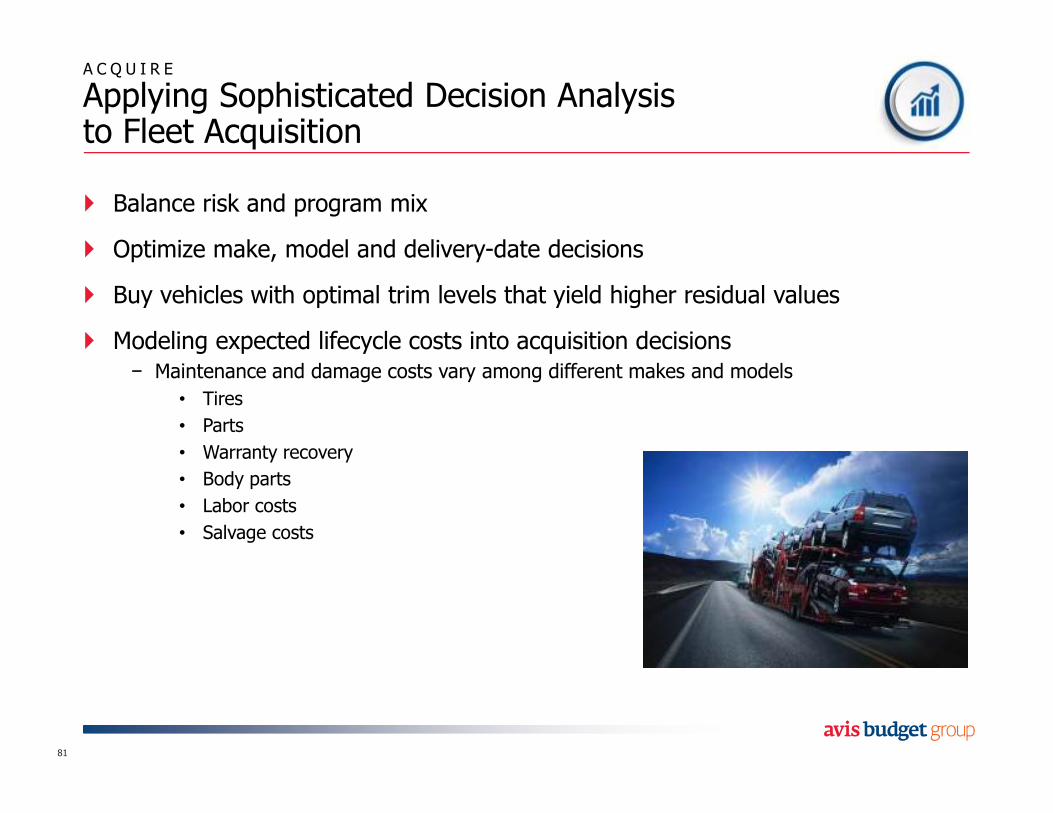
A C Q U I R E
Applying Sophisticated Decision Analysis to Fleet Acquisition
� Balance risk and program mix
� Optimize make, model and delivery-date decisions
� Buy vehicles with optimal trim levels that yield higher residual values
� Modeling expected lifecycle costs into acquisition decisions− Maintenance and damage costs vary among different makes and models
• Tires
• Parts
• Warranty recovery
• Body parts
• Labor costs
• Salvage costs
81
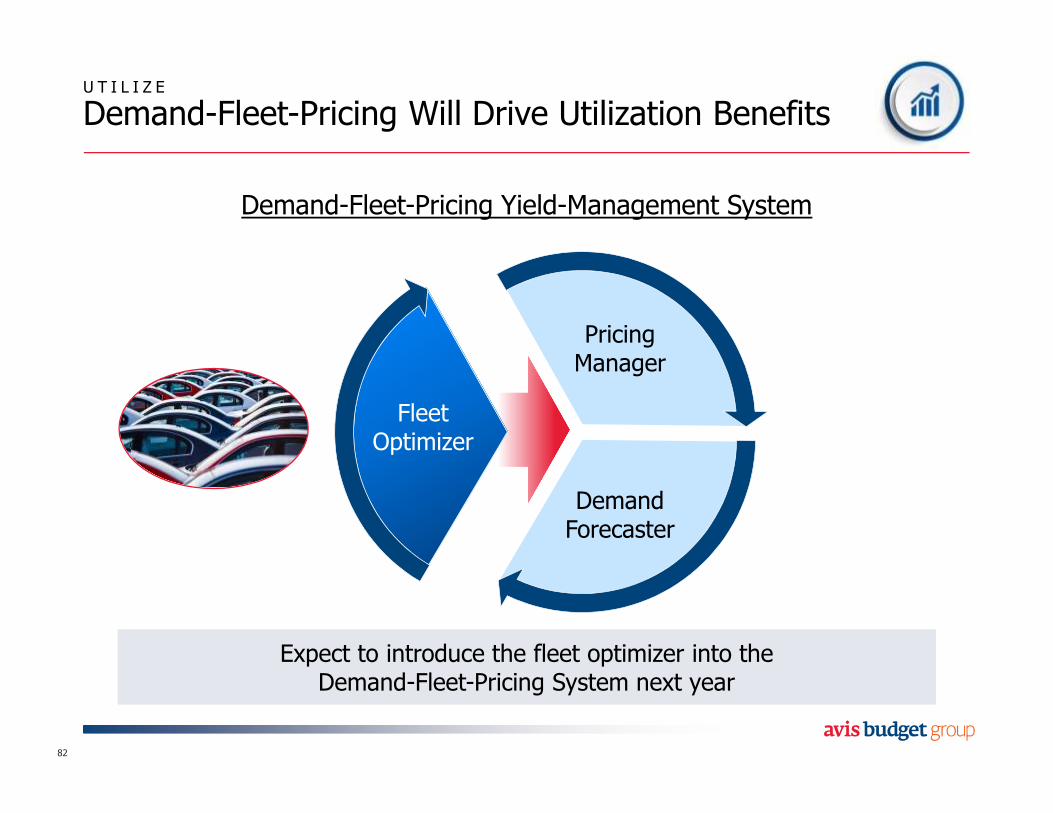
U T I L I Z E
Demand-Fleet-Pricing Will Drive Utilization Benefits
82
Expect to introduce the fleet optimizer into the Demand-Fleet-Pricing System next year
Expect to introduce the fleet optimizer into the Demand-Fleet-Pricing System next year
Demand-Fleet-Pricing Yield-Management System
PricingManager
DemandForecaster
FleetOptimizer
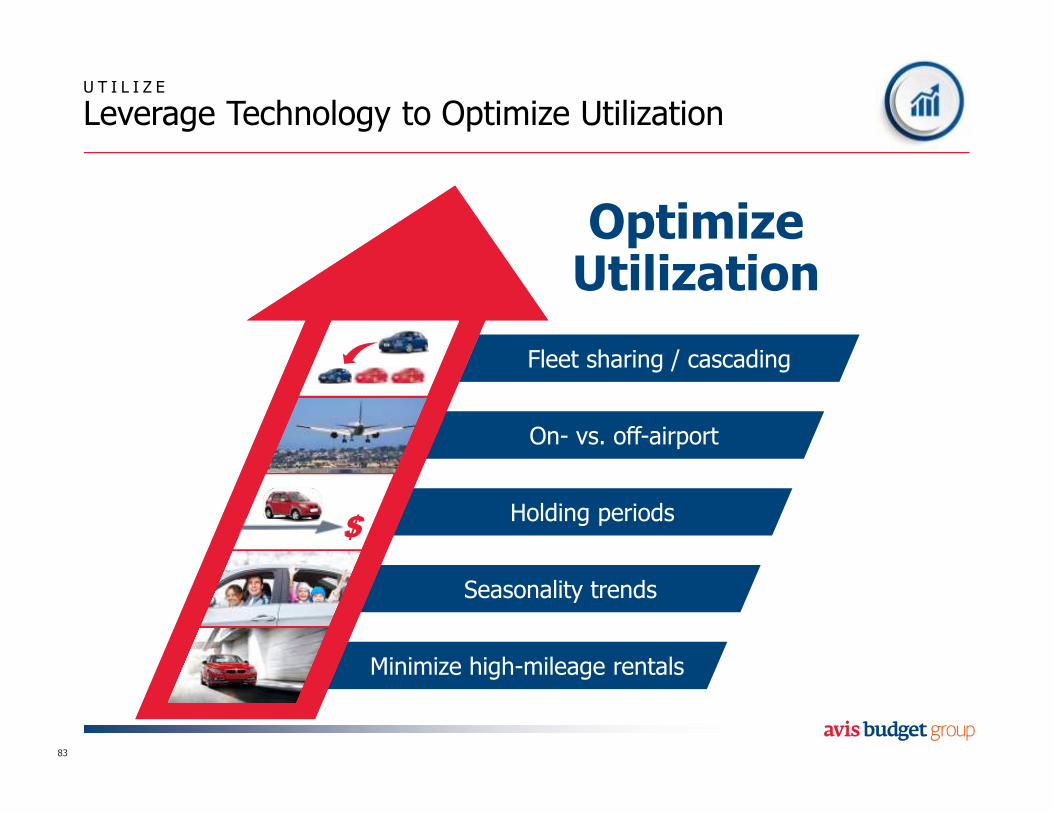
Minimize high-mileage rentals
Seasonality trends
Holding periods
On- vs. off-airport
Fleet sharing / cascading
U T I L I Z E
Leverage Technology to Optimize Utilization
83
OptimizeUtilization
$
U T I L I Z E
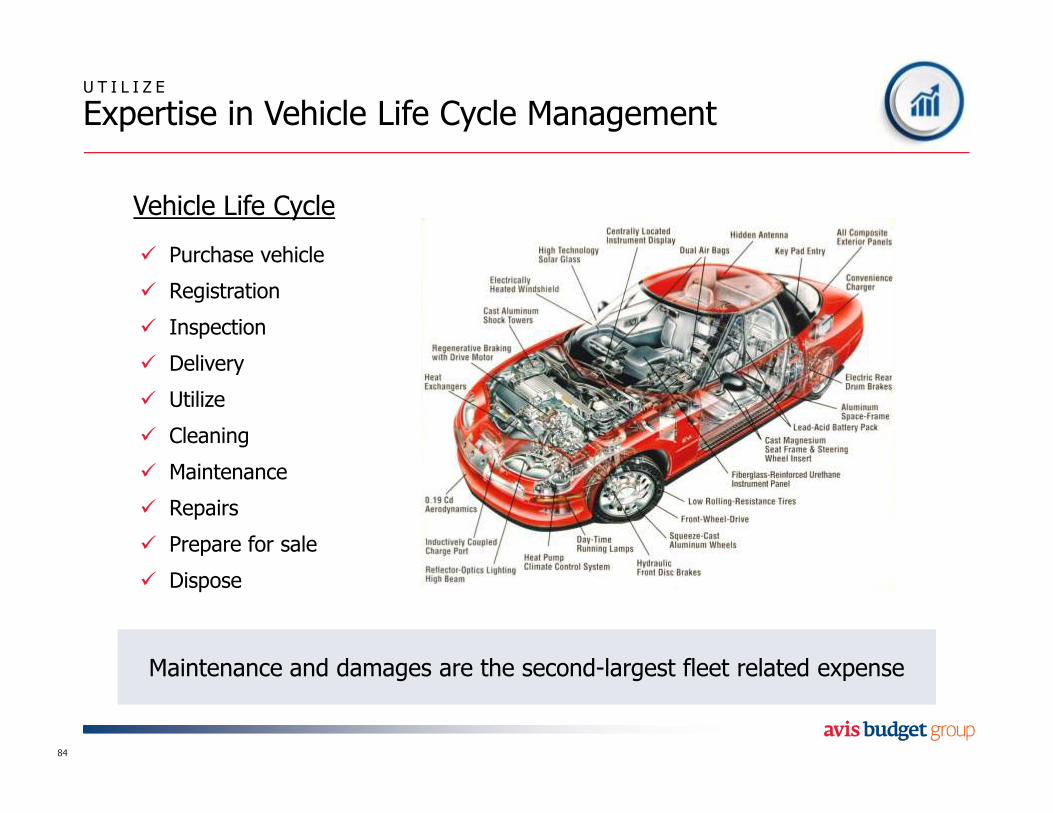
Expertise in Vehicle Life Cycle Management
84
Vehicle Life Cycle
� Purchase vehicle
� Registration
� Inspection
� Delivery
� Utilize
� Cleaning
� Maintenance
� Repairs
� Prepare for sale
� Dispose
Maintenance and damages are the second-largest fleet related expenseMaintenance and damages are the second-largest fleet related expense
Alternative Channel Benefits
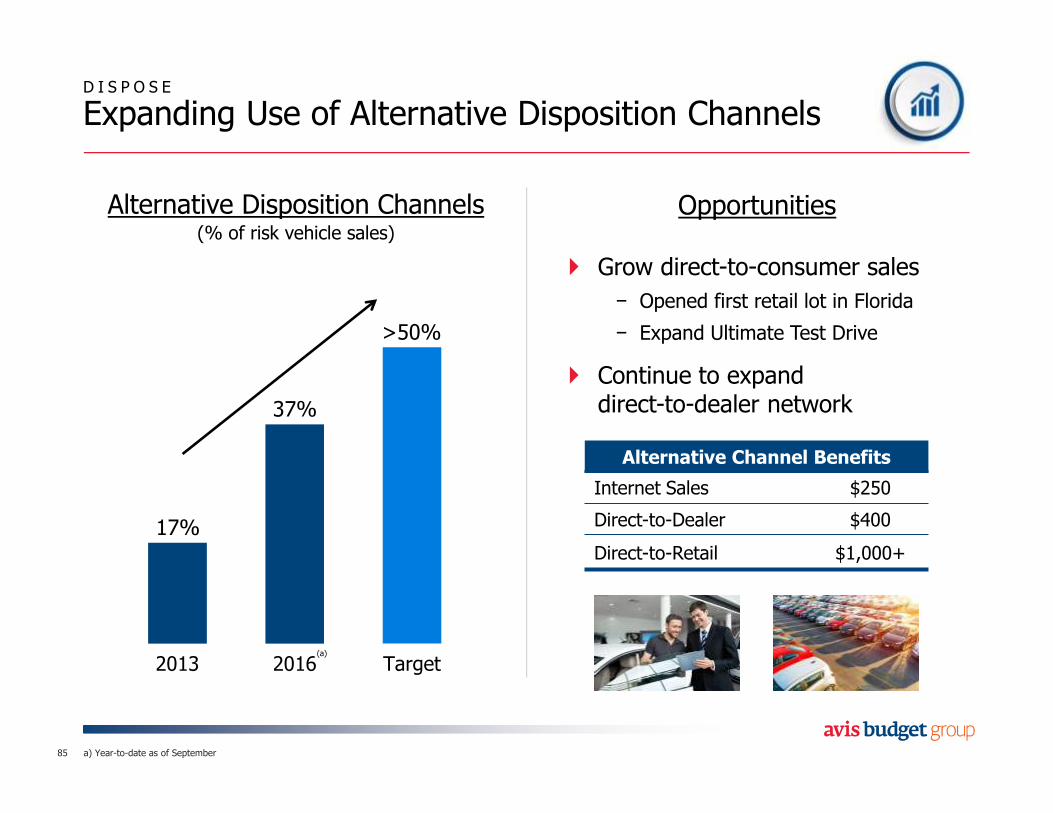
D I S P O S E
Expanding Use of Alternative Disposition Channels
85
Alternative Disposition Channels(% of risk vehicle sales)
2013 2016 Target
17%
>50%
37%
Internet Sales $250
Direct-to-Dealer $400
Direct-to-Retail $1,000+
Opportunities
� Grow direct-to-consumer sales
− Opened first retail lot in Florida
− Expand Ultimate Test Drive
� Continue to expand direct-to-dealer network
(a)
a) Year-to-date as of September
Agenda
The Americas Business Today
Optimizing Fleet Costs
Driving Operational Efficiencies
86
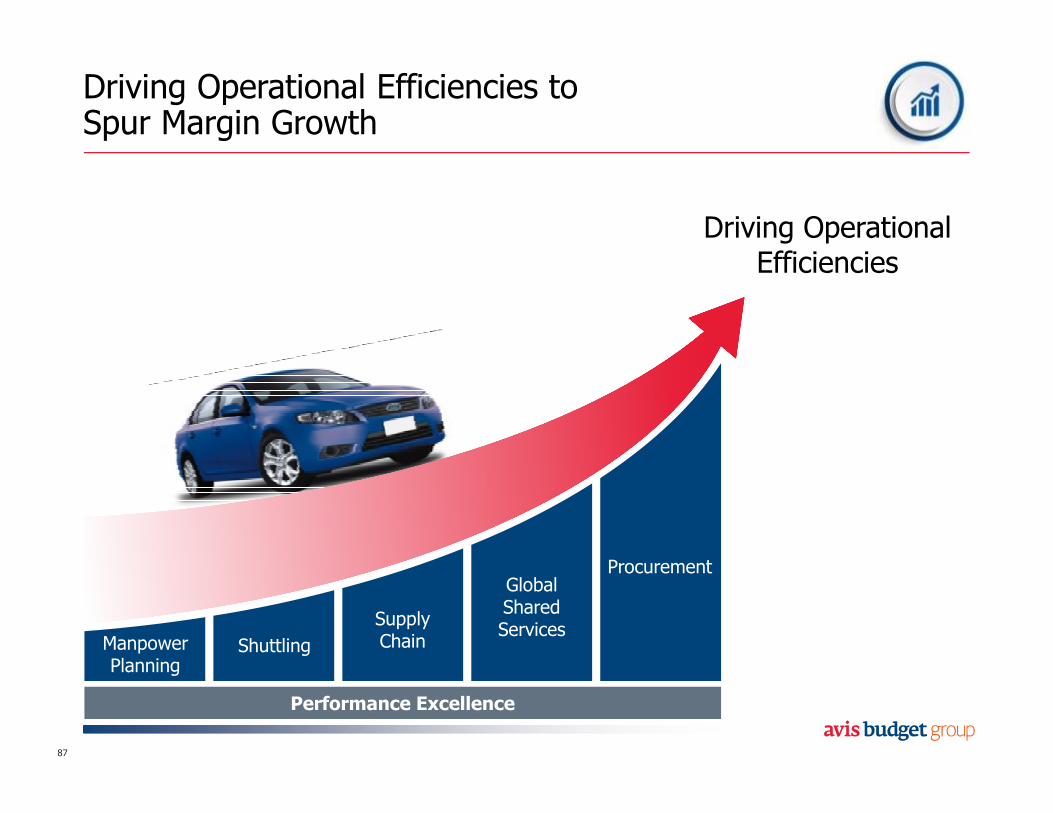
Driving Operational Efficiencies to Spur Margin Growth
87
Driving OperationalEfficiencies
ProcurementGlobalSharedServices
SupplyChainShuttlingManpower
Planning
Performance Excellence
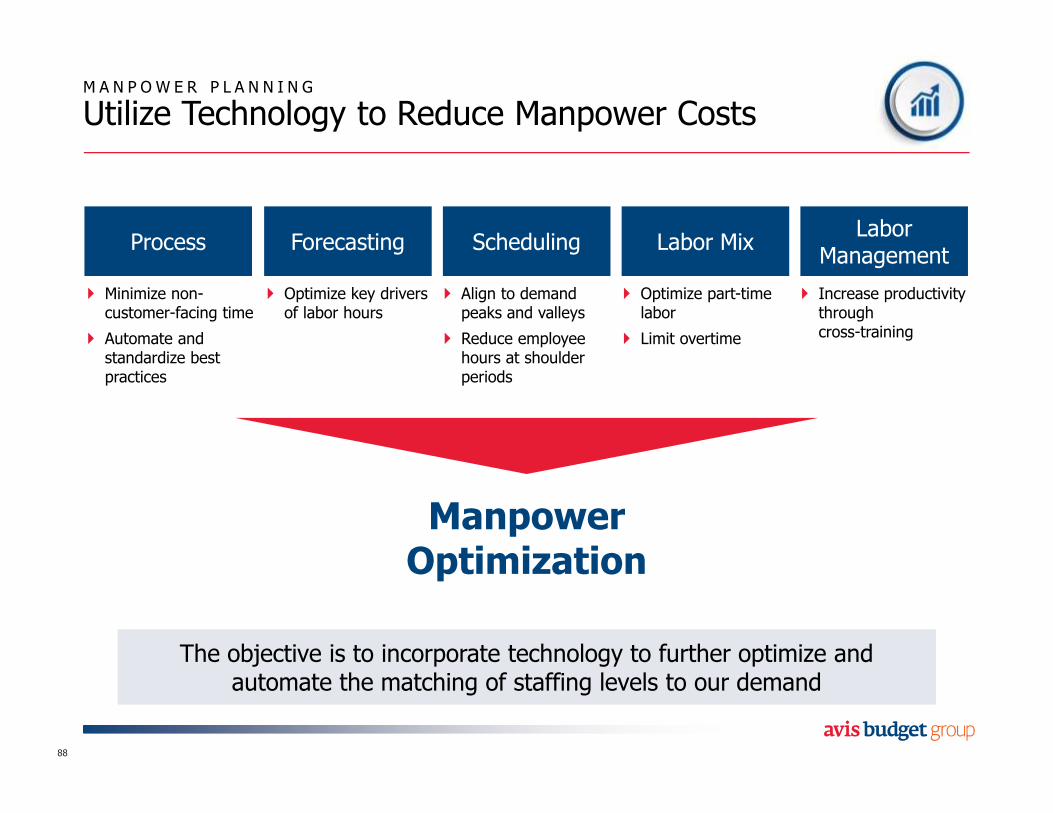
M A N P O W E R P L A N N I N G
Utilize Technology to Reduce Manpower Costs
88
� Minimize non-customer-facing time
� Automate and standardize best practices
� Optimize key drivers of labor hours
� Align to demand peaks and valleys
� Reduce employee hours at shoulder periods
Process Forecasting Scheduling
� Optimize part-time labor
� Limit overtime
� Increase productivity through cross-training
Labor MixLabor
Management
ManpowerOptimization
The objective is to incorporate technology to further optimize and automate the matching of staffing levels to our demand
The objective is to incorporate technology to further optimize and automate the matching of staffing levels to our demand
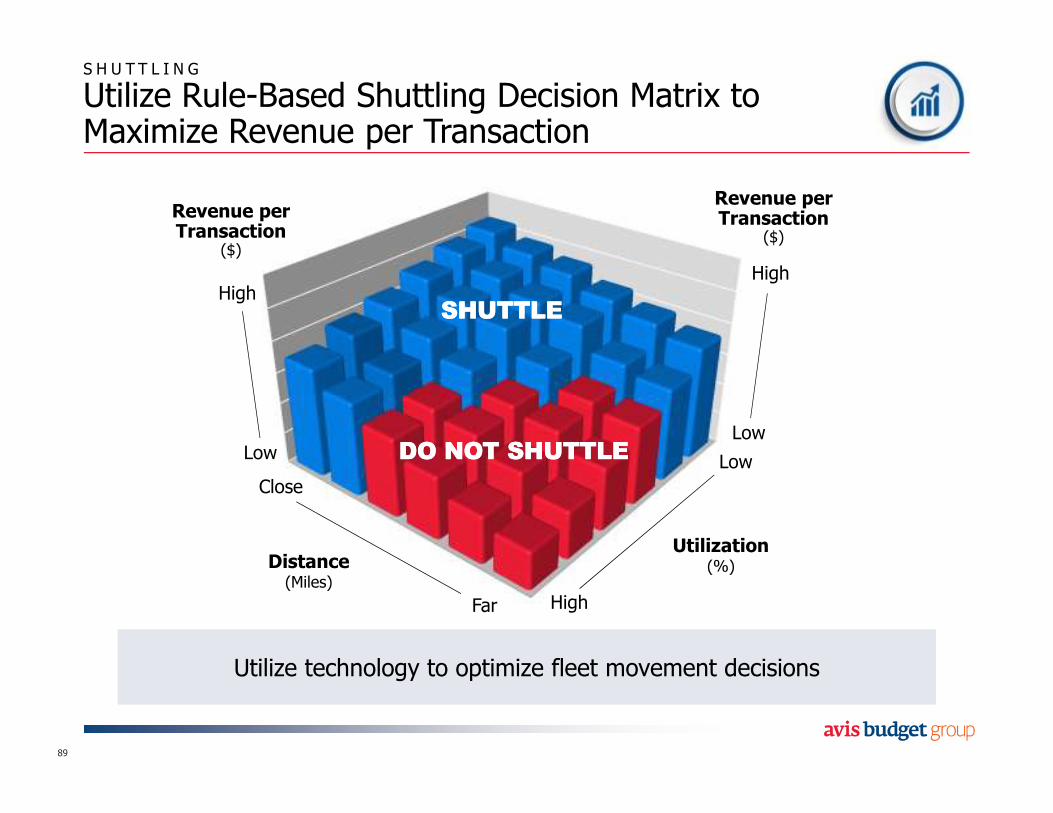
S H U T T L I N G
Utilize Rule-Based Shuttling Decision Matrix toMaximize Revenue per Transaction
89
Utilize technology to optimize fleet movement decisionsUtilize technology to optimize fleet movement decisions
Revenue perTransaction
($)
HighHigh
LowLow
Revenue perTransaction
($)
Close
Far High
Low
Utilization(%)Distance
(Miles)
DO NOT SHUTTLEDO NOT SHUTTLE
SHUTTLESHUTTLE
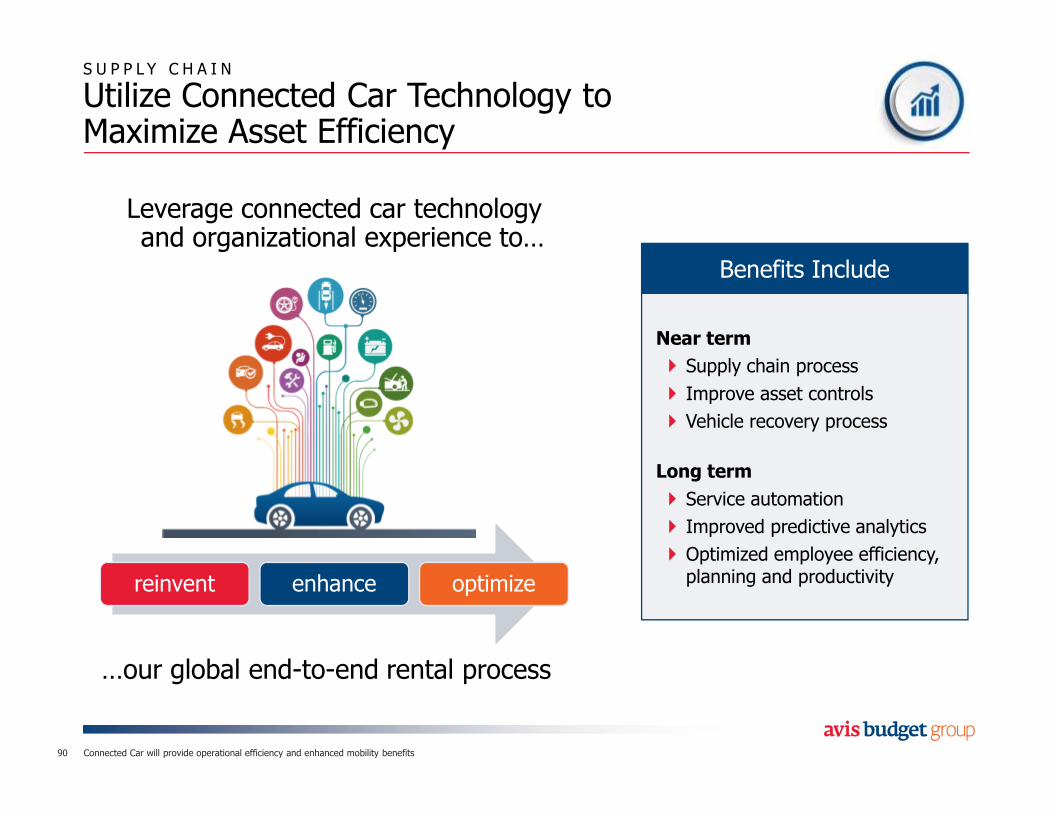
S U P P L Y C H A I N
Utilize Connected Car Technology to Maximize Asset Efficiency
90
Near term
� Supply chain process
� Improve asset controls
� Vehicle recovery process
Long term
� Service automation
� Improved predictive analytics
� Optimized employee efficiency, planning and productivity
Benefits Include
Leverage connected car technology and organizational experience to…
reinvent enhance optimize
…our global end-to-end rental process
Connected Car will provide operational efficiency and enhanced mobility benefits
91
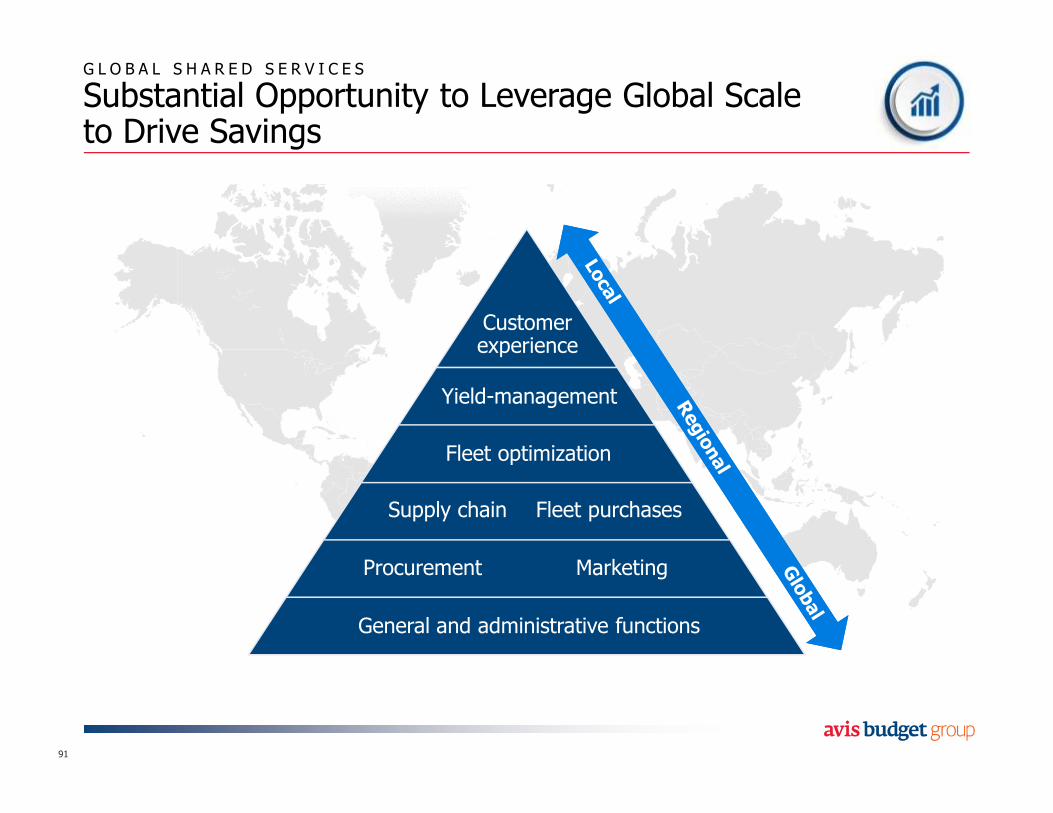
G L O B A L S H A R E D S E R V I C E S
Substantial Opportunity to Leverage Global Scaleto Drive Savings
Procurement
Fleet purchases
General and administrative functions
Supply chain
Marketing
Fleet optimization
Yield-management
Customerexperience
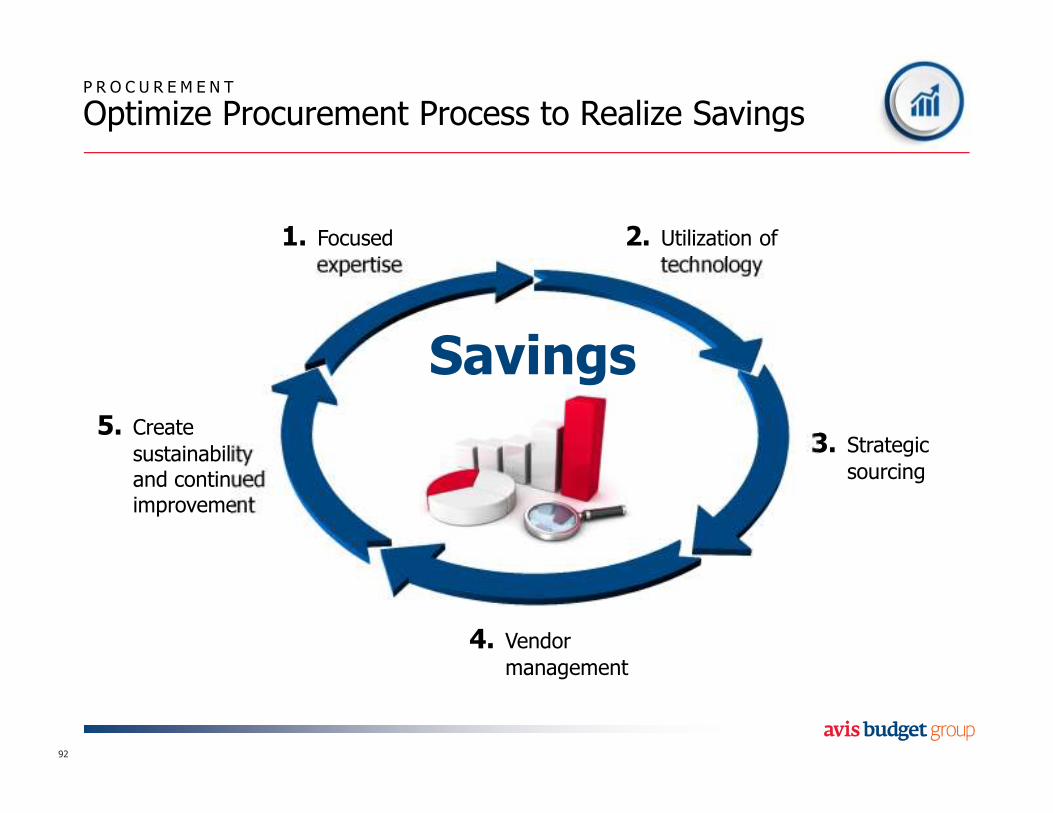
P R O C U R E M E N T
Optimize Procurement Process to Realize Savings
92
1. Focused expertise
2. Utilization of technology
3. Strategicsourcing
5. Create sustainabilityand continued improvement
4. Vendormanagement
Savings
93
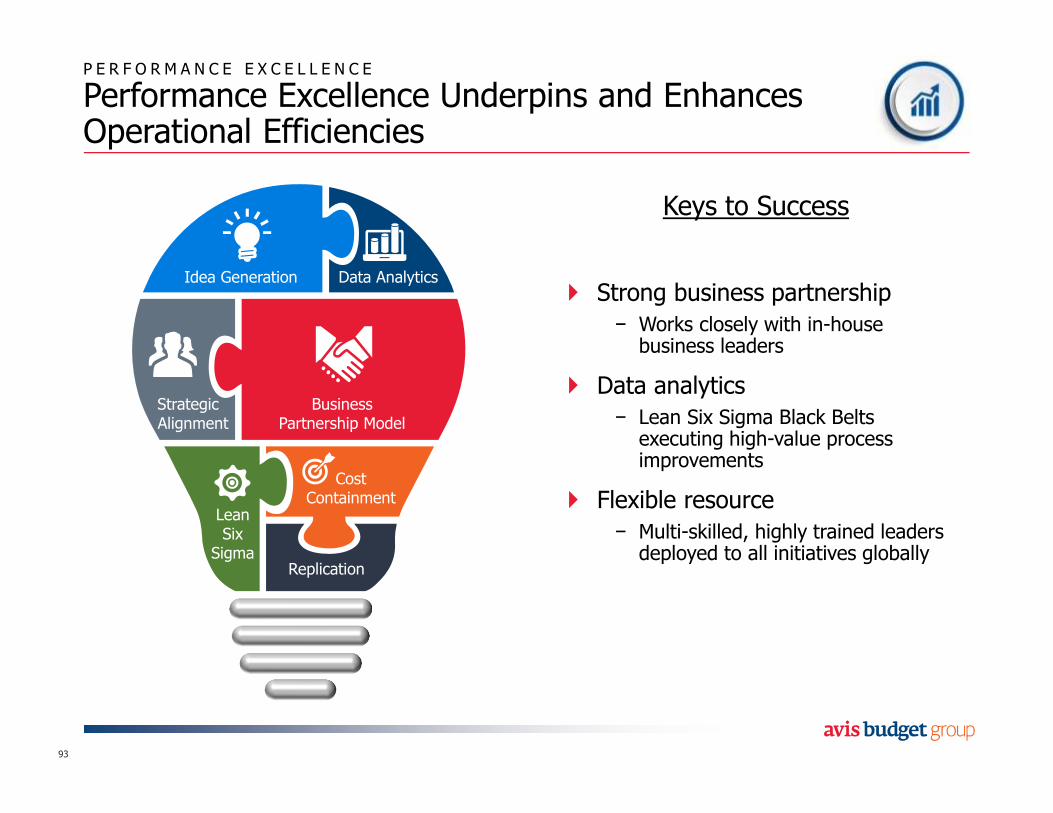
P E R F O R M A N C E E X C E L L E N C E
Performance Excellence Underpins and Enhances Operational Efficiencies
Replication
Strategic Alignment
Idea Generation Data Analytics
Lean Six
Sigma
Cost Containment
Keys to Success
� Strong business partnership
− Works closely with in-house business leaders
� Data analytics
− Lean Six Sigma Black Belts executing high-value process improvements
� Flexible resource
− Multi-skilled, highly trained leaders deployed to all initiatives globally
BusinessPartnership Model
Fleet Optimization
Operational Efficiencies
Profitable Revenue Growth
Enhanced Mobility
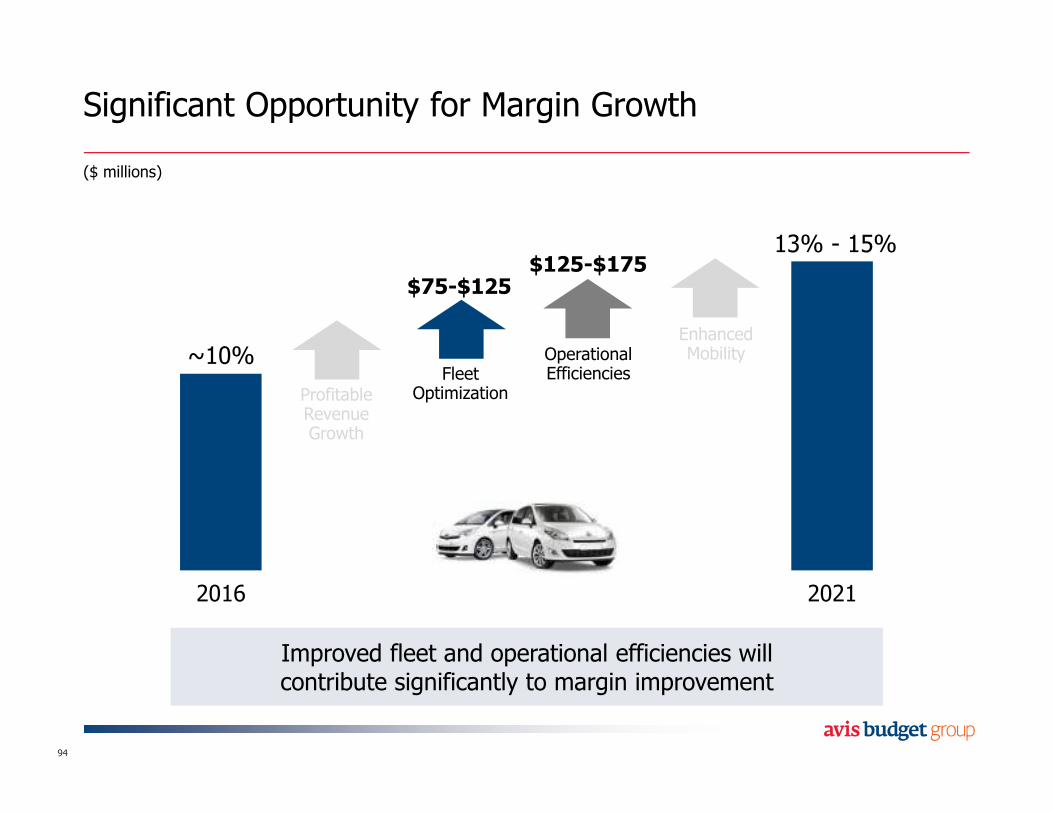
2016 2021
Significant Opportunity for Margin Growth
94
Improved fleet and operational efficiencies will contribute significantly to margin improvementImproved fleet and operational efficiencies will contribute significantly to margin improvement
$75-$125$125-$175
($ millions)
~10%
13% - 15%
� Industry leader in the car rental and car sharing markets
� Fleet optimization provides significant margin opportunity
� Operational efficiencies will drive significant cost savings
� Enablers to execution are innovation, technology and people
95
K E Y T A K E A W A Y S
Laser-Focused on Reducing Costs and Driving Margin Improvement

David Wyshner
President and Chief Financial Officer
Agenda
The Business Today
Margin Growth Opportunity
Going Forward
97
Free Cash Flow and Balance Sheet
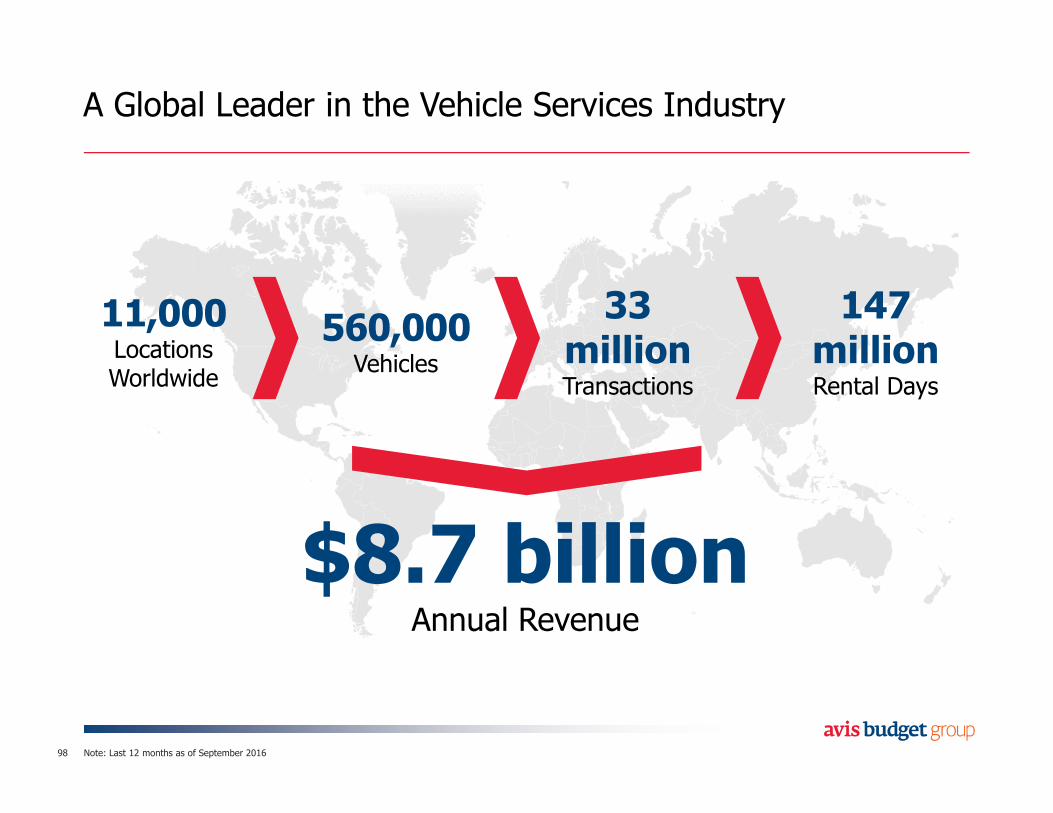
A Global Leader in the Vehicle Services Industry
98
11,000LocationsWorldwide
560,000Vehicles
33 millionTransactions
147 millionRental Days
$8.7 billionAnnual Revenue
Note: Last 12 months as of September 2016
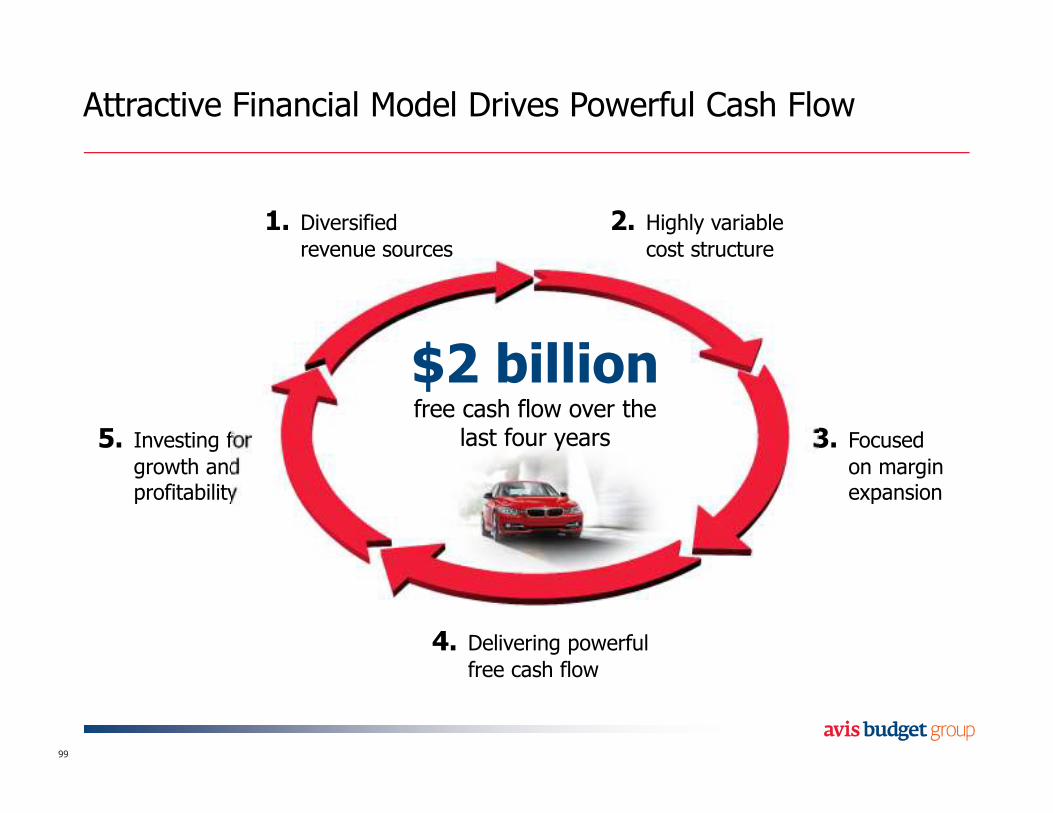
Attractive Financial Model Drives Powerful Cash Flow
99
1. Diversified revenue sources
2. Highly variable cost structure
3. Focused on margin expansion
5. Investing for growth and profitability
4. Delivering powerful free cash flow
$2 billionfree cash flow over the
last four years
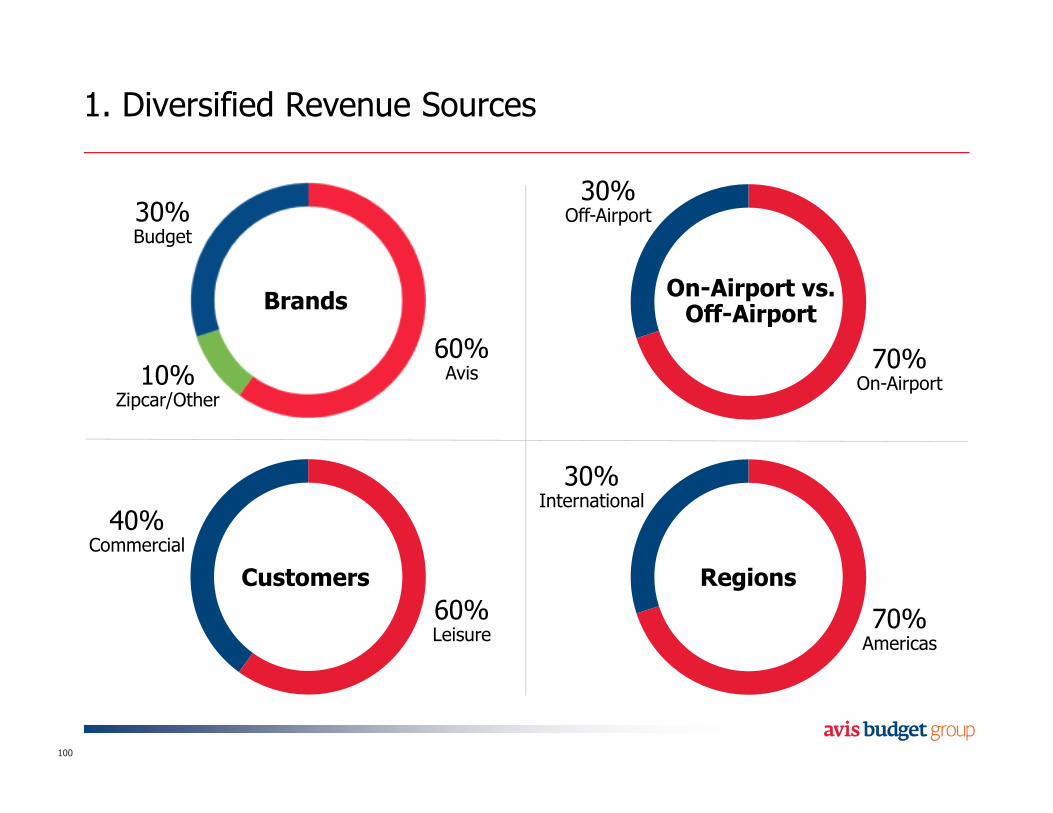
1. Diversified Revenue Sources
100
70%On-Airport
BrandsOn-Airport vs. Off-Airport
Customers Regions
30%Off-Airport
70%Americas
30%International
60%Leisure
40%Commercial
60%Avis10%
Zipcar/Other
30%Budget
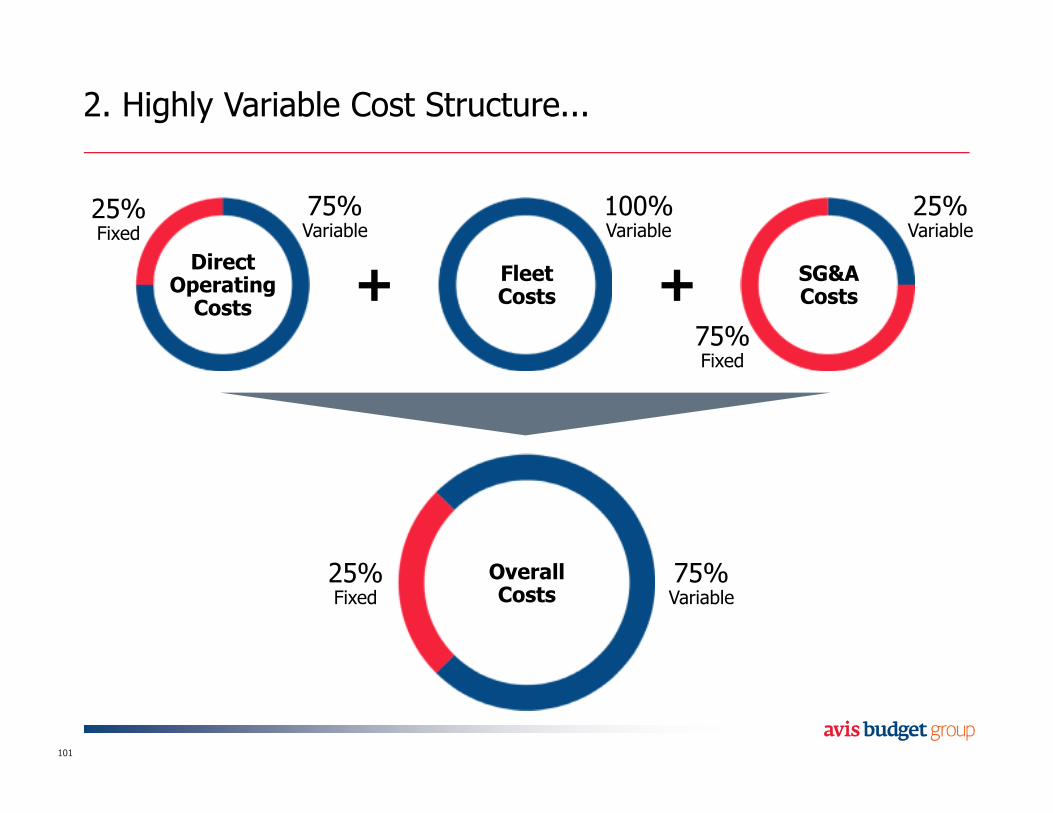
2. Highly Variable Cost Structure...
101
DirectOperatingCosts
FleetCosts
SG&ACosts
25%Fixed
75%Fixed
75%Variable
100%Variable
25%Variable
OverallCosts
25%Fixed
75%Variable
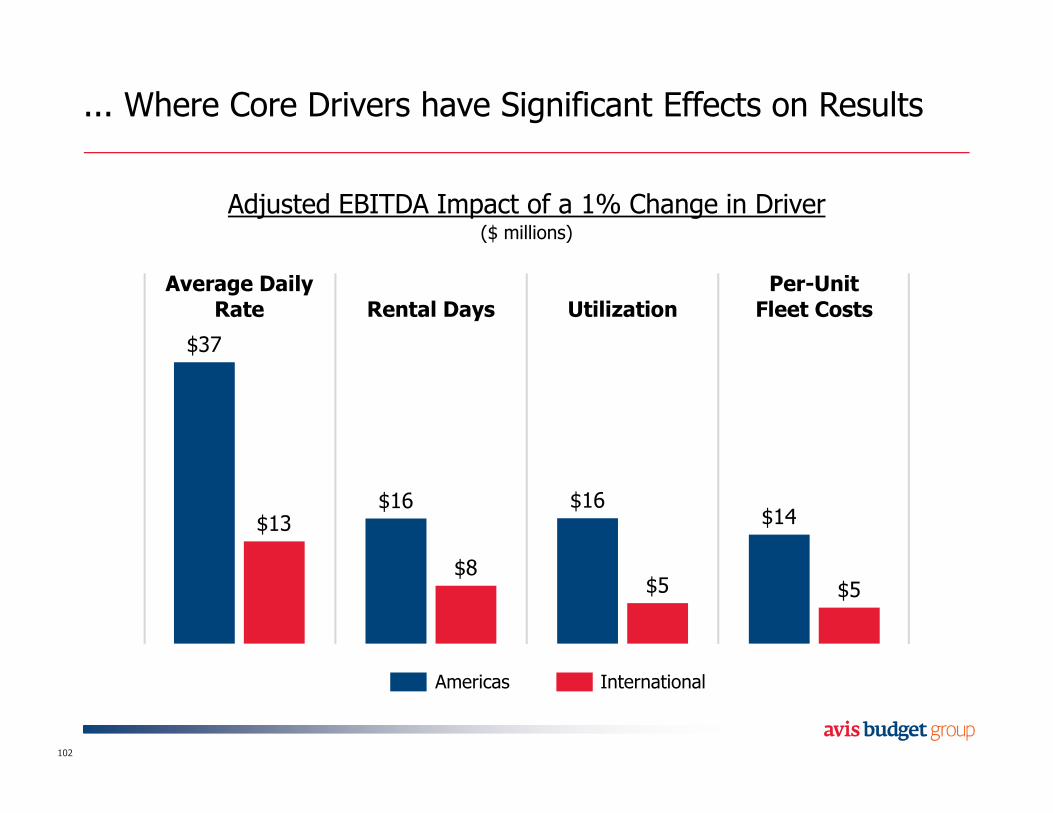
... Where Core Drivers have Significant Effects on Results
102
$37
$16 $16$14$13
$8$5 $5
Average DailyRate Rental Days Utilization
Per-UnitFleet Costs
Adjusted EBITDA Impact of a 1% Change in Driver($ millions)
Americas International
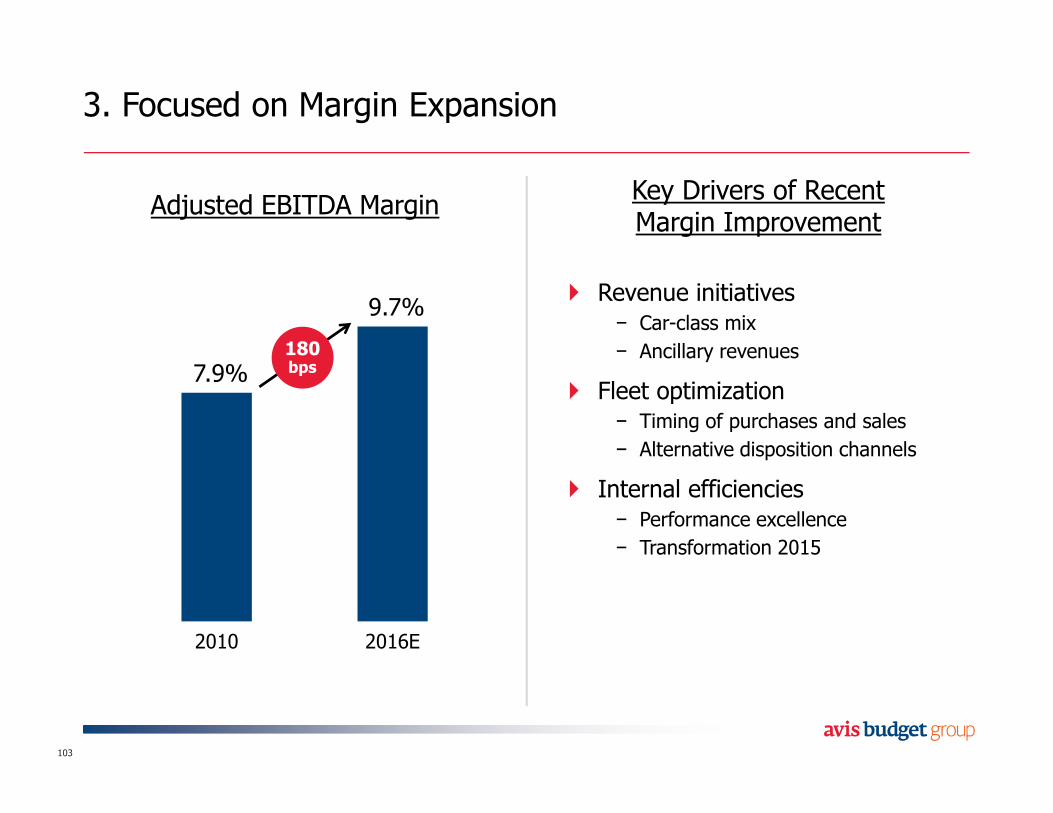
3. Focused on Margin Expansion
Adjusted EBITDA Margin
7.9%
9.7%
2010 2016E
180 bps
Key Drivers of RecentMargin Improvement
� Revenue initiatives− Car-class mix
− Ancillary revenues
� Fleet optimization− Timing of purchases and sales
− Alternative disposition channels
� Internal efficiencies− Performance excellence
− Transformation 2015
103
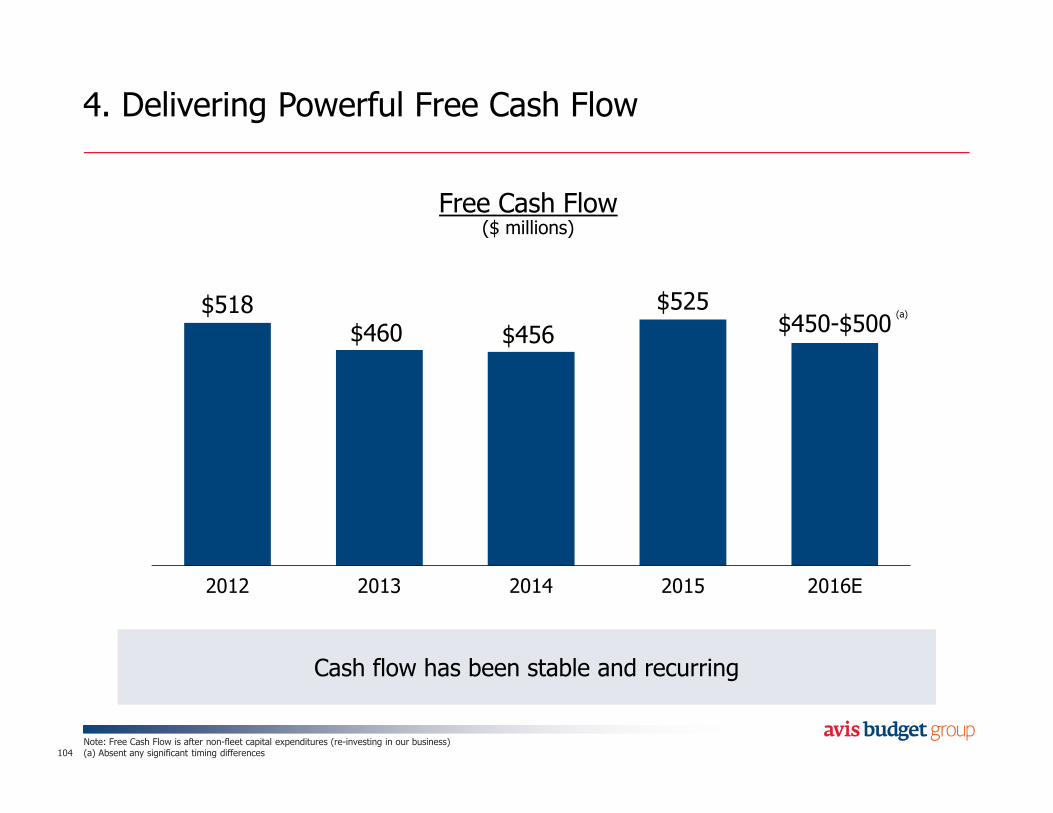
4. Delivering Powerful Free Cash Flow
Note: Free Cash Flow is after non-fleet capital expenditures (re-investing in our business)(a) Absent any significant timing differences104
Free Cash Flow($ millions)
$518$460 $456
$525$450-$500
2012 2013 2014 2015 2016E
Cash flow has been stable and recurringCash flow has been stable and recurring
(a)
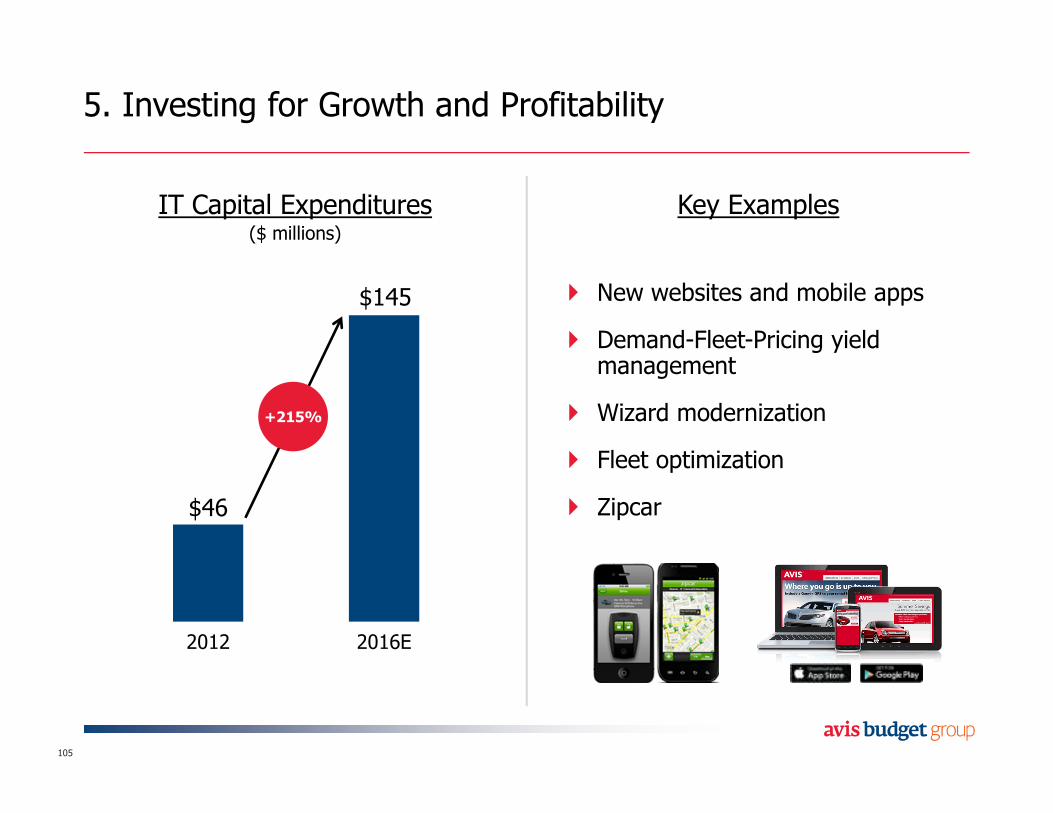
5. Investing for Growth and Profitability
IT Capital Expenditures($ millions)
105
$46
$145
2012 2016E
+215%
Key Examples
� New websites and mobile apps
� Demand-Fleet-Pricing yield management
� Wizard modernization
� Fleet optimization
� Zipcar
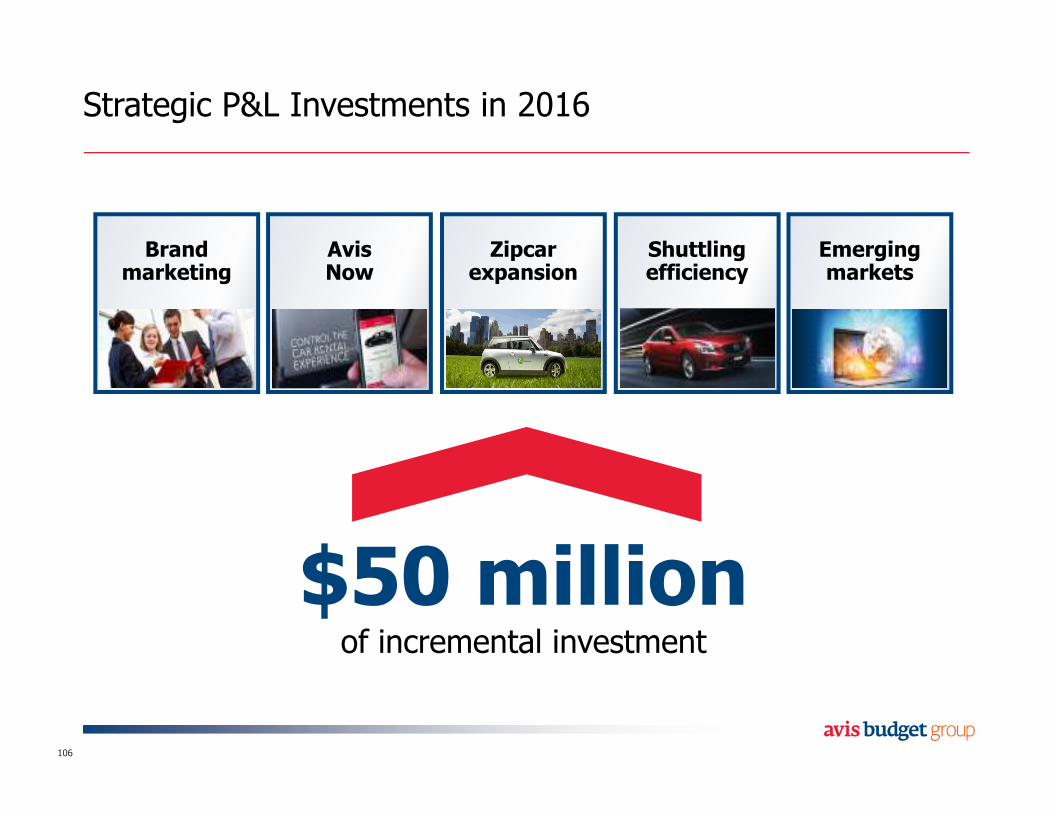
Strategic P&L Investments in 2016
106
Brandmarketing
AvisNow
Zipcarexpansion
Shuttlingefficiency
Emergingmarkets
$50 millionof incremental investment

Agenda
107
The Business Today
Margin Growth Opportunity
Going Forward
Free Cash Flow and Balance Sheet
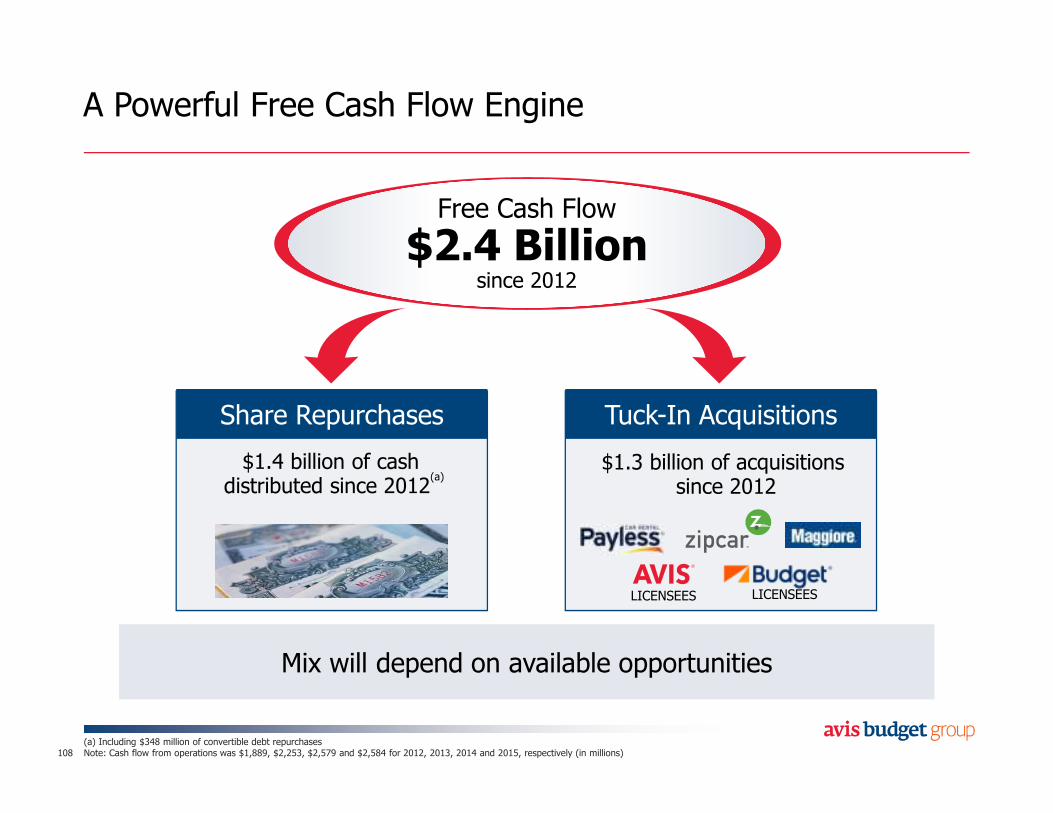
A Powerful Free Cash Flow Engine
(a) Including $348 million of convertible debt repurchasesNote: Cash flow from operations was $1,889, $2,253, $2,579 and $2,584 for 2012, 2013, 2014 and 2015, respectively (in millions)108
Free Cash Flow
$2.4 Billionsince 2012
Share Repurchases Tuck-In Acquisitions
$1.3 billion of acquisitionssince 2012
Mix will depend on available opportunitiesMix will depend on available opportunities
$1.4 billion of cash distributed since 2012
(a)
LICENSEES LICENSEES
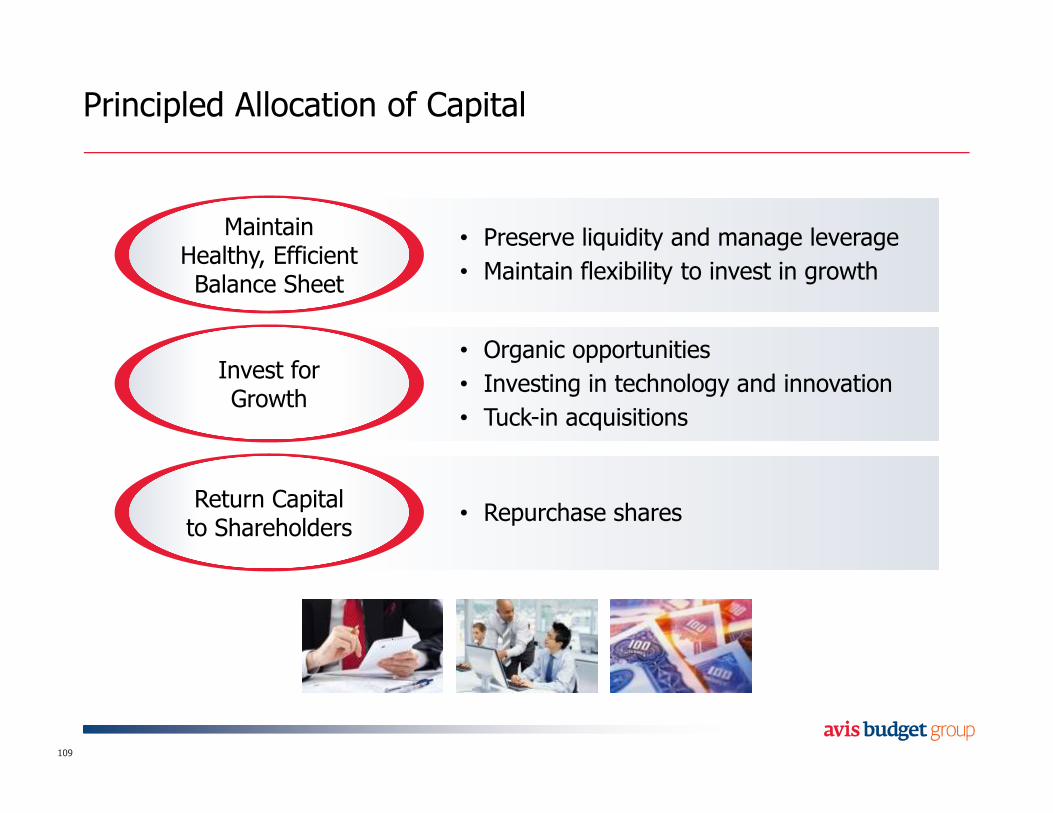
Principled Allocation of Capital
109
Maintain Healthy, Efficient Balance Sheet
Invest for Growth
Return Capital to Shareholders
• Preserve liquidity and manage leverage
• Maintain flexibility to invest in growth
• Repurchase shares
• Organic opportunities
• Investing in technology and innovation
• Tuck-in acquisitions
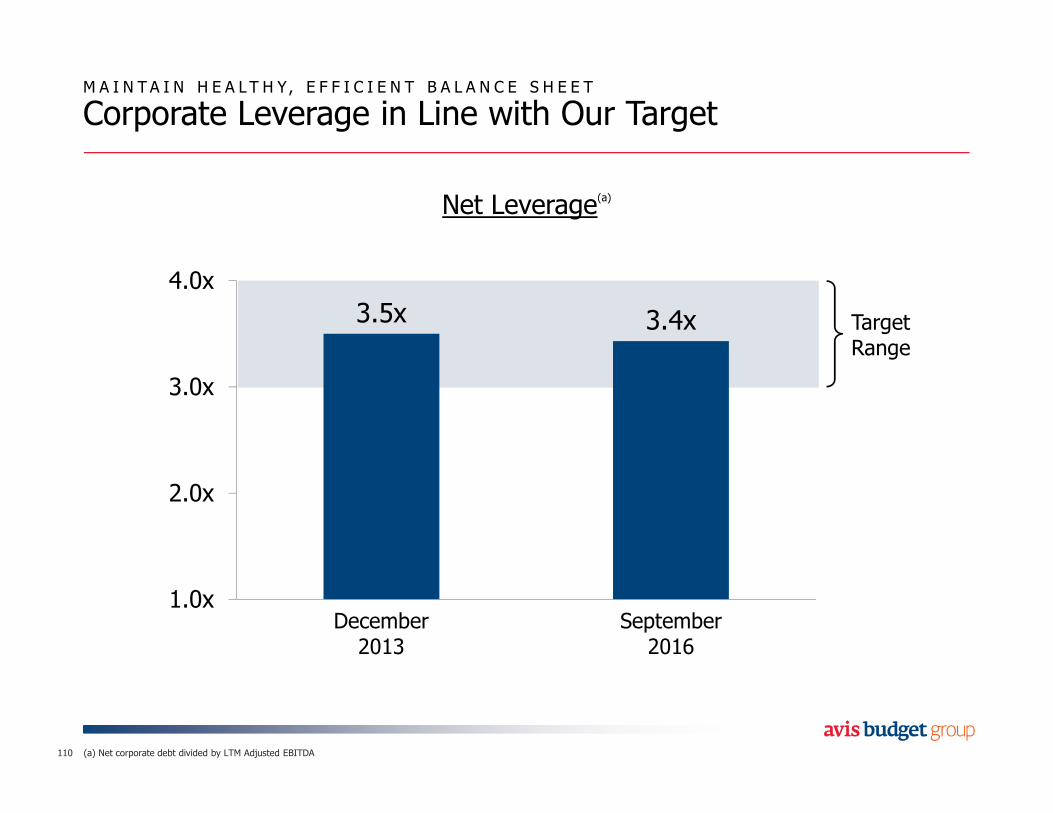
3.5x 3.4x
1.0x
2.0x
3.0x
4.0x
December2013
September2016
M A I N T A I N H E A L T H Y, E F F I C I E N T B A L A N C E S H E E T
Corporate Leverage in Line with Our Target
110
Net Leverage(a)
Target Range
(a) Net corporate debt divided by LTM Adjusted EBITDA
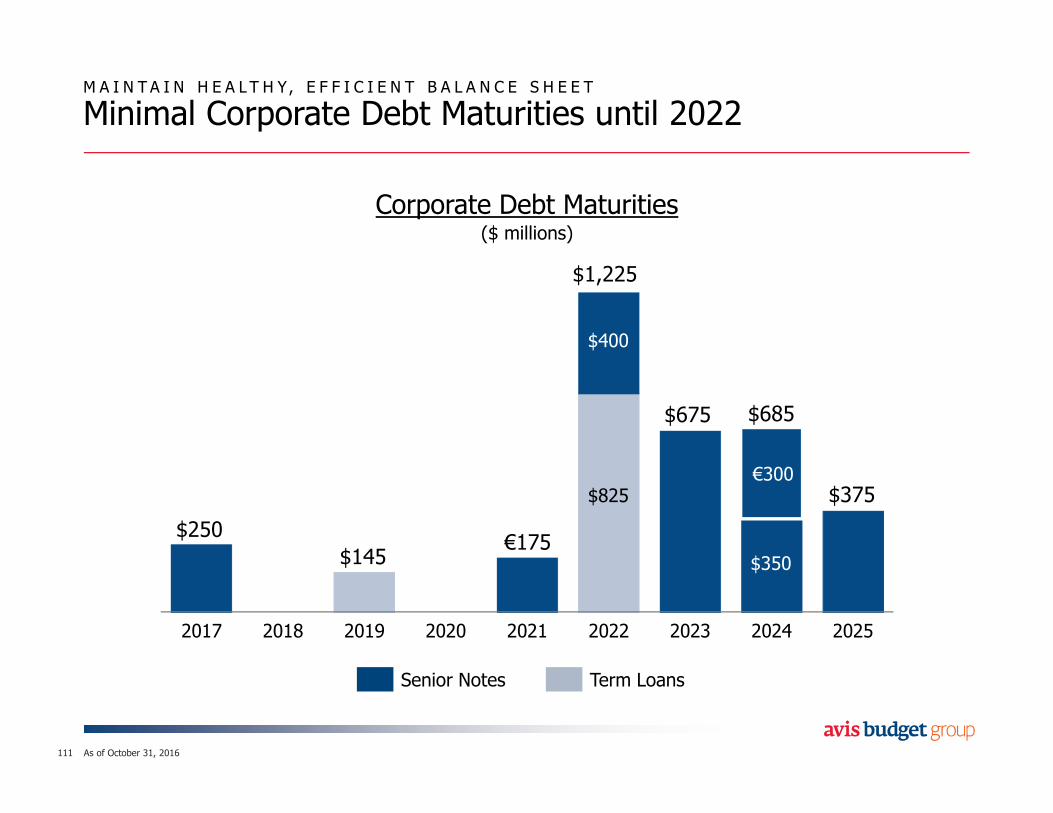
M A I N T A I N H E A L T H Y, E F F I C I E N T B A L A N C E S H E E T
Minimal Corporate Debt Maturities until 2022
111
Corporate Debt Maturities($ millions)
2017 2018 2019 2020 2021 2022 2023 2024 2025
$145€175
$250
$675
$1,225
$375
$685
$825
Senior Notes Term Loans
$400
€300
$350
As of October 31, 2016
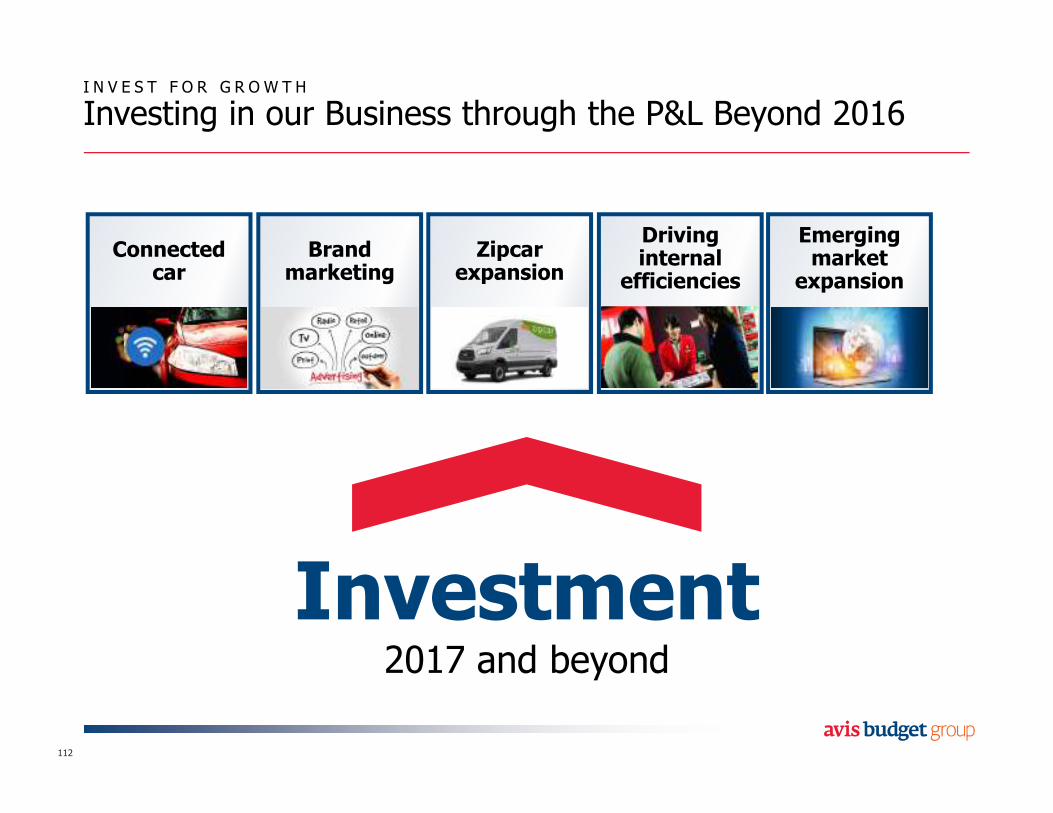
I N V E S T F O R G R O W T H
Investing in our Business through the P&L Beyond 2016
112
Connectedcar
Brandmarketing
Zipcarexpansion
Drivinginternal
efficiencies
Emergingmarket
expansion
Investment2017 and beyond
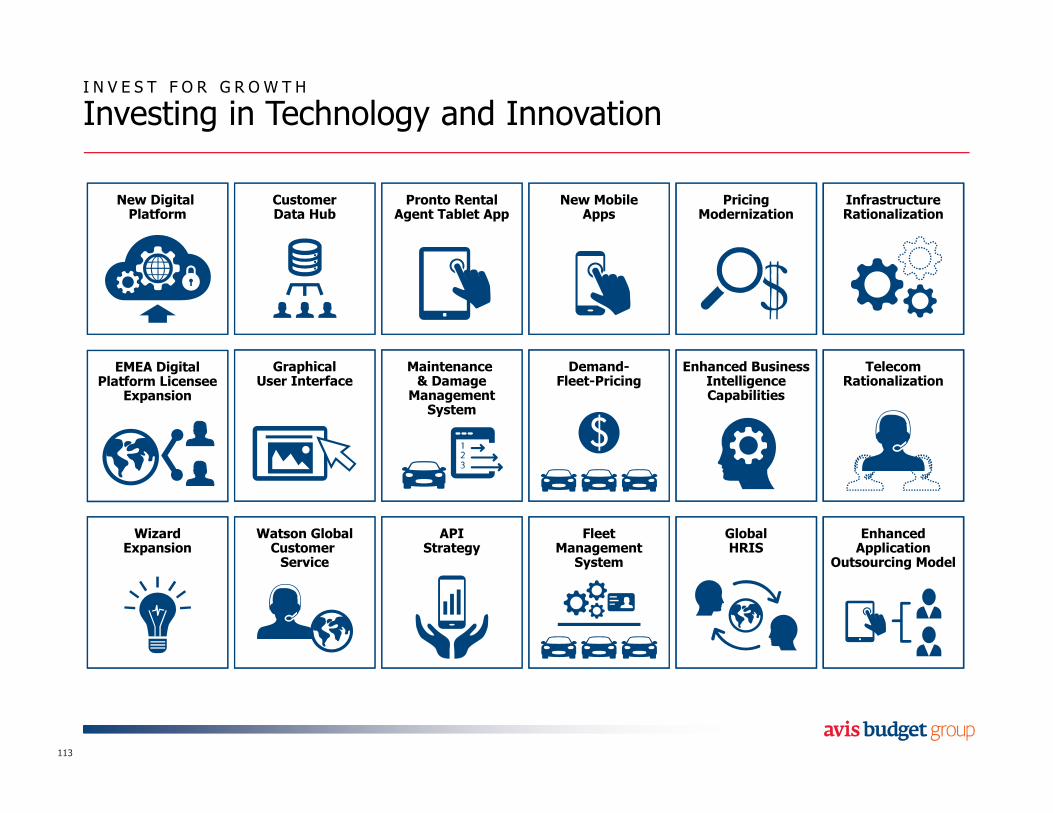
I N V E S T F O R G R O W T H
Investing in Technology and Innovation
113
TelecomRationalization
New Digital Platform
EMEA DigitalPlatform Licensee
Expansion
WizardExpansion
Customer Data Hub
GraphicalUser Interface
Watson GlobalCustomer Service
Pronto RentalAgent Tablet App
Maintenance & Damage
ManagementSystem
APIStrategy
New MobileApps
Demand-Fleet-Pricing
FleetManagement
System
PricingModernization
Enhanced BusinessIntelligenceCapabilities
GlobalHRIS
InfrastructureRationalization
EnhancedApplication
Outsourcing Model
R E T U R N C A P I T A L T O S H A R E H O L D E R S
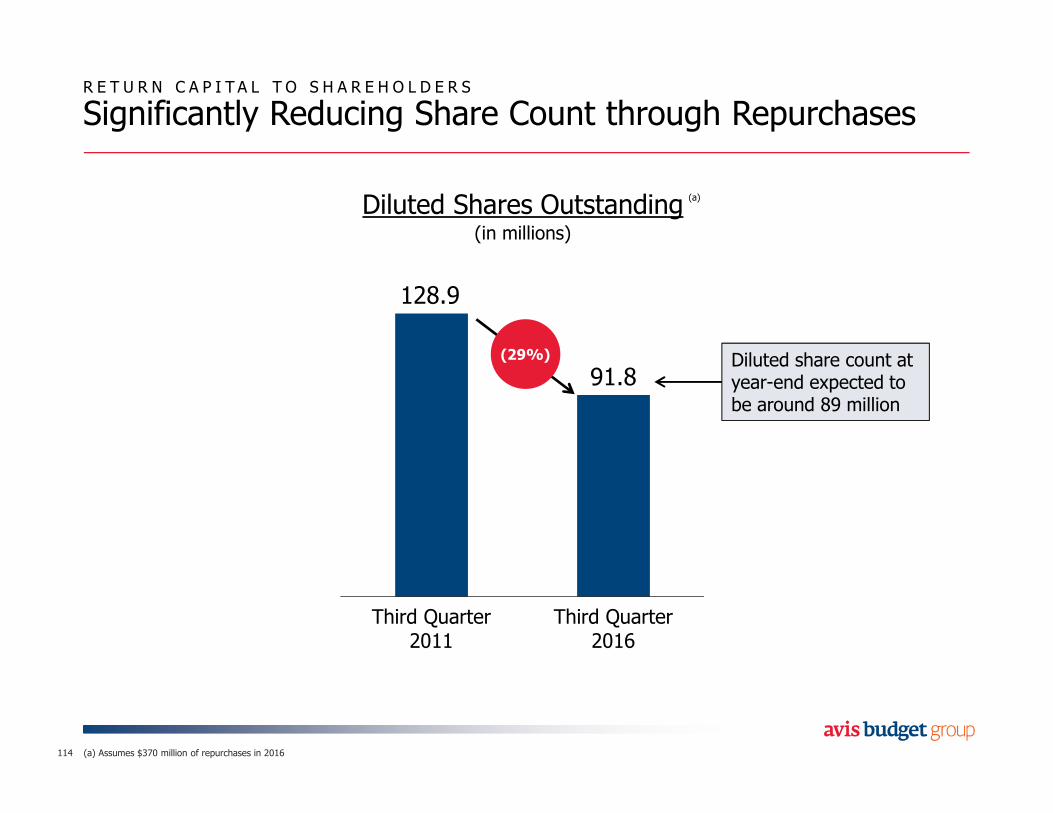
Significantly Reducing Share Count through Repurchases
(a) Assumes $370 million of repurchases in 2016114
Diluted Shares Outstanding(in millions)
128.9
91.8
Third Quarter2011
Third Quarter2016
(29%) Diluted share count at year-end expected to be around 89 million
(a)

Agenda
115
The Business Today
Margin Growth Opportunity
Going Forward
Free Cash Flow and Balance Sheet

An Evolved Strategy for an Evolving Landscape
116
1. Win Customers– Through differentiatedbrands and products
2. Increase Margins– Via revenue, fleet and cost optimization
EnablersEnablers
Driving Sustained,Profitable Growth
3. Succeed in Mobility– Position ourselves in evolving landscape
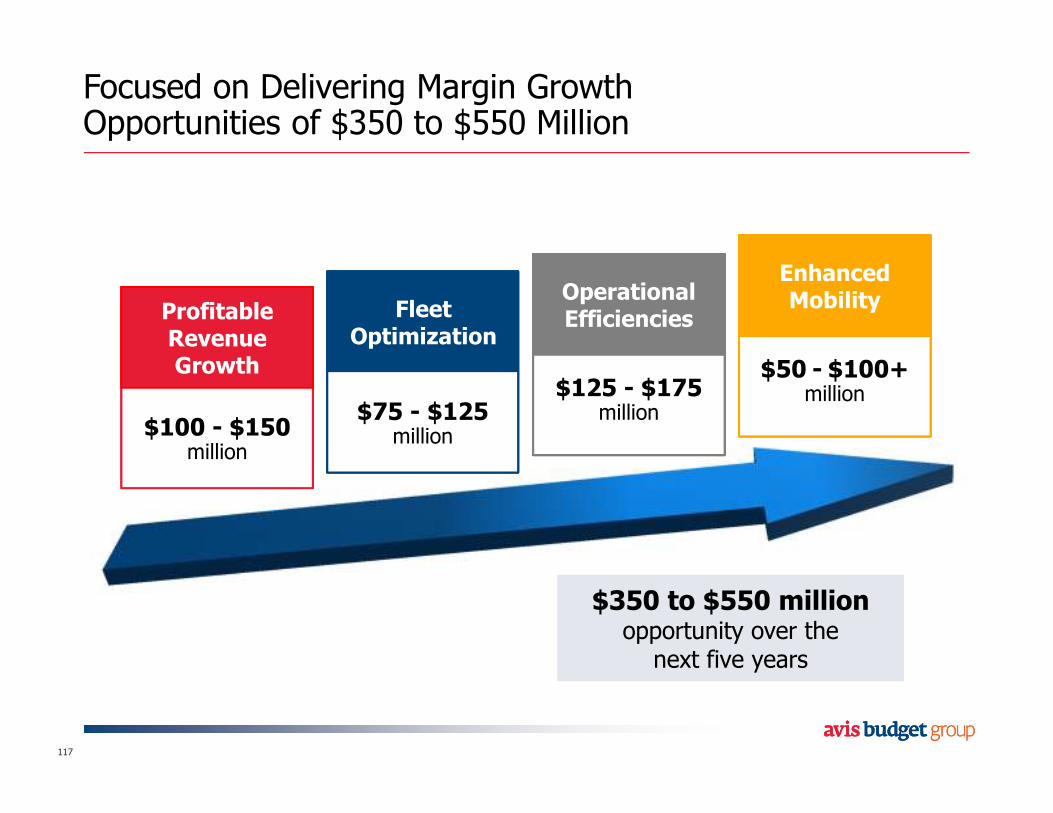
Focused on Delivering Margin GrowthOpportunities of $350 to $550 Million
117
$125 - $175million
Operational Efficiencies
$125 - $175million
Operational Efficiencies
$75 - $125million
Fleet Optimization
$75 - $125million
Fleet Optimization
$100 - $150million
ProfitableRevenue Growth
$100 - $150million
ProfitableRevenue Growth $50 - $100+
million
Enhanced Mobility
$50 - $100+million
Enhanced Mobility
$350 to $550 millionopportunity over thenext five years
$350 to $550 millionopportunity over thenext five years
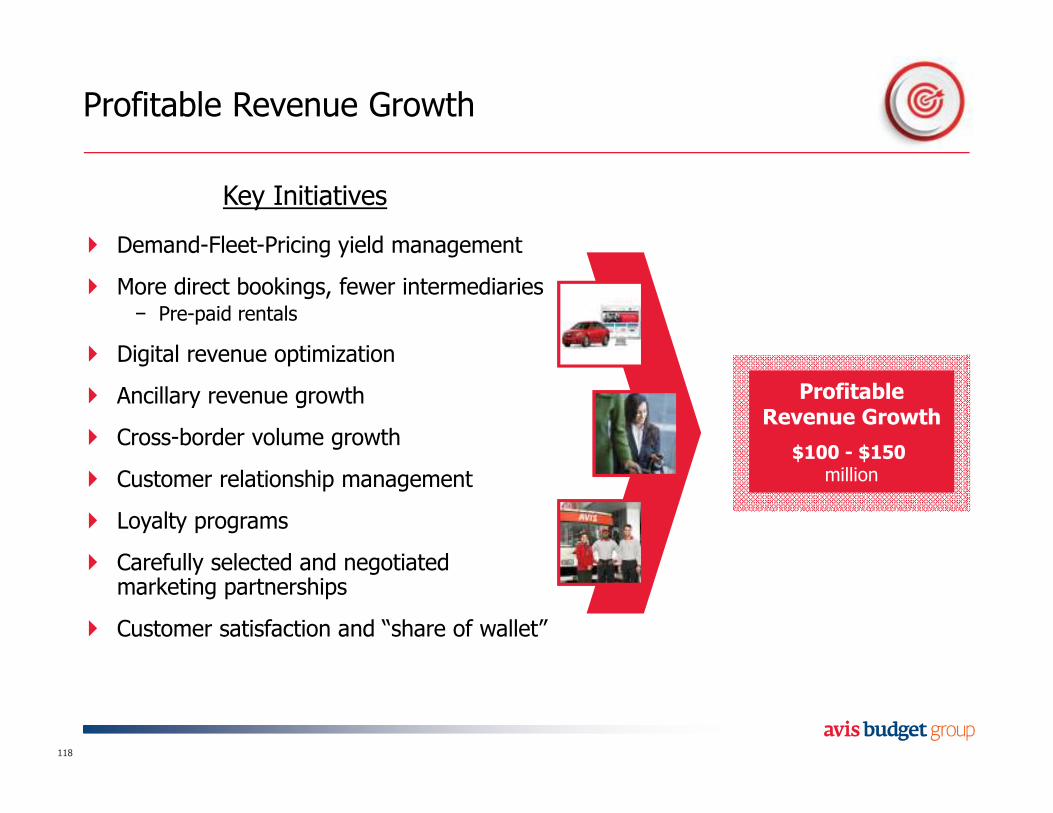
Profitable Revenue Growth
118
� Demand-Fleet-Pricing yield management
� More direct bookings, fewer intermediaries− Pre-paid rentals
� Digital revenue optimization
� Ancillary revenue growth
� Cross-border volume growth
� Customer relationship management
� Loyalty programs
� Carefully selected and negotiatedmarketing partnerships
� Customer satisfaction and “share of wallet”
$100 - $150 million
Profitable Revenue Growth
Key Initiatives
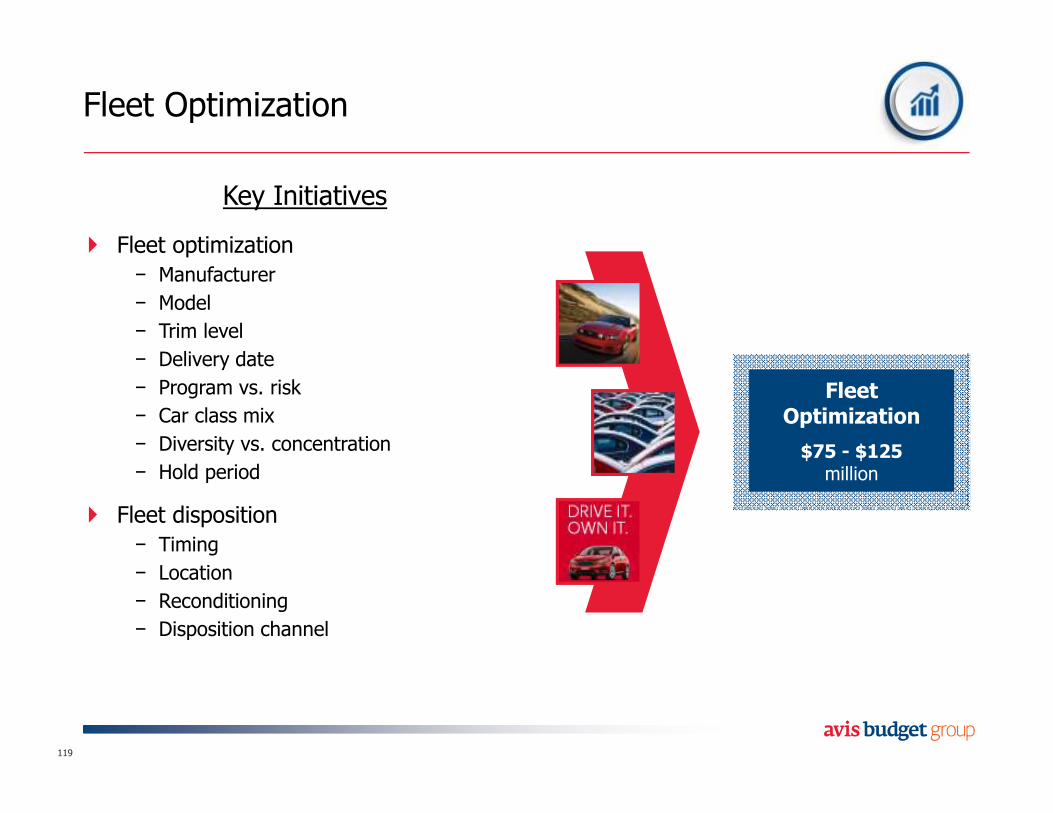
Fleet Optimization
119
� Fleet optimization
− Manufacturer
− Model
− Trim level
− Delivery date
− Program vs. risk
− Car class mix
− Diversity vs. concentration
− Hold period
� Fleet disposition
− Timing
− Location
− Reconditioning
− Disposition channel
$75 - $125million
Fleet Optimization
Key Initiatives
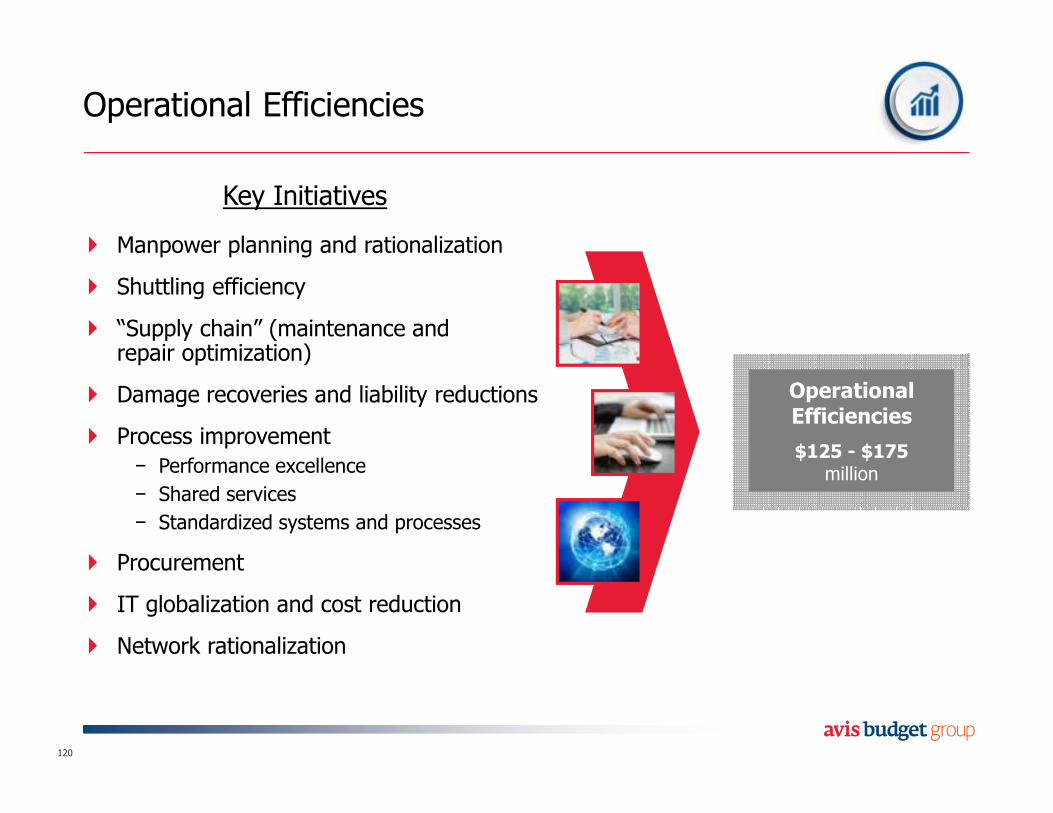
Operational Efficiencies
120
� Manpower planning and rationalization
� Shuttling efficiency
� “Supply chain” (maintenance and repair optimization)
� Damage recoveries and liability reductions
� Process improvement
− Performance excellence
− Shared services
− Standardized systems and processes
� Procurement
� IT globalization and cost reduction
� Network rationalization
$125 - $175million
Operational Efficiencies
Key Initiatives
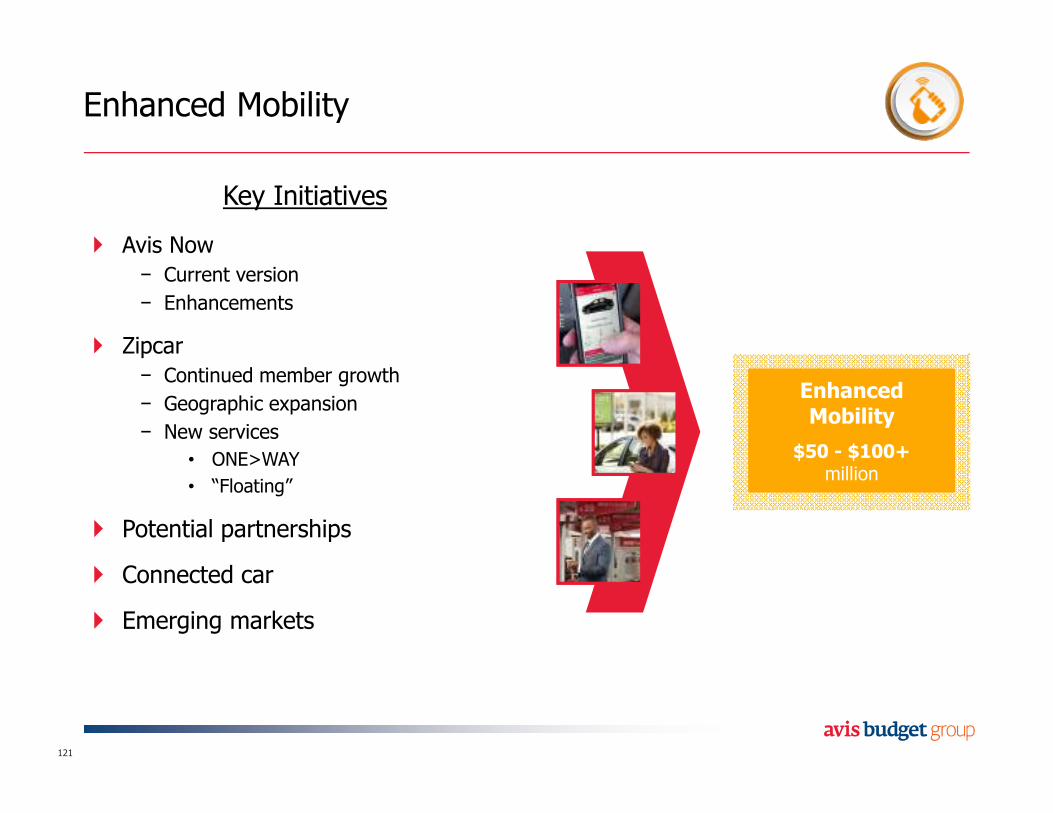
Enhanced Mobility
121
� Avis Now
− Current version
− Enhancements
� Zipcar
− Continued member growth
− Geographic expansion
− New services
• ONE>WAY
• “Floating”
� Potential partnerships
� Connected car
� Emerging markets
$50 - $100+million
Enhanced Mobility
Key Initiatives
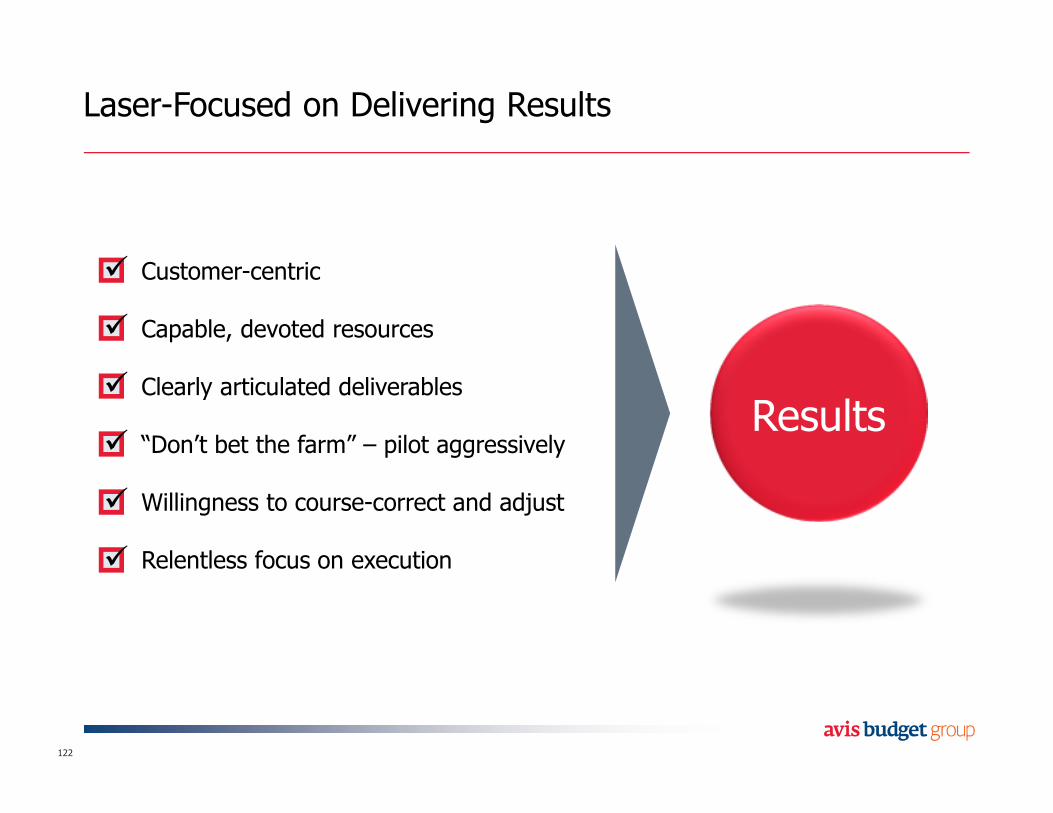
Laser-Focused on Delivering Results
122
Customer-centric
Capable, devoted resources
Clearly articulated deliverables
“Don’t bet the farm” – pilot aggressively
Willingness to course-correct and adjust
Relentless focus on execution
Results
�
�
�
�
�
�
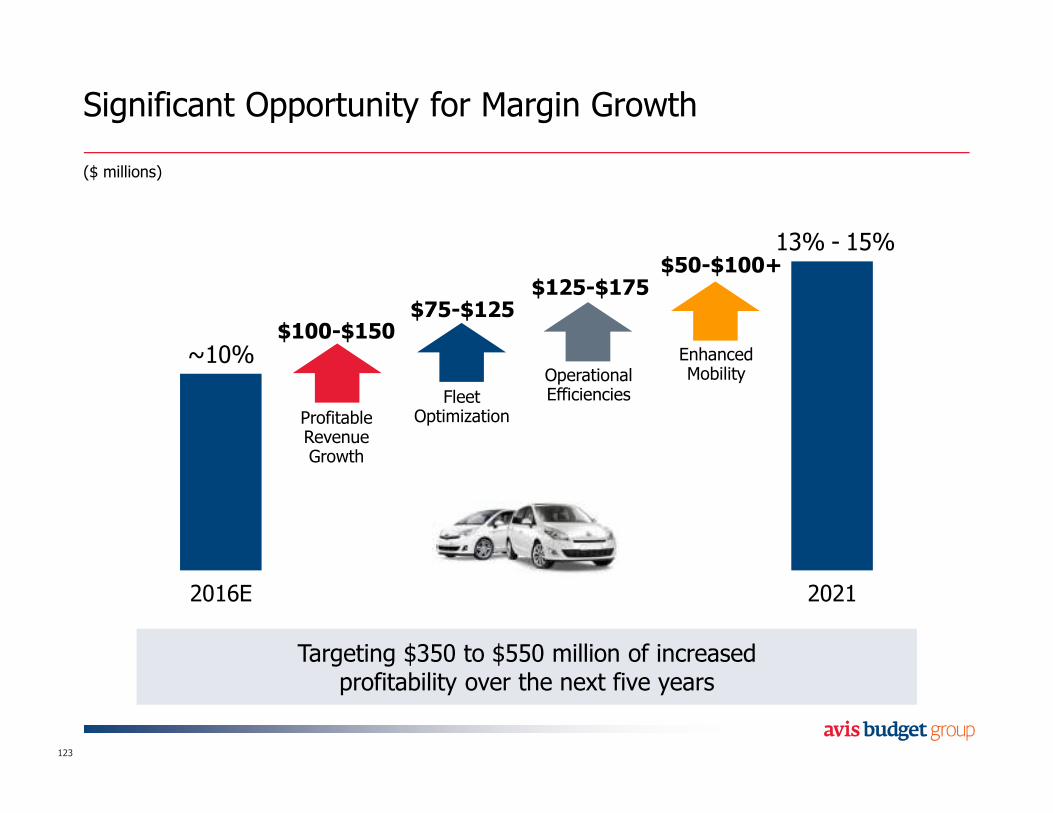
2016E 2021
Significant Opportunity for Margin Growth
123
Fleet Optimization
Operational Efficiencies
Profitable Revenue Growth
Enhanced Mobility
$100-$150$75-$125
$125-$175$50-$100+
($ millions)
~10%
13% - 15%
Targeting $350 to $550 million of increased profitability over the next five years
Targeting $350 to $550 million of increased profitability over the next five years
Agenda
124
The Business Today
Margin Growth Opportunity
Going Forward
Free Cash Flow and Balance Sheet
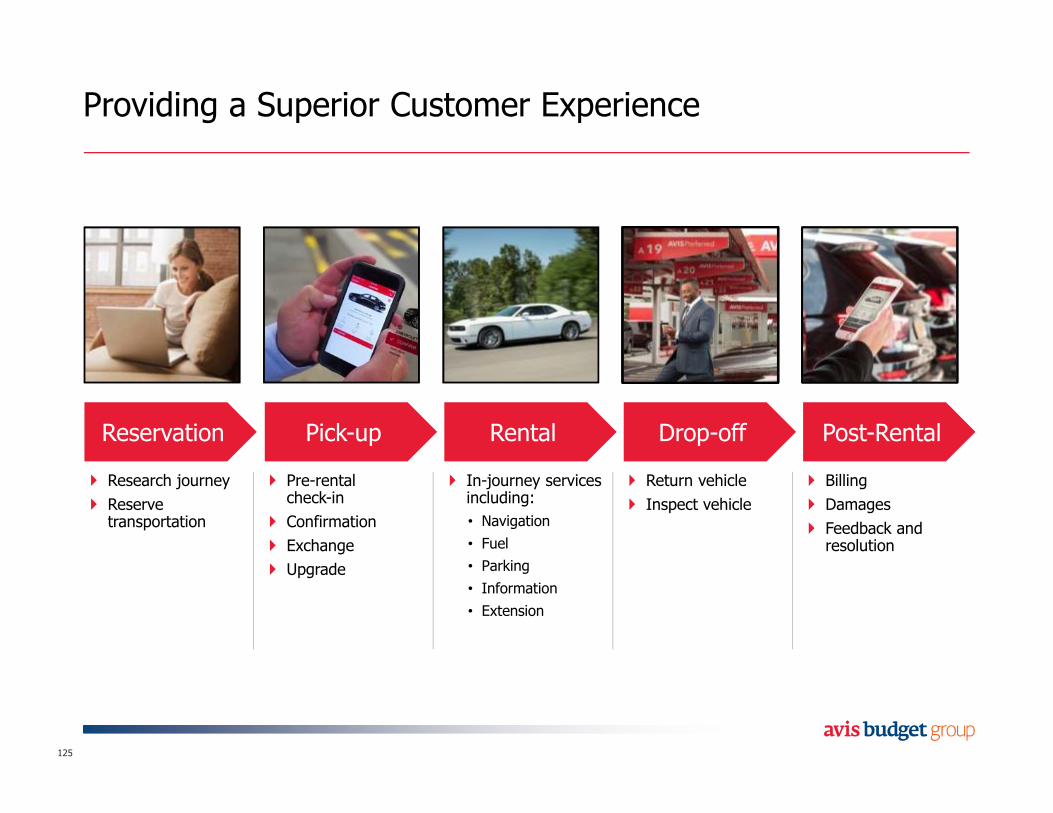
Providing a Superior Customer Experience
125
Reservation Pick-up Rental Drop-off Post-Rental
� Research journey
� Reserve transportation
� Pre-rental check-in
� Confirmation
� Exchange
� Upgrade
� In-journey services including:
• Navigation
• Fuel
• Parking
• Information
• Extension
� Return vehicle
� Inspect vehicle
� Billing
� Damages
� Feedback and resolution
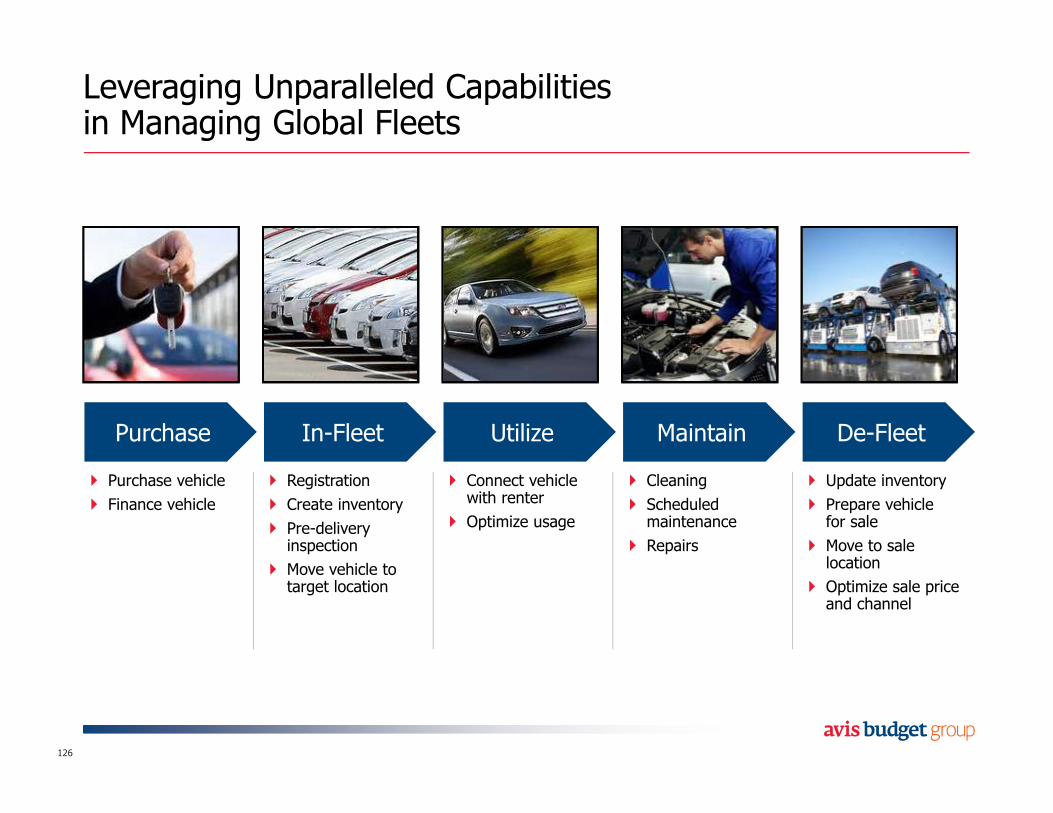
Leveraging Unparalleled Capabilities in Managing Global Fleets
126
Purchase In-Fleet Utilize Maintain De-Fleet
� Purchase vehicle
� Finance vehicle
� Registration
� Create inventory
� Pre-delivery inspection
� Move vehicle to target location
� Connect vehicle with renter
� Optimize usage
� Cleaning
� Scheduled maintenance
� Repairs
� Update inventory
� Prepare vehicle for sale
� Move to sale location
� Optimize sale price and channel
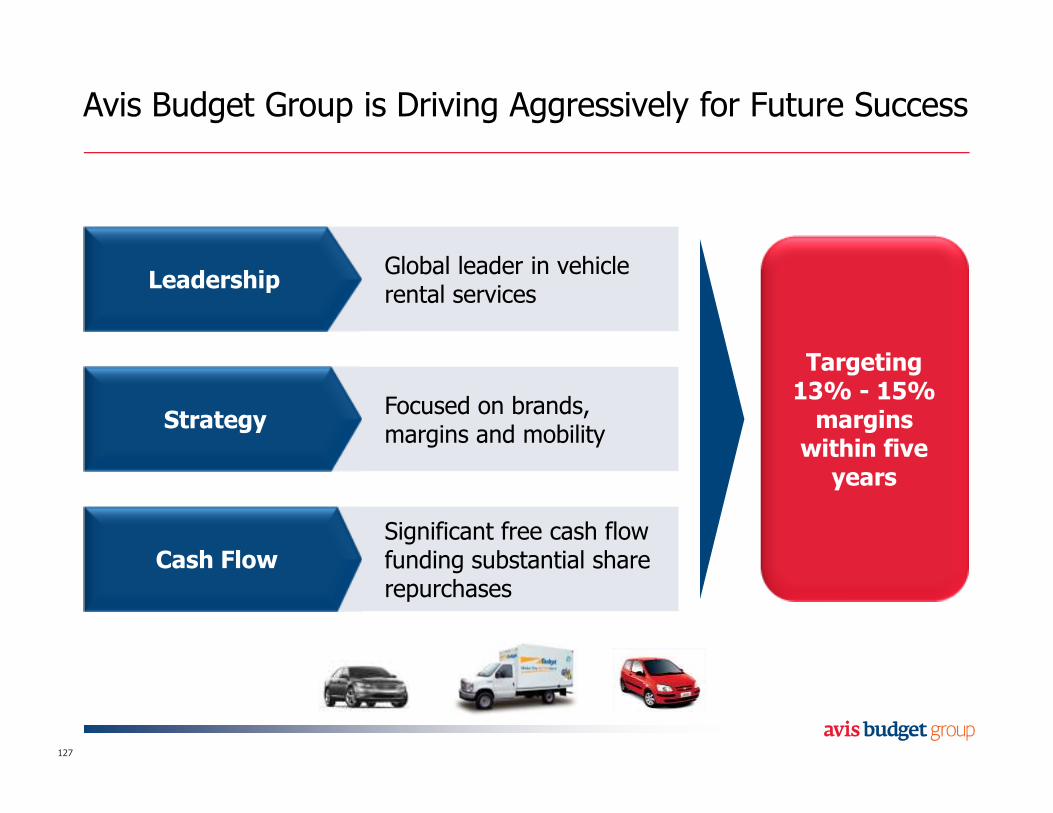
Avis Budget Group is Driving Aggressively for Future Success
127
Leadership
Strategy
Cash Flow
Global leader in vehicle rental services
Focused on brands, margins and mobility
Significant free cash flow funding substantial share repurchases
Targeting 13% - 15% margins within five
years
Avis Budget Group 2016 Investor Day
Glossary
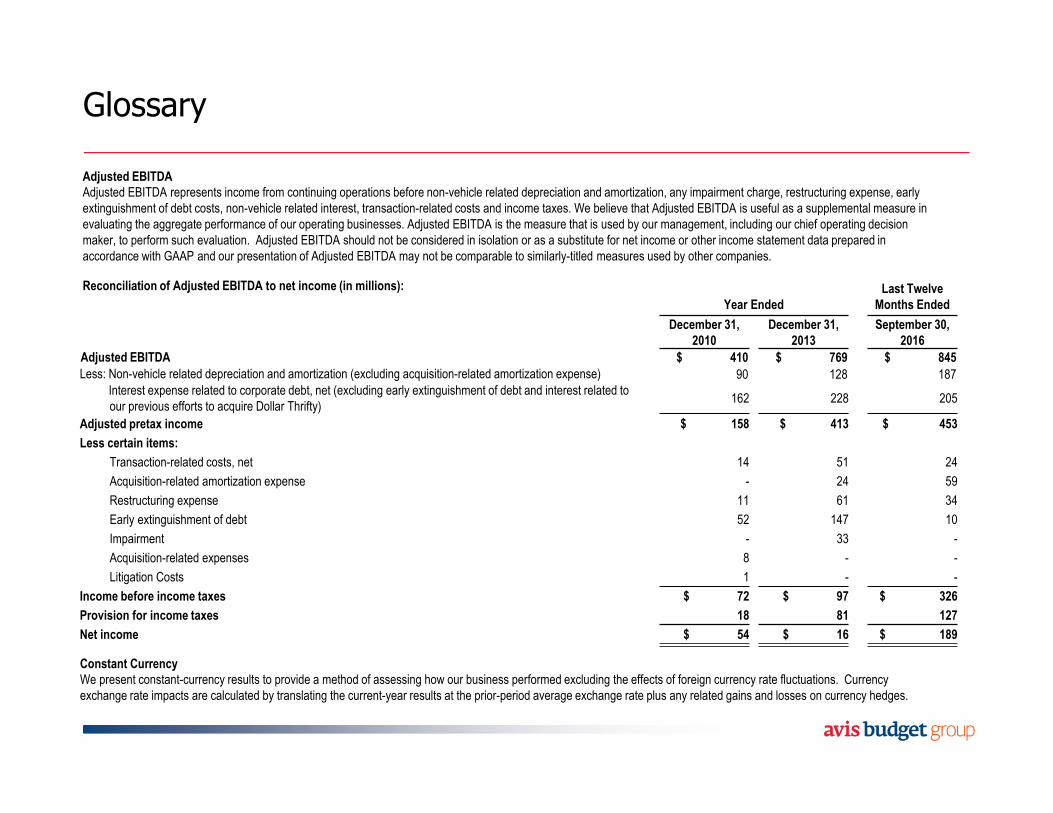
Adjusted EBITDAAdjusted EBITDA represents income from continuing operations before non-vehicle related depreciation and amortization, any impairment charge, restructuring expense, early
extinguishment of debt costs, non-vehicle related interest, transaction-related costs and income taxes. We believe that Adjusted EBITDA is useful as a supplemental measure in
evaluating the aggregate performance of our operating businesses. Adjusted EBITDA is the measure that is used by our management, including our chief operating decision
maker, to perform such evaluation. Adjusted EBITDA should not be considered in isolation or as a substitute for net income or other income statement data prepared in
accordance with GAAP and our presentation of Adjusted EBITDA may not be comparable to similarly-titled measures used by other companies.
Reconciliation of Adjusted EBITDA to net income (in millions):
Year EndedLast Twelve
Months Ended
December 31, 2010
December 31,2013
September 30,2016
Adjusted EBITDA $ 410 $ 769 $ 845
Less: Non-vehicle related depreciation and amortization (excluding acquisition-related amortization expense) 90 128 187
Less: Interest expense related to corporate debt, net (excluding early extinguishment of debt and interest related to
our previous efforts to acquire Dollar Thrifty)162 228 205
Adjusted pretax income $ 158 $ 413 $ 453
Less certain items:
Transaction-related costs, net 14 51 24
Acquisition-related amortization expense - 24 59
Restructuring expense 11 61 34
Early extinguishment of debt 52 147 10
Impairment - 33 -
Acquisition-related expenses 8 - -
Litigation Costs 1 - -
Income before income taxes $ 72 $ 97 $ 326
Provision for income taxes 18 81 127
Net income $ 54 $ 16 $ 189
Constant CurrencyWe present constant-currency results to provide a method of assessing how our business performed excluding the effects of foreign currency rate fluctuations. Currency
exchange rate impacts are calculated by translating the current-year results at the prior-period average exchange rate plus any related gains and losses on currency hedges.
Glossary
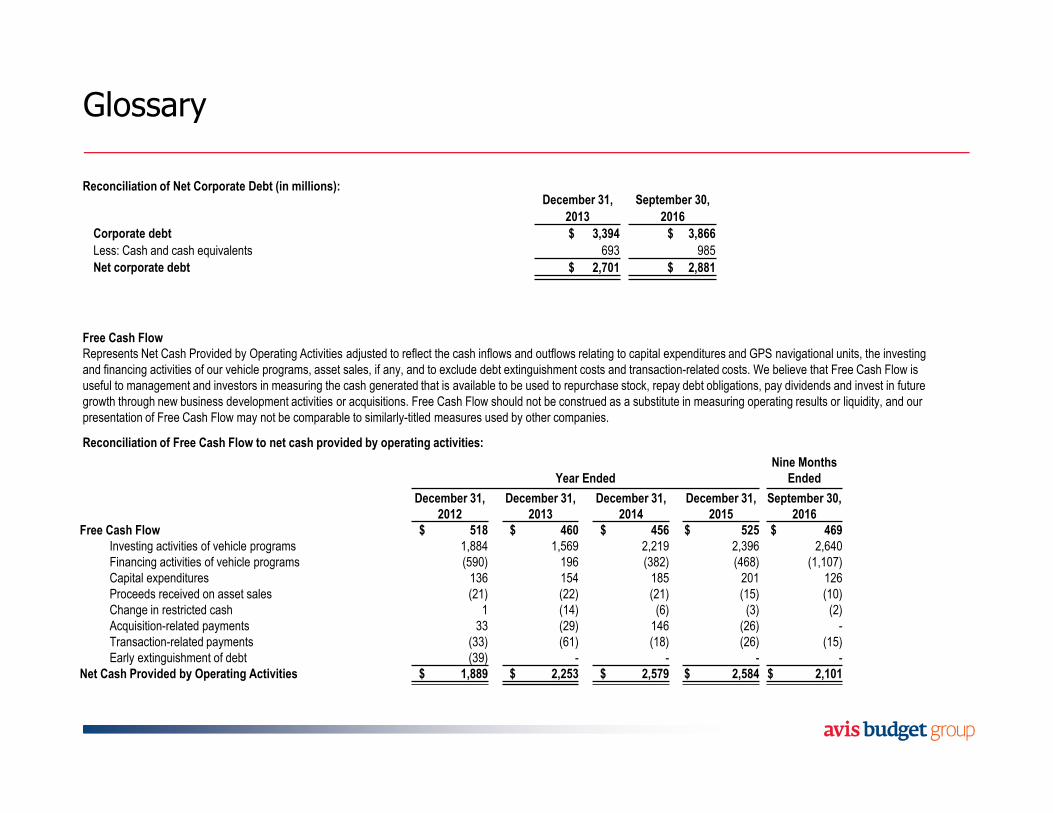
Reconciliation of Net Corporate Debt (in millions):December 31, September 30,
2013 2016
Corporate debt $ 3,394 $ 3,866
Less: Cash and cash equivalents 693 985
Net corporate debt $ 2,701 $ 2,881
Free Cash FlowRepresents Net Cash Provided by Operating Activities adjusted to reflect the cash inflows and outflows relating to capital expenditures and GPS navigational units, the investing
and financing activities of our vehicle programs, asset sales, if any, and to exclude debt extinguishment costs and transaction-related costs. We believe that Free Cash Flow is
useful to management and investors in measuring the cash generated that is available to be used to repurchase stock, repay debt obligations, pay dividends and invest in future
growth through new business development activities or acquisitions. Free Cash Flow should not be construed as a substitute in measuring operating results or liquidity, and our
presentation of Free Cash Flow may not be comparable to similarly-titled measures used by other companies.
Reconciliation of Free Cash Flow to net cash provided by operating activities:
Year EndedNine Months
Ended
December 31, 2012
December 31, 2013
December 31, 2014
December 31, 2015
September 30, 2016
Free Cash Flow $ 518 $ 460 $ 456 $ 525 $ 469Investing activities of vehicle programs 1,884 1,569 2,219 2,396 2,640
Financing activities of vehicle programs (590) 196 (382) (468) (1,107)
Capital expenditures 136 154 185 201 126
Proceeds received on asset sales (21) (22) (21) (15) (10)
Change in restricted cash 1 (14) (6) (3) (2)
Acquisition-related payments 33 (29) 146 (26) -
Transaction-related payments (33) (61) (18) (26) (15)
Early extinguishment of debt (39) - - - -
Net Cash Provided by Operating Activities $ 1,889 $ 2,253 $ 2,579 $ 2,584 $ 2,101