Investor Relations | page 1. Investor Relations | page 2 Overview of Unibanco.
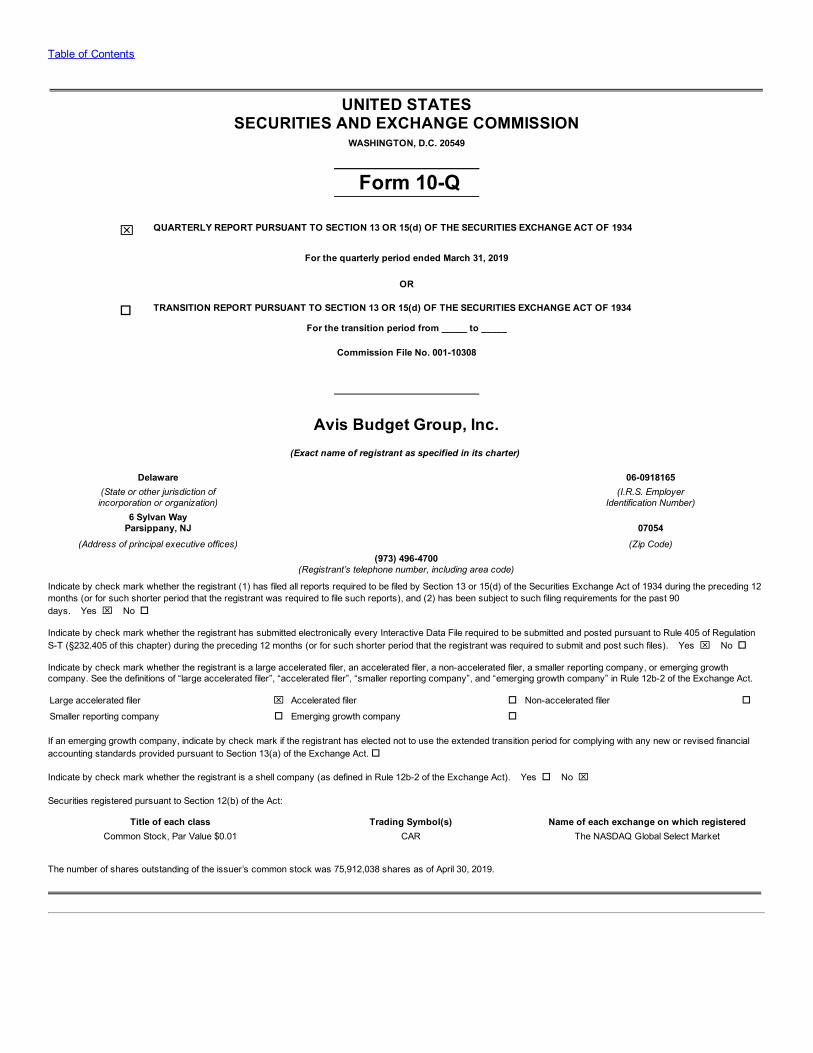
Table of Contents
UNITED STATES
SECURITIES AND EXCHANGE COMMISSIONWASHINGTON, D.C. 20549
Form 10-Q
x QUARTERLY REPORT PURSUANT TO SECTION 13 OR 15(d) OF THE SECURITIES EXCHANGE ACT OF 1934
For the quarterly period ended March 31, 2019
OR
o TRANSITION REPORT PURSUANT TO SECTION 13 OR 15(d) OF THE SECURITIES EXCHANGE ACT OF 1934
For the transition period from _____ to _____
Commission File No. 001-10308
Avis Budget Group, Inc.(Exact name of registrant as specified in its charter)
Delaware 06-0918165(State or other jurisdiction ofincorporation or organization)
(I.R.S. EmployerIdentification Number)
6 Sylvan WayParsippany, NJ 07054
(Address of principal executive offices) (Zip Code)
(973) 496-4700
(Registrant’s telephone number, including area code) Indicate by check mark whether the registrant (1) has filed all reports required to be filed by Section 13 or 15(d) of the Securities Exchange Act of 1934 during the preceding 12months (or for such shorter period that the registrant was required to file such reports), and (2) has been subject to such filing requirements for the past 90days. Yes x No o
Indicate by check mark whether the registrant has submitted electronically every Interactive Data File required to be submitted and posted pursuant to Rule 405 of RegulationS-T (§232.405 of this chapter) during the preceding 12 months (or for such shorter period that the registrant was required to submit and post such files). Yes x No o
Indicate by check mark whether the registrant is a large accelerated filer, an accelerated filer, a non-accelerated filer, a smaller reporting company, or emerging growthcompany. See the definitions of “large accelerated filer”, “accelerated filer”, “smaller reporting company”, and “emerging growth company” in Rule 12b-2 of the Exchange Act.
Large accelerated filer x Accelerated filer o Non-accelerated filer oSmaller reporting company o Emerging growth company o
If an emerging growth company, indicate by check mark if the registrant has elected not to use the extended transition period for complying with any new or revised financialaccounting standards provided pursuant to Section 13(a) of the Exchange Act. o
Indicate by check mark whether the registrant is a shell company (as defined in Rule 12b-2 of the Exchange Act). Yes o No x
Securities registered pursuant to Section 12(b) of the Act:
Title of each class Trading Symbol(s) Name of each exchange on which registeredCommon Stock, Par Value $0.01 CAR The NASDAQ Global Select Market
The number of shares outstanding of the issuer’s common stock was 75,912,038 shares as of April 30, 2019.
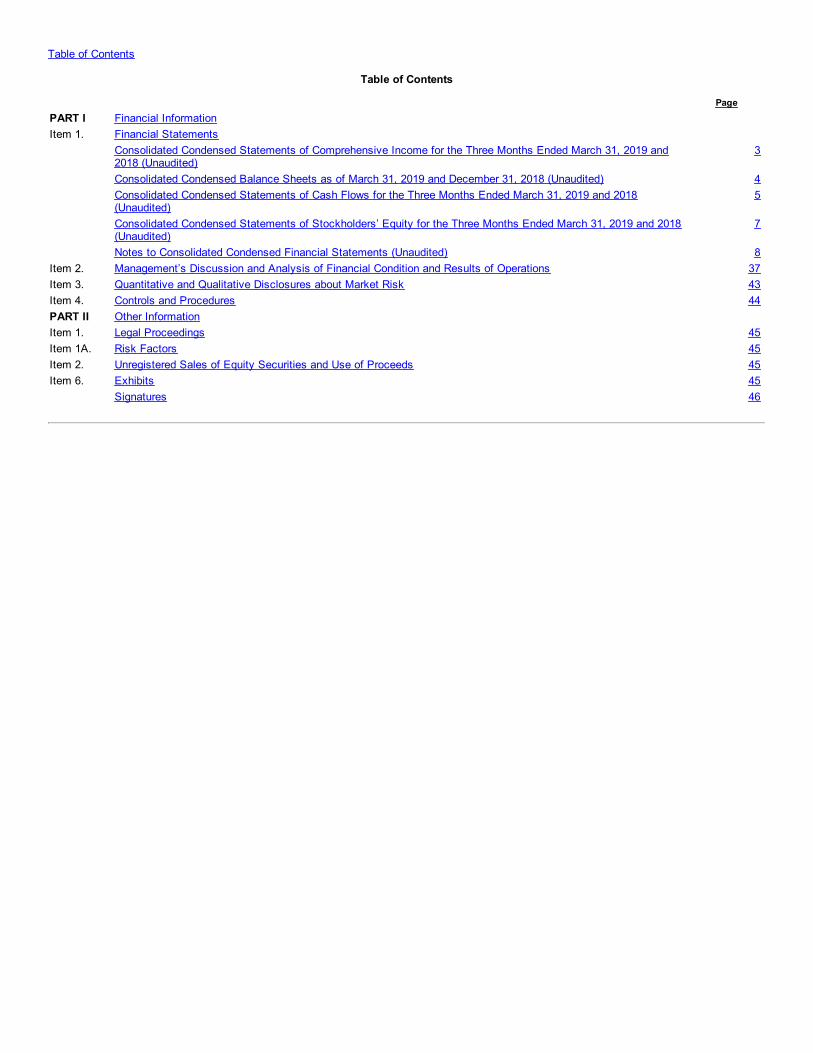
Table of Contents
Table of Contents
PagePART I Financial Information Item 1. Financial Statements
Consolidated Condensed Statements of Comprehensive Income for the Three Months Ended March 31, 2019 and2018 (Unaudited)
3
Consolidated Condensed Balance Sheets as of March 31, 2019 and December 31, 2018 (Unaudited) 4
Consolidated Condensed Statements of Cash Flows for the Three Months Ended March 31, 2019 and 2018(Unaudited)
5
Consolidated Condensed Statements of Stockholders’ Equity for the Three Months Ended March 31, 2019 and 2018(Unaudited)
7
Notes to Consolidated Condensed Financial Statements (Unaudited) 8Item 2. Management’s Discussion and Analysis of Financial Condition and Results of Operations 37Item 3. Quantitative and Qualitative Disclosures about Market Risk 43Item 4. Controls and Procedures 44PART II Other Information Item 1. Legal Proceedings 45Item 1A. Risk Factors 45Item 2. Unregistered Sales of Equity Securities and Use of Proceeds 45Item 6. Exhibits 45 Signatures 46
Table of Contents
FORWARD-LOOKING STATEMENTS
Certain statements contained in this Quarterly Report on Form 10-Q may be considered “forward-looking statements” as that term is defined in thePrivate Securities Litigation Reform Act of 1995. The forward-looking statements contained herein are subject to known and unknown risks,uncertainties, assumptions and other factors that may cause our actual results, performance or achievements to be materially different from thoseexpressed or implied by any such forward-looking statements. Forward-looking statements include information concerning our future financialperformance, business strategy, projected plans and objectives. These statements may be identified by the fact that they do not relate tohistorical or current facts and may use words such as “believes,” “expects,” “anticipates,” “will,” “should,” “could,” “may,” “would,” “intends,”“projects,” “estimates,” “plans,” and similar words, expressions or phrases. The following important factors and assumptions could affect our futureresults and could cause actual results to differ materially from those expressed in such forward-looking statements:
• the high level of competition in the mobility industry, including from new companies or technology, and the impact such competition mayhave on pricing and rental volume;
• a change in our fleet costs as a result of a change in the cost of new vehicles, manufacturer recalls, disruption in the supply of newvehicles, and/or a change in the price at which we dispose of used vehicles either in the used vehicle market or under repurchase orguaranteed depreciation programs;
• the results of operations or financial condition of the manufacturers of our cars, which could impact their ability to perform their paymentobligations under our agreements with them, including repurchase and/or guaranteed depreciation arrangements, and/or their willingness orability to make cars available to us or the rental car industry as a whole on commercially reasonable terms or at all;
• a change in travel demand, including changes or disruptions in airline passenger traffic;
• any change in economic conditions generally, particularly during our peak season or in key market segments;
• an occurrence or threat of terrorism, pandemic disease, natural disasters, military conflict, civil unrest or political instability in the locationsin which we operate;
• any substantial changes in the cost or supply of fuel, vehicle parts, energy, labor or other resources on which we depend to operate ourbusiness;
• our ability to continue to successfully implement our business strategies, achieve and maintain cost savings and adapt our business tochanges in mobility;
• political, economic or commercial instability in the countries in which we operate, and our ability to conform to multiple and conflicting lawsor regulations in those countries;
• our dependence on third-party distribution channels, third-party suppliers of other services and co-marketing arrangements with thirdparties;
• our dependence on the performance and retention of our senior management and key employees;
• risks related to completed or future acquisitions or investments that we may pursue, including the incurrence of incremental indebtednessto help fund such transactions and our ability to promptly and effectively integrate any acquired businesses or capitalize on joint ventures,partnerships and other investments;
• our ability to utilize derivative instruments, and the impact of derivative instruments we utilize, which can be affected by fluctuations ininterest rates, gasoline prices and exchange rates, changes in government regulations and other factors;
• our exposure to uninsured or unpaid claims in excess of historical levels;
1
Table of Contents
• risks associated with litigation, governmental or regulatory inquiries, or any failure or inability to comply with laws, regulations orcontractual obligations or any changes in laws, regulations or contractual obligations, including with respect to personally identifiableinformation and consumer privacy, labor and employment, and tax;
• risks related to protecting the integrity of, and preventing unauthorized access to, our information technology systems or those of our third-party vendors, and protecting the confidential information of our employees and customers against security breaches, including physical orcybersecurity breaches, attacks, or other disruptions, and compliance with privacy and data protection regulation;
• any impact on us from the actions of our licensees, dealers, third-party vendors and independent contractors;
• any major disruptions in our communication networks or information systems;
• risks related to tax obligations and the effect of future changes in tax laws and accounting standards;
• risks related to our indebtedness, including our substantial outstanding debt obligations, potential interest rate increases, and our ability toincur substantially more debt;
• our ability to obtain financing for our global operations, including the funding of our vehicle fleet through the issuance of asset-backedsecurities and use of the global lending markets;
• our ability to meet the financial and other covenants contained in the agreements governing our indebtedness;
• our ability to accurately estimate our future results; and
• other business, economic, competitive, governmental, regulatory, political or technological factors affecting our operations, pricing orservices.
We operate in a continuously changing business environment and new risk factors emerge from time to time. New risk factors, factors beyond ourcontrol, or changes in the impact of identified risk factors may cause actual results to differ materially from those set forth in any forward-lookingstatements. Accordingly, forward-looking statements should not be relied upon as a prediction of actual results. Moreover, we do not assumeresponsibility for the accuracy and completeness of those statements. Other factors and assumptions not identified above, including thosediscussed in “Management’s Discussion and Analysis of Financial Condition and Results of Operations,” “Risk Factors” and other portions of our2018 Annual Report on Form 10-K filed with the Securities and Exchange Commission on February 21, 2019 (the “2018 Form 10-K”), could causeactual results to differ materially from those projected in any forward-looking statements.
Although we believe that our assumptions are reasonable, any or all of our forward-looking statements may prove to be inaccurate and we canmake no guarantees about our future performance. Should unknown risks or uncertainties materialize or underlying assumptions prove inaccurate,actual results could differ materially from past results and/or those anticipated, estimated or projected. We undertake no obligation to release anyrevisions to any forward-looking statements, to report events or to report the occurrence of unanticipated events. For any forward-lookingstatements contained in any document, we claim the protection of the safe harbor for forward-looking statements contained in the PrivateSecurities Litigation Reform Act of 1995.
2
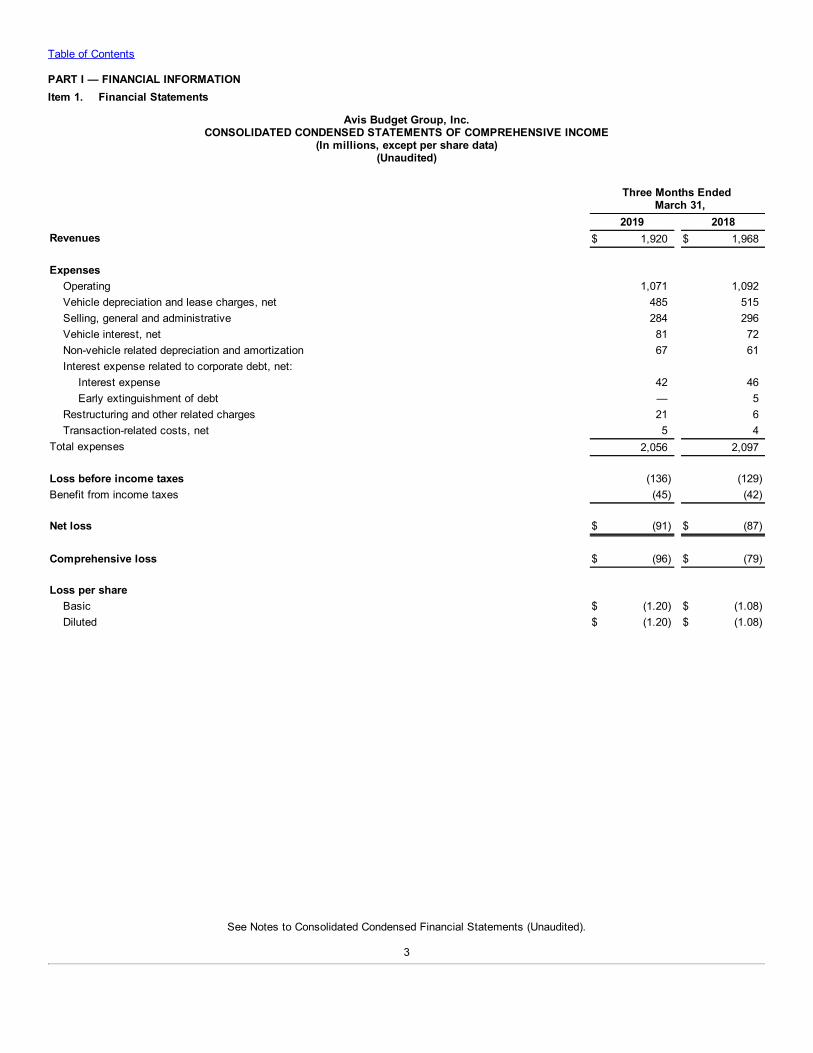
Table of Contents
PART I — FINANCIAL INFORMATIONItem 1. Financial Statements
Avis Budget Group, Inc.CONSOLIDATED CONDENSED STATEMENTS OF COMPREHENSIVE INCOME
(In millions, except per share data)(Unaudited)
Three Months Ended
March 31, 2019 2018Revenues $ 1,920 $ 1,968 Expenses Operating 1,071 1,092 Vehicle depreciation and lease charges, net 485 515 Selling, general and administrative 284 296 Vehicle interest, net 81 72 Non-vehicle related depreciation and amortization 67 61 Interest expense related to corporate debt, net: Interest expense 42 46 Early extinguishment of debt — 5 Restructuring and other related charges 21 6 Transaction-related costs, net 5 4Total expenses 2,056 2,097 Loss before income taxes (136) (129)Benefit from income taxes (45) (42) Net loss $ (91) $ (87)
Comprehensive loss $ (96) $ (79) Loss per share Basic $ (1.20) $ (1.08) Diluted $ (1.20) $ (1.08)
See Notes to Consolidated Condensed Financial Statements (Unaudited).
3
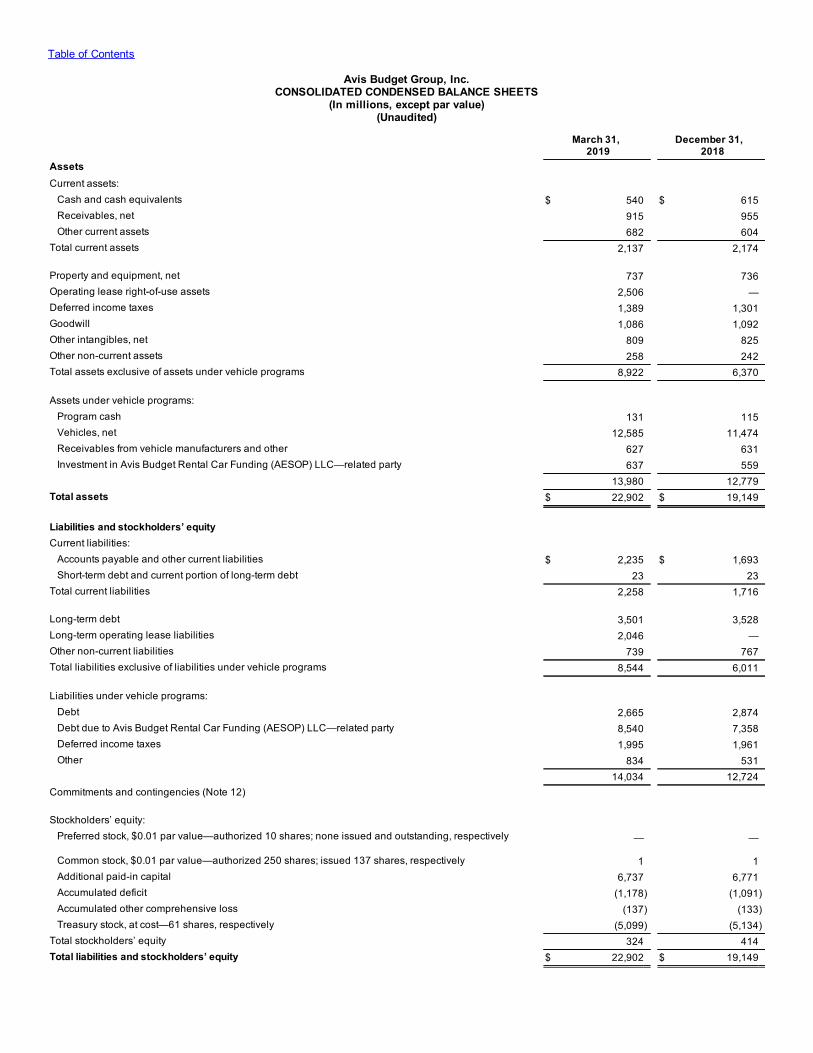
Table of Contents
Avis Budget Group, Inc.CONSOLIDATED CONDENSED BALANCE SHEETS
(In millions, except par value)(Unaudited)
March 31,
2019 December 31,
2018Assets Current assets: Cash and cash equivalents $ 540 $ 615 Receivables, net 915 955 Other current assets 682 604Total current assets 2,137 2,174 Property and equipment, net 737 736Operating lease right-of-use assets 2,506 —Deferred income taxes 1,389 1,301Goodwill 1,086 1,092Other intangibles, net 809 825Other non-current assets 258 242Total assets exclusive of assets under vehicle programs 8,922 6,370
Assets under vehicle programs: Program cash 131 115 Vehicles, net 12,585 11,474 Receivables from vehicle manufacturers and other 627 631 Investment in Avis Budget Rental Car Funding (AESOP) LLC—related party 637 559 13,980 12,779Total assets $ 22,902 $ 19,149
Liabilities and stockholders’ equity Current liabilities: Accounts payable and other current liabilities $ 2,235 $ 1,693 Short-term debt and current portion of long-term debt 23 23Total current liabilities 2,258 1,716 Long-term debt 3,501 3,528Long-term operating lease liabilities 2,046 —Other non-current liabilities 739 767Total liabilities exclusive of liabilities under vehicle programs 8,544 6,011
Liabilities under vehicle programs: Debt 2,665 2,874 Debt due to Avis Budget Rental Car Funding (AESOP) LLC—related party 8,540 7,358 Deferred income taxes 1,995 1,961 Other 834 531 14,034 12,724Commitments and contingencies (Note 12) Stockholders’ equity: Preferred stock, $0.01 par value—authorized 10 shares; none issued and outstanding, respectively — —
Common stock, $0.01 par value—authorized 250 shares; issued 137 shares, respectively 1 1 Additional paid-in capital 6,737 6,771 Accumulated deficit (1,178) (1,091) Accumulated other comprehensive loss (137) (133) Treasury stock, at cost—61 shares, respectively (5,099) (5,134)Total stockholders’ equity 324 414Total liabilities and stockholders’ equity $ 22,902 $ 19,149

See Notes to Consolidated Condensed Financial Statements (Unaudited).
4
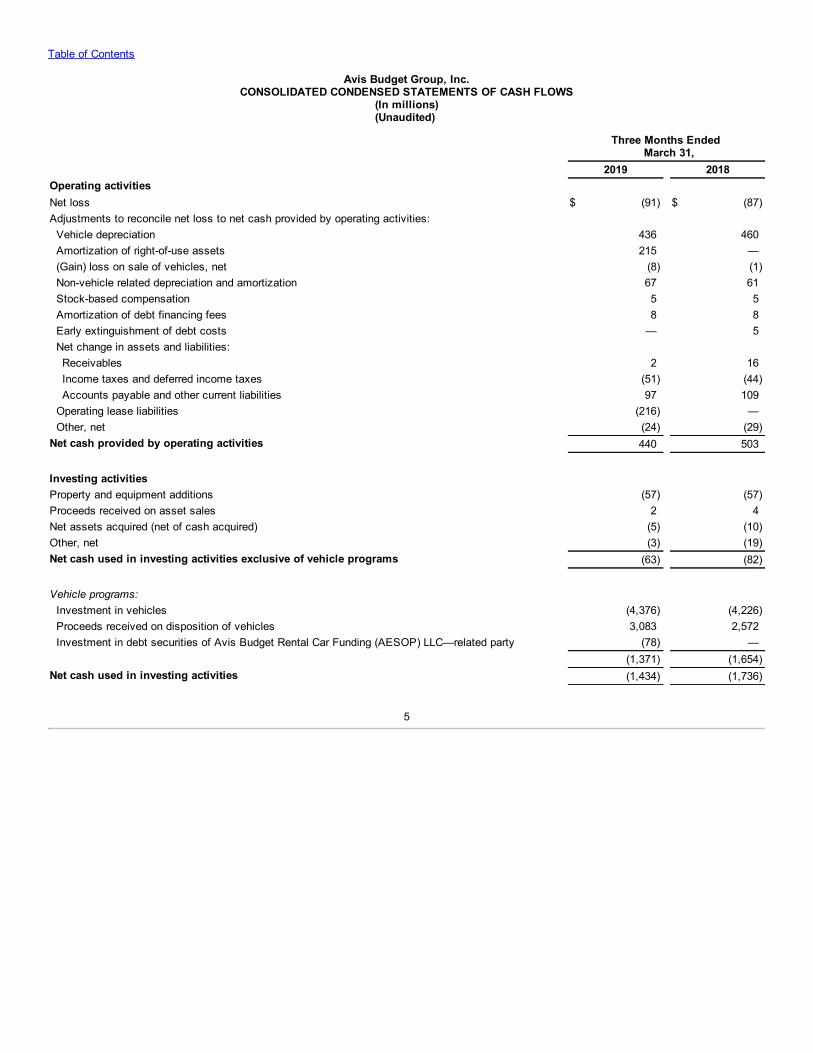
Table of Contents
Avis Budget Group, Inc.CONSOLIDATED CONDENSED STATEMENTS OF CASH FLOWS
(In millions)(Unaudited)
Three Months Ended
March 31, 2019 2018Operating activities Net loss $ (91) $ (87)Adjustments to reconcile net loss to net cash provided by operating activities: Vehicle depreciation 436 460 Amortization of right-of-use assets 215 — (Gain) loss on sale of vehicles, net (8) (1) Non-vehicle related depreciation and amortization 67 61 Stock-based compensation 5 5 Amortization of debt financing fees 8 8 Early extinguishment of debt costs — 5 Net change in assets and liabilities: Receivables 2 16 Income taxes and deferred income taxes (51) (44) Accounts payable and other current liabilities 97 109 Operating lease liabilities (216) — Other, net (24) (29)Net cash provided by operating activities 440 503 Investing activities Property and equipment additions (57) (57)Proceeds received on asset sales 2 4Net assets acquired (net of cash acquired) (5) (10)Other, net (3) (19)Net cash used in investing activities exclusive of vehicle programs (63) (82) Vehicle programs: Investment in vehicles (4,376) (4,226) Proceeds received on disposition of vehicles 3,083 2,572 Investment in debt securities of Avis Budget Rental Car Funding (AESOP) LLC—related party (78) — (1,371) (1,654)Net cash used in investing activities (1,434) (1,736)
5
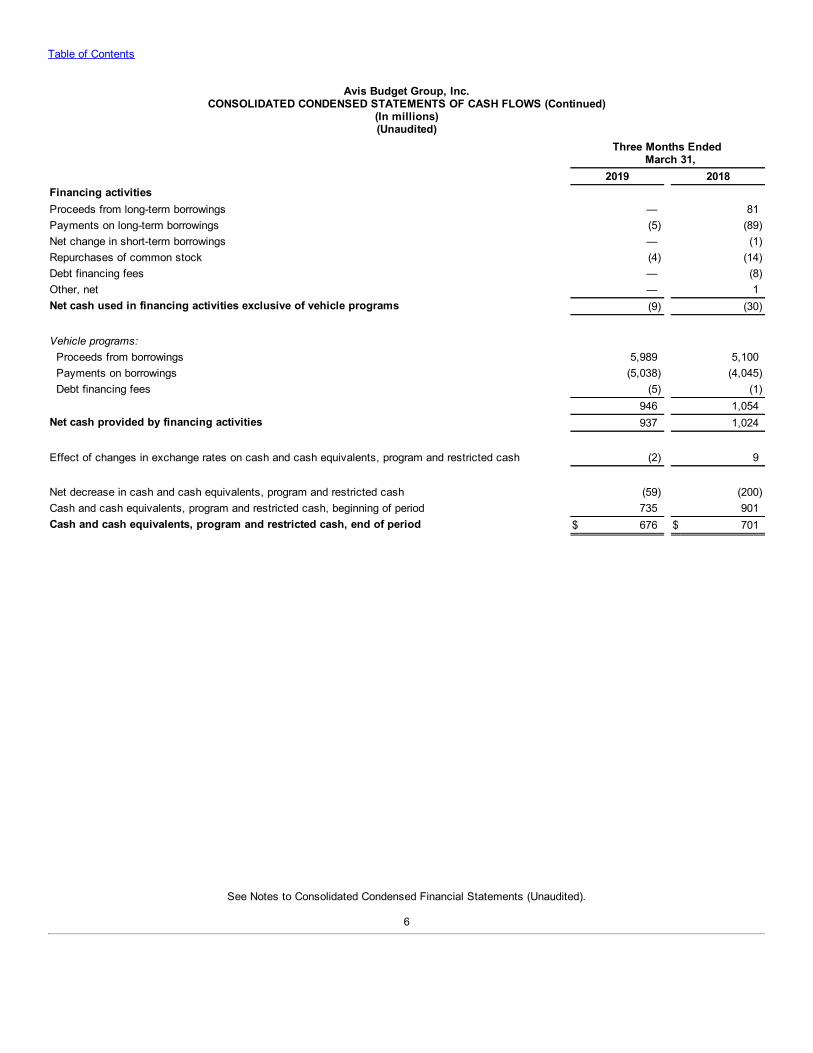
Table of Contents
Avis Budget Group, Inc.CONSOLIDATED CONDENSED STATEMENTS OF CASH FLOWS (Continued)
(In millions)(Unaudited)
Three Months Ended
March 31, 2019 2018Financing activities Proceeds from long-term borrowings — 81Payments on long-term borrowings (5) (89)Net change in short-term borrowings — (1)Repurchases of common stock (4) (14)Debt financing fees — (8)Other, net — 1Net cash used in financing activities exclusive of vehicle programs (9) (30) Vehicle programs: Proceeds from borrowings 5,989 5,100 Payments on borrowings (5,038) (4,045) Debt financing fees (5) (1) 946 1,054Net cash provided by financing activities 937 1,024 Effect of changes in exchange rates on cash and cash equivalents, program and restricted cash (2) 9 Net decrease in cash and cash equivalents, program and restricted cash (59) (200)Cash and cash equivalents, program and restricted cash, beginning of period 735 901Cash and cash equivalents, program and restricted cash, end of period $ 676 $ 701
See Notes to Consolidated Condensed Financial Statements (Unaudited).
6
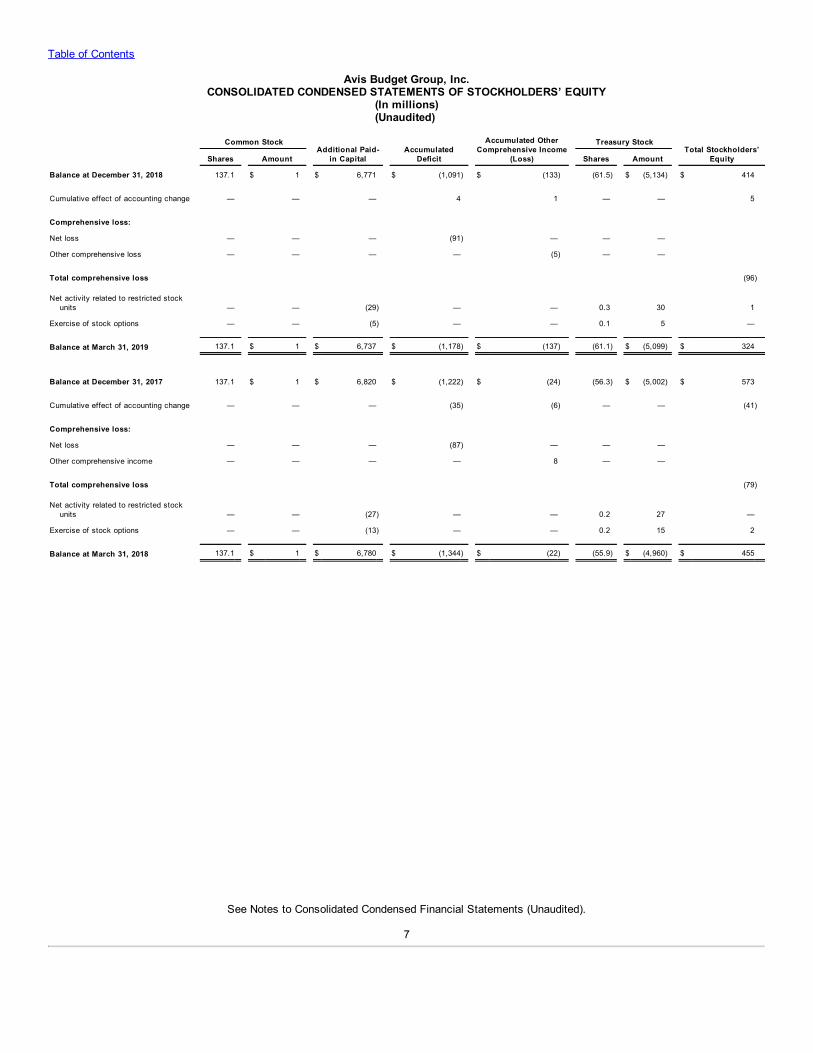
Table of Contents
Avis Budget Group, Inc.CONSOLIDATED CONDENSED STATEMENTS OF STOCKHOLDERS’ EQUITY
(In millions)(Unaudited)
Common Stock Additional Paid-
in Capital
Accumulated
Deficit
Accumulated OtherComprehensive Income
(Loss)
Treasury Stock Total Stockholders’
Equity Shares Amount Shares Amount Balance at December 31, 2018 137.1 $ 1 $ 6,771 $ (1,091) $ (133) (61.5) $ (5,134) $ 414
Cumulative effect of accounting change — — — 4 1 — — 5
Comprehensive loss: Net loss — — — (91) — — — Other comprehensive loss — — — — (5) — — Total comprehensive loss (96)
Net activity related to restricted stock
units — — (29) — — 0.3 30 1
Exercise of stock options — — (5) — — 0.1 5 —
Balance at March 31, 2019 137.1 $ 1 $ 6,737 $ (1,178) $ (137) (61.1) $ (5,099) $ 324
Balance at December 31, 2017 137.1 $ 1 $ 6,820 $ (1,222) $ (24) (56.3) $ (5,002) $ 573
Cumulative effect of accounting change — — — (35) (6) — — (41)
Comprehensive loss: Net loss — — — (87) — — — Other comprehensive income — — — — 8 — — Total comprehensive loss (79)
Net activity related to restricted stock
units — — (27) — — 0.2 27 —
Exercise of stock options — — (13) — — 0.2 15 2
Balance at March 31, 2018 137.1 $ 1 $ 6,780 $ (1,344) $ (22) (55.9) $ (4,960) $ 455
See Notes to Consolidated Condensed Financial Statements (Unaudited).
7
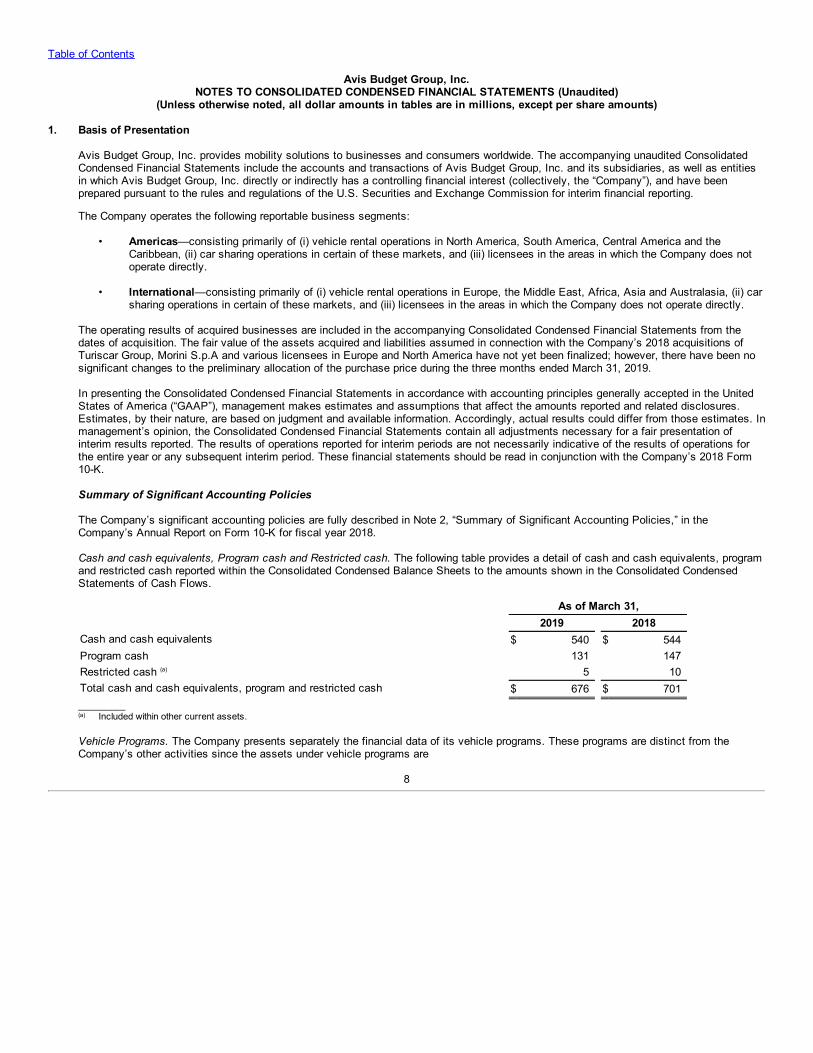
Table of Contents
Avis Budget Group, Inc.NOTES TO CONSOLIDATED CONDENSED FINANCIAL STATEMENTS (Unaudited)
(Unless otherwise noted, all dollar amounts in tables are in millions, except per share amounts)
1. Basis of Presentation
Avis Budget Group, Inc. provides mobility solutions to businesses and consumers worldwide. The accompanying unaudited ConsolidatedCondensed Financial Statements include the accounts and transactions of Avis Budget Group, Inc. and its subsidiaries, as well as entitiesin which Avis Budget Group, Inc. directly or indirectly has a controlling financial interest (collectively, the “Company”), and have beenprepared pursuant to the rules and regulations of the U.S. Securities and Exchange Commission for interim financial reporting.
The Company operates the following reportable business segments:
• Americas—consisting primarily of (i) vehicle rental operations in North America, South America, Central America and theCaribbean, (ii) car sharing operations in certain of these markets, and (iii) licensees in the areas in which the Company does notoperate directly.
• International—consisting primarily of (i) vehicle rental operations in Europe, the Middle East, Africa, Asia and Australasia, (ii) carsharing operations in certain of these markets, and (iii) licensees in the areas in which the Company does not operate directly.
The operating results of acquired businesses are included in the accompanying Consolidated Condensed Financial Statements from thedates of acquisition. The fair value of the assets acquired and liabilities assumed in connection with the Company’s 2018 acquisitions ofTuriscar Group, Morini S.p.A and various licensees in Europe and North America have not yet been finalized; however, there have been nosignificant changes to the preliminary allocation of the purchase price during the three months ended March 31, 2019.
In presenting the Consolidated Condensed Financial Statements in accordance with accounting principles generally accepted in the UnitedStates of America (“GAAP”), management makes estimates and assumptions that affect the amounts reported and related disclosures.Estimates, by their nature, are based on judgment and available information. Accordingly, actual results could differ from those estimates. Inmanagement’s opinion, the Consolidated Condensed Financial Statements contain all adjustments necessary for a fair presentation ofinterim results reported. The results of operations reported for interim periods are not necessarily indicative of the results of operations forthe entire year or any subsequent interim period. These financial statements should be read in conjunction with the Company’s 2018 Form10-K.
Summary of Significant Accounting Policies
The Company’s significant accounting policies are fully described in Note 2, “Summary of Significant Accounting Policies,” in theCompany’s Annual Report on Form 10-K for fiscal year 2018.
Cash and cash equivalents, Program cash and Restricted cash. The following table provides a detail of cash and cash equivalents, programand restricted cash reported within the Consolidated Condensed Balance Sheets to the amounts shown in the Consolidated CondensedStatements of Cash Flows.
As of March 31, 2019 2018Cash and cash equivalents $ 540 $ 544Program cash 131 147Restricted cash (a) 5 10Total cash and cash equivalents, program and restricted cash $ 676 $ 701________(a) Included within other current assets.
Vehicle Programs. The Company presents separately the financial data of its vehicle programs. These programs are distinct from theCompany’s other activities since the assets under vehicle programs are
8
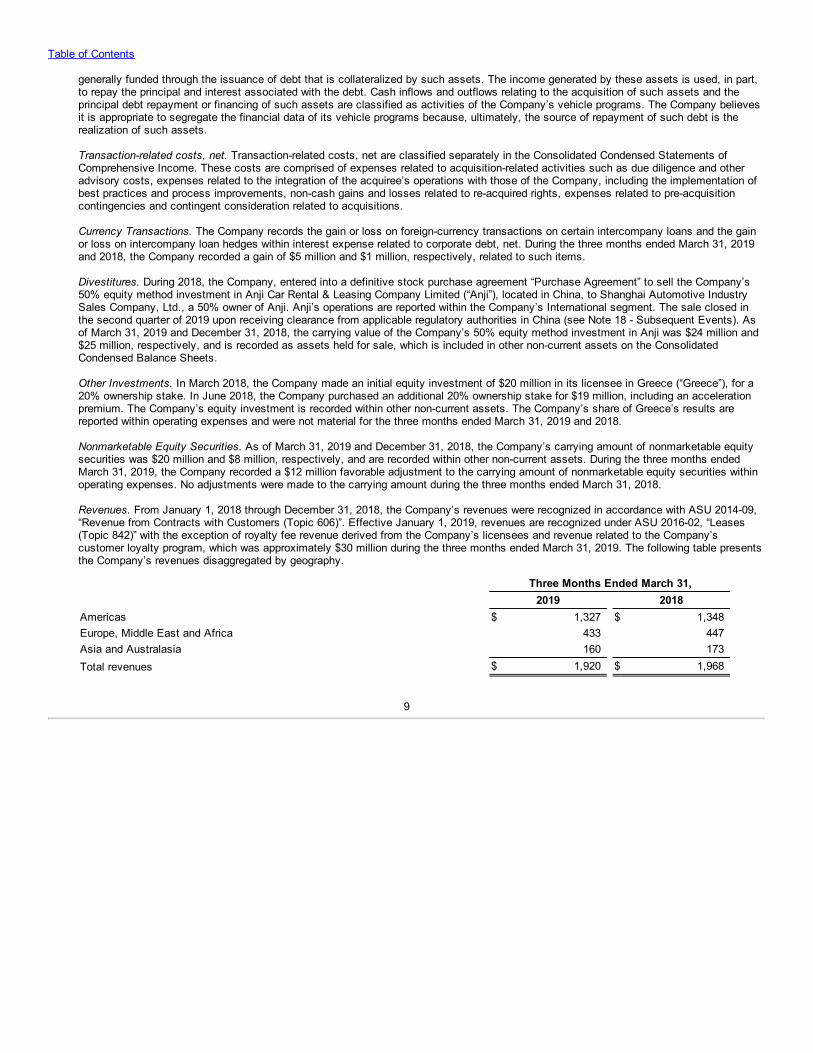
Table of Contents
generally funded through the issuance of debt that is collateralized by such assets. The income generated by these assets is used, in part,to repay the principal and interest associated with the debt. Cash inflows and outflows relating to the acquisition of such assets and theprincipal debt repayment or financing of such assets are classified as activities of the Company’s vehicle programs. The Company believesit is appropriate to segregate the financial data of its vehicle programs because, ultimately, the source of repayment of such debt is therealization of such assets.
Transaction-related costs, net. Transaction-related costs, net are classified separately in the Consolidated Condensed Statements ofComprehensive Income. These costs are comprised of expenses related to acquisition-related activities such as due diligence and otheradvisory costs, expenses related to the integration of the acquiree’s operations with those of the Company, including the implementation ofbest practices and process improvements, non-cash gains and losses related to re-acquired rights, expenses related to pre-acquisitioncontingencies and contingent consideration related to acquisitions.
Currency Transactions. The Company records the gain or loss on foreign-currency transactions on certain intercompany loans and the gainor loss on intercompany loan hedges within interest expense related to corporate debt, net. During the three months ended March 31, 2019and 2018, the Company recorded a gain of $5 million and $1 million, respectively, related to such items.
Divestitures. During 2018, the Company, entered into a definitive stock purchase agreement “Purchase Agreement” to sell the Company’s50% equity method investment in Anji Car Rental & Leasing Company Limited (“Anji”), located in China, to Shanghai Automotive IndustrySales Company, Ltd., a 50% owner of Anji. Anji’s operations are reported within the Company’s International segment. The sale closed inthe second quarter of 2019 upon receiving clearance from applicable regulatory authorities in China (see Note 18 - Subsequent Events). Asof March 31, 2019 and December 31, 2018, the carrying value of the Company’s 50% equity method investment in Anji was $24 million and$25 million, respectively, and is recorded as assets held for sale, which is included in other non-current assets on the ConsolidatedCondensed Balance Sheets.
Other Investments. In March 2018, the Company made an initial equity investment of $20 million in its licensee in Greece (“Greece”), for a20% ownership stake. In June 2018, the Company purchased an additional 20% ownership stake for $19 million, including an accelerationpremium. The Company’s equity investment is recorded within other non-current assets. The Company’s share of Greece’s results arereported within operating expenses and were not material for the three months ended March 31, 2019 and 2018.
Nonmarketable Equity Securities. As of March 31, 2019 and December 31, 2018, the Company’s carrying amount of nonmarketable equitysecurities was $20 million and $8 million, respectively, and are recorded within other non-current assets. During the three months endedMarch 31, 2019, the Company recorded a $12 million favorable adjustment to the carrying amount of nonmarketable equity securities withinoperating expenses. No adjustments were made to the carrying amount during the three months ended March 31, 2018.
Revenues. From January 1, 2018 through December 31, 2018, the Company’s revenues were recognized in accordance with ASU 2014-09,“Revenue from Contracts with Customers (Topic 606)”. Effective January 1, 2019, revenues are recognized under ASU 2016-02, “Leases(Topic 842)” with the exception of royalty fee revenue derived from the Company’s licensees and revenue related to the Company’scustomer loyalty program, which was approximately $30 million during the three months ended March 31, 2019. The following table presentsthe Company’s revenues disaggregated by geography.
Three Months Ended March 31, 2019 2018Americas $ 1,327 $ 1,348Europe, Middle East and Africa 433 447Asia and Australasia 160 173Total revenues $ 1,920 $ 1,968
9
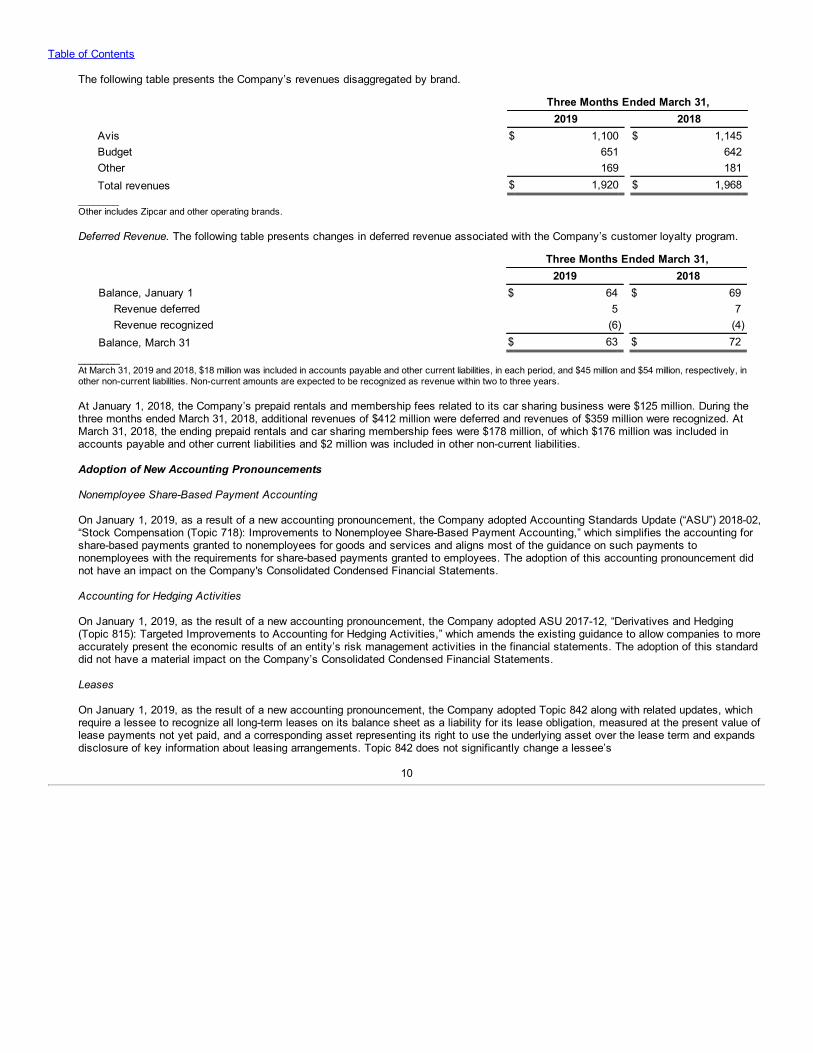
Table of Contents
The following table presents the Company’s revenues disaggregated by brand.
Three Months Ended March 31, 2019 2018Avis $ 1,100 $ 1,145Budget 651 642Other 169 181Total revenues $ 1,920 $ 1,968
________Other includes Zipcar and other operating brands.
Deferred Revenue. The following table presents changes in deferred revenue associated with the Company’s customer loyalty program.
Three Months Ended March 31, 2019 2018Balance, January 1 $ 64 $ 69
Revenue deferred 5 7Revenue recognized (6) (4)
Balance, March 31 $ 63 $ 72_______At March 31, 2019 and 2018, $18 million was included in accounts payable and other current liabilities, in each period, and $45 million and $54 million, respectively, inother non-current liabilities. Non-current amounts are expected to be recognized as revenue within two to three years.
At January 1, 2018, the Company’s prepaid rentals and membership fees related to its car sharing business were $125 million. During thethree months ended March 31, 2018, additional revenues of $412 million were deferred and revenues of $359 million were recognized. AtMarch 31, 2018, the ending prepaid rentals and car sharing membership fees were $178 million, of which $176 million was included inaccounts payable and other current liabilities and $2 million was included in other non-current liabilities.
Adoption of New Accounting Pronouncements
Nonemployee Share-Based Payment Accounting
On January 1, 2019, as a result of a new accounting pronouncement, the Company adopted Accounting Standards Update (“ASU”) 2018-02,“Stock Compensation (Topic 718): Improvements to Nonemployee Share-Based Payment Accounting,” which simplifies the accounting forshare-based payments granted to nonemployees for goods and services and aligns most of the guidance on such payments tononemployees with the requirements for share-based payments granted to employees. The adoption of this accounting pronouncement didnot have an impact on the Company's Consolidated Condensed Financial Statements. Accounting for Hedging Activities
On January 1, 2019, as the result of a new accounting pronouncement, the Company adopted ASU 2017-12, “Derivatives and Hedging(Topic 815): Targeted Improvements to Accounting for Hedging Activities,” which amends the existing guidance to allow companies to moreaccurately present the economic results of an entity’s risk management activities in the financial statements. The adoption of this standarddid not have a material impact on the Company’s Consolidated Condensed Financial Statements.
Leases
On January 1, 2019, as the result of a new accounting pronouncement, the Company adopted Topic 842 along with related updates, whichrequire a lessee to recognize all long-term leases on its balance sheet as a liability for its lease obligation, measured at the present value oflease payments not yet paid, and a corresponding asset representing its right to use the underlying asset over the lease term and expandsdisclosure of key information about leasing arrangements. Topic 842 does not significantly change a lessee’s
10
Table of Contents
recognition, measurement and presentation of expenses and cash flows. Additionally, Topic 842 aligns key aspects of lessor accountingwith the revenue recognition guidance in Topic 606.
The Company elected available practical expedients for existing or expired contracts of lessees and lessors wherein the Company is notrequired to reassess whether such contracts contain leases, the lease classification or the initial direct costs. The Company is not utilizingthe practical expedient which allows the use of hindsight by lessees and lessors in determining the lease term and in assessing impairmentof its right-of-use (“ROU”) assets. Additionally, the Company elected as accounting policies to not recognize ROU assets or lease liabilitiesfor short-term leases (i.e. those with a term of 12 months or less at lease commencement) and, by class of underlying asset, to combinelease and nonlease components in the contract. The Company utilized the transition method allowing entities to only apply the new leasestandard in the year of adoption.
LessorThe Company has determined that revenues derived by providing vehicle rentals and other related products and mobility services tocustomers are within the scope of the accounting guidance contained in Topic 842 with the exception of royalty fee revenue derived from theCompany’s licensees and revenue related to the Company’s customer loyalty program. The Company’s rental related revenues have beenaccounted for under the revenue accounting standard Topic 606, until the adoption of Topic 842.
The Company excludes from the measurement of its lease revenues any tax assessed by a governmental authority that is both imposed onand concurrent with a specific revenue-producing transaction and collected from a customer. As a result, lease revenues exclude suchtaxes collected. Fees collected from customers for which the Company is the primary obligor such as airport concessions and vehiclelicensing are recorded within revenues and corresponding remittances of these fees by the Company are recorded within operatingexpenses.
LesseeThe Company determines if an arrangement is a lease at inception. Operating leases, other than those associated with the Company’svehicle rental programs, are included in operating lease ROU assets, accounts payable and other current liabilities, and long-term operatinglease liabilities in the Company’s Consolidated Condensed Balance Sheets. Finance leases, other than those associated with theCompany’s vehicle rental programs, are included in property and equipment, net, short-term debt and current portion of long-term debt, andlong-term debt in the Company’s Consolidated Condensed Balance Sheets.
ROU assets represent the Company’s right to use an underlying asset for the lease term and lease liabilities represent the Company’sobligation to make lease payments arising from the lease. ROU assets and liabilities are recognized at commencement date based on thepresent value of lease payments over the expected lease term. As most of the Company’s leases do not provide an implicit rate, theCompany uses its incremental borrowing rate based on information available at commencement date in determining the present value oflease payments. The operating lease ROU assets are reduced by any lease incentives. The Company’s lease terms may include options toextend or terminate the lease, which are included in the calculation of ROU assets when it is reasonably certain that the Company willexercise those options. Lease expense for lease payments is usually recognized on a straight-line basis over the lease term.
The Company has lease agreements with lease and non-lease components, which are generally not accounted for separately. Additionally,for certain leases, the Company applies a portfolio approach to account for the operating lease ROU assets and liabilities as the leases aresimilar in nature and have nearly identical contract provisions.
Adoption of this standard resulted in most of the Company’s operating lease commitments being recognized as operating lease liabilities andright-of-use assets, which increased total assets and total liabilities by approximately $2,811 million related to property operating leases and$183 million related to vehicle operating leases. The Company recorded a beginning accumulated deficit adjustment of $5 million, net of tax,related to the adoption of this standard.
11
Table of Contents
Recently Issued Accounting Pronouncements
Intangibles—Goodwill and Other—Internal—Use Software
In August 2018, the Financial Accounting Standards Board (“FASB”) issued ASU 2018-15 “Customer’s Accounting for Fees Paid in a CloudComputing Arrangement That Is a Service Contract”, which provides guidance for determining when the arrangement includes a softwarelicense. The amendments align the requirements for capitalizing implementation costs incurred in a hosting arrangement that is a servicecontract with the requirements for capitalizing implementation costs incurred to develop or obtain internal use software (and hostingarrangements that include an internal use software license). The amendments in this update also require the entity to expense thecapitalized implementation costs of a hosting arrangement that is a service contract over the term of the hosting arrangement, to present theexpense in the same line in its statement of income as the fees associated with the hosting element (service) of the arrangement andclassify payments for capitalized implementation costs in its statement of cash flows in the same manner as payments made for feesassociated with the hosting element. The entity is also required to present the capitalized implementation costs in its balance sheet in thesame line that a prepayment for the fees of the associated hosting arrangement would be presented. ASU 2018-15 becomes effective for theCompany on January 1, 2020. Early adoption is permitted. The Company is currently evaluating the impact of adopting this accountingpronouncement on its Consolidated Condensed Financial Statements.
Compensation—Retirement Benefits—Defined Benefit Plans
In August 2018, the FASB issued ASU 2018-14, “Disclosure Framework—Changes to the Disclosure Requirements for Defined BenefitPlans,” which adds, removes, and clarifies disclosure requirements related to defined benefit pension and other postretirement plans. Thesechanges are part of the FASB’s disclosure framework project, which the Board launched in 2014 to improve the effectiveness of disclosuresin notes to financial statements. ASU 2018-14 becomes effective for the Company on January 1, 2021. Early adoption is permitted. Theadoption of this accounting pronouncement is not expected to have a material impact on the Company's Consolidated Condensed FinancialStatements.
Fair Value Measurement
In August 2018, the FASB issued ASU 2018-13, “Disclosure Framework—Changes to the Disclosure Requirements for Fair ValueMeasurement,” which adds, removes, and modifies disclosure requirements related to fair value measurements. ASU 2018-13 becomeseffective for the Company on January 1, 2020. Early adoption is permitted. The adoption of this accounting pronouncement is not expectedto have a material impact on the Company's Consolidated Condensed Financial Statements.
Measurement of Credit Losses on Financial Instruments
In June 2016, the FASB issued ASU 2016-13, “Financial Instruments—Credit Losses (Topic 326): Measurement of Credit Losses onFinancial Instruments,” which sets forth a current expected credit loss impairment model for financial assets that replaces the currentincurred loss model. This model requires a financial asset (or group of financial assets), including trade receivables, measured at amortizedcost to be presented at the net amount expected to be collected with an allowance for credit losses deducted from the amortized cost basis.The allowance for credit losses should reflect management’s current estimate of credit losses that are expected to occur over the remaininglife of a financial asset. ASU 2016-13 becomes effective for the Company on January 1, 2020. Early adoption is permitted as of January 1,2019. The adoption of this accounting pronouncement is not expected to have a material impact on the Company's Consolidated CondensedFinancial Statements.
2. Leases
Lessor
For periods after January 1, 2019, the Company combines all lease and nonlease components of its vehicle rental contracts for which thetiming and pattern of transfer are the same and the lease component meets the classification of an operating lease, and accounts for themin accordance with Topic 842. The Company derives revenues primarily by providing vehicle rentals and other related products and mobilityservices to
12
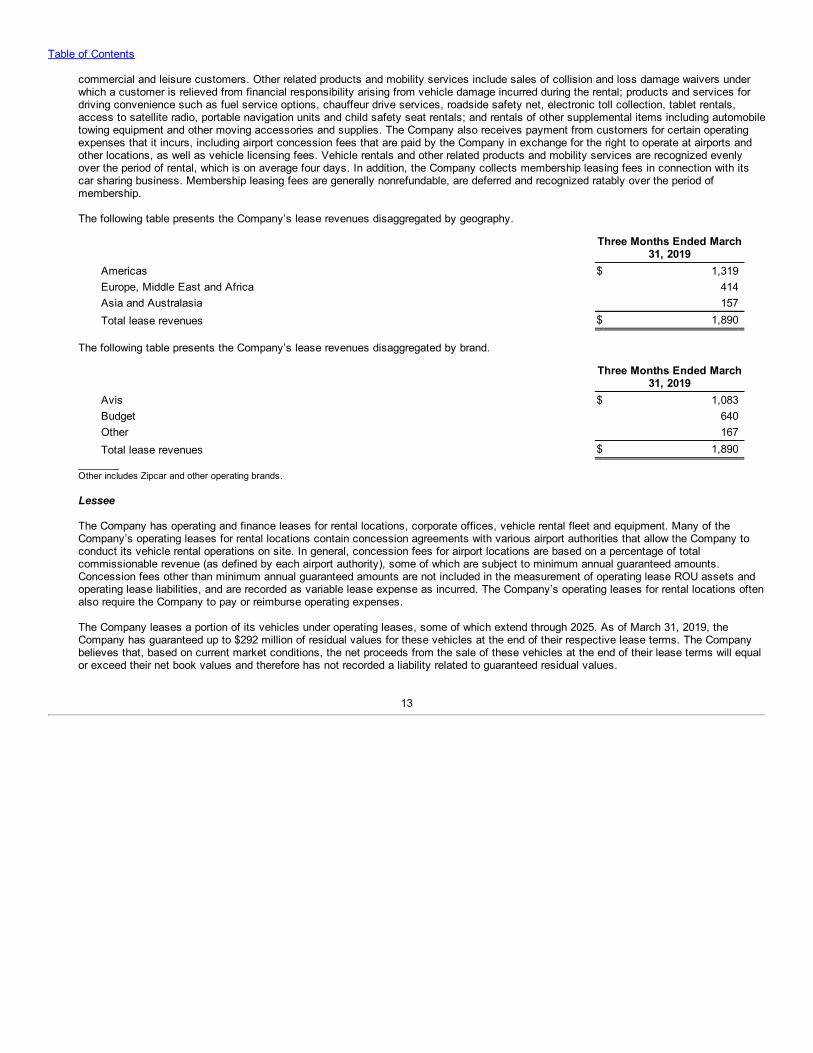
Table of Contents
commercial and leisure customers. Other related products and mobility services include sales of collision and loss damage waivers underwhich a customer is relieved from financial responsibility arising from vehicle damage incurred during the rental; products and services fordriving convenience such as fuel service options, chauffeur drive services, roadside safety net, electronic toll collection, tablet rentals,access to satellite radio, portable navigation units and child safety seat rentals; and rentals of other supplemental items including automobiletowing equipment and other moving accessories and supplies. The Company also receives payment from customers for certain operatingexpenses that it incurs, including airport concession fees that are paid by the Company in exchange for the right to operate at airports andother locations, as well as vehicle licensing fees. Vehicle rentals and other related products and mobility services are recognized evenlyover the period of rental, which is on average four days. In addition, the Company collects membership leasing fees in connection with itscar sharing business. Membership leasing fees are generally nonrefundable, are deferred and recognized ratably over the period ofmembership.
The following table presents the Company’s lease revenues disaggregated by geography.
Three Months Ended March
31, 2019Americas $ 1,319Europe, Middle East and Africa 414Asia and Australasia 157Total lease revenues $ 1,890
The following table presents the Company’s lease revenues disaggregated by brand.
Three Months Ended March
31, 2019Avis $ 1,083Budget 640Other 167Total lease revenues $ 1,890
________Other includes Zipcar and other operating brands.
Lessee
The Company has operating and finance leases for rental locations, corporate offices, vehicle rental fleet and equipment. Many of theCompany’s operating leases for rental locations contain concession agreements with various airport authorities that allow the Company toconduct its vehicle rental operations on site. In general, concession fees for airport locations are based on a percentage of totalcommissionable revenue (as defined by each airport authority), some of which are subject to minimum annual guaranteed amounts.Concession fees other than minimum annual guaranteed amounts are not included in the measurement of operating lease ROU assets andoperating lease liabilities, and are recorded as variable lease expense as incurred. The Company’s operating leases for rental locations oftenalso require the Company to pay or reimburse operating expenses.
The Company leases a portion of its vehicles under operating leases, some of which extend through 2025. As of March 31, 2019, theCompany has guaranteed up to $292 million of residual values for these vehicles at the end of their respective lease terms. The Companybelieves that, based on current market conditions, the net proceeds from the sale of these vehicles at the end of their lease terms will equalor exceed their net book values and therefore has not recorded a liability related to guaranteed residual values.
13
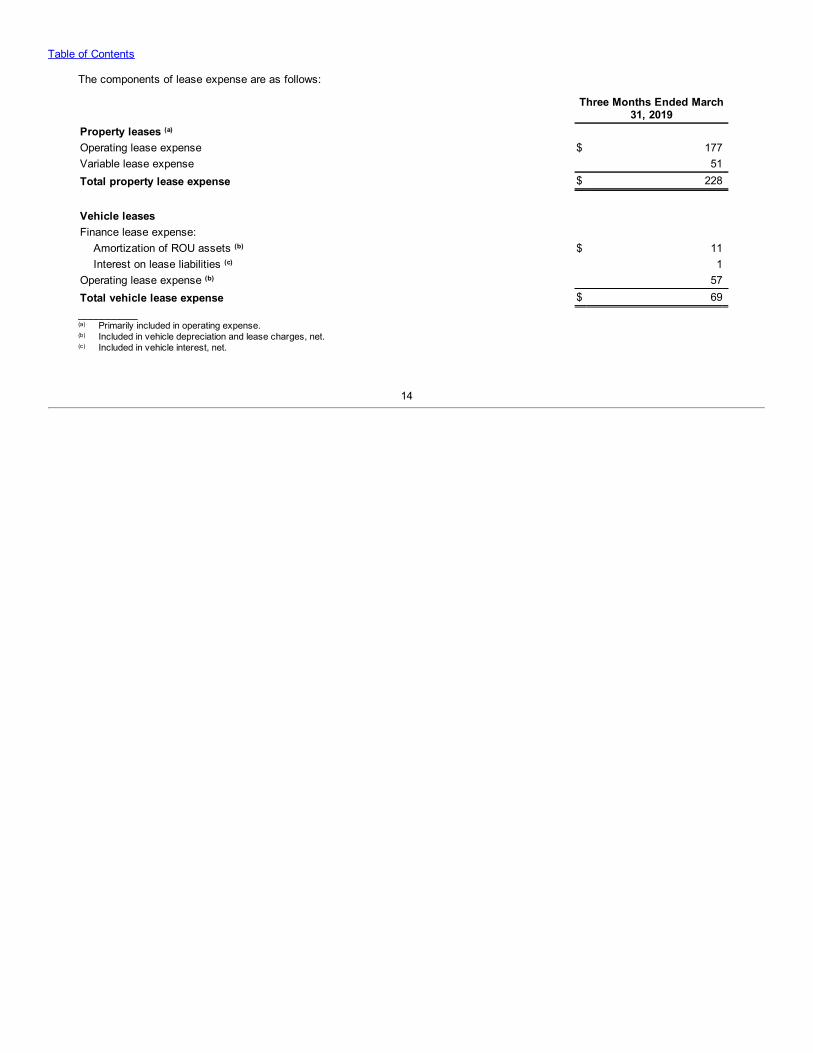
Table of Contents
The components of lease expense are as follows:
Three Months Ended March
31, 2019Property leases (a) Operating lease expense $ 177Variable lease expense 51Total property lease expense $ 228
Vehicle leases Finance lease expense:
Amortization of ROU assets (b) $ 11Interest on lease liabilities (c) 1
Operating lease expense (b) 57Total vehicle lease expense $ 69__________(a) Primarily included in operating expense.(b) Included in vehicle depreciation and lease charges, net.(c) Included in vehicle interest, net.
14
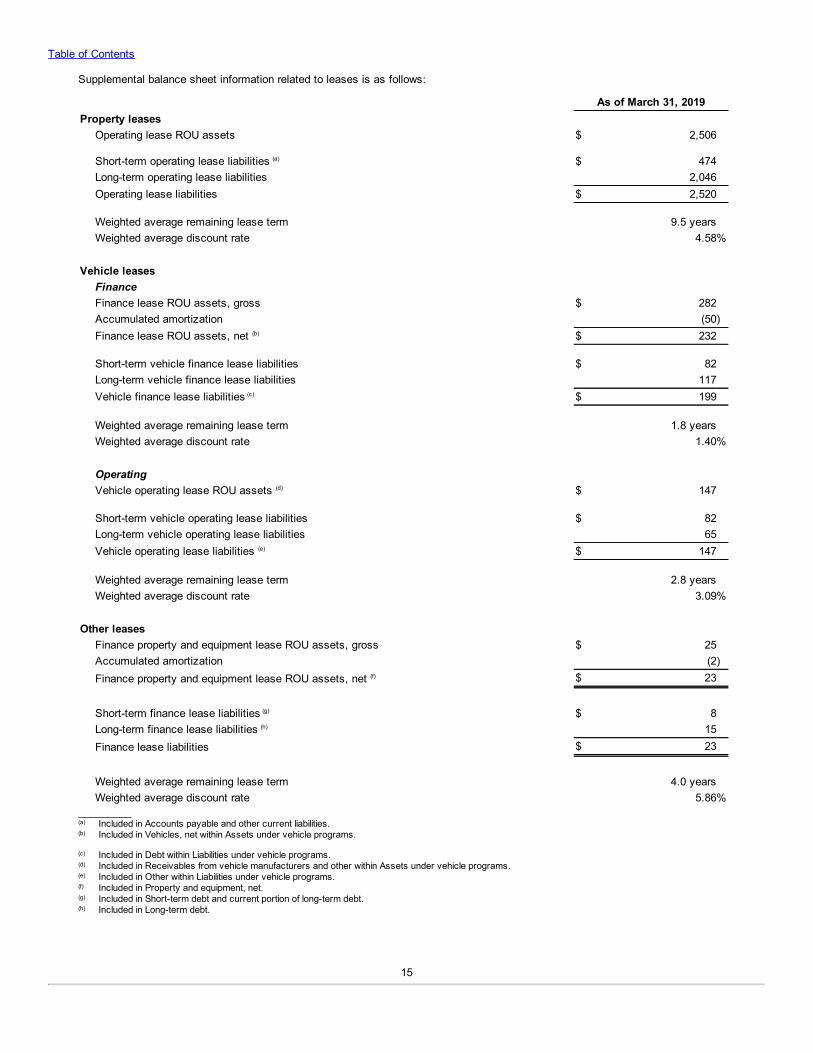
Table of Contents
Supplemental balance sheet information related to leases is as follows:
As of March 31, 2019Property leases
Operating lease ROU assets $ 2,506
Short-term operating lease liabilities (a) $ 474Long-term operating lease liabilities 2,046Operating lease liabilities $ 2,520
Weighted average remaining lease term 9.5 yearsWeighted average discount rate 4.58%
Vehicle leases
Finance Finance lease ROU assets, gross $ 282Accumulated amortization (50)Finance lease ROU assets, net (b) $ 232
Short-term vehicle finance lease liabilities $ 82Long-term vehicle finance lease liabilities 117Vehicle finance lease liabilities (c) $ 199
Weighted average remaining lease term 1.8 yearsWeighted average discount rate 1.40%
Operating Vehicle operating lease ROU assets (d) $ 147
Short-term vehicle operating lease liabilities $ 82Long-term vehicle operating lease liabilities 65Vehicle operating lease liabilities (e) $ 147
Weighted average remaining lease term 2.8 yearsWeighted average discount rate 3.09%
Other leases
Finance property and equipment lease ROU assets, gross $ 25Accumulated amortization (2)Finance property and equipment lease ROU assets, net (f) $ 23
Short-term finance lease liabilities (g) $ 8Long-term finance lease liabilities (h) 15Finance lease liabilities $ 23
Weighted average remaining lease term 4.0 yearsWeighted average discount rate 5.86%
_________(a) Included in Accounts payable and other current liabilities.(b) Included in Vehicles, net within Assets under vehicle programs.
(c) Included in Debt within Liabilities under vehicle programs.(d) Included in Receivables from vehicle manufacturers and other within Assets under vehicle programs.(e) Included in Other within Liabilities under vehicle programs.(f) Included in Property and equipment, net.(g) Included in Short-term debt and current portion of long-term debt.(h) Included in Long-term debt.
15
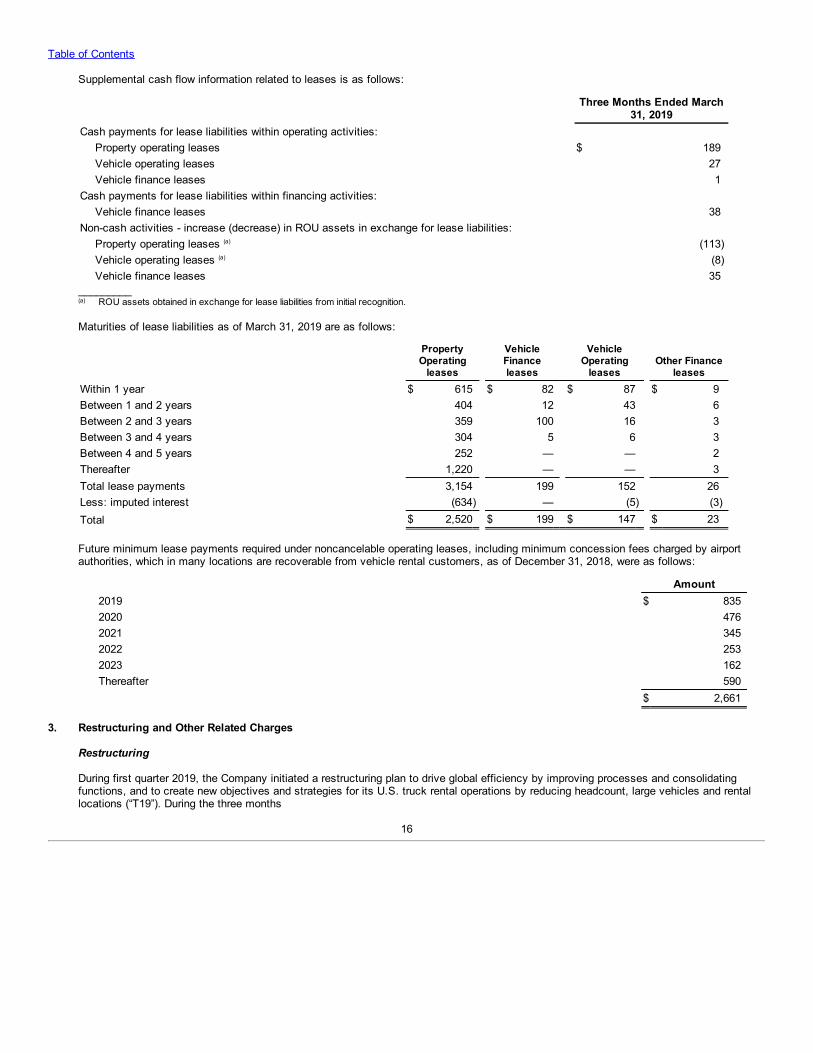
Table of Contents
Supplemental cash flow information related to leases is as follows:
Three Months Ended March
31, 2019Cash payments for lease liabilities within operating activities:
Property operating leases $ 189Vehicle operating leases 27Vehicle finance leases 1
Cash payments for lease liabilities within financing activities: Vehicle finance leases 38
Non-cash activities - increase (decrease) in ROU assets in exchange for lease liabilities: Property operating leases (a) (113)Vehicle operating leases (a) (8)Vehicle finance leases 35
_________(a) ROU assets obtained in exchange for lease liabilities from initial recognition.
Maturities of lease liabilities as of March 31, 2019 are as follows:
PropertyOperating
leases
VehicleFinanceleases
VehicleOperating
leases Other Finance
leasesWithin 1 year $ 615 $ 82 $ 87 $ 9Between 1 and 2 years 404 12 43 6Between 2 and 3 years 359 100 16 3Between 3 and 4 years 304 5 6 3Between 4 and 5 years 252 — — 2Thereafter 1,220 — — 3Total lease payments 3,154 199 152 26Less: imputed interest (634) — (5) (3)Total $ 2,520 $ 199 $ 147 $ 23
Future minimum lease payments required under noncancelable operating leases, including minimum concession fees charged by airportauthorities, which in many locations are recoverable from vehicle rental customers, as of December 31, 2018, were as follows:
Amount2019 $ 8352020 4762021 3452022 2532023 162Thereafter 590 $ 2,661
3. Restructuring and Other Related Charges
Restructuring
During first quarter 2019, the Company initiated a restructuring plan to drive global efficiency by improving processes and consolidatingfunctions, and to create new objectives and strategies for its U.S. truck rental operations by reducing headcount, large vehicles and rentallocations (“T19”). During the three months
16
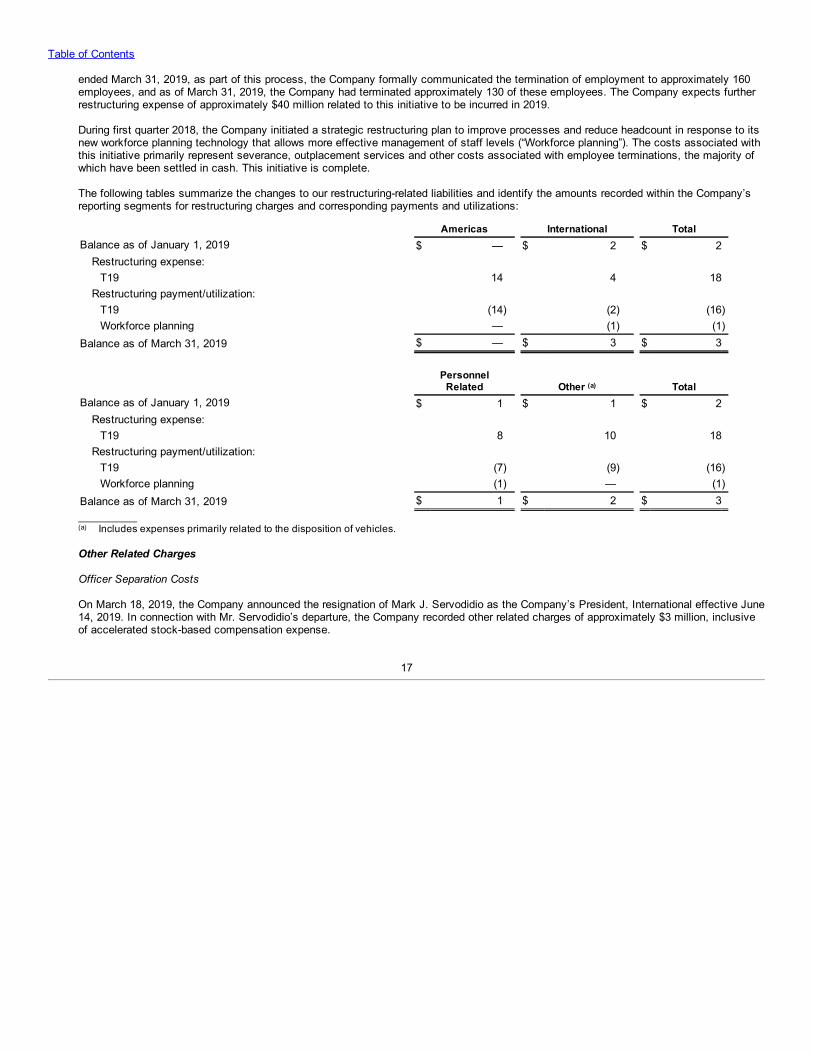
Table of Contents
ended March 31, 2019, as part of this process, the Company formally communicated the termination of employment to approximately 160employees, and as of March 31, 2019, the Company had terminated approximately 130 of these employees. The Company expects furtherrestructuring expense of approximately $40 million related to this initiative to be incurred in 2019.
During first quarter 2018, the Company initiated a strategic restructuring plan to improve processes and reduce headcount in response to itsnew workforce planning technology that allows more effective management of staff levels (“Workforce planning”). The costs associated withthis initiative primarily represent severance, outplacement services and other costs associated with employee terminations, the majority ofwhich have been settled in cash. This initiative is complete.
The following tables summarize the changes to our restructuring-related liabilities and identify the amounts recorded within the Company’sreporting segments for restructuring charges and corresponding payments and utilizations:
Americas International TotalBalance as of January 1, 2019 $ — $ 2 $ 2 Restructuring expense: T19 14 4 18 Restructuring payment/utilization: T19 (14) (2) (16) Workforce planning — (1) (1)Balance as of March 31, 2019 $ — $ 3 $ 3
Personnel
Related Other (a) TotalBalance as of January 1, 2019 $ 1 $ 1 $ 2 Restructuring expense: T19 8 10 18 Restructuring payment/utilization: T19 (7) (9) (16) Workforce planning (1) — (1)Balance as of March 31, 2019 $ 1 $ 2 $ 3__________(a) Includes expenses primarily related to the disposition of vehicles.
Other Related Charges
Officer Separation Costs
On March 18, 2019, the Company announced the resignation of Mark J. Servodidio as the Company’s President, International effective June14, 2019. In connection with Mr. Servodidio’s departure, the Company recorded other related charges of approximately $3 million, inclusiveof accelerated stock-based compensation expense.
17
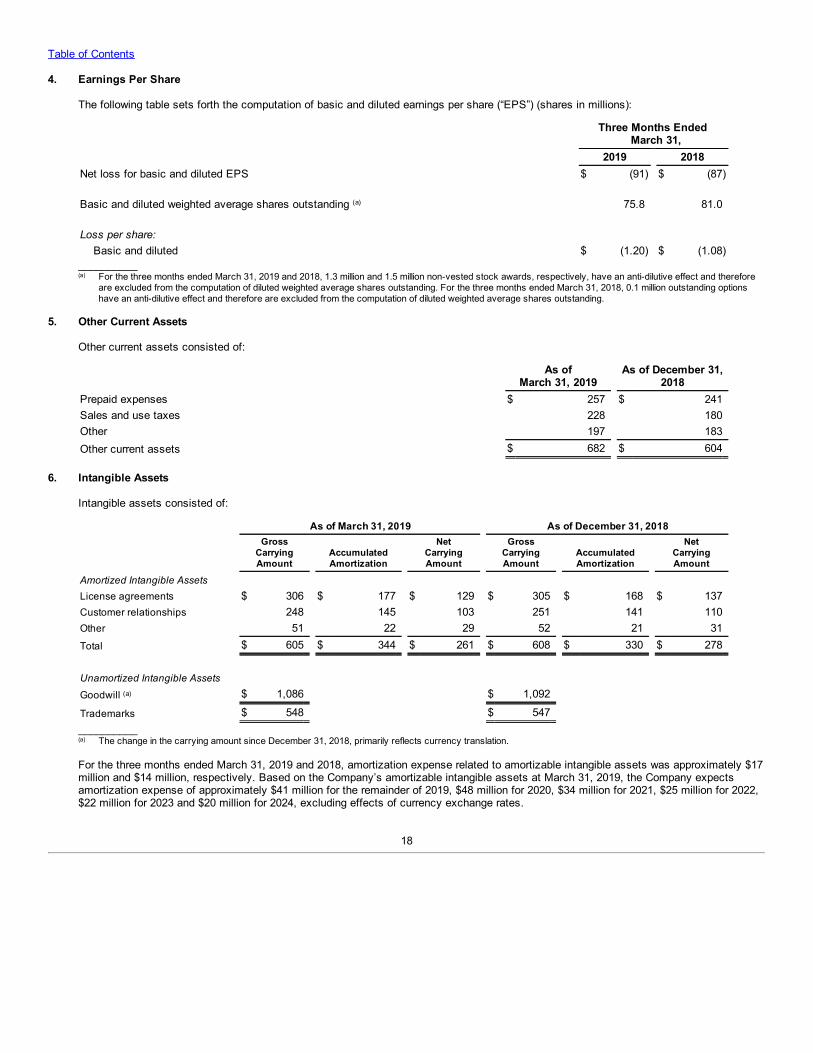
Table of Contents
4. Earnings Per Share
The following table sets forth the computation of basic and diluted earnings per share (“EPS”) (shares in millions):
Three Months Ended
March 31, 2019 2018Net loss for basic and diluted EPS $ (91) $ (87) Basic and diluted weighted average shares outstanding (a) 75.8 81.0 Loss per share: Basic and diluted $ (1.20) $ (1.08)__________(a) For the three months ended March 31, 2019 and 2018, 1.3 million and 1.5 million non-vested stock awards, respectively, have an anti-dilutive effect and therefore
are excluded from the computation of diluted weighted average shares outstanding. For the three months ended March 31, 2018, 0.1 million outstanding optionshave an anti-dilutive effect and therefore are excluded from the computation of diluted weighted average shares outstanding.
5. Other Current Assets
Other current assets consisted of:
As of
March 31, 2019 As of December 31,
2018Prepaid expenses $ 257 $ 241Sales and use taxes 228 180Other 197 183Other current assets $ 682 $ 604
6. Intangible Assets
Intangible assets consisted of:
As of March 31, 2019 As of December 31, 2018
GrossCarryingAmount
AccumulatedAmortization
NetCarryingAmount
GrossCarryingAmount
AccumulatedAmortization
NetCarryingAmount
Amortized Intangible Assets License agreements $ 306 $ 177 $ 129 $ 305 $ 168 $ 137Customer relationships 248 145 103 251 141 110Other 51 22 29 52 21 31Total $ 605 $ 344 $ 261 $ 608 $ 330 $ 278
Unamortized Intangible Assets Goodwill (a) $ 1,086 $ 1,092
Trademarks $ 548 $ 547 __________(a) The change in the carrying amount since December 31, 2018, primarily reflects currency translation.
For the three months ended March 31, 2019 and 2018, amortization expense related to amortizable intangible assets was approximately $17million and $14 million, respectively. Based on the Company’s amortizable intangible assets at March 31, 2019, the Company expectsamortization expense of approximately $41 million for the remainder of 2019, $48 million for 2020, $34 million for 2021, $25 million for 2022,$22 million for 2023 and $20 million for 2024, excluding effects of currency exchange rates.
18
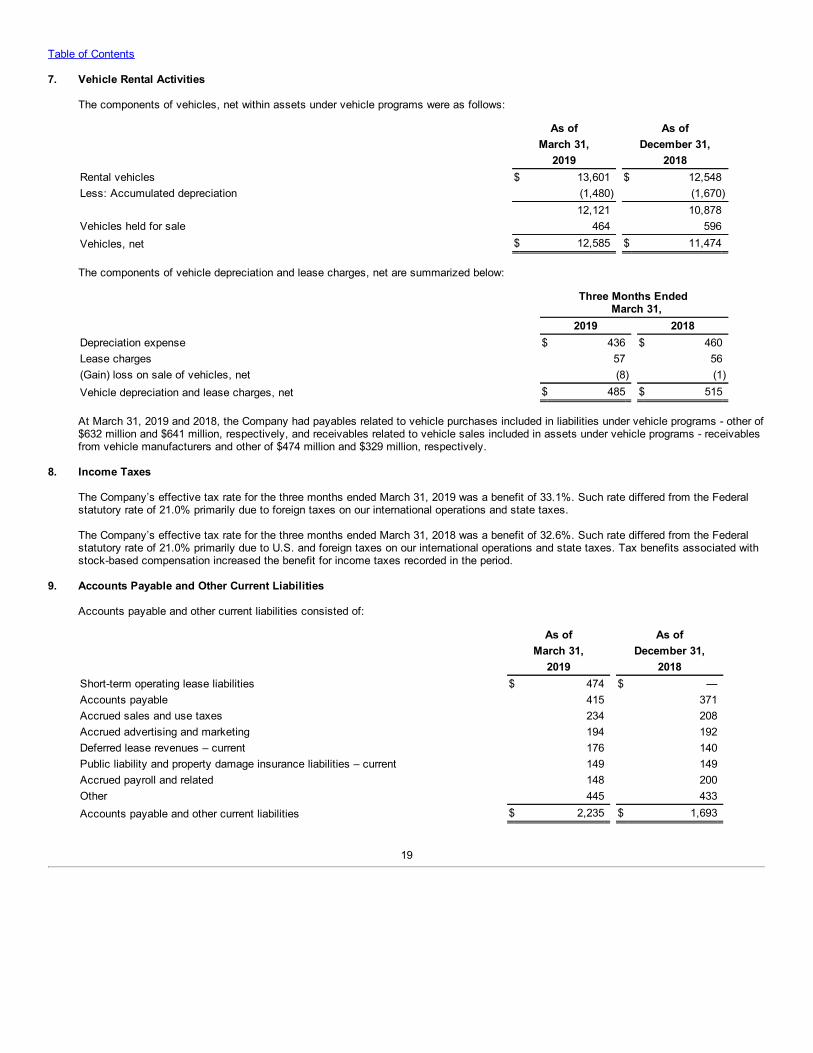
Table of Contents
7. Vehicle Rental Activities
The components of vehicles, net within assets under vehicle programs were as follows:
As of As of March 31, December 31, 2019 2018Rental vehicles $ 13,601 $ 12,548Less: Accumulated depreciation (1,480) (1,670) 12,121 10,878Vehicles held for sale 464 596Vehicles, net $ 12,585 $ 11,474
The components of vehicle depreciation and lease charges, net are summarized below:
Three Months Ended
March 31, 2019 2018Depreciation expense $ 436 $ 460Lease charges 57 56(Gain) loss on sale of vehicles, net (8) (1)Vehicle depreciation and lease charges, net $ 485 $ 515
At March 31, 2019 and 2018, the Company had payables related to vehicle purchases included in liabilities under vehicle programs - other of$632 million and $641 million, respectively, and receivables related to vehicle sales included in assets under vehicle programs - receivablesfrom vehicle manufacturers and other of $474 million and $329 million, respectively.
8. Income Taxes
The Company’s effective tax rate for the three months ended March 31, 2019 was a benefit of 33.1%. Such rate differed from the Federalstatutory rate of 21.0% primarily due to foreign taxes on our international operations and state taxes.
The Company’s effective tax rate for the three months ended March 31, 2018 was a benefit of 32.6%. Such rate differed from the Federalstatutory rate of 21.0% primarily due to U.S. and foreign taxes on our international operations and state taxes. Tax benefits associated withstock-based compensation increased the benefit for income taxes recorded in the period.
9. Accounts Payable and Other Current Liabilities
Accounts payable and other current liabilities consisted of:
As of As of March 31, December 31, 2019 2018Short-term operating lease liabilities $ 474 $ —Accounts payable 415 371Accrued sales and use taxes 234 208Accrued advertising and marketing 194 192Deferred lease revenues – current 176 140Public liability and property damage insurance liabilities – current 149 149Accrued payroll and related 148 200Other 445 433Accounts payable and other current liabilities $ 2,235 $ 1,693
19
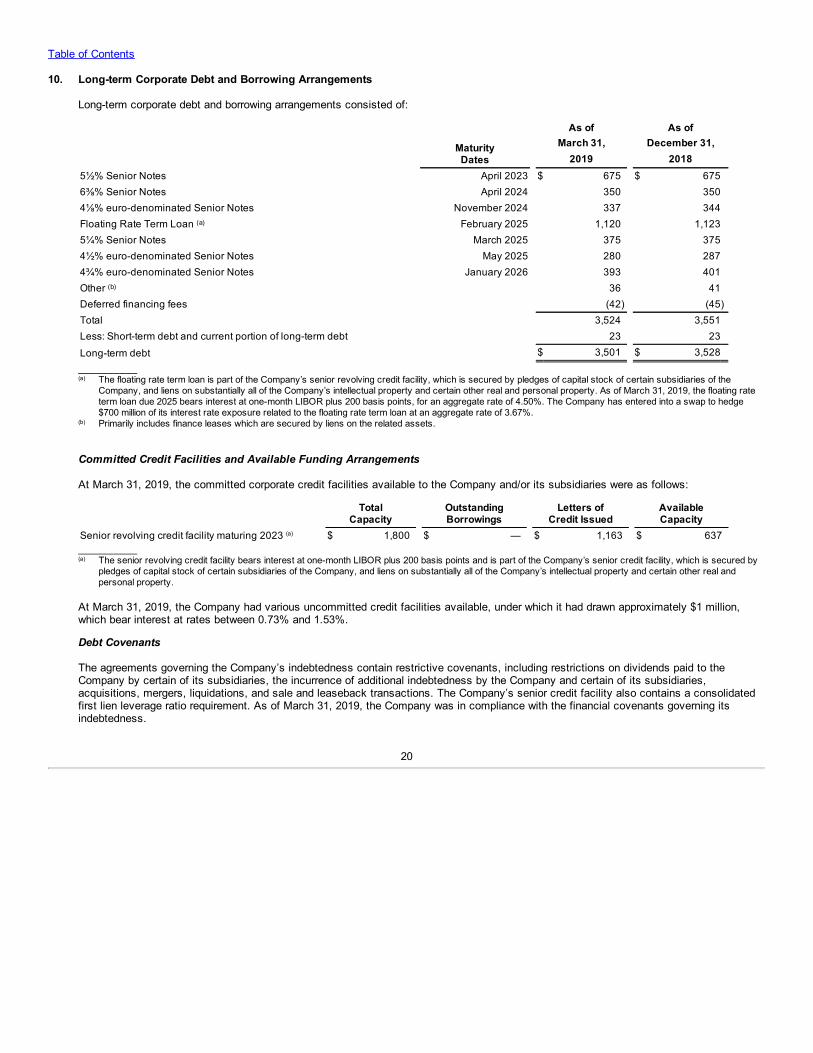
Table of Contents
10. Long-term Corporate Debt and Borrowing Arrangements
Long-term corporate debt and borrowing arrangements consisted of:
As of As of Maturity
Dates March 31, December 31,
2019 20185½% Senior Notes April 2023 $ 675 $ 6756⅜% Senior Notes April 2024 350 3504⅛% euro-denominated Senior Notes November 2024 337 344Floating Rate Term Loan (a) February 2025 1,120 1,1235¼% Senior Notes March 2025 375 3754½% euro-denominated Senior Notes May 2025 280 2874¾% euro-denominated Senior Notes January 2026 393 401Other (b) 36 41Deferred financing fees (42) (45)Total 3,524 3,551Less: Short-term debt and current portion of long-term debt 23 23
Long-term debt $ 3,501 $ 3,528__________(a) The floating rate term loan is part of the Company’s senior revolving credit facility, which is secured by pledges of capital stock of certain subsidiaries of the
Company, and liens on substantially all of the Company’s intellectual property and certain other real and personal property. As of March 31, 2019, the floating rateterm loan due 2025 bears interest at one-month LIBOR plus 200 basis points, for an aggregate rate of 4.50%. The Company has entered into a swap to hedge$700 million of its interest rate exposure related to the floating rate term loan at an aggregate rate of 3.67%.
(b) Primarily includes finance leases which are secured by liens on the related assets.
Committed Credit Facilities and Available Funding Arrangements
At March 31, 2019, the committed corporate credit facilities available to the Company and/or its subsidiaries were as follows:
Total
Capacity OutstandingBorrowings
Letters ofCredit Issued
AvailableCapacity
Senior revolving credit facility maturing 2023 (a) $ 1,800 $ — $ 1,163 $ 637__________(a) The senior revolving credit facility bears interest at one-month LIBOR plus 200 basis points and is part of the Company’s senior credit facility, which is secured by
pledges of capital stock of certain subsidiaries of the Company, and liens on substantially all of the Company’s intellectual property and certain other real andpersonal property.
At March 31, 2019, the Company had various uncommitted credit facilities available, under which it had drawn approximately $1 million,which bear interest at rates between 0.73% and 1.53%.
Debt Covenants
The agreements governing the Company’s indebtedness contain restrictive covenants, including restrictions on dividends paid to theCompany by certain of its subsidiaries, the incurrence of additional indebtedness by the Company and certain of its subsidiaries,acquisitions, mergers, liquidations, and sale and leaseback transactions. The Company’s senior credit facility also contains a consolidatedfirst lien leverage ratio requirement. As of March 31, 2019, the Company was in compliance with the financial covenants governing itsindebtedness.
20
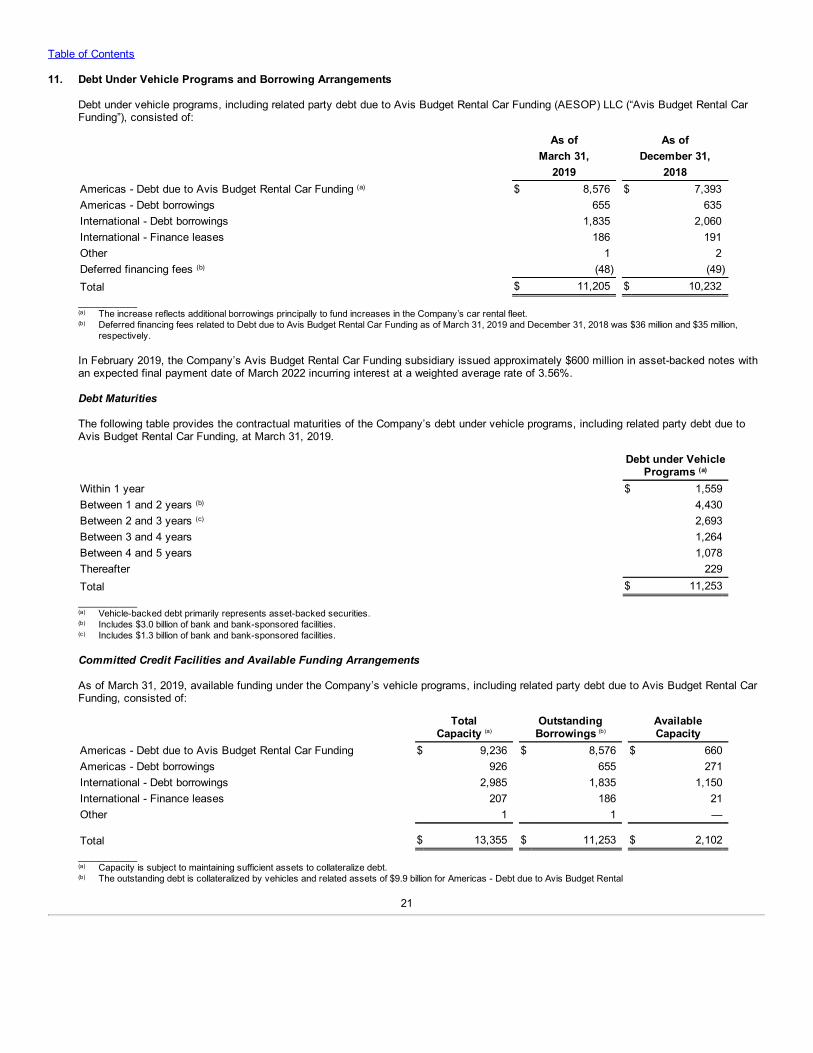
Table of Contents
11. Debt Under Vehicle Programs and Borrowing Arrangements
Debt under vehicle programs, including related party debt due to Avis Budget Rental Car Funding (AESOP) LLC (“Avis Budget Rental CarFunding”), consisted of:
As of As of March 31, December 31, 2019 2018Americas - Debt due to Avis Budget Rental Car Funding (a) $ 8,576 $ 7,393Americas - Debt borrowings 655 635International - Debt borrowings 1,835 2,060International - Finance leases 186 191Other 1 2Deferred financing fees (b) (48) (49)Total $ 11,205 $ 10,232__________(a) The increase reflects additional borrowings principally to fund increases in the Company’s car rental fleet.(b) Deferred financing fees related to Debt due to Avis Budget Rental Car Funding as of March 31, 2019 and December 31, 2018 was $36 million and $35 million,
respectively.
In February 2019, the Company’s Avis Budget Rental Car Funding subsidiary issued approximately $600 million in asset-backed notes withan expected final payment date of March 2022 incurring interest at a weighted average rate of 3.56%.
Debt Maturities
The following table provides the contractual maturities of the Company’s debt under vehicle programs, including related party debt due toAvis Budget Rental Car Funding, at March 31, 2019.
Debt under Vehicle
Programs (a)
Within 1 year $ 1,559Between 1 and 2 years (b) 4,430Between 2 and 3 years (c) 2,693Between 3 and 4 years 1,264Between 4 and 5 years 1,078Thereafter 229Total $ 11,253__________(a) Vehicle-backed debt primarily represents asset-backed securities.(b) Includes $3.0 billion of bank and bank-sponsored facilities.(c) Includes $1.3 billion of bank and bank-sponsored facilities.
Committed Credit Facilities and Available Funding Arrangements
As of March 31, 2019, available funding under the Company’s vehicle programs, including related party debt due to Avis Budget Rental CarFunding, consisted of:
Total
Capacity (a) OutstandingBorrowings (b)
AvailableCapacity
Americas - Debt due to Avis Budget Rental Car Funding $ 9,236 $ 8,576 $ 660Americas - Debt borrowings 926 655 271International - Debt borrowings 2,985 1,835 1,150International - Finance leases 207 186 21Other 1 1 —
Total $ 13,355 $ 11,253 $ 2,102__________(a) Capacity is subject to maintaining sufficient assets to collateralize debt.(b) The outstanding debt is collateralized by vehicles and related assets of $9.9 billion for Americas - Debt due to Avis Budget Rental
21
Table of Contents
Car Funding; $0.7 billion for Americas - Debt borrowings; $2.0 billion for International - Debt borrowings; and $0.2 billion for International - Finance leases.
Debt Covenants
The agreements under the Company’s vehicle-backed funding programs contain restrictive covenants, including restrictions on dividendspaid to the Company by certain of its subsidiaries and restrictions on indebtedness, mergers, liens, liquidations, and sale and leasebacktransactions and in some cases also require compliance with certain financial requirements. As of March 31, 2019, the Company is notaware of any instances of non-compliance with any of the financial covenants contained in the debt agreements under its vehicle-backedfunding programs.
12. Commitments and Contingencies
Contingencies
In 2006, the Company completed the spin-offs of its Realogy and Wyndham subsidiaries. The Company does not believe that the impact ofany resolution of pre-existing contingent liabilities in connection with the spin-offs should result in a material liability to the Company inrelation to its consolidated financial position or liquidity, as Realogy and Wyndham each have agreed to assume responsibility for theseliabilities. The Company is also named in litigation that is primarily related to the businesses of its former subsidiaries, including Realogyand Wyndham. The Company is entitled to indemnification from such entities for any liability resulting from such litigation.
In February 2017, following a state court trial in Georgia, a jury found the Company liable for damages in a case brought by a plaintiff whowas injured in a vehicle accident allegedly caused by an employee of an independent contractor of the Company who was acting outside ofthe scope of employment. In March 2017, the Company was also found liable for damages in a companion case arising from the sameincident. The Company is appealing both verdicts and considers the attribution of liability to the Company, and the amount of damagesawarded, to be unsupported by the facts of these cases. The Company has recognized a liability for the expected loss related to thesecases, net of recoverable insurance proceeds, of approximately $12 million.
The Company is involved in claims, legal proceedings and governmental inquiries that are incidental to its vehicle rental and car sharingoperations, including, among others, contract and licensee disputes, competition matters, employment and wage-and-hour claims, insuranceand liability claims, intellectual property claims, business practice disputes and other regulatory, environmental, commercial and taxmatters. Litigation is inherently unpredictable and, although the Company believes that its accruals are adequate and/or that it has validdefenses in these matters, unfavorable resolutions could occur. The Company estimates that the potential exposure resulting from adverseoutcomes of legal proceedings in which it is reasonably possible that a loss may be incurred could, in the aggregate, be up to approximately$45 million in excess of amounts accrued as of March 31, 2019. The Company does not believe that the impact should result in a materialliability to the Company in relation to its consolidated financial condition or results of operations.
Commitments to Purchase Vehicles
The Company maintains agreements with vehicle manufacturers under which the Company has agreed to purchase approximately $6.0billion of vehicles from manufacturers over the next 12 months financed primarily through the issuance of vehicle-backed debt and cashreceived upon the disposition of vehicles. Certain of these commitments are subject to the vehicle manufacturers satisfying their obligationsunder their respective repurchase and guaranteed depreciation agreements.
Concentrations
Concentrations of credit risk at March 31, 2019 include (i) risks related to the Company’s repurchase and guaranteed depreciationagreements with domestic and foreign car manufacturers, primarily with respect to receivables for program cars that have been disposed butfor which the Company has not yet received payment from the manufacturers and (ii) risks related to Realogy and Wyndham, includingreceivables of
22
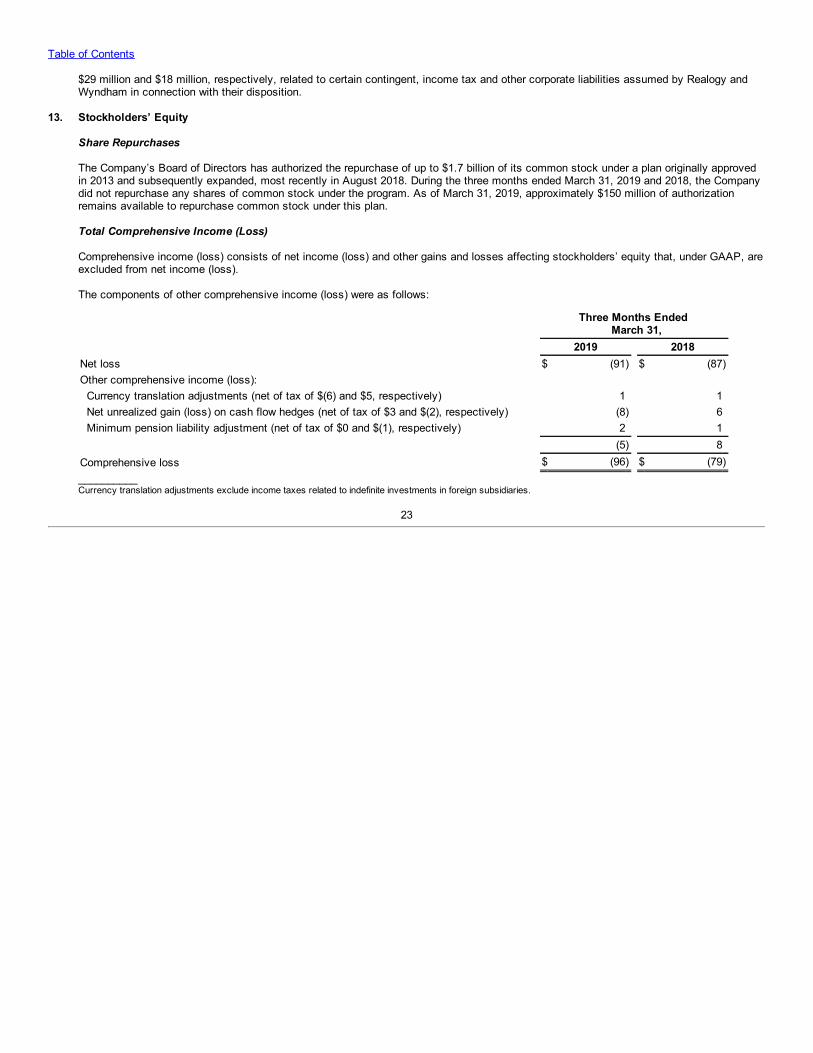
Table of Contents
$29 million and $18 million, respectively, related to certain contingent, income tax and other corporate liabilities assumed by Realogy andWyndham in connection with their disposition.
13. Stockholders’ Equity
Share Repurchases
The Company’s Board of Directors has authorized the repurchase of up to $1.7 billion of its common stock under a plan originally approvedin 2013 and subsequently expanded, most recently in August 2018. During the three months ended March 31, 2019 and 2018, the Companydid not repurchase any shares of common stock under the program. As of March 31, 2019, approximately $150 million of authorizationremains available to repurchase common stock under this plan.
Total Comprehensive Income (Loss)
Comprehensive income (loss) consists of net income (loss) and other gains and losses affecting stockholders’ equity that, under GAAP, areexcluded from net income (loss).
The components of other comprehensive income (loss) were as follows:
Three Months Ended
March 31, 2019 2018Net loss $ (91) $ (87)Other comprehensive income (loss): Currency translation adjustments (net of tax of $(6) and $5, respectively) 1 1 Net unrealized gain (loss) on cash flow hedges (net of tax of $3 and $(2), respectively) (8) 6 Minimum pension liability adjustment (net of tax of $0 and $(1), respectively) 2 1 (5) 8Comprehensive loss $ (96) $ (79)__________Currency translation adjustments exclude income taxes related to indefinite investments in foreign subsidiaries.
23
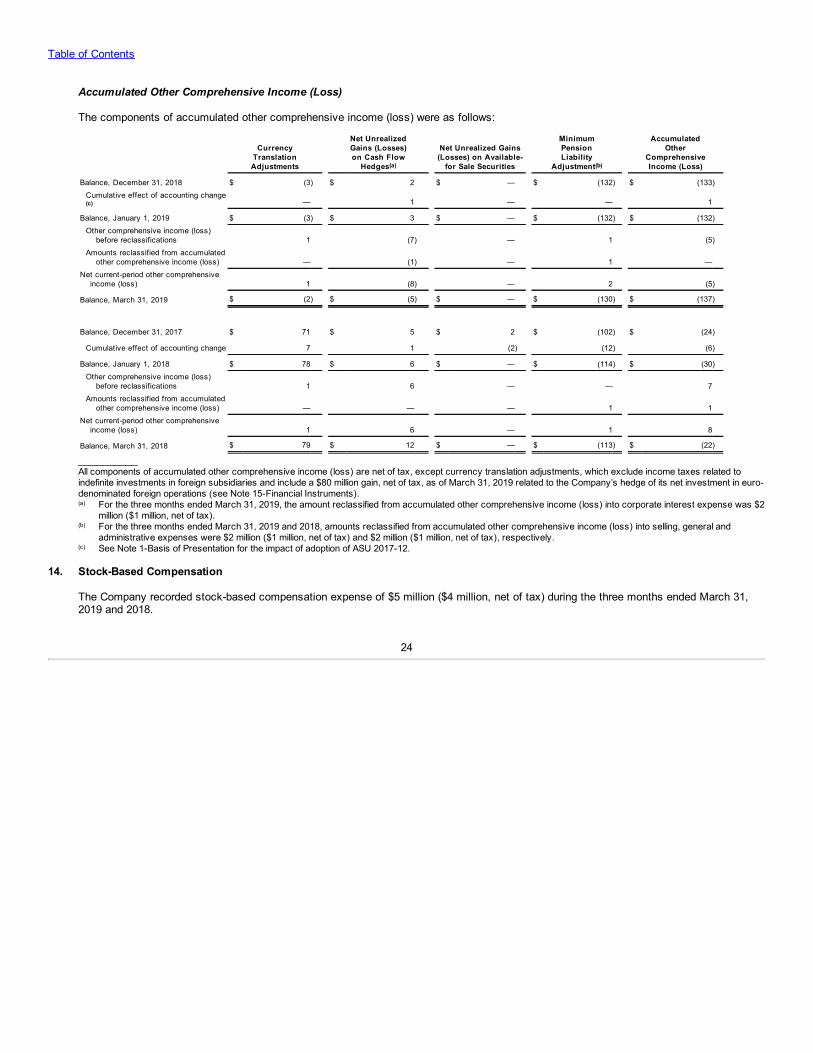
Table of Contents
Accumulated Other Comprehensive Income (Loss)
The components of accumulated other comprehensive income (loss) were as follows:
Currency
TranslationAdjustments
Net UnrealizedGains (Losses)on Cash Flow
Hedges(a) Net Unrealized Gains
(Losses) on Available-for Sale Securities
MinimumPensionLiability
Adjustment(b)
AccumulatedOther
ComprehensiveIncome (Loss)
Balance, December 31, 2018 $ (3) $ 2 $ — $ (132) $ (133)
Cumulative effect of accounting change(c) — 1 — — 1
Balance, January 1, 2019 $ (3) $ 3 $ — $ (132) $ (132)
Other comprehensive income (loss)
before reclassifications 1 (7) — 1 (5)
Amounts reclassified from accumulated
other comprehensive income (loss) — (1) — 1 —
Net current-period other comprehensiveincome (loss) 1 (8) — 2 (5)
Balance, March 31, 2019 $ (2) $ (5) $ — $ (130) $ (137)
Balance, December 31, 2017 $ 71 $ 5 $ 2 $ (102) $ (24)
Cumulative effect of accounting change 7 1 (2) (12) (6)
Balance, January 1, 2018 $ 78 $ 6 $ — $ (114) $ (30)
Other comprehensive income (loss)
before reclassifications 1 6 — — 7
Amounts reclassified from accumulated
other comprehensive income (loss) — — — 1 1
Net current-period other comprehensiveincome (loss) 1 6 — 1 8
Balance, March 31, 2018 $ 79 $ 12 $ — $ (113) $ (22)
__________All components of accumulated other comprehensive income (loss) are net of tax, except currency translation adjustments, which exclude income taxes related toindefinite investments in foreign subsidiaries and include a $80 million gain, net of tax, as of March 31, 2019 related to the Company’s hedge of its net investment in euro-denominated foreign operations (see Note 15-Financial Instruments).(a) For the three months ended March 31, 2019, the amount reclassified from accumulated other comprehensive income (loss) into corporate interest expense was $2
million ($1 million, net of tax).(b) For the three months ended March 31, 2019 and 2018, amounts reclassified from accumulated other comprehensive income (loss) into selling, general and
administrative expenses were $2 million ($1 million, net of tax) and $2 million ($1 million, net of tax), respectively.(c) See Note 1-Basis of Presentation for the impact of adoption of ASU 2017-12.
14. Stock-Based Compensation
The Company recorded stock-based compensation expense of $5 million ($4 million, net of tax) during the three months ended March 31,2019 and 2018.
24
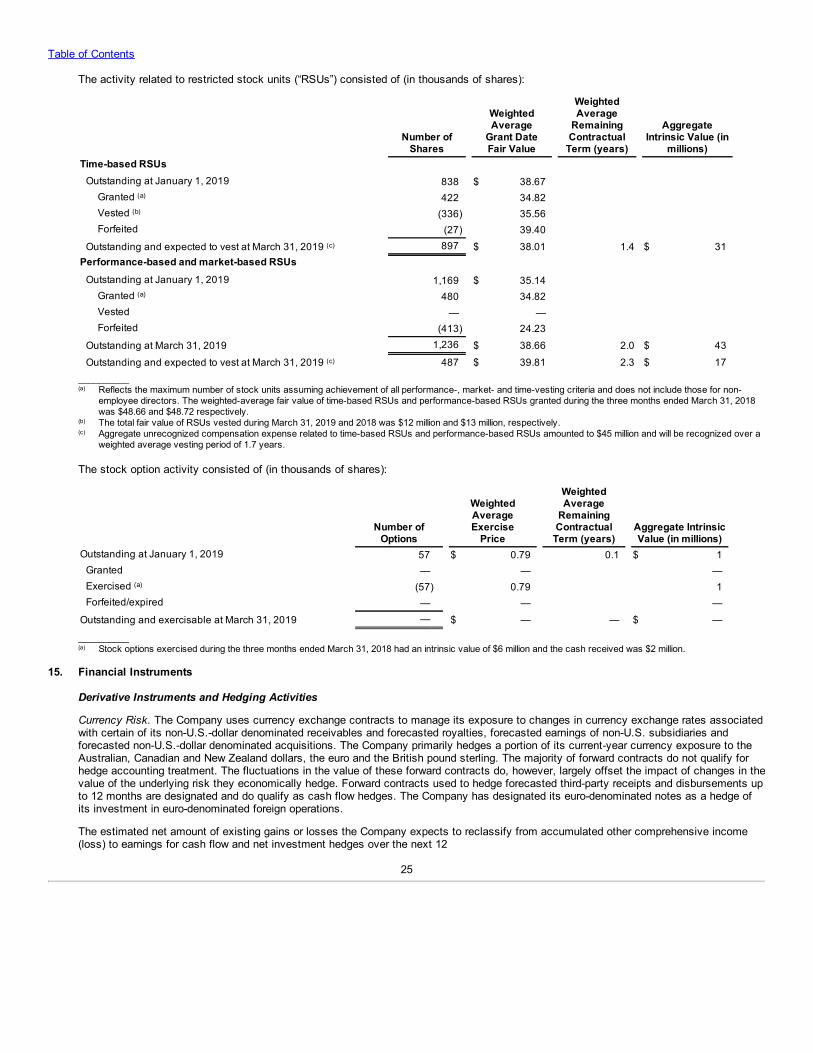
Table of Contents
The activity related to restricted stock units (“RSUs”) consisted of (in thousands of shares):
Number of
Shares
WeightedAverage
Grant DateFair Value
WeightedAverage
RemainingContractual
Term (years)
AggregateIntrinsic Value (in
millions)Time-based RSUs Outstanding at January 1, 2019 838 $ 38.67 Granted (a) 422 34.82 Vested (b) (336) 35.56 Forfeited (27) 39.40 Outstanding and expected to vest at March 31, 2019 (c) 897 $ 38.01 1.4 $ 31Performance-based and market-based RSUs Outstanding at January 1, 2019 1,169 $ 35.14 Granted (a) 480 34.82 Vested — — Forfeited (413) 24.23 Outstanding at March 31, 2019 1,236 $ 38.66 2.0 $ 43
Outstanding and expected to vest at March 31, 2019 (c) 487 $ 39.81 2.3 $ 17__________(a) Reflects the maximum number of stock units assuming achievement of all performance-, market- and time-vesting criteria and does not include those for non-
employee directors. The weighted-average fair value of time-based RSUs and performance-based RSUs granted during the three months ended March 31, 2018was $48.66 and $48.72 respectively.
(b) The total fair value of RSUs vested during March 31, 2019 and 2018 was $12 million and $13 million, respectively.(c) Aggregate unrecognized compensation expense related to time-based RSUs and performance-based RSUs amounted to $45 million and will be recognized over a
weighted average vesting period of 1.7 years.
The stock option activity consisted of (in thousands of shares):
Number of
Options
WeightedAverageExercise
Price
WeightedAverage
RemainingContractual
Term (years) Aggregate IntrinsicValue (in millions)
Outstanding at January 1, 2019 57 $ 0.79 0.1 $ 1 Granted — — — Exercised (a) (57) 0.79 1 Forfeited/expired — — —
Outstanding and exercisable at March 31, 2019 — $ — — $ —
__________(a) Stock options exercised during the three months ended March 31, 2018 had an intrinsic value of $6 million and the cash received was $2 million.
15. Financial Instruments
Derivative Instruments and Hedging Activities
Currency Risk. The Company uses currency exchange contracts to manage its exposure to changes in currency exchange rates associatedwith certain of its non-U.S.-dollar denominated receivables and forecasted royalties, forecasted earnings of non-U.S. subsidiaries andforecasted non-U.S.-dollar denominated acquisitions. The Company primarily hedges a portion of its current-year currency exposure to theAustralian, Canadian and New Zealand dollars, the euro and the British pound sterling. The majority of forward contracts do not qualify forhedge accounting treatment. The fluctuations in the value of these forward contracts do, however, largely offset the impact of changes in thevalue of the underlying risk they economically hedge. Forward contracts used to hedge forecasted third-party receipts and disbursements upto 12 months are designated and do qualify as cash flow hedges. The Company has designated its euro-denominated notes as a hedge ofits investment in euro-denominated foreign operations.
The estimated net amount of existing gains or losses the Company expects to reclassify from accumulated other comprehensive income(loss) to earnings for cash flow and net investment hedges over the next 12
25
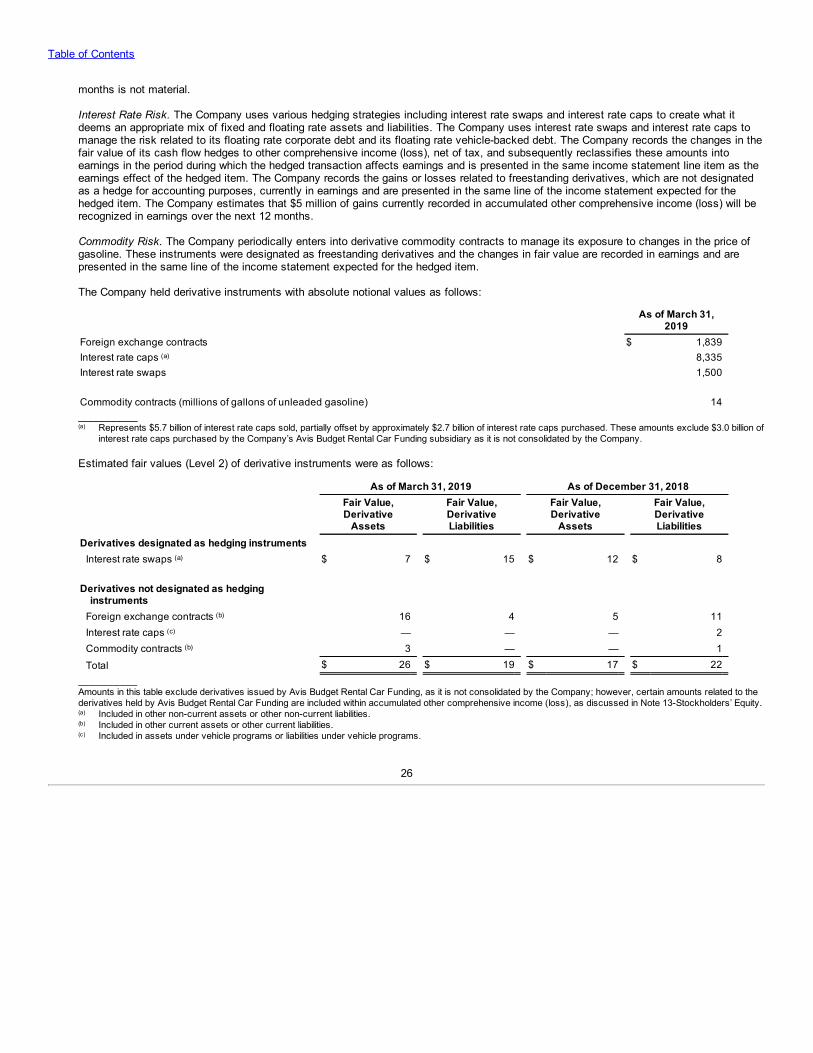
Table of Contents
months is not material.
Interest Rate Risk. The Company uses various hedging strategies including interest rate swaps and interest rate caps to create what itdeems an appropriate mix of fixed and floating rate assets and liabilities. The Company uses interest rate swaps and interest rate caps tomanage the risk related to its floating rate corporate debt and its floating rate vehicle-backed debt. The Company records the changes in thefair value of its cash flow hedges to other comprehensive income (loss), net of tax, and subsequently reclassifies these amounts intoearnings in the period during which the hedged transaction affects earnings and is presented in the same income statement line item as theearnings effect of the hedged item. The Company records the gains or losses related to freestanding derivatives, which are not designatedas a hedge for accounting purposes, currently in earnings and are presented in the same line of the income statement expected for thehedged item. The Company estimates that $5 million of gains currently recorded in accumulated other comprehensive income (loss) will berecognized in earnings over the next 12 months.
Commodity Risk. The Company periodically enters into derivative commodity contracts to manage its exposure to changes in the price ofgasoline. These instruments were designated as freestanding derivatives and the changes in fair value are recorded in earnings and arepresented in the same line of the income statement expected for the hedged item.
The Company held derivative instruments with absolute notional values as follows:
As of March 31,
2019Foreign exchange contracts $ 1,839Interest rate caps (a) 8,335Interest rate swaps 1,500 Commodity contracts (millions of gallons of unleaded gasoline) 14__________(a) Represents $5.7 billion of interest rate caps sold, partially offset by approximately $2.7 billion of interest rate caps purchased. These amounts exclude $3.0 billion of
interest rate caps purchased by the Company’s Avis Budget Rental Car Funding subsidiary as it is not consolidated by the Company.
Estimated fair values (Level 2) of derivative instruments were as follows:
As of March 31, 2019 As of December 31, 2018
Fair Value,Derivative
Assets
Fair Value,DerivativeLiabilities
Fair Value,Derivative
Assets
Fair Value,DerivativeLiabilities
Derivatives designated as hedging instruments Interest rate swaps (a) $ 7 $ 15 $ 12 $ 8 Derivatives not designated as hedging
instruments Foreign exchange contracts (b) 16 4 5 11 Interest rate caps (c) — — — 2 Commodity contracts (b) 3 — — 1
Total $ 26 $ 19 $ 17 $ 22__________Amounts in this table exclude derivatives issued by Avis Budget Rental Car Funding, as it is not consolidated by the Company; however, certain amounts related to thederivatives held by Avis Budget Rental Car Funding are included within accumulated other comprehensive income (loss), as discussed in Note 13-Stockholders’ Equity.(a) Included in other non-current assets or other non-current liabilities.(b) Included in other current assets or other current liabilities.(c) Included in assets under vehicle programs or liabilities under vehicle programs.
26
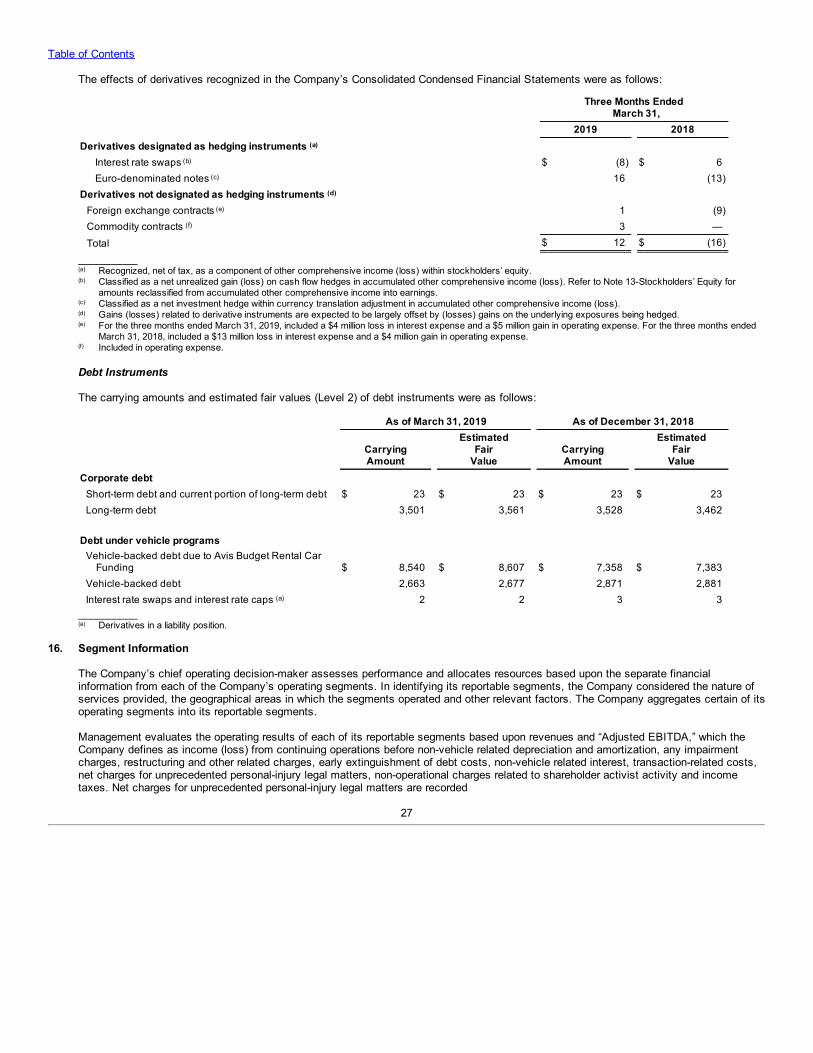
Table of Contents
The effects of derivatives recognized in the Company’s Consolidated Condensed Financial Statements were as follows:
Three Months Ended
March 31, 2019 2018Derivatives designated as hedging instruments (a) Interest rate swaps (b) $ (8) $ 6 Euro-denominated notes (c) 16 (13)Derivatives not designated as hedging instruments (d) Foreign exchange contracts (e) 1 (9) Commodity contracts (f) 3 —
Total $ 12 $ (16)
__________(a) Recognized, net of tax, as a component of other comprehensive income (loss) within stockholders’ equity.(b) Classified as a net unrealized gain (loss) on cash flow hedges in accumulated other comprehensive income (loss). Refer to Note 13-Stockholders’ Equity for
amounts reclassified from accumulated other comprehensive income into earnings.(c) Classified as a net investment hedge within currency translation adjustment in accumulated other comprehensive income (loss).(d) Gains (losses) related to derivative instruments are expected to be largely offset by (losses) gains on the underlying exposures being hedged.(e) For the three months ended March 31, 2019, included a $4 million loss in interest expense and a $5 million gain in operating expense. For the three months ended
March 31, 2018, included a $13 million loss in interest expense and a $4 million gain in operating expense.(f) Included in operating expense.
Debt Instruments
The carrying amounts and estimated fair values (Level 2) of debt instruments were as follows:
As of March 31, 2019 As of December 31, 2018
CarryingAmount
EstimatedFair
Value CarryingAmount
EstimatedFair
ValueCorporate debt Short-term debt and current portion of long-term debt $ 23 $ 23 $ 23 $ 23 Long-term debt 3,501 3,561 3,528 3,462 Debt under vehicle programs
Vehicle-backed debt due to Avis Budget Rental Car
Funding $ 8,540 $ 8,607 $ 7,358 $ 7,383 Vehicle-backed debt 2,663 2,677 2,871 2,881 Interest rate swaps and interest rate caps (a) 2 2 3 3__________(a) Derivatives in a liability position.
16. Segment Information
The Company’s chief operating decision-maker assesses performance and allocates resources based upon the separate financialinformation from each of the Company’s operating segments. In identifying its reportable segments, the Company considered the nature ofservices provided, the geographical areas in which the segments operated and other relevant factors. The Company aggregates certain of itsoperating segments into its reportable segments.
Management evaluates the operating results of each of its reportable segments based upon revenues and “Adjusted EBITDA,” which theCompany defines as income (loss) from continuing operations before non-vehicle related depreciation and amortization, any impairmentcharges, restructuring and other related charges, early extinguishment of debt costs, non-vehicle related interest, transaction-related costs,net charges for unprecedented personal-injury legal matters, non-operational charges related to shareholder activist activity and incometaxes. Net charges for unprecedented personal-injury legal matters are recorded
27
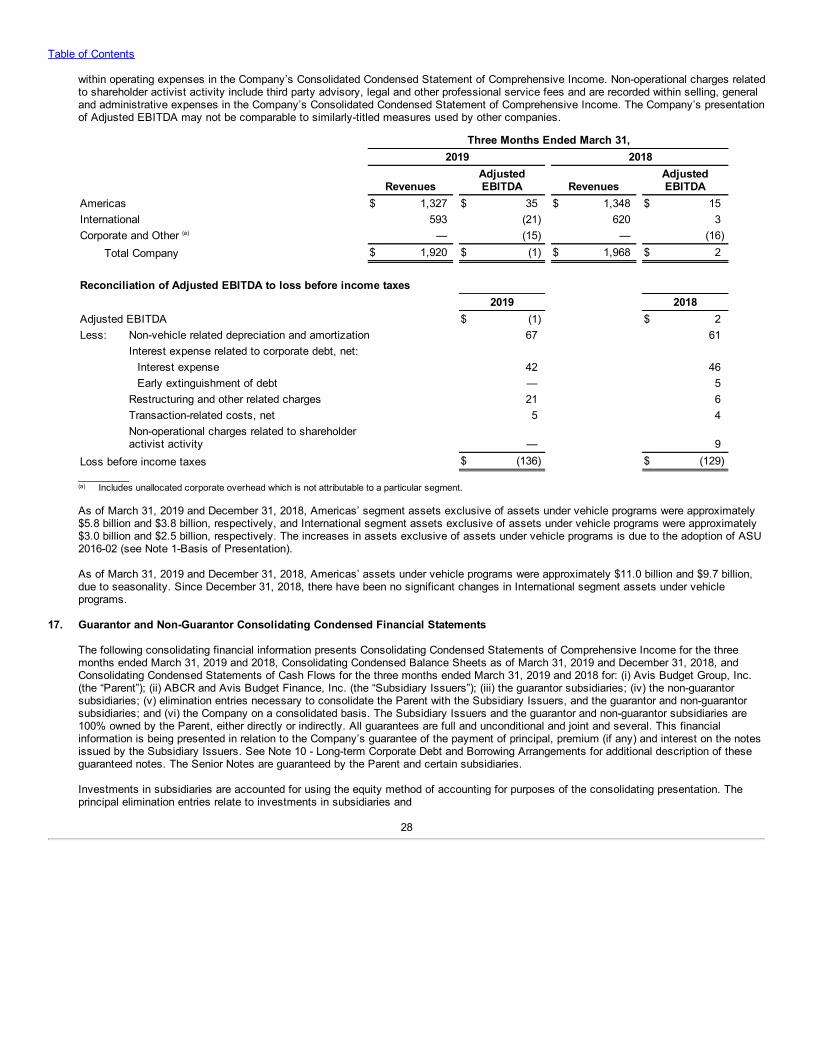
Table of Contents
within operating expenses in the Company’s Consolidated Condensed Statement of Comprehensive Income. Non-operational charges relatedto shareholder activist activity include third party advisory, legal and other professional service fees and are recorded within selling, generaland administrative expenses in the Company’s Consolidated Condensed Statement of Comprehensive Income. The Company’s presentationof Adjusted EBITDA may not be comparable to similarly-titled measures used by other companies.
Three Months Ended March 31, 2019 2018
RevenuesAdjustedEBITDA Revenues
AdjustedEBITDA
Americas $ 1,327 $ 35 $ 1,348 $ 15International 593 (21) 620 3Corporate and Other (a) — (15) — (16) Total Company $ 1,920 $ (1) $ 1,968 $ 2
Reconciliation of Adjusted EBITDA to loss before income taxes 2019 2018Adjusted EBITDA $ (1) $ 2Less: Non-vehicle related depreciation and amortization 67 61 Interest expense related to corporate debt, net: Interest expense 42 46 Early extinguishment of debt — 5 Restructuring and other related charges 21 6 Transaction-related costs, net 5 4
Non-operational charges related to shareholderactivist activity — 9
Loss before income taxes $ (136) $ (129)__________(a) Includes unallocated corporate overhead which is not attributable to a particular segment.
As of March 31, 2019 and December 31, 2018, Americas’ segment assets exclusive of assets under vehicle programs were approximately$5.8 billion and $3.8 billion, respectively, and International segment assets exclusive of assets under vehicle programs were approximately$3.0 billion and $2.5 billion, respectively. The increases in assets exclusive of assets under vehicle programs is due to the adoption of ASU2016-02 (see Note 1-Basis of Presentation).
As of March 31, 2019 and December 31, 2018, Americas’ assets under vehicle programs were approximately $11.0 billion and $9.7 billion,due to seasonality. Since December 31, 2018, there have been no significant changes in International segment assets under vehicleprograms.
17. Guarantor and Non-Guarantor Consolidating Condensed Financial Statements
The following consolidating financial information presents Consolidating Condensed Statements of Comprehensive Income for the threemonths ended March 31, 2019 and 2018, Consolidating Condensed Balance Sheets as of March 31, 2019 and December 31, 2018, andConsolidating Condensed Statements of Cash Flows for the three months ended March 31, 2019 and 2018 for: (i) Avis Budget Group, Inc.(the “Parent”); (ii) ABCR and Avis Budget Finance, Inc. (the “Subsidiary Issuers”); (iii) the guarantor subsidiaries; (iv) the non-guarantorsubsidiaries; (v) elimination entries necessary to consolidate the Parent with the Subsidiary Issuers, and the guarantor and non-guarantorsubsidiaries; and (vi) the Company on a consolidated basis. The Subsidiary Issuers and the guarantor and non-guarantor subsidiaries are100% owned by the Parent, either directly or indirectly. All guarantees are full and unconditional and joint and several. This financialinformation is being presented in relation to the Company’s guarantee of the payment of principal, premium (if any) and interest on the notesissued by the Subsidiary Issuers. See Note 10 - Long-term Corporate Debt and Borrowing Arrangements for additional description of theseguaranteed notes. The Senior Notes are guaranteed by the Parent and certain subsidiaries.
Investments in subsidiaries are accounted for using the equity method of accounting for purposes of the consolidating presentation. Theprincipal elimination entries relate to investments in subsidiaries and
28
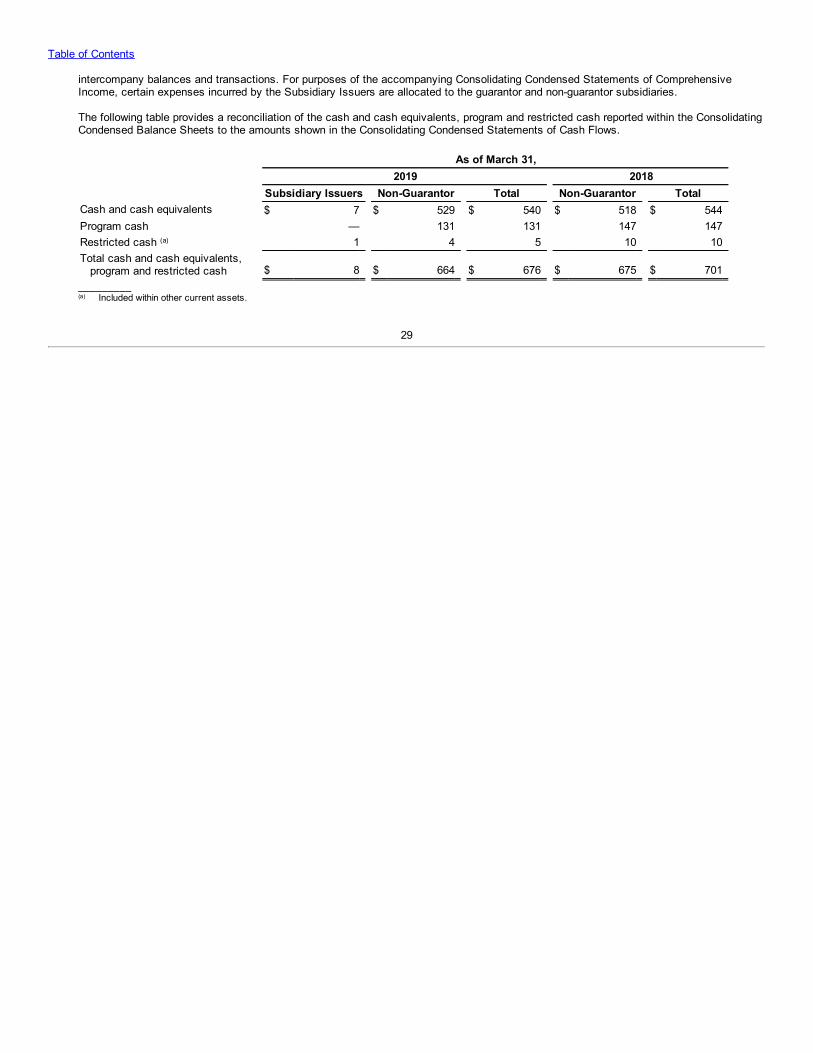
Table of Contents
intercompany balances and transactions. For purposes of the accompanying Consolidating Condensed Statements of ComprehensiveIncome, certain expenses incurred by the Subsidiary Issuers are allocated to the guarantor and non-guarantor subsidiaries.
The following table provides a reconciliation of the cash and cash equivalents, program and restricted cash reported within the ConsolidatingCondensed Balance Sheets to the amounts shown in the Consolidating Condensed Statements of Cash Flows.
As of March 31, 2019 2018 Subsidiary Issuers Non-Guarantor Total Non-Guarantor TotalCash and cash equivalents $ 7 $ 529 $ 540 $ 518 $ 544Program cash — 131 131 147 147Restricted cash (a) 1 4 5 10 10Total cash and cash equivalents,
program and restricted cash $ 8 $ 664 $ 676 $ 675 $ 701_________(a) Included within other current assets.
29
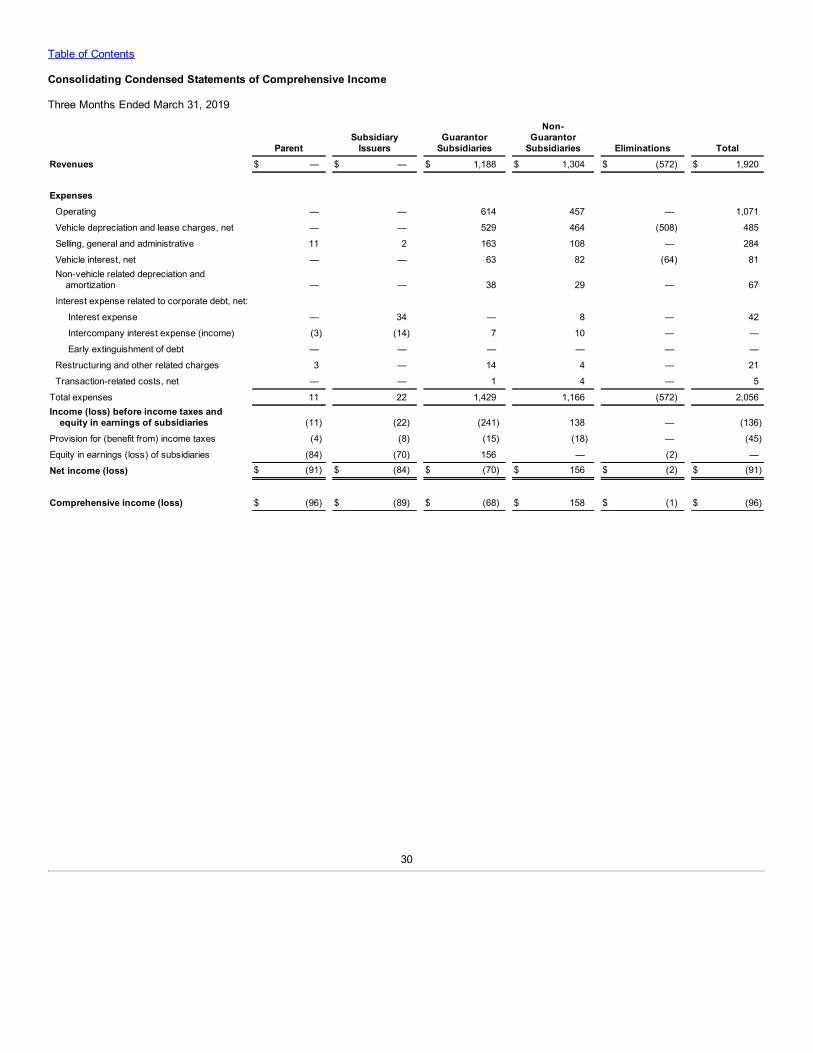
Table of Contents
Consolidating Condensed Statements of Comprehensive Income
Three Months Ended March 31, 2019
Parent Subsidiary
Issuers Guarantor
Subsidiaries
Non-Guarantor
Subsidiaries Eliminations TotalRevenues $ — $ — $ 1,188 $ 1,304 $ (572) $ 1,920
Expenses Operating — — 614 457 — 1,071
Vehicle depreciation and lease charges, net — — 529 464 (508) 485
Selling, general and administrative 11 2 163 108 — 284
Vehicle interest, net — — 63 82 (64) 81
Non-vehicle related depreciation and
amortization — — 38 29 — 67
Interest expense related to corporate debt, net: Interest expense — 34 — 8 — 42
Intercompany interest expense (income) (3) (14) 7 10 — —
Early extinguishment of debt — — — — — —
Restructuring and other related charges 3 — 14 4 — 21
Transaction-related costs, net — — 1 4 — 5
Total expenses 11 22 1,429 1,166 (572) 2,056Income (loss) before income taxes and
equity in earnings of subsidiaries (11) (22) (241) 138 — (136)
Provision for (benefit from) income taxes (4) (8) (15) (18) — (45)
Equity in earnings (loss) of subsidiaries (84) (70) 156 — (2) —
Net income (loss) $ (91) $ (84) $ (70) $ 156 $ (2) $ (91)
Comprehensive income (loss) $ (96) $ (89) $ (68) $ 158 $ (1) $ (96)
30
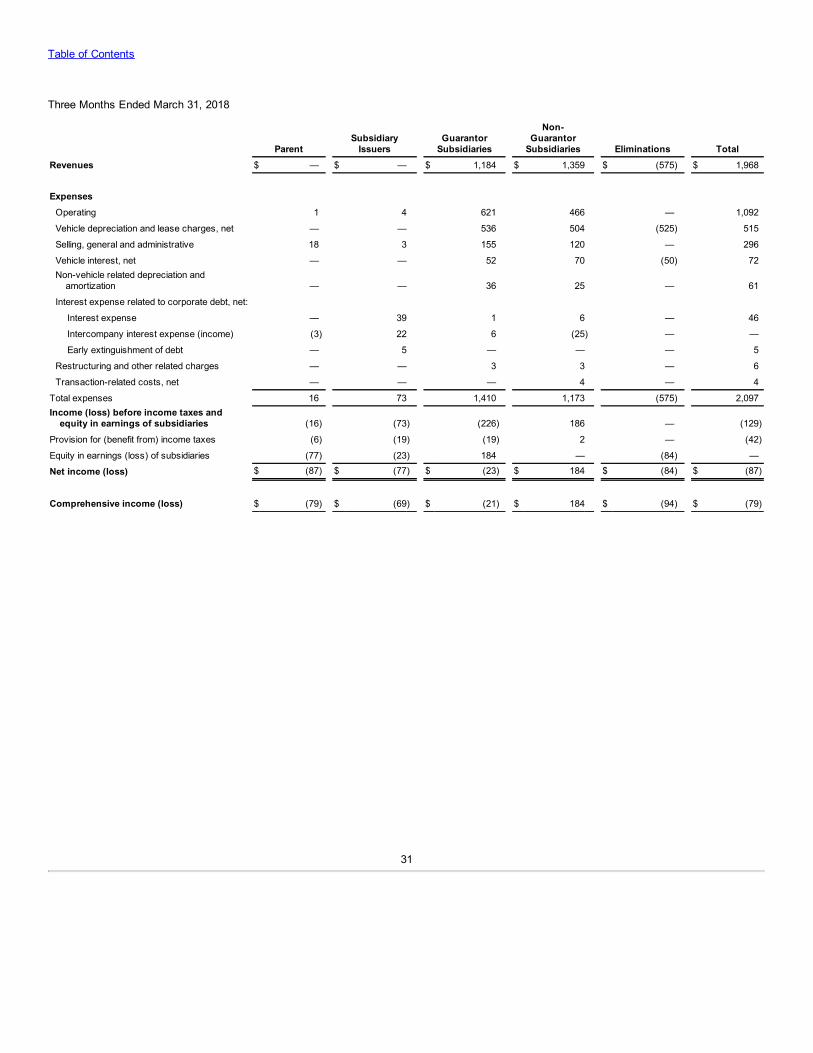
Table of Contents
Three Months Ended March 31, 2018
Parent Subsidiary
Issuers Guarantor
Subsidiaries
Non-Guarantor
Subsidiaries Eliminations TotalRevenues $ — $ — $ 1,184 $ 1,359 $ (575) $ 1,968
Expenses Operating 1 4 621 466 — 1,092
Vehicle depreciation and lease charges, net — — 536 504 (525) 515
Selling, general and administrative 18 3 155 120 — 296
Vehicle interest, net — — 52 70 (50) 72
Non-vehicle related depreciation and
amortization — — 36 25 — 61
Interest expense related to corporate debt, net: Interest expense — 39 1 6 — 46
Intercompany interest expense (income) (3) 22 6 (25) — —
Early extinguishment of debt — 5 — — — 5
Restructuring and other related charges — — 3 3 — 6
Transaction-related costs, net — — — 4 — 4
Total expenses 16 73 1,410 1,173 (575) 2,097Income (loss) before income taxes and
equity in earnings of subsidiaries (16) (73) (226) 186 — (129)
Provision for (benefit from) income taxes (6) (19) (19) 2 — (42)
Equity in earnings (loss) of subsidiaries (77) (23) 184 — (84) —
Net income (loss) $ (87) $ (77) $ (23) $ 184 $ (84) $ (87)
Comprehensive income (loss) $ (79) $ (69) $ (21) $ 184 $ (94) $ (79)
31
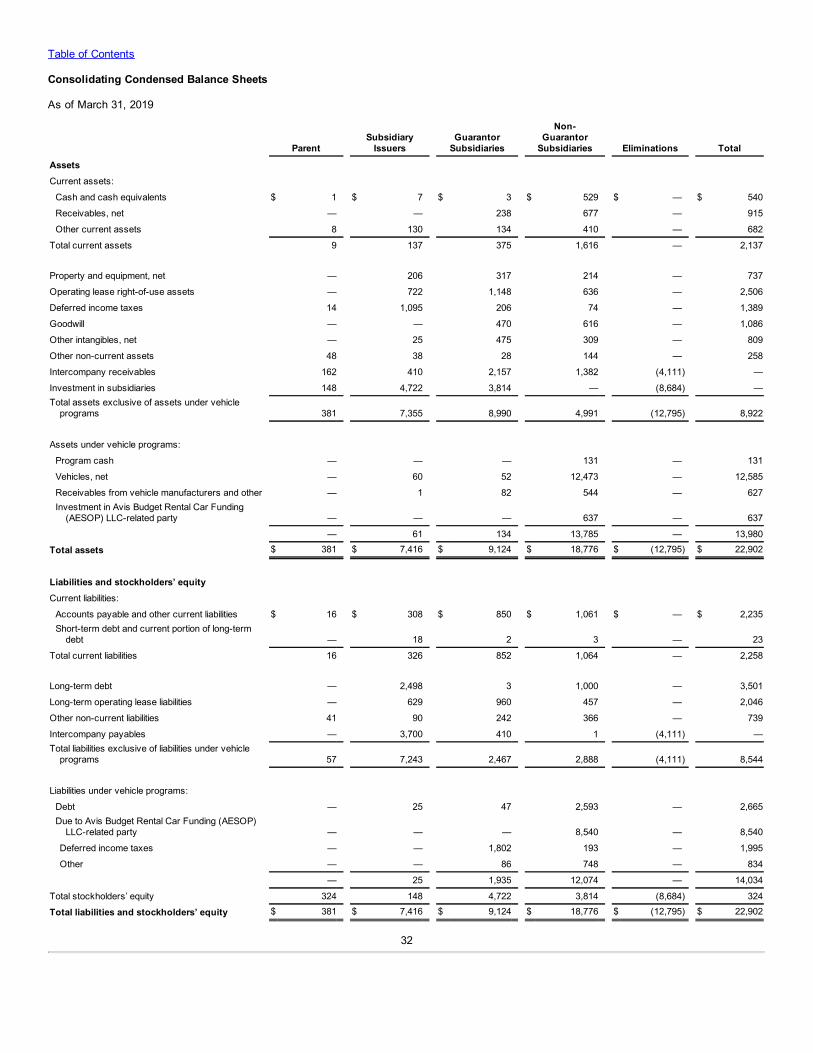
Table of Contents
Consolidating Condensed Balance Sheets
As of March 31, 2019
Parent Subsidiary
Issuers Guarantor
Subsidiaries
Non-Guarantor
Subsidiaries Eliminations Total
Assets Current assets: Cash and cash equivalents $ 1 $ 7 $ 3 $ 529 $ — $ 540
Receivables, net — — 238 677 — 915
Other current assets 8 130 134 410 — 682
Total current assets 9 137 375 1,616 — 2,137
Property and equipment, net — 206 317 214 — 737
Operating lease right-of-use assets — 722 1,148 636 — 2,506
Deferred income taxes 14 1,095 206 74 — 1,389
Goodwill — — 470 616 — 1,086
Other intangibles, net — 25 475 309 — 809
Other non-current assets 48 38 28 144 — 258
Intercompany receivables 162 410 2,157 1,382 (4,111) —
Investment in subsidiaries 148 4,722 3,814 — (8,684) —Total assets exclusive of assets under vehicle
programs 381 7,355 8,990 4,991 (12,795) 8,922
Assets under vehicle programs: Program cash — — — 131 — 131
Vehicles, net — 60 52 12,473 — 12,585
Receivables from vehicle manufacturers and other — 1 82 544 — 627
Investment in Avis Budget Rental Car Funding
(AESOP) LLC-related party — — — 637 — 637
— 61 134 13,785 — 13,980
Total assets $ 381 $ 7,416 $ 9,124 $ 18,776 $ (12,795) $ 22,902
Liabilities and stockholders’ equity Current liabilities: Accounts payable and other current liabilities $ 16 $ 308 $ 850 $ 1,061 $ — $ 2,235
Short-term debt and current portion of long-term
debt — 18 2 3 — 23
Total current liabilities 16 326 852 1,064 — 2,258
Long-term debt — 2,498 3 1,000 — 3,501
Long-term operating lease liabilities — 629 960 457 — 2,046
Other non-current liabilities 41 90 242 366 — 739
Intercompany payables — 3,700 410 1 (4,111) —Total liabilities exclusive of liabilities under vehicle
programs 57 7,243 2,467 2,888 (4,111) 8,544
Liabilities under vehicle programs: Debt — 25 47 2,593 — 2,665
Due to Avis Budget Rental Car Funding (AESOP)
LLC-related party — — — 8,540 — 8,540
Deferred income taxes — — 1,802 193 — 1,995
Other — — 86 748 — 834
— 25 1,935 12,074 — 14,034
Total stockholders’ equity 324 148 4,722 3,814 (8,684) 324
Total liabilities and stockholders’ equity $ 381 $ 7,416 $ 9,124 $ 18,776 $ (12,795) $ 22,902
32
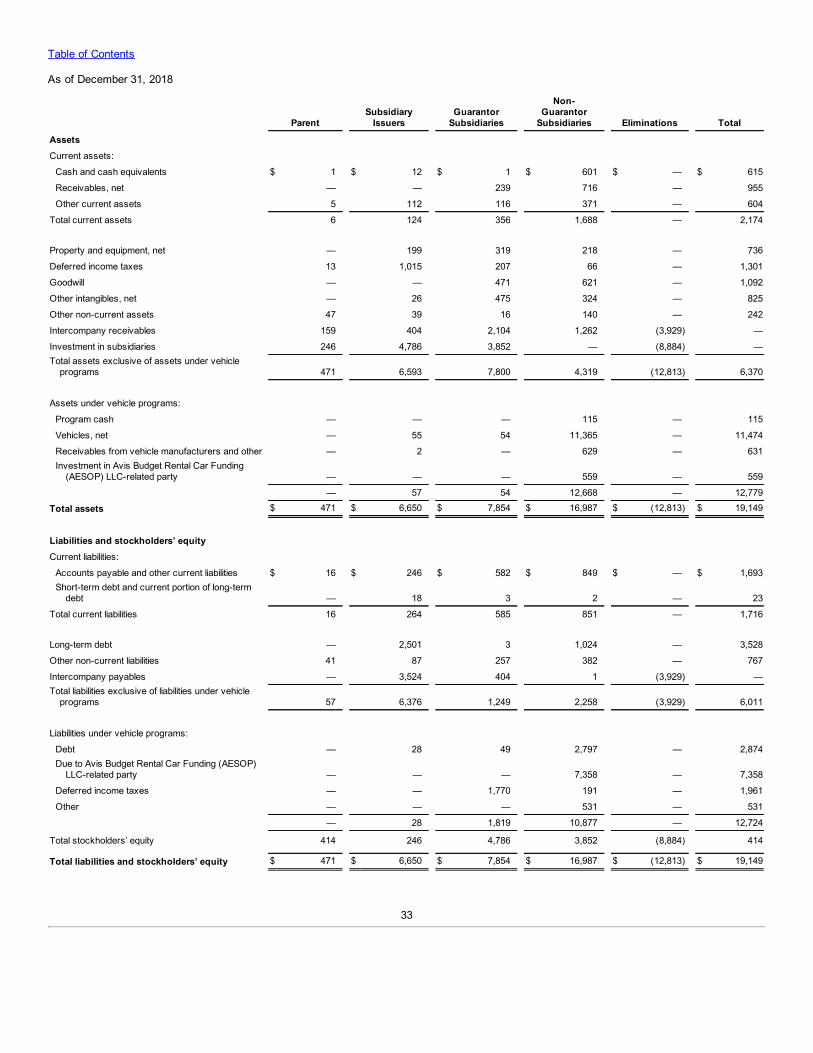
Table of Contents
As of December 31, 2018
Parent Subsidiary
Issuers Guarantor
Subsidiaries
Non-Guarantor
Subsidiaries Eliminations Total
Assets Current assets: Cash and cash equivalents $ 1 $ 12 $ 1 $ 601 $ — $ 615
Receivables, net — — 239 716 — 955
Other current assets 5 112 116 371 — 604
Total current assets 6 124 356 1,688 — 2,174
Property and equipment, net — 199 319 218 — 736
Deferred income taxes 13 1,015 207 66 — 1,301
Goodwill — — 471 621 — 1,092
Other intangibles, net — 26 475 324 — 825
Other non-current assets 47 39 16 140 — 242
Intercompany receivables 159 404 2,104 1,262 (3,929) —
Investment in subsidiaries 246 4,786 3,852 — (8,884) —Total assets exclusive of assets under vehicle
programs 471 6,593 7,800 4,319 (12,813) 6,370
Assets under vehicle programs: Program cash — — — 115 — 115
Vehicles, net — 55 54 11,365 — 11,474
Receivables from vehicle manufacturers and other — 2 — 629 — 631
Investment in Avis Budget Rental Car Funding
(AESOP) LLC-related party — — — 559 — 559
— 57 54 12,668 — 12,779
Total assets $ 471 $ 6,650 $ 7,854 $ 16,987 $ (12,813) $ 19,149
Liabilities and stockholders’ equity Current liabilities: Accounts payable and other current liabilities $ 16 $ 246 $ 582 $ 849 $ — $ 1,693
Short-term debt and current portion of long-term
debt — 18 3 2 — 23
Total current liabilities 16 264 585 851 — 1,716
Long-term debt — 2,501 3 1,024 — 3,528
Other non-current liabilities 41 87 257 382 — 767
Intercompany payables — 3,524 404 1 (3,929) —Total liabilities exclusive of liabilities under vehicle
programs 57 6,376 1,249 2,258 (3,929) 6,011
Liabilities under vehicle programs: Debt — 28 49 2,797 — 2,874
Due to Avis Budget Rental Car Funding (AESOP)
LLC-related party — — — 7,358 — 7,358
Deferred income taxes — — 1,770 191 — 1,961
Other — — — 531 — 531
— 28 1,819 10,877 — 12,724
Total stockholders’ equity 414 246 4,786 3,852 (8,884) 414
Total liabilities and stockholders’ equity $ 471 $ 6,650 $ 7,854 $ 16,987 $ (12,813) $ 19,149
33
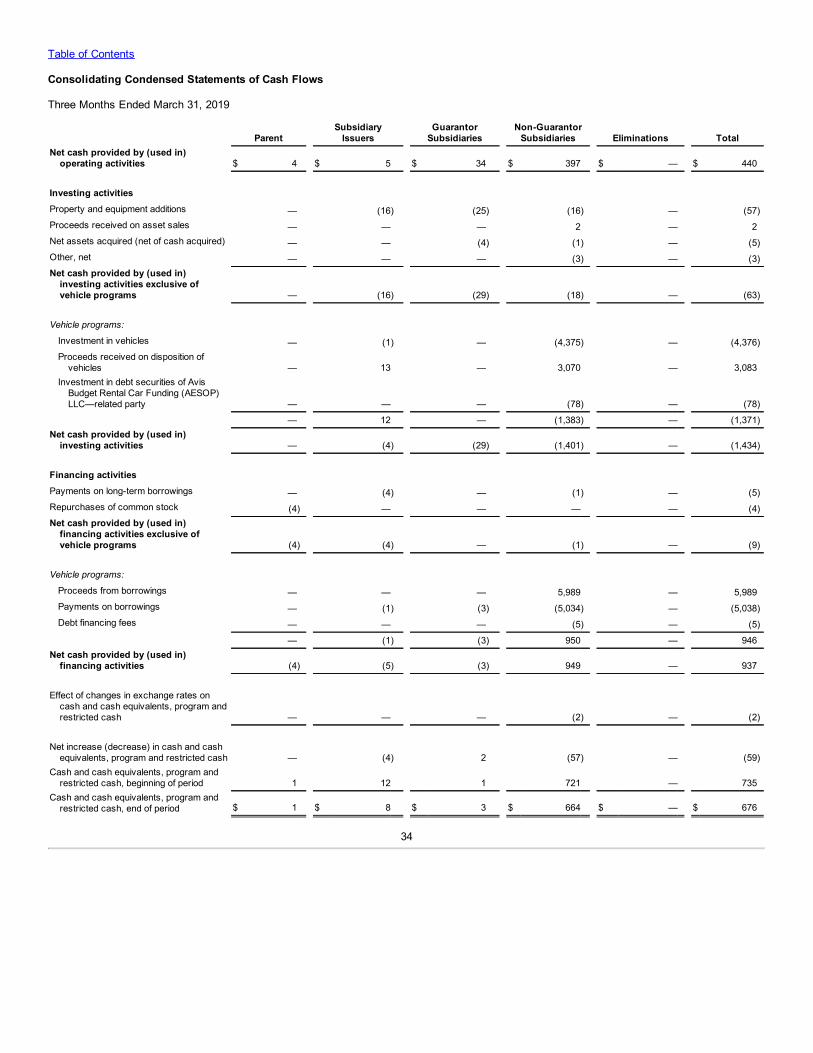
Table of Contents
Consolidating Condensed Statements of Cash Flows
Three Months Ended March 31, 2019
Parent Subsidiary
Issuers Guarantor
Subsidiaries Non-Guarantor
Subsidiaries Eliminations TotalNet cash provided by (used in)
operating activities $ 4 $ 5 $ 34 $ 397 $ — $ 440
Investing activities Property and equipment additions — (16) (25) (16) — (57)Proceeds received on asset sales — — — 2 — 2Net assets acquired (net of cash acquired) — — (4) (1) — (5)Other, net — — — (3) — (3)Net cash provided by (used in)
investing activities exclusive ofvehicle programs — (16) (29) (18) — (63)
Vehicle programs:
Investment in vehicles — (1) — (4,375) — (4,376)Proceeds received on disposition of
vehicles — 13 — 3,070 — 3,083Investment in debt securities of Avis
Budget Rental Car Funding (AESOP)LLC—related party — — — (78) — (78)
— 12 — (1,383) — (1,371)Net cash provided by (used in)
investing activities — (4) (29) (1,401) — (1,434)
Financing activities Payments on long-term borrowings — (4) — (1) — (5)Repurchases of common stock (4) — — — — (4)Net cash provided by (used in)
financing activities exclusive ofvehicle programs (4) (4) — (1) — (9)
Vehicle programs:
Proceeds from borrowings — — — 5,989 — 5,989Payments on borrowings — (1) (3) (5,034) — (5,038)Debt financing fees — — — (5) — (5)
— (1) (3) 950 — 946Net cash provided by (used in)
financing activities (4) (5) (3) 949 — 937
Effect of changes in exchange rates on
cash and cash equivalents, program andrestricted cash — — — (2) — (2)
Net increase (decrease) in cash and cash
equivalents, program and restricted cash — (4) 2 (57) — (59)Cash and cash equivalents, program and
restricted cash, beginning of period 1 12 1 721 — 735Cash and cash equivalents, program and
restricted cash, end of period $ 1 $ 8 $ 3 $ 664 $ — $ 676
34
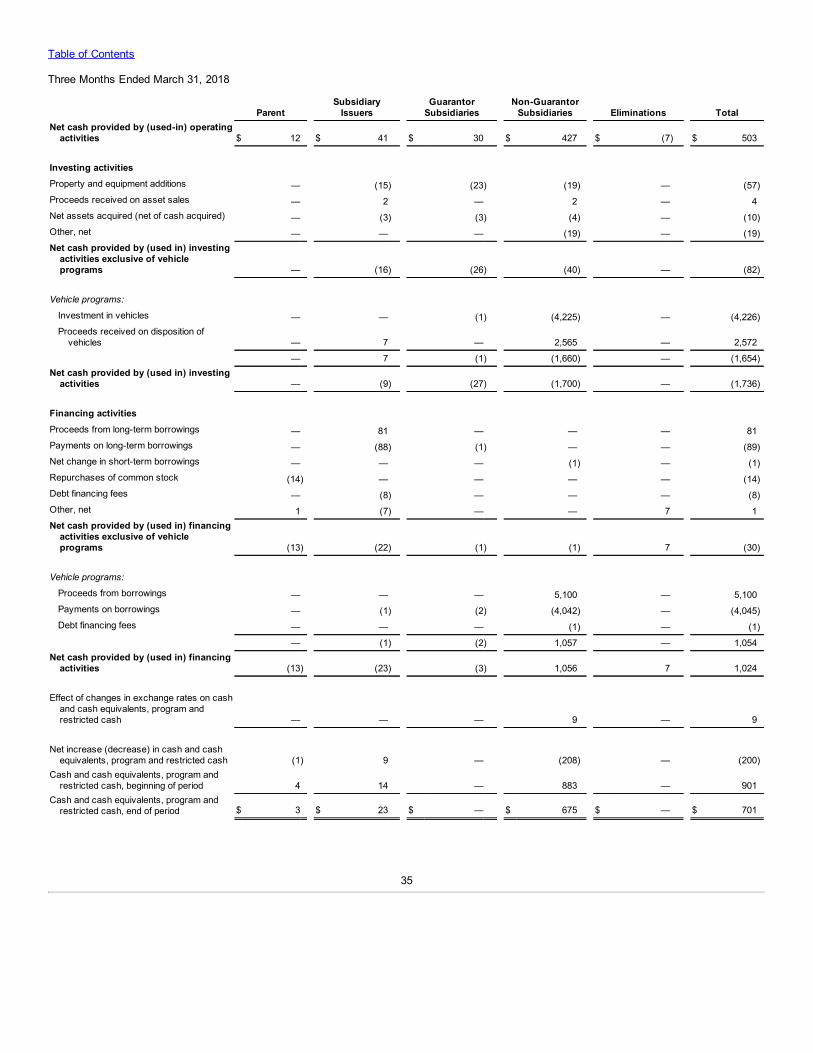
Table of Contents
Three Months Ended March 31, 2018
Parent Subsidiary
Issuers Guarantor
Subsidiaries Non-Guarantor
Subsidiaries Eliminations TotalNet cash provided by (used-in) operating
activities $ 12 $ 41 $ 30 $ 427 $ (7) $ 503
Investing activities Property and equipment additions — (15) (23) (19) — (57)Proceeds received on asset sales — 2 — 2 — 4Net assets acquired (net of cash acquired) — (3) (3) (4) — (10)Other, net — — — (19) — (19)Net cash provided by (used in) investing
activities exclusive of vehicleprograms — (16) (26) (40) — (82)
Vehicle programs:
Investment in vehicles — — (1) (4,225) — (4,226)Proceeds received on disposition of
vehicles — 7 — 2,565 — 2,572
— 7 (1) (1,660) — (1,654)Net cash provided by (used in) investing
activities — (9) (27) (1,700) — (1,736)
Financing activities Proceeds from long-term borrowings — 81 — — — 81Payments on long-term borrowings — (88) (1) — — (89)Net change in short-term borrowings — — — (1) — (1)Repurchases of common stock (14) — — — — (14)Debt financing fees — (8) — — — (8)Other, net 1 (7) — — 7 1Net cash provided by (used in) financing
activities exclusive of vehicleprograms (13) (22) (1) (1) 7 (30)
Vehicle programs:
Proceeds from borrowings — — — 5,100 — 5,100Payments on borrowings — (1) (2) (4,042) — (4,045)Debt financing fees — — — (1) — (1)
— (1) (2) 1,057 — 1,054Net cash provided by (used in) financing
activities (13) (23) (3) 1,056 7 1,024
Effect of changes in exchange rates on cash
and cash equivalents, program andrestricted cash — — — 9 — 9
Net increase (decrease) in cash and cash
equivalents, program and restricted cash (1) 9 — (208) — (200)Cash and cash equivalents, program and
restricted cash, beginning of period 4 14 — 883 — 901Cash and cash equivalents, program and
restricted cash, end of period $ 3 $ 23 $ — $ 675 $ — $ 701
35

Table of Contents
18. Subsequent Events
In April 2019, the Company’s Avis Budget Rental Car Funding subsidiary issued approximately $650 million in asset-backed notes with anexpected final payment date of September 2024 incurring interest at a weighted average rate of 3.44%.
In April 2019, the Company completed the sale of its 50% investment in Anji to Shanghai Automotive Industry Sales Company, Ltd. for $64million, net of cross-border withholding taxes.
* * * *
36
Table of Contents
Item 2. Management’s Discussion and Analysis of Financial Condition and Results of Operations
The following discussion should be read in conjunction with our Consolidated Condensed Financial Statements and accompanying Notes includedin this Quarterly Report on Form 10-Q, and with our 2018 Form 10-K. Our actual results of operations may differ materially from those discussed inforward-looking statements as a result of various factors, including but not limited to those included in this Quarterly Report on Form 10-Q andthose included in the “Management’s Discussion and Analysis of Financial Condition and Results of Operations,” “Risk Factors” and other portionsof our 2018 Form 10-K. Unless otherwise noted, all dollar amounts in tables are in millions.
OVERVIEW
Our Company
We operate three of the most globally recognized brands in mobility solutions, Avis, Budget and Zipcar, together with several other regional brandswell recognized in their respective markets. We are a leading vehicle rental operator in North America, Europe and Australasia with an averagerental fleet of nearly 650,000 vehicles. We also license the use of our trademarks to licensees in the areas in which we do not operate directly. Weand our licensees operate our brands in approximately 180 countries throughout the world.
Our Segments
We categorize our operations into two reportable business segments: Americas, consisting primarily of our vehicle rental operations in NorthAmerica, South America, Central America and the Caribbean, car sharing operations in certain of these markets, and licensees in the areas inwhich we do not operate directly; and International, consisting primarily of our vehicle rental operations in Europe, the Middle East, Africa, Asiaand Australasia, car sharing operations in certain of these markets, and licensees in the areas in which we do not operate directly.
Business and Trends
Our revenues are derived principally from vehicle rental operations and include:
• time & mileage fees charged to our customers for vehicle rentals;
• sales of loss damage waivers and insurance and other supplemental items in conjunction with vehicle rentals; and
• payments from our customers with respect to certain operating expenses we incur, including gasoline, vehicle licensing fees andconcession fees, which provide the right to operate at airports and other locations.
In addition, we receive revenue for royalties and associated fees from our licensees in conjunction with their vehicle rental transactions.
Our operating results are subject to variability due to seasonality, macroeconomic conditions and other factors. Car rental volumes tend to beassociated with the travel industry, particularly airline passenger volumes, or enplanements, which in turn tend to reflect general economicconditions. Our operations are also seasonal, with the third quarter of the year historically having been our strongest due to the increased level ofleisure travel during such quarter. We have a partially variable cost structure and routinely adjust the size, and therefore the cost, of our rental fleetin response to fluctuations in demand.
Thus far in 2019, worldwide demand for mobility solutions has increased, and used-vehicle values in the U.S. have stabilized, counterbalanced bythe incremental impact of rising interest rates, higher salaries, wages and related benefits. We expect such economic conditions to continuethroughout 2019.
We pursue opportunities to enhance profitability and increase return on invested capital. Our strategies are intended to support and strengthen ourbrands, to grow our margins and earnings over time and to achieve growth and efficiency opportunities as mobility solutions continue to evolve.
37
Table of Contents
We operate in a highly competitive industry and we expect to continue to face challenges and risks in managing our business. We seek to mitigateour exposure to risks in numerous ways, including delivering upon our core strategic initiatives and through continued optimization of fleet levels tomatch changes in demand for vehicle rentals, maintenance of liquidity to fund our fleet investment and operations, appropriate investments intechnology, and adjustments in the size and the nature and terms of our relationships with vehicle manufacturers.
RESULTS OF OPERATIONS
We measure performance principally using the following key metrics: (i) rental days, which represent the total number of days (or portion thereof) avehicle was rented, (ii) revenue per day, which represents revenues divided by rental days, (iii) vehicle utilization, which represents rental daysdivided by available rental days, available rental days is defined as average rental fleet times the number of days in the period, and (iv) per-unitfleet costs, which represent vehicle depreciation, lease charges and gain or loss on vehicle sales, divided by average rental fleet. Our rental days,revenue per day and vehicle utilization metrics are all calculated based on the actual rental of the vehicle during a 24-hour period. We believe thatthis methodology provides us with the most relevant metrics in order to manage the business. Our calculation may not be comparable to thecalculation of similarly-titled metrics by other companies. We present currency exchange rate effects to provide a method of assessing how ourbusiness performed excluding the effects of foreign currency rate fluctuations. Currency exchange rate effects are calculated by translating thecurrent-year results at the prior-period average exchange rate plus any related gains and losses on currency hedges.
We assess performance and allocate resources based upon the separate financial information of our operating segments. In identifying ourreportable segments, we also consider the nature of services provided by our operating segments, the geographical areas in which our segmentsoperate and other relevant factors. Management evaluates the operating results of each of our reportable segments based upon revenues and“Adjusted EBITDA,” which we define as income from continuing operations before non-vehicle related depreciation and amortization, anyimpairment charges, restructuring and other related charges, early extinguishment of debt costs, non-vehicle related interest, transaction-relatedcosts, net charges for unprecedented personal-injury legal matters, non-operational charges related to shareholder activist activity and incometaxes. Net charges for unprecedented personal-injury legal matters are recorded within operating expenses in our consolidated condensedstatement of operations. Non-operational charges related to shareholder activist activity include third party advisory, legal and other professionalservice fees and are recorded within selling, general and administrative expenses in our consolidated results of operations. We believe AdjustedEBITDA is useful as a supplemental measure in evaluating the performance of our operating businesses and in comparing our results from periodto period. We also believe that Adjusted EBITDA is useful to investors because it allows them to assess our results of operations and financialcondition on the same basis that management uses internally. Adjusted EBITDA is a non-GAAP measure and should not be considered inisolation or as a substitute for net income or other income statement data prepared in accordance with U.S. GAAP. Our presentation of AdjustedEBITDA may not be comparable to similarly-titled measures used by other companies.
During the three months ended March 31, 2019:
• Our revenues totaled $1.9 billion and decreased 2% compared to the similar period in 2018 primarily due to a 3% negative impact fromcurrency exchange rate movements.
• Our net loss was $91 million and our Adjusted EBITDA was a loss of $1 million, representing a $3 million year-over-year decrease, drivenby lower revenues.
38
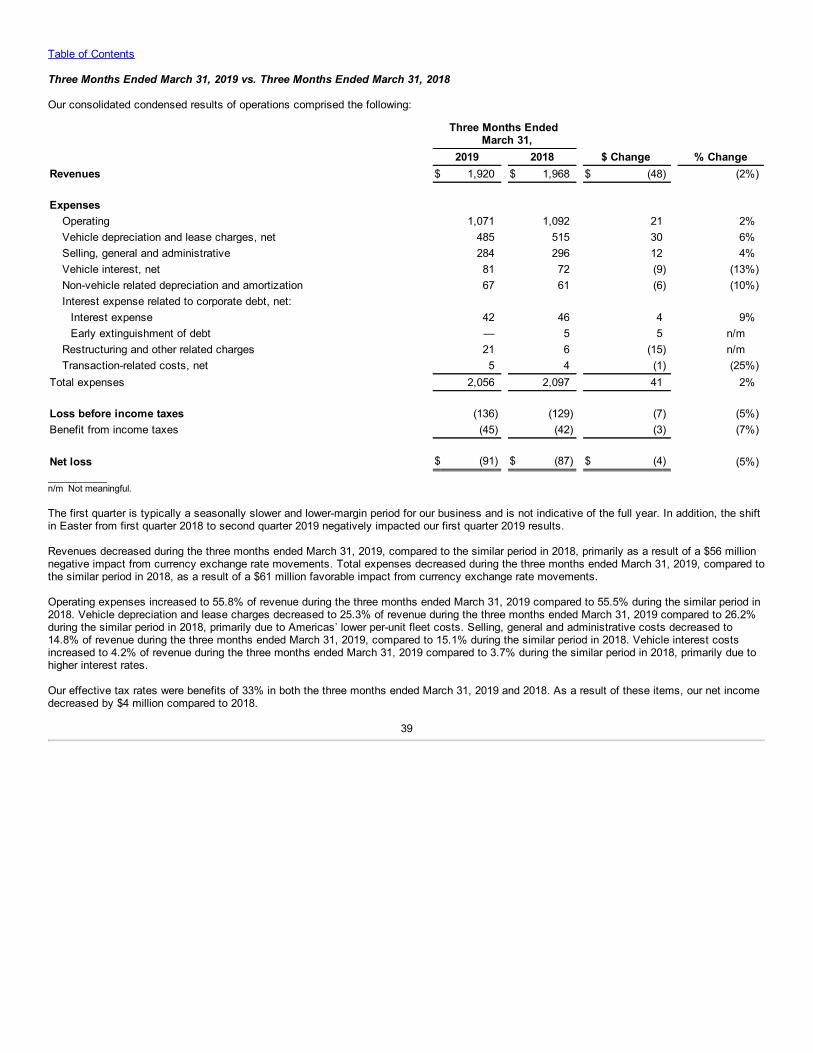
Table of Contents
Three Months Ended March 31, 2019 vs. Three Months Ended March 31, 2018
Our consolidated condensed results of operations comprised the following:
Three Months Ended
March 31, 2019 2018 $ Change % ChangeRevenues $ 1,920 $ 1,968 $ (48) (2%) Expenses Operating 1,071 1,092 21 2% Vehicle depreciation and lease charges, net 485 515 30 6% Selling, general and administrative 284 296 12 4% Vehicle interest, net 81 72 (9) (13%) Non-vehicle related depreciation and amortization 67 61 (6) (10%) Interest expense related to corporate debt, net: Interest expense 42 46 4 9% Early extinguishment of debt — 5 5 n/m Restructuring and other related charges 21 6 (15) n/m Transaction-related costs, net 5 4 (1) (25%)Total expenses 2,056 2,097 41 2% Loss before income taxes (136) (129) (7) (5%)Benefit from income taxes (45) (42) (3) (7%) Net loss $ (91) $ (87) $ (4) (5%)__________n/m Not meaningful.
The first quarter is typically a seasonally slower and lower-margin period for our business and is not indicative of the full year. In addition, the shiftin Easter from first quarter 2018 to second quarter 2019 negatively impacted our first quarter 2019 results.
Revenues decreased during the three months ended March 31, 2019, compared to the similar period in 2018, primarily as a result of a $56 millionnegative impact from currency exchange rate movements. Total expenses decreased during the three months ended March 31, 2019, compared tothe similar period in 2018, as a result of a $61 million favorable impact from currency exchange rate movements.
Operating expenses increased to 55.8% of revenue during the three months ended March 31, 2019 compared to 55.5% during the similar period in2018. Vehicle depreciation and lease charges decreased to 25.3% of revenue during the three months ended March 31, 2019 compared to 26.2%during the similar period in 2018, primarily due to Americas’ lower per-unit fleet costs. Selling, general and administrative costs decreased to14.8% of revenue during the three months ended March 31, 2019, compared to 15.1% during the similar period in 2018. Vehicle interest costsincreased to 4.2% of revenue during the three months ended March 31, 2019 compared to 3.7% during the similar period in 2018, primarily due tohigher interest rates.
Our effective tax rates were benefits of 33% in both the three months ended March 31, 2019 and 2018. As a result of these items, our net incomedecreased by $4 million compared to 2018.
39
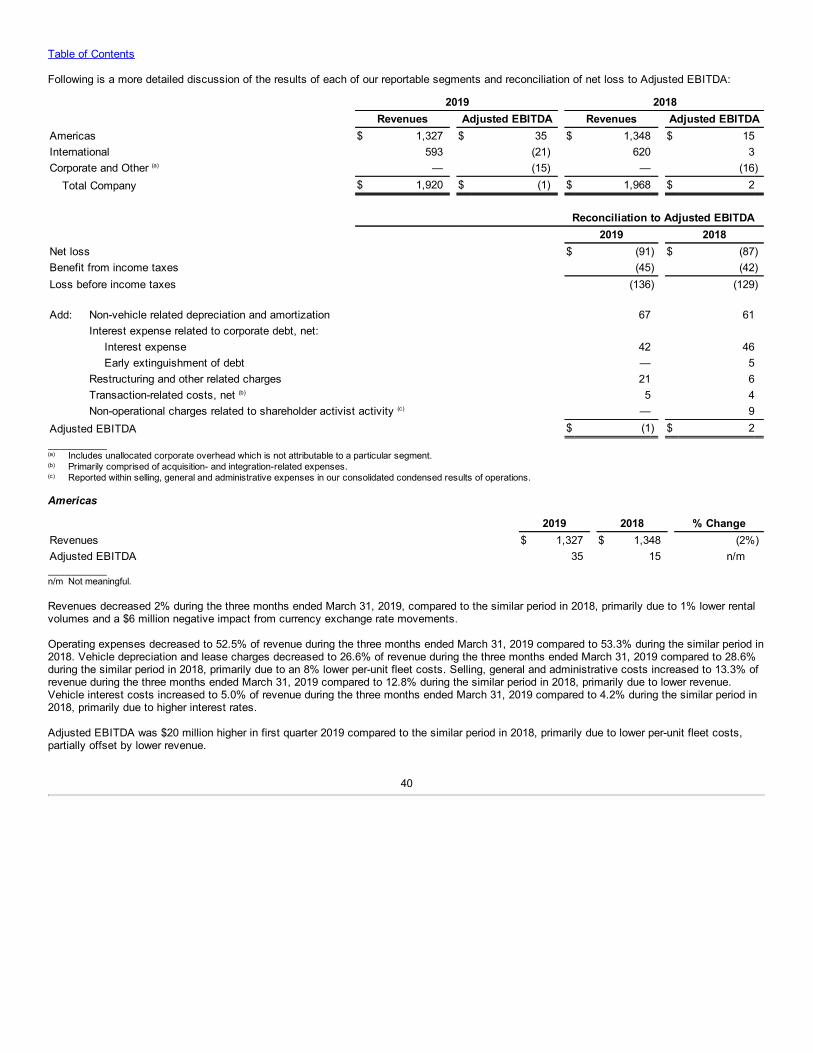
Table of Contents
Following is a more detailed discussion of the results of each of our reportable segments and reconciliation of net loss to Adjusted EBITDA:
2019 2018 Revenues Adjusted EBITDA Revenues Adjusted EBITDAAmericas $ 1,327 $ 35 $ 1,348 $ 15International 593 (21) 620 3Corporate and Other (a) — (15) — (16) Total Company $ 1,920 $ (1) $ 1,968 $ 2
Reconciliation to Adjusted EBITDA 2019 2018Net loss $ (91) $ (87)Benefit from income taxes (45) (42)Loss before income taxes (136) (129) Add: Non-vehicle related depreciation and amortization 67 61 Interest expense related to corporate debt, net: Interest expense 42 46 Early extinguishment of debt — 5 Restructuring and other related charges 21 6 Transaction-related costs, net (b) 5 4 Non-operational charges related to shareholder activist activity (c) — 9Adjusted EBITDA $ (1) $ 2__________(a) Includes unallocated corporate overhead which is not attributable to a particular segment.(b) Primarily comprised of acquisition- and integration-related expenses.(c) Reported within selling, general and administrative expenses in our consolidated condensed results of operations.
Americas
2019 2018 % ChangeRevenues $ 1,327 $ 1,348 (2%)Adjusted EBITDA 35 15 n/m__________n/m Not meaningful.
Revenues decreased 2% during the three months ended March 31, 2019, compared to the similar period in 2018, primarily due to 1% lower rentalvolumes and a $6 million negative impact from currency exchange rate movements.
Operating expenses decreased to 52.5% of revenue during the three months ended March 31, 2019 compared to 53.3% during the similar period in2018. Vehicle depreciation and lease charges decreased to 26.6% of revenue during the three months ended March 31, 2019 compared to 28.6%during the similar period in 2018, primarily due to an 8% lower per-unit fleet costs. Selling, general and administrative costs increased to 13.3% ofrevenue during the three months ended March 31, 2019 compared to 12.8% during the similar period in 2018, primarily due to lower revenue.Vehicle interest costs increased to 5.0% of revenue during the three months ended March 31, 2019 compared to 4.2% during the similar period in2018, primarily due to higher interest rates.
Adjusted EBITDA was $20 million higher in first quarter 2019 compared to the similar period in 2018, primarily due to lower per-unit fleet costs,partially offset by lower revenue.
40
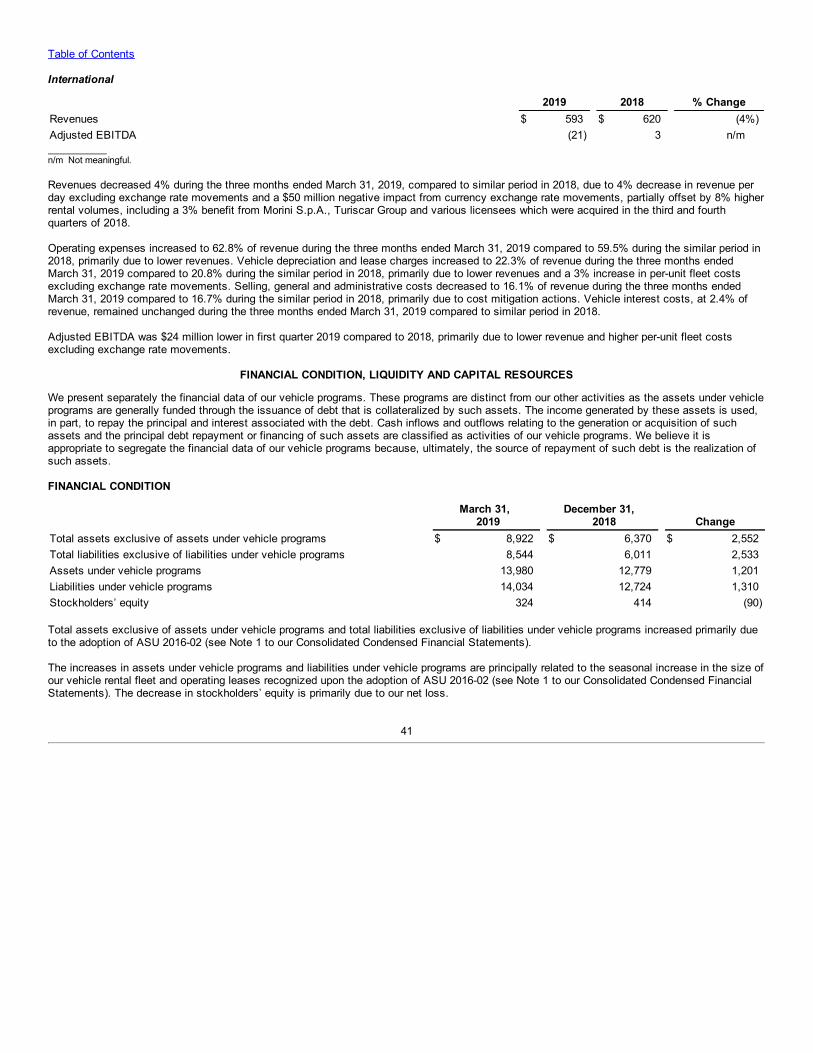
Table of Contents
International
2019 2018 % ChangeRevenues $ 593 $ 620 (4%)Adjusted EBITDA (21) 3 n/m__________n/m Not meaningful.
Revenues decreased 4% during the three months ended March 31, 2019, compared to similar period in 2018, due to 4% decrease in revenue perday excluding exchange rate movements and a $50 million negative impact from currency exchange rate movements, partially offset by 8% higherrental volumes, including a 3% benefit from Morini S.p.A., Turiscar Group and various licensees which were acquired in the third and fourthquarters of 2018.
Operating expenses increased to 62.8% of revenue during the three months ended March 31, 2019 compared to 59.5% during the similar period in2018, primarily due to lower revenues. Vehicle depreciation and lease charges increased to 22.3% of revenue during the three months endedMarch 31, 2019 compared to 20.8% during the similar period in 2018, primarily due to lower revenues and a 3% increase in per-unit fleet costsexcluding exchange rate movements. Selling, general and administrative costs decreased to 16.1% of revenue during the three months endedMarch 31, 2019 compared to 16.7% during the similar period in 2018, primarily due to cost mitigation actions. Vehicle interest costs, at 2.4% ofrevenue, remained unchanged during the three months ended March 31, 2019 compared to similar period in 2018.
Adjusted EBITDA was $24 million lower in first quarter 2019 compared to 2018, primarily due to lower revenue and higher per-unit fleet costsexcluding exchange rate movements.
FINANCIAL CONDITION, LIQUIDITY AND CAPITAL RESOURCES
We present separately the financial data of our vehicle programs. These programs are distinct from our other activities as the assets under vehicleprograms are generally funded through the issuance of debt that is collateralized by such assets. The income generated by these assets is used,in part, to repay the principal and interest associated with the debt. Cash inflows and outflows relating to the generation or acquisition of suchassets and the principal debt repayment or financing of such assets are classified as activities of our vehicle programs. We believe it isappropriate to segregate the financial data of our vehicle programs because, ultimately, the source of repayment of such debt is the realization ofsuch assets.
FINANCIAL CONDITION
March 31,
2019 December 31,
2018 ChangeTotal assets exclusive of assets under vehicle programs $ 8,922 $ 6,370 $ 2,552Total liabilities exclusive of liabilities under vehicle programs 8,544 6,011 2,533Assets under vehicle programs 13,980 12,779 1,201Liabilities under vehicle programs 14,034 12,724 1,310Stockholders’ equity 324 414 (90)
Total assets exclusive of assets under vehicle programs and total liabilities exclusive of liabilities under vehicle programs increased primarily dueto the adoption of ASU 2016-02 (see Note 1 to our Consolidated Condensed Financial Statements).
The increases in assets under vehicle programs and liabilities under vehicle programs are principally related to the seasonal increase in the size ofour vehicle rental fleet and operating leases recognized upon the adoption of ASU 2016-02 (see Note 1 to our Consolidated Condensed FinancialStatements). The decrease in stockholders’ equity is primarily due to our net loss.
41
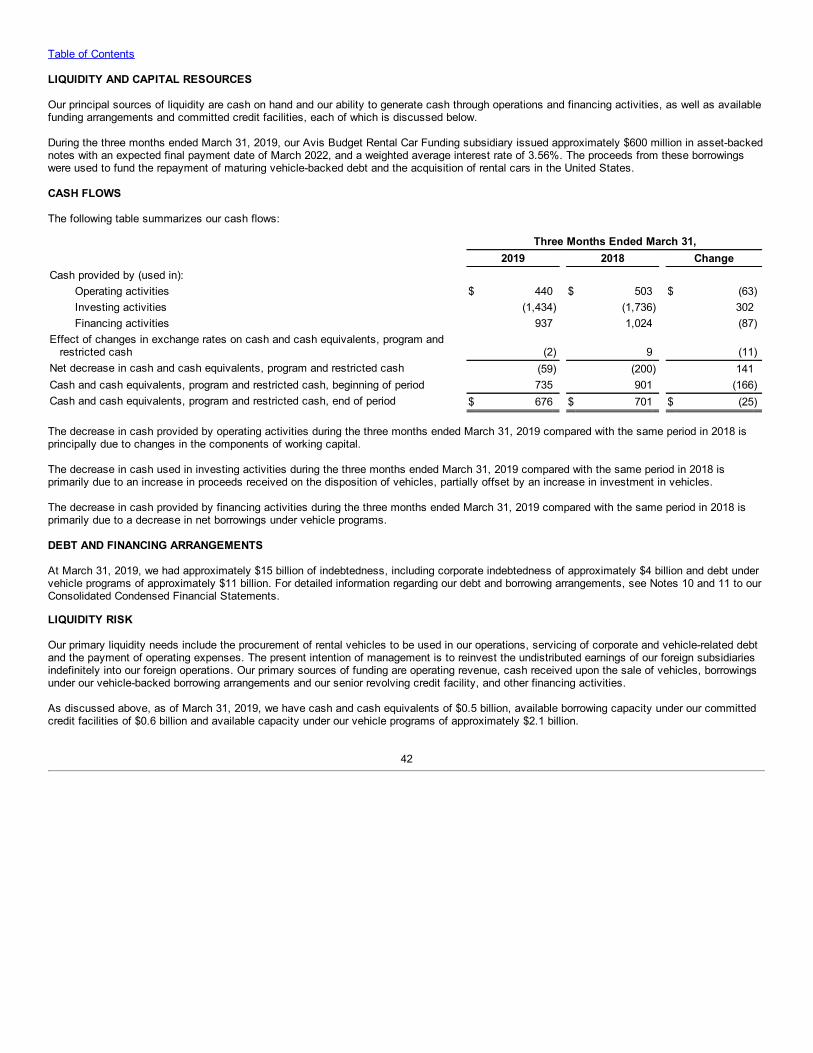
Table of Contents
LIQUIDITY AND CAPITAL RESOURCES
Our principal sources of liquidity are cash on hand and our ability to generate cash through operations and financing activities, as well as availablefunding arrangements and committed credit facilities, each of which is discussed below.
During the three months ended March 31, 2019, our Avis Budget Rental Car Funding subsidiary issued approximately $600 million in asset-backednotes with an expected final payment date of March 2022, and a weighted average interest rate of 3.56%. The proceeds from these borrowingswere used to fund the repayment of maturing vehicle-backed debt and the acquisition of rental cars in the United States.
CASH FLOWS
The following table summarizes our cash flows:
Three Months Ended March 31, 2019 2018 ChangeCash provided by (used in):
Operating activities $ 440 $ 503 $ (63)Investing activities (1,434) (1,736) 302Financing activities 937 1,024 (87)
Effect of changes in exchange rates on cash and cash equivalents, program andrestricted cash (2) 9 (11)
Net decrease in cash and cash equivalents, program and restricted cash (59) (200) 141Cash and cash equivalents, program and restricted cash, beginning of period 735 901 (166)Cash and cash equivalents, program and restricted cash, end of period $ 676 $ 701 $ (25)
The decrease in cash provided by operating activities during the three months ended March 31, 2019 compared with the same period in 2018 isprincipally due to changes in the components of working capital.
The decrease in cash used in investing activities during the three months ended March 31, 2019 compared with the same period in 2018 isprimarily due to an increase in proceeds received on the disposition of vehicles, partially offset by an increase in investment in vehicles.
The decrease in cash provided by financing activities during the three months ended March 31, 2019 compared with the same period in 2018 isprimarily due to a decrease in net borrowings under vehicle programs.
DEBT AND FINANCING ARRANGEMENTS
At March 31, 2019, we had approximately $15 billion of indebtedness, including corporate indebtedness of approximately $4 billion and debt undervehicle programs of approximately $11 billion. For detailed information regarding our debt and borrowing arrangements, see Notes 10 and 11 to ourConsolidated Condensed Financial Statements.
LIQUIDITY RISK
Our primary liquidity needs include the procurement of rental vehicles to be used in our operations, servicing of corporate and vehicle-related debtand the payment of operating expenses. The present intention of management is to reinvest the undistributed earnings of our foreign subsidiariesindefinitely into our foreign operations. Our primary sources of funding are operating revenue, cash received upon the sale of vehicles, borrowingsunder our vehicle-backed borrowing arrangements and our senior revolving credit facility, and other financing activities.
As discussed above, as of March 31, 2019, we have cash and cash equivalents of $0.5 billion, available borrowing capacity under our committedcredit facilities of $0.6 billion and available capacity under our vehicle programs of approximately $2.1 billion.
42
Table of Contents
Our liquidity position could be negatively affected by financial market disruptions or a downturn in the U.S. and worldwide economies, which mayresult in unfavorable conditions in the mobility industry, in the asset-backed financing market and in the credit markets generally. We believe thesefactors have in the past affected and could in the future affect the debt ratings assigned to us by credit rating agencies and the cost of ourborrowings. Additionally, a downturn in the worldwide economy or a disruption in the credit markets could impact our liquidity due to (i) decreaseddemand and pricing for vehicles in the used-vehicle market, (ii) increased costs associated with, and/or reduced capacity or increased collateralneeds under, our financings, (iii) the adverse impact of vehicle manufacturers being unable or unwilling to honor their obligations to repurchase orguarantee the depreciation on the related program vehicles and (iv) disruption in our ability to obtain financing due to negative credit eventsspecific to us or affecting the overall debt market.
Our liquidity position could also be negatively impacted if we are unable to remain in compliance with the financial and other covenants associatedwith our senior revolving credit facility and other borrowings, including a maximum leverage ratio. As of March 31, 2019, we were in compliancewith the financial covenants governing our indebtedness. For additional information regarding our liquidity risks, see Part I, Item 1A, “Risk Factors”of our 2018 Form 10-K.
CONTRACTUAL OBLIGATIONS
Our future contractual obligations have not changed significantly from the amounts reported within our 2018 Form 10-K with the exception of ourcommitment to purchase vehicles, which decreased by approximately $2.7 billion from December 31, 2018, to approximately $6.0billion at March 31, 2019 due to seasonality. Changes to our obligations related to corporate indebtedness and debt under vehicle programs arepresented above within the section titled “Liquidity and Capital Resources—Debt and Financing Arrangements” and also within Notes 10 and 11 toour Consolidated Condensed Financial Statements.
ACCOUNTING POLICIES
The results of the majority of our recurring operations are recorded in our financial statements using accounting policies that are not particularlysubjective, nor complex. However, in presenting our financial statements in conformity with generally accepted accounting principles, we arerequired to make estimates and assumptions that affect the amounts reported therein. Several of the estimates and assumptions that we arerequired to make pertain to matters that are inherently uncertain as they relate to future events. Presented within the section titled “CriticalAccounting Policies” of our 2018 Form 10-K are the accounting policies (related to goodwill and other indefinite-lived intangible assets, vehicles,income taxes and public liability, property damage and other insurance liabilities) that we believe require subjective and/or complex judgments thatcould potentially affect 2019 reported results. There have been no significant changes to those accounting policies or our assessment of whichaccounting policies we would consider to be critical accounting policies.
New Accounting Standards
For detailed information regarding new accounting standards and their impact on our business, see Note 1 to our Consolidated CondensedFinancial Statements.
Item 3. Quantitative and Qualitative Disclosures about Market Risk
We are exposed to a variety of market risks, including changes in currency exchange rates, interest rates and gasoline prices. We assess ourmarket risks based on changes in interest and currency exchange rates utilizing a sensitivity analysis that measures the potential impact onearnings, fair values and cash flows based on a hypothetical 10% change (increase and decrease) in interest and foreign currency exchange rates.We used March 31, 2019 market rates to perform a sensitivity analysis separately for each of these market risk exposures. We have determined,through such analyses, that the impact of a 10% change in interest or currency exchange rates on our results of operations, balance sheet andcash flows would not be material. Additionally, we have commodity price exposure related to fluctuations in the price of unleaded gasoline. Weanticipate that such commodity risk will remain a market risk exposure for the foreseeable future. We determined that a 10% change in the price ofunleaded gasoline would not have a material impact on our earnings for the period ended March 31, 2019. For additional information regarding ourlong-term borrowings and financial instruments, see Notes 10, 11 and 15 to our Consolidated Condensed Financial Statements.
43

Table of Contents
Item 4. Controls and Procedures
(a) Disclosure Controls and Procedures. Under the supervision and with the participation of our Chief Executive Officer and Chief FinancialOfficer, our management conducted an evaluation of the effectiveness of our disclosure controls and procedures (as such term is defined inRules 13a-15(e) and 15d-15(e) under the Securities Exchange Act of 1934, as amended (the “Exchange Act”)). Based on such evaluation, ourChief Executive Officer and Chief Financial Officer have concluded that our disclosure controls and procedures were effective as of March 31,2019.
(b) Changes in Internal Control Over Financial Reporting. During the fiscal quarter to which this report relates, there has been no change in theCompany’s internal control over financial reporting (as such term is defined in Rules 13a-15(f) and 15d-15(f) under the Exchange Act) that hasmaterially affected, or is reasonably likely to materially affect, the Company’s internal control over financial reporting.
44
Table of Contents
PART II – OTHER INFORMATION
Item 1. Legal Proceedings
During the quarter ended March 31, 2019, the Company had no material developments to report with respect to its legal proceedings. For additionalinformation regarding the Company’s legal proceedings, see Note 12 to our Consolidated Condensed Financial Statements and refer to theCompany’s 2018 Form 10-K.
Item 1A. Risk Factors
During the quarter ended March 31, 2019, the Company had no material developments to report with respect to its risk factors. For additionalinformation regarding the Company’s risk factors, please refer to the Company’s 2018 Form 10-K.
Item 2. Unregistered Sales of Equity Securities and Use of Proceeds
The Company’s Board of Directors has authorized the repurchase of up to $1.7 billion of its common stock under a plan originally approved in 2013and subsequently expanded, most recently in August 2018. The Company’s stock repurchases may occur through open market purchases ortrading plans pursuant to Rule 10b5-1 of the Securities Exchange Act of 1934. The amount and timing of specific repurchases are subject tomarket conditions, applicable legal requirements and other factors. The repurchase program may be suspended, modified or discontinued at anytime without prior notice. The repurchase program has no set expiration or termination date. During the three months ended March 31, 2019, nocommon stock repurchases were made under the plan and 124,068 shares were withheld by the Company to satisfy employees’ income taxliabilities attributable to the vesting of restricted stock unit awards.
Item 6. Exhibits
See Exhibit Index.
45
Table of Contents
SIGNATURES
Pursuant to the requirements of the Securities Exchange Act of 1934, the registrant has duly caused this report to be signed on its behalf by theundersigned thereunto duly authorized.
AVIS BUDGET GROUP, INC.
Date: May 2, 2019 /s/ David T. Calabria David T. Calabria Senior Vice President and Chief Accounting Officer
46
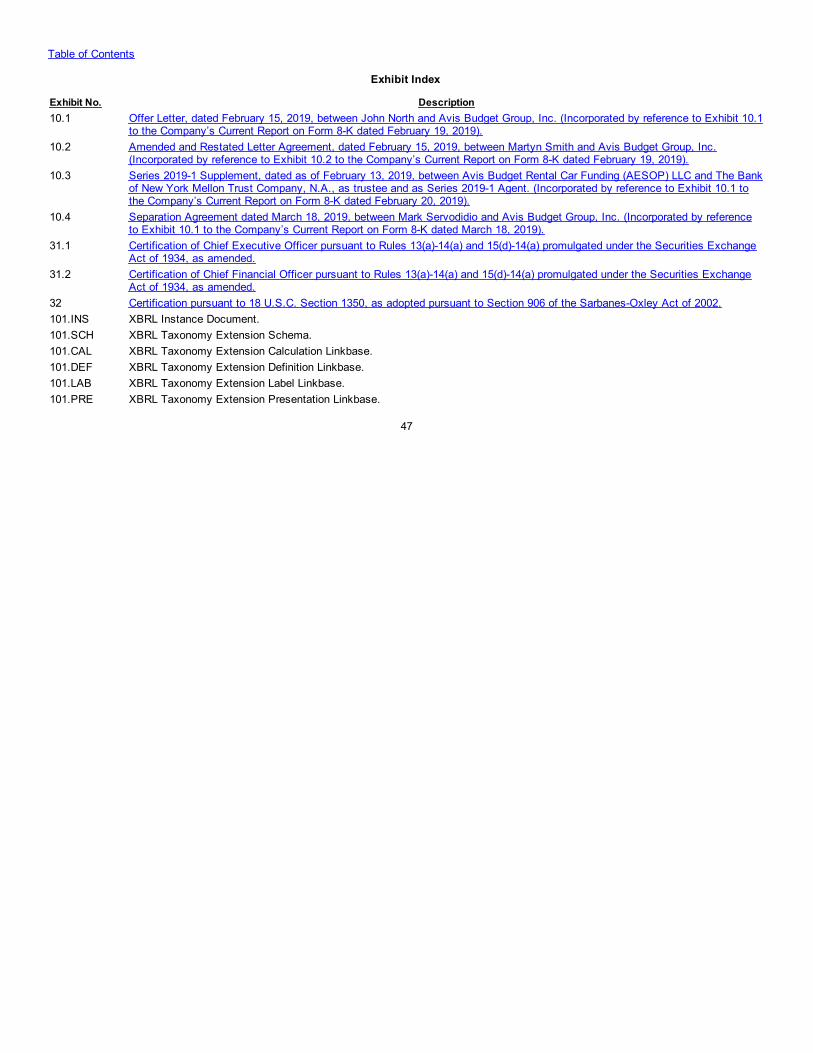
Table of Contents
Exhibit Index
Exhibit No. Description10.1 Offer Letter, dated February 15, 2019, between John North and Avis Budget Group, Inc. (Incorporated by reference to Exhibit 10.1
to the Company’s Current Report on Form 8-K dated February 19, 2019).10.2 Amended and Restated Letter Agreement, dated February 15, 2019, between Martyn Smith and Avis Budget Group, Inc.
(Incorporated by reference to Exhibit 10.2 to the Company’s Current Report on Form 8-K dated February 19, 2019).10.3 Series 2019-1 Supplement, dated as of February 13, 2019, between Avis Budget Rental Car Funding (AESOP) LLC and The Bank
of New York Mellon Trust Company, N.A., as trustee and as Series 2019-1 Agent. (Incorporated by reference to Exhibit 10.1 tothe Company’s Current Report on Form 8-K dated February 20, 2019).
10.4 Separation Agreement dated March 18, 2019, between Mark Servodidio and Avis Budget Group, Inc. (Incorporated by referenceto Exhibit 10.1 to the Company’s Current Report on Form 8-K dated March 18, 2019).
31.1 Certification of Chief Executive Officer pursuant to Rules 13(a)-14(a) and 15(d)-14(a) promulgated under the Securities ExchangeAct of 1934, as amended.
31.2 Certification of Chief Financial Officer pursuant to Rules 13(a)-14(a) and 15(d)-14(a) promulgated under the Securities ExchangeAct of 1934, as amended.
32 Certification pursuant to 18 U.S.C. Section 1350, as adopted pursuant to Section 906 of the Sarbanes-Oxley Act of 2002.101.INS XBRL Instance Document.101.SCH XBRL Taxonomy Extension Schema.101.CAL XBRL Taxonomy Extension Calculation Linkbase.101.DEF XBRL Taxonomy Extension Definition Linkbase.101.LAB XBRL Taxonomy Extension Label Linkbase.101.PRE XBRL Taxonomy Extension Presentation Linkbase.
47
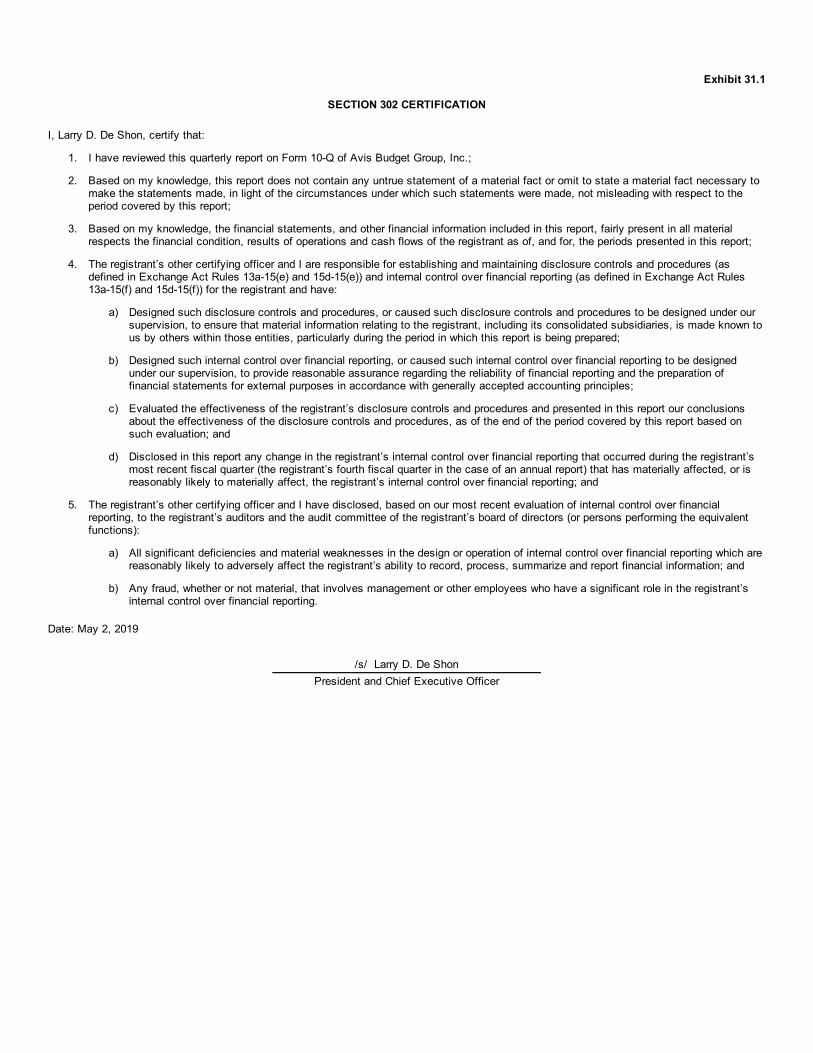
Exhibit 31.1
SECTION 302 CERTIFICATION
I, Larry D. De Shon, certify that:
1. I have reviewed this quarterly report on Form 10-Q of Avis Budget Group, Inc.;
2. Based on my knowledge, this report does not contain any untrue statement of a material fact or omit to state a material fact necessary tomake the statements made, in light of the circumstances under which such statements were made, not misleading with respect to theperiod covered by this report;
3. Based on my knowledge, the financial statements, and other financial information included in this report, fairly present in all materialrespects the financial condition, results of operations and cash flows of the registrant as of, and for, the periods presented in this report;
4. The registrant’s other certifying officer and I are responsible for establishing and maintaining disclosure controls and procedures (asdefined in Exchange Act Rules 13a-15(e) and 15d-15(e)) and internal control over financial reporting (as defined in Exchange Act Rules13a-15(f) and 15d-15(f)) for the registrant and have:
a) Designed such disclosure controls and procedures, or caused such disclosure controls and procedures to be designed under oursupervision, to ensure that material information relating to the registrant, including its consolidated subsidiaries, is made known tous by others within those entities, particularly during the period in which this report is being prepared;
b) Designed such internal control over financial reporting, or caused such internal control over financial reporting to be designedunder our supervision, to provide reasonable assurance regarding the reliability of financial reporting and the preparation offinancial statements for external purposes in accordance with generally accepted accounting principles;
c) Evaluated the effectiveness of the registrant’s disclosure controls and procedures and presented in this report our conclusionsabout the effectiveness of the disclosure controls and procedures, as of the end of the period covered by this report based onsuch evaluation; and
d) Disclosed in this report any change in the registrant’s internal control over financial reporting that occurred during the registrant’smost recent fiscal quarter (the registrant’s fourth fiscal quarter in the case of an annual report) that has materially affected, or isreasonably likely to materially affect, the registrant’s internal control over financial reporting; and
5. The registrant’s other certifying officer and I have disclosed, based on our most recent evaluation of internal control over financialreporting, to the registrant’s auditors and the audit committee of the registrant’s board of directors (or persons performing the equivalentfunctions):
a) All significant deficiencies and material weaknesses in the design or operation of internal control over financial reporting which arereasonably likely to adversely affect the registrant’s ability to record, process, summarize and report financial information; and
b) Any fraud, whether or not material, that involves management or other employees who have a significant role in the registrant’sinternal control over financial reporting.
Date: May 2, 2019
/s/ Larry D. De ShonPresident and Chief Executive Officer
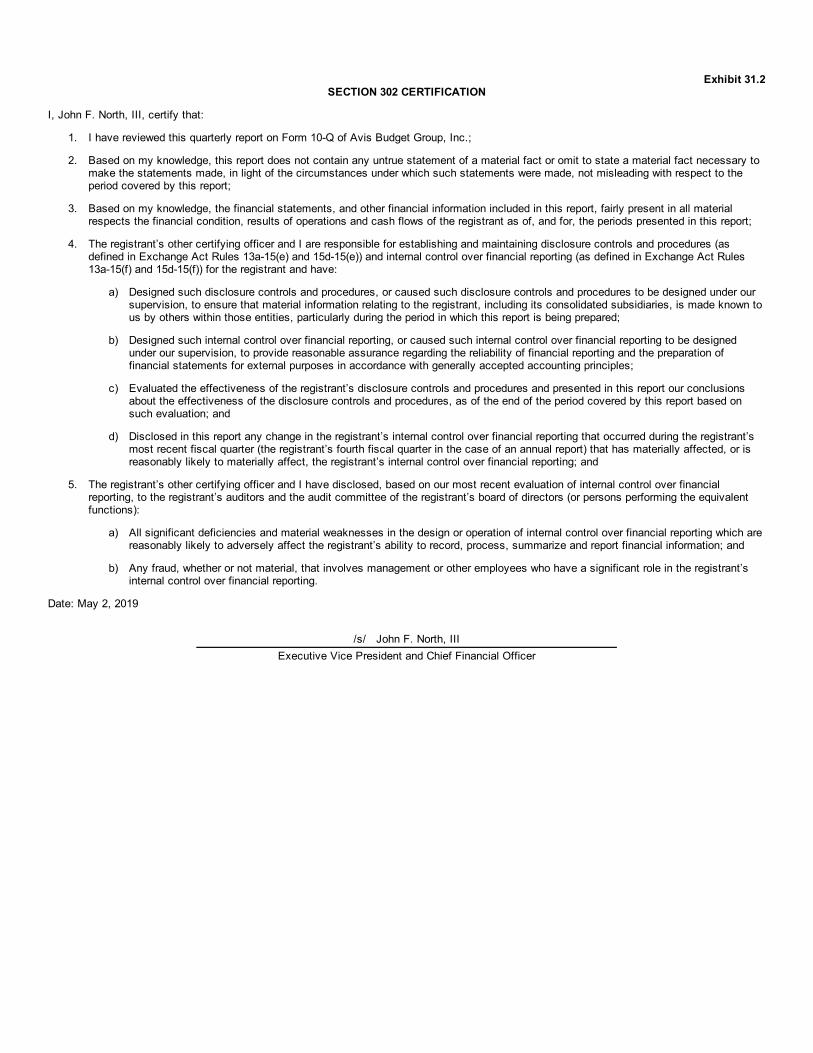
Exhibit 31.2SECTION 302 CERTIFICATION
I, John F. North, III, certify that:
1. I have reviewed this quarterly report on Form 10-Q of Avis Budget Group, Inc.;
2. Based on my knowledge, this report does not contain any untrue statement of a material fact or omit to state a material fact necessary tomake the statements made, in light of the circumstances under which such statements were made, not misleading with respect to theperiod covered by this report;
3. Based on my knowledge, the financial statements, and other financial information included in this report, fairly present in all materialrespects the financial condition, results of operations and cash flows of the registrant as of, and for, the periods presented in this report;
4. The registrant’s other certifying officer and I are responsible for establishing and maintaining disclosure controls and procedures (asdefined in Exchange Act Rules 13a-15(e) and 15d-15(e)) and internal control over financial reporting (as defined in Exchange Act Rules13a-15(f) and 15d-15(f)) for the registrant and have:
a) Designed such disclosure controls and procedures, or caused such disclosure controls and procedures to be designed under oursupervision, to ensure that material information relating to the registrant, including its consolidated subsidiaries, is made known tous by others within those entities, particularly during the period in which this report is being prepared;
b) Designed such internal control over financial reporting, or caused such internal control over financial reporting to be designedunder our supervision, to provide reasonable assurance regarding the reliability of financial reporting and the preparation offinancial statements for external purposes in accordance with generally accepted accounting principles;
c) Evaluated the effectiveness of the registrant’s disclosure controls and procedures and presented in this report our conclusionsabout the effectiveness of the disclosure controls and procedures, as of the end of the period covered by this report based onsuch evaluation; and
d) Disclosed in this report any change in the registrant’s internal control over financial reporting that occurred during the registrant’smost recent fiscal quarter (the registrant’s fourth fiscal quarter in the case of an annual report) that has materially affected, or isreasonably likely to materially affect, the registrant’s internal control over financial reporting; and
5. The registrant’s other certifying officer and I have disclosed, based on our most recent evaluation of internal control over financialreporting, to the registrant’s auditors and the audit committee of the registrant’s board of directors (or persons performing the equivalentfunctions):
a) All significant deficiencies and material weaknesses in the design or operation of internal control over financial reporting which arereasonably likely to adversely affect the registrant’s ability to record, process, summarize and report financial information; and
b) Any fraud, whether or not material, that involves management or other employees who have a significant role in the registrant’sinternal control over financial reporting.
Date: May 2, 2019
/s/ John F. North, IIIExecutive Vice President and Chief Financial Officer
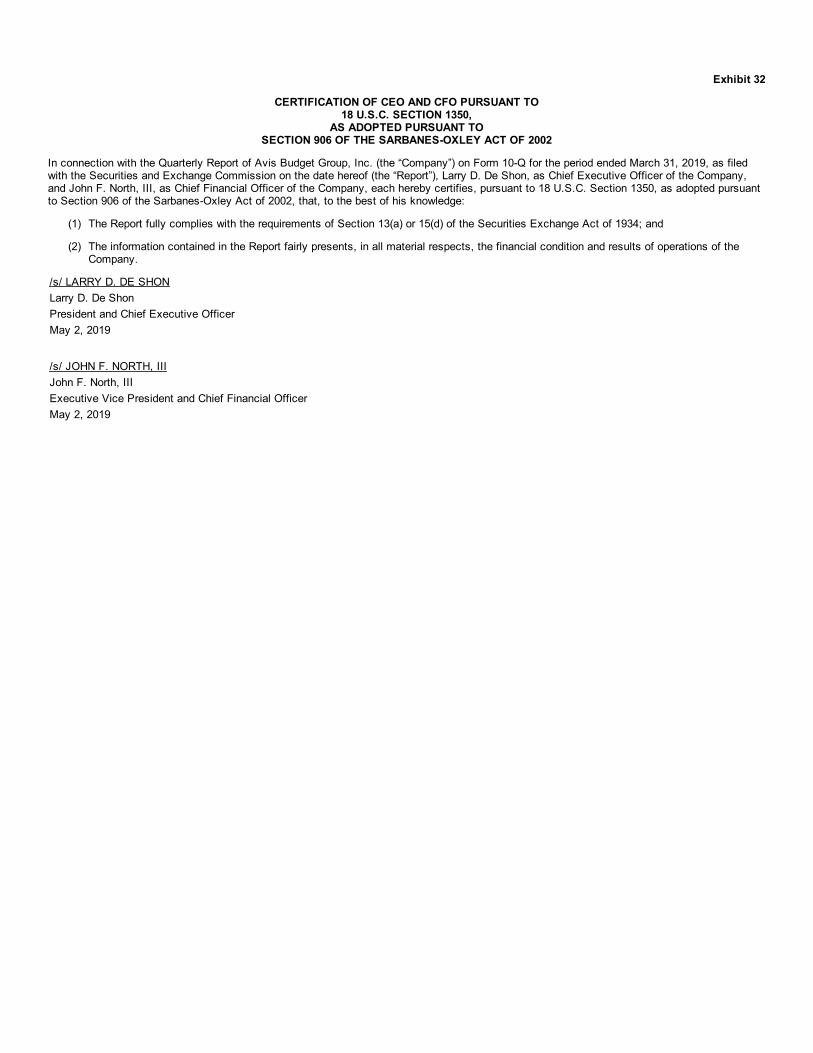
Exhibit 32
CERTIFICATION OF CEO AND CFO PURSUANT TO18 U.S.C. SECTION 1350,
AS ADOPTED PURSUANT TOSECTION 906 OF THE SARBANES-OXLEY ACT OF 2002
In connection with the Quarterly Report of Avis Budget Group, Inc. (the “Company”) on Form 10-Q for the period ended March 31, 2019, as filedwith the Securities and Exchange Commission on the date hereof (the “Report”), Larry D. De Shon, as Chief Executive Officer of the Company,and John F. North, III, as Chief Financial Officer of the Company, each hereby certifies, pursuant to 18 U.S.C. Section 1350, as adopted pursuantto Section 906 of the Sarbanes-Oxley Act of 2002, that, to the best of his knowledge:
(1) The Report fully complies with the requirements of Section 13(a) or 15(d) of the Securities Exchange Act of 1934; and
(2) The information contained in the Report fairly presents, in all material respects, the financial condition and results of operations of theCompany.
/s/ LARRY D. DE SHONLarry D. De ShonPresident and Chief Executive OfficerMay 2, 2019
/s/ JOHN F. NORTH, IIIJohn F. North, IIIExecutive Vice President and Chief Financial OfficerMay 2, 2019