Tropical Channel NEMO-OASIS-WRF Coupled simulations at very high resolution
cicsnc.org ncdc.noaa.gov Climate.gov
Carolina Climate Resilience Conference 28th – 29th April 2014
Charlotte, NC, USA
Introduction
Ongoing Research
Key Results WRF Simulations The Carolinas are prone to tropical cyclone (TC) activity that impacts communities along their tracks (Fig. 1). While damaging winds, storm-surge, and tornados are associated with TCs, intense precipitation (fresh water floods) result in more deaths than any other hazard (Rappaport 2000). Hydrological assessments of TCs require a suite of observation systems that unfortunately have sparse data coverage, sensor uncertainties (Z-R relationship) or coarse temporal and spatial resolutions. These challenges become more pronounced over complex terrain where precipitation intensity is more variable. Numerical models, can serve a valuable tool to further investigate the hydrological impacts of TCs at regional and local scales.
Further evaluate model performance with respect to IBTrACS and surface observations from the U.S. Climate Reference Network (USCRN) and North Carolina Environment and Climate Observing Network (NC ECOnet).
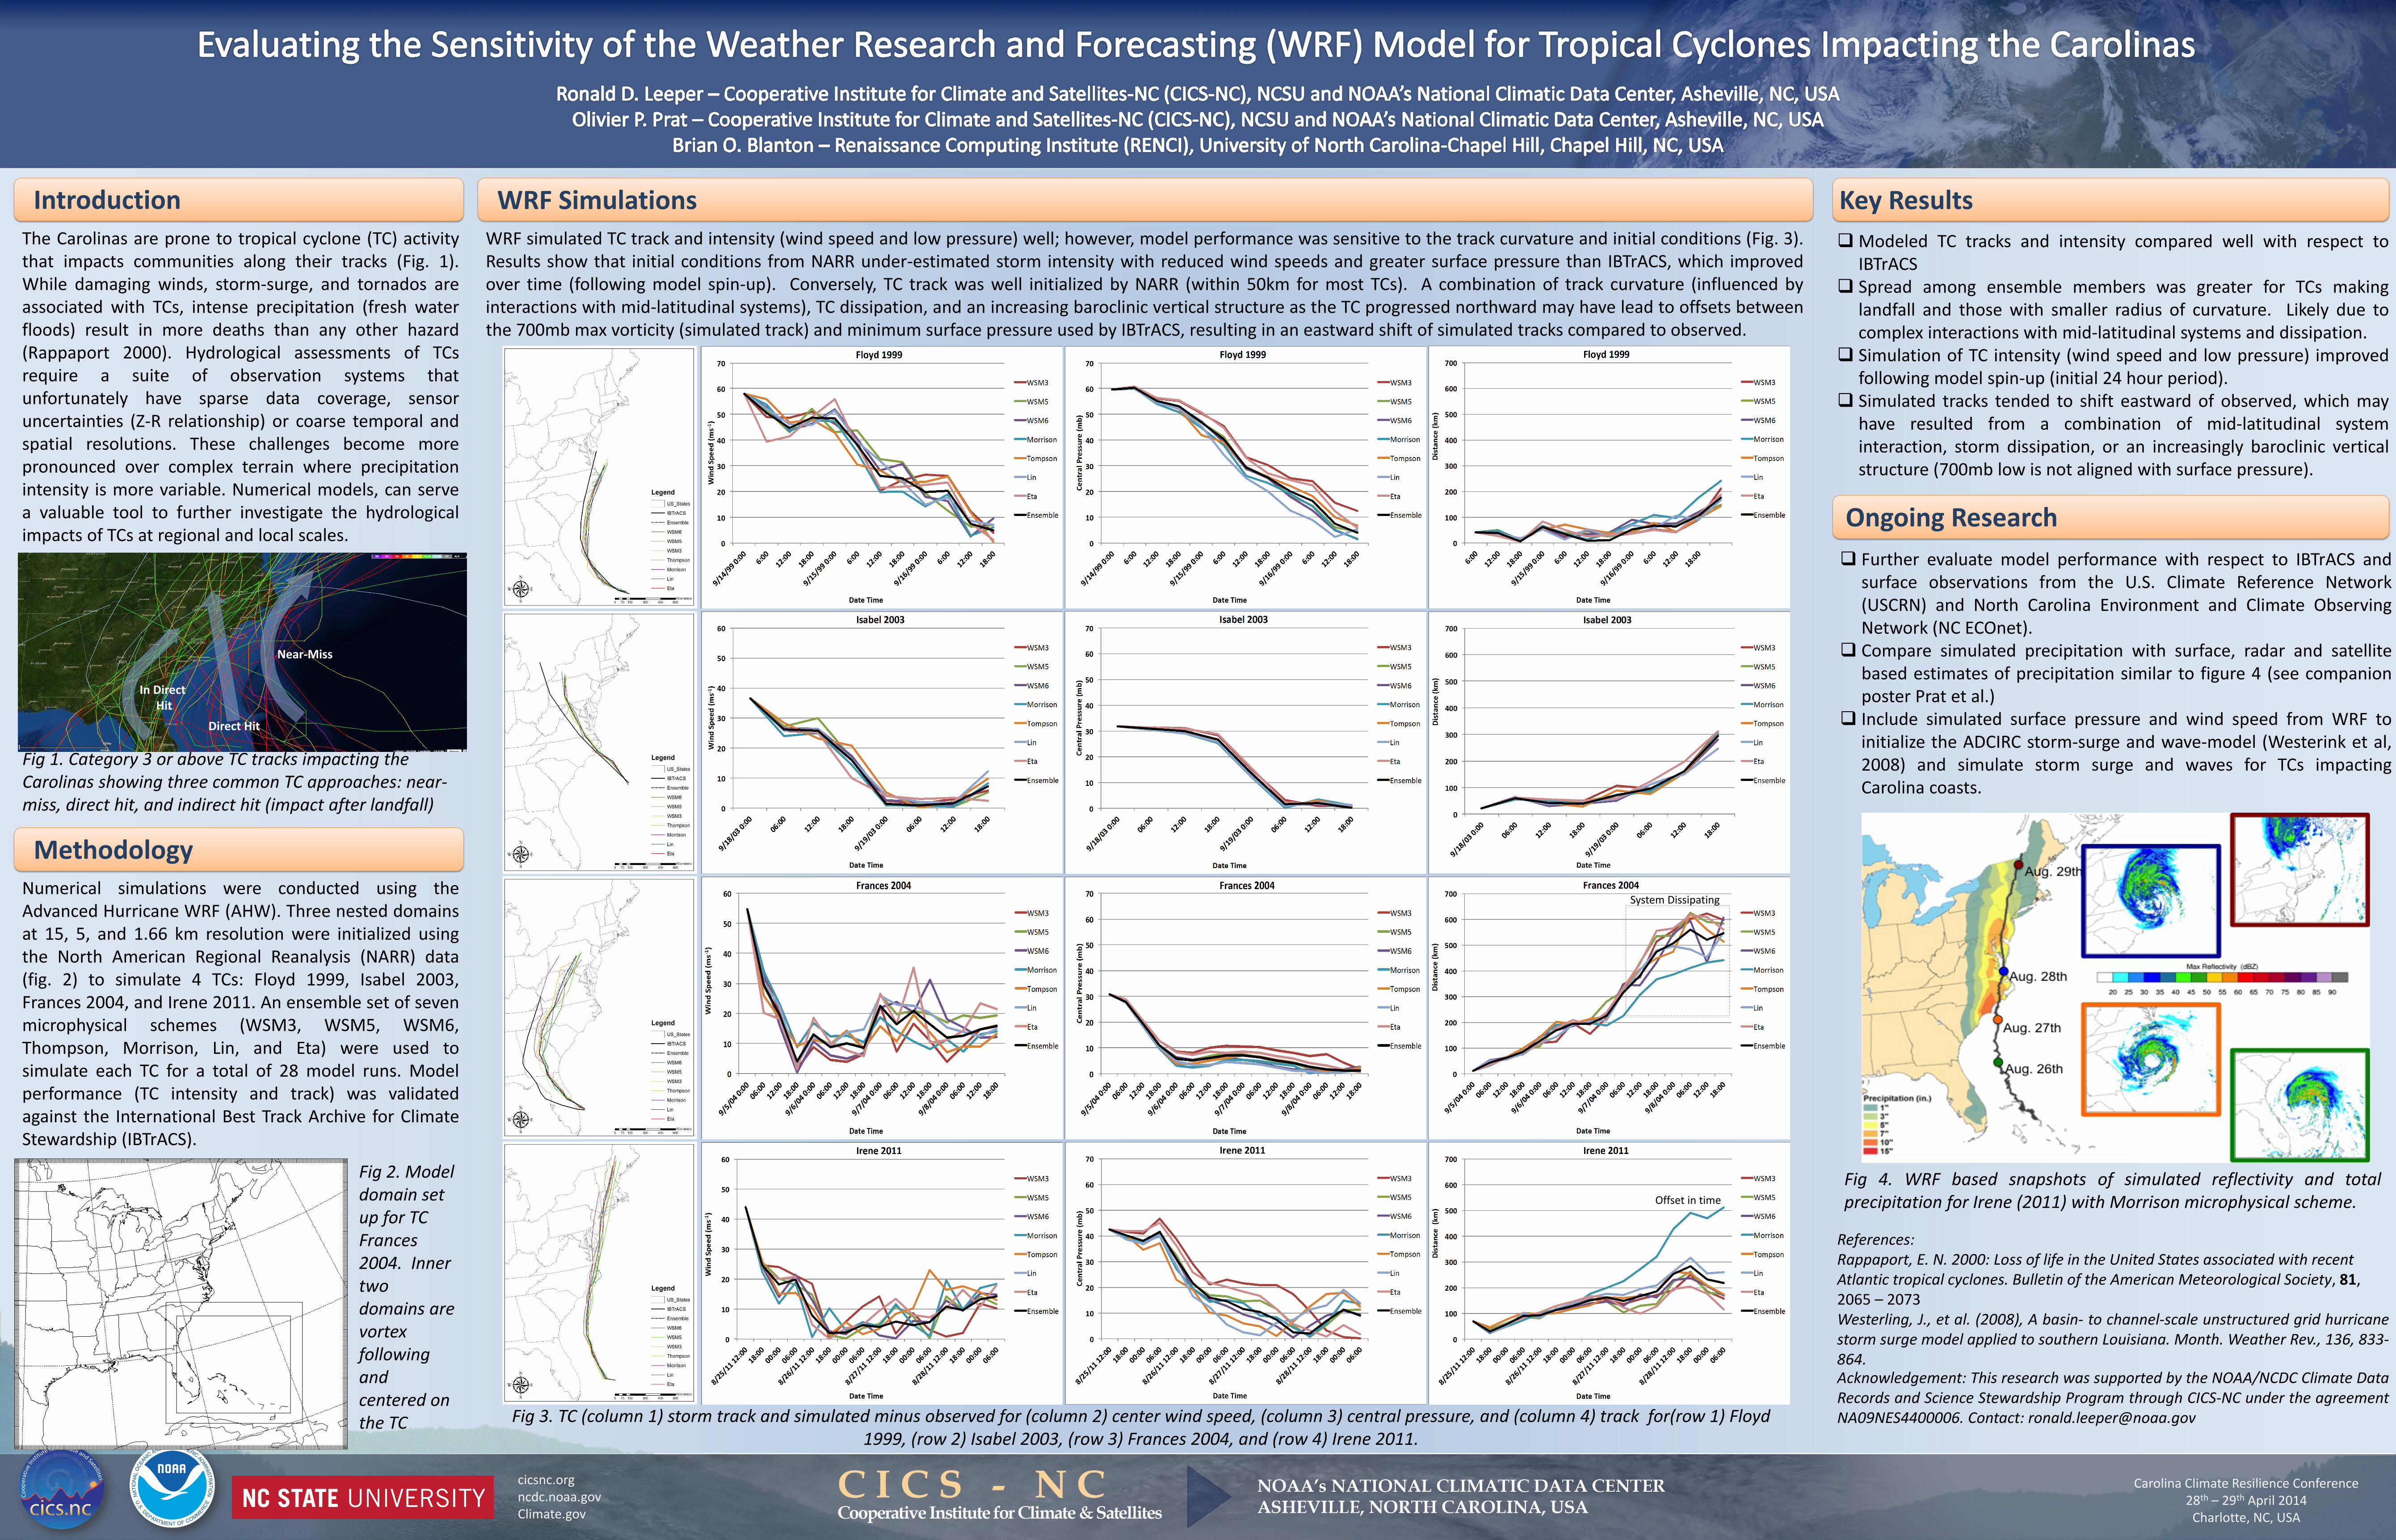
Compare simulated precipitation with surface, radar and satellite based estimates of precipitation similar to figure 4 (see companion poster Prat et al.)
Include simulated surface pressure and wind speed from WRF to initialize the ADCIRC storm-surge and wave-model (Westerink et al, 2008) and simulate storm surge and waves for TCs impacting Carolina coasts.
Acknowledgement: This research was supported by the NOAA/NCDC Climate Data Records and Science Stewardship Program through CICS-NC under the agreement NA09NES4400006. Contact: [email protected]
References: Rappaport, E. N. 2000: Loss of life in the United States associated with recent Atlantic tropical cyclones. Bulletin of the American Meteorological Society, 81, 2065 – 2073 Westerling, J., et al. (2008), A basin- to channel-scale unstructured grid hurricane storm surge model applied to southern Louisiana. Month. Weather Rev., 136, 833-864.
Modeled TC tracks and intensity compared well with respect to IBTrACS
Spread among ensemble members was greater for TCs making landfall and those with smaller radius of curvature. Likely due to complex interactions with mid-latitudinal systems and dissipation.
Simulation of TC intensity (wind speed and low pressure) improved following model spin-up (initial 24 hour period).
Simulated tracks tended to shift eastward of observed, which may have resulted from a combination of mid-latitudinal system interaction, storm dissipation, or an increasingly baroclinic vertical structure (700mb low is not aligned with surface pressure).
Fig 4. WRF based snapshots of simulated reflectivity and total precipitation for Irene (2011) with Morrison microphysical scheme.
Methodology Numerical simulations were conducted using the Advanced Hurricane WRF (AHW). Three nested domains at 15, 5, and 1.66 km resolution were initialized using the North American Regional Reanalysis (NARR) data (fig. 2) to simulate 4 TCs: Floyd 1999, Isabel 2003, Frances 2004, and Irene 2011. An ensemble set of seven microphysical schemes (WSM3, WSM5, WSM6, Thompson, Morrison, Lin, and Eta) were used to simulate each TC for a total of 28 model runs. Model performance (TC intensity and track) was validated against the International Best Track Archive for Climate Stewardship (IBTrACS).
Fig 2. Model domain set up for TC Frances 2004. Inner two domains are vortex following and centered on the TC Fig 3. TC (column 1) storm track and simulated minus observed for (column 2) center wind speed, (column 3) central pressure, and (column 4) track for(row 1) Floyd
1999, (row 2) Isabel 2003, (row 3) Frances 2004, and (row 4) Irene 2011.
WRF simulated TC track and intensity (wind speed and low pressure) well; however, model performance was sensitive to the track curvature and initial conditions (Fig. 3). Results show that initial conditions from NARR under-estimated storm intensity with reduced wind speeds and greater surface pressure than IBTrACS, which improved over time (following model spin-up). Conversely, TC track was well initialized by NARR (within 50km for most TCs). A combination of track curvature (influenced by interactions with mid-latitudinal systems), TC dissipation, and an increasing baroclinic vertical structure as the TC progressed northward may have lead to offsets between the 700mb max vorticity (simulated track) and minimum surface pressure used by IBTrACS, resulting in an eastward shift of simulated tracks compared to observed.
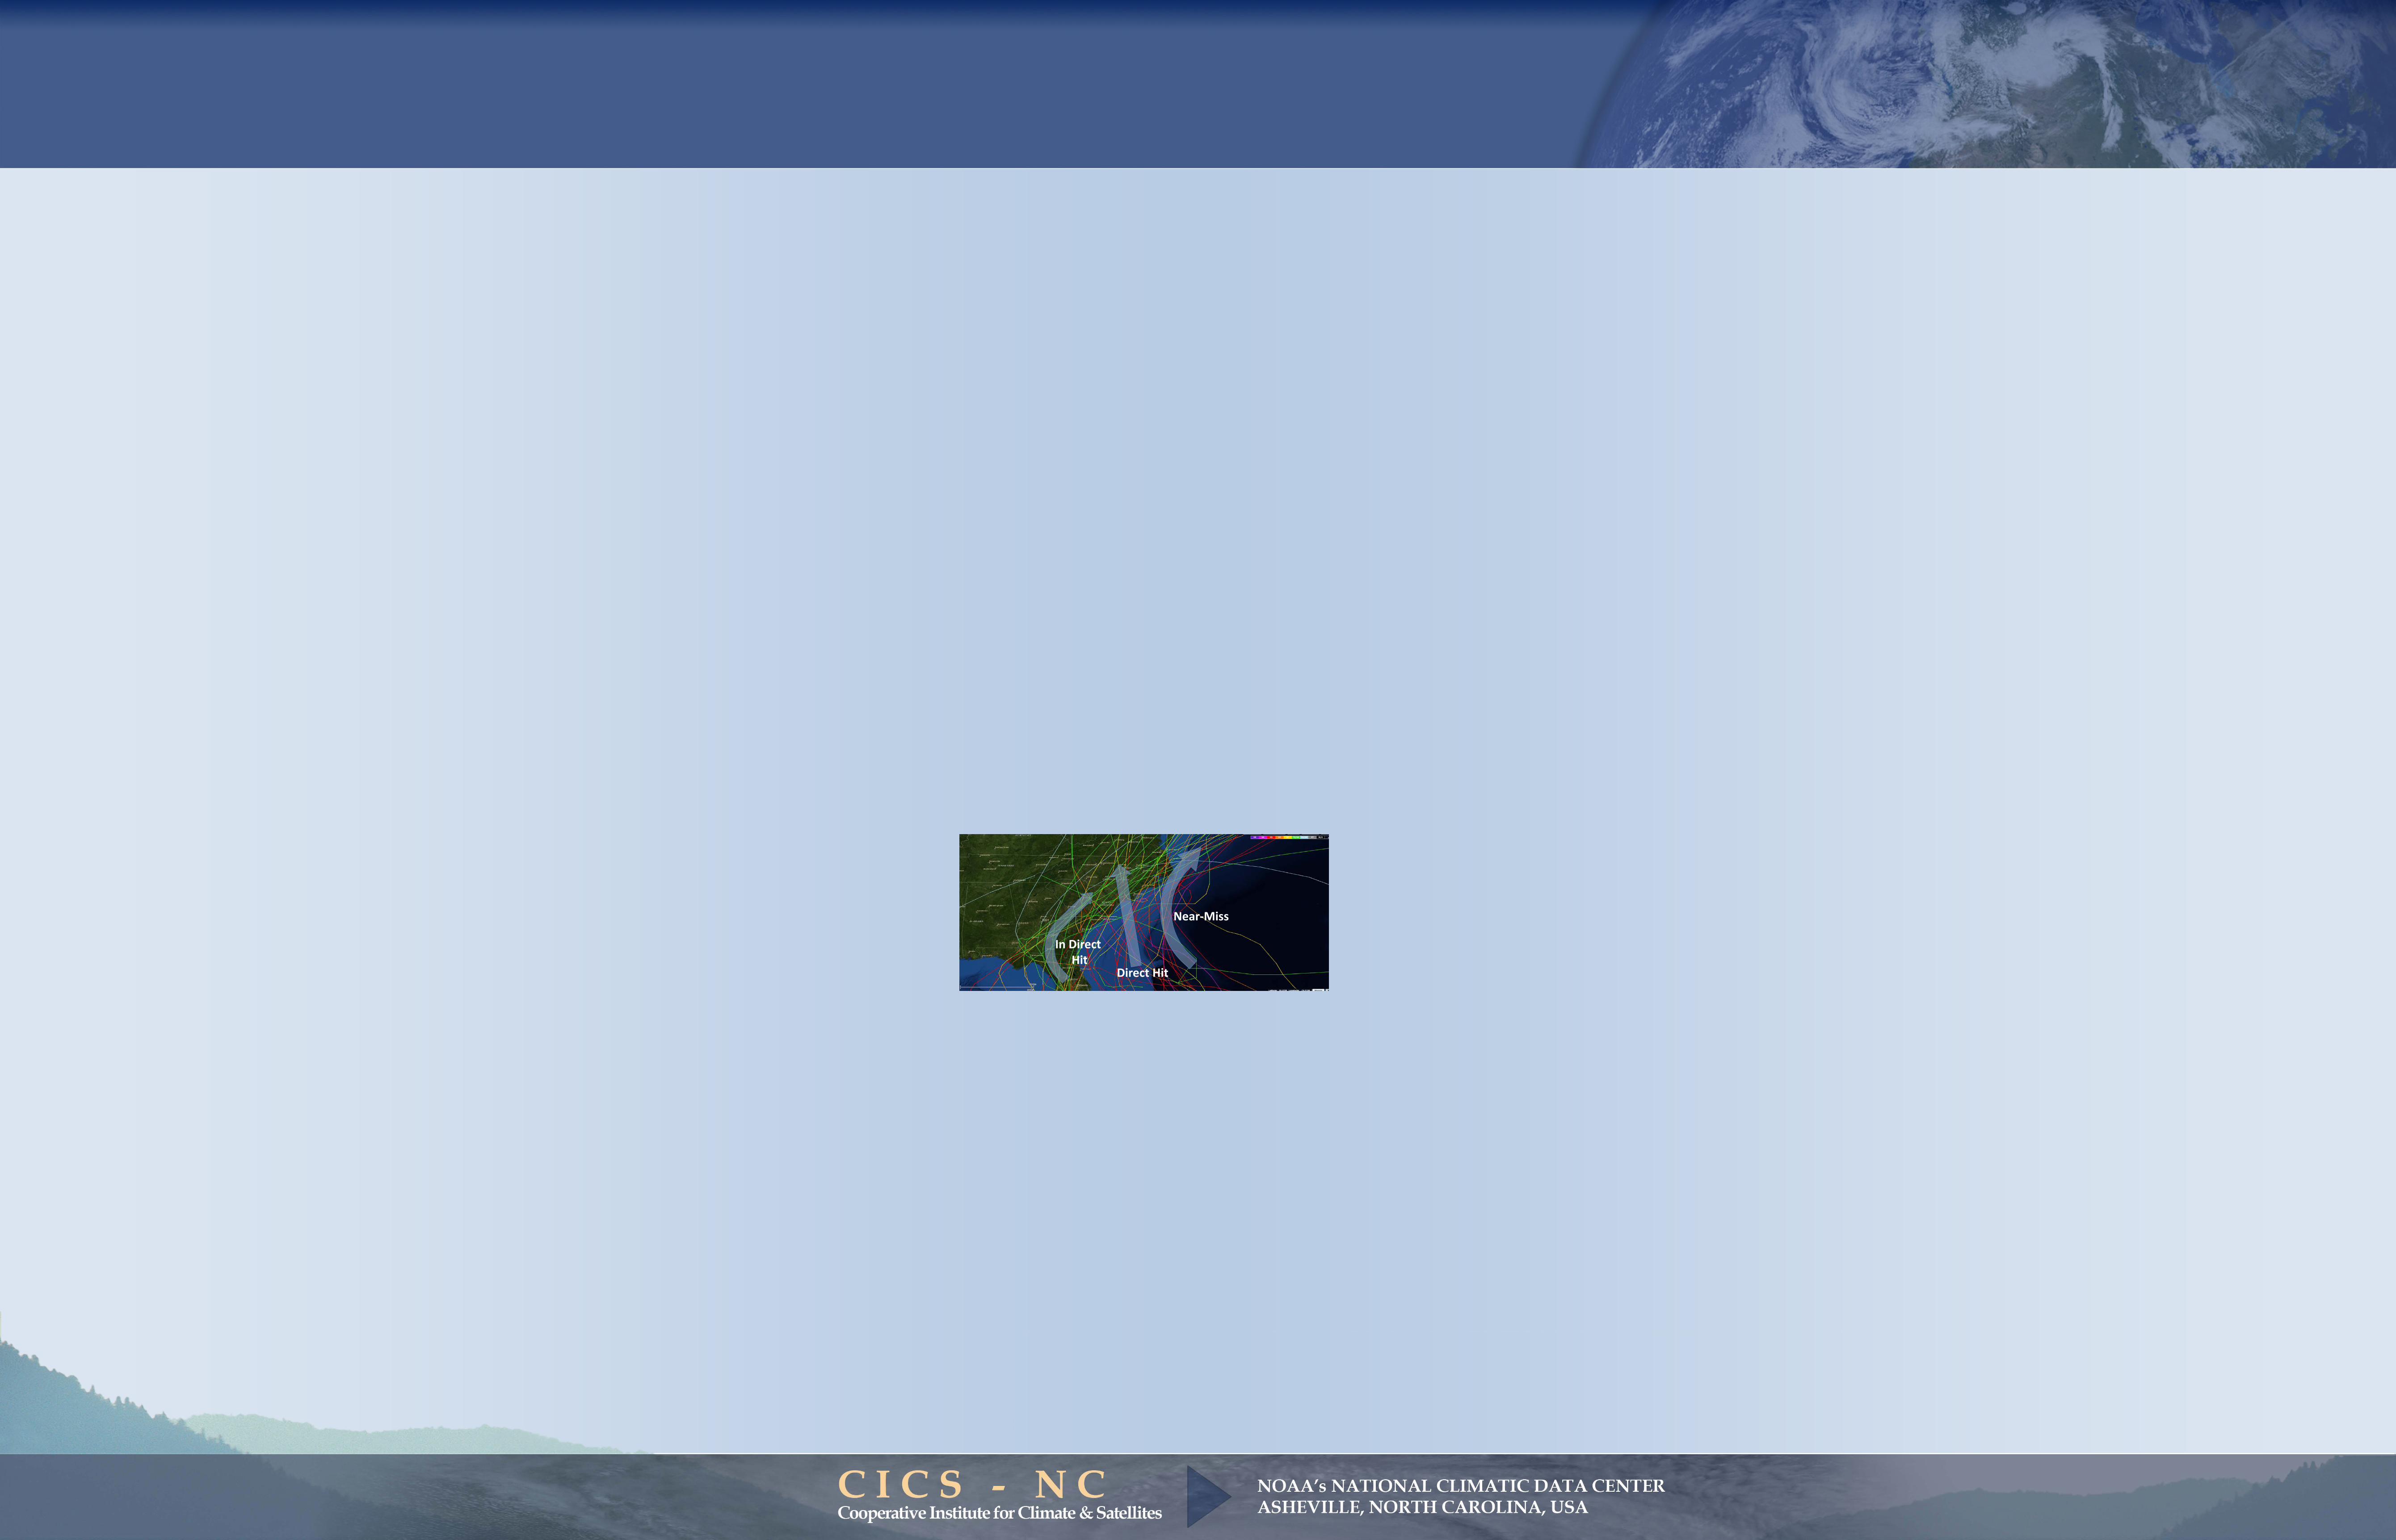
Fig 1. Category 3 or above TC tracks impacting the Carolinas showing three common TC approaches: near-miss, direct hit, and indirect hit (impact after landfall)
Near-Miss
Direct Hit
In Direct Hit
System Dissipating
Offset in time

Near-Miss
Direct Hit
In Direct Hit