SENSITIVITY OF WRF MODEL RESULTS TO TOPOGRAPHY AND …
15
87 ГОДИШНИК НА СОФИЙСКИЯ УНИВЕРСИТЕТ „СВ. КЛИМЕНТ ОХРИДСКИ“ ФИЗИЧЕСКИ ФАКУЛТЕТ Том 111 ANNUAL OF SOFIA UNIVERSITY “ST. KLIMENT OHRIDSKI” FACULTY OF PHYSICS Volume 111 SENSITIVITY OF WRF MODEL RESULTS TO TOPOGRAPHY AND LAND COVER: STUDY FOR THE SOFIA REGION EVGENI VLADIMIROV 1,2 , RENETA DIMITROVA 1 , VENTSISLAV DANCHOVSKI 1 1 Department of Meteorology and Geophysics 2 BULATSA, Sofia, Bulgaria Евгени Владимиров, Ренета Димитрова, Венцислав Данчовски. ЧУВСТВИТЕЛНОСТ НА РЕЗУЛТАТИТЕ НА МОДЕЛА WRF КЪМ ТОПОГРАФИЯТА И ПОДЛОЖНАТА ПОВЪРХ- НОСТ: ИЗСЛЕДВАНЕ ЗА РАЙОНА НА СОФИЯ Най-сложна и изключително разнообразна картина на атмосферните процеси в атмосфер- ния граничен слой се наблюдава в комплексен терен и градски райони. Описанието на таки- ва процеси все още остава предизвикателство поради множеството фактори, които действат в мезо- и микромащаби. Две нови бази данни бяха адаптирани и използвани, за да се подобрят моделните резултати. Представена е методологията, която описва подготовката на статични- те полета данни. Също така са дискутирани сравнение между резултатите от моделирането, получени с груба и с по-добра разделителна способност за топографията, както и различно представяне на подложната повърхност . Evgeni Vladimirov, Reneta Dimitrova, Ventsislav Danchovski. SENSITIVITY OF THE WRF MODEL RESULTS TO TOPOGRAPHY AND LAND COVER: STUDY FOR THE SOFIA REGION The most complicated and extremely diverse pattern of atmospheric boundary-layer processes relate to a complex terrain and urban areas. Description of such processes still remain to be a challenge due to a multiplicity of forcing factors, acting primarily at the mesoscale and microscale. Two new datasets were adapted and implemented to improve the model performance. A methodology describing preparation of both static data field is presented. A comparison between modelling results obtained with rough and fine topography and different land-use datasets is also discussed. Keywords: new static datasets implementation, model sensitivity to topography and land-use, model evaluation PACS numbers: 92.60.-e, 92.60.Sz, 92.60.hf, 92.60.Fm, 47.27.nb, 92.60.Ry, 92.60.Jq, *92.60.jf, 92.60. Vb, 92.60.hk For contact: Evgeni Vladimirov, Department of Meteorology and Geophysics, Faculty of Physics, 5 James Bourchier Blvd., 1164 Sofia, Bulgaria, GSM: +359 898 507 567, E-mail: evgeniv@uni-sofia.bg
Transcript of SENSITIVITY OF WRF MODEL RESULTS TO TOPOGRAPHY AND …
87
ГОДИШНИК НА СОФИЙСКИЯ УНИВЕРСИТЕТ „СВ. КЛИМЕНТ ОХРИДСКИ“
ФИЗИЧЕСКИ ФАКУЛТЕТ
Том 111
ANNUAL OF SOFIA UNIVERSITY “ST. KLIMENT OHRIDSKI”
FACULTY OF PHYSICS
Volume 111
SENSITIVITY OF WRF MODEL RESULTS TO TOPOGRAPHY AND LAND COVER: STUDY FOR THE SOFIA REGION
EVGENI VLADIMIROV1,2, RENETA DIMITROVA1, VENTSISLAV DANCHOVSKI1
1 Department of Meteorology and Geophysics2 BULATSA, Sofi a, Bulgaria
Евгени Владимиров, Ренета Димитрова, Венцислав Данчовски. ЧУВСТВИТЕЛНОСТ НА РЕЗУЛТАТИТЕ НА МОДЕЛА WRF КЪМ ТОПОГРАФИЯТА И ПОДЛОЖНАТА ПОВЪРХ-НОСТ: ИЗСЛЕДВАНЕ ЗА РАЙОНА НА СОФИЯ
Най-сложна и изключително разнообразна картина на атмосферните процеси в атмосфер-ния граничен слой се наблюдава в комплексен терен и градски райони. Описанието на таки-ва процеси все още остава предизвикателство поради множеството фактори, които действат в мезо- и микромащаби. Две нови бази данни бяха адаптирани и използвани, за да се подобрят моделните резултати. Представена е методологията, която описва подготовката на статични-те полета данни. Също така са дискутирани сравнение между резултатите от моделирането, получени с груба и с по-добра разделителна способност за топографията, както и различно представяне на подложната повърхност.
Evgeni Vladimirov, Reneta Dimitrova, Ventsislav Danchovski. SENSITIVITY OF THE WRF MODEL RESULTS TO TOPOGRAPHY AND LAND COVER: STUDY FOR THE SOFIA REGION
The most complicated and extremely diverse pattern of atmospheric boundary-layer processes relate to a complex terrain and urban areas. Description of such processes still remain to be a challenge due to a multiplicity of forcing factors, acting primarily at the mesoscale and microscale. Two new datasets were adapted and implemented to improve the model performance. A methodology describing preparation of both static data field is presented. A comparison between modelling results obtained with rough and fine topography and different land-use datasets is also discussed.
Keywords: new static datasets implementation, model sensitivity to topography and land-use, model evaluation
PACS numbers: 92.60.-e, 92.60.Sz, 92.60.hf, 92.60.Fm, 47.27.nb, 92.60.Ry, 92.60.Jq, *92.60.jf, 92.60.Vb, 92.60.hk
For contact: Evgeni Vladimirov, Department of Meteorology and Geophysics, Faculty of Physics, 5 James Bourchier Blvd., 1164 Sofia, Bulgaria, GSM: +359 898 507 567, E-mail: [email protected]
88
1. INTRODUCTION
The most complicated and extremely diverse pattern of atmospheric boundary-layer processes relate to a complex terrain in response to a multiplicity of forcing factors, acting primarily at the mesoscale and microscale [1‒12]. Terrain and land-use inhomogeneity cause thermal circulation domination under quiescent conditions, or significant modification of the large-scale synoptic flow [13‒14].
In addition to natural factors urban areas affect considerably local microclimate. It is noteworthy that 54% of the world’s population (almost 4 billion) now lives in urban, rather than rural areas. This is expected to swell to 66%, or more than 6 billion, by 2050 [15], as cities become centers of human activity that provide more opportunities for realization. Intense modifications of land surfaces occur through urban development [16], for example, the use of high heat capacity material for construction and roadways affects local microclimates. The differences in energy balance, temperature, humidity, and storm runoff between urban areas and rural surfaces are substantial.
The application of numerical modelling to investigate fundamental scientific tasks and solve operational tasks became more significant with the rapid development of new technology and computer science during the last few decades. This made the problem of improving numerical forecasts an increasingly salient issue, the resolution of which is highly significant to serving society’s needs. Noteworthy efforts in improving operational model predictions were made on high-resolution atmospheric modelling in complex terrain. Correctly treating the land surface properties is becoming increasingly important for meteorological models to be able to capture local mesoscale circulation induced by land surface forcing [17]. The main findings from a number of studies are the importance of better description of topography and land-use inhomogeneity leading to better description of urban atmospheric processes such as clouds and precipitation, heat transfer and convection.
Sofia city is located in very complex terrain in close proximity to Vitosha mountain and better description of the topography is necessary. The standard sur-face datasets distributed with WRF model is global digital elevation (GMTED2010) and US Geological Survey land-use (USGS) datasets with resolution of 30-arc-sec-ond, approximately 1 km at 45° latitude. More recent MODerate resolution Imaging Spectroradiometer (MODIS) land-use dataset, modified in the International Geo-sphere-Biosphere Programme Data and Information System (IGBP-DIS) DISCover are also available for modelling community with resolution of 30-arc-second and 15-arc-second (approximately 500 m at 45° latitude).
Two new datasets have been implemented and adapted in this study: SRTM 1-arc-second (approximately 30 m at considering latitude) digital elevation data (SRTM, NASA; https://lta.cr.usgs.gov/SRTM1Arc) and the more recent CORINE 2012 with 3-arc-second resolution (approximately 90 m at the same latitude) Land
89
Cover data (CLC2012, EEA; https://land.copernicus.eu/pan-european/corine-land-cover/clc-2012) for Europe. A methodology describing preparation of both static data field is presented. A comparison between modelling results obtained with rough and fine topography data, from one side, and different land-use category datasets, from the other side, are in the main focus of this study. The model performance is estimated by comparison against observations at singular data points.
2. MODEL SET UP
The well-known Weather Research and Forecasting (WRF) model, version 3.8.1 is used for the numerical experiments. WRF is a state-of-the-art atmospheric modelling system, designed for broad range of applications. These include idealized simulations for investigation of specific physical processes in the atmosphere, data assimilation, and operational forecast.
High resolution numerical modelling in both directions ‒ horizontal (500 meters step) and vertical (50 irregular stretched vertical levels with greater density in Planetary Boundary Layer ‒ PBL) is required for this study. Two major changes are introduced into the model in order to evaluate some improvements in its performance. A new dataset of topography with 1-arc-second resolution, and new physical surface properties via a more accurate land-use dataset with 3-arc-second resolution are implemented to WRF. A reclassifying procedure is carried out to adapt the new information from CORINE Land Cover 2012 to the existing into the model surface properties from USGS dataset.
Four nested domains are used based on a Lambert Projection (Figure 1), which essentially covered Balkan Peninsula (Domain 1, D1), Bulgaria (Domain 2, D2), Western part of Bulgaria (Domain 3, D3) and Sofia Valley (Domain 4, D4). D1 has 36×44 grid points in the horizontal with 32-km grid-point spacing; D2 ‒ 73×65 8-km cells respectively; D3 ‒ 69×97 2-km cells, and D4 cover Sofia Valley with 157×129 cells with resolution of 500 m.
The initial and boundary conditions (for the parent domain D1) are derived from the 0.25 degree NCEP Final Operational Model Global Tropospheric Analyses (http://rda.ucar.edu/datasets/ds083.2/) on every 6 hours. This product comes from the Global Data Assimilation System, which continuously collects observational data from the Global Telecommunications System. Data assimilation (fdda model option) is used for domain D1 at all vertical levels and for domains D2, D3 only above closest to the ground 10 model levels The fdda option did not apply for the most inner domain of specific interest.

90
Fig. 1. Domains used for numerical calculations with extended view of Sofia valley (500 m grid)
The WRF physics package includes: a sophisticated microphysics scheme [18], the Rapid Radiative Transfer Model (RRTM) longwave radiation parameterization [19], Dudhia shortwave radiation parameterization [20], Noah land surface model [17]. Simplified Arakawa‒Schubert cumulus parameterization [21] is used only for domains D1 and D2. For high resolution domains D3 and D4 cumulus formation is resolved explicitly by the microphysics. The most sensitive to local surface inhomo-geneity are surface fluxes and skin temperature which depend strongly on surface schemes and related PBL schemes used for simulations. Due to this reason most of the available in WRF model PBL schemes and corresponding surface schemes are used and compared. These include: Asymmetric Convective Model ‒ ACM2 [22], Bougeault and Lacarrere‒BouLac [23], Mellor‒Yamada‒Janjic ‒ MYJ [24], Mellor‒Yamada‒Nakanishi and Niino Level 2.5 – MYNN2.5 [25], Mellor‒Yamada‒Nakan-ishi and Niino Level 3 ‒ MYNN3 [25], Quasi-Normal Scale Elimination ‒ QNSE [26], Bretherton and Park – UW [27] and Yonsei University ‒ YSU [28].
3. METHODOLOGY FOR IMPLEMENTAION OF HIGH RESOLUTION EVEVATION AND LAND-USE DATA
WRF uses WPS (WRF pre-processing system) to prepare the boundary and ini-tial condition fields for real-data numerical simulations. WPS is a set of three pro-grams and each of the programs performs one stage of the work: geogrid make the initial fields and interpolates static geographical e.g. terrain and the land cover data, to the specific domain grids; ungrib extracts meteorological fields from global NCEP GRIB-formatted files; and metgrid horizontally interpolates the meteorological fields extracted by ungrib to the model grids defined by geogrid. WPS produces a specific

91
readable binary format files for each field. Therefore to use other than the standard datasets in WRF model it is necessary to convert the downloaded data into WPS read-able binary format. There are a number of available software solutions to transform the originally downloaded datasets, the most prominent of which are ARCGIS. We use R- language in this work however [29].
3.1. PROCEDURE OF HIGH RESOLUTION TOPOGRAPHY DATA PREPATION
The dataset is downloading from the digital elevation NASA database SRT-M1Arc (https://lta.cr.usgs.gov/SRTM1Arc). A visualization tool, such as EarthEx-plorer (http://earthexplorer.usgs.gov/), is needed to visualize and select only the area corresponding to domain use for the numerical simulations. The selection of the appropriate area allows downloading only a part of the full global dataset. The SRTM data for the region between 22th‒24th meridian and 42th‒43th parallel are down-loaded merged and saved in an ASCII formatted file. A slightly modified version of Fortran90 code, provided by Lorenzo Giovannini (Atmospheric Physics Group Department of Civil and Environmental Engineering, University of Trento) [30] and C program, distributed with the WPS source code, are used to convert the ASCII file into a WPS readable binary format. Very important part of the procedure is creation of index file describing all necessary information for the dataset and its geo-oriented projection. The GEOGRID.TBL file must be changed, adding the path to new dataset and describing the type of interpolation to be used. The pre-processing system is able to implement the new topography field via geogrid module.
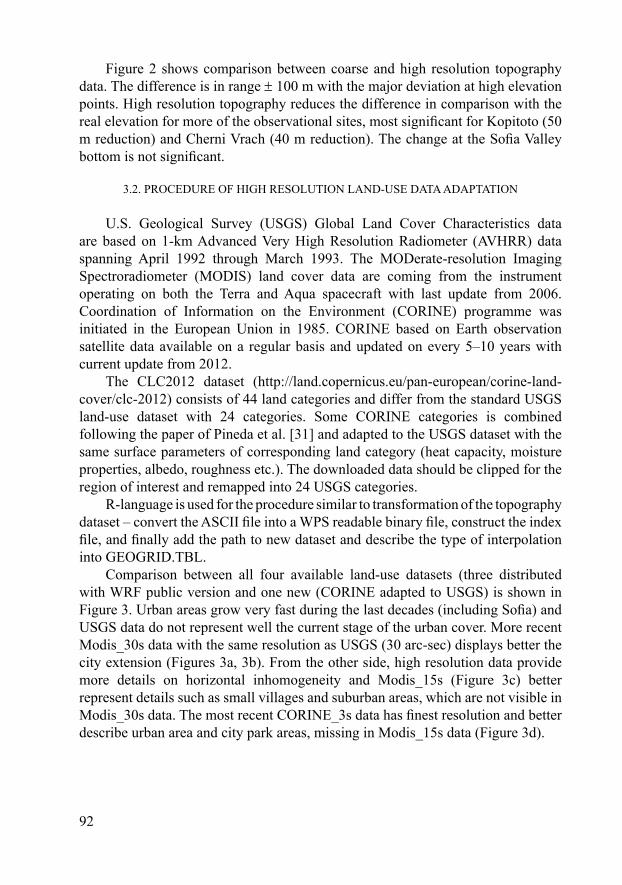
Fig. 2. Topography with 30 and 1arc-seconds and map of the domain from Google Earth (the upper panel); map of the difference between both datasets and table with differences for specific sites of
model validation (down panel)
92
Figure 2 shows comparison between coarse and high resolution topography data. The difference is in range 100 m with the major deviation at high elevation points. High resolution topography reduces the difference in comparison with the real elevation for more of the observational sites, most significant for Kopitoto (50 m reduction) and Cherni Vrach (40 m reduction). The change at the Sofia Valley bottom is not significant.
3.2. PROCEDURE OF HIGH RESOLUTION LAND-USE DATA ADAPTATION
U.S. Geological Survey (USGS) Global Land Cover Characteristics data are based on 1-km Advanced Very High Resolution Radiometer (AVHRR) data spanning April 1992 through March 1993. The MODerate-resolution Imaging Spectroradiometer (MODIS) land cover data are coming from the instrument operating on both the Terra and Aqua spacecraft with last update from 2006. Coordination of Information on the Environment (CORINE) programme was initiated in the European Union in 1985. CORINE based on Earth observation satellite data available on a regular basis and updated on every 5‒10 years with current update from 2012.
The CLC2012 dataset (http://land.copernicus.eu/pan-european/corine-land-cover/clc-2012) consists of 44 land categories and differ from the standard USGS land-use dataset with 24 categories. Some CORINE categories is combined following the paper of Pineda et al. [31] and adapted to the USGS dataset with the same surface parameters of corresponding land category (heat capacity, moisture properties, albedo, roughness etc.). The downloaded data should be clipped for the region of interest and remapped into 24 USGS categories.
R-language is used for the procedure similar to transformation of the topography dataset – convert the ASCII file into a WPS readable binary file, construct the index file, and finally add the path to new dataset and describe the type of interpolation into GEOGRID.TBL.
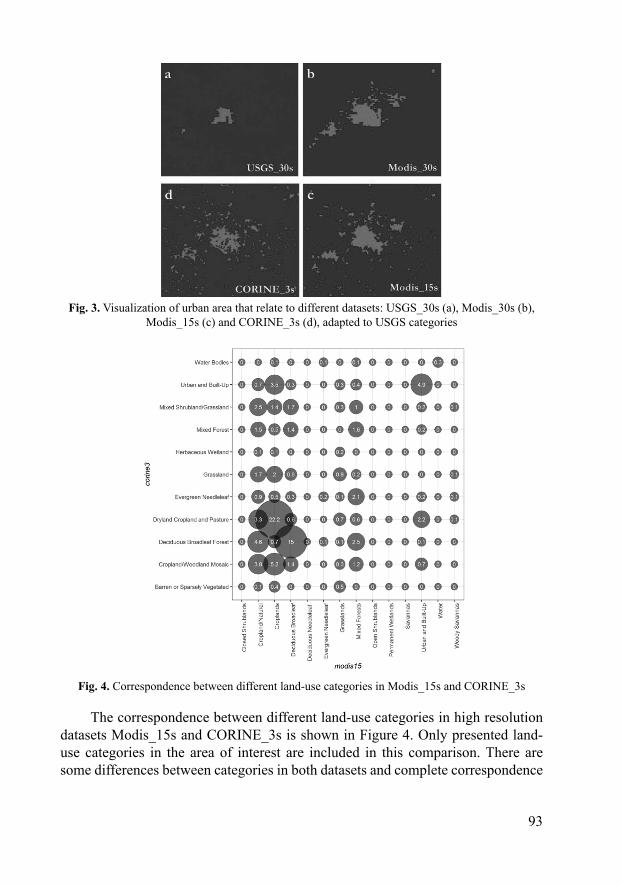
Comparison between all four available land-use datasets (three distributed with WRF public version and one new (CORINE adapted to USGS) is shown in Figure 3. Urban areas grow very fast during the last decades (including Sofia) and USGS data do not represent well the current stage of the urban cover. More recent Modis_30s data with the same resolution as USGS (30 arc-sec) displays better the city extension (Figures 3a, 3b). From the other side, high resolution data provide more details on horizontal inhomogeneity and Modis_15s (Figure 3c) better represent details such as small villages and suburban areas, which are not visible in Modis_30s data. The most recent CORINE_3s data has finest resolution and better describe urban area and city park areas, missing in Modis_15s data (Figure 3d).
93
Fig. 3. Visualization of urban area that relate to different datasets: USGS_30s (a), Modis_30s (b), Modis_15s (c) and CORINE_3s (d), adapted to USGS categories
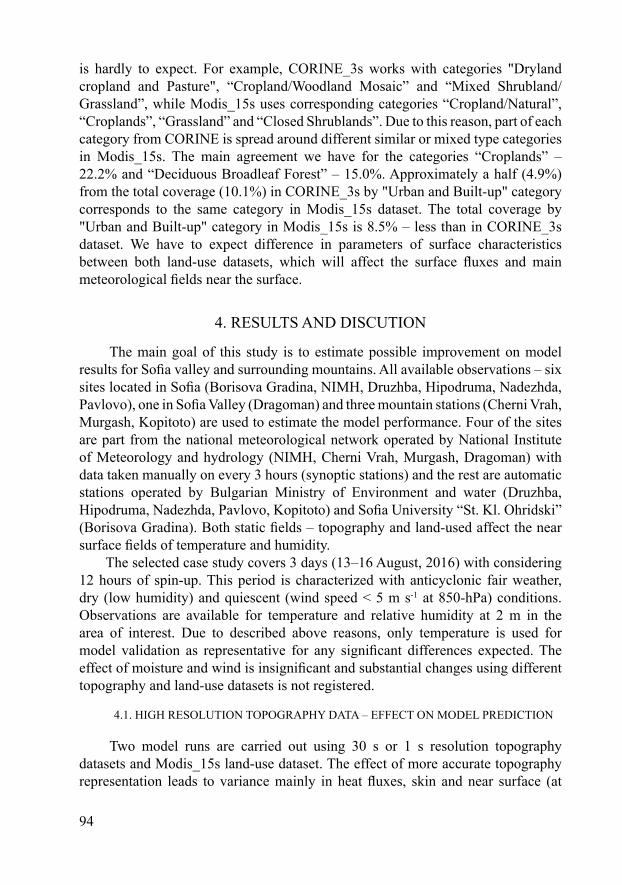
Fig. 4. Correspondence between different land-use categories in Modis_15s and CORINE_3s
The correspondence between different land-use categories in high resolution datasets Modis_15s and CORINE_3s is shown in Figure 4. Only presented land-use categories in the area of interest are included in this comparison. There are some differences between categories in both datasets and complete correspondence
94
is hardly to expect. For example, CORINE_3s works with categories "Dryland cropland and Pasture", “Cropland/Woodland Mosaic” and “Mixed Shrubland/Grassland”, while Modis_15s uses corresponding categories “Cropland/Natural”, “Croplands”, “Grassland” and “Closed Shrublands”. Due to this reason, part of each category from CORINE is spread around different similar or mixed type categories in Modis_15s. The main agreement we have for the categories “Croplands” ‒ 22.2% and “Deciduous Broadleaf Forest” – 15.0%. Approximately a half (4.9%) from the total coverage (10.1%) in CORINE_3s by "Urban and Built-up" category corresponds to the same category in Modis_15s dataset. The total coverage by "Urban and Built-up" category in Modis_15s is 8.5% ‒ less than in CORINE_3s dataset. We have to expect difference in parameters of surface characteristics between both land-use datasets, which will affect the surface fluxes and main meteorological fields near the surface.
4. RESULTS AND DISCUTION
The main goal of this study is to estimate possible improvement on model results for Sofia valley and surrounding mountains. All available observations – six sites located in Sofia (Borisova Gradina, NIMH, Druzhba, Hipodruma, Nadezhda, Pavlovo), one in Sofia Valley (Dragoman) and three mountain stations (Cherni Vrah, Murgash, Kopitoto) are used to estimate the model performance. Four of the sites are part from the national meteorological network operated by National Institute of Meteorology and hydrology (NIMH, Cherni Vrah, Murgash, Dragoman) with data taken manually on every 3 hours (synoptic stations) and the rest are automatic stations operated by Bulgarian Ministry of Environment and water (Druzhba, Hipodruma, Nadezhda, Pavlovo, Kopitoto) and Sofia University “St. Kl. Ohridski” (Borisova Gradina). Both static fields – topography and land-used affect the near surface fields of temperature and humidity.
The selected case study covers 3 days (13‒16 August, 2016) with considering 12 hours of spin-up. This period is characterized with anticyclonic fair weather, dry (low humidity) and quiescent (wind speed < 5 m s-1 at 850-hPa) conditions. Observations are available for temperature and relative humidity at 2 m in the area of interest. Due to described above reasons, only temperature is used for model validation as representative for any significant differences expected. The effect of moisture and wind is insignificant and substantial changes using different topography and land-use datasets is not registered.
4.1. HIGH RESOLUTION TOPOGRAPHY DATA ‒ EFFECT ON MODEL PREDICTION
Two model runs are carried out using 30 s or 1 s resolution topography datasets and Modis_15s land-use dataset. The effect of more accurate topography representation leads to variance mainly in heat fluxes, skin and near surface (at
95
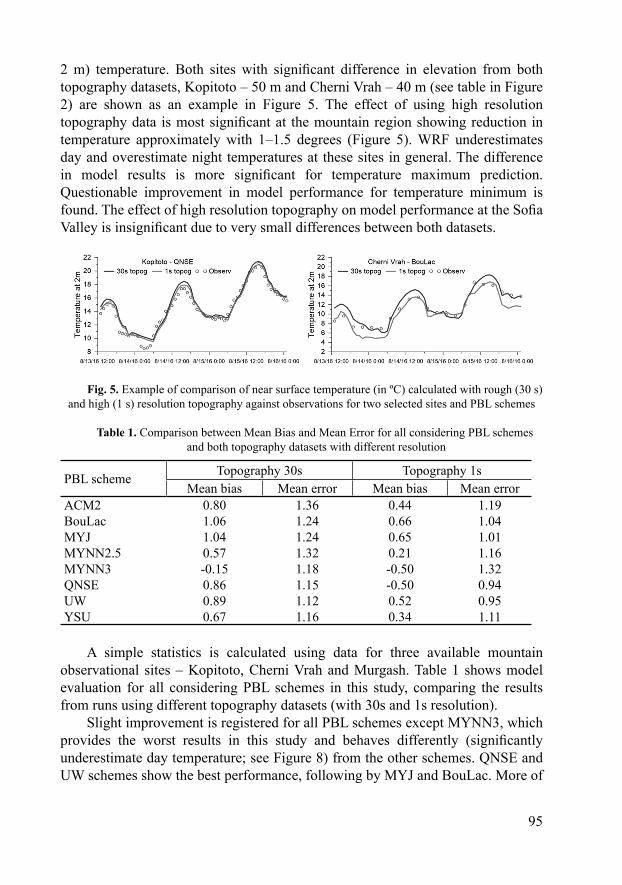
2 m) temperature. Both sites with significant difference in elevation from both topography datasets, Kopitoto ‒ 50 m and Cherni Vrah ‒ 40 m (see table in Figure 2) are shown as an example in Figure 5. The effect of using high resolution topography data is most significant at the mountain region showing reduction in temperature approximately with 1–1.5 degrees (Figure 5). WRF underestimates day and overestimate night temperatures at these sites in general. The difference in model results is more significant for temperature maximum prediction. Questionable improvement in model performance for temperature minimum is found. The effect of high resolution topography on model performance at the Sofia Valley is insignificant due to very small differences between both datasets.
Fig. 5. Example of comparison of near surface temperature (in ºC) calculated with rough (30 s) and high (1 s) resolution topography against observations for two selected sites and PBL schemes
Table 1. Comparison between Mean Bias and Mean Error for all considering PBL schemes and both topography datasets with different resolution
PBL scheme Topography 30s Topography 1sMean bias Mean error Mean bias Mean error
ACM2BouLacMYJMYNN2.5MYNN3QNSEUWYSU
0.801.061.040.57-0.150.860.890.67
1.361.241.241.321.181.151.121.16
0.440.660.650.21-0.50-0.500.520.34
1.191.041.011.161.320.940.951.11
A simple statistics is calculated using data for three available mountain observational sites – Kopitoto, Cherni Vrah and Murgash. Table 1 shows model evaluation for all considering PBL schemes in this study, comparing the results from runs using different topography datasets (with 30s and 1s resolution).
Slight improvement is registered for all PBL schemes except MYNN3, which provides the worst results in this study and behaves differently (significantly underestimate day temperature; see Figure 8) from the other schemes. QNSE and UW schemes show the best performance, following by MYJ and BouLac. More of
96
the PBL schemes demonstrate small positive mean bias (less than 0.7°C), two of them (MYNN3 and QNSE) negative (‒0.5°C). Mean error is approximately 1°C and show reduction of modelling errors for all schemes (except MYNN3) using new implemented in WRF topography.
4.2. HIGH RESOLUTION LAND-USE DATA ‒ EFFECT ON MODEL PREDICTION
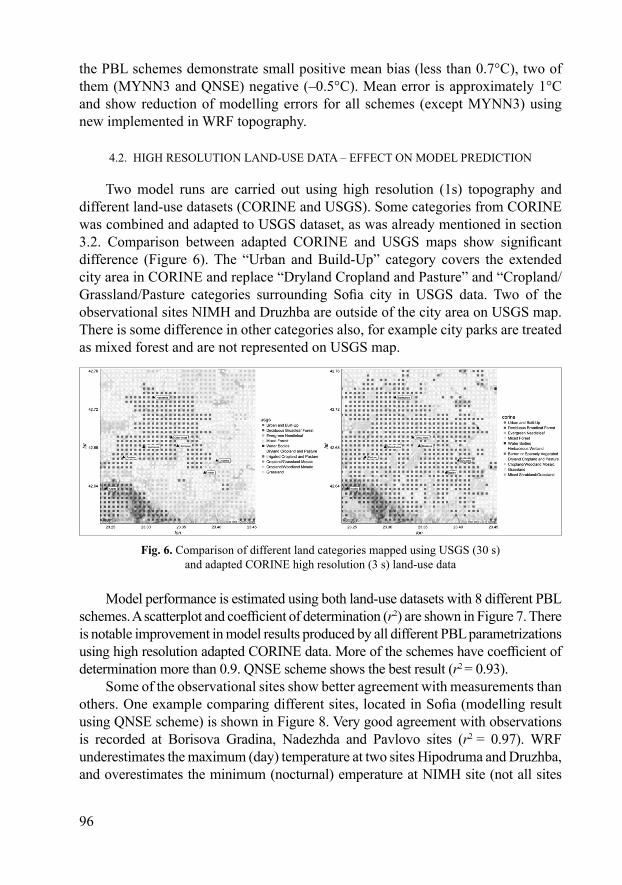
Two model runs are carried out using high resolution (1s) topography and different land-use datasets (CORINE and USGS). Some categories from CORINE was combined and adapted to USGS dataset, as was already mentioned in section 3.2. Comparison between adapted CORINE and USGS maps show significant difference (Figure 6). The “Urban and Build-Up” category covers the extended city area in CORINE and replace “Dryland Cropland and Pasture” and “Cropland/Grassland/Pasture categories surrounding Sofia city in USGS data. Two of the observational sites NIMH and Druzhba are outside of the city area on USGS map. There is some difference in other categories also, for example city parks are treated as mixed forest and are not represented on USGS map.
Fig. 6. Comparison of different land categories mapped using USGS (30 s) and adapted CORINE high resolution (3 s) land-use data
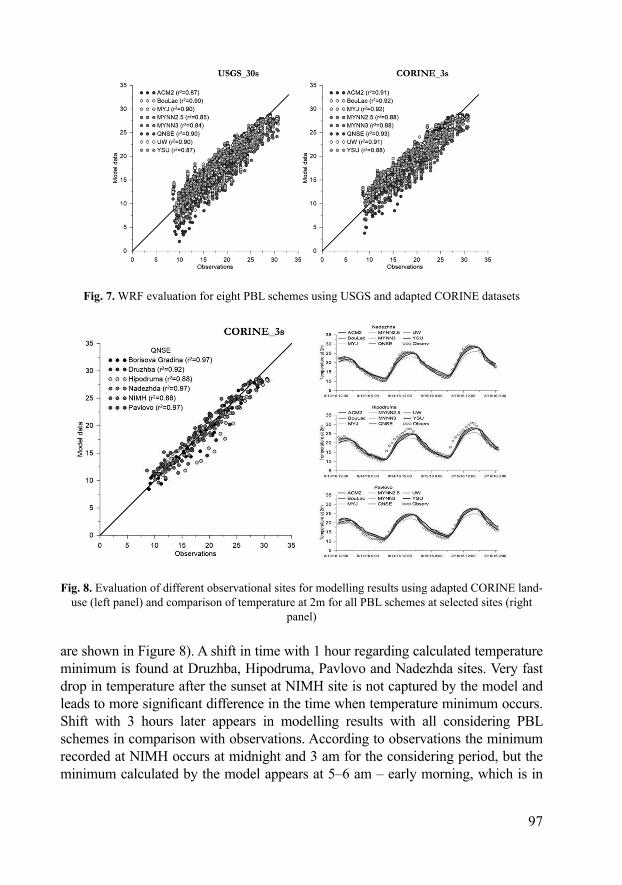
Model performance is estimated using both land-use datasets with 8 different PBL schemes. A scatterplot and coefficient of determination (r2) are shown in Figure 7. There is notable improvement in model results produced by all different PBL parametrizations using high resolution adapted CORINE data. More of the schemes have coefficient of determination more than 0.9. QNSE scheme shows the best result (r2 = 0.93).
Some of the observational sites show better agreement with measurements than others. One example comparing different sites, located in Sofi a (modelling result using QNSE scheme) is shown in Figure 8. Very good agreement with observations is recorded at Borisova Gradina, Nadezhda and Pavlovo sites (r2 = 0.97). WRF underestimates the maximum (day) temperature at two sites Hipodruma and Druzhba, and overestimates the minimum (nocturnal) emperature at NIMH site (not all sites
97
Fig. 7. WRF evaluation for eight PBL schemes using USGS and adapted CORINE datasets
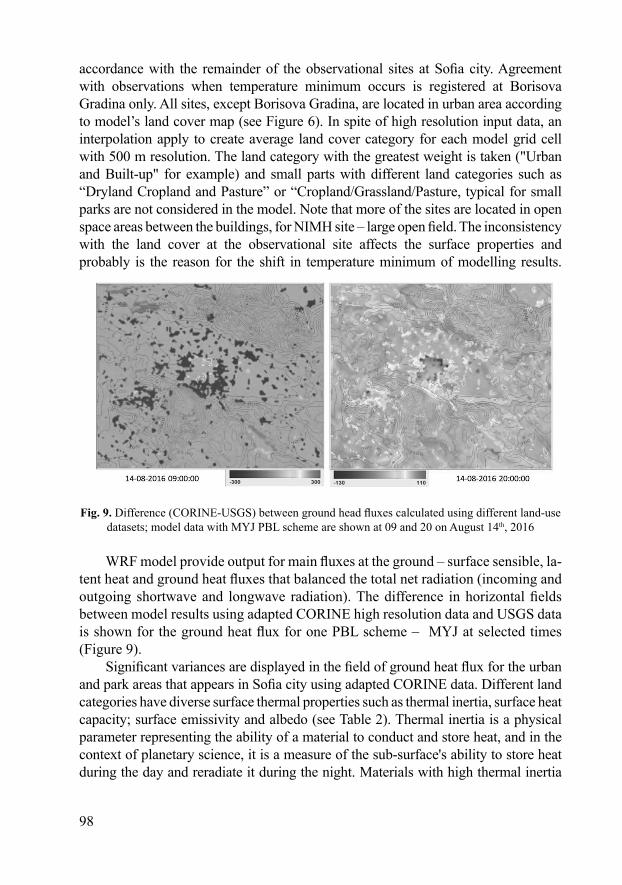
Fig. 8. Evaluation of different observational sites for modelling results using adapted CORINE land-use (left panel) and comparison of temperature at 2m for all PBL schemes at selected sites (right
panel)
are shown in Figure 8). A shift in time with 1 hour regarding calculated temperature minimum is found at Druzhba, Hipodruma, Pavlovo and Nadezhda sites. Very fast drop in temperature after the sunset at NIMH site is not captured by the model and leads to more signifi cant difference in the time when temperature minimum occurs. Shift with 3 hours later appears in modelling results with all considering PBL schemes in comparison with observations. According to observations the minimum recorded at NIMH occurs at midnight and 3 am for the considering period, but the minimum calculated by the model appears at 5‒6 am ‒ early morning, which is in
98
accordance with the remainder of the observational sites at Sofi a city. Agreement with observations when temperature minimum occurs is registered at Borisova Gradina only. All sites, except Borisova Gradina, are located in urban area according to model’s land cover map (see Figure 6). In spite of high resolution input data, an interpolation apply to create average land cover category for each model grid cell with 500 m resolution. The land category with the greatest weight is taken ("Urban and Built-up" for example) and small parts with different land categories such as “Dryland Cropland and Pasture” or “Cropland/Grassland/Pasture, typical for small parks are not considered in the model. Note that more of the sites are located in open space areas between the buildings, for NIMH site ‒ large open fi eld. The inconsistency with the land cover at the observational site affects the surface properties and probably is the reason for the shift in temperature minimum of modelling results.
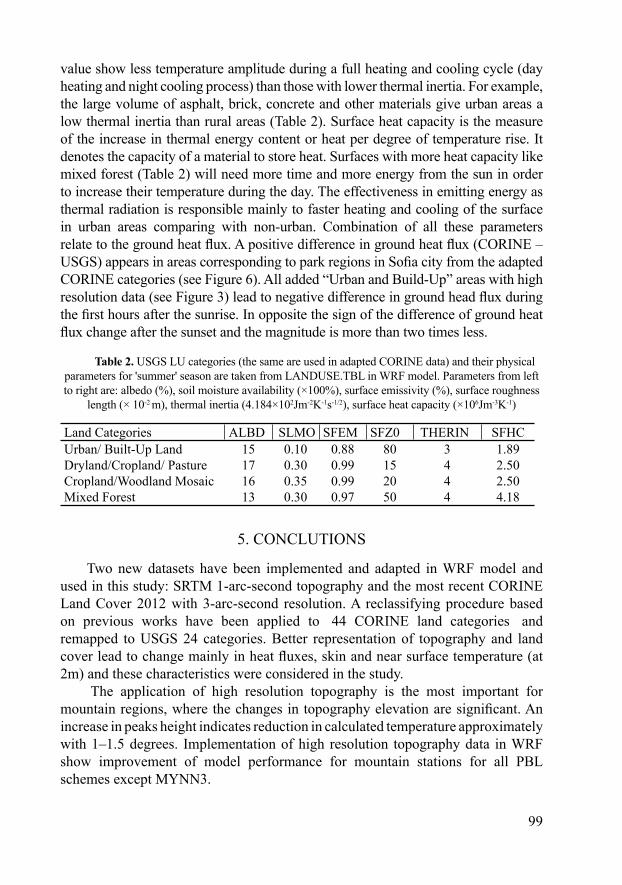
Fig. 9. Difference (CORINE-USGS) between ground head fl uxes calculated using different land-use datasets; model data with MYJ PBL scheme are shown at 09 and 20 on August 14th, 2016
WRF model provide output for main fluxes at the ground – surface sensible, la-tent heat and ground heat fluxes that balanced the total net radiation (incoming and outgoing shortwave and longwave radiation). The difference in horizontal fields between model results using adapted CORINE high resolution data and USGS data is shown for the ground heat flux for one PBL scheme ‒ MYJ at selected times (Figure 9).
Signifi cant variances are displayed in the fi eld of ground heat fl ux for the urban and park areas that appears in Sofi a city using adapted CORINE data. Different land categories have diverse surface thermal properties such as thermal inertia, surface heat capacity; surface emissivity and albedo (see Table 2). Thermal inertia is a physical parameter representing the ability of a material to conduct and store heat, and in the context of planetary science, it is a measure of the sub-surface's ability to store heat during the day and reradiate it during the night. Materials with high thermal inertia
99
value show less temperature amplitude during a full heating and cooling cycle (day heating and night cooling process) than those with lower thermal inertia. For example, the large volume of asphalt, brick, concrete and other materials give urban areas a low thermal inertia than rural areas (Table 2). Surface heat capacity is the measure of the increase in thermal energy content or heat per degree of temperature rise. It denotes the capacity of a material to store heat. Surfaces with more heat capacity like mixed forest (Table 2) will need more time and more energy from the sun in order to increase their temperature during the day. The effectiveness in emitting energy as thermal radiation is responsible mainly to faster heating and cooling of the surface in urban areas comparing with non-urban. Combination of all these parameters relate to the ground heat fl ux. A positive difference in ground heat fl ux (CORINE – USGS) appears in areas corresponding to park regions in Sofi a city from the adapted CORINE categories (see Figure 6). All added “Urban and Build-Up” areas with high resolution data (see Figure 3) lead to negative difference in ground head fl ux during the fi rst hours after the sunrise. In opposite the sign of the difference of ground heat fl ux change after the sunset and the magnitude is more than two times less.
Table 2. USGS LU categories (the same are used in adapted CORINE data) and their physical parameters for 'summer' season are taken from LANDUSE.TBL in WRF model. Parameters from left to right are: albedo (%), soil moisture availability (×100%), surface emissivity (%), surface roughness
length (× 10-2 m), thermal inertia (4.184×10²Jm-2K-1s-1/2), surface heat capacity (×106Jm-3K-1)
Land Categories ALBD SLMO SFEM SFZ0 THERIN SFHCUrban/ Built-Up LandDryland/Cropland/ PastureCropland/Woodland MosaicMixed Forest
15171613
0.100.300.350.30
0.880.990.990.97
80152050
3444
1.892.502.504.18
5. CONCLUTIONS
Two new datasets have been implemented and adapted in WRF model and used in this study: SRTM 1-arc-second topography and the most recent CORINE Land Cover 2012 with 3-arc-second resolution. A reclassifying procedure based on previous works have been applied to 44 CORINE land categories and remapped to USGS 24 categories. Better representation of topography and land cover lead to change mainly in heat fl uxes, skin and near surface temperature (at 2m) and these characteristics were considered in the study.
The application of high resolution topography is the most important for mountain regions, where the changes in topography elevation are significant. An increase in peaks height indicates reduction in calculated temperature approximately with 1–1.5 degrees. Implementation of high resolution topography data in WRF show improvement of model performance for mountain stations for all PBL schemes except MYNN3.
100
CORINE is the most recent dataset and ensures better description of actual urban areas than USGS dataset. High resolution of the new data allow to increase model’s horizontal grid resolution (500 m) and update the land cover to better represent surface characteristics that may have changed in recent years. There is notable improvement in model results produced by all different PBL parametrizations with coefficient of determination between 0.88 and 0.93. Very good agreement with observations is achieved at sites: Borisova Gradina, Nadezhda and Pavlovo sites (r2 = 0.97). WRF underestimates the maximum (day) temperature at two sites Hipodruma and Druzhba, and in contrary overestimates the minimum (night) temperature at NIMH site. Also a shift in calculated minimum temperature is found for all sites except Borisova Gradina. Different land categories have diverse surface thermal properties such as thermal inertia, surface heat capacity, surface emissivity and albedo. Inappropriate representation of land cover at specific sites can be the reason disagreement between the modelling result and observations.
A positive difference in ground heat flux (CORINE–USGS) appears in areas corresponding to park regions in Sofia city from the adapted CORINE categories. All added “Urban and Build-Up” areas with high resolution data lead to negative difference in ground head flux during the first hours after the sunrise. In opposite the sign of the difference of ground heat flux change after the sunset and the magnitude is more than two times less. Therefore using the appropriate dataset is necessary in efforts to improve numerical weather simulations and enhance weather forecasting capability.
Acknowledgements. This research is developed within the scope of the project DN4/7 (Study of the PBL structure and dynamics over complex terrain and urban area), funded by Research Fund at the Bulgarian Ministry of Education and Science.
REFERENCES[1] Defant, F. In: Compendium of Meteorology, T. M. Malone (Ed), Amer. Meteor. Soc. 1951,
655-672.[2] Holton, J. R. Tellus, 1966, 19, 199-205. [3] Vergeiner, I., E. Dreiseitl. Meteor. Atmos. Phys., 1987, 36, 264-286.[4] Egger, J. Amer. Meteor. Soc., Meteor. Monogr., 1990, 45, 43-57.[5] Whiteman, C. D. AMS Meteorological Monographs, 1990, 45, 23, 5-42.[6] Whiteman, C. D. Mountain meteorology: fundamentals and applications, New York, 2000.[7] Simpson, J. E. Gravity currents, Cambridge Univ Press, 2nd Edition, 1999.[8] Sturman, A. P., H. A. McGowan, R. A. Spronken-Smith. Progress Physical Geography,
1999, 23, 611-635.[9] Poulos, G. S., S. Zhong. Geography Compass, 2008, 2, 1-24.[10] Parish, T.R., L.D. Oolman. J. Atmos. Sci., 2010, 67, 2690–2699.[11] Fernando, H.J.S., E.R. Pardyjak. EOS, 2013, 94, 36.

101
[12] Fernando, H.J.S., E.R. Pardyjak, S. Di Sabatino, F.K. Chow, S.F.J. DeWekker, S.W. Hoch, J. Hacker, J.C. Pace, T. Pratt, Z. Pu, J.W Steenburgh., C.D. Whiteman, Y. Wang, D. Zajic, B. Balsley, R. Dimitrova, G.D. Emmitt, C.W. Higgins, J.C.R. Hunt, J.G. Knievel, D. Lawrence, Y. Liu, D.F. Nadeau, E. Kit, B.W. Blomquist, P. Conry, R.S. Coppersmith, E. Creegan, M. Felton, A. Grachev, N. Gunawardena, C. Hang, C.M. Hocut, G. Huynh, M.E. Jeglum, D. Jensen, V. Kulandaivelu, M. Lehner, L.S. Leo, D. Liberzon, J.D. Massey, K. McEnerney, S. Pal, T. Price, M. Sghiatti, Z. Silver, M. Thompson, H. Zhang, T. Zsedrovits. Bull. Amer. Meteorl. Soc., 2015, 96, 11, 1945-1967.
[13] Bodine, D., P. M. Klein, S. C. Arms, A. Shapiro, Appl. Meteor. Climatol., 2009, 48, 1117–1141.
[14] Dixit, P. N., D. Chen, Theor. Appl. Climatol., 2011, 103, 533–542.[15] United Nations, Department of Economic and Social Affairs, Population Division, “World
Urbanization Prospects: The 2014 Revision”, (ST/ESA/SER.A/366), 2015.[16] Changnon, S.A. Jr. Bull. Am. Meteorol. Soc., 1992, 73, 619–627.[17] Chen, F., J. Dudhia. Mon. Weather. Rev., 2001, 129, 569–585.[18] Lin, Y.L., R.D. Farley, H.D. Orville. J. Appl. Meteorol., 1983, 22, 1065-1092.[19] Mlawer, E.J., S.J. Taubman, P.D. Brown, M.J. Iacono, S.A. Clough. J. Geophys. Res.
Atmos., 1997, 102, 16, 663-16, 682.[20] Dudhia, J. J. Atmos. Sci., 1989, 46, 3077–3107.[21] Arakawa, A., and W. H. Schubert. J. Atmos. Sci., 1974, 31, 674-701.[22] Pleim, J.E. J. Appl. Meteorol. Clim., 2007, 46(9), 1383–1395.[23] Bougeault, P., P. Lacarrere. Mon. Weather Rev., 1989, 117(8), 1872-1890.[24] Janjic, Z. Mon. Weather Rev., 1990, 118, 1429-1443.[25] Nakanishi, M., H. Nino. Boundary-Layer Meteorol., 2006, 119, 397-407.[26] Sukoriansky, S., B. Galperin, V. Perov. Boundary-Layer Meteorol., 2005, 117(2), 231-257.[27] Bretherton, C.S., S. Park. Atmosphere Model. J. of Climate, 2009, 31(2), 3422-3448.[28] Hong, S., Y. Noh, J. Dudhia, Mon. Weather Rev., 2006, 134(9), 2318-2341.[29] Arnold, D., I. Schicker, P. Seibert. High-Resolution Atmospheric Modelling in Complex
Terrain for Future Climate Simulations (HiRmod), VSC Report, 2010.[30] Pineda, N., O. Jorba, J. Jorge, J.M. Baldasano. Int. J. Remote Sens., 2004, 25(1), 129-143.[31] Core Team. A language and environment for statistical computing. Foundation for
Statistical Computing, Vienna, Austria. 2013.