Introduction to Shipping, Offshore and Logistics / …...2012/03/29 · 1 Nordea Markets 16,100.51...
41
Introduction to Shipping, Offshore and Logistics / DNB London Branch Current Challenges in Ship Finance Markets Markets Presentation to Shippingforum 18 th Otb 2012 18 th October 2012 September 2012
Transcript of Introduction to Shipping, Offshore and Logistics / …...2012/03/29 · 1 Nordea Markets 16,100.51...
Introduction to Shipping, Offshore and Logistics / DNB London Branch
Current Challenges in Ship Finance MarketsMarkets
Presentation to Shippingforum18th O t b 201218th October 2012
September 2012
Content
Introduction / Welcome London Branch overview
Status of ship finance markets
Alternative sources of financingfinancing
2
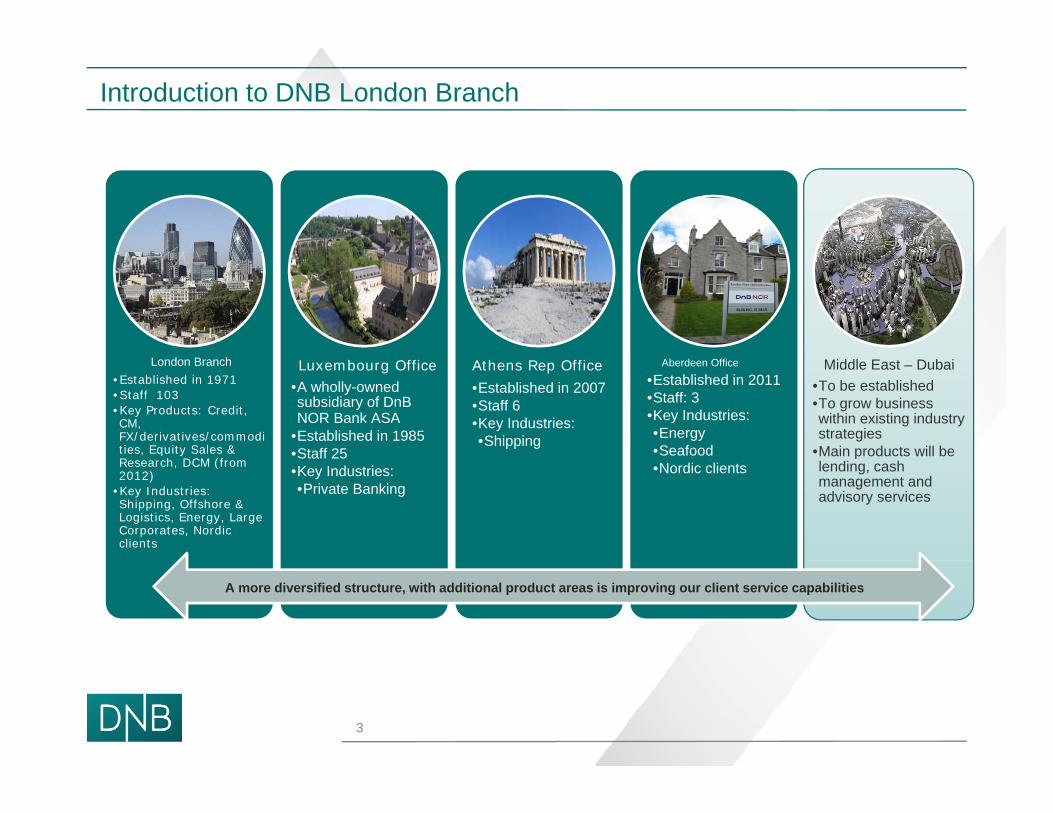
Introduction to DNB London Branch
London Branch•Established in 1971•Staff 103•Key Products: Credit, CM, FX/derivatives/commodities, Equity Sales & R h DCM (f
Luxembourg Office •A wholly-owned subsidiary of DnB NOR Bank ASA
•Established in 1985•Staff 25
Athens Rep Office •Established in 2007•Staff 6•Key Industries:•Shipping
Aberdeen Office
•Established in 2011•Staff: 3•Key Industries:•Energy•Seafood
Middle East – Dubai•To be established•To grow business within existing industry strategies
•Main products will be Research, DCM (from 2012)
•Key Industries: Shipping, Offshore & Logistics, Energy, Large Corporates, Nordic clients
Staff 25•Key Industries:•Private Banking
•Nordic clientsp
lending, cash management and advisory services
A more diversified structure, with additional product areas is improving our client service capabilities
3
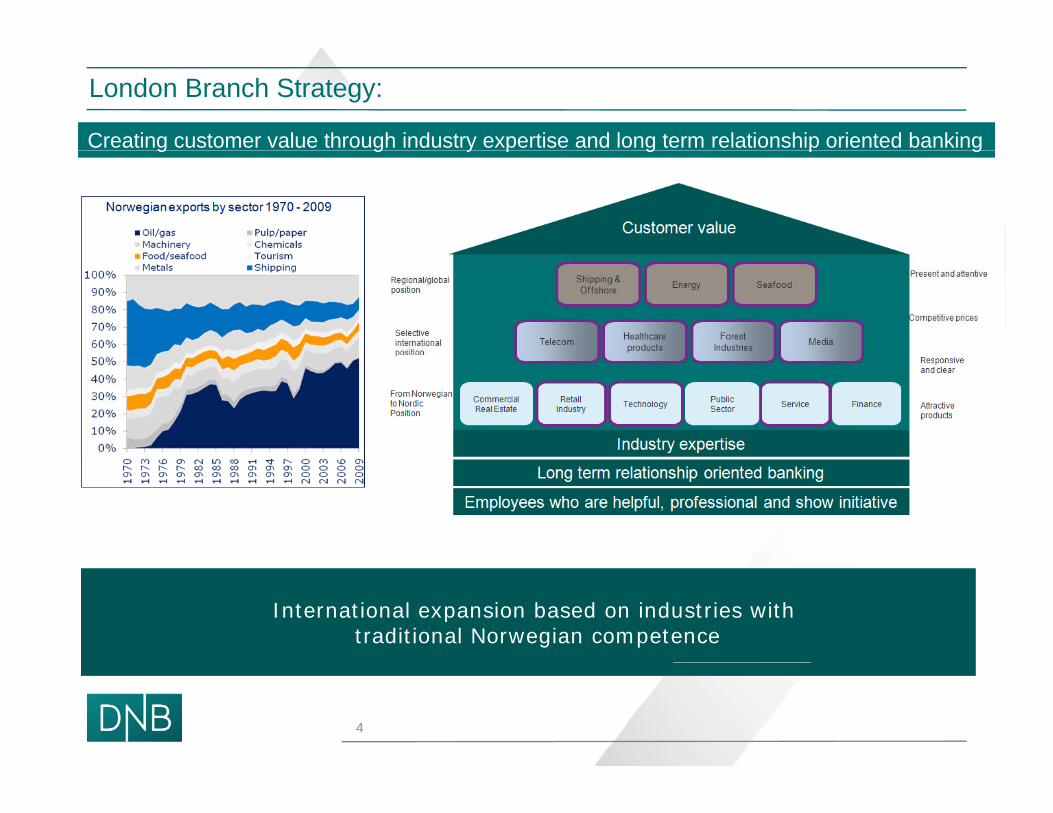
London Branch Strategy:
Creating customer value through industry expertise and long term relationship oriented bankingg g y p g p g
International expansion based on industries withtraditional Norwegian competence
4
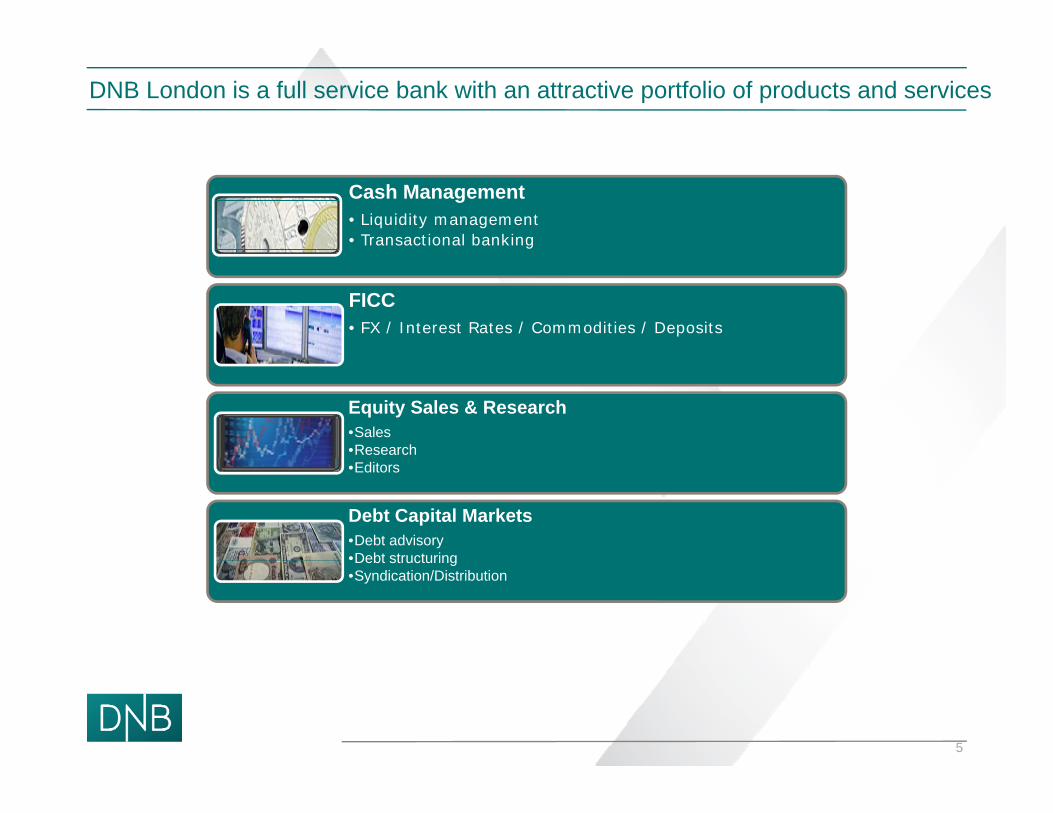
DNB London is a full service bank with an attractive portfolio of products and services
Cash Management• Liquidity management• Transactional banking
FICC• FX / Interest Rates / Commodities / Deposits
Equity Sales & Research•Sales•Research•Editors
Debt Capital Markets •Debt advisory•Debt structuringDebt structuring•Syndication/Distribution
5
Content
Introduction / Welcome London Branch overview
Status of ship finance markets
Alternative sources of financingfinancing
6
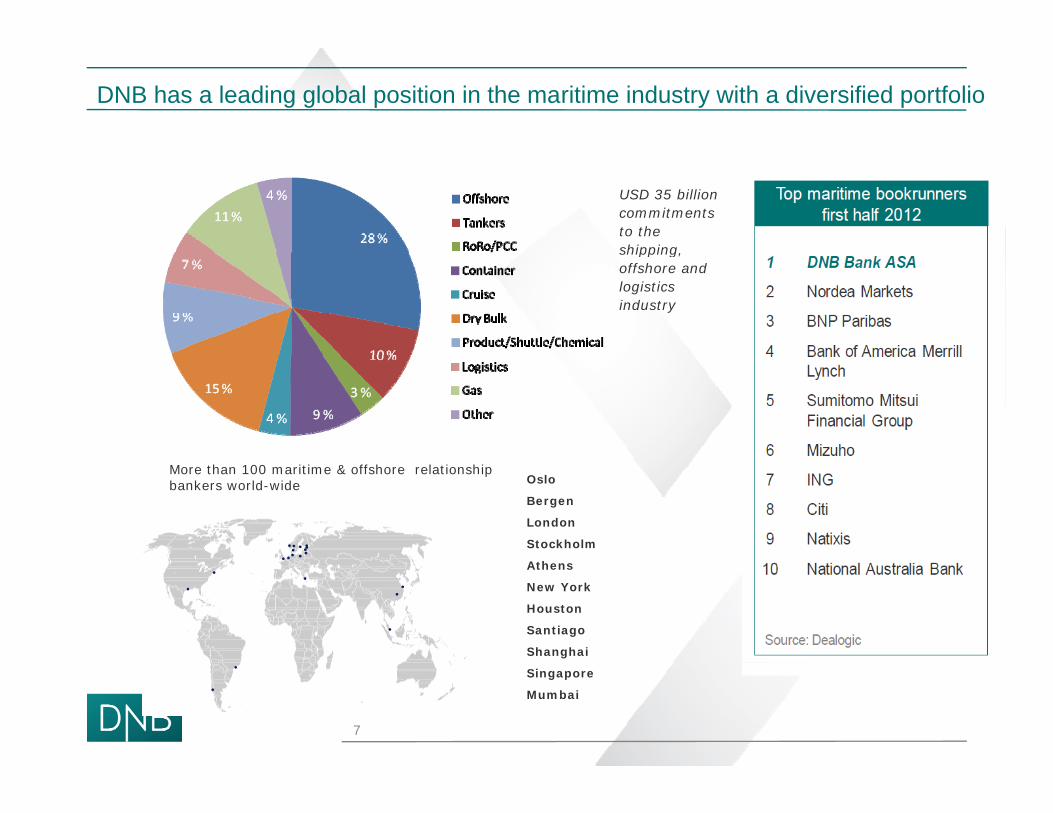
DNB has a leading global position in the maritime industry with a diversified portfolio
USD 35 billion commitments to the shipping, shipping, offshore and logistics industry
....... ............ .....
Oslo
Bergen
London
Stockholm
More than 100 maritime & offshore relationship bankers world-wide
.. ...
. .. ...
.Athens
New York
Houston
Santiago
Shanghai
..
..
Singapore
Mumbai
7
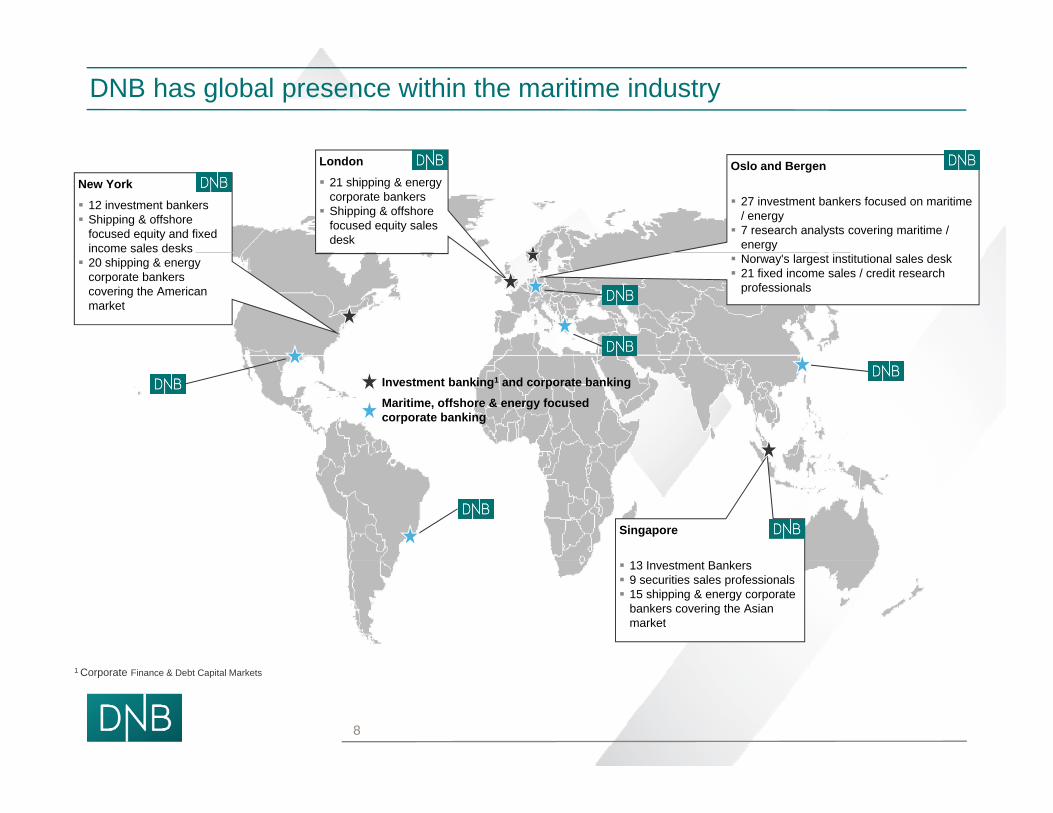
DNB has global presence within the maritime industry
London
21 shipping & energy corporate bankers Shipping & offshore
focused equity sales desk
Oslo and Bergen
27 investment bankers focused on maritime / energy 7 research analysts covering maritime /
energy
New York
12 investment bankers Shipping & offshore
focused equity and fixed income sales desks
Norway's largest institutional sales desk 21 fixed income sales / credit research
professionals
20 shipping & energy corporate bankers covering the American market
Investment banking1 and corporate bankingMaritime, offshore & energy focusedcorporate banking
Singapore
13 Investment Bankers 9 securities sales professionals 15 shipping & energy corporate
bankers covering the Asian market
8
1 Corporate Finance & Debt Capital Markets
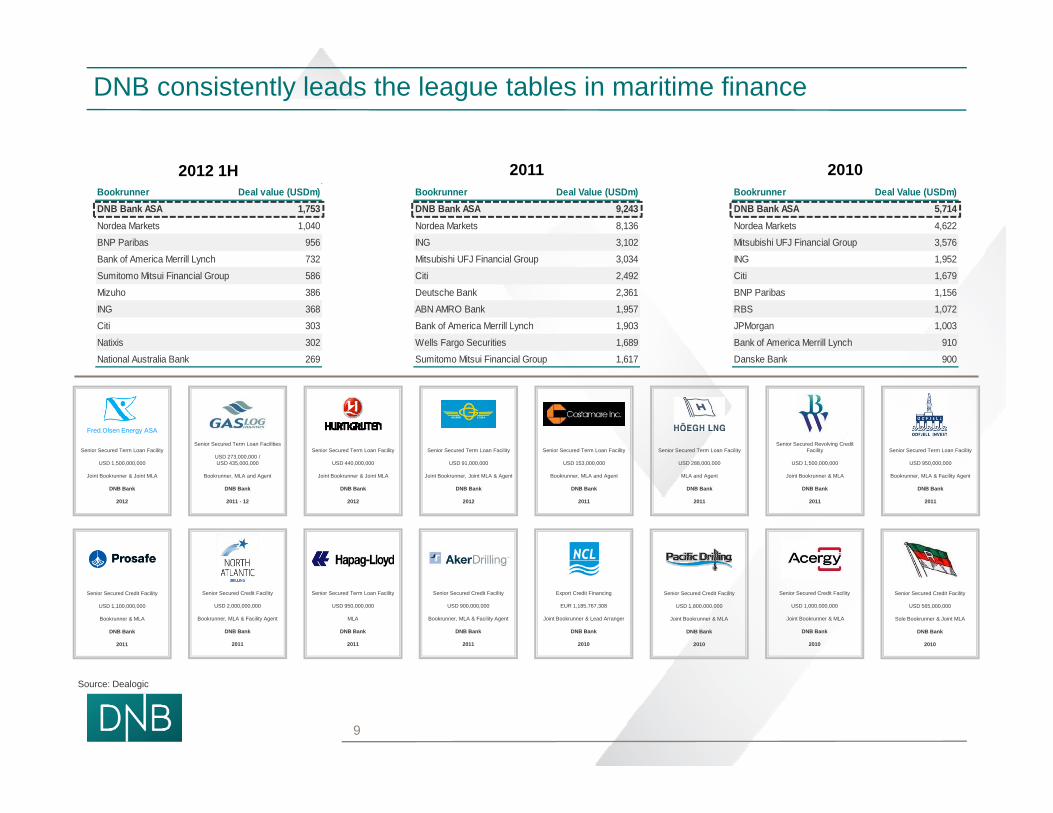
DNB consistently leads the league tables in maritime finance
2012 1H 2011 2010Bookrunner Deal value (USDm)DNB Bank ASA 1,753Nordea Markets 1,040BNP Paribas 956
Bookrunner Deal Value (USDm)DNB Bank ASA 9,243Nordea Markets 8,136ING 3,102
Bookrunner Deal Value (USDm)DNB Bank ASA 5,714Nordea Markets 4,622Mitsubishi UFJ Financial Group 3,576
Bank of America Merrill Lynch 732
Sumitomo Mitsui Financial Group 586
Mizuho 386
ING 368
Citi 303
Natixis 302
N i l A li B k 269
Mitsubishi UFJ Financial Group 3,034
Citi 2,492
Deutsche Bank 2,361
ABN AMRO Bank 1,957
Bank of America Merrill Lynch 1,903
Wells Fargo Securities 1,689
S i Mi i Fi i l G 1 617
ING 1,952
Citi 1,679
BNP Paribas 1,156
RBS 1,072
JPMorgan 1,003
Bank of America Merrill Lynch 910
D k B k 900
Senior Secured Revolving Credit Facility Senior Secured Term Loan FacilitySenior Secured Term Loan Facility
Senior Secured Term Loan Facilities
USD 273,000,000 /Senior Secured Term Loan Facility
Fred.Olsen Energy ASA
Senior Secured Term Loan Facility Senior Secured Term Loan Facility Senior Secured Term Loan Facility
National Australia Bank 269 Sumitomo Mitsui Financial Group 1,617 Danske Bank 900
USD 1,500,000,000
Joint Bookrunner & MLA
DNB Bank
2011
USD 950,000,000
Bookrunner, MLA & Facility Agent
DNB Bank
2011
USD 153,000,000
Bookrunner, MLA and Agent
DNB Bank
2011
USD 273,000,000 / USD 435,000,000
Bookrunner, MLA and Agent
DNB Bank
2011 - 12
USD 288,000,000
MLA and Agent
DNB Bank
2011
USD 1,500,000,000
Joint Bookrunner & Joint MLA
DNB Bank
2012
USD 440,000,000
Joint Bookrunner & Joint MLA
DNB Bank
2012
USD 91,000,000
Joint Bookrunner, Joint MLA & Agent
DNB Bank
2012
Export Credit Financing
EUR 1,185,767,308
Joint Bookrunner & Lead Arranger
DNB Bank
2010
Senior Secured Credit Facility
USD 1,800,000,000
Joint Bookrunner & MLA
DNB Bank
2010
Senior Secured Credit Facility
USD 1,000,000,000
Joint Bookrunner & MLA
DNB Bank
2010
Senior Secured Credit Facility
USD 565,000,000
Sole Bookrunner & Joint MLA
DNB Bank
2010
Senior Secured Credit Facility
USD 900,000,000
Bookrunner, MLA & Facility Agent
DNB Bank
2011
Senior Secured Credit Facility
USD 1,100,000,000
Bookrunner & MLA
DNB Bank
2011
Senior Secured Credit Facility
USD 2,000,000,000
Bookrunner, MLA & Facility Agent
DNB Bank
2011
Senior Secured Term Loan Facility
USD 950,000,000
MLA
DNB Bank
2011
9
Source: Dealogic
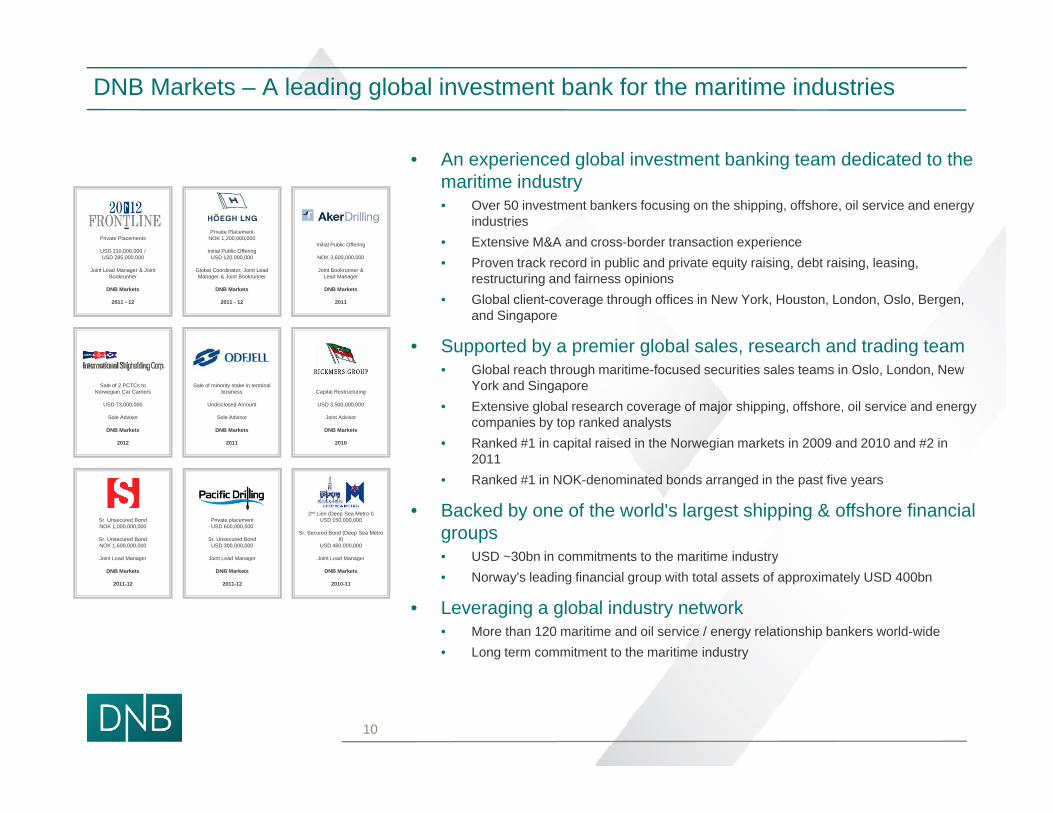
DNB Markets – A leading global investment bank for the maritime industries
• An experienced global investment banking team dedicated to the maritime industry• Over 50 investment bankers focusing on the shipping, offshore, oil service and energy
industries• Extensive M&A and cross-border transaction experienceInitial Public Offering
Private PlacementNOK 1,200,000,000
Initial Public Offering
Private Placements
USD 210,000,000 /
• Proven track record in public and private equity raising, debt raising, leasing, restructuring and fairness opinions
• Global client-coverage through offices in New York, Houston, London, Oslo, Bergen, and Singapore
• Supported by a premier global sales, research and trading team
NOK 3,600,000,000
Joint Bookrunner & Lead Manager
DNB Markets
2011
gUSD 120,000,000
Global Coordinator, Joint Lead Manager & Joint Bookrunner
DNB Markets
2011 - 12
, ,USD 285,000,000
Joint Lead Manager & Joint Bookrunner
DNB Markets
2011 - 12
pp y p g g• Global reach through maritime-focused securities sales teams in Oslo, London, New
York and Singapore• Extensive global research coverage of major shipping, offshore, oil service and energy
companies by top ranked analysts• Ranked #1 in capital raised in the Norwegian markets in 2009 and 2010 and #2 in
2011
Sale of minority stake in terminal business
Undisclosed Amount
Sole Advisor
DNB Markets
2011
Capital Restructuring
USD 3,500,000,000
Joint Advisor
DNB Markets
2010
Sale of 2 PCTCs toNorwegian Car Carriers
USD 73,000,000
Sole Advisor
DNB Markets
2012
2011 • Ranked #1 in NOK-denominated bonds arranged in the past five years
• Backed by one of the world's largest shipping & offshore financial groups• USD ~30bn in commitments to the maritime industry
Sr. Unsecured BondNOK 1,000,000,000
Sr. Unsecured BondNOK 1,600,000,000
Joint Lead Manager
2nd Lien (Deep Sea Metro I)USD 150,000,000
Sr. Secured Bond (Deep Sea Metro II)
USD 460,000,000
Joint Lead Manager
Private placementUSD 600,000,000
Sr. Unsecured BondUSD 300,000,000
Joint Lead Manager USD 30bn in commitments to the maritime industry• Norway's leading financial group with total assets of approximately USD 400bn
• Leveraging a global industry network • More than 120 maritime and oil service / energy relationship bankers world-wide• Long term commitment to the maritime industry
g
DNB Markets
2011-12
g
DNB Markets
2010-11
g
DNB Markets
2011-12
10
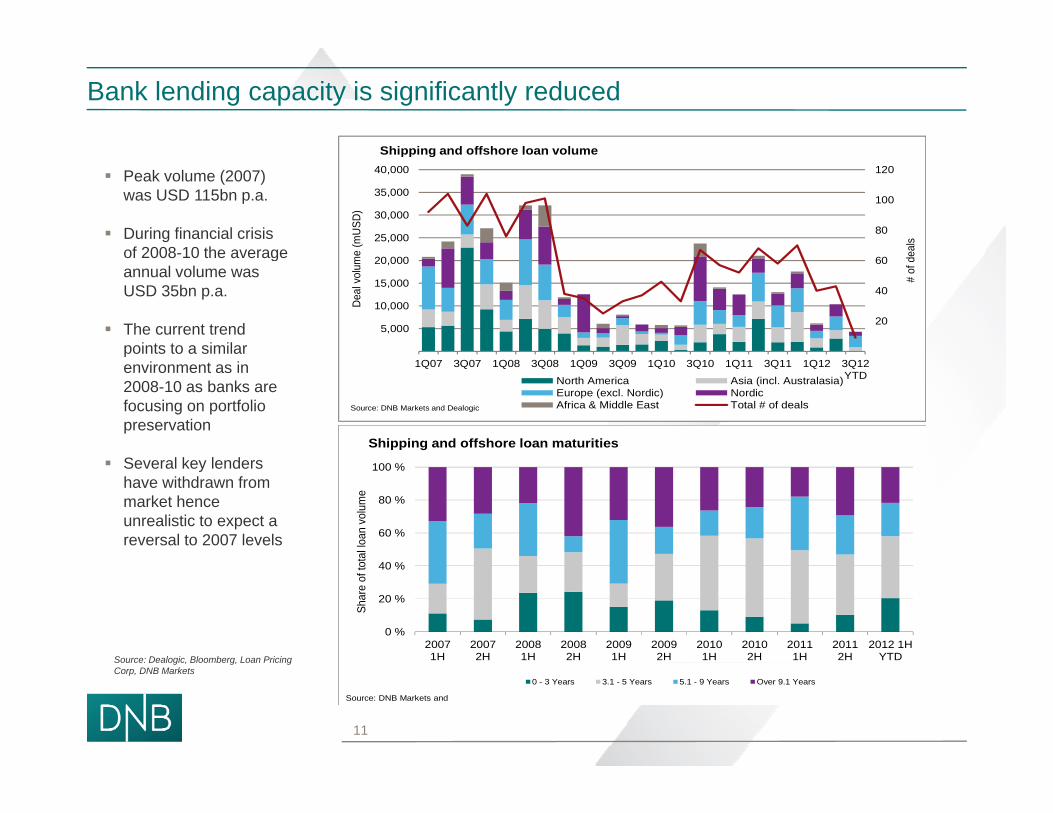
Bank lending capacity is significantly reduced
Shipping and offshore loan volume
Peak volume (2007) was USD 115bn p.a.
During financial crisis of 2008 10 the average
80
100
120
25,000
30,000
35,000
40,000
eals
e (m
USD)
Shipping and offshore loan volume
of 2008-10 the average annual volume was USD 35bn p.a.
The current trend points to a similar
20
40
60
5,000
10,000
15,000
20,000
# of
de
Deal
vol
ume
penvironment as in 2008-10 as banks are focusing on portfolio preservation
S l k l d
1Q07 3Q07 1Q08 3Q08 1Q09 3Q09 1Q10 3Q10 1Q11 3Q11 1Q12 3Q12YTDNorth America Asia (incl. Australasia)
Europe (excl. Nordic) NordicAfrica & Middle East Total # of dealsSource: DNB Markets and Dealogic
Shipping and offshore loan maturities Several key lenders
have withdrawn from market hence unrealistic to expect a reversal to 2007 levels 60 %
80 %
100 %
tal lo
an v
olum
e
Source: Dealogic, Bloomberg, Loan Pricing
0 %
20 %
40 %
20071H
20072H
20081H
20082H
20091H
20092H
20101H
20102H
20111H
20112H
2012 1HYTD
Shar
e of
tot
g , g, gCorp, DNB Markets
0 - 3 Years 3.1 - 5 Years 5.1 - 9 Years Over 9.1 Years
Source: DNB Markets and
11
Challenges in the syndicated loans market
Due to balance sheet constraints (e g Basel III) banks are faced with a more strict• Due to balance sheet constraints (e.g. Basel III) banks are faced with a more strict prioritization when allocating capital and will in general look for the following:• Large corporate clients with strong balance sheets • Sizeable non-lending income potential
S ( G ff )• Segments with a positive market outlook (e.g. LNG and offshore)• Contracted cash flow
• Banks are looking to diversify their portfolios and following several years with strong f d b lk d t k th i l tit f th tfocus on dry bulk and tankers, there is less appetite for these segments• Banks show relatively strong interest in LNG and offshore transactions
• Is your financing requirement larger than the lending capacity of your existing bank ?group?
• Banks are in general very reluctant to take on new relationships• ECAs will play an important role in bridging the gap between available bank financing and
newbuilding cap-ex requirements
• Several traditional shipping and offshore banks are reducing their loan portfolios• Opportunistic approach from non-relationship driven banks in the secondary market
12
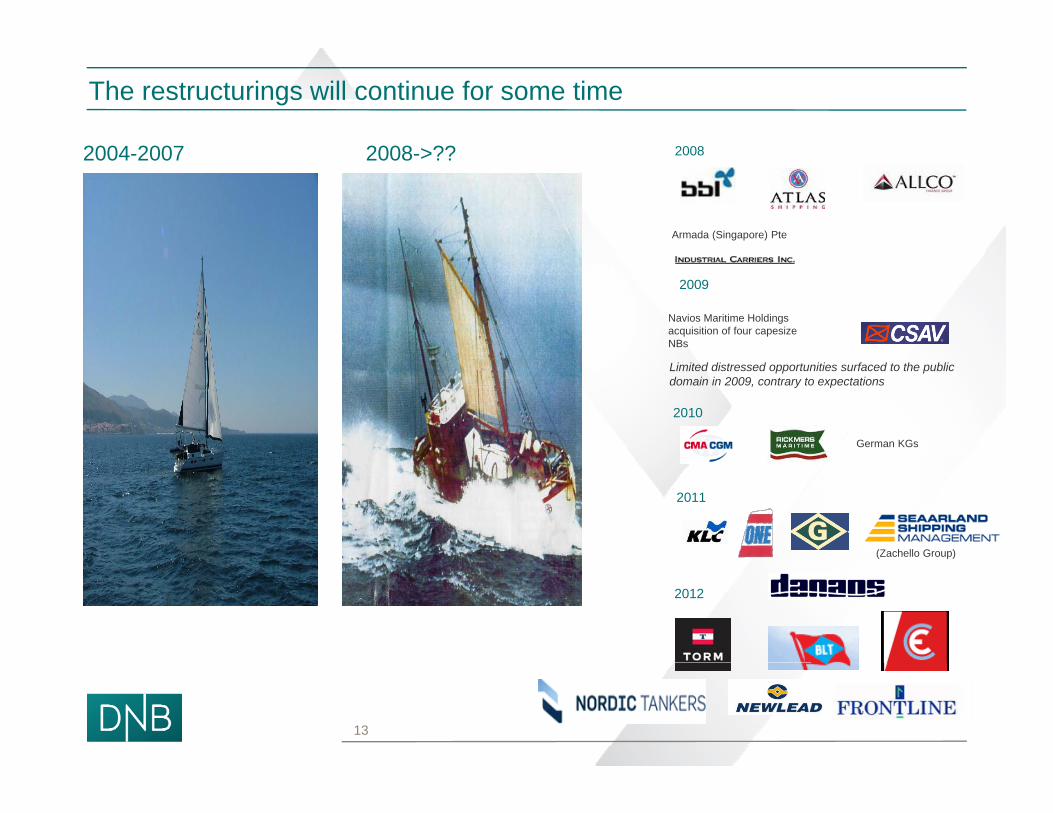
The restructurings will continue for some time
2008 >??2004 2007 20082008->??2004-2007
Armada (Singapore) Pte
2008
2009
Navios Maritime Holdings acquisition of four capesize NBs
Limited distressed opportunities surfaced to the public domain in 2009, contrary to expectations
German KGs
2010
2011
(Zachello Group)
2012
13
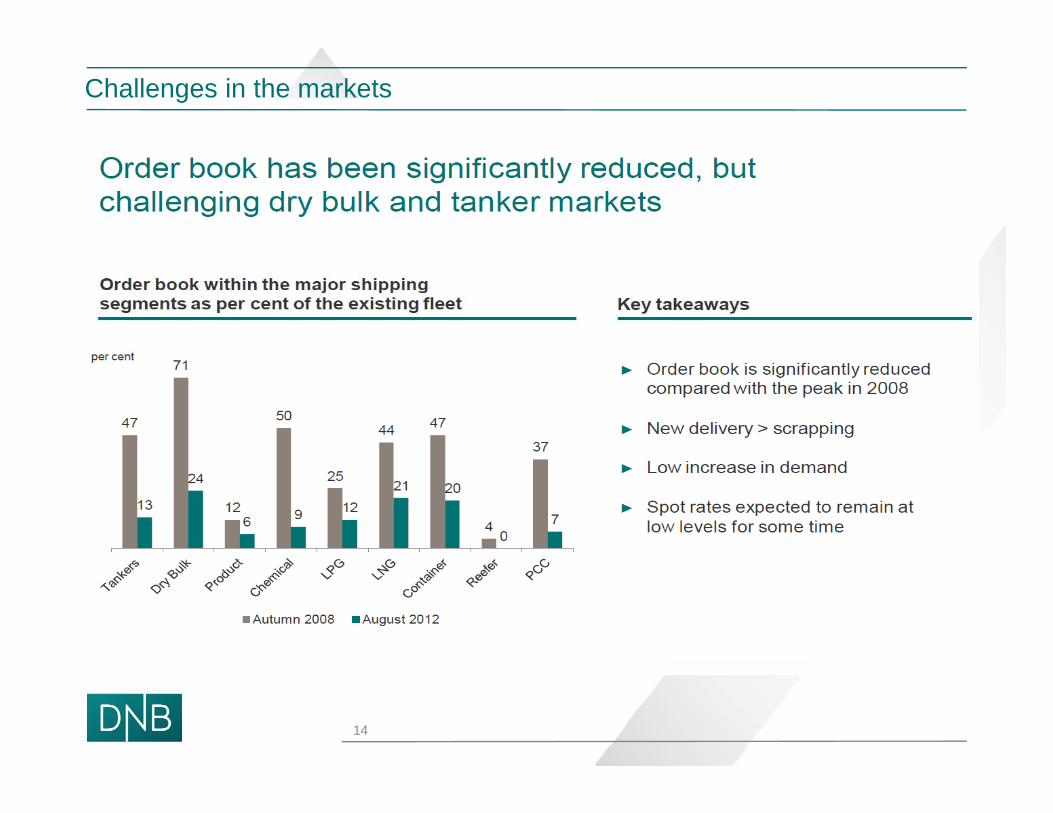
Challenges in the markets
14
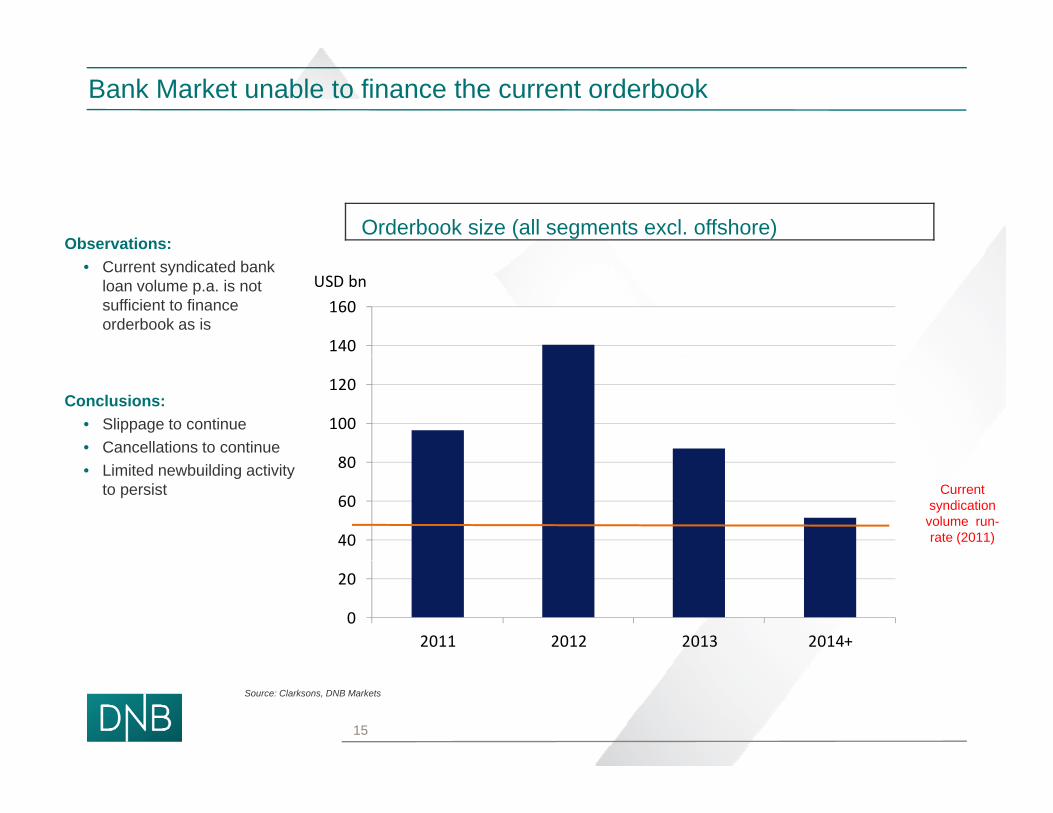
Bank Market unable to finance the current orderbook
Observations:Orderbook size (all segments excl. offshore)
• Current syndicated bank loan volume p.a. is not sufficient to finance orderbook as is
140
160USD bn
Conclusions:• Slippage to continue• Cancellations to continue
80
100
120
• Limited newbuilding activity to persist
40
60
80Current
syndication volume run-rate (2011)
0
20
2011 2012 2013 2014+
Source: Clarksons, DNB Markets
15
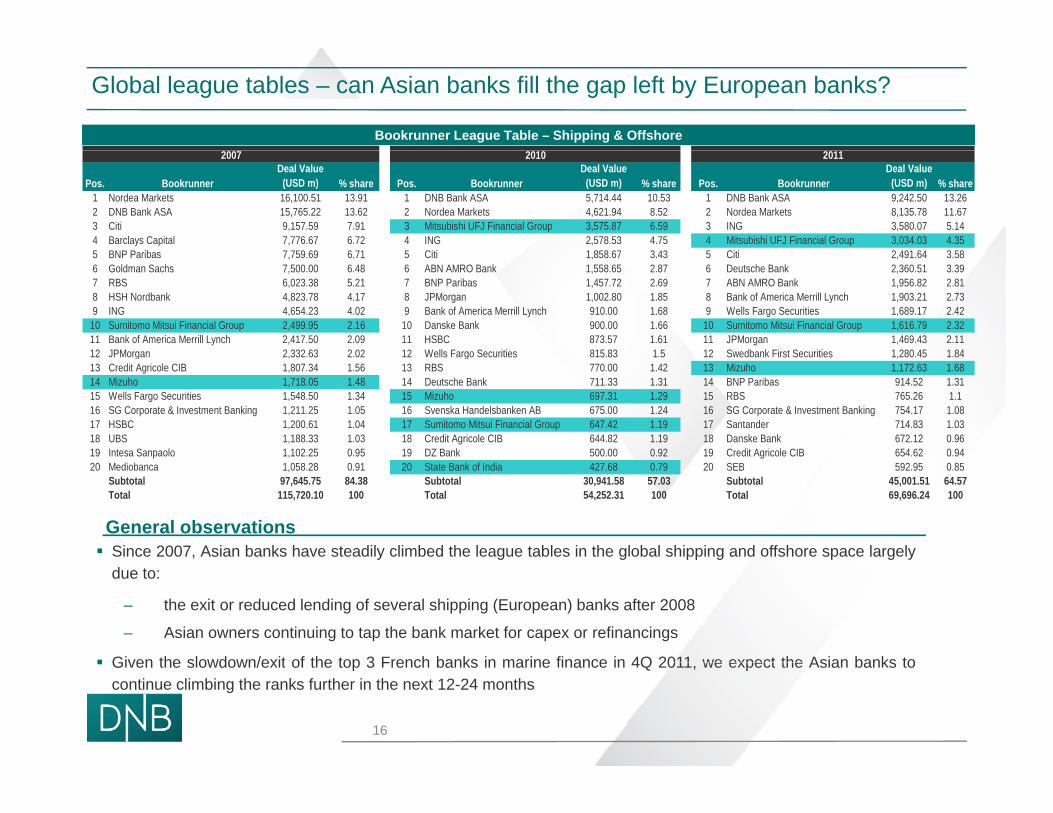
Global league tables – can Asian banks fill the gap left by European banks?
Bookrunner League Table – Shipping & Offshore
Pos. BookrunnerDeal Value
(USD m) % share Pos. BookrunnerDeal Value
(USD m) % share Pos. BookrunnerDeal Value
(USD m) % share1 Nordea Markets 16,100.51 13.91 1 DNB Bank ASA 5,714.44 10.53 1 DNB Bank ASA 9,242.50 13.262 DNB Bank ASA 15,765.22 13.62 2 Nordea Markets 4,621.94 8.52 2 Nordea Markets 8,135.78 11.673 Citi 9,157.59 7.91 3 Mitsubishi UFJ Financial Group 3,575.87 6.59 3 ING 3,580.07 5.144 Barclays Capital 7,776.67 6.72 4 ING 2,578.53 4.75 4 Mitsubishi UFJ Financial Group 3,034.03 4.355 BNP Paribas 7 759 69 6 71 5 Citi 1 858 67 3 43 5 Citi 2 491 64 3 58
2010 20112007
5 BNP Paribas 7,759.69 6.71 5 Citi 1,858.67 3.43 5 Citi 2,491.64 3.586 Goldman Sachs 7,500.00 6.48 6 ABN AMRO Bank 1,558.65 2.87 6 Deutsche Bank 2,360.51 3.397 RBS 6,023.38 5.21 7 BNP Paribas 1,457.72 2.69 7 ABN AMRO Bank 1,956.82 2.818 HSH Nordbank 4,823.78 4.17 8 JPMorgan 1,002.80 1.85 8 Bank of America Merrill Lynch 1,903.21 2.739 ING 4,654.23 4.02 9 Bank of America Merrill Lynch 910.00 1.68 9 Wells Fargo Securities 1,689.17 2.42
10 Sumitomo Mitsui Financial Group 2,499.95 2.16 10 Danske Bank 900.00 1.66 10 Sumitomo Mitsui Financial Group 1,616.79 2.3211 Bank of America Merrill Lynch 2,417.50 2.09 11 HSBC 873.57 1.61 11 JPMorgan 1,469.43 2.1112 JPMorgan 2 332 63 2 02 12 Wells Fargo Securities 815 83 1 5 12 Swedbank First Securities 1 280 45 1 8412 JPMorgan 2,332.63 2.02 12 Wells Fargo Securities 815.83 1.5 12 Swedbank First Securities 1,280.45 1.8413 Credit Agricole CIB 1,807.34 1.56 13 RBS 770.00 1.42 13 Mizuho 1,172.63 1.6814 Mizuho 1,718.05 1.48 14 Deutsche Bank 711.33 1.31 14 BNP Paribas 914.52 1.3115 Wells Fargo Securities 1,548.50 1.34 15 Mizuho 697.31 1.29 15 RBS 765.26 1.116 SG Corporate & Investment Banking 1,211.25 1.05 16 Svenska Handelsbanken AB 675.00 1.24 16 SG Corporate & Investment Banking 754.17 1.0817 HSBC 1,200.61 1.04 17 Sumitomo Mitsui Financial Group 647.42 1.19 17 Santander 714.83 1.0318 UBS 1,188.33 1.03 18 Credit Agricole CIB 644.82 1.19 18 Danske Bank 672.12 0.9619 Intesa Sanpaolo 1,102.25 0.95 19 DZ Bank 500.00 0.92 19 Credit Agricole CIB 654.62 0.94p g20 Mediobanca 1,058.28 0.91 20 State Bank of India 427.68 0.79 20 SEB 592.95 0.85
Subtotal 97,645.75 84.38 Subtotal 30,941.58 57.03 Subtotal 45,001.51 64.57Total 115,720.10 100 Total 54,252.31 100 Total 69,696.24 100
General observations Since 2007, Asian banks have steadily climbed the league tables in the global shipping and offshore space largely
due to:
– the exit or reduced lending of several shipping (European) banks after 2008
– Asian owners continuing to tap the bank market for capex or refinancings
Given the slowdown/exit of the top 3 French banks in marine finance in 4Q 2011 we expect the Asian banks to
16
Given the slowdown/exit of the top 3 French banks in marine finance in 4Q 2011, we expect the Asian banks tocontinue climbing the ranks further in the next 12-24 months
Content
Introduction / Welcome London Branch overview
Status of ship finance markets
Alternative sources of financingfinancing
17
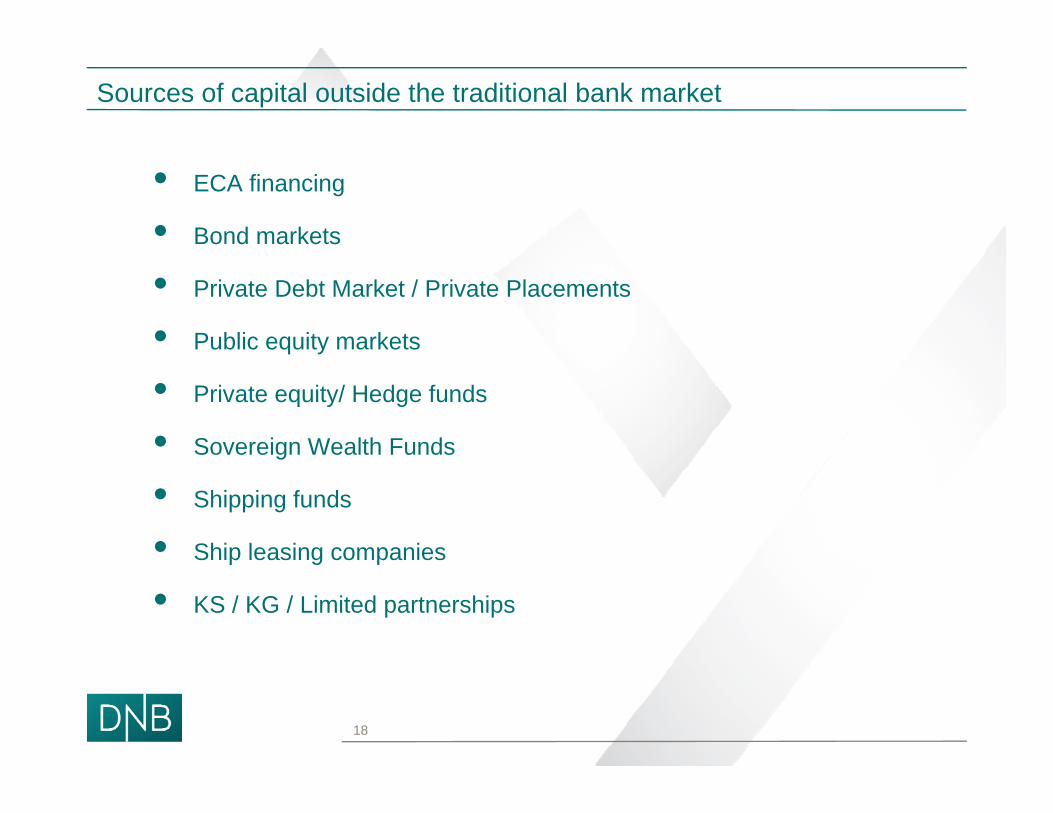
Sources of capital outside the traditional bank market
• ECA financing
• Bond markets
• Private Debt Market / Private Placements
• Public equity markets
• Private equity/ Hedge funds
• Sovereign Wealth Fundsg
• Shipping funds
• Ship leasing companies p g p
• KS / KG / Limited partnerships
18
19
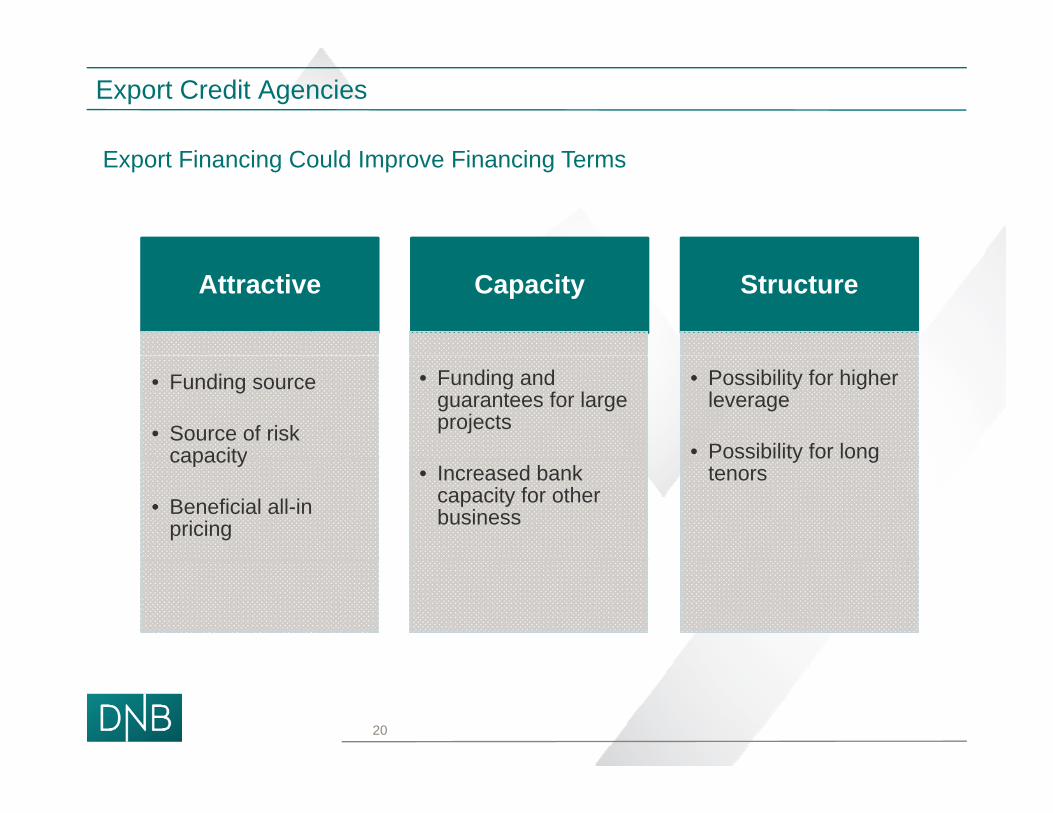
Export Credit Agencies
E Fi i C ld I Fi i TExport Financing Could Improve Financing Terms
Attractive Capacity Structure
• Funding source
• Source of risk capacity
• Funding and guarantees for large projects
• Possibility for higherleverage
• Possibility for longcapacity
• Beneficial all-inpricing
• Increased bank capacity for otherbusiness
Possibility for longtenors
20
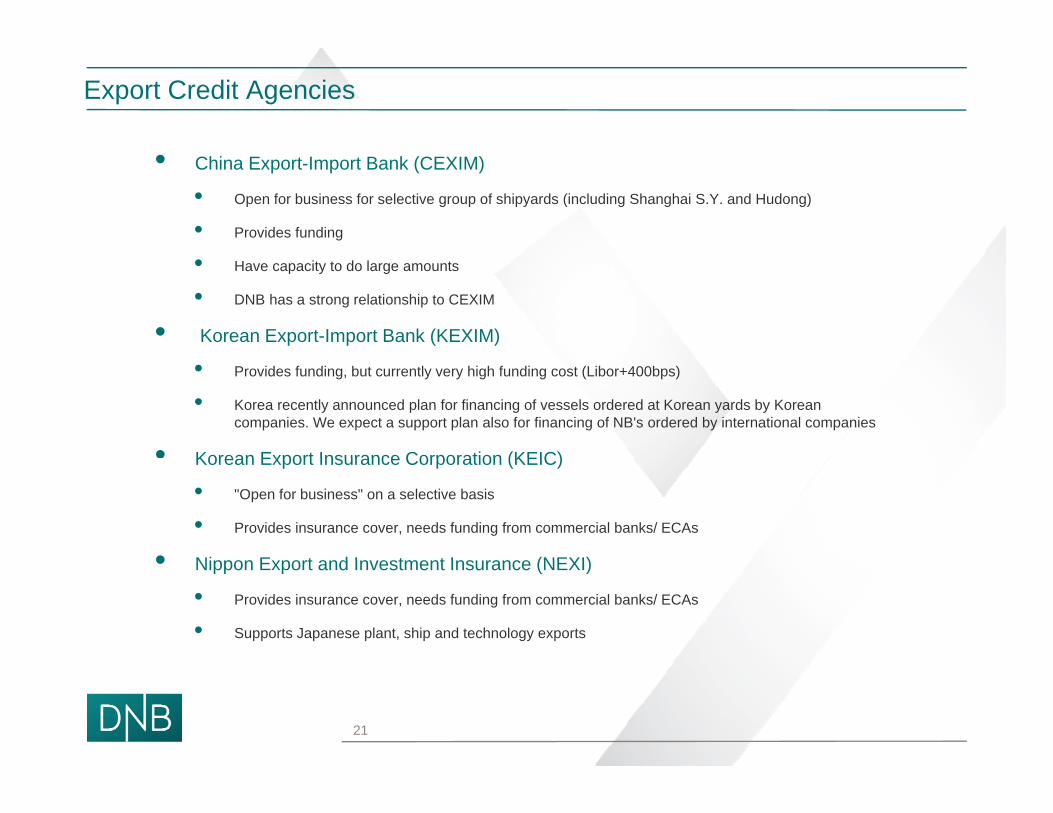
Export Credit Agencies
• China Export-Import Bank (CEXIM)
• Open for business for selective group of shipyards (including Shanghai S.Y. and Hudong)
• Provides funding
• Have capacity to do large amounts
• DNB has a strong relationship to CEXIM
• Korean Export-Import Bank (KEXIM)
• Provides funding, but currently very high funding cost (Libor+400bps)
• Korea recently announced plan for financing of vessels ordered at Korean yards by Korean companies. We expect a support plan also for financing of NB's ordered by international companies
• Korean Export Insurance Corporation (KEIC)Korean Export Insurance Corporation (KEIC)
• "Open for business" on a selective basis
• Provides insurance cover, needs funding from commercial banks/ ECAs
• Nippon Export and Investment Insurance (NEXI)• Nippon Export and Investment Insurance (NEXI)
• Provides insurance cover, needs funding from commercial banks/ ECAs
• Supports Japanese plant, ship and technology exports
21
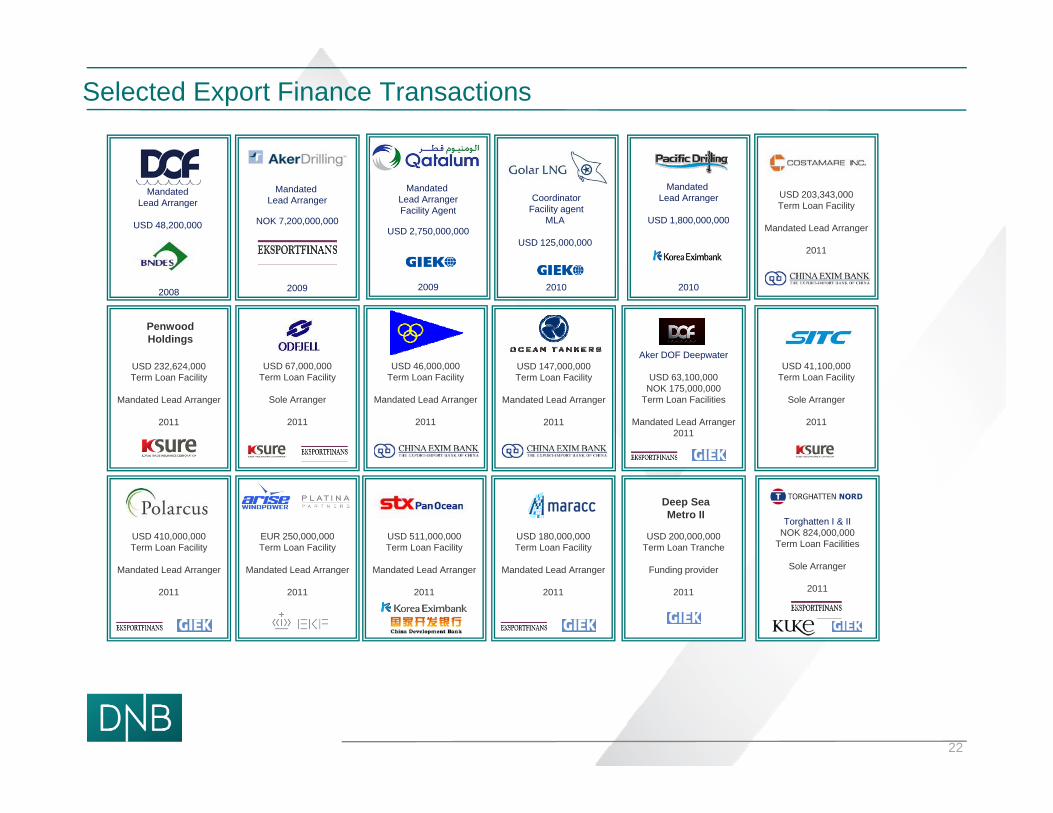
Selected Export Finance Transactions
Mandated Lead Arranger
USD 48,200,000
CoordinatorFacility agent
MLA
USD 125,000,000
Mandated Lead ArrangerFacility Agent
USD 2,750,000,000
Mandated Lead Arranger
USD 1,800,000,000
Mandated Lead Arranger
NOK 7,200,000,000
USD 203,343,000Term Loan Facility
Mandated Lead Arranger
2011
Penwood Holdings
Aker DOF Deepwater
2008 20102009 20102009
2011
USD 46,000,000Term Loan Facility
Mandated Lead Arranger
2011
USD 147,000,000Term Loan Facility
Mandated Lead Arranger
2011
USD 232,624,000Term Loan Facility
Mandated Lead Arranger
2011
USD 67,000,000Term Loan Facility
Sole Arranger
2011
USD 41,100,000Term Loan Facility
Sole Arranger
2011
Aker DOF Deepwater
USD 63,100,000NOK 175,000,000
Term Loan Facilities
Mandated Lead Arranger2011
Torghatten I & IINOK 824,000,000
Term Loan FacilitiesUSD 180,000,000Term Loan Facility
USD 511,000,000Term Loan Facility
USD 410,000,000Term Loan Facility
EUR 250,000,000Term Loan Facility
USD 200,000,000Term Loan Tranche
Deep Sea Metro II
Sole Arranger
2011
Mandated Lead Arranger
2011
Mandated Lead Arranger
2011
Mandated Lead Arranger
2011
Mandated Lead Arranger
2011
Funding provider
2011
22
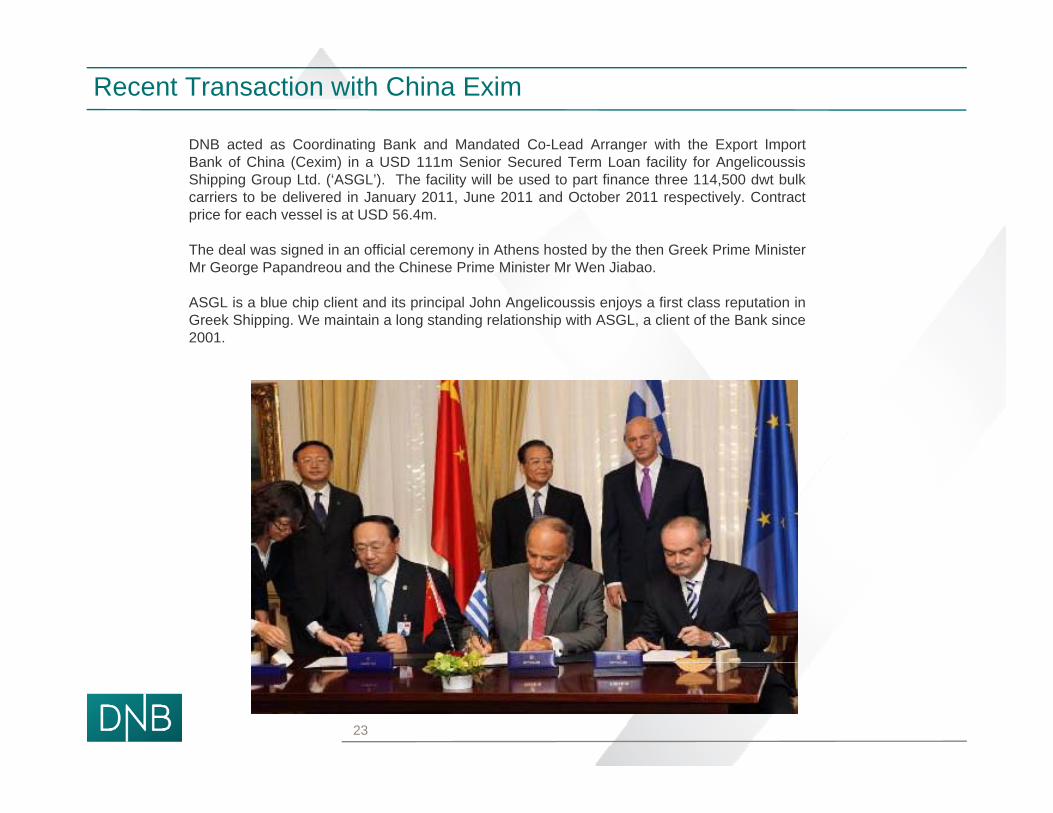
Recent Transaction with China Exim
DNB acted as Coordinating Bank and Mandated Co-Lead Arranger with the Export Importg g p pBank of China (Cexim) in a USD 111m Senior Secured Term Loan facility for AngelicoussisShipping Group Ltd. (‘ASGL’). The facility will be used to part finance three 114,500 dwt bulkcarriers to be delivered in January 2011, June 2011 and October 2011 respectively. Contractprice for each vessel is at USD 56.4m.
The deal was signed in an official ceremony in Athens hosted by the then Greek Prime MinisterThe deal was signed in an official ceremony in Athens hosted by the then Greek Prime MinisterMr George Papandreou and the Chinese Prime Minister Mr Wen Jiabao.
ASGL is a blue chip client and its principal John Angelicoussis enjoys a first class reputation inGreek Shipping. We maintain a long standing relationship with ASGL, a client of the Bank since2001.
23
Why Issue High Yield Bonds?
• Access a large, liquid and growing debt capital market
• Increasingly important alternative debt funding source as bank lending capacity diminishes
• Broaden corporate story beyond lenders and equity investorsoade co po a e s o y beyo d e de s a d equ y es o s
• High yield market has wide investor following
• Published and widely referenced industry credit research from the largest brokerage houses
• Introduce long term non amortizing debt to capital structure• Introduce long-term, non-amortizing debt to capital structure
• Obtain financing with instruments providing permissive operational governance (no performance covenants)
• P id d i i h bili i d f i f• Provide seasoned issuers with ability to raise new money under fast time-frame to support strategic initiatives
• Opportunities to raise desirable unsecured financing
• Market acceptance for dividend recapitalization transactions enabling owners to take money "off the table"
• Greater leverage tolerance historically than bank market
24
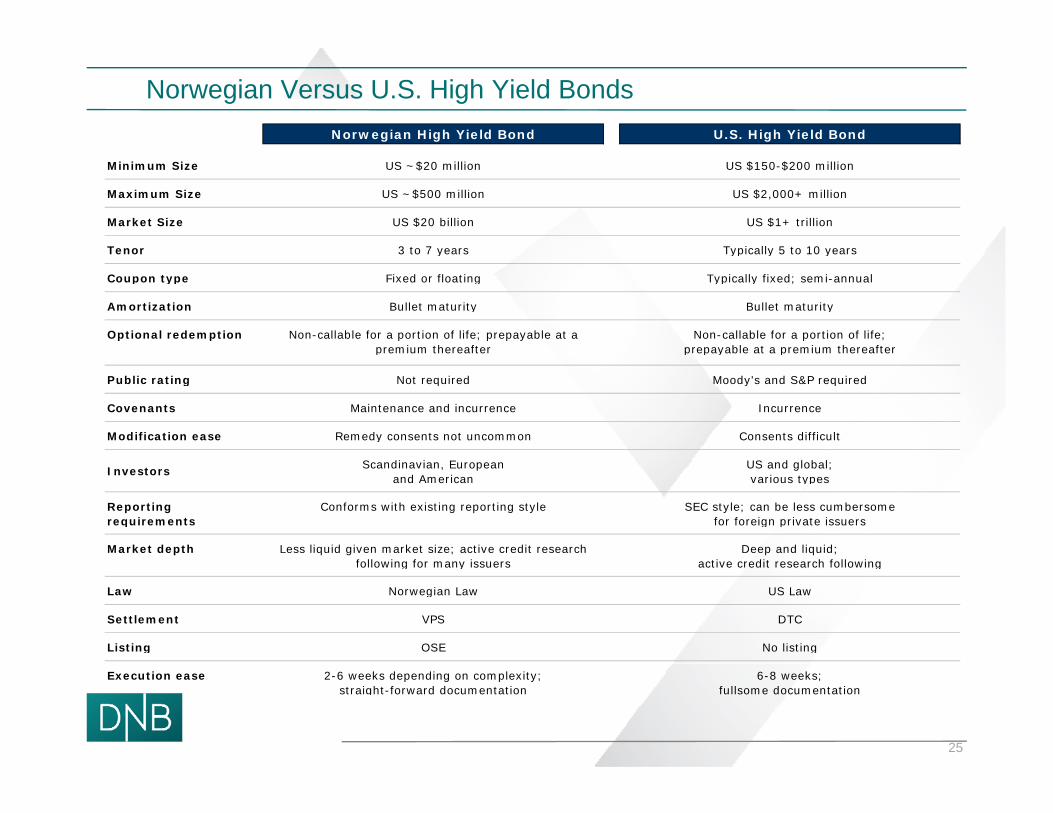
Norwegian Versus U.S. High Yield BondsNorwegian High Yield Bond U.S. High Yield Bond
INTRODUCTION
Minimum Size US ~$20 million US $150-$200 million
Maximum Size US ~$500 million US $2,000+ million
Market Size US $20 billion US $1+ trillion
Tenor 3 to 7 years Typically 5 to 10 yearsTenor 3 to 7 years Typically 5 to 10 years
Coupon type Fixed or floating Typically fixed; semi-annual
Amortization Bullet maturity Bullet maturity
Optional redemption Non-callable for a portion of life; prepayable at a premium thereafter
Non-callable for a portion of life;prepayable at a premium thereafterp p p y p
Public rating Not required Moody's and S&P required
Covenants Maintenance and incurrence Incurrence
Modification ease Remedy consents not uncommon Consents difficult
Investors Scandinavian, Europeanand American
US and global;various types
Reporting requirements
Conforms with existing reporting style SEC style; can be less cumbersomefor foreign private issuers
Market depth Less liquid given market size; active credit research f ll i f i
Deep and liquid;ti dit h f ll ifollowing for many issuers active credit research following
Law Norwegian Law US Law
Settlement VPS DTC
Listing OSE No listing
25
Execution ease 2-6 weeks depending on complexity;straight-forward documentation
6-8 weeks;fullsome documentation
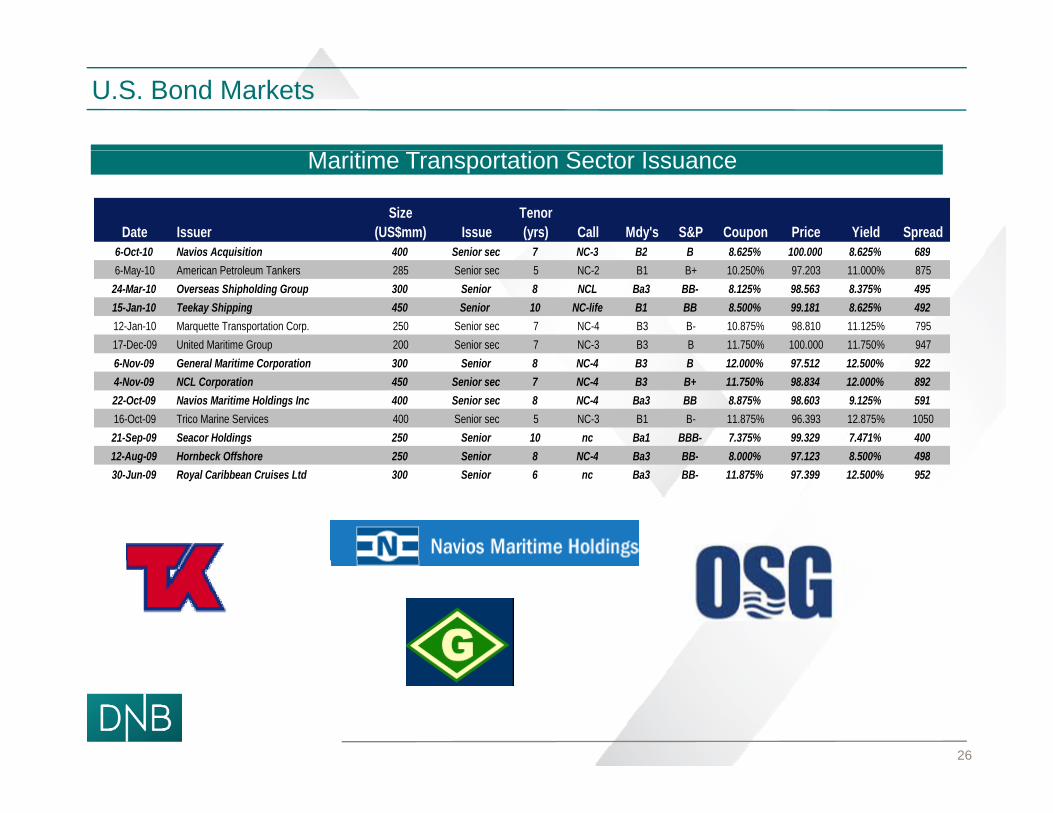
U.S. Bond Markets
Maritime Transportation Sector Issuance
Date IssuerSize
(US$mm) IssueTenor (yrs) Call Mdy's S&P Coupon Price Yield Spread
6-Oct-10 Navios Acquisition 400 Senior sec 7 NC-3 B2 B 8 625% 100 000 8 625% 6896-Oct-10 Navios Acquisition 400 Senior sec 7 NC-3 B2 B 8.625% 100.000 8.625% 6896-May-10 American Petroleum Tankers 285 Senior sec 5 NC-2 B1 B+ 10.250% 97.203 11.000% 875
24-Mar-10 Overseas Shipholding Group 300 Senior 8 NCL Ba3 BB- 8.125% 98.563 8.375% 49515-Jan-10 Teekay Shipping 450 Senior 10 NC-life B1 BB 8.500% 99.181 8.625% 49212-Jan-10 Marquette Transportation Corp. 250 Senior sec 7 NC-4 B3 B- 10.875% 98.810 11.125% 79517-Dec-09 United Maritime Group 200 Senior sec 7 NC-3 B3 B 11.750% 100.000 11.750% 9476-Nov-09 General Maritime Corporation 300 Senior 8 NC-4 B3 B 12.000% 97.512 12.500% 9224-Nov-09 NCL Corporation 450 Senior sec 7 NC-4 B3 B+ 11.750% 98.834 12.000% 89222-Oct-09 Navios Maritime Holdings Inc 400 Senior sec 8 NC-4 Ba3 BB 8.875% 98.603 9.125% 59116-Oct-09 Trico Marine Services 400 Senior sec 5 NC-3 B1 B- 11.875% 96.393 12.875% 105021-Sep-09 Seacor Holdings 250 Senior 10 nc Ba1 BBB- 7.375% 99.329 7.471% 40012-Aug-09 Hornbeck Offshore 250 Senior 8 NC-4 Ba3 BB- 8 000% 97 123 8 500% 49812 Aug 09 Hornbeck Offshore 250 Senior 8 NC 4 Ba3 BB 8.000% 97.123 8.500% 49830-Jun-09 Royal Caribbean Cruises Ltd 300 Senior 6 nc Ba3 BB- 11.875% 97.399 12.500% 952
26
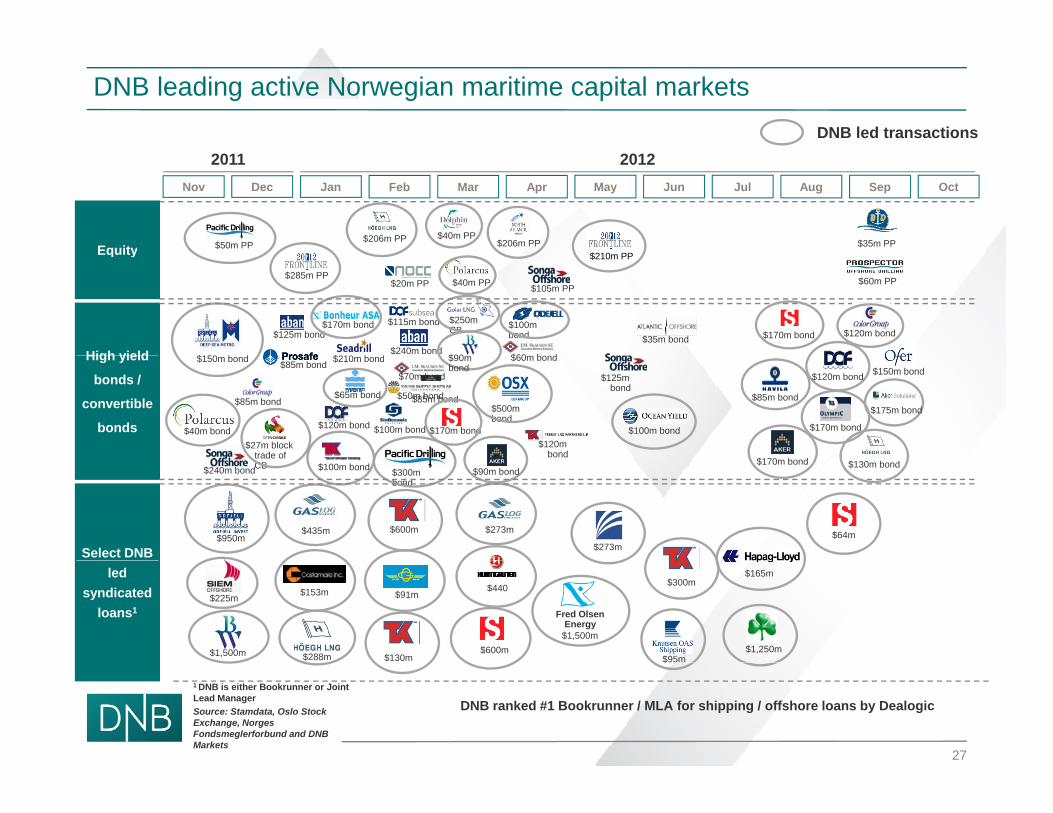
DNB leading active Norwegian maritime capital marketsDNB led transactions
Equity
2011May Jun Sep OctNov Dec Jan Feb Mar Apr
2012
$206m PP$50m PP
Jul Aug
$40m PP
$210 PP$206m PP $35m PPEquity
High yield $150 b d
$125m bond$170m bond
$210 b d
$115m bond
$240m bond
$250m CB
$90
$100m bond
$60 b d
$20m PP $40m PP $105m PP
$210m PP
$35m bond
$285m PP
$170m bond $120m bond
$60m PP
High yield
bonds /
convertible
bonds $40m bond
$150m bond
$27m block trade of
$85m bond $85m bond
$85m bond
$120m bond
$65m bond
$210m bond
$100m bond
$70m bond
$90m bond
$50m bond
$170m bond
$500m bond
$60m bond
$120m bond
$125m bond
$100m bond
$85m bond
$1 0 b d
$120m bond
$170m bond
$150m bond
$175m bond
Select DNB
$240m bond
$950m
trade of CB $100m bond
$435m
$300m bond
$90m bond
$600m $273m
$273m
$170m bond
$64m
$130m bond
led syndicated
loans1
$1,500m
$225m $153m
$288m $130m$600m
$440$91m
$1,500m
Fred Olsen Energy
$95m
$300m
$1,250m
$165m
1 DNB is either Bookrunner or Joint Lead ManagerSource: Stamdata, Oslo Stock Exchange, Norges Fondsmeglerforbund and DNB Markets
$
DNB ranked #1 Bookrunner / MLA for shipping / offshore loans by Dealogic
27
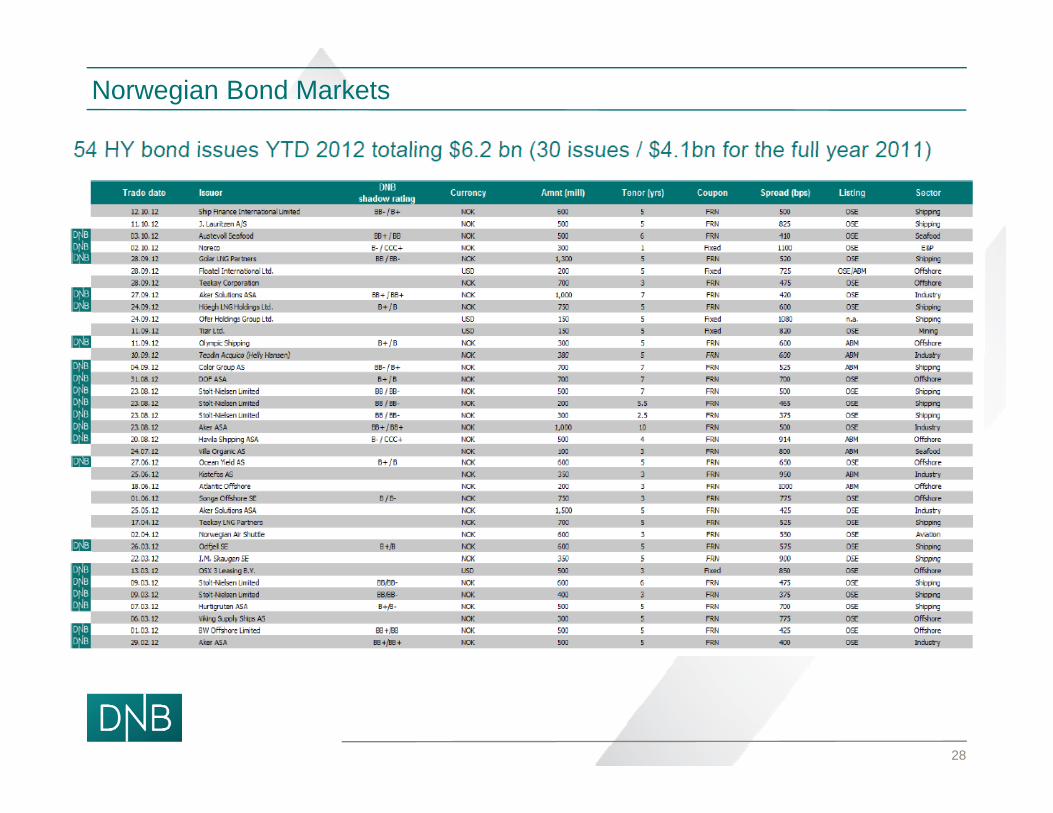
Norwegian Bond Markets
28
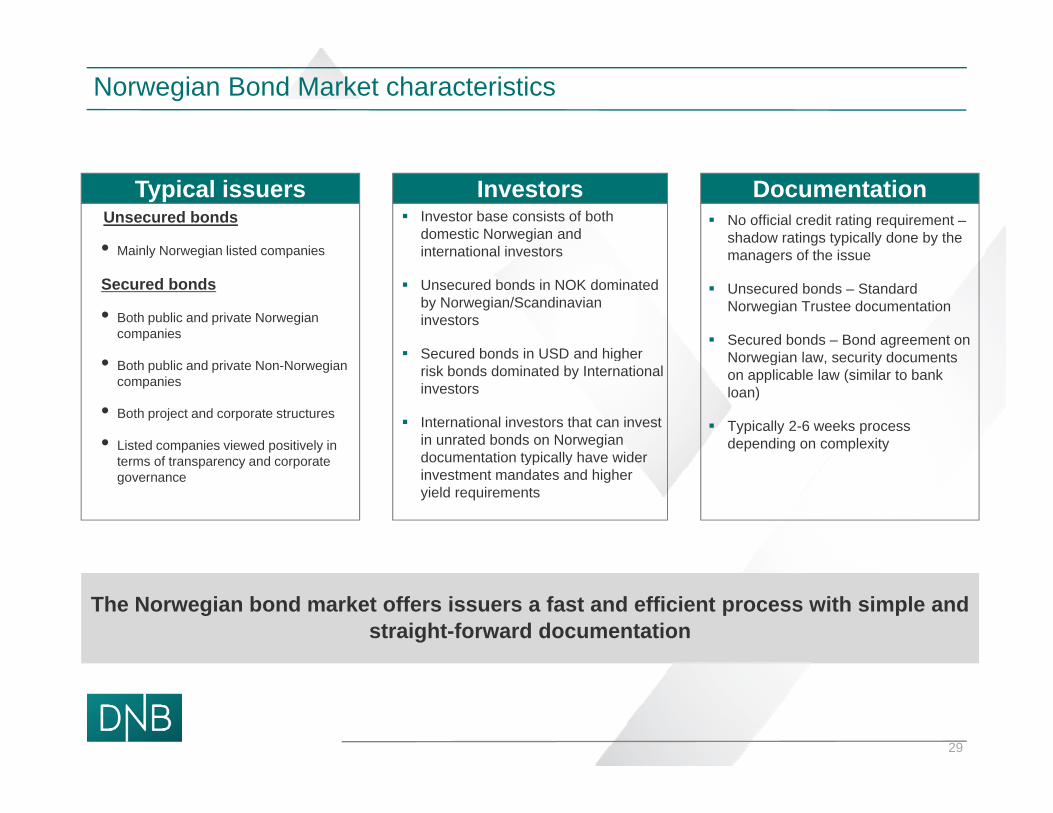
Norwegian Bond Market characteristics
Typical issuers Investors DocumentationUnsecured bonds
• Mainly Norwegian listed companies
Investor base consists of both domestic Norwegian and international investors
No official credit rating requirement –shadow ratings typically done by the managers of the issueMainly Norwegian listed companies
Secured bonds
• Both public and private Norwegian companies
international investors
Unsecured bonds in NOK dominated by Norwegian/Scandinavian investors
Secured bonds in USD and higher
managers of the issue
Unsecured bonds – Standard Norwegian Trustee documentation
Secured bonds – Bond agreement on Norwegian law security documents• Both public and private Non-Norwegian
companies
• Both project and corporate structures
• Listed companies viewed positively in t f t d t
Secured bonds in USD and higher risk bonds dominated by International investors
International investors that can invest in unrated bonds on Norwegian documentation typically have wider
Norwegian law, security documents on applicable law (similar to bank loan)
Typically 2-6 weeks process depending on complexity
terms of transparency and corporate governance
documentation typically have wider investment mandates and higher yield requirements
The Norwegian bond market offers issuers a fast and efficient process with simple and straight-forward documentation
29
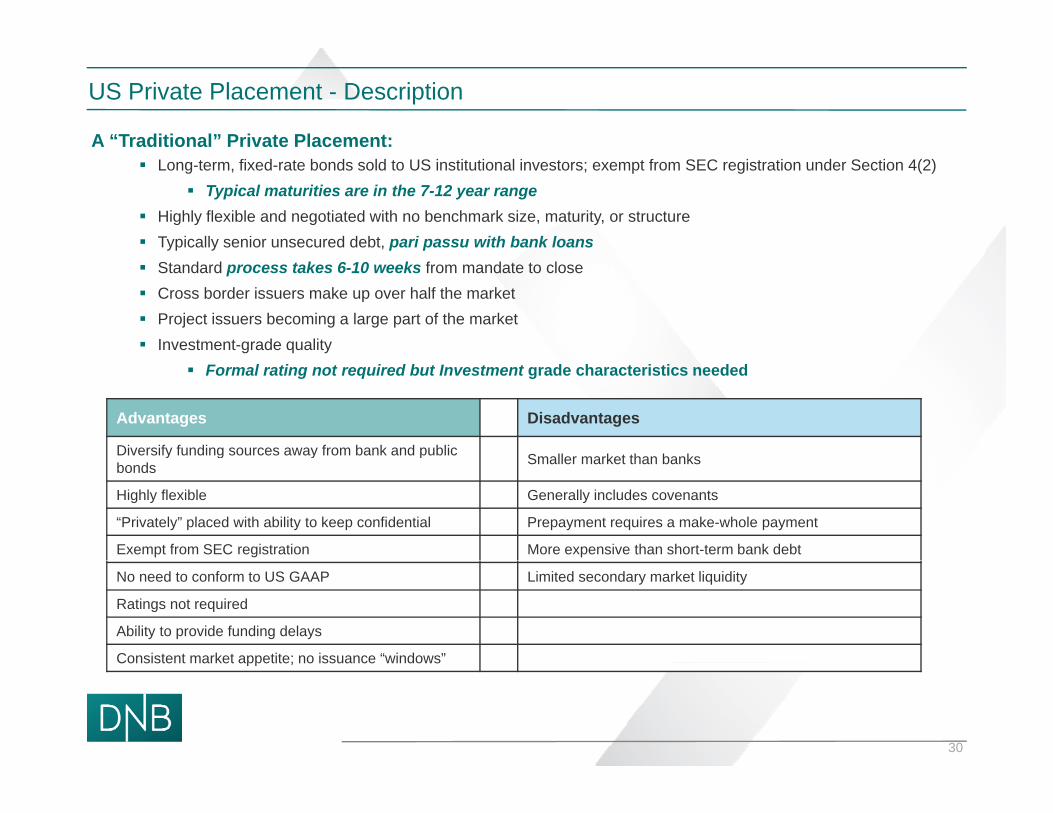
US Private Placement - Description
A “Traditional” Private Placement: Long-term, fixed-rate bonds sold to US institutional investors; exempt from SEC registration under Section 4(2)
Typical maturities are in the 7-12 year range Highly flexible and negotiated with no benchmark size, maturity, or structure Typically senior unsecured debt, pari passu with bank loans Standard process takes 6-10 weeks from mandate to close Cross border issuers make up over half the market Project issuers becoming a large part of the market Investment-grade quality
Advantages Disadvantages
Diversify funding sources away from bank and public Smaller market than banks
Formal rating not required but Investment grade characteristics needed
y g y pbonds Smaller market than banks
Highly flexible Generally includes covenants
“Privately” placed with ability to keep confidential Prepayment requires a make-whole payment
Exempt from SEC registration More expensive than short-term bank debt
No need to conform to US GAAP Limited secondary market liquidity
Ratings not required
Ability to provide funding delays
Consistent market appetite; no issuance “windows”
30
Consistent market appetite; no issuance windows
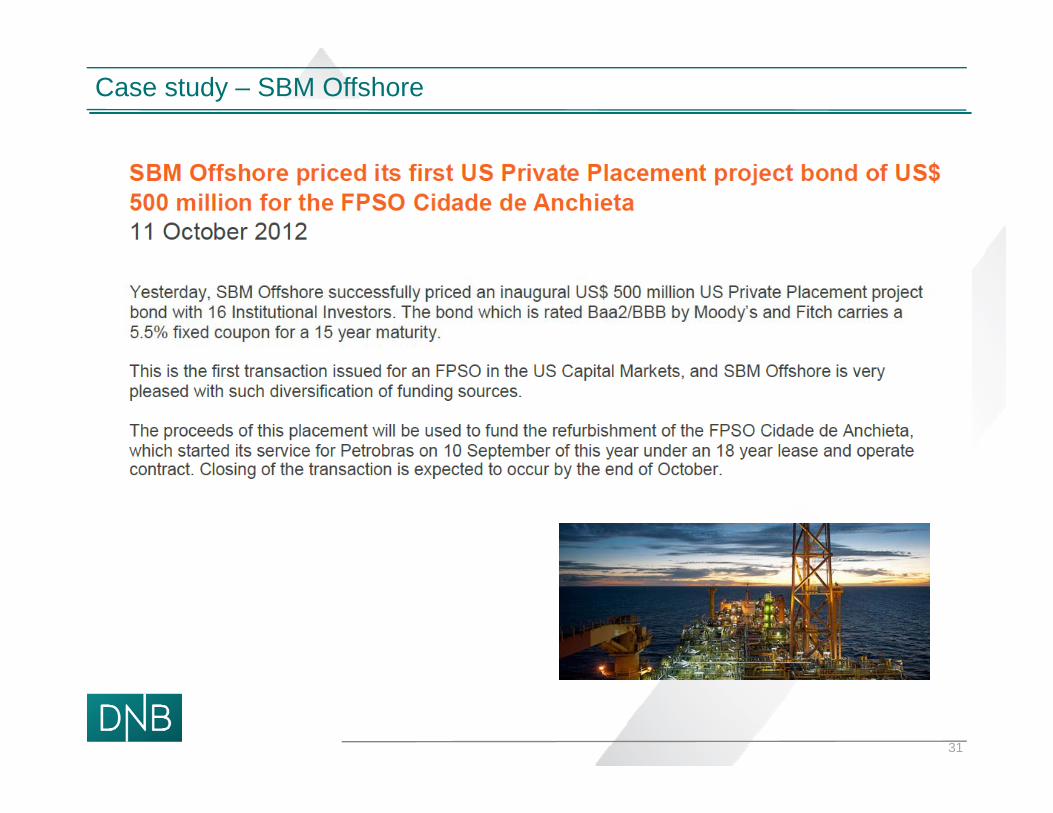
Case study – SBM Offshore
31
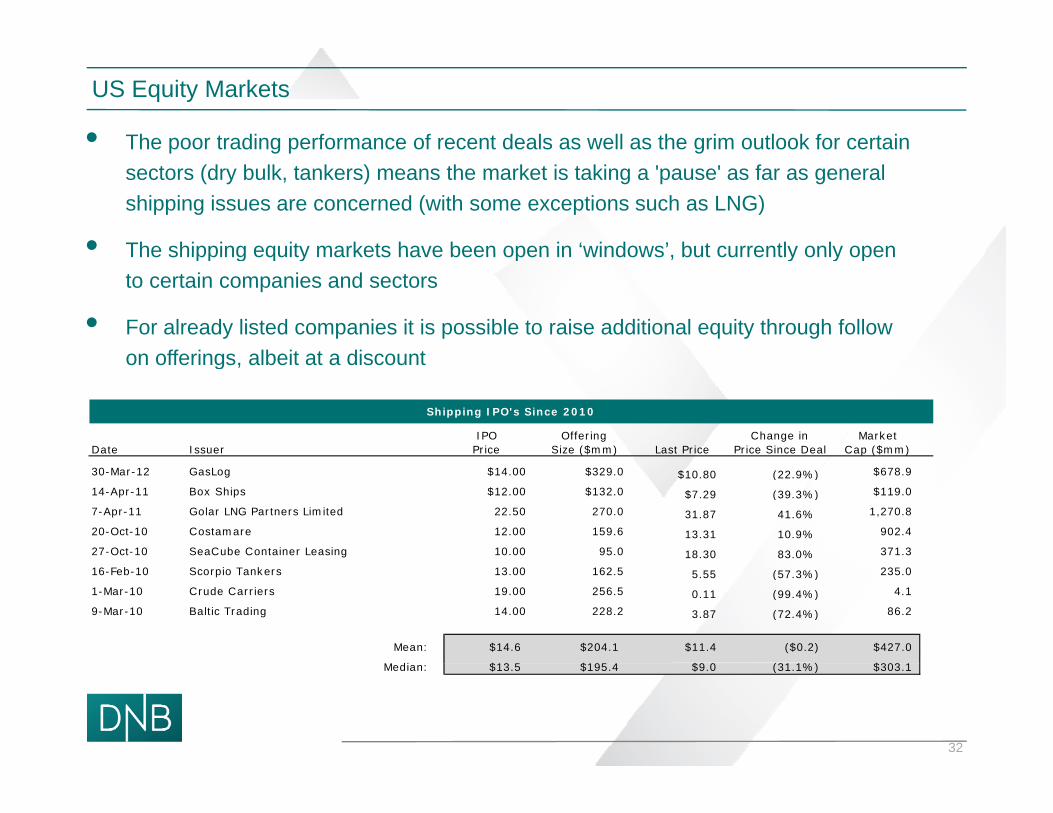
US Equity Markets
• The poor trading performance of recent deals as well as the grim outlook for certain p g p gsectors (dry bulk, tankers) means the market is taking a 'pause' as far as general shipping issues are concerned (with some exceptions such as LNG)
• The shipping equity markets have been open in ‘windows’ but currently only openThe shipping equity markets have been open in windows , but currently only open to certain companies and sectors
• For already listed companies it is possible to raise additional equity through follow on offerings albeit at a discounton offerings, albeit at a discount
Shipping IPO's Since 2010
IPO Offering Change in MarketDate Issuer Price Size ($mm) Last Price Price Since Deal Cap ($mm)
30-Mar-12 GasLog $14.00 $329.0 $10.80 (22.9%) $678.9
14-Apr-11 Box Ships $12.00 $132.0 $7.29 (39.3%) $119.0
7-Apr-11 Golar LNG Partners Limited 22.50 270.0 31.87 41.6% 1,270.8
20-Oct-10 Costamare 12.00 159.6 13.31 10.9% 902.4
27-Oct-10 SeaCube Container Leasing 10.00 95.0 18.30 83.0% 371.3
16-Feb-10 Scorpio Tankers 13.00 162.5 5.55 (57.3%) 235.0
1-Mar-10 Crude Carriers 19.00 256.5 0.11 (99.4%) 4.1
9-Mar-10 Baltic Trading 14.00 228.2 3.87 (72.4%) 86.2
Mean: $14.6 $204.1 $11.4 ($0.2) $427.0
M di $13 5 $195 4 $9 0 (31 1%) $303 1
32
Median: $13.5 $195.4 $9.0 (31.1%) $303.1
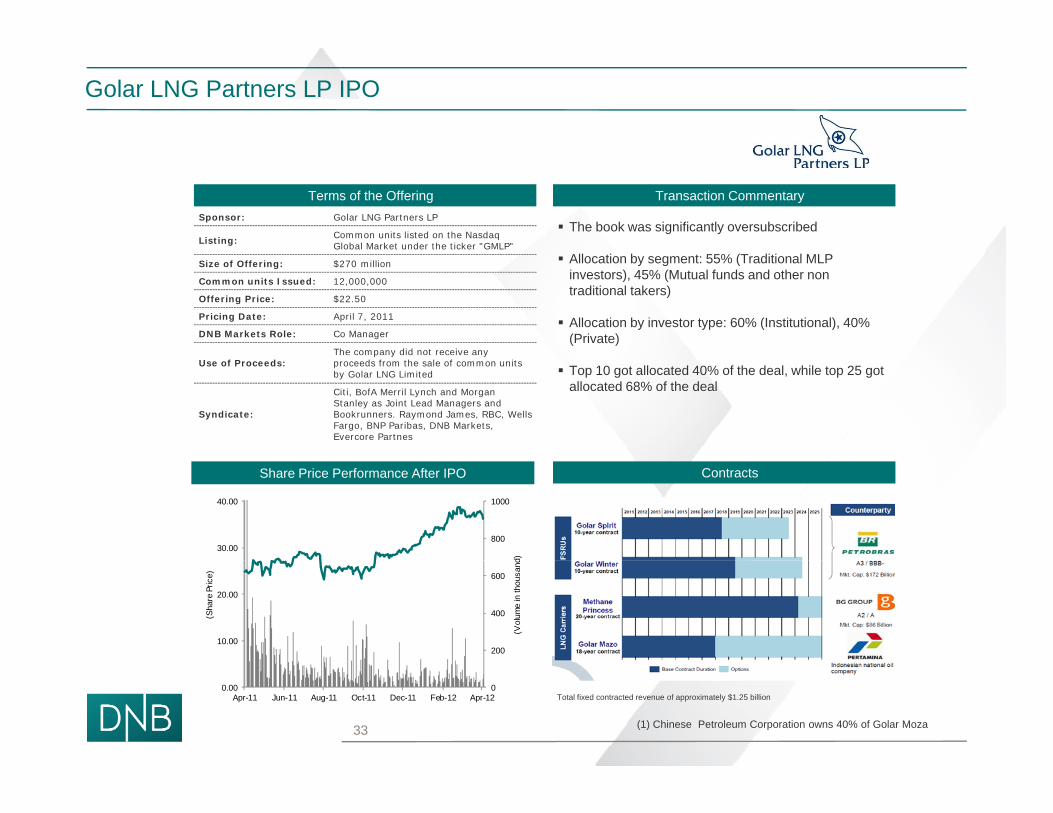
Golar LNG Partners LP IPO
Terms of the Offering Transaction Commentary
The book was significantly oversubscribedSponsor: Golar LNG Partners LP
Listing: Common units listed on the Nasdaq Global Market under the ticker "GMLP"
Allocation by segment: 55% (Traditional MLP investors), 45% (Mutual funds and other non traditional takers)
Allocation by investor type: 60% (Institutional), 40% (Private)
Size of Offering: $270 million
Common units Issued: 12,000,000
Offering Price: $22.50
Pricing Date: April 7, 2011
DNB Markets Role: Co Manager
The company did not receive any
Top 10 got allocated 40% of the deal, while top 25 got allocated 68% of the deal
Use of Proceeds:p y y
proceeds from the sale of common units by Golar LNG Limited
Syndicate:
Citi, BofA Merril Lynch and Morgan Stanley as Joint Lead Managers and Bookrunners. Raymond James, RBC, Wells Fargo, BNP Paribas, DNB Markets, Evercore Partnes
ContractsShare Price Performance After IPO
800
1000
30.00
40.00
d)
200
400
600
10.00
20.00
(Vol
ume
in th
ousa
nd
(Sha
re P
rice)
(1) Chinese Petroleum Corporation owns 40% of Golar Moza
Total fixed contracted revenue of approximately $1.25 billion00.00
Apr-11 Jun-11 Aug-11 Oct-11 Dec-11 Feb-12 Apr-12
33
GasLog IPO
Terms of the Offering Transaction Commentaryg y
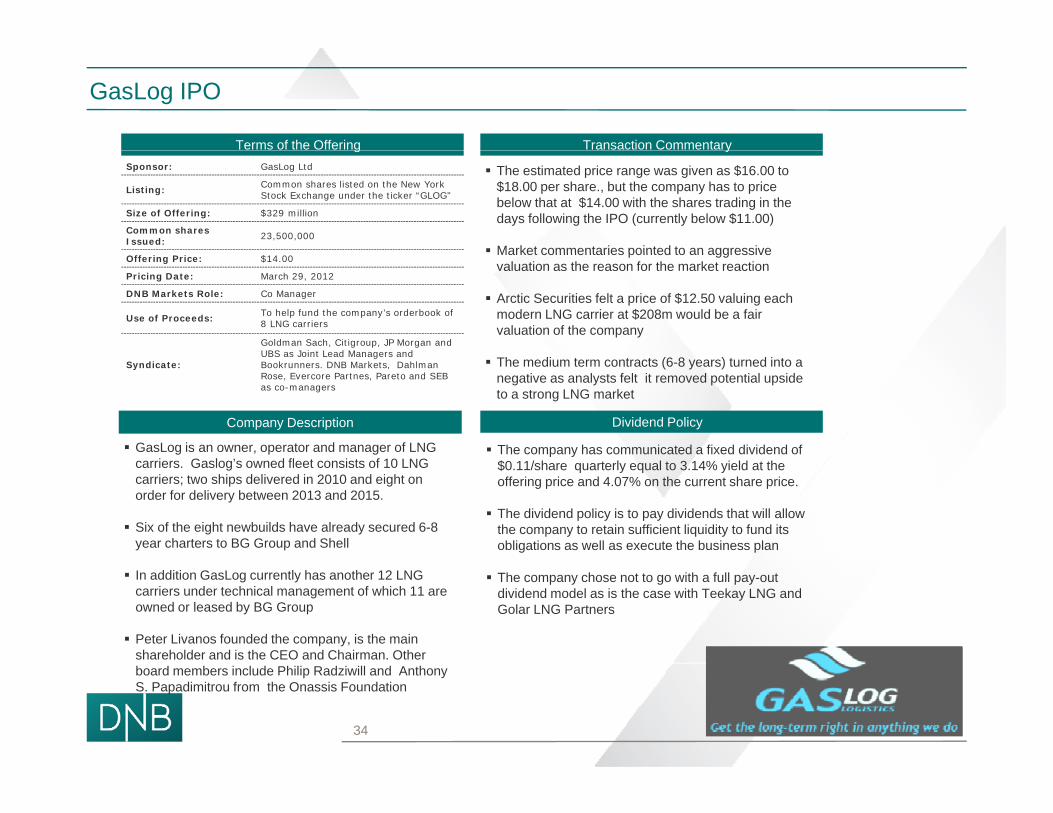
The estimated price range was given as $16.00 to $18.00 per share., but the company has to price below that at $14.00 with the shares trading in the days following the IPO (currently below $11.00)
Market commentaries pointed to an aggressive
Sponsor: GasLog Ltd
Listing: Common shares listed on the New York Stock Exchange under the ticker “GLOG"
Size of Offering: $329 million
Common shares Issued: 23,500,000
Market commentaries pointed to an aggressive valuation as the reason for the market reaction
Arctic Securities felt a price of $12.50 valuing each modern LNG carrier at $208m would be a fair valuation of the company
Offering Price: $14.00
Pricing Date: March 29, 2012
DNB Markets Role: Co Manager
Use of Proceeds: To help fund the company’s orderbook of8 LNG carriers
Goldman Sach, Citigroup, JP Morgan and UBS as Joint Lead Managers and
Dividend Policy
The medium term contracts (6-8 years) turned into a negative as analysts felt it removed potential upside to a strong LNG market
Syndicate:UBS as Joint Lead Managers and Bookrunners. DNB Markets, DahlmanRose, Evercore Partnes, Pareto and SEB as co-managers
Company Description
GasLog is an owner, operator and manager of LNG The company has communicated a fixed dividend of carriers. Gaslog’s owned fleet consists of 10 LNG carriers; two ships delivered in 2010 and eight on order for delivery between 2013 and 2015.
Six of the eight newbuilds have already secured 6-8 year charters to BG Group and Shell
$0.11/share quarterly equal to 3.14% yield at the offering price and 4.07% on the current share price.
The dividend policy is to pay dividends that will allow the company to retain sufficient liquidity to fund its obligations as well as execute the business plan
In addition GasLog currently has another 12 LNG carriers under technical management of which 11 are owned or leased by BG Group
Peter Livanos founded the company, is the main shareholder and is the CEO and Chairman. Other
The company chose not to go with a full pay-out dividend model as is the case with Teekay LNG and Golar LNG Partners
board members include Philip Radziwill and Anthony S. Papadimitrou from the Onassis Foundation
34
US Master Limited Partnerships
The third largest independent owner of LNG carriers formed by
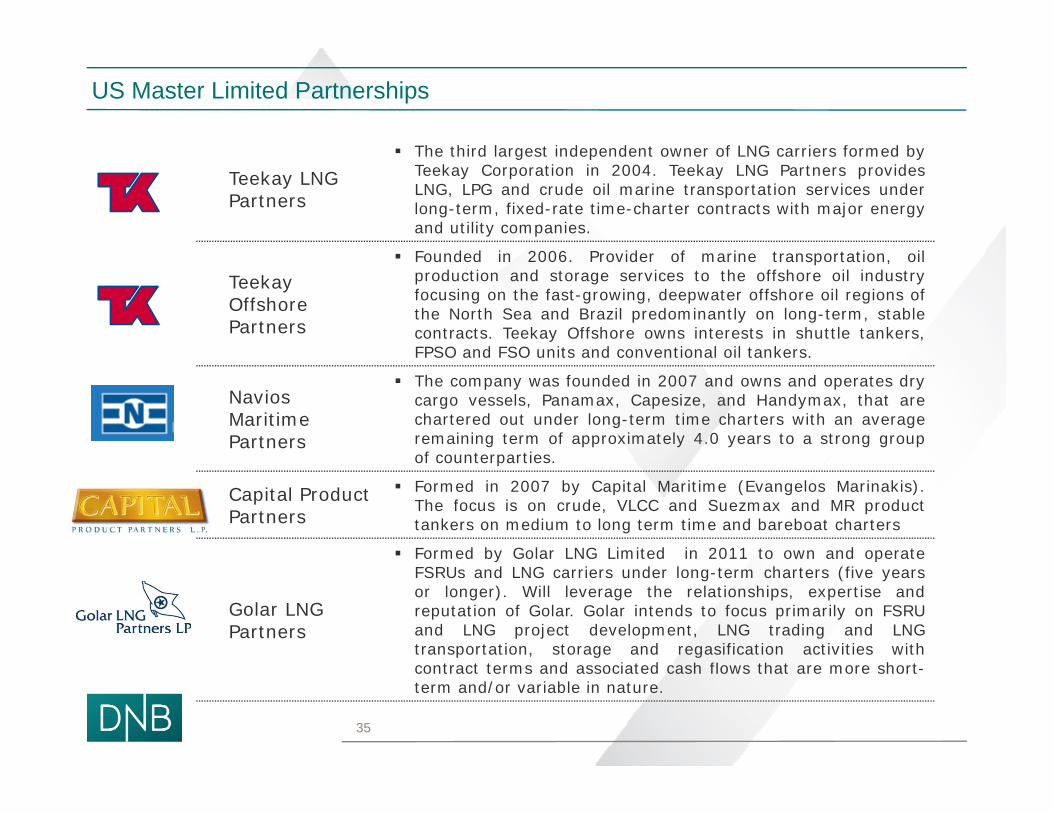
Teekay LNG Partners
The third largest independent owner of LNG carriers formed byTeekay Corporation in 2004. Teekay LNG Partners providesLNG, LPG and crude oil marine transportation services underlong-term, fixed-rate time-charter contracts with major energyand utility companies.
F d d i 2006 P id f i t t ti ilTeekayOffshore Partners
Founded in 2006. Provider of marine transportation, oilproduction and storage services to the offshore oil industryfocusing on the fast-growing, deepwater offshore oil regions ofthe North Sea and Brazil predominantly on long-term, stablecontracts. Teekay Offshore owns interests in shuttle tankers,FPSO and FSO units and conventional oil tankersFPSO and FSO units and conventional oil tankers.
NaviosMaritime Partners
The company was founded in 2007 and owns and operates drycargo vessels, Panamax, Capesize, and Handymax, that arechartered out under long-term time charters with an averageremaining term of approximately 4.0 years to a strong groupof counterpartiesof counterparties.
Capital Product Partners
Formed in 2007 by Capital Maritime (Evangelos Marinakis).The focus is on crude, VLCC and Suezmax and MR producttankers on medium to long term time and bareboat charters
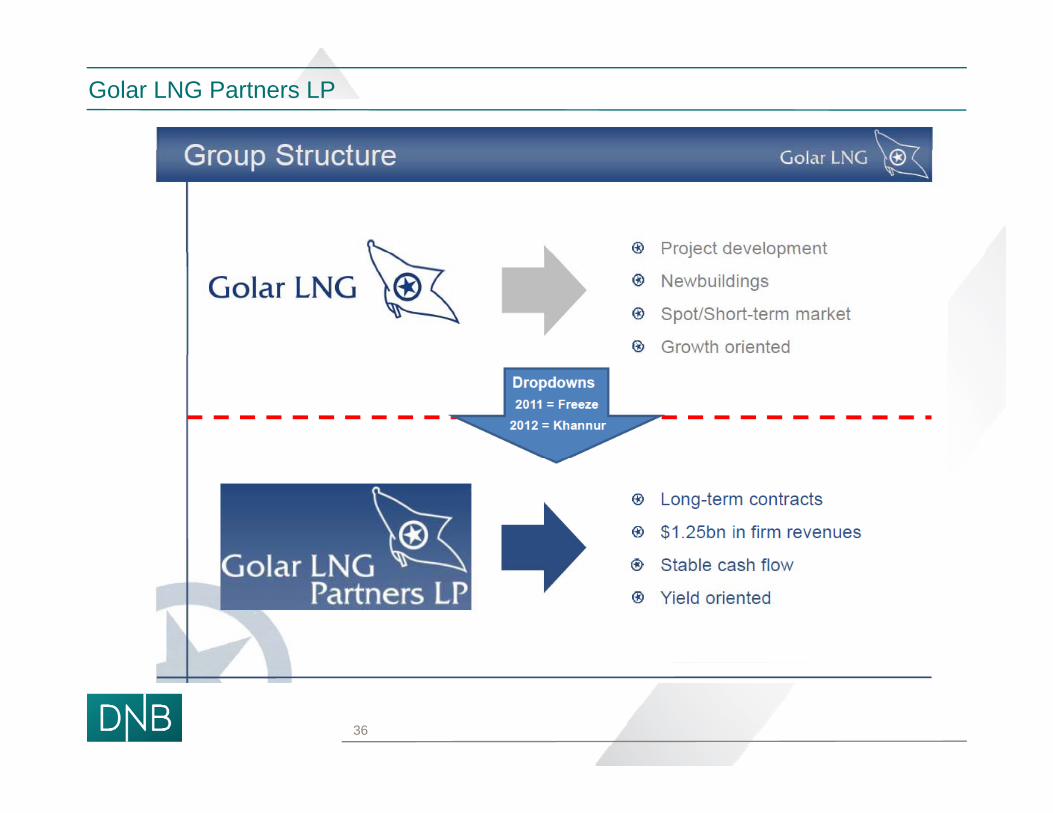
Formed by Golar LNG Limited in 2011 to own and operate
Golar LNG Partners
y pFSRUs and LNG carriers under long-term charters (five yearsor longer). Will leverage the relationships, expertise andreputation of Golar. Golar intends to focus primarily on FSRUand LNG project development, LNG trading and LNGtransportation, storage and regasification activities with
t t t d i t d h fl th t h tcontract terms and associated cash flows that are more short-term and/or variable in nature.
35
Golar LNG Partners LP
36
Financial Investors active in Shipping
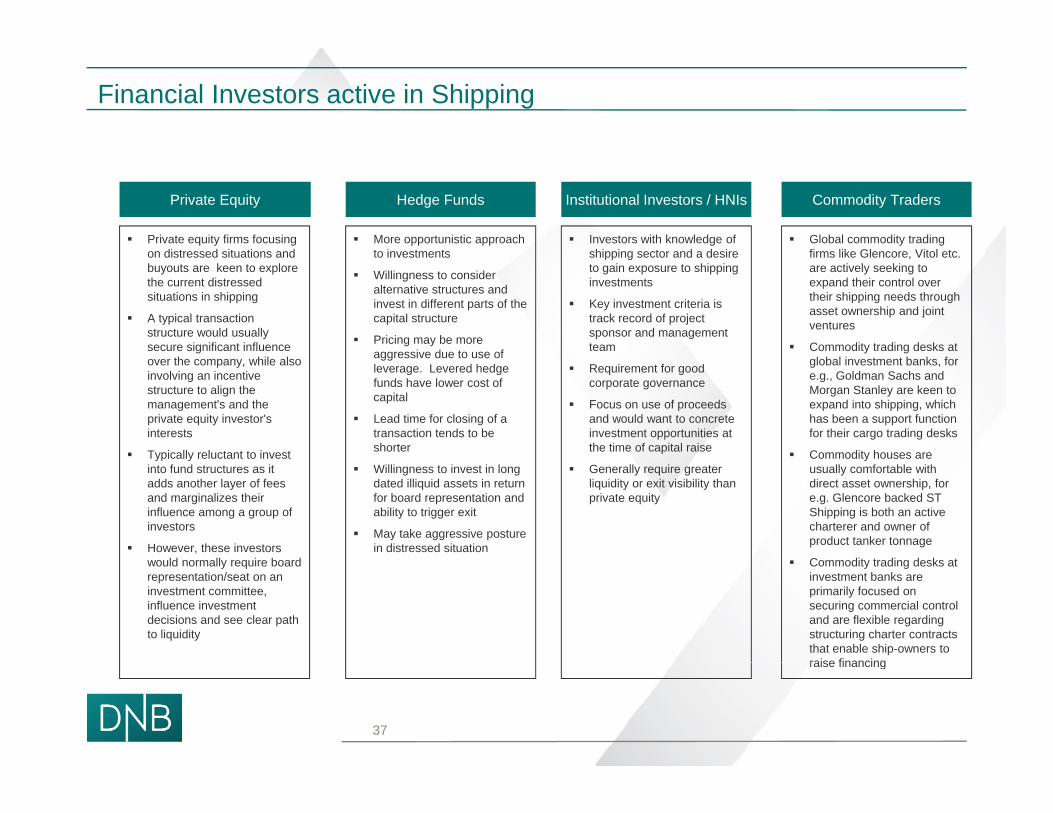
Private equity firms focusing on distressed situations and
Hedge FundsPrivate Equity
More opportunistic approach to investments
Institutional Investors / HNIs
Investors with knowledge of shipping sector and a desire
Commodity Traders
Global commodity trading firms like Glencore Vitol etcon distressed situations and
buyouts are keen to explore the current distressed situations in shipping
A typical transaction structure would usually secure significant influence
to investments
Willingness to consider alternative structures and invest in different parts of the capital structure
Pricing may be more aggressive due to use of
shipping sector and a desire to gain exposure to shipping investments
Key investment criteria is track record of project sponsor and management team
firms like Glencore, Vitol etc. are actively seeking to expand their control over their shipping needs through asset ownership and joint ventures
Commodity trading desks at over the company, while also involving an incentive structure to align the management's and the private equity investor's interests
Typically reluctant to invest
aggressive due to use of leverage. Levered hedge funds have lower cost of capital
Lead time for closing of a transaction tends to be shorter
Requirement for good corporate governance
Focus on use of proceeds and would want to concrete investment opportunities at the time of capital raise
global investment banks, for e.g., Goldman Sachs and Morgan Stanley are keen to expand into shipping, which has been a support function for their cargo trading desks
Commodity houses areTypically reluctant to invest into fund structures as it adds another layer of fees and marginalizes their influence among a group of investors
However, these investors would normally require board
Willingness to invest in long dated illiquid assets in return for board representation and ability to trigger exit
May take aggressive posture in distressed situation
Generally require greater liquidity or exit visibility than private equity
Commodity houses are usually comfortable with direct asset ownership, for e.g. Glencore backed ST Shipping is both an active charterer and owner of product tanker tonnage
Commodity trading desks atwould normally require board representation/seat on an investment committee, influence investment decisions and see clear path to liquidity
Commodity trading desks at investment banks are primarily focused on securing commercial control and are flexible regarding structuring charter contracts that enable ship-owners to raise financingraise financing
37
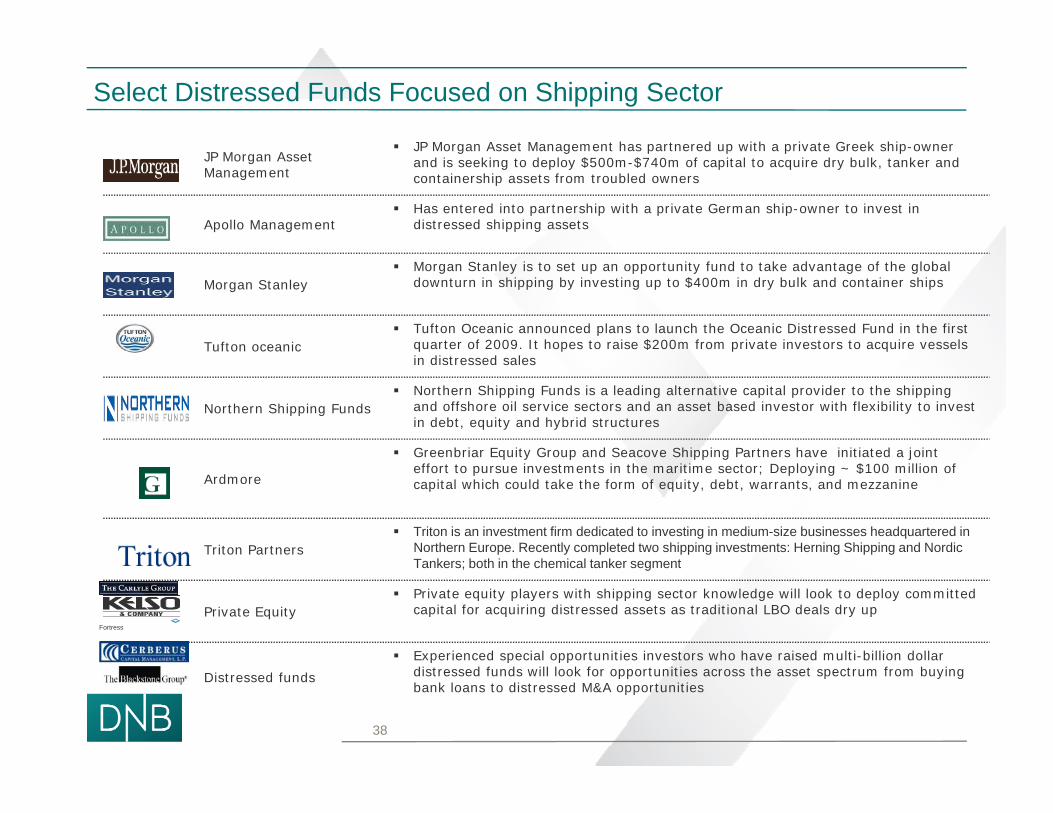
Select Distressed Funds Focused on Shipping Sector
JP Morgan Asset Management has partnered up with a private Greek ship-owner JP Morgan Asset Management
JP Morgan Asset Management has partnered up with a private Greek ship owner and is seeking to deploy $500m-$740m of capital to acquire dry bulk, tanker and containership assets from troubled owners
Apollo Management Has entered into partnership with a private German ship-owner to invest in
distressed shipping assets
Morgan Stanley Morgan Stanley is to set up an opportunity fund to take advantage of the global
downturn in shipping by investing up to $400m in dry bulk and container ships
Tufton oceanic Tufton Oceanic announced plans to launch the Oceanic Distressed Fund in the first
quarter of 2009. It hopes to raise $200m from private investors to acquire vessels i di d lin distressed sales
Northern Shipping Funds Northern Shipping Funds is a leading alternative capital provider to the shipping
and offshore oil service sectors and an asset based investor with flexibility to invest in debt, equity and hybrid structures
Greenbriar Equity Group and Seacove Shipping Partners have initiated a joint
Ardmore
q y p pp g jeffort to pursue investments in the maritime sector; Deploying ~ $100 million of capital which could take the form of equity, debt, warrants, and mezzanine
Triton Partners Triton is an investment firm dedicated to investing in medium-size businesses headquartered in
Northern Europe. Recently completed two shipping investments: Herning Shipping and Nordic T k b th i th h i l t k tTankers; both in the chemical tanker segment
Private Equity Private equity players with shipping sector knowledge will look to deploy committed
capital for acquiring distressed assets as traditional LBO deals dry up
Experienced special opportunities investors who have raised multi-billion dollar
Fortress
Distressed funds distressed funds will look for opportunities across the asset spectrum from buying bank loans to distressed M&A opportunities
38
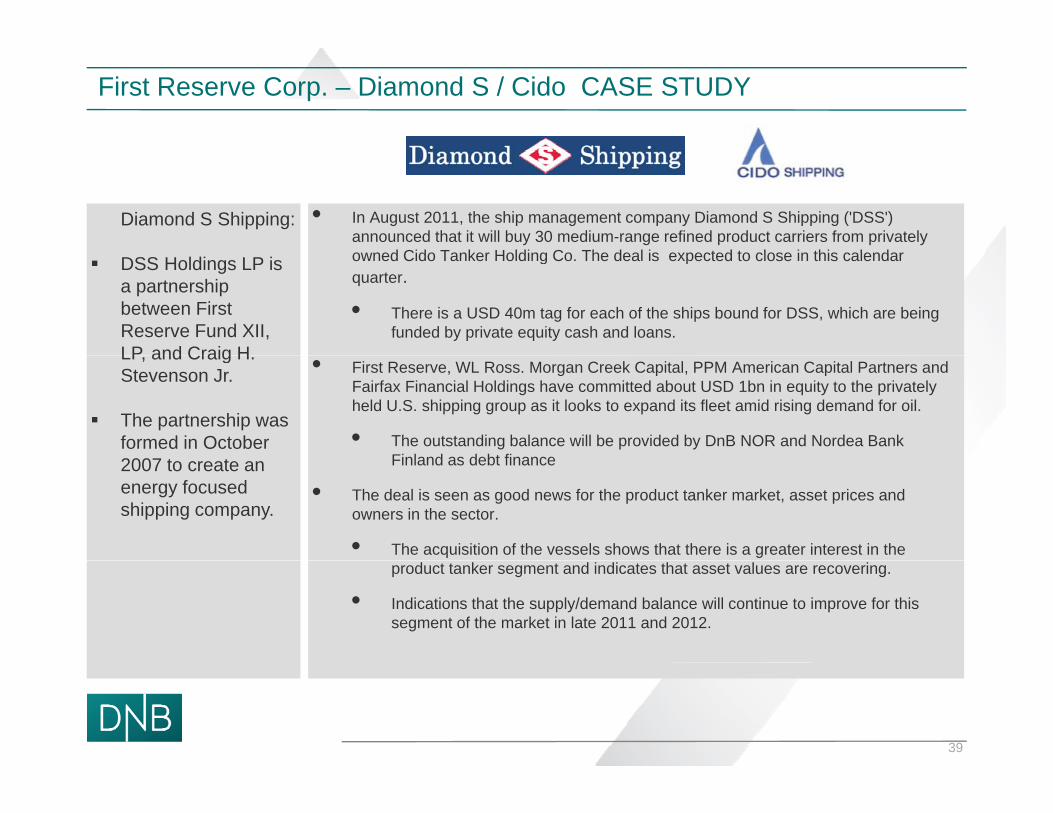
First Reserve Corp. – Diamond S / Cido CASE STUDY
• In August 2011, the ship management company Diamond S Shipping ('DSS') announced that it will buy 30 medium-range refined product carriers from privately owned Cido Tanker Holding Co The deal is expected to close in this calendar
Diamond S Shipping:
owned Cido Tanker Holding Co. The deal is expected to close in this calendar quarter.
• There is a USD 40m tag for each of the ships bound for DSS, which are being funded by private equity cash and loans.
DSS Holdings LP is a partnership between First Reserve Fund XII, LP and Craig H • First Reserve, WL Ross. Morgan Creek Capital, PPM American Capital Partners and
Fairfax Financial Holdings have committed about USD 1bn in equity to the privately held U.S. shipping group as it looks to expand its fleet amid rising demand for oil.
• The outstanding balance will be provided by DnB NOR and Nordea Bank Finland as debt finance
LP, and Craig H. Stevenson Jr.
The partnership was formed in October 2007 Finland as debt finance
• The deal is seen as good news for the product tanker market, asset prices and owners in the sector.
• The acquisition of the vessels shows that there is a greater interest in the
2007 to create an energy focused shipping company.
product tanker segment and indicates that asset values are recovering.
• Indications that the supply/demand balance will continue to improve for this segment of the market in late 2011 and 2012.
39
Contact Details
Frank Pedder
DNB Bank ASA
E-mail: [email protected]: +44 (0)207 621 6033
Mobile: +44 (0)7786 388603
40
Thank You
- banking with a cool headand a warm heart41