INTERCONTINENTAL COLLABORATION IN ROLLING RESISTANCE...
31
(Politechnika Gdańska) Technical University of Gdansk Poland INTERCONTINENTAL COLLABORATION IN ROLLING RESISTANCE MEASUREMENT Bernard Igbafen Izevbekhai Jerzy ( Jurek) A. Ejsmont TRB Session 325 January 23 2012
Transcript of INTERCONTINENTAL COLLABORATION IN ROLLING RESISTANCE...

(Politechnika Gdańska)
Technical University of Gdansk Poland
INTERCONTINENTAL COLLABORATION IN ROLLING RESISTANCE MEASUREMENT
Bernard Igbafen Izevbekhai
Jerzy ( Jurek) A. Ejsmont
TRB Session 325 January 23 2012

Acknowledgements • TU Gdansk Poland:
– Principal Investigator: Professor Jerzy Ejsmont TU Gdansk Poland
– Co –Principal Investigator Grzegrz Ronowski
• Professor Ulf Sandberg, VTI Sweden
• FHWA: Mark Swanlund, Robert Orthmeyer, Larry Wiser
• Minnesota State University Mankato: Prof W. James Wilde PI for
Diamond Grinding Pooled Fund Study TPF 5-134
• Minnesota DOT: Keith Shannon, Maureen Jensen, & Steve Olson
• Minnesota DOT: Tim Clyne assisted with some MnROAD Slides
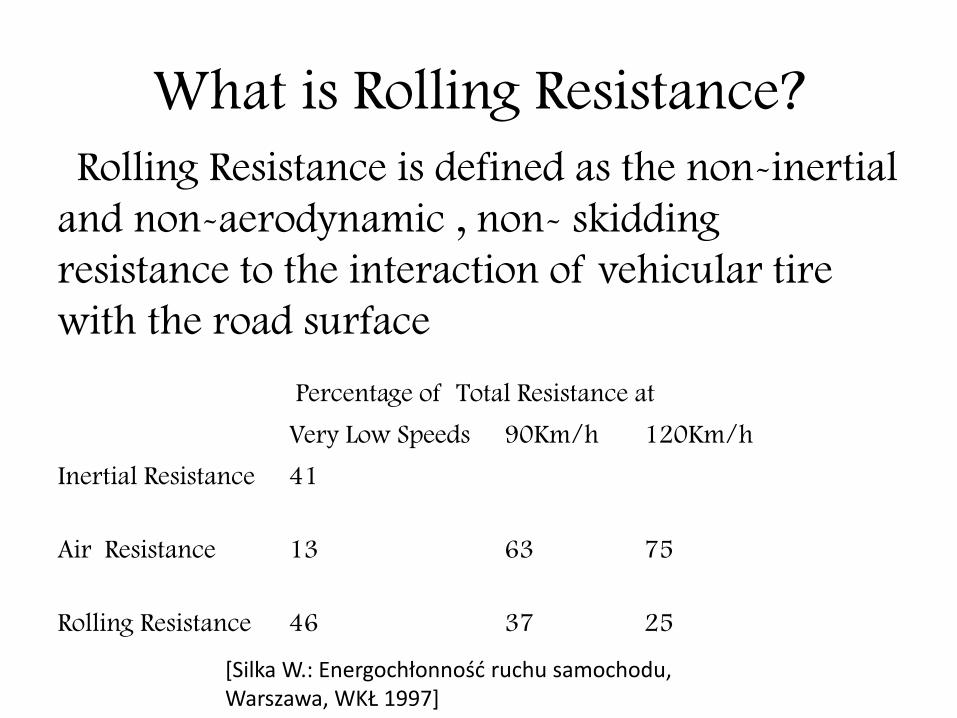
What is Rolling Resistance? Rolling Resistance is defined as the non-inertial and non-aerodynamic , non- skidding resistance to the interaction of vehicular tire with the road surface
Percentage of Total Resistance at
Very Low Speeds 90Km/h 120Km/h
Inertial Resistance
41
Air Resistance
13 63 75
Rolling Resistance
46 37 25
[Silka W.: Energochłonność ruchu samochodu, Warszawa, WKŁ 1997]

WHY ARE WE CONCERNED?
FUEL CONSUMPTION & RR At 100 km/hr passenger car expends~50% fuel to
overcome RR At 80km/hr a truck expends ~40% of fuel to overcome RR In all driving conditions an overall average ~
25% of fuel consumption is expended on RR leaving 75% to overcome air drag and inertia.

Beginnings & Conceptualization • January 2010: Ulf Sandberg Presents on Rolling Resistance at TRB AFD 90
Meeting.
• Meetings: MNDOT, FHWA, Sandberg on Possibility of testing at MnROAD
• November 2010 : Jerzy Ejsmont Visits MnROAD Facility and observes the test cells
• April 2011: FHWA adds Funds to TPF 5-134 for Rolling Resistance
• June 2011: MnDOT Contract Amended with MSU for Rolling Resistance, MSU
Sub-contract with TU Gdansk Executed
• August 2011: RR Equipment Shipped to MnROAD Monticello Minnesota USA
• September 2011: Testing of All MnROAD Cells
• November 2011 Additional Texture (Robotex) tests for better texture
Characterization

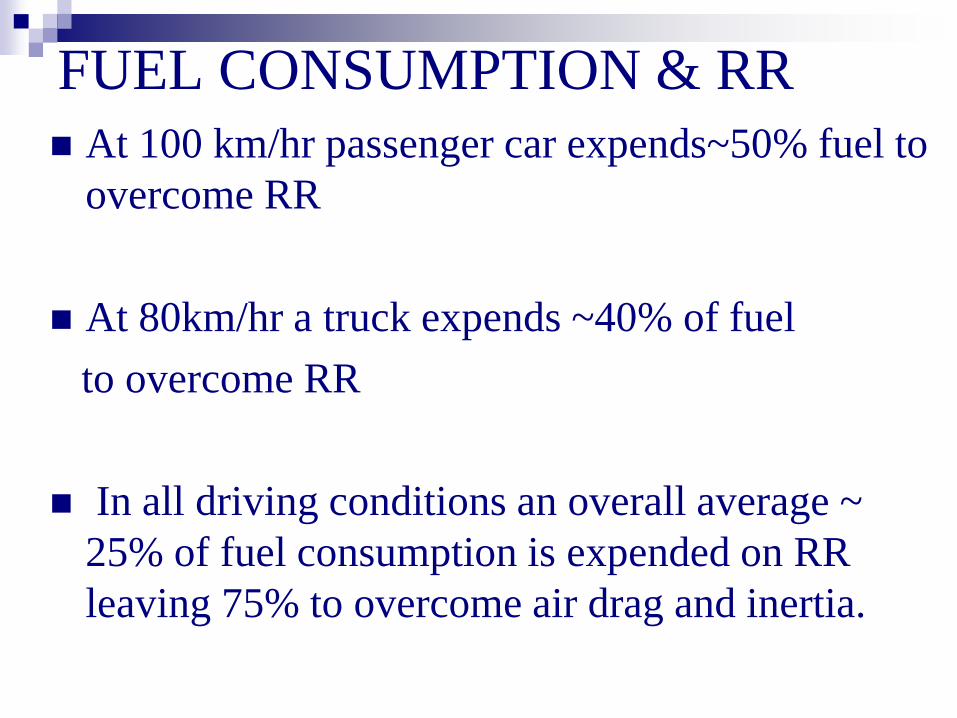
Field Equipment Description
A one-ton articulated device, with a housing for standard tire, (with compensation for pavement smoothness, and other variables) that allows an angular displacement due to resistance between tire and pavement and translates this into a rolling resistance number through mechanics of motion.
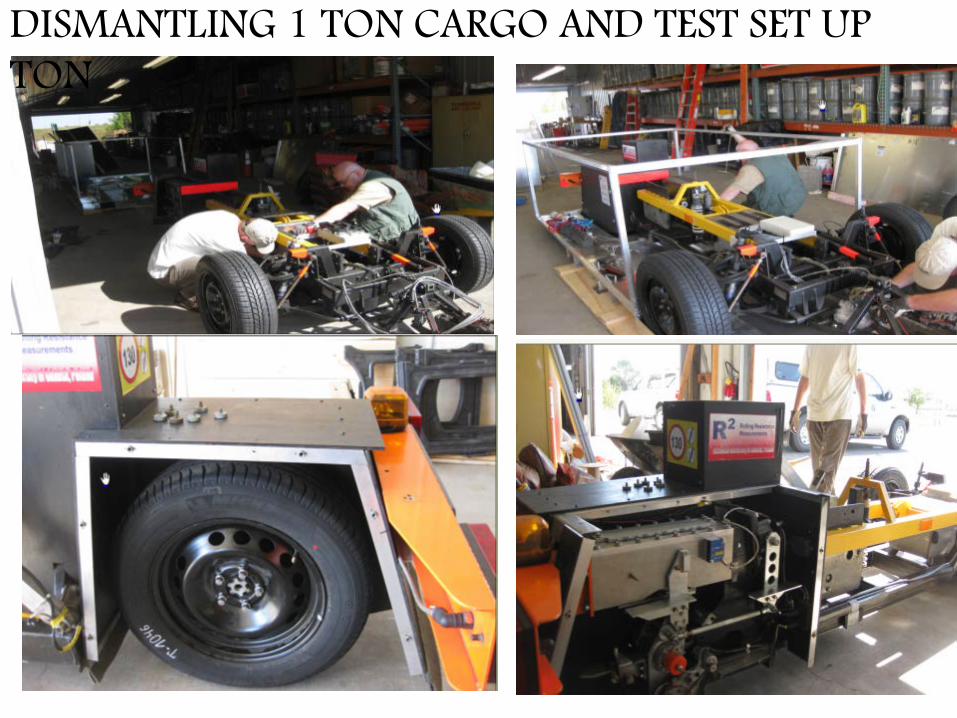
DISMANTLING 1 TON CARGO AND TEST SET UP TON

TEST SET UP

RESEARCH MATRIX FORWARD AND REVERSE RUN 50 km/h 70 km/h 90km/hr
AV4 SRTT MIPR AV4 SRTT MIPR AV4 SRTT MIPR
MnROAD Mainline Driving Lane (2 Runs each Direction)
x x x x x x x x x
MnROAD LVR Inside (Traffic) Lane (2 runs each Direction)
x x x x x x x x x
Stone Matrix Asphalt TH 212 in Waconia MN (3 Runs each Direction)
x x x x x x x x x
Presenter
Presentation Notes
MnROAD Cells

Test tires (from the left: SRTT, AV4, MIPR)
TEST TIRES
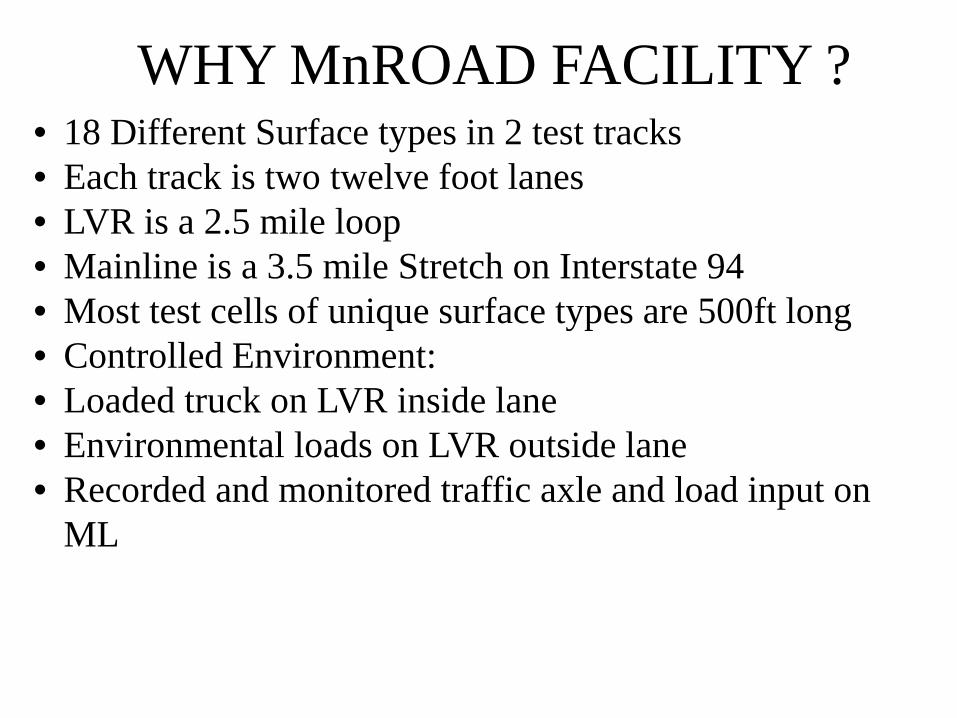
WHY MnROAD FACILITY ? • 18 Different Surface types in 2 test tracks • Each track is two twelve foot lanes • LVR is a 2.5 mile loop • Mainline is a 3.5 mile Stretch on Interstate 94 • Most test cells of unique surface types are 500ft long • Controlled Environment: • Loaded truck on LVR inside lane • Environmental loads on LVR outside lane • Recorded and monitored traffic axle and load input on
ML
A long-term accelerated pavement testing facility that gives researchers a unique, real-life
laboratory to study and evaluate the performance of materials used in roadway construction.
MnROAD MnDOT Office of Materials and Road Research
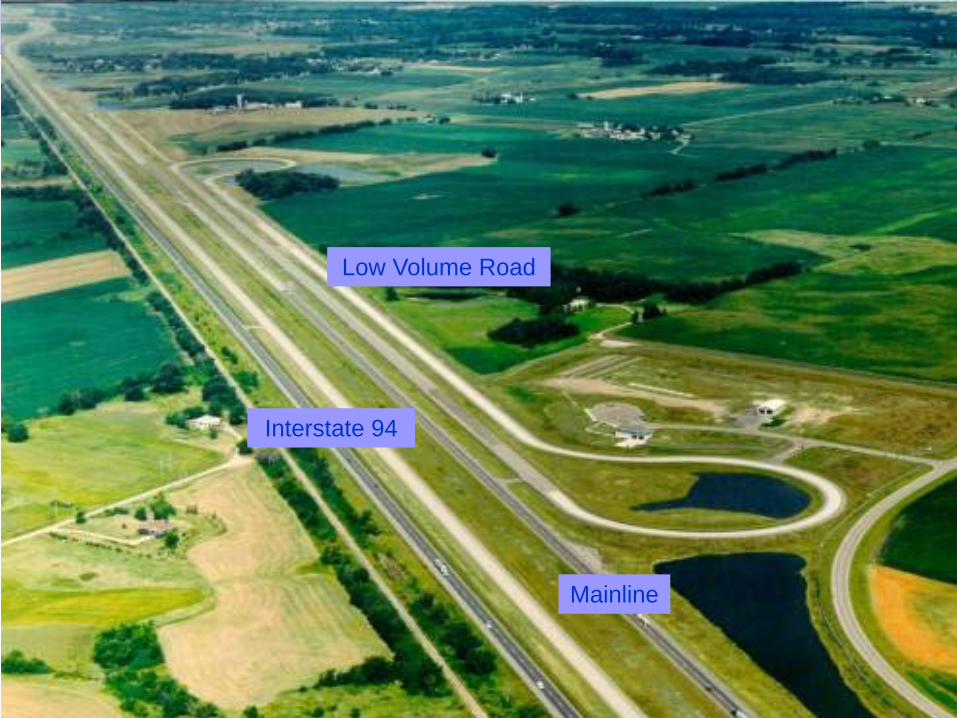
Low Volume Road
Mainline
Interstate 94
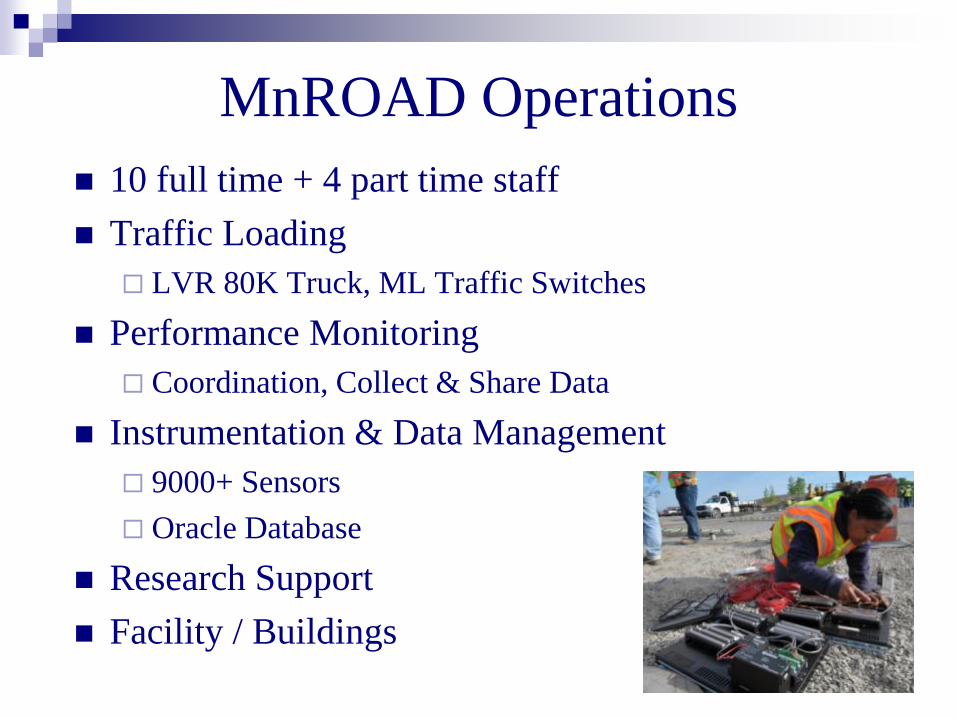
MnROAD Operations 10 full time + 4 part time staff Traffic Loading
LVR 80K Truck, ML Traffic Switches Performance Monitoring
Coordination, Collect & Share Data Instrumentation & Data Management
9000+ Sensors Oracle Database
Research Support Facility / Buildings
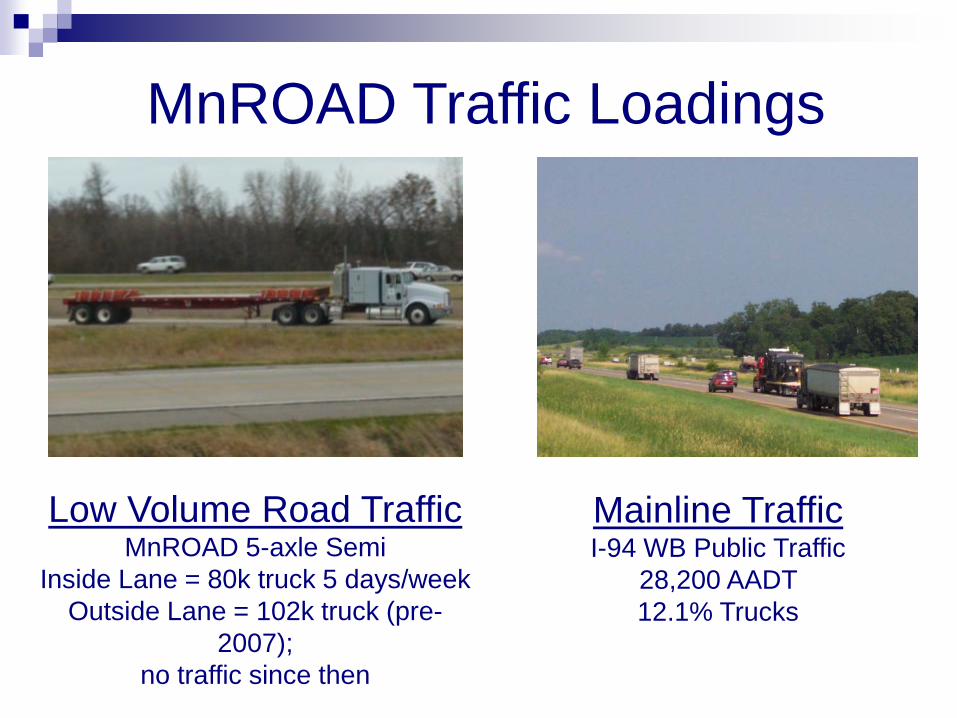
Low Volume Road Traffic MnROAD 5-axle Semi
Inside Lane = 80k truck 5 days/week Outside Lane = 102k truck (pre-
2007); no traffic since then
Mainline Traffic I-94 WB Public Traffic
28,200 AADT 12.1% Trucks
MnROAD Traffic Loadings

Conventional Diamond Grind Cells 5, 8, 37 (TS3) and 71 (Passing) • Groove Width – 3.75 mm • Groove Depth – 1.2 mm • Asperity Interval – 6
Innovative Diamond Grind Cells 7 and 37 (TS1 and 2) • Groove Width – 3.75 mm • Groove Depth – 1.25 mm • Asperity Interval – 12.5 • TS1 – 1 Pass • TS2 – 2 Pass
Ultimate Diamond Grind Cell 9 • Groove Width – 3.75 mm • Groove Depth – 8 mm • Asperity Interval – 15
2010 Ultimate Diamond Grind Cells 37 (TS5) and 71 (Driving). Replicate of I-35 Duluth Grind • Groove Width – 3.75 mm • Groove Depth – 8 mm • Asperity Interval – 15
Transverse Broom Drag Cell 5, Cell 53 Inside • Groove Width – 2 mm • Groove Depth – 1 mm • Asperity Interval – 2 Outside • Groove Width – 3 mm • Groove Depth – 1.5 mm • Asperity Interval – 2
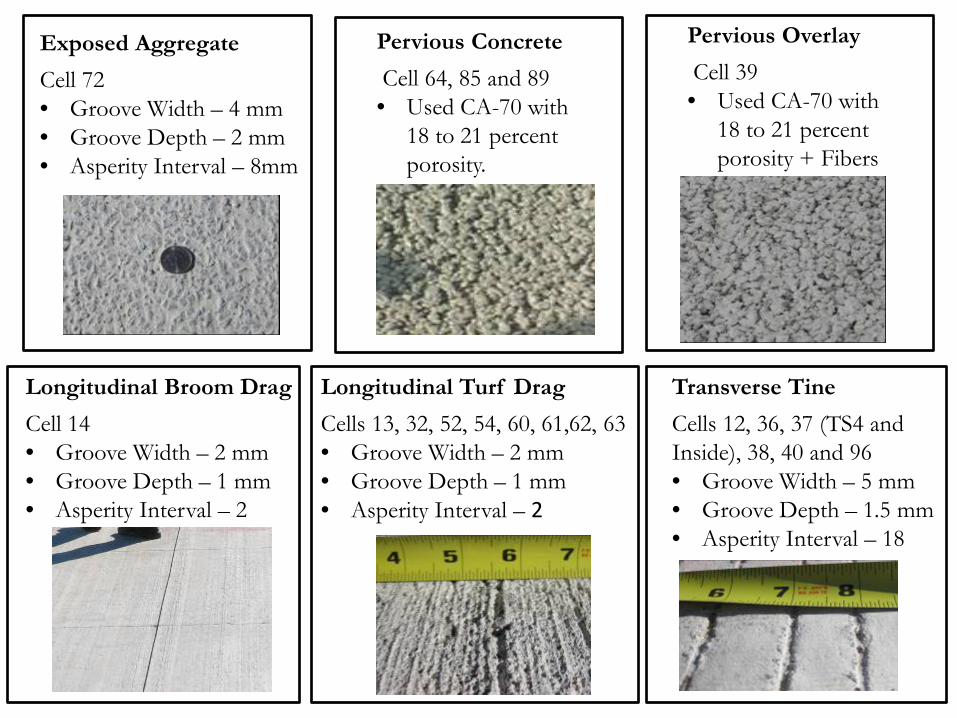
Exposed Aggregate Cell 72 • Groove Width – 4 mm • Groove Depth – 2 mm • Asperity Interval – 8mm
Pervious Concrete Cell 64, 85 and 89 • Used CA-70 with
18 to 21 percent porosity.
Pervious Overlay Cell 39 • Used CA-70 with
18 to 21 percent porosity + Fibers
Longitudinal Turf Drag Cells 13, 32, 52, 54, 60, 61,62, 63 • Groove Width – 2 mm • Groove Depth – 1 mm • Asperity Interval – 2
Longitudinal Broom Drag Cell 14 • Groove Width – 2 mm • Groove Depth – 1 mm • Asperity Interval – 2
Transverse Tine Cells 12, 36, 37 (TS4 and Inside), 38, 40 and 96 • Groove Width – 5 mm • Groove Depth – 1.5 mm • Asperity Interval – 18
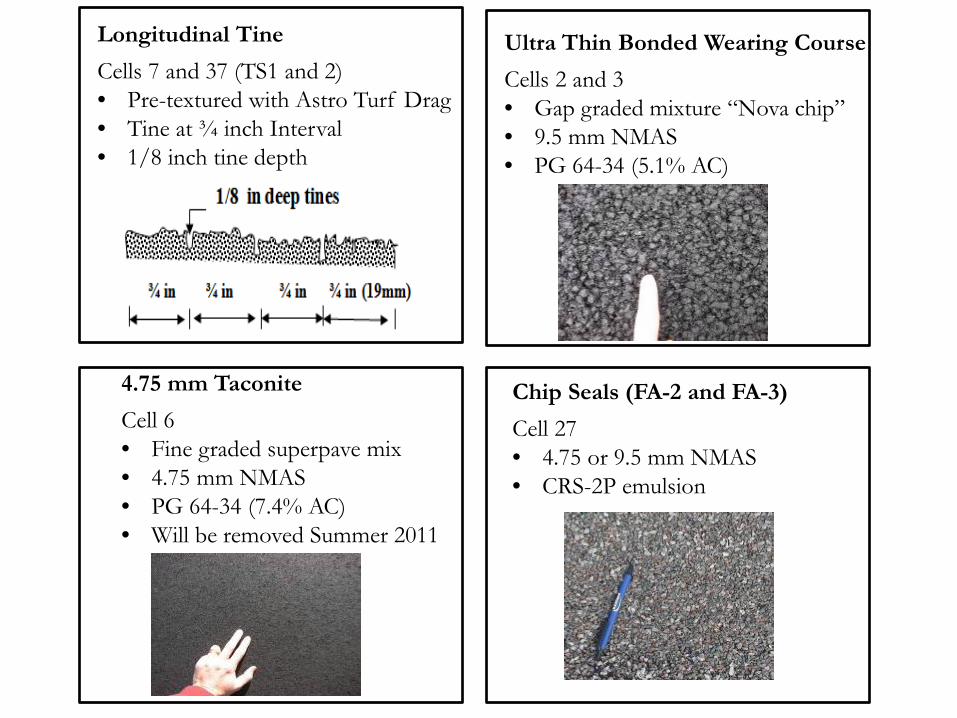
Longitudinal Tine Cells 7 and 37 (TS1 and 2) • Pre-textured with Astro Turf Drag • Tine at ¾ inch Interval • 1/8 inch tine depth
Ultra Thin Bonded Wearing Course Cells 2 and 3 • Gap graded mixture “Nova chip” • 9.5 mm NMAS • PG 64-34 (5.1% AC)
4.75 mm Taconite Cell 6 • Fine graded superpave mix • 4.75 mm NMAS • PG 64-34 (7.4% AC) • Will be removed Summer 2011
Chip Seals (FA-2 and FA-3) Cell 27 • 4.75 or 9.5 mm NMAS • CRS-2P emulsion
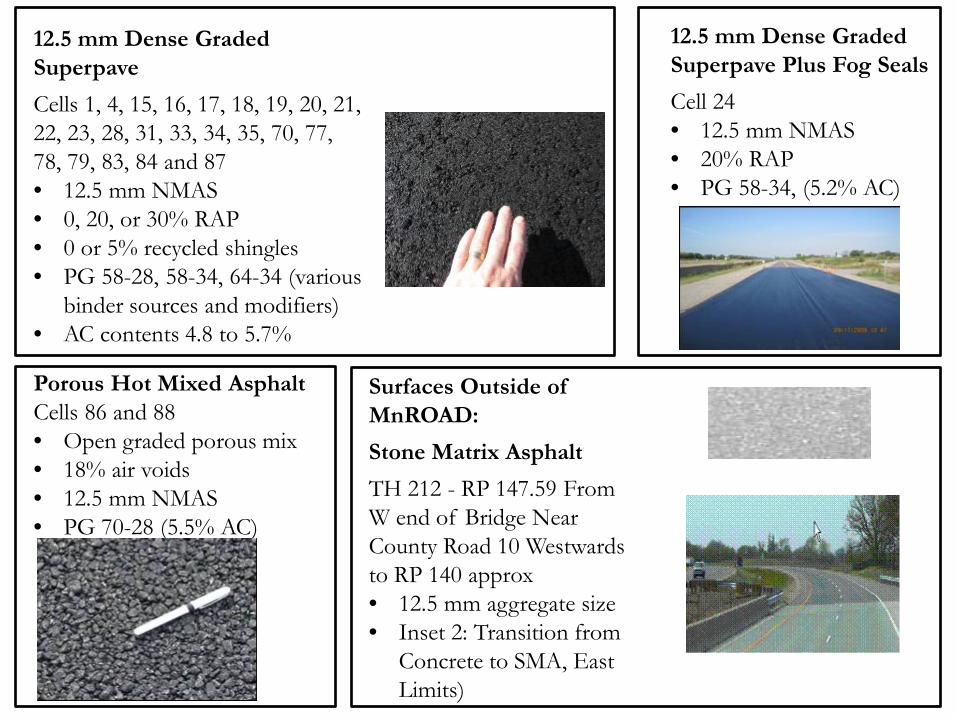
12.5 mm Dense Graded Superpave Cells 1, 4, 15, 16, 17, 18, 19, 20, 21, 22, 23, 28, 31, 33, 34, 35, 70, 77, 78, 79, 83, 84 and 87 • 12.5 mm NMAS • 0, 20, or 30% RAP • 0 or 5% recycled shingles • PG 58-28, 58-34, 64-34 (various
binder sources and modifiers) • AC contents 4.8 to 5.7%
12.5 mm Dense Graded Superpave Plus Fog Seals Cell 24 • 12.5 mm NMAS • 20% RAP • PG 58-34, (5.2% AC)
Porous Hot Mixed Asphalt Cells 86 and 88 • Open graded porous mix • 18% air voids • 12.5 mm NMAS • PG 70-28 (5.5% AC)
Surfaces Outside of MnROAD: Stone Matrix Asphalt TH 212 - RP 147.59 From W end of Bridge Near County Road 10 Westwards to RP 140 approx • 12.5 mm aggregate size • Inset 2: Transition from
Concrete to SMA, East Limits)
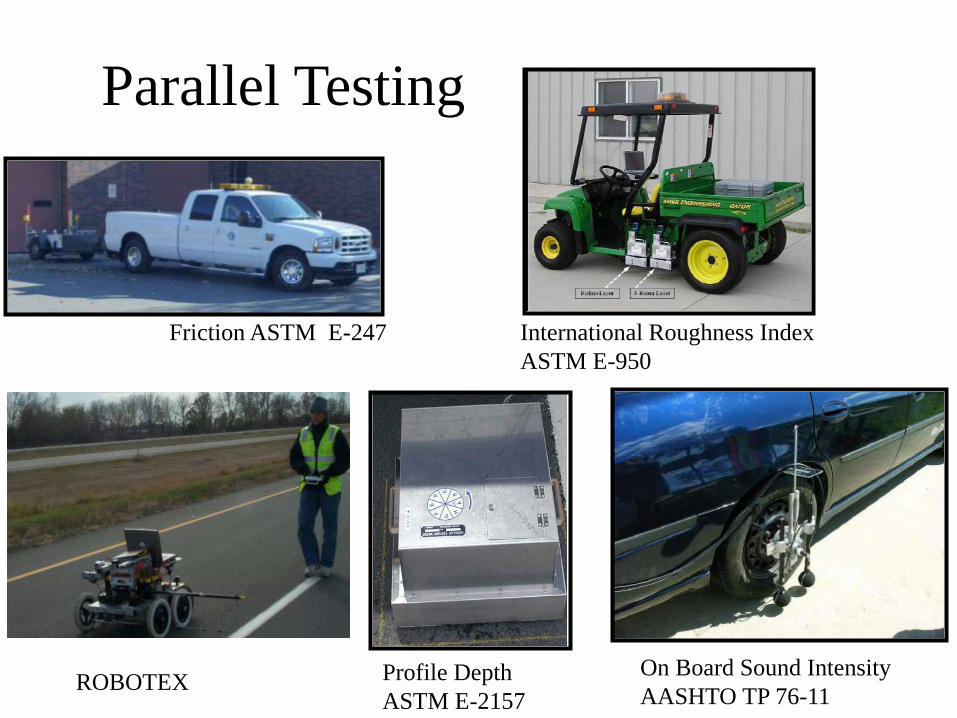
Parallel Testing
On Board Sound Intensity AASHTO TP 76-11
Friction ASTM E-247 International Roughness Index ASTM E-950
Profile Depth ASTM E-2157
ROBOTEX

TEST RESULTS UPPER RR

Surface Ranking Lower RR
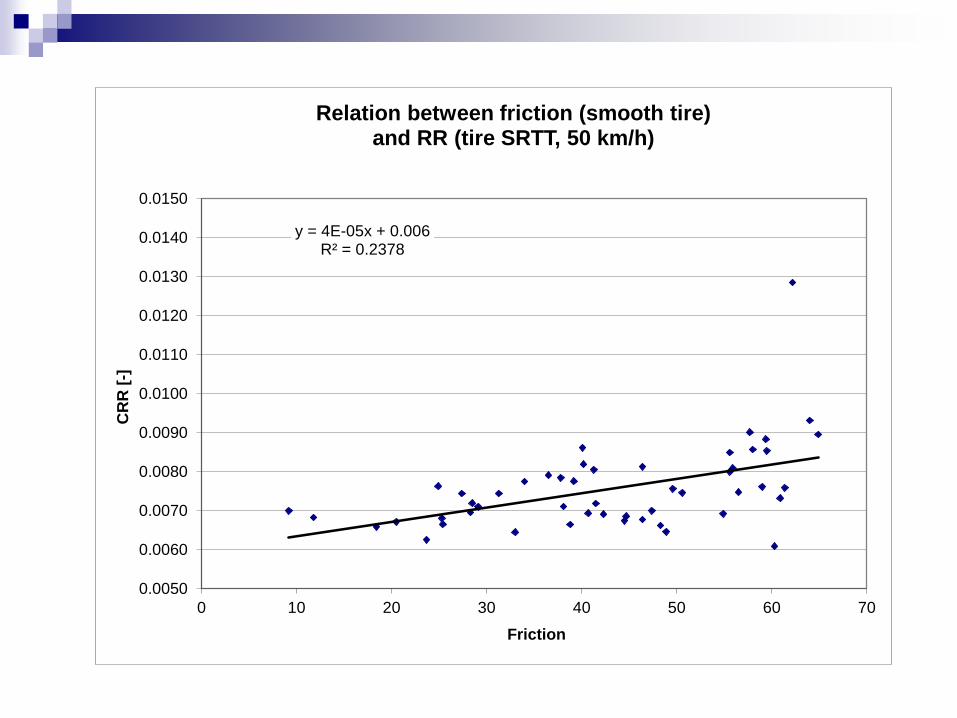
y = 4E-05x + 0.006 R² = 0.2378
0.0050
0.0060
0.0070
0.0080
0.0090
0.0100
0.0110
0.0120
0.0130
0.0140
0.0150
0 10 20 30 40 50 60 70
CR
R [-
]
Friction
Relation between friction (smooth tire) and RR (tire SRTT, 50 km/h)
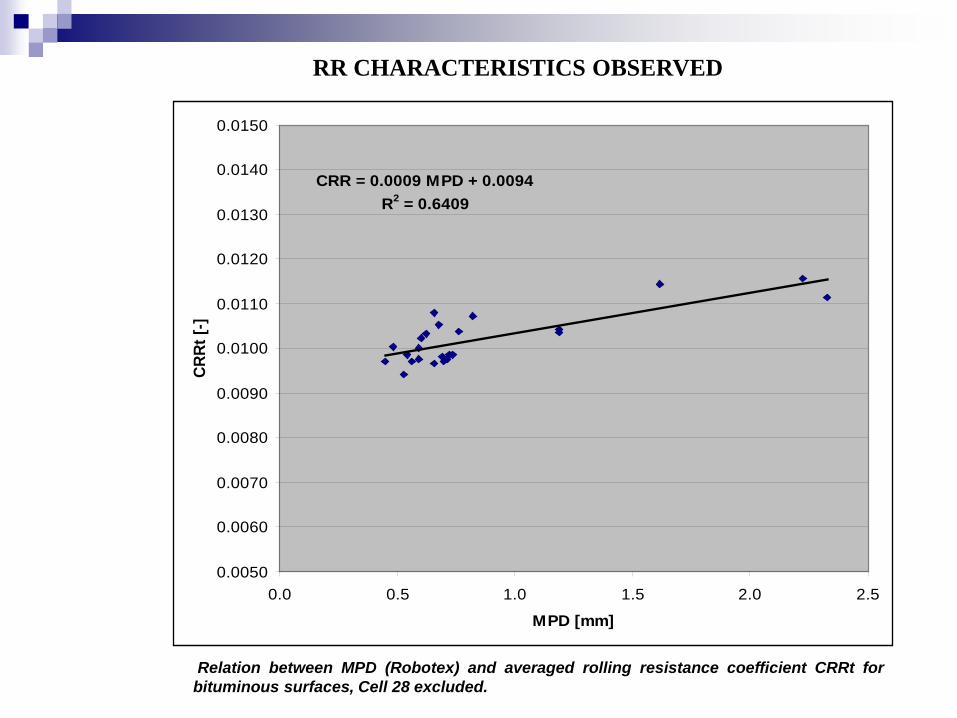
CRR = 0.0009 MPD + 0.0094R2 = 0.6409
0.0050
0.0060
0.0070
0.0080
0.0090
0.0100
0.0110
0.0120
0.0130
0.0140
0.0150
0.0 0.5 1.0 1.5 2.0 2.5
MPD [mm]
CRRt
[-]
Relation between MPD (Robotex) and averaged rolling resistance coefficient CRRt for bituminous surfaces, Cell 28 excluded.
RR CHARACTERISTICS OBSERVED
0.00
0.10
0.20
0.30
0.40
0.50
0.60
0.70
0.80
0.90
1.00R
R D
eter
min
atio
n C
oeff
icie
nts
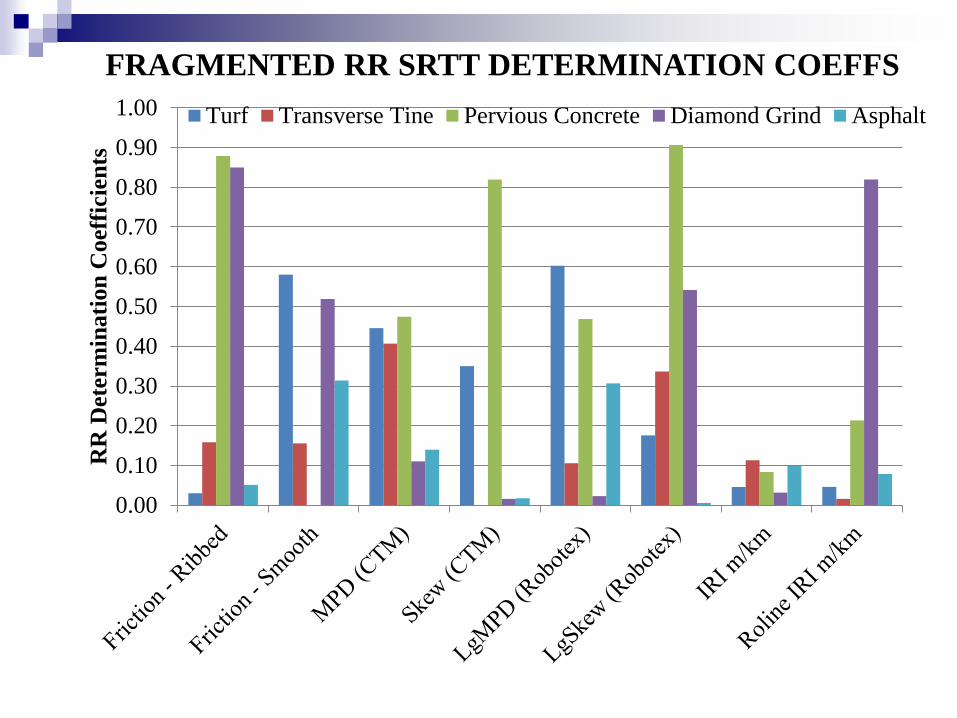
Turf Transverse Tine Pervious Concrete Diamond Grind Asphalt
FRAGMENTED RR SRTT DETERMINATION COEFFS

• There is an order of RR in surface textures. It is conclusive that the drag textures have the least RR. Other textures may be compared but not without mention of some confidence level. Softer, raveled uneven surfaces appear to exhibit high rolling resistance • Variation of temperature may have distorted the correlation because of
possibility of non representative temperature correction procedure based on ISO28580.
•Another variant of MPD, namely when the profile has first been modified by a mathematical function (envelopment) (Hamet 2003) to simulate tire deflection, the calculated MPD on this modified profile is likely more correlated to RR. This may be especially important for the many special textures included in this dataset (grooved concrete).
DISCUSSION

• It may also be that the precision and repeatability of the
rolling resistance measurements have been different from measurements in Sweden and Denmark, where distances of several hundred meters have generally been used for each test section. MnRoad facility permitted non-disturbed measurements in both directions (3x2 runs for each surface/tire/speed combination) and that should equalize shorter section length.
• Fragmenting the data into texture types seemed to produce
better coefficients of Determination between RR and Surface Characteristics.
CONCLUSION

THE WAY FORWARD It is possible that each texture type has a unique RR
variability function. Identification of individual RR function for various texture types may enhance better prediction model.
CONTINUING RESEARCH IS NEEDED!!! Periodic 2-year interval of measurements of the
MnROAD Cells is recommended. Other test tracks: SMART Road, NCAT may be measured also to facilitate a robust database.
Results of MnROAD RR testing is being reviewed and will be published in March 2012. (Look out for it)

QUESTIONS