Institutional Presentation - February, 2015
48
February, 2015. Localiza Rent a Car S.A. Institutional Presentation 1
-
Upload
localiza -
Category
Economy & Finance
-
view
167 -
download
5
Transcript of Institutional Presentation - February, 2015

February, 2015.
Localiza Rent a Car S.A.Institutional Presentation
1
1. Company overview
2. Main business divisions
� Car Rental
� Fleet Rental
� Seminovos
3. Consolidated
Appendix: Earnings release 4Q14
Agenda
2
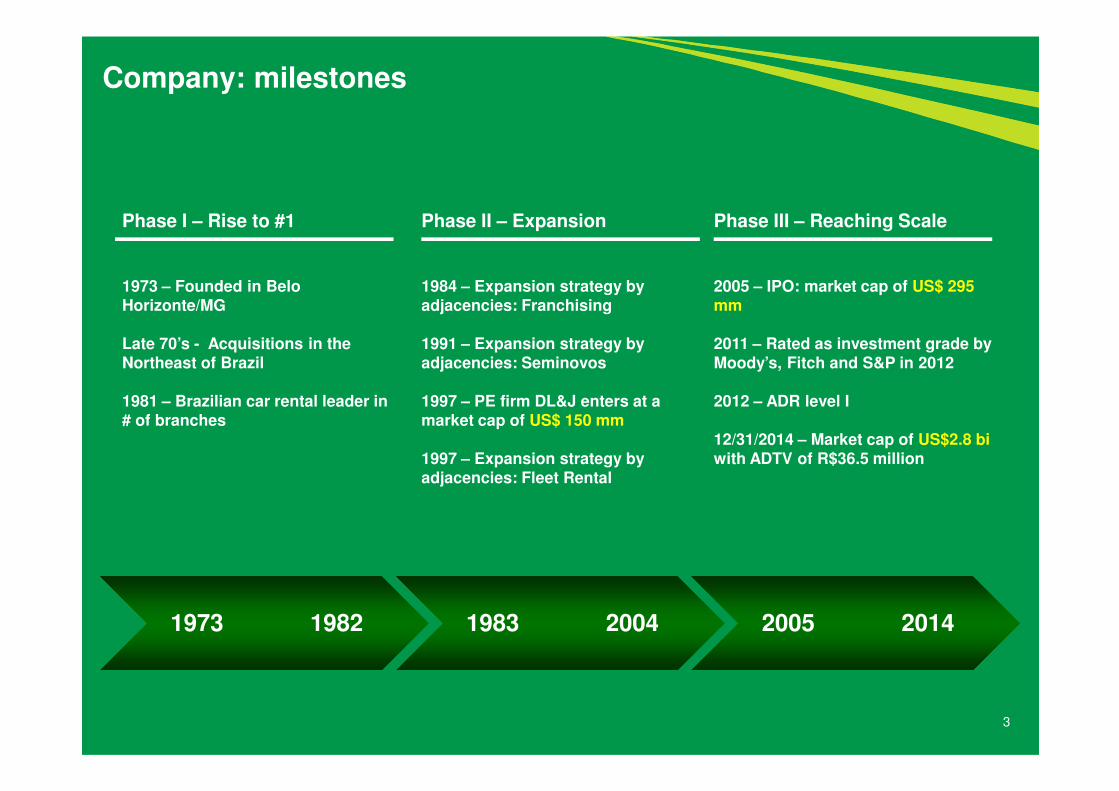
Company: milestones
Phase I – Rise to #1
1973 – Founded in Belo Horizonte/MG
Late 70’s - Acquisitions in the Northeast of Brazil
1981 – Brazilian car rental leader in # of branches
Phase II – Expansion
1984 – Expansion strategy by adjacencies: Franchising
1991 – Expansion strategy by adjacencies: Seminovos
1997 – PE firm DL&J enters at a market cap of US$ 150 mm
1997 – Expansion strategy by adjacencies: Fleet Rental
Phase III – Reaching Scale
2005 – IPO: market cap of US$ 295 mm
2011 – Rated as investment grade by Moody’s, Fitch and S&P in 2012
2012 – ADR level I
12/31/2014 – Market cap of US$2.8 bi with ADTV of R$36.5 million
1973 1982 1983 2004 2005 2014
3
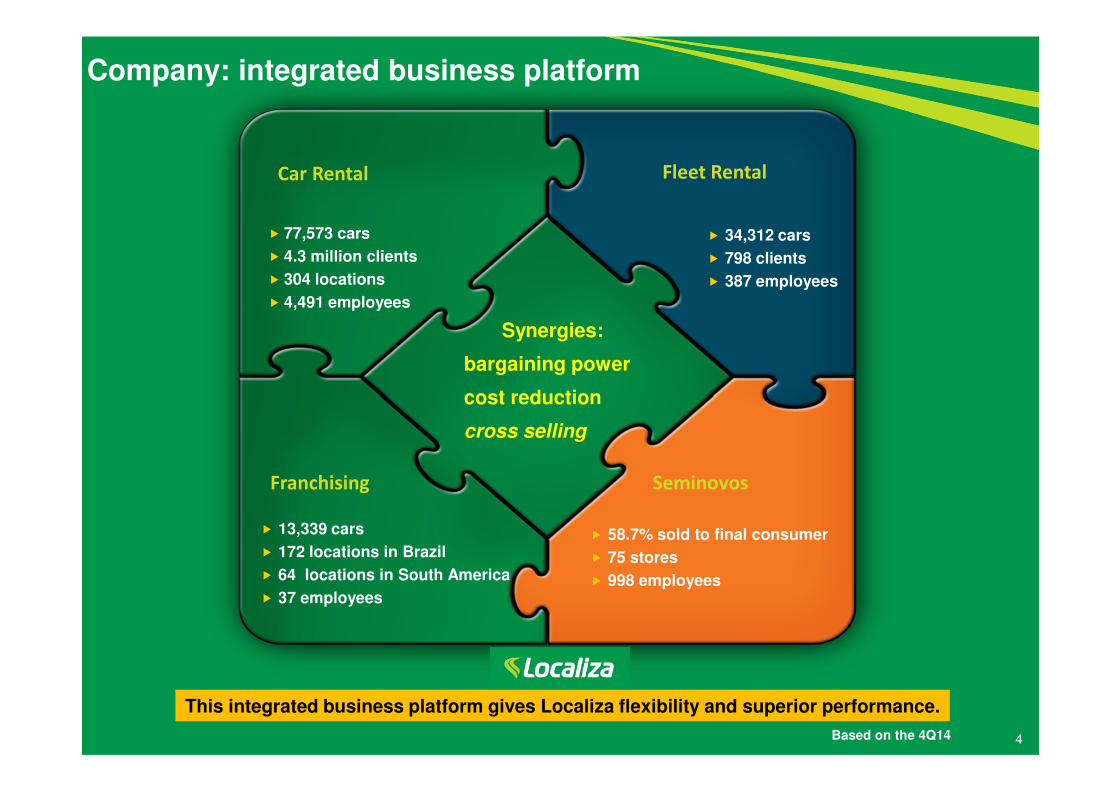
Company: integrated business platform
Synergies:
bargaining power
cost reduction
cross selling
� 13,339 cars
� 172 locations in Brazil
� 64 locations in South America
� 37 employees
� 58.7% sold to final consumer
� 75 stores
� 998 employees
� 77,573 cars
� 4.3 million clients
� 304 locations
� 4,491 employees
� 34,312 cars
� 798 clients
� 387 employees
This integrated business platform gives Localiza flexibility and superior performance.
Based on the 4Q14 4
Car Rental Fleet Rental
SeminovosFranchising
35%
65%
5
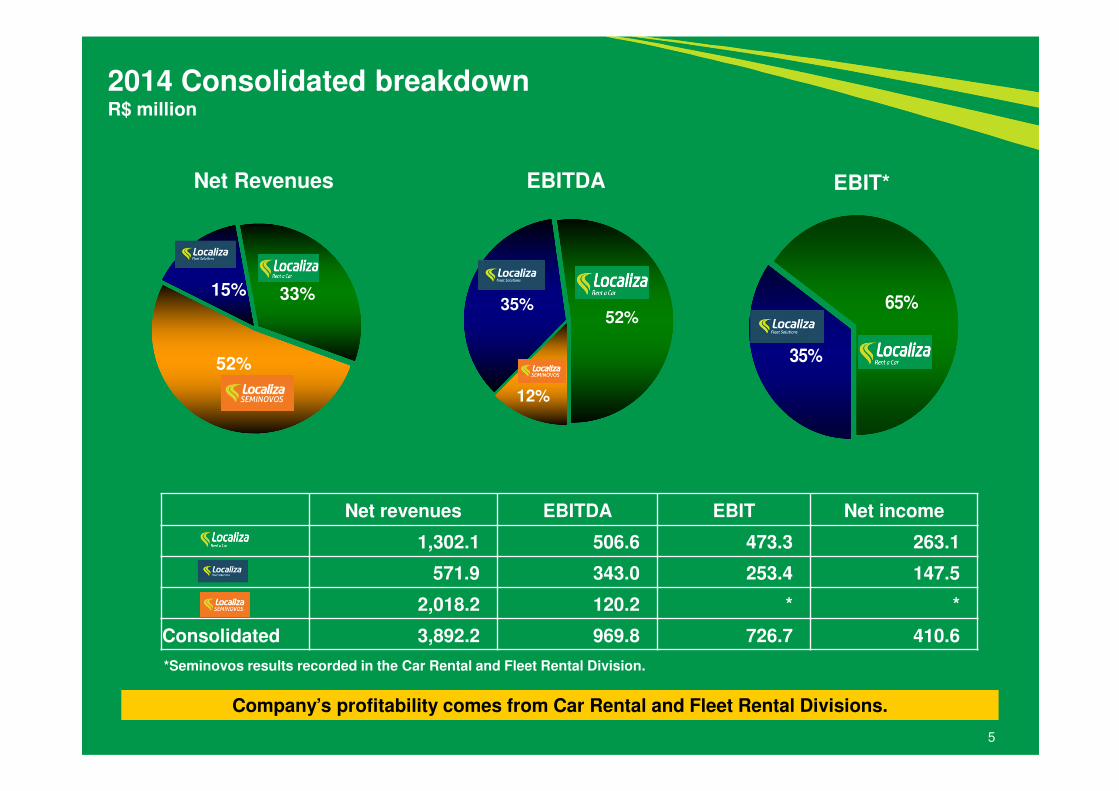
2014 Consolidated breakdownR$ million
Net Revenues EBITDA
12%
35%52%
52%
15% 33%
Company’s profitability comes from Car Rental and Fleet Rental Divisions.
EBIT*
Net revenues EBITDA EBIT Net income
1,302.1 506.6 473.3 263.1
571.9 343.0 253.4 147.5
2,018.2 120.2 * *
Consolidated 3,892.2 969.8 726.7 410.6
*Seminovos results recorded in the Car Rental and Fleet Rental Division.
6
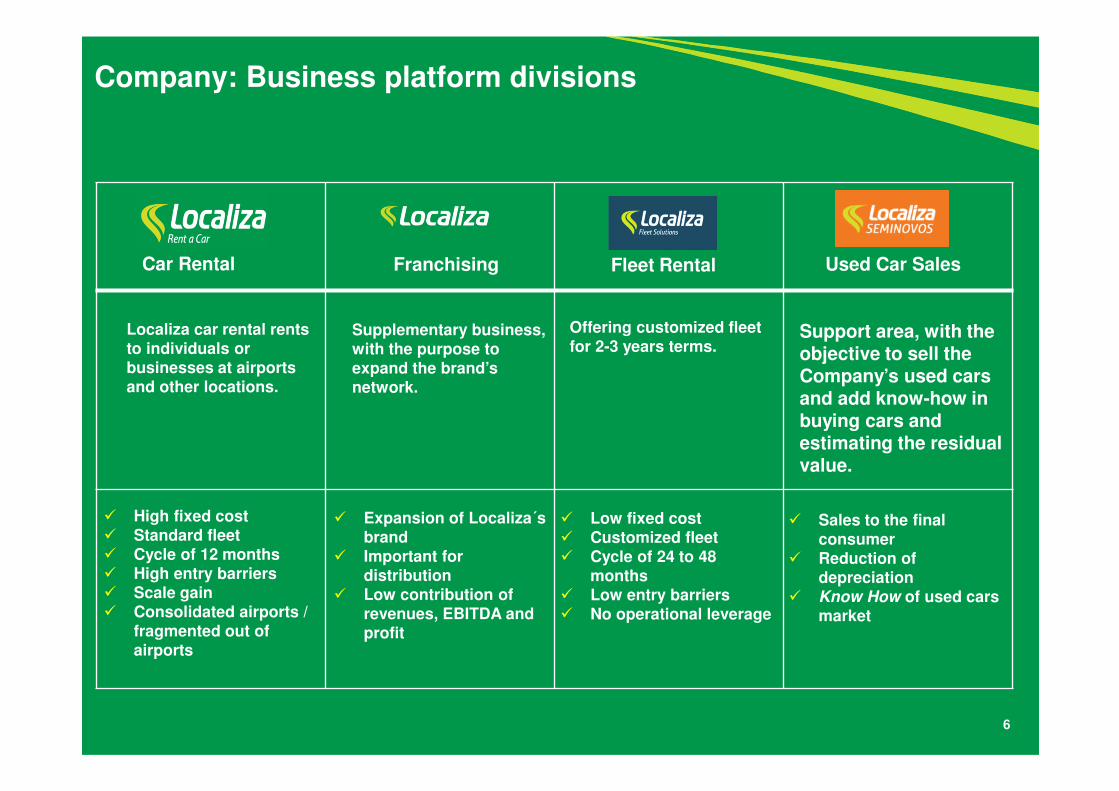
� High fixed cost� Standard fleet� Cycle of 12 months� High entry barriers� Scale gain� Consolidated airports /
fragmented out of airports
� Sales to the final consumer
� Reduction ofdepreciation
� Know How of used carsmarket
� Expansion of Localiza´sbrand
� Important for distribution
� Low contribution ofrevenues, EBITDA andprofit
Company: Business platform divisions
Car Rental
Localiza car rental rents to individuals or businesses at airports and other locations.
Franchising
Supplementary business, with the purpose to expand the brand’s network.
Fleet Rental
Offering customized fleet for 2-3 years terms.
Used Car Sales
Support area, with the objective to sell the Company’s used cars and add know-how in buying cars and estimating the residual value.
� Low fixed cost� Customized fleet� Cycle of 24 to 48
months� Low entry barriers� No operational leverage

1,462.8 1,699.2 1,802.5 1,821.8
2010 2011 2012 2013
Rental revenues evolution
4,637.6 4,692.1 4,791.3 4,698.2
2010 2011 2012 2013
Localiza’s rental revenues at constant prices
Sector’s revenue at constant prices (ex- Localiza)
GDP 7.5% 2.7% 1.0% 2.5%
Average GDP growth: 2.7%
Source: ABLA (Brazilian Car Rental Association) and Localiza. 7
The Company grew at an average of 2.8x GDP and 19.0x the sector.
8
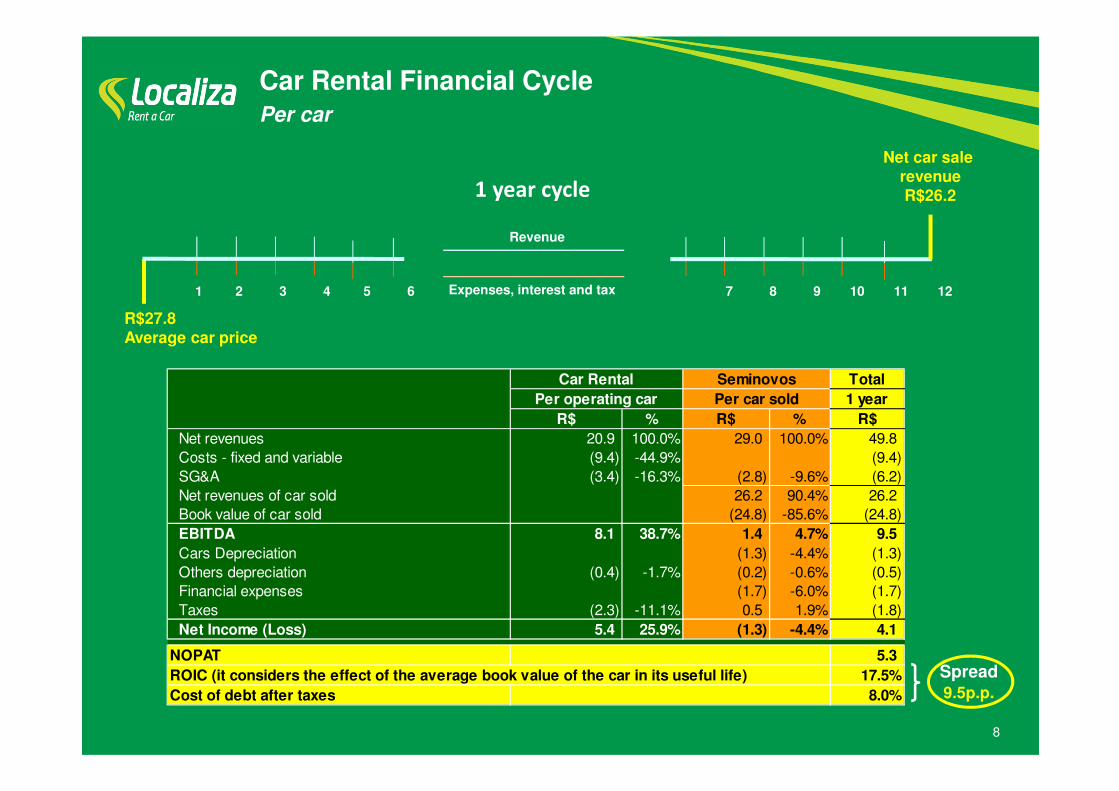
Net car salerevenue R$26.21 year cycle
Car Rental Financial CyclePer car
R$27.8Average car price
1 2 3 4 5 6 7 8 9 10 11 12Expenses, interest and tax
Revenue
Spread9.5p.p.
Total
1 year
R$ % R$ % R$
Net revenues 20.9 100.0% 29.0 100.0% 49.8
Costs - fixed and variable (9.4) -44.9% (9.4)
SG&A (3.4) -16.3% (2.8) -9.6% (6.2)
Net revenues of car sold 26.2 90.4% 26.2
Book value of car sold (24.8) -85.6% (24.8)
EBITDA 8.1 38.7% 1.4 4.7% 9.5
Cars Depreciation (1.3) -4.4% (1.3)
Others depreciation (0.4) -1.7% (0.2) -0.6% (0.5)
Financial expenses (1.7) -6.0% (1.7)
Taxes (2.3) -11.1% 0.5 1.9% (1.8)
Net Income (Loss) 5.4 25.9% (1.3) -4.4% 4.1
NOPAT 5.3
ROIC (it considers the effect of the average book value of the car in its useful life) 17.5%
Cost of debt after taxes 8.0%
Car Rental Seminovos
Per car soldPer operating car

9
Net car salerevenue R$24.4
3 year cycle
Fleet Rental Financial Cycle
Per car
Spread9.5p.p.
1 2 3 4 5 6 19 20 21 22 23 24Expenses, interest and tax
Revenue
R$33.3Average car price
Total
3 years
R$ % Seminovos % R$
Net revenues 55.7 100.0% 26.9 100.0% 82.6
Costs - fixed and variable (18.6) -33.4% (18.6)
SG&A (3.7) -6.7% (2.5) -9.3% (6.2)
Net revenues of car sold 24.4 90.7% 24.4
Book value of car sold (21.2) -78.9% (21.2)
EBITDA 33.4 60.0% 3.2 11.8% 36.6
Cars Depreciation (12.6) -46.9% (12.6)
Others depreciation (0.1) -0.2% (0.1) -0.2% (0.2)
Financial expenses (4.4) -16.3% (4.4)
Taxes (10.0) -17.9% 4.2 15.5% (5.8)
Net Income (Loss) 23.3 41.8% (9.7) -36.1% 13.6
Net Income (Loss) - per year 7.8 41.8% (3.2) -36.1% 4.5
NOPAT 5.6
ROIC (it considers the effect of the average book value of the car in its useful life) 17.5%
Cost of debt after taxes 8.0%
Per operating car
Fleet Rental Seminovos
Per car sold

Raisingmoney Buying
cars
Renting Cars SellingCars
Source: ABLA (Brazilian Car Rental Association) and Localiza.
Cash to renew the fleet or pay debt
$
Profitability comes from rental divisions
Competitive advantages: 41 years of experience in managing assets
$
10
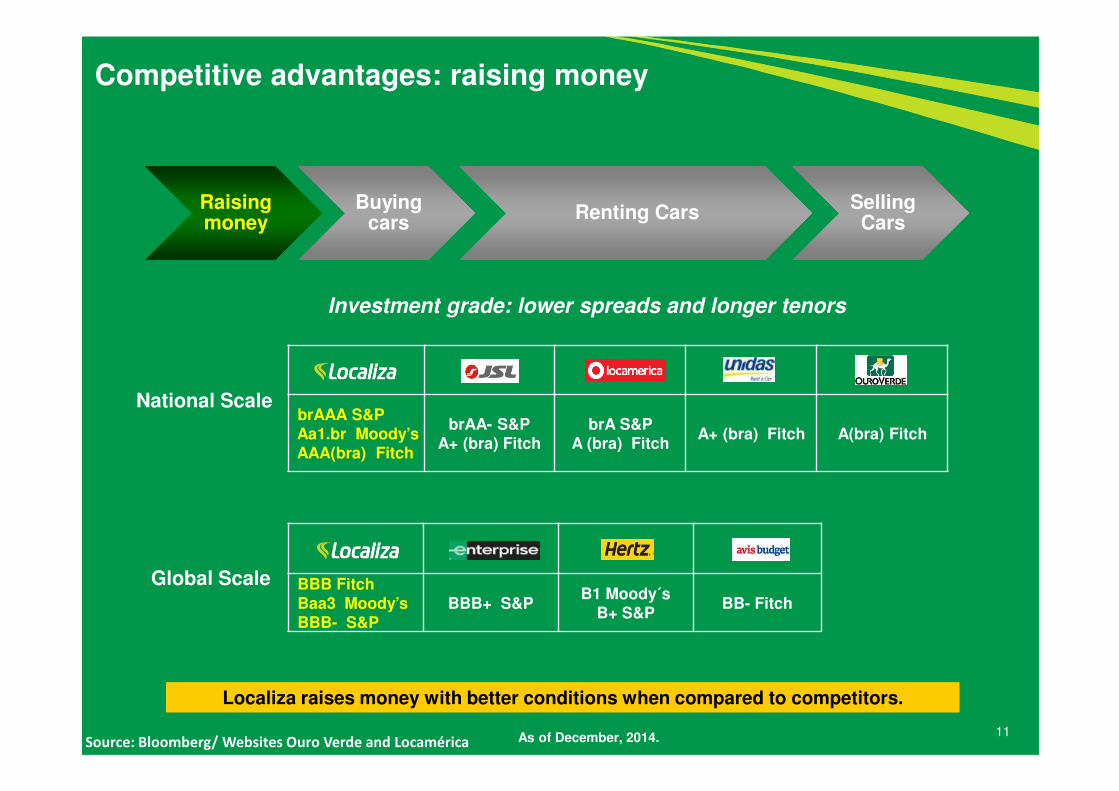
Competitive advantages: raising money
Global Scale
National Scale
Localiza raises money with better conditions when compared to competitors.
As of December, 2014.
BBB FitchBaa3 Moody’sBBB- S&P
BBB+ S&PB1 Moody´s
B+ S&PBB- Fitch
brAAA S&P Aa1.br Moody’sAAA(bra) Fitch
brAA- S&PA+ (bra) Fitch
brA S&P A (bra) Fitch
A+ (bra) Fitch A(bra) Fitch
Raisingmoney
Buyingcars
Renting CarsSellingCars
11
Investment grade: lower spreads and longer tenors
Source: Bloomberg/ Websites Ouro Verde and Locamérica

12
Competitive advantages: buying cars
Localiza buys cars with better conditions due to the volume of purchases.
Number of cars purchased - 2013
• Includes Franchising
78,779
18,8669,950
*
Source: each company website
Localiza’s share in the internal sales of the major OEMs - 2013
2.6%
Raisingmoney
Buyingcars
Renting CarsSellingCars
Localiza Unidas Locamerica
108
158
55
13
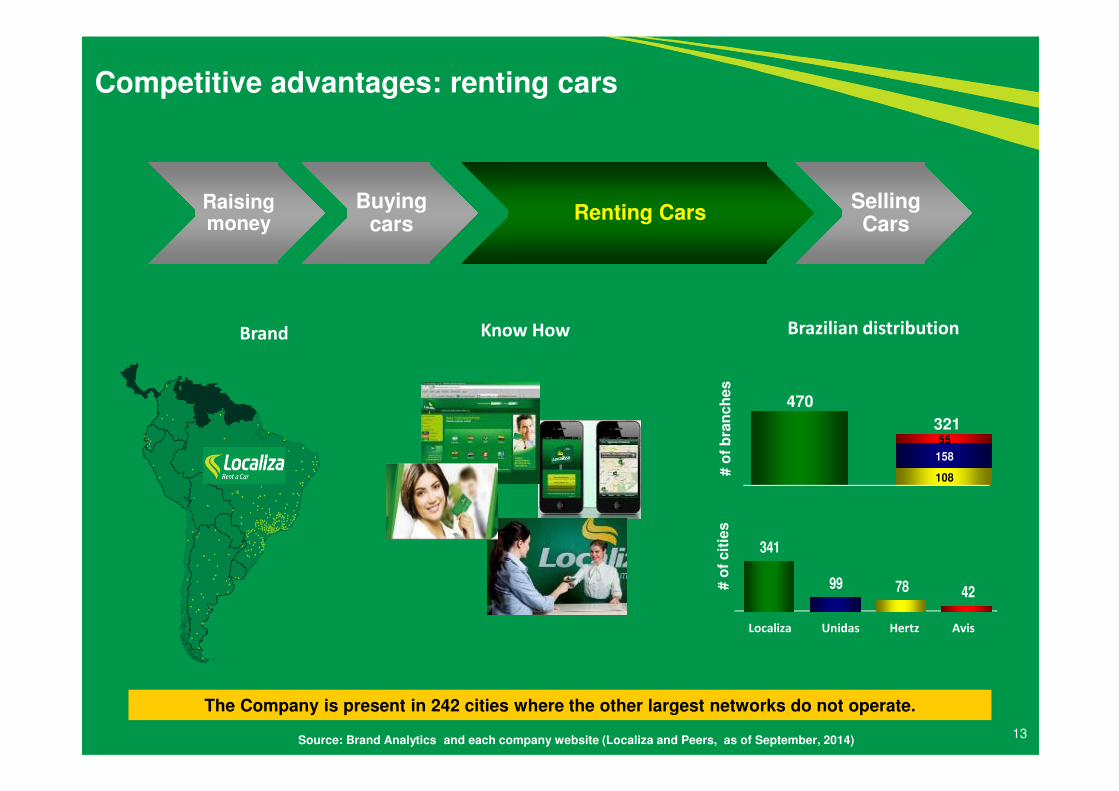
The Company is present in 242 cities where the other largest networks do not operate.
Competitive advantages: renting cars
Know HowBrand Brazilian distribution
# o
f b
ran
ch
es
# o
f cit
ies
Source: Brand Analytics and each company website (Localiza and Peers, as of September, 2014)
470
321
Raisingmoney
Buyingcars
Renting CarsSellingCars
Localiza Unidas Hertz Avis
341
99 78 42
14
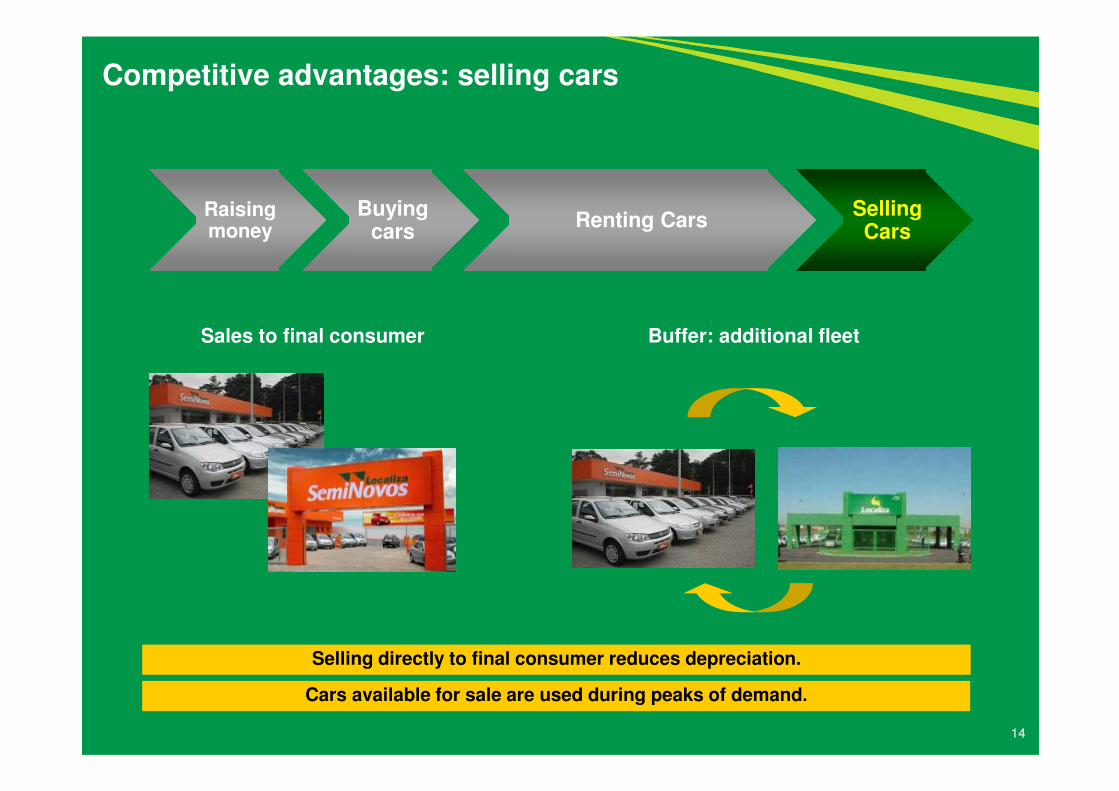
Sales to final consumer
Competitive advantages: selling cars
Selling directly to final consumer reduces depreciation.
Cars available for sale are used during peaks of demand.
Raisingmoney
Buyingcars
Renting CarsSellingCars
Buffer: additional fleet
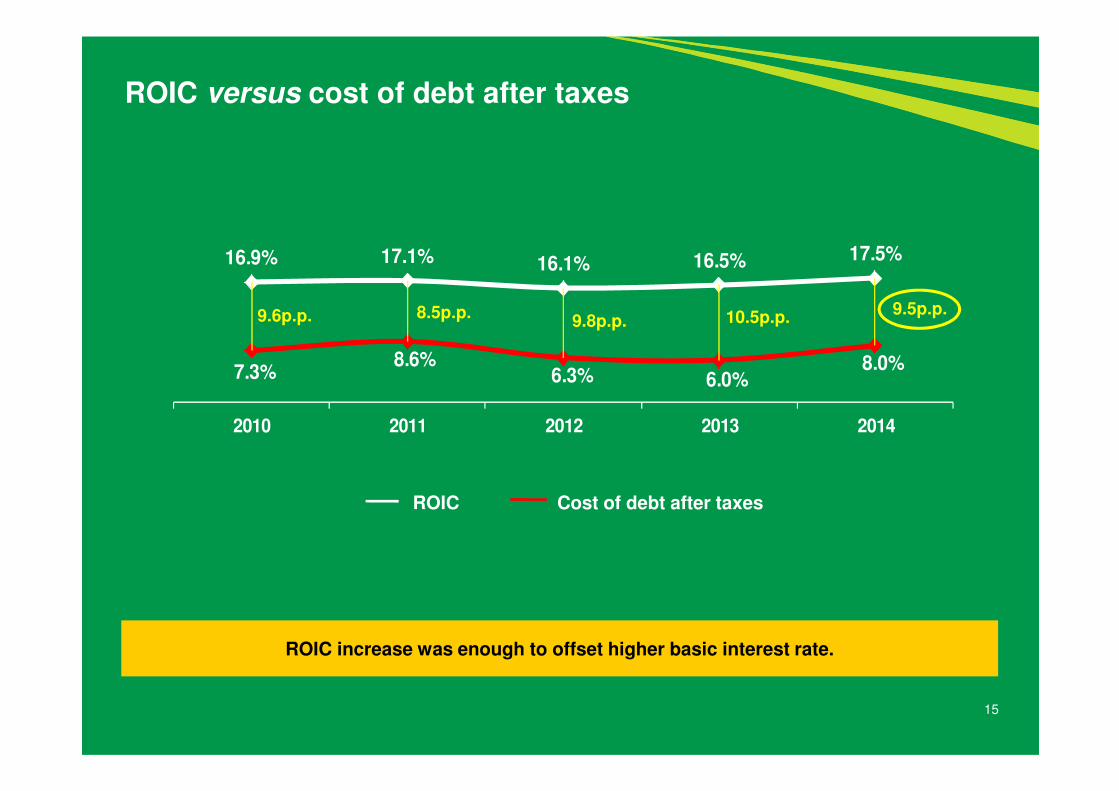
7.3%8.6%
6.3% 6.0%8.0%
16.9% 17.1% 16.1% 16.5% 17.5%
2010 2011 2012 2013 2014
15
ROIC versus cost of debt after taxes
9.6p.p. 8.5p.p. 9.5p.p.9.8p.p.
ROIC increase was enough to offset higher basic interest rate.
ROIC Cost of debt after taxes
10.5p.p.

ActivitiesCar and Fleet
rentalsCar and Fleet
rentals*Fleet rental*
Machinery, heavy
equipmentsand fleetrentals
Logistics, Car and Fleet and
rentals*Car Rental*
Fleet (End of Period) 125,224 40,296 30,291 25,326 40,807 11,695
Net Debt/EBITDA 1.4x 2.0x 3.2x 3.7x 4.2x 7.4x
Net Debt/ Equity 0.8x 0.9x 2.0x 8.5x 3.3x 1.9x
Industry overview
Source: ABLA, Companies’ Financial Statements.*9M14**Ouro Verde: Net Fleet Rental Revenue; Ouro Verde: EBITDA excludes selling of Martini Meat.
16
ROIC 2014ROE 2014

17
1. Company overview
2. Main business divisions
� Car Rental
� Fleet Rental
� Seminovos
3. Consolidated
Appendix: Earnings release 4Q14
Agenda
18
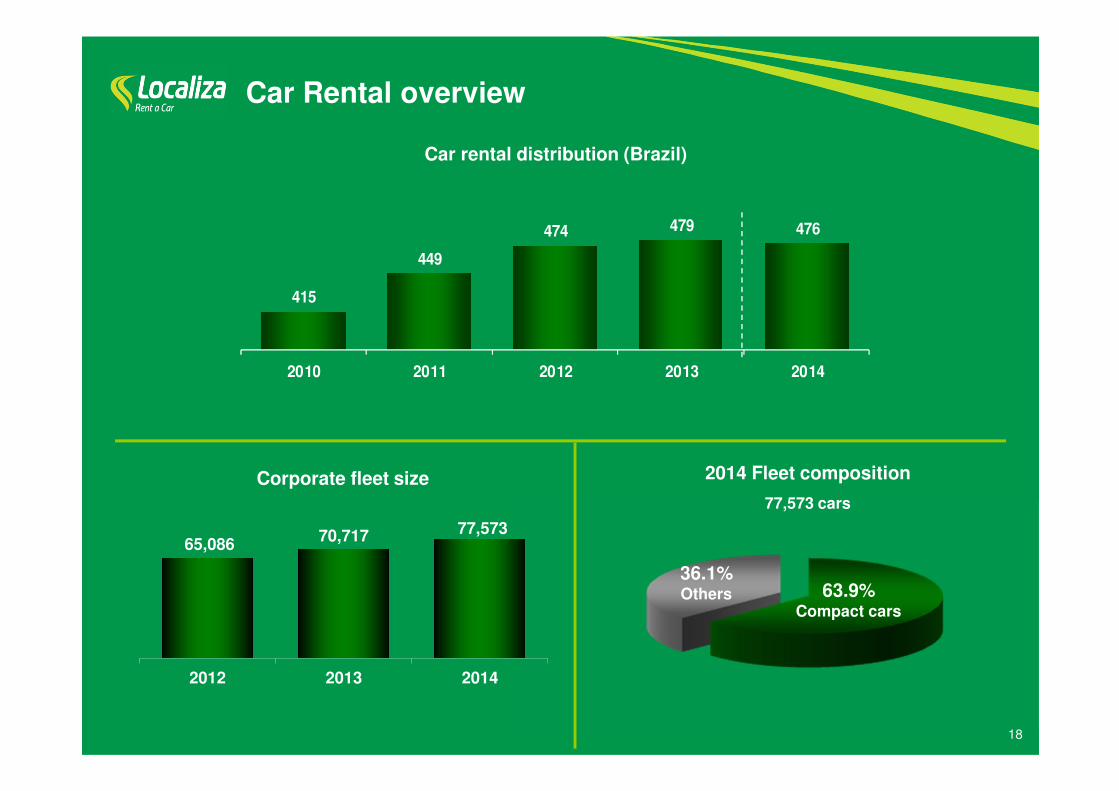
Car Rental overview
63.9%Compact cars
2014 Fleet composition
77,573 cars
36.1%Others
Corporate fleet size
65,08670,717 77,573
2012 2013 2014
Car rental distribution (Brazil)
415
449
474 479 476
2010 2011 2012 2013 2014
7082 89 90
2010 2011 2012 2013
19
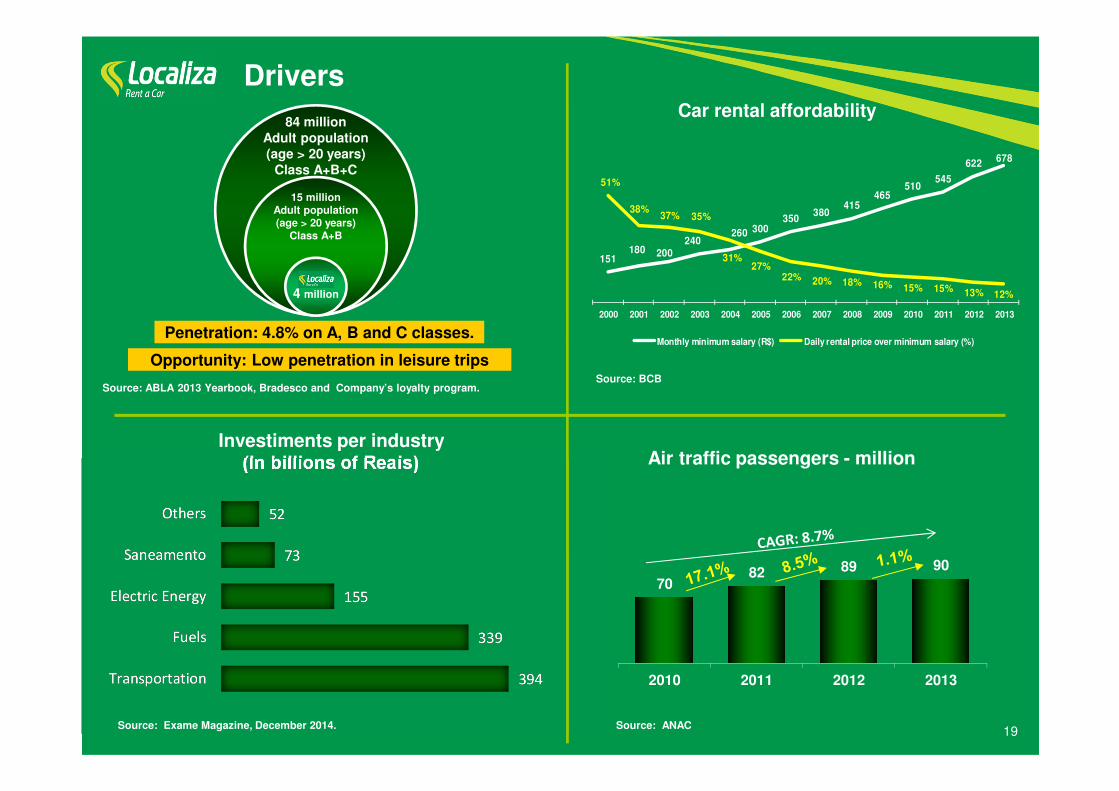
Drivers
Air traffic passengers - million
Source: BCB
151180 200
240260 300
350380
415465
510545
622678
51%
38%37% 35%
31%27%
22% 20% 18% 16% 15% 15% 13% 12%
2000 2001 2002 2003 2004 2005 2006 2007 2008 2009 2010 2011 2012 2013
Monthly minimum salary (R$) Daily rental price over minimum salary (%)
Car rental affordability
Investiments per industry(In billions of Reais)
Source: ABLA 2013 Yearbook, Bradesco and Company’s loyalty program.
Source: Exame Magazine, December 2014. Source: ANAC
4 million
84 millionAdult population(age > 20 years)
Class A+B+C
15 millionAdult population(age > 20 years)
Class A+B
Opportunity: Low penetration in leisure trips
Penetration: 4.8% on A, B and C classes.

20Source: RAIS 2012 and each company’s website (August 2014)
Off-airport market is still fragmented.
Airport locations Off-airport locations
Car Rental Locations in Brazil
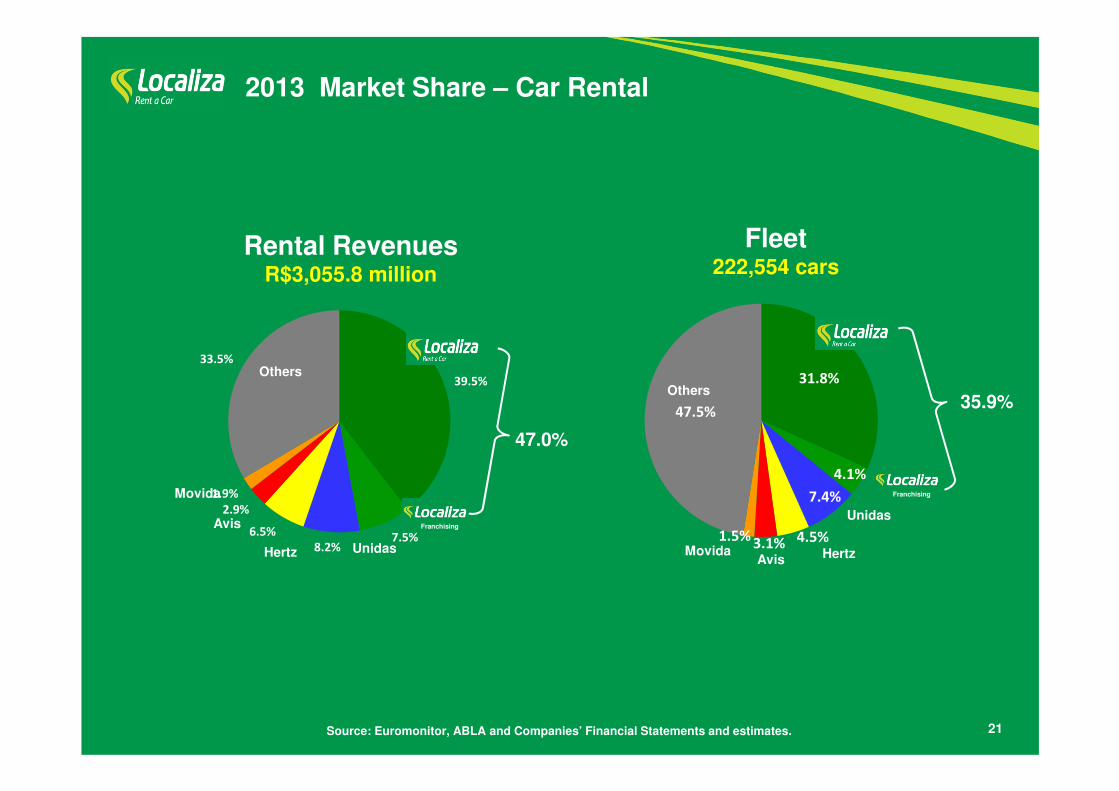
39.5%
7.5%8.2%
6.5%
2.9%
1.9%
33.5%
21
31.8%
4.1%
7.4%
4.5%3.1%1.5%
47.5%
47.0%
35.9%
Others
Movida
Avis
Hertz Unidas
Franchising
Franchising
Others
MovidaAvis Hertz
Unidas
2013 Market Share – Car Rental
Rental RevenuesR$3,055.8 million
Fleet222,554 cars
Source: Euromonitor, ABLA and Companies’ Financial Statements and estimates.
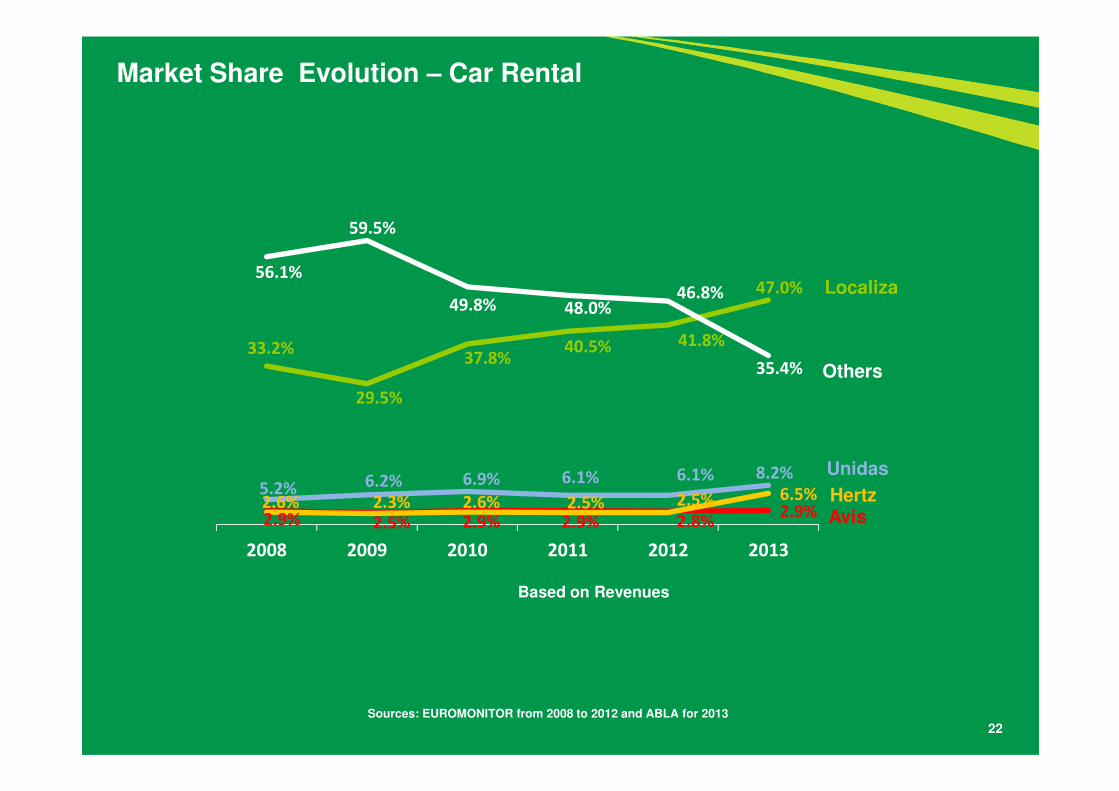
Sources: EUROMONITOR from 2008 to 2012 and ABLA for 2013
22
Market Share Evolution – Car Rental
33.2%
29.5%
37.8%40.5% 41.8%
47.0%
5.2% 6.2% 6.9% 6.1% 6.1% 8.2%
2.9% 2.5% 2.9% 2.9% 2.8%2.9%
2.6% 2.3% 2.6% 2.5% 2.5% 6.5%
56.1%
59.5%
49.8% 48.0%46.8%
35.4%
2008 2009 2010 2011 2012 2013
Localiza
HertzAvis
Unidas
Others
Based on Revenues

23
1. Company overview
2. Main business divisions
� Car Rental
� Fleet Rental
� Seminovos
3. Consolidated
Appendix: Earnings release 4Q14
Agenda

24
Number of clients
Fleet Rental overview
35.0%Compact cars
2014 Fleet composition
34,312 cars
65.0%Others
729760 798
2012 2013 2014
End of period fleet
32,104 32,809 34,312
2012 2013 2014

25Source: ABLA, Datamonitor and Localiza
Low penetration of rented fleet in Brazil.
Rented fleet penetration
Corporate fleet:
4,000,000*
Rented fleet:
307,336
32,809
Brazilian MarketWorld
8.1% 8.9%13.3%
16.5%
24.5%
37.4%
46.9%
58.3%
Drivers
*Localiza estimates
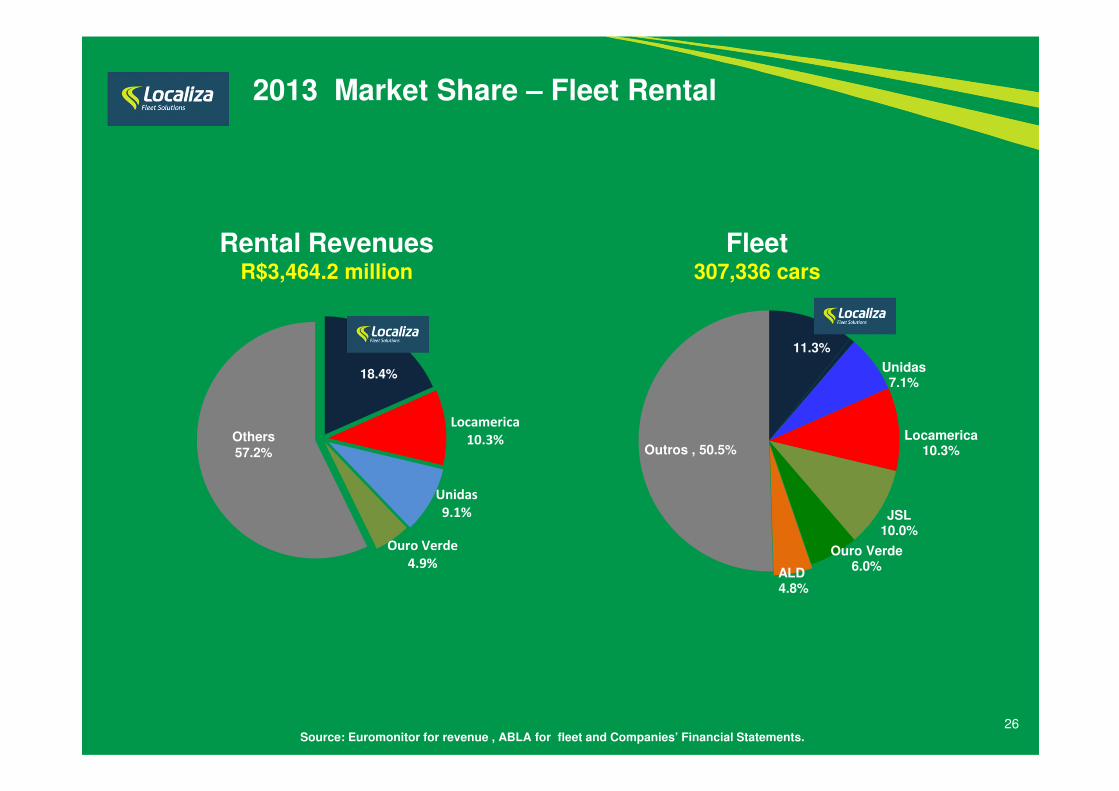
2013 Market Share – Fleet Rental
26
Rental RevenuesR$3,464.2 million
Fleet307,336 cars
Source: Euromonitor for revenue , ABLA for fleet and Companies’ Financial Statements.
Locamerica
10.3%
Unidas
9.1%
Ouro Verde
4.9%
18.4%
Others57.2%
11.3%
Unidas7.1%
Locamerica10.3%
JSL10.0%
Ouro Verde6.0%
ALD 4.8%
Outros , 50.5%

27
1. Company overview
2. Main business divisions
� Car Rental
� Fleet Rental
� Seminovos
3. Consolidated
Appendix: Earnings release 4Q14
Agenda
28
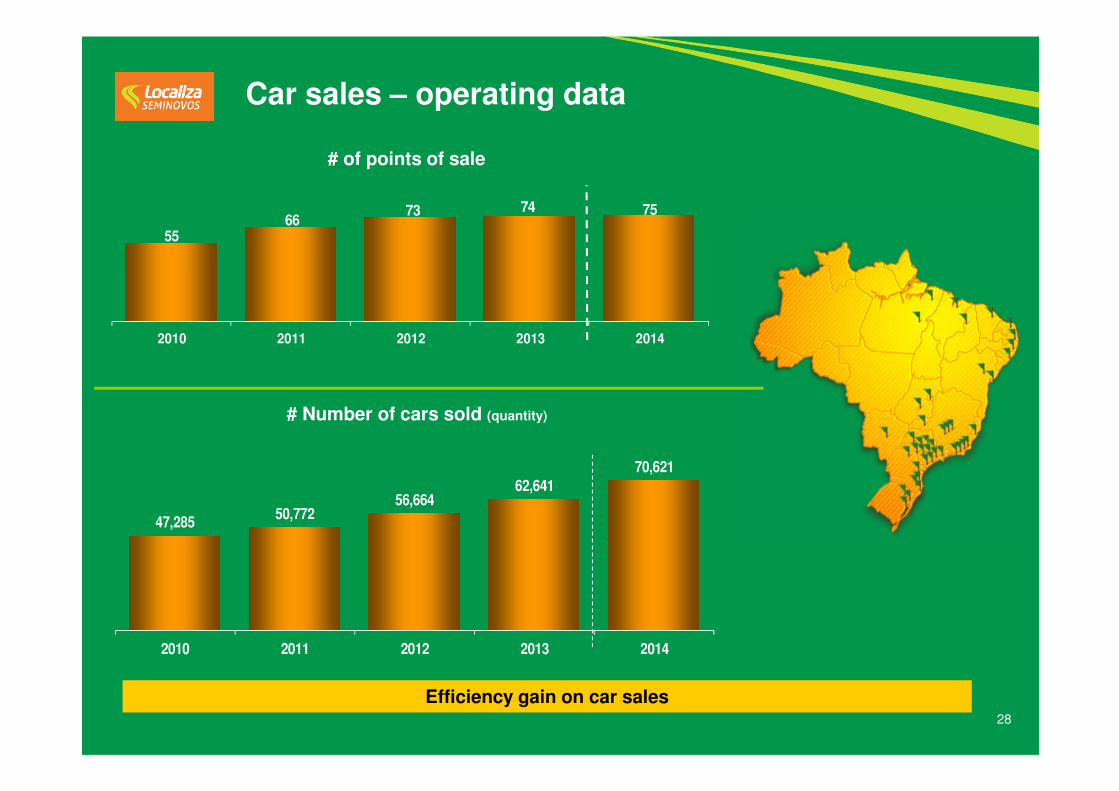
Efficiency gain on car sales
# of points of sale
Car sales – operating data
5566
73 74 75
2010 2011 2012 2013 2014
47,28550,772
56,66462,641
70,621
2010 2011 2012 2013 2014
# Number of cars sold (quantity)

29Source: O Estado de São Paulo newspaper, as of 08/16/13 (based on researches of Sindipeças) and Globo website, as of 03/10/2014.
Used car sales drivers: affordability and penetration
# of inhabitants per car 2012 – (Brazil 2013)# of inhabitants per car - Brazil
4.4
4.2
4.0
3.6
2.1
2.0
1.9
1.8
1.2
Brazil
Argentina
Russia
South Korea
Japan
France
Germany
United Kingdon
USA
5.9 5.5 5.24.4
2010 2011 2012 2013
Affordability to buy cars – Public Price of the most basic Gol
300 350 380
415 465 510
545 622
678 724
84
71 69
61 55
51
49 43 43 43
-
10
20
30
40
50
60
70
80
90
-
100
200
300
400
500
600
700
800
900
2005 2006 2007 2008 2009 2010 2011 2012 2013 2014
Minimum wage (R$) Minimum wages to buy a new car

8.4 8.9 9.0 9.410.1
3.3 3.5 3.6 3.6 3.3
30
2.5x 2.5x
2010 2011 2012 2013 2014
2.6x
Brazilian car market: new x used car market and affordability
New cars
Used cars
Source: FENABRAVE (Autos + light commercial)
2.6x
Total market of 13.4 million cars.
3.1x
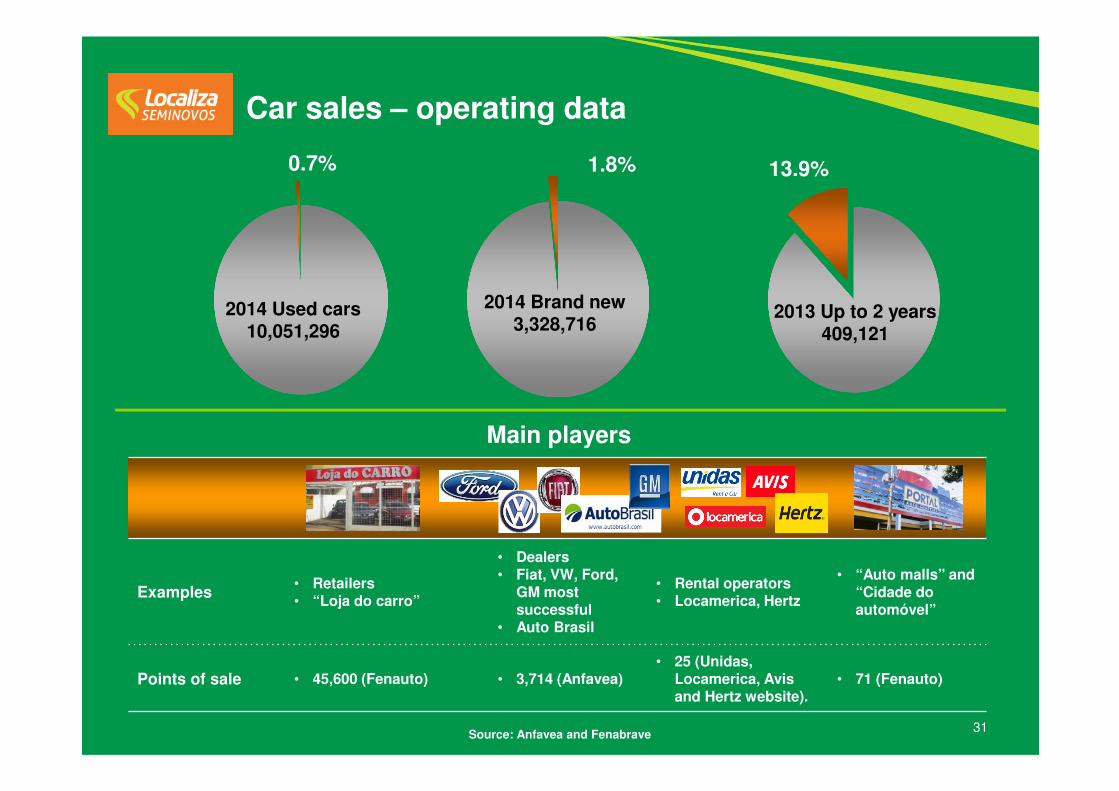
31
2013 Up to 2 years409,121
2014 Brand new3,328,716
2014 Used cars10,051,296
0.7% 1.8% 13.9%
Car sales – operating data
Source: Anfavea and Fenabrave
Examples• Retailers• “Loja do carro”
• Dealers• Fiat, VW, Ford,
GM most successful
• Auto Brasil
• Rental operators• Locamerica, Hertz
• “Auto malls” and “Cidade do automóvel”
Points of sale • 45,600 (Fenauto) • 3,714 (Anfavea)• 25 (Unidas,
Locamerica, Avis and Hertz website).
• 71 (Fenauto)
Main players

32
1. Company overview
2. Main business divisions
� Car Rental
� Fleet Rental
� Seminovos
3. Consolidated
Appendix: Earnings release 4Q14
Agenda

802.2980.7 1,093.7 1,163.5 1,284.4
310.4 331.2
2010 2011 2012 2013 2014 4Q13 4Q14
33
Net Revenues (R$ million)
# Daily Rentals (thousands)
Car Rental Division
The net revenues increased 10.4% in 2014
10,734 12,794 13,749 14,242 15,416
3,714 3,898
2010 2011 2012 2013 2014 4Q13 4Q14

234 247 272 286 304
181 202 202 193 17261 47 50 63 64
2010 2011 2012 2013 2014
34
Car Rental network evolution
18 new owned rental locations were added to the network in 2014.
# of car rental locations (Brazil and abroad)
Localiza´s branches - Brazil Franchisees´ branches - Brazil Franchisses´ branches - abroad
476 496 524 542 540
+18

35
Utilization rate evolution – Car Rental Division
Higher utilization rate reduced the invested capital in fleet.
69.1%
68.9%
70.8%
66.8%
69.9%
2010 2011 2012 2013 2014
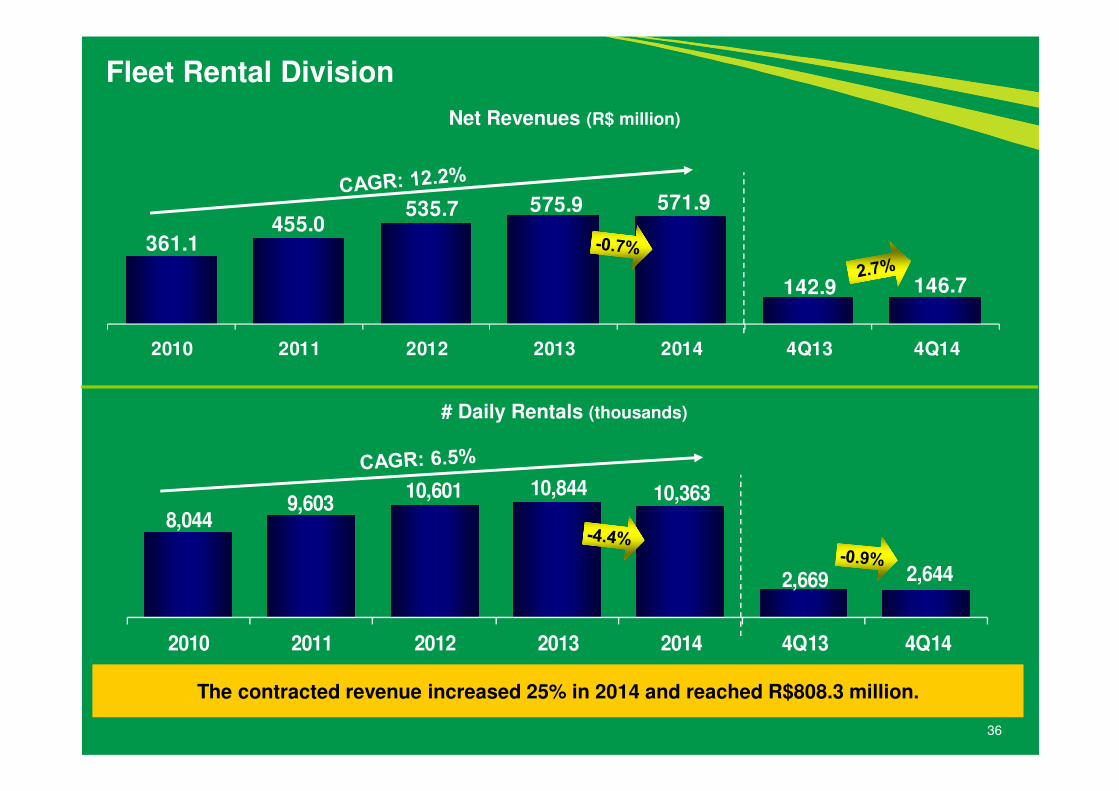
361.1 455.0
535.7 575.9 571.9
142.9 146.7
2010 2011 2012 2013 2014 4Q13 4Q14
8,0449,603
10,601 10,844 10,363
2,669 2,644
2010 2011 2012 2013 2014 4Q13 4Q14
36
Net Revenues (R$ million)
# Daily Rentals (thousands)
Fleet Rental Division
The contracted revenue increased 25% in 2014 and reached R$808.3 million.
1,910.4 1,776.5 1,618.8
2,026.2
2,483.2
553.8 877.4
1,321.9 1,468.1 1,520.0 1,747.3
2,018.2
505.6 553.0
2010 2011 2012 2013 2014 4Q13 4Q14
Purchases (includes accessories) Used car sales net revenues
Cars purchased Cars sold
37
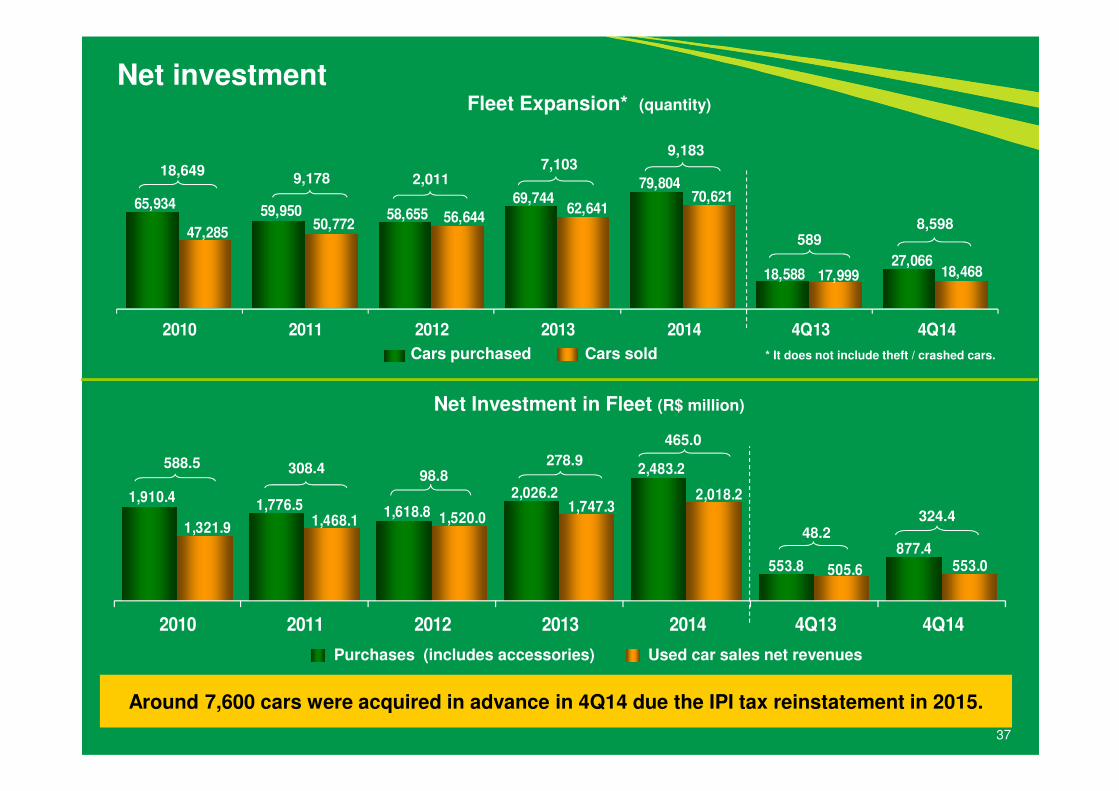
Net investmentFleet Expansion* (quantity)
Around 7,600 cars were acquired in advance in 4Q14 due the IPI tax reinstatement in 2015.
Net Investment in Fleet (R$ million)
65,934 59,950 58,655 69,744
79,804
18,588 27,066
47,285 50,772 56,644
62,641 70,621
17,999 18,468
2010 2011 2012 2013 2014 4Q13 4Q14
9,178 2,0117,10318,649
589
308.498.8
588.5 278.9
* It does not include theft / crashed cars.
48.2
8,598
324.4
9,183
465.0

38
End of period fleetQuantity
In the Car Rental division, around 7,600 cars were acquired in advance in 4Q14, due the IPI tax reinstatement in 2015.
By the end of 2014, 1,942 cars in the Fleet Rental division were being prepared to be delivered to the clients.
61,445 64,688 65,086 70,717 77,573
26,61531,629 32,104
32,80934,31210.652
12,958 14,54514,233
13,339
2010 2011 2012 2013 2014
98,712109,275 111,735
117,759125,224
Car Rental Fleet Rental Franchising
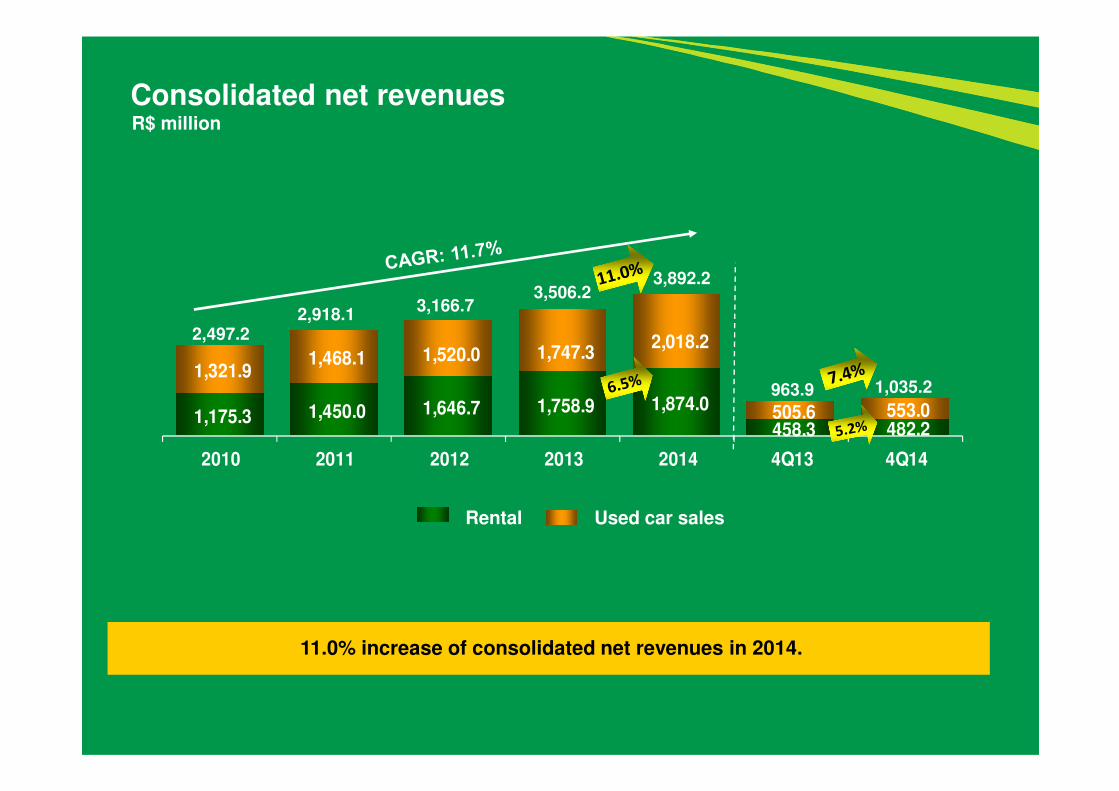
1,175.3 1,450.0 1,646.7 1,758.9 1,874.0
458.3 482.2
1,321.9 1,468.1 1,520.0 1,747.3
2,018.2
505.6 553.0
2010 2011 2012 2013 2014 4Q13 4Q14
39
Consolidated net revenuesR$ million
11.0% increase of consolidated net revenues in 2014.
Rental Used car sales
2,918.1
3,506.23,892.2
2,497.2
3,166.7
963.9 1,035.2

40
Consolidated EBITDA R$ million
EBITDA grew 5.8% in the 2014.
649.5821.3 875.6 916.5 969.8
236.0 237.6
2010 2011 2012 2013 2014 4Q13 4Q14
(*)From 2012 on, accessories and freight of new cars have been accounted directly in the cost line, impacting EBITDAbut reducing depreciation costs.
Divisions 2010* 2011* 2012 2013 2014 4Q13 4Q14
Car Rental 45.3% 46.9% 40.9% 36.8% 38,7% 37.3% 37.1%
Fleet Rental 68.0% 68.6% 66.4% 65.5% 60.0% 64.7% 55.5%
Rental Consolidated 52.3% 53.8% 49.3% 46.5% 45.3% 46.0% 42.6%
Used Car Sales 2.6% 2.8% 4.2% 5.7% 6.0% 4.9% 5.8%
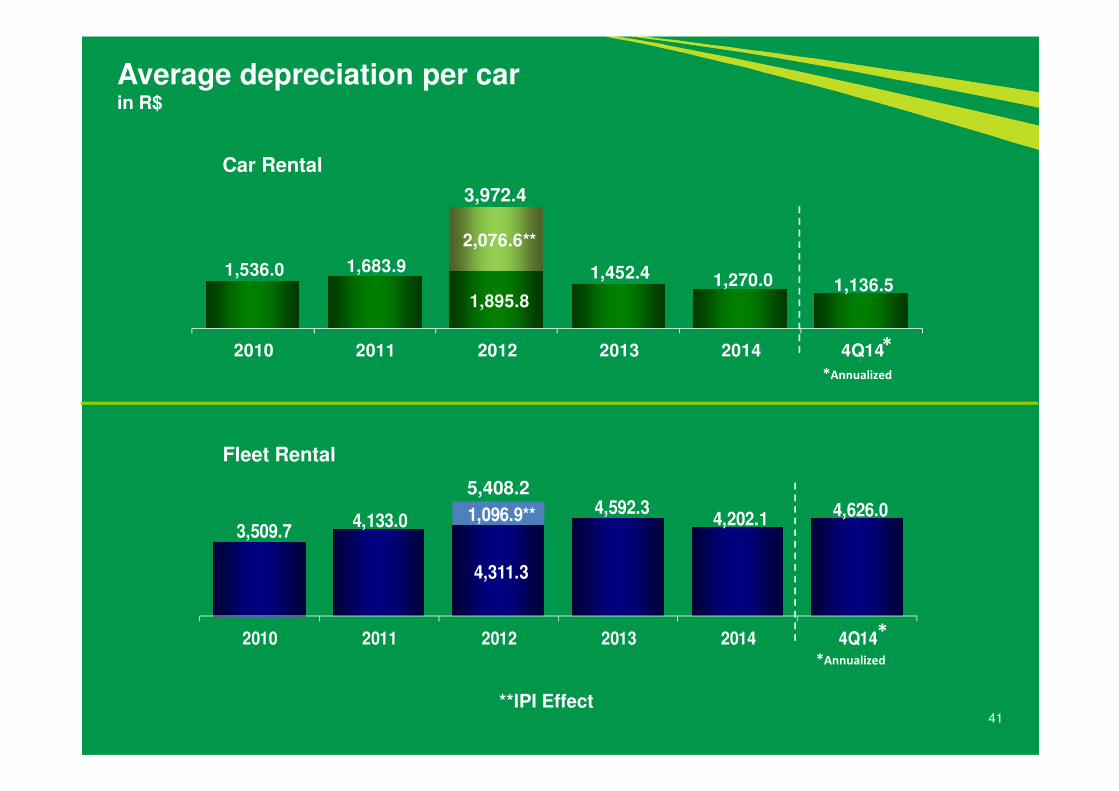
**IPI Effect
3,509.7 4,133.0
4,311.3
4,592.3 4,202.1 4,626.0 1,096.9**
2010 2011 2012 2013 2014 4Q14
1,536.0 1,683.9
1,895.8
1,452.4 1,270.0 1,136.5
2,076.6**
2010 2011 2012 2013 2014 4Q14
41
Average depreciation per carin R$
3,972.4
5,408.2
Car Rental
Fleet Rental
*Annualized
*
*
*Annualized
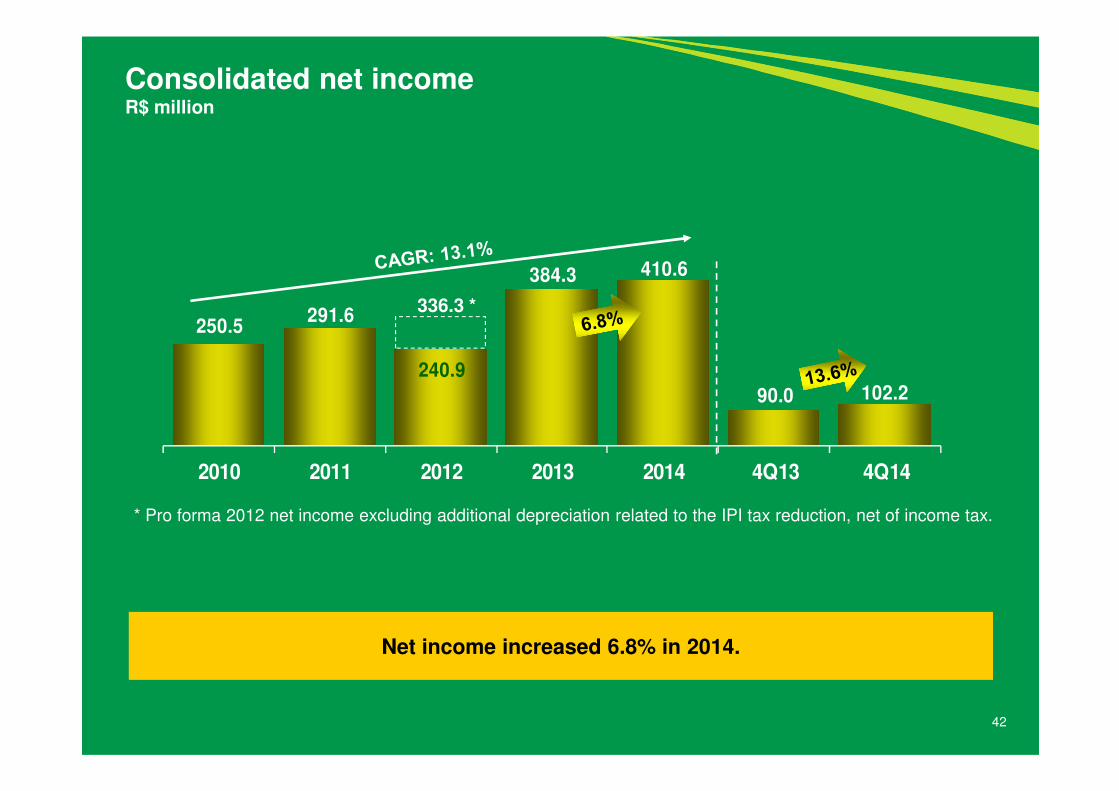
250.5291.6
240.9
384.3 410.6
90.0 102.2
2010 2011 2012 2013 2014 4Q13 4Q14
42
Consolidated net incomeR$ million
* Pro forma 2012 net income excluding additional depreciation related to the IPI tax reduction, net of income tax.
336.3 *
Net income increased 6.8% in 2014.

43
Free cash flow - FCF(*) Without the technical discount up to 2010
Free cash flow - R$ million 2010 2011 2012 2013 2014O
pera
tio
ns
EBITDA 649.5 821.3 875.6 916.5 969.8
Used car sale revenue, net from taxes (1,321.9) (1,468.1) (1,520.0) (1,747.3) (2,018.2)
Depreciated cost of cars sold (*) 1,203.2 1,328.6 1,360.2 1,543.8 1,777.0
(-) Income tax and social contribution (57.8) (83.0) (100.9) (108.5) (113.1)
Change in working capital 54.5 (83.9) 37.1 2.9 (27.1)
Cash provided by rental operations 527.5 514.9 652.0 607.4 588.4
Cap
ex -
Ren
ew
als
Used car sale revenue, net from taxes 1,321.9 1,468.1 1,520.0 1,747.3 2,018.2
Fleet renewal investment (1,370.1) (1,504.5) (1,563.3) (1,819.7) (2,197.7)
Net investment for fleet renewal (48.2) (36.4) (43.3) (72.4) (179.5)
Fleet renewal – quantity 47,285 50,772 56,644 62,641 70,621
Investment, other property and intangibles investments (50.6) (59.9) (77.8) (47.5) (46.3)
Free cash flow before growth, new HQ and interest 428.7 418.6 530.9 487.5 362.6
Cap
ex -
Gro
wth
Fleet growth investment (540.3) (272.0) (55.5) (209.4) (286.8)
Change in accounts payable to car suppliers 111.3 32.7 (116.9) 89.7 334.4
Fleet growth (429.0) (239.3) (172.4) (119.7) 47.6
Fleet increase / (reduction) – quantity 18,649 9,178 2,011 7,103 9,183
Free cash flow after growth, and before interest and before new headquarters (0.3) 179.3 358.5 367.8 410.2
Cap
ex
–H
Q
Investment in the construction of the new headquarters (0.5) (3.1) (2.4) (6.5) (55.7)
Marketable securities – new headquarters - - - - (92.6)
New headquarters construction (0.5) (3.1) (2.4) (6.5) (148.3)
Free cash flow before interest (0.8) 176.2 356.1 361.3 261.9
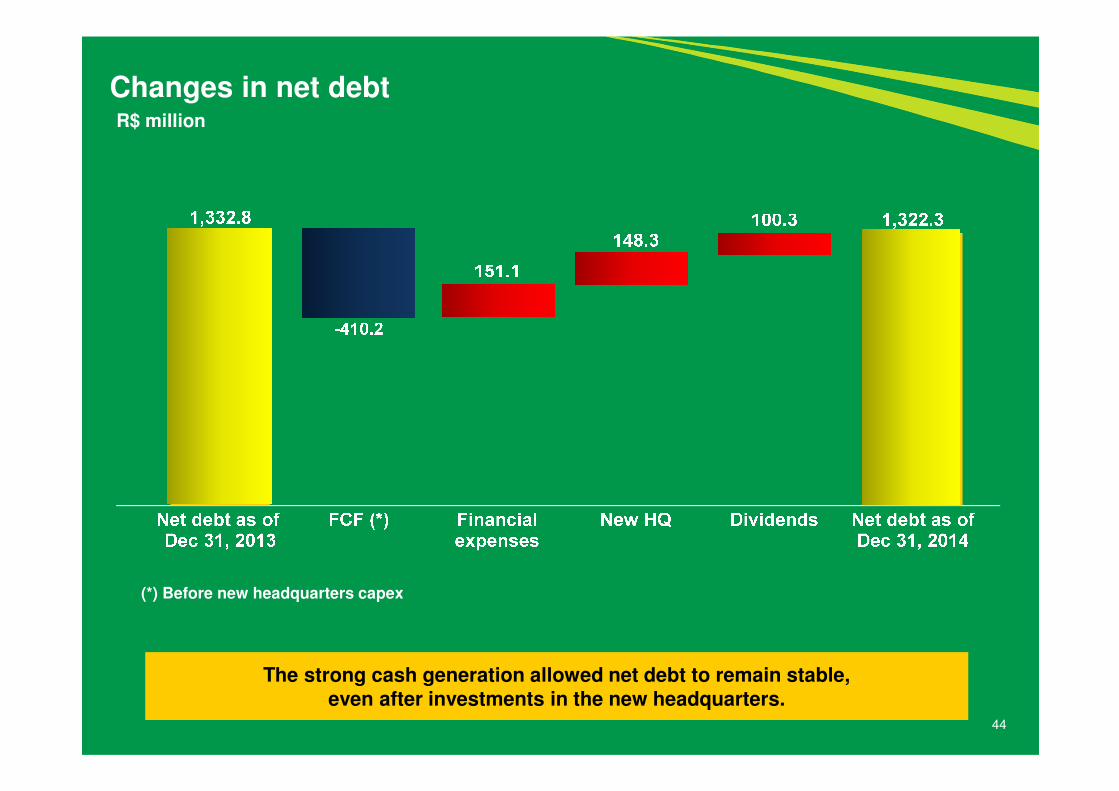
44
The strong cash generation allowed net debt to remain stable, even after investments in the new headquarters.
(*) Before new headquarters capex
Changes in net debt R$ million
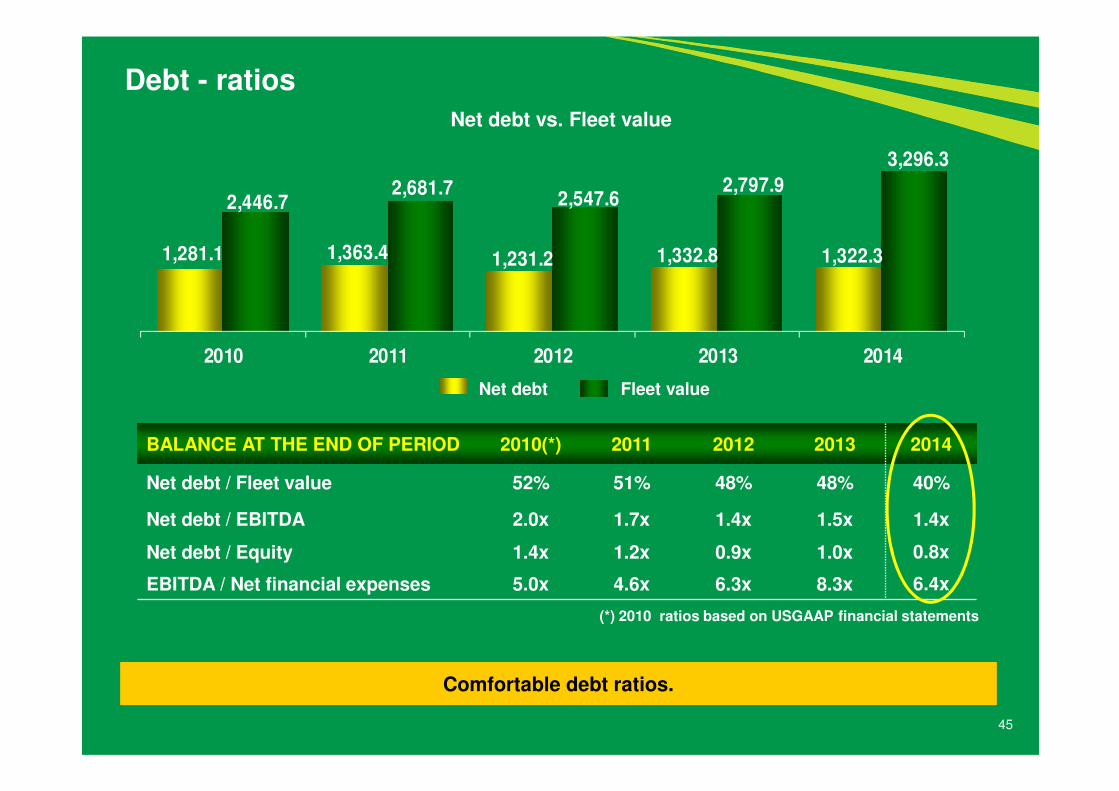
1,281.1 1,363.4 1,231.2 1,332.8 1,322.3
2,446.7 2,681.7
2,547.6 2,797.9
3,296.3
2010 2011 2012 2013 2014
45
Debt - ratios
Net debt vs. Fleet value
BALANCE AT THE END OF PERIOD 2010(*) 2011 2012 2013 2014
Net debt / Fleet value 52% 51% 48% 48% 40%
Net debt / EBITDA 2.0x 1.7x 1.4x 1.5x 1.4x
Net debt / Equity 1.4x 1.2x 0.9x 1.0x 0.8x
EBITDA / Net financial expenses 5.0x 4.6x 6.3x 8.3x 6.4x
(*) 2010 ratios based on USGAAP financial statements
Net debt Fleet value
Comfortable debt ratios.

-248.6
555.9 511.7
221.0
544.5 445.0
147.5
2014 2015 2016 2017 2018 2019 2020 2021
46
Debt maturity profile (principal)R$ million
Total cash of R$1,482.8 million if we consider the R$92.6 million in marketable securities investment for the new headquarters.
Cash
1,390.2
1,316.2
As of December 31, 2014

47
Localiza Level I ADR
�Ticker Symbol: LZRFY
�CUSIP: 53956W300
�ISIN: US53956W3007
�Ratio: 1 Common Share : 1 ADR
�Exchange: OTC
�Depositary bank: Deutsche Bank Trust Company Americas
�ADR broker helpline: +1 212 250 9100 (New York)
+44 207 547 6500 (London)
�E-mail: [email protected]
�ADR website: www.adr.db.com
�Depositary bank’s local custodian: Banco Bradesco S/A, Brazil
48
Disclaimer
Disclaimer
The material presented is a presentation of general background information about LOCALIZA as of the date of the presentation. It is information in summary form and doesnot purport to be complete. It is not intended to be relied upon as advice to potential investors. This presentation is strictly confidential and may not be disclosed to anyother person. No representation or warranty, express or implied, is made concerning, and no reliance should be placed on, the accuracy, fairness, or completeness of theinformation presented herein.
This presentation contains statements that are forward-looking within the meaning of Section 27A of the Securities Act of 1933 and Section 21E of the Securities ExchangeAct of 1934. Such forward-looking statements are only predictions and are not guarantees of future performance. Investors are cautioned that any such forward-lookingstatements are and will be, as the case may be, subject to many risks, uncertainties and factors relating to the operations and business environments of LOCALIZA and itssubsidiaries that may cause the actual results of the companies to be materially different from any future results expressed or implied in such forward-looking statements.
Although LOCALIZA believes that the expectations and assumptions reflected in the forward-looking statements are reasonable based on information currently available toLOCALIZA’s management, LOCALIZA cannot guarantee future results or events. LOCALIZA expressly disclaims a duty to update any of the forward-looking statement.
Securities may not be offered or sold in the United States unless they are registered or exempt from registration under the Securities Act of 1933. Any offering of securitiesto be made in the United States will be made by means of an offering memorandum that may be obtained from any underwriters we may appoint in connection with anoffering of securities in future. Such offering memorandum will contain, or incorporate by reference, detailed information about LOCALIZA and its business and financialresults, as well as its financial statements.This presentation does not constitute an offer, or invitation, or solicitation of an offer, to subscribe for or purchase any securities. Neither this presentation nor anything
contained herein shall form the basis of any contract or commitment whatsoever.
Website: www.localiza.com/ir E-mail: [email protected] Phone: 55 31 3247-7024
Roberto MendesCFO and IR
Nora LanariHead of IR
Eugênio MattarCEO