Income, Poverty, and Health Insurance Coverage in the .... Census Bureau Income, Poverty, and Health...
88
Issued September 2013 P60-245 By Carmen DeNavas-Walt, Bernadette D. Proctor, Jessica C. Smith Income, Poverty, and Health Insurance Coverage in the United States: 2012 Current Population Reports 2 7 . 5 1 . 1 1 .0 0 7 . 6 1 . 3 * 1 . 1 6 . 7 1 . 9 * 1 . 5 9 0 . 9 0 . 7 1 . 5 1 . 2 1 . 4 1 . 2 6 * 1 . 2 0 . 7 0 . 9 0 . 9 1 1 1 .8 8 8 9 . 2 2 0 0 .7 7 1 0 . 0 0 1 1 . 0 1 0 0 .1 1 1 2 . 7 7 1 1 . 2 1 1 . 4 1 .3 3 9 . 0 0 1 1 . 0 9 9 . 2 1 . 1 1 3 . 2 2 1 1 . 3 1 2 2 . 7 1 . 4 1 5 . 2 2 0 0 . 8 1 5 5 . 4 0 . 9 8 . 0 0 1 1 . 0 6 6 . 7 1 . 0 9 . 8 8 1 1 . 1 9 9 . 8 1 . 2 8 . 0 0 1 1 . 0 8 8 . 1 1 . 1 1 0 . 4 4 1 1 . 1 1 0 0 . 2 1 . 2 1 5 . 6 6 1 1 . 3 1 5 5 . 2 1 . 4 1 . 2 2 1 1 . 0 1 . 7 7 1 1 . 3 1 . 9 9 * 1 1 . 4 0 . 7 7 * 0 0 . 6 1 . 2 2 0 0 . 9 1 . 1 1 1 . 0 1 . 3 3 * 1 1 . 1 1 . 9 9 * 1 1 . 5 0 . 9 9 0 0 . 7 1 1 . 2 1 8 . 8 1 . 7 7 1 4 . 1 0 . 7 7 1 1 2 . 9 1 . 0 0 1 3 1 2 . 4 1 . 2 1 1 . 7 7 1 0 . 8 0 . 8 1 1 . 0 0 1 4 . 3 1 . 3 1 3 . 9 9 1 1 . 8 1 . 2 1 1 . 7 7 1 . 9 . 2 0 . 7 7 9 . 0 0 0 . 7 1 0 . 0 1 . 0 0 1 0 . 1 1 . 2 1 2 . 7 1 . 2 1 1 . 4 4 1 . 3 1 3 9 . 0 1 . 0 0 9 . 2 1 . 1 9 . 6 2 1 . 3 1 2 . 7 7 1 . 4 1 3 . 8 8 1 5 . 4 4 0 . 9 1 5 . 2 1 7 1 . 0 9 . 1 1 1 . 3 2 9 . 9 1 1 . 3 8 1 1 1 . 2 1 1 . 4 4 9 9 5 9 , 9 2 5 5 8 , 9 7 9 5 7 , 5 5 5 5 4 2 1 1 9 , 8 9 0 5 7 , 7 8 3 3 3 5 , 3 1 6 2 0 , 5 3 8 5 8 , 1 5 5 5 3 7 , 3 3 5 2 1 , 9 7 7 5 8 , 8 6 5 5 3 7 , 7 7 3 2 2 , 4 2 5 5 9 , 3 6 9 9 3 7 , 9 1 3 2 2 , 5 6 1 5 9 , 5 0 6 6 3 9 , 9 2 3 2 3 , 1 0 0 5 7 , 8 6 6 1 1 4 1 , 1 9 5 2 3 , 3 3 0 5 6 , 6 6 6 3 9 , 7 5 0 2 3 , 3 5 5 5 5 8 8 3 9 , 4 7 9 2 3 , 2 2 1 , 5 3 0 2 6 6 , 6 9 1 4 1 1 , 2 5 9 2 6 6 , 8 9 9 4 0 0 , 8 9 8 2 7 7 , , 0 0 4 0 0 , 2 0 7 2 2 3 8 8 , 7 8 9 3 9 9 , 7 9 9 9 3 9 9 , , 8 8 3 3 9 9 6 6 6 6 6 1 6 , , 6 3 3 5 5 8 , , 7 5 4 5 8 , , 8 1 8 0 0 0 2 6 0 , , 1 9 3 , , 7 7 0 8 5 8 , , 9 2 2 2 2 2 4 4 , 6 6 1 5 9 , , 4 4 1 2 4 , 4 7 4 5 9 , , 6 6 3 1 1 2 2 2 2 2 4 , 3 1 2 , , 2 2 2 1 3 2 3 3 3 9 9 4 4 9 7 7 9 9 2 2 7 , 7 9 9 8 6 9 , 8 5 9 9 9 , 8 4 3 2 8 , 2 0 0 3 7 0 , 7 8 3 3 9 , 1 4 3 2 7 , 9 9 9 5 7 1 , 5 2 3 8 , 9 0 0 2 7 , 9 9 9 5 7 1 , 9 6 3 8 , 7 6 8 2 7 , 6 9 9 1 7 1 , 4 2 3 8 , 5 3 1 2 8 , 4 2 2 1 7 3 , 7 6 3 9 , 5 2 1 2 9 , 3 0 0 9 7 4 , 1 6 4 0 , 9 0 6 2 9 , 9 3 3 1 7 3 , 1 7 4 1 , 2 4 9 2 9 , 8 2 2 9 4 0 , 8 6 1 4 0 8 U.S. Department of Commerce Economics and Statistics Administration U.S. CENSUS BUREAU census.gov
Transcript of Income, Poverty, and Health Insurance Coverage in the .... Census Bureau Income, Poverty, and Health...

Issued September 2013P60-245
By Carmen DeNavas-Walt, Bernadette D. Proctor, Jessica C. Smith
Income, Poverty, and Health Insurance Coverage in the United States: 2012Current Population Reports
7.66
9 1.44
1.6 177.
0.6 12.6 00..
1 9.2 1.2
7.5 1.1 1.00
7.6 1.3 * 1.1
6.7 1.9 * 1.5
9 0.9 0.7
1.5 1.2
1.4 1.2
6 * 1.2
0.7
0.9
0.9
1
11.888
9.22 00.77
10.00 11.0 100.11
12.77 11.2 11.4 1.33
9.00 11.0 99.2 1.1
13.22 11.3 122.7 1.4
15.22 00.8 155.4 0.9
8.00 11.0 66.7 1.0
9.88 11.1 99.8 1.2
8.00 11.0 88.1 1.1
10.44 11.1 100.2 1.2
15.66 11.3 155.2 1.4
1.22 11.0
1.77 11.3
1.99 * 11.4
0.77 * 00.6
1.22 00.9
1.1 11.0
1.33 * 11.1
1.99 * 11.5
0.99 00.7
11.2
18.8 1.77
14.1 0.77 1
12.9 1.00 13
12.4 1.2 11.77
10.8 0.8 11.00
14.3 1.3 13.99
11.8 1.2 11.77 1.
9.2 0.77 9.00 0.7
10.0 1.00 10.1 1.2
12.7 1.2 11.44 1.3 13
9.0 1.00 9.2 1.1 9.6
2 1.3 12.77 1.4 13.8
8 15.44 0.9 15.2 1
7 1.0 9.1 11.3
2 9.9 11.3
8 1 11.2
11.4
1.
499
59,9255
8,979 57,5555
,421 19,890 57,7833
35,316 20,538 58,1555
37,335 21,977 58,8655
37,773 22,425 59,3699
37,913 22,561 59,5066
39,923 23,100 57,86611
41,195 23,330 56,,666
39,750 23,355 5588
39,479 23,221
2 633,,6666
266,160 66444
,530 266,691
411,259 266,899
400,898 277,,00
400,207 22
388,789
399,7999
399,,88
3399
66
6661
66,,633
558,,754
58,,818
0002 60,,193
,,7708 58,,922
22244,661 59,,441
24,474 59,,663
112222 24,312
,,222133 23
33399,449
777992 27,7998 69,85
999,843 28,2003 70,78
3339,143 27,9995 71,52
38,900 27,9995 71,96
38,768 27,6991 71,42
38,531 28,4221 73,76
39,521 29,3009 74,16
40,906 29,9331 73,17
41,249 29,8229
40,861
40 8
use 259C pantone
U.S. Department of CommerceEconomics and Statistics Administration
U.S. CENSUS BUREAU
census.gov
Carmen DeNavas-Walt, with the assistance of Jessica L. Semega and Melissa A. Stringfellow, prepared the income section of this report under the direction of Edward J. Welniak, Jr., Chief of the Income Statistics Branch. Bernadette D. Proctor prepared the poverty section under the direction of Trudi J. Renwick, Chief of the Poverty Statistics Branch. Jessica C. Smith prepared the health insurance coverage sec-tion under the direction of Brett O’Hara, Chief of the Health and Disability Statistics Branch. Charles T. Nelson, Assistant Division Chief for Economic Characteristics, and Jennifer Cheeseman Day, Assistant Division Chief for Employment Characteristics, both of the Social, Economic, and Housing Statistics Division, provided overall direction.
David E. Adams, Vonda M. Ashton, Susan S. Gajewski, Tim J. Marshall, and Gregory D. Weyland, Demographic Surveys Division, processed the Current Population Survey 2013 Annual Social and Economic Supplement file. Christopher J. Boniface, Kirk E. Davis, Matthew Davis, Van P. Duong, Thy K. Le, Chandararith R. Phe, and Nora P. Szeto programmed and produced the detailed and publica-tion tables under the direction of Hung X. Pham, Chief of the Survey Processing Branch.
Kelly Baker, Matthew Herbstritt, and Rebecca A. Hoop, under the supervision of David V. Hornick, all of the Demographic Statistical Methods Division, conducted sample review.
Lisa Clement, Tim J. Marshall, and Lisa Paska, Demographic Surveys Division, and Roberto Picha and Agatha Jung, Technologies Management Office, prepared and programmed the computer-assisted interviewing instrument used to conduct the Annual Social and Economic Supplement.
Additional people within the U.S. Census Bureau also made significant contributions to the preparation of this report. Joelle Abramowitz, Bernice Boursiquot, Matthew Brault, Kayla R. Fontenot, Marjorie Hanson, Misty L. Heggeness, John Hisnanick, Charles Hokayem, Yasmin Morgan, Laryssa Mykyta, Len Norry, Kirby G. Posey, and Bruce H. Webster, Jr. reviewed the contents.
Census Bureau field representatives and telephone interviewers collected the data. Without their dedication, the preparation of this report or any report from the Current Population Survey would be impossible.
Linda Chen, Donna Gillis, and Donald J. Meyd, of the Administrative and Customer Services Division, Francis Grailand Hall, Chief, provided publications and printing management, graphics design and composi-tion, and editorial review for print and electronic media. General direction and production management were provided by Claudette E. Bennett, Assistant Division Chief, and Barbara J. McCoy, Chief, Publications Services Branch.
Acknowledgments

U.S. Department of Commerce Penny Pritzker,
Secretary
Patrick D. Gallagher, Acting Deputy Secretary
Economics and Statistics Administration Mark Doms,
Under Secretary for Economic Affairs
U.S. CENSUS BUREAU John H. Thompson,
Director
P60-245
Income, Poverty, and Health Insurance Coverage in the
United States: 2012 Issued September 2013
Suggested Citation DeNavas-Walt, Carmen, Bernadette D.
Proctor, and Jessica C. Smith, U.S. Census Bureau,
Current Population Reports, P60-245, Income, Poverty, and Health Insurance
Coverage in the United States: 2012, U.S. Government Printing Office,
Washington, DC, 2013.
Economics and Statistics Administration Mark Doms, Under Secretary for Economic Affairs
U.S. CENSUS BUREAU John H. Thompson, Director
Nancy A. Potok, Deputy Director and Chief Operating Officer
Enrique Lamas, Associate Director for Demographic Programs
David S. Johnson, Chief, Social, Economic, and Housing Statistics Division
ECONOMICS
AND STATISTICS
ADMINISTRATION
U.S. Census Bureau Income, Poverty, and Health Insurance Coverage in the United States: 2012 iii
TEXT
Income, Poverty, and Health Insurance Coverage in the United States: 2012 . . . . . . . . . . . . . . . . . . . . . . . . . . . . . 1 Introduction . . . . . . . . . . . . . . . . . . . . . . . . . . . . . . . . . . . . . . . . 1 Source of Estimates . . . . . . . . . . . . . . . . . . . . . . . . . . . . . . . . . . 1 Statistical Accuracy . . . . . . . . . . . . . . . . . . . . . . . . . . . . . . . . . . 2 Supplemental Poverty Measure. . . . . . . . . . . . . . . . . . . . . . . . . . 2 State and Local Estimates of Income, Poverty, and Health Insurance . . . . . . . . . . . . . . . . . . . . . . . . . . . . . . . . . . 3 Dynamics of Economic Well-Being . . . . . . . . . . . . . . . . . . . . . . . 4
Income in the United States . . . . . . . . . . . . . . . . . . . . . . . . . . . 5 Highlights . . . . . . . . . . . . . . . . . . . . . . . . . . . . . . . . . . . . . . . . . 5 Household Income . . . . . . . . . . . . . . . . . . . . . . . . . . . . . . . . . . . 7 Type of Household. . . . . . . . . . . . . . . . . . . . . . . . . . . . . . . . . . . 7 Race and Hispanic Origin . . . . . . . . . . . . . . . . . . . . . . . . . . . . . . 8 Age of Householder . . . . . . . . . . . . . . . . . . . . . . . . . . . . . . . . . . 8 Nativity . . . . . . . . . . . . . . . . . . . . . . . . . . . . . . . . . . . . . . . . . . . 8 Disability Status of Householder . . . . . . . . . . . . . . . . . . . . . . . . 8 Region . . . . . . . . . . . . . . . . . . . . . . . . . . . . . . . . . . . . . . . . . . . . 8 Residence . . . . . . . . . . . . . . . . . . . . . . . . . . . . . . . . . . . . . . . . . 9 Income Inequality . . . . . . . . . . . . . . . . . . . . . . . . . . . . . . . . . . . 9 Equivalence-Adjusted Income Inequality. . . . . . . . . . . . . . . . . . . 9 Earnings and Work Experience . . . . . . . . . . . . . . . . . . . . . . . . . . 11
Poverty in the United States . . . . . . . . . . . . . . . . . . . . . . . . . . . 13 Highlights . . . . . . . . . . . . . . . . . . . . . . . . . . . . . . . . . . . . . . . . . 13 Race and Hispanic Origin . . . . . . . . . . . . . . . . . . . . . . . . . . . . . . 13 Age . . . . . . . . . . . . . . . . . . . . . . . . . . . . . . . . . . . . . . . . . . . . . . 15 Sex . . . . . . . . . . . . . . . . . . . . . . . . . . . . . . . . . . . . . . . . . . . . . . 16 Nativity . . . . . . . . . . . . . . . . . . . . . . . . . . . . . . . . . . . . . . . . . . . 16 Region . . . . . . . . . . . . . . . . . . . . . . . . . . . . . . . . . . . . . . . . . . . . 16 Residence . . . . . . . . . . . . . . . . . . . . . . . . . . . . . . . . . . . . . . . . . 16 Work Experience . . . . . . . . . . . . . . . . . . . . . . . . . . . . . . . . . . . . 16 Disability Status . . . . . . . . . . . . . . . . . . . . . . . . . . . . . . . . . . . . . 17 Families . . . . . . . . . . . . . . . . . . . . . . . . . . . . . . . . . . . . . . . . . . . 17 Depth of Poverty . . . . . . . . . . . . . . . . . . . . . . . . . . . . . . . . . . . . 17 Ratio of Income to Poverty. . . . . . . . . . . . . . . . . . . . . . . . . . . 17 Income Deficit . . . . . . . . . . . . . . . . . . . . . . . . . . . . . . . . . . . . 19 Shared Households . . . . . . . . . . . . . . . . . . . . . . . . . . . . . . . . . . 20 Alternative/Experimental Poverty Measures . . . . . . . . . . . . . . . . 20 National Academy of Sciences (NAS)-Based Measures. . . . . . . 21 Research Files . . . . . . . . . . . . . . . . . . . . . . . . . . . . . . . . . . . . 21 CPS Table Creator. . . . . . . . . . . . . . . . . . . . . . . . . . . . . . . . . . 21
Health Insurance Coverage in the United States . . . . . . . . . . 22 Highlights . . . . . . . . . . . . . . . . . . . . . . . . . . . . . . . . . . . . . . . . . 22 What Is Health Insurance Coverage?. . . . . . . . . . . . . . . . . . . . . . 22 Type of Coverage. . . . . . . . . . . . . . . . . . . . . . . . . . . . . . . . . . . . 25 Race and Hispanic Origin . . . . . . . . . . . . . . . . . . . . . . . . . . . . . . 26 Age . . . . . . . . . . . . . . . . . . . . . . . . . . . . . . . . . . . . . . . . . . . . . . 26 Nativity . . . . . . . . . . . . . . . . . . . . . . . . . . . . . . . . . . . . . . . . . . . 27 Economic Status. . . . . . . . . . . . . . . . . . . . . . . . . . . . . . . . . . . . . 28 Work Experience . . . . . . . . . . . . . . . . . . . . . . . . . . . . . . . . . . . . 28 Disability Status . . . . . . . . . . . . . . . . . . . . . . . . . . . . . . . . . . . . . 28 Children’s Health Insurance Coverage . . . . . . . . . . . . . . . . . . . . 29 Region . . . . . . . . . . . . . . . . . . . . . . . . . . . . . . . . . . . . . . . . . . . . 29 Residence . . . . . . . . . . . . . . . . . . . . . . . . . . . . . . . . . . . . . . . . . 29
Contents
iv Income, Poverty, and Health Insurance Coverage in the United States: 2012 U.S. Census Bureau
Comments . . . . . . . . . . . . . . . . . . . . . . . . . . . . . . . . . . . . . . . . . . . . . . . . . . . . . . . . . . . . . . 30 Additional Data and Contacts . . . . . . . . . . . . . . . . . . . . . . . . . . . . . . . . . . . . . . . . . . . . . . 30
TEXT TABLES
1. Income and Earnings Summary Measures by Selected Characteristics: 2011 and 2012 . . . . . . . . . . . . . . . . . . . . . . . . . . . . . . . . . . . . . . . . . . . . . . . . . . . . . . . . 6
2. Income Distribution Measures Using Money Income and Equivalence-Adjusted Income: 2011 and 2012 . . . . . . . . . . . . . . . . . . . . . . . . . . . . . . . . . . . . . . . . . . . . . . . . . . . . . . . . 10
3. People in Poverty by Selected Characteristics: 2011 and 2012 . . . . . . . . . . . . . . . . . . . . . 14
4. Families in Poverty by Type of Family: 2011 and 2012 . . . . . . . . . . . . . . . . . . . . . . . . . . . 17
5. People With Income Below Specified Ratios of Their Poverty Thresholds by Selected Characteristics: 2012 . . . . . . . . . . . . . . . . . . . . . . . . . . . . . . . . . . . . . . . . . . . . 18
6. Income Deficit or Surplus of Families and Unrelated Individuals by Poverty Status: 2012 . . . . . . . . . . . . . . . . . . . . . . . . . . . . . . . . . . . . . . . . . . . . . . . . . . . . . . . . . . . . . . . . 19
7. People Without Health Insurance Coverage by Selected Characteristics: 2011 and 2012 . . . . . . . . . . . . . . . . . . . . . . . . . . . . . . . . . . . . . . . . . . . . . . . . . . . . . . . . 23
8. Coverage Rates by Type of Health Insurance: 2011 and 2012 . . . . . . . . . . . . . . . . . . . . . . 26
FIGURES
1. Real Median Household Income by Race and Hispanic Origin: 1967 to 2012 . . . . . . . . . . 5
2. Female-to-Male Earnings Ratio and Median Earnings of Full-Time, Year-Round Workers 15 Years and Older by Sex: 1960 to 2012 . . . . . . . . . . . . . . . . . . . . . . . . . . . . . 11
3. Total and Full-Time, Year-Round Workers With Earnings by Sex: 1967 to 2012 . . . . . . . . . 12
4. Number in Poverty and Poverty Rate: 1959 to 2012 . . . . . . . . . . . . . . . . . . . . . . . . . . . . . 13
5. Poverty Rates by Age: 1959 to 2012 . . . . . . . . . . . . . . . . . . . . . . . . . . . . . . . . . . . . . . . . . 15
6. Poverty Rates by Age by Gender: 2012 . . . . . . . . . . . . . . . . . . . . . . . . . . . . . . . . . . . . . . . 16
7. Demographic Makeup of the Population at Varying Degrees of Poverty: 2012 . . . . . . . . . 19
8. Number Uninsured and Uninsured Rate: 1987 to 2012 . . . . . . . . . . . . . . . . . . . . . . . . . . 25
9. Uninsured Rates by Age: 1999 to 2012 . . . . . . . . . . . . . . . . . . . . . . . . . . . . . . . . . . . . . . 27
10. Uninsured Rates by Real Household Income: 1999 to 2012 . . . . . . . . . . . . . . . . . . . . . . . 28
11. Uninsured Children by Poverty Status, Household Income, Age, Race and Hispanic Origin, and Nativity: 2012 . . . . . . . . . . . . . . . . . . . . . . . . . . . . . . . . . . . . . . . . . . . . . . . . 29

U.S. Census Bureau Income, Poverty, and Health Insurance Coverage in the United States: 2012 v
APPENDIXES
Appendix A. Estimates of Income . . . . . . . . . . . . . . . . . . . . . . . . . . . . . . . . . . . . . . . . . . . 31 How Income Is Measured . . . . . . . . . . . . . . . . . . . . . . . . . . . . . . . . . . . . . . . . . . . . . . . . . 31 Recessions . . . . . . . . . . . . . . . . . . . . . . . . . . . . . . . . . . . . . . . . . . . . . . . . . . . . . . . . . . . . 31 Annual Average Consumer Price Index Research Series (CPI-U-RS) Using Current Methods All Items: 1947 to 2012 . . . . . . . . . . . . . . . . . . . . . . . . . . . . . . . . . . . . . . . . . . . . . . . . . 32 Cost-of-Living Adjustment . . . . . . . . . . . . . . . . . . . . . . . . . . . . . . . . . . . . . . . . . . . . . . . . . 32 Poverty Threshold Adjustment . . . . . . . . . . . . . . . . . . . . . . . . . . . . . . . . . . . . . . . . . . . . . 32
Appendix B. Estimates of Poverty . . . . . . . . . . . . . . . . . . . . . . . . . . . . . . . . . . . . . . . . . . . 51 How Poverty Is Calculated . . . . . . . . . . . . . . . . . . . . . . . . . . . . . . . . . . . . . . . . . . . . . . . . . 51 Poverty Thresholds for 2012 by Size of Family and Number of Related Children Under 18 Years . . . . . . . . . . . . . . . . . . . . . . . . . . . . . . . . . . . . . . . . . . . . . . . . . . . . . . . . 51 Weighted Average Poverty Thresholds in 2012 by Size of Family . . . . . . . . . . . . . . . . . . . 51
Appendix C. Estimates of Health Insurance Coverage . . . . . . . . . . . . . . . . . . . . . . . . . . 65 Quality of Health Insurance Coverage Estimates . . . . . . . . . . . . . . . . . . . . . . . . . . . . . . . . 65 National surveys and health insurance coverage . . . . . . . . . . . . . . . . . . . . . . . . . . . . . . 65 Reporting of coverage through major federal health insurance programs . . . . . . . . . . . 65 Enhancements in 2010 . . . . . . . . . . . . . . . . . . . . . . . . . . . . . . . . . . . . . . . . . . . . . . . . . 66
Appendix D. Replicate Weights. . . . . . . . . . . . . . . . . . . . . . . . . . . . . . . . . . . . . . . . . . . . . . 76
Appendix E. Additional Data and Contacts . . . . . . . . . . . . . . . . . . . . . . . . . . . . . . . . . . . . 77 Customized Tables . . . . . . . . . . . . . . . . . . . . . . . . . . . . . . . . . . . . . . . . . . . . . . . . . . . . . . 77 The CPS Table Creator . . . . . . . . . . . . . . . . . . . . . . . . . . . . . . . . . . . . . . . . . . . . . . . . . . 77 Data Ferrett . . . . . . . . . . . . . . . . . . . . . . . . . . . . . . . . . . . . . . . . . . . . . . . . . . . . . . . . . . 77 Public Use MicroData . . . . . . . . . . . . . . . . . . . . . . . . . . . . . . . . . . . . . . . . . . . . . . . . . . . . 77 CPS ASEC. . . . . . . . . . . . . . . . . . . . . . . . . . . . . . . . . . . . . . . . . . . . . . . . . . . . . . . . . . . . 77 Taxes and Noncash Benefits . . . . . . . . . . . . . . . . . . . . . . . . . . . . . . . . . . . . . . . . . . . . . 77 Research Files . . . . . . . . . . . . . . . . . . . . . . . . . . . . . . . . . . . . . . . . . . . . . . . . . . . . . . . . 77 Topcoding . . . . . . . . . . . . . . . . . . . . . . . . . . . . . . . . . . . . . . . . . . . . . . . . . . . . . . . . . . . . . 77
APPENDIX TABLES
A-1. Households by Total Money Income, Race, and Hispanic Origin of Householder: 1967 to 2012 . . . . . . . . . . . . . . . . . . . . . . . . . . . . . . . . . . . . . . . . . . . . 33
A-2. Selected Measures of Household Income Dispersion: 1967 to 2012 . . . . . . . . . . . . . . . 40
A-3. Selected Measures of Equivalence-Adjusted Income Dispersion: 1967 to 2012 . . . . . . 46
A-4. Number and Real Median Earnings of Total Workers and Full-Time, Year-Round Workers by Sex and Female-to-Male Earnings Ratio: 1960 to 2012 . . . . . . . . . . . . . . . 50
B-1. Poverty Status of People by Family Relationship, Race, and Hispanic Origin: 1959 to 2012 . . . . . . . . . . . . . . . . . . . . . . . . . . . . . . . . . . . . . . . . . . . . . . . . . . . . . . . 52
B-2. Poverty Status of People by Age, Race, and Hispanic Origin: 1959 to 2012 . . . . . . . . . 58
B-3. Poverty Status of Families, by Type of Family: 1959 to 2012 . . . . . . . . . . . . . . . . . . . . 64
C-1. Health Insurance Coverage: 1987 to 2012 . . . . . . . . . . . . . . . . . . . . . . . . . . . . . . . . . . 67
C-2. Health Insurance Coverage by Race and Hispanic Origin: 1999 to 2012 . . . . . . . . . . . . 68
C-3. Health Insurance Coverage by Age: 1999 to 2012 . . . . . . . . . . . . . . . . . . . . . . . . . . . . 72

U.S. Census Bureau Income, Poverty, and Health Insurance Coverage in the United States: 2012 1
INTRoDUCTIoN
This report presents data on income, poverty, and health insurance cover-age in the United States based on information collected in the 2013 and earlier Current Population Survey Annual Social and Economic Supplements (CPS ASEC) conducted by the U.S. Census Bureau.
Summary of findings:
• Realmedianhouseholdincomein 2012 was not statistically different from the 2011 median income.1
• Thepovertyratein2012wasnotstatistically different from 2011.
• Thepercentageofpeoplewith-out health insurance decreased between 2011 and 2012, while the number of uninsured in 2012 was not statistically different from 2011.
For most groups, the 2012 income, poverty, and health insurance esti-mates were not statistically different
1 “Real” refers to income after adjusting for inflation. All income values are adjusted to reflect 2012 dollars. The adjustment is based on percentage changes in prices between 2012 and earlier years and is computed by dividing the annual average Consumer Price Index Research Series (CPI-U-RS) for 2012 by the annual average for earlier years. The CPI-U-RS values for 1947 to 2012 are available in Appendix A and on the Internet at <www.census.gov/hhes/www /income/data/incpovhlth/2012/CPI-U-RS -Index-2012.pdf>. Consumer prices between 2011 and 2012 increased by 2.1 percent.
from the 2011 estimates. There were a few exceptions. Households in the West and those residing inside prin-cipal cities of metropolitan statistical areas experienced increases in median
household income. The poverty rate in the West went down in 2012. For health insurance, the uninsured rate for Asians and Hispanics decreased. These results are discussed in more
Income, Poverty, and Health Insurance Coverage in the United States: 2012
Source of Estimates
The data in this report are from the 2013 Current Population Survey Annual Social and Economic Supplement (CPS ASEC) and were collected in the 50 states and the District of Columbia. The data do not represent residents of Puerto Rico and U.S. Island Areas.* The data are based on a sample of about 100,000 addresses. The estimates in this report are con-trolled to independent national population estimates by age, sex, race, and Hispanic origin for March 2013. The estimates for 2011 and 2012 use pop-ulation controls based on the 2010 Census. Earlier reports presenting data for calendar years 1999 through 2010 used population controls based on the results from Census 2000, updated annually using administrative records for such things as births, deaths, emigration, and immigration.
The CPS is a household survey primarily used to collect employment data. The sample universe for the basic CPS consists of the resident civilian noninstitutionalized population of the United States. People in institu-tions, such as prisons, long-term care hospitals, and nursing homes, are not eligible to be interviewed in the CPS. Students living in dormitories are included in the estimates only if information about them is reported in an interview at their parents’ home. Since the CPS is a household survey, persons who are homeless and not living in shelters are not included in the sample. The sample universe for the CPS ASEC is slightly larger than that of the basic CPS since it includes military personnel who live in a household with at least one other civilian adult, regardless of whether they live off post or on post. All other Armed Forces are excluded. For further documentation about the CPS ASEC, see <www.census.gov/prod/techdoc /cps/cpsmar13.pdf>.
*U.S. Island Areas include American Samoa, Guam, the Commonwealth of the Northern Mariana Islands, and the Virgin Islands of the United States.
2 Income, Poverty, and Health Insurance Coverage in the United States: 2012 U.S. Census Bureau
detail in the three main sections of this report—income, poverty, and health insurance coverage. Each sec-tion presents estimates by character-istics such as race, Hispanic origin, nativity, and region.2 Other topics covered are earnings, family poverty rates, and health insurance coverage of children.
2 Federal surveys give respondents the option of reporting more than one race. Therefore, two basic ways of defining a race group are pos-sible. A group such as Asian may be defined as those who reported Asian and no other race (the race-alone or single-race concept) or as those who reported Asian regardless of whether they also reported another race (the race-alone-or-in-combination concept). The body of this report (text, figures, and tables) shows data using the first approach (race alone). The appendix tables show data using both approaches. Use of the single-race population does not imply that it is the preferred method of presenting or analyz-ing data. The Census Bureau uses a variety of approaches. In this report, the terms “White, not Hispanic” and “non-Hispanic White” are used interchange-ably and refer to people who are not Hispanic and who reported White and no other race. The Census Bureau uses non-Hispanic Whites as the comparison group for other race groups and Hispanics. Since Hispanics may be any race, data in this report for Hispanics overlap with data for race groups. Being Hispanic was reported by 14.2 percent of White householders who reported only one race, 4.6 percent of Black householders who reported only one race, and 2.6 percent of Asian householders who reported only one race. The small sample size of the Asian population and the fact that the CPS does not use separate population controls for weighting the Asian sample to national totals contribute to the large variances surrounding estimates for this group. This means that for some estimates for the Asian population, we are unable to detect statistically significant changes from the previous year. The American Community Survey (ACS), based on a much larger sample of the population, is a better source for estimating and identifying changes for small subgroups of the population. The householder is the person (or one of the people) in whose name the home is owned or rented and the person to whom the relationship of other household members is recorded. If a married couple owns the home jointly, either the husband or the wife may be listed as the house-holder. Since only one person in each household is designated as the householder, the number of householders is equal to the number of house-holds. This report uses the characteristics of the householder to describe the household. Data users should exercise caution when interpreting aggregate results for the Hispanic population or for race groups because these populations consist of many distinct groups that differ in socioeconomic characteristics, culture, and recent immigration status. Data were first collected for Hispanics in 1972 and for Asians and Pacific Islanders in 1987. For further infor-mation, see <www.census.gov/cps>.
Statistical Accuracy
Most of the data from the CPS ASEC were collected in March (with some data collected in February and April). The estimates in this report (which may be shown in text, figures, and tables) are based on responses from a sample of the population and may differ from actual values because of sampling variability or other factors. As a result, apparent differences between the estimates for two or more groups may not be statistically significant. All comparative statements have undergone statistical testing and are significant at the 90 percent confidence level unless otherwise noted. In this report, the variances of estimates were calculated using both the Successive Difference Replication (SDR) method and the Generalized Variance Function (GVF) approach. (See Appendix D for a more extensive discussion of these methods.) Further information about the source and accuracy of the estimates is available at <www.census.gov/hhes/www /p60_245sa.pdf>.
Supplemental Poverty Measure
In 2010, an interagency technical working group (which included repre-sentatives from the Bureau of Labor Statistics [BLS], the Census Bureau, the Economics and Statistics Administration, the Council of Economic Advisers, the U.S. Department of Health and Human Services, and the Office of Management and Budget) issued a series of suggestions to the Census Bureau and the BLS on how to develop the Supplemental Poverty Measure (SPM). Their suggestions drew on the recommendations of a 1995 National Academy of Sciences report and the extensive research on poverty measurement conducted over the past 15 years.
The new measure based on these suggestions serves as an additional indicator of economic well-being and provides a deeper understanding of economic conditions and policy effects. The new measure creates a more complex statistical picture incorporating additional items such as tax payments and work expenses in its family resource estimates. Thresholds used in the new measure are derived from Consumer Expenditure Survey expenditure data on basic necessities (food, shelter, clothing, and utilities) and are adjusted for geographic differences in the cost of housing. The new thresholds are not intended to assess eligibility for government programs.
The Census Bureau’s statistical experts, with assistance from the BLS and in consultation with other appropriate agencies and outside experts, are responsible for the measure’s technical design. Both the Census Bureau and the interagency technical working group consider the SPM a work in progress and expect that there will be improvements to the statistic over time.
The Census Bureau published preliminary poverty estimates using the new approach in November 2011 and November 2012. Estimates for 2011 showed that 16.1 percent of all people were in poverty using the SPM. Poverty rates were lower for children and higher for those aged 18 to 64 and over 65 years of age than under the official poverty measure. SPM estimates can be found at <www.census.gov/hhes/povmeas /methodology/supplemental/research/Short_ResearchSPM2011.pdf>. SPM estimates for 2012 will be published in fall 2013.
U.S. Census Bureau Income, Poverty, and Health Insurance Coverage in the United States: 2012 3
The CPS is the longest-running survey conducted by the Census Bureau. The CPS ASEC asks detailed ques-tions categorizing income into over 50 sources. The key purpose of the CPS ASEC is to provide timely and detailed estimates of income, poverty, and health insurance coverage and to measure change in these national- level estimates. The CPS ASEC is the official source of the national poverty estimates calculated in accordance with the Office of Management and
Budget’s (OMB) Statistical Policy Directive 14 (Appendix B).
The Census Bureau also reports income, poverty, and health insur-ance coverage estimates based on data from the American Community Survey (ACS). The ACS is part of the 2010 Census program and eliminates the need for a long-form census questionnaire. The ACS offers broad, comprehensive information on social, economic, and housing topics and provides this information at many levels of geography.
Since the CPS ASEC produces more complete and thorough estimates of income and poverty, the Census Bureau recommends that people use it as the data source for national estimates. Estimates for income, poverty, health insurance coverage, and other economic characteristics at the state level can be found on the American FactFinder Web site at <factfinder2.census.gov> and in forth-coming briefs based on the 2012 ACS data. For more information on state and local estimates, see the text box “State and Local Estimates of Income, Poverty, and Health Insurance.”
The CPS ASEC provides reliable esti-mates of the net change, from one year to the next, in the overall distri-bution of economic characteristics of the population, such as income and earnings, but it does not show how those characteristics change for the same person, family, or household. Longitudinal measures of income, poverty, and health insurance cover-age that are based on following the same people over time are avail-able from the Survey of Income and Program Participation (SIPP). Estimates derived from SIPP data answer ques-tions such as:
• Whatpercentageofhouseholdsmove up or down the income distribution over time?
• Howmanypeopleremaininpoverty over time?
• Howlongdopeoplewithouthealth insurance tend to remain uninsured?
State and Local Estimates of Income, Poverty, and Health Insurance
The U.S. Census Bureau presents annual estimates of median household income, poverty, and health insurance coverage by state and other smaller geographic units based on data collected in the American Community Survey (ACS). Single-year estimates are available for geographic units with populations of 65,000 or more. The ACS produces estimates of income and poverty for counties and places with populations of 20,000 or more by pooling 3 years of data. Five-year income, poverty, and health insur-ance estimates are available for all geographic units, including census tracts and block groups.
The Census Bureau’s Small Area Income and Poverty Estimates (SAIPE) and Small Area Health Insurance Estimates (SAHIE) programs also produce single-year estimates of health insurance, median household income, and poverty for states and all counties, as well as population and poverty estimates for school districts. These estimates are based on models using data from a variety of sources, including current surveys, administra-tive records, intercensal population estimates, and personal income data published by the Bureau of Economic Analysis. In general, SAIPE and SAHIE estimates have lower variances than ACS estimates but are released later because they incorporate ACS data in the models.
SAIPE income and poverty estimates for 2011 are available at <www.census.gov/did/www/saipe/index.html>. SAHIE health insurance estimates are available at <www.census.gov/did/www/sahie/index.html>. Estimates for 2012 will be available later this year.
4 Income, Poverty, and Health Insurance Coverage in the United States: 2012 U.S. Census Bureau
The text box “Dynamics of Economic Well-Being” provides more information about the SIPP.
The income and poverty estimates shown in this report are based solely on money income before taxes and do not include the value of noncash benefits, such as those provided by the Supplemental Nutrition Assistance Program (SNAP), Medicare, Medicaid, public housing, or employer-provided fringe benefits.
Since the publication of the first official U.S. poverty estimates in 1964, there has been a continuing debate about the best approach to
measuring income and poverty in the United States. Recognizing that alternative estimates of income and poverty can provide useful informa-tion to the public as well as to the federal government, the OMB’s Chief Statistician formed the Interagency Technical Working Group on develop-ing a Supplemental Poverty Measure. This group asked the Census Bureau, in cooperation with the U.S. Bureau of Labor Statistics (BLS), to develop a new measure that allows for an improved understanding of the eco-nomic well-being of American families and how federal policies affect those living in poverty. In November 2011
and November 2012, the Census Bureau released the first sets of esti-mates for the Supplemental Poverty Measure.3 The text box “Supplemental Poverty Measure” provides more infor-mation about this initiative.
3 See <www.census.gov/hhes/povmeas /methodology/supplemental/research/Short _ResearchSPM2011.pdf>.
Dynamics of Economic Well-Being
The Survey of Income and Program Participation (SIPP) provides monthly data about labor force participation, income sources and amounts, and health insurance cov-erage of individuals, families, and households during the time span covered by each of its panels. The data yield insights into the dynamic nature of these experiences and the economic mobility of U.S. residents.* For exam-ple, the data demonstrate that using a longer time frame to measure poverty (e.g., 4 years) yields, on average, a lower poverty rate than the annual measures presented in this report, while using a shorter time frame (e.g., 2 months) yields higher poverty rates. Some specific findings from the 2004 and 2008 panels include:
• The proportion of households in the bottom quintile in 2004 that moved up to a higher quintile in 2007 (30.9 percent) was not statistically different from the proportion of households in the top quintile in 2004 that moved to a lower quintile in 2007 (32.2 percent).
• Households with householders who had lower levels of education were more likely to remain in or move into a lower quintile than households whose house-holders had higher levels of education.
• During the 3-year period from 2009 to 2011, approximately 31.6 percent of the population had at least one spell of poverty lasting 2 or more months.
• Chronic poverty over the 3-year period from 2009 to 2011 was relatively uncommon, with 3.5 percent of the population living in poverty all 36 months.
• In 2011, 24.6 percent of all people experienced at least 1 month without health insurance coverage.
More information based on these data is available in a series of reports titled the Dynamics of Economic Well-Being, as well as in table packages and working papers. For more information, see <www.census.gov/sipp /pubs.html>.
The U.S. Census Bureau is in the process of reengi-neering the SIPP. The redesigned survey is expected to reduce respondent burden and attrition and deliver data on a timely basis while addressing the same topic areas of the earlier SIPP panels. For more information, see <www.census.gov/sipp>.
*The 2004 SIPP panel collected data from February 2004 through January 2008. The 2008 SIPP panel has collected data from May 2008 to the present. Data are currently available to download. See the SIPP Web site for details at <www.census.gov/sipp>.
U.S. Census Bureau Income, Poverty, and Health Insurance Coverage in the United States: 2012 5
INCoME IN THE UNITED STATES
Highlights
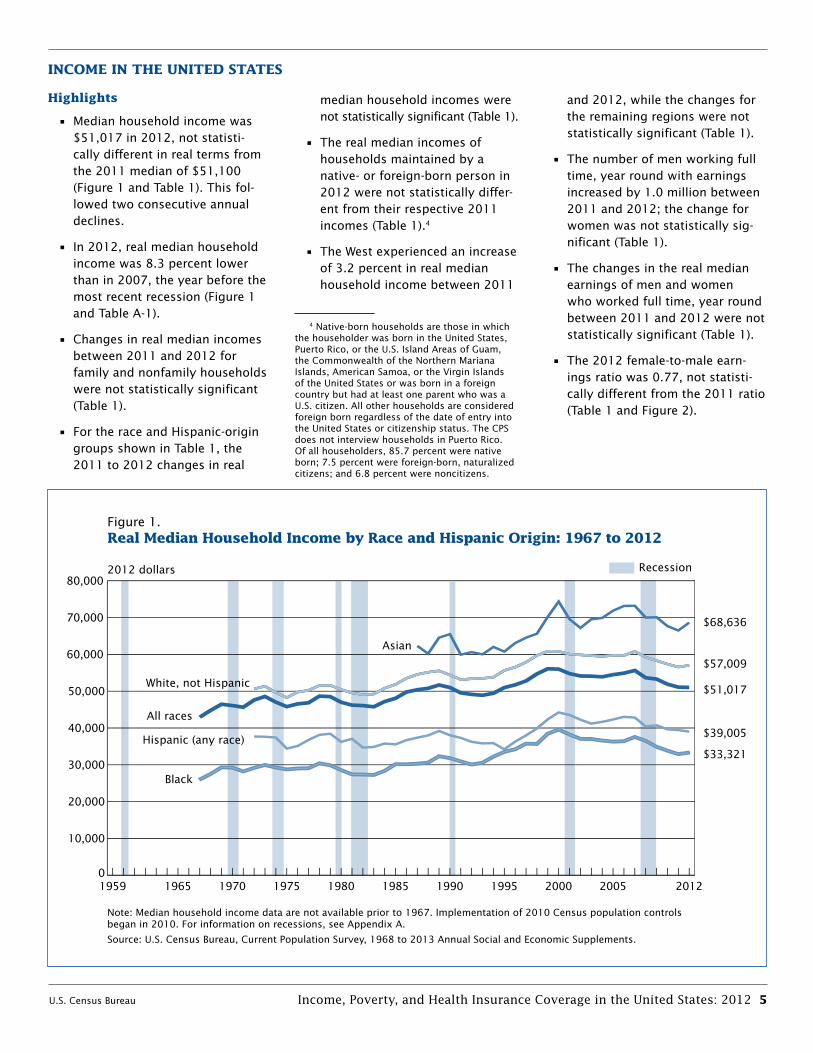
• Medianhouseholdincomewas$51,017 in 2012, not statisti-cally different in real terms from the 2011 median of $51,100 (Figure 1 and Table 1). This fol-lowed two consecutive annual declines.
•In2012,realmedianhouseholdincome was 8.3 percent lower than in 2007, the year before the most recent recession (Figure 1 and Table A-1).
•Changesinrealmedianincomesbetween 2011 and 2012 for family and nonfamily households were not statistically significant (Table 1).
•FortheraceandHispanic-origingroups shown in Table 1, the 2011 to 2012 changes in real
median household incomes were not statistically significant (Table 1).
•Therealmedianincomesofhouseholds maintained by a native- or foreign-born person in 2012 were not statistically differ-ent from their respective 2011 incomes (Table 1).4
•TheWestexperiencedanincreaseof 3.2 percent in real median household income between 2011
4 Native-born households are those in which the householder was born in the United States, Puerto Rico, or the U.S. Island Areas of Guam, the Commonwealth of the Northern Mariana Islands, American Samoa, or the Virgin Islands of the United States or was born in a foreign country but had at least one parent who was a U.S. citizen. All other households are considered foreign born regardless of the date of entry into the United States or citizenship status. The CPS does not interview households in Puerto Rico. Of all householders, 85.7 percent were native born; 7.5 percent were foreign-born, naturalized citizens; and 6.8 percent were noncitizens.
and 2012, while the changes for the remaining regions were not statistically significant (Table 1).
•Thenumberofmenworkingfulltime, year round with earnings increased by 1.0 million between 2011 and 2012; the change for women was not statistically sig-nificant (Table 1).
•Thechangesintherealmedianearnings of men and women who worked full time, year round between 2011 and 2012 were not statistically significant (Table 1).
•The2012female-to-maleearn-ings ratio was 0.77, not statisti-cally different from the 2011 ratio (Table 1 and Figure 2).
Figure 1.Real Median Household Income by Race and Hispanic Origin: 1967 to 2012
Note: Median household income data are not available prior to 1967. Implementation of 2010 Census population controls began in 2010. For information on recessions, see Appendix A.
Source: U.S. Census Bureau, Current Population Survey, 1968 to 2013 Annual Social and Economic Supplements.
2012 dollars Recession
0
10,000
20,000
30,000
40,000
50,000
60,000
70,000
80,000
201220052000 19951990198519801975197019651959
$68,636
$57,009
$51,017
$39,005
$33,321
All races
White, not Hispanic
Black
Asian
Hispanic (any race)

6 Income, Poverty, and Health Insurance Coverage in the United States: 2012 U.S. Census Bureau
Table 1.Income and Earnings Summary Measures by Selected Characteristics: 2011 and 2012—Con .(Income in 2012 dollars. Households and people as of March of the following year. For information on confidentiality protection, sampling error, nonsampling error, and definitions, see www.census.gov/prod/techdoc/cps/cpsmar13.pdf. Standard errors calculated using replicate weights)
Characteristic
2011 2012Percentage change*
in real median income (2012 less 2011)
Number (thousands)
Median income (dollars)
Number (thousands)
Median income (dollars)
Estimate
90 percent confidence interval1 (±)Estimate
90 percent confidence interval1 (±) Estimate
90 percent confidence interval1 (±)
HOUSEHOLDS All households . . . . . . . . . . . . . . . . . . . . . 121,084 51,100 422 122,459 51,017 343 –0 .2 0 .86
Type of HouseholdFamily households . . . . . . . . . . . . . . . . . . . . . . . . . . . 80,506 63,574 457 80,902 64,053 772 0 .8 1 .22 Married-couple . . . . . . . . . . . . . . . . . . . . . . . . . . . . 58,949 75,678 965 59,204 75,694 612 Z 1 .26 Female householder, no husband present . . . . . . . 15,669 34,340 830 15,469 34,002 984 –1 .0 3 .53 Male householder, no wife present . . . . . . . . . . . . 5,888 50,602 2,189 6,229 48,634 1,558 –3 .9 4 .50Nonfamily households . . . . . . . . . . . . . . . . . . . . . . . . 40,578 30,853 429 41,558 30,880 475 0 .1 1 .72 Female householder . . . . . . . . . . . . . . . . . . . . . . . 21,383 26,024 528 21,810 26,016 586 Z 2 .55 Male householder . . . . . . . . . . . . . . . . . . . . . . . . . 19,195 36,223 814 19,747 36,989 750 2 .1 2 .53
Race2 and Hispanic Origin of HouseholderWhite . . . . . . . . . . . . . . . . . . . . . . . . . . . . . . . . . . . . . 96,964 53,304 377 97,705 53,706 631 0 .8 1 .10 White, not Hispanic . . . . . . . . . . . . . . . . . . . . . . . . 83,573 56,570 551 83,792 57,009 591 0 .8 1 .13Black . . . . . . . . . . . . . . . . . . . . . . . . . . . . . . . . . . . . . 15,583 32,902 855 15,872 33,321 1,300 1 .3 3 .66Asian . . . . . . . . . . . . . . . . . . . . . . . . . . . . . . . . . . . . . 5,374 66,489 2,631 5,560 68,636 3,109 3 .2 5 .16
Hispanic (any race) . . . . . . . . . . . . . . . . . . . . . . . . . . 14,939 39,430 919 15,589 39,005 879 –1 .1 2 .64
Age of HouseholderUnder 65 years . . . . . . . . . . . . . . . . . . . . . . . . . . . . . 94,241 56,802 486 94,535 57,353 505 1 .0 1 .04 15 to 24 years . . . . . . . . . . . . . . . . . . . . . . . . . . . . 6,180 31,096 969 6,314 30,604 1,085 –1 .6 4 .33 25 to 34 years . . . . . . . . . . . . . . . . . . . . . . . . . . . . 19,846 51,835 708 20,017 51,381 597 –0 .9 1 .61 35 to 44 years . . . . . . . . . . . . . . . . . . . . . . . . . . . . 21,241 63,209 708 21,334 63,629 1,508 0 .7 2 .36 45 to 54 years . . . . . . . . . . . . . . . . . . . . . . . . . . . . 24,195 65,195 1,884 24,068 66,411 988 1 .9 3 .21 55 to 64 years . . . . . . . . . . . . . . . . . . . . . . . . . . . . 22,779 57,105 1,186 22,802 58,626 1,354 2 .7 2 .8965 years and older . . . . . . . . . . . . . . . . . . . . . . . . . . . 26,843 33,810 595 27,924 33,848 631 0 .1 2 .30
Nativity of HouseholderNative born . . . . . . . . . . . . . . . . . . . . . . . . . . . . . . . . 103,965 51,862 401 104,909 51,803 385 –0 .1 0 .83Foreign born . . . . . . . . . . . . . . . . . . . . . . . . . . . . . . . 17,119 45,359 1,270 17,550 45,475 779 0 .3 2 .89 Naturalized citizen . . . . . . . . . . . . . . . . . . . . . . . . . 8,874 53,010 1,184 9,192 53,015 1,934 Z 3 .68 Not a citizen . . . . . . . . . . . . . . . . . . . . . . . . . . . . . . 8,246 38,686 1,288 8,358 37,721 1,035 –2 .5 3 .63
Disability Status of Householder3
Households with householder aged 18 to 64 . . . . . . 94,050 56,846 487 94,360 57,389 514 1 .0 1 .05 With disability . . . . . . . . . . . . . . . . . . . . . . . . . . . . . 8,793 25,951 1,152 8,830 25,974 967 0 .1 5 .43 Without disability . . . . . . . . . . . . . . . . . . . . . . . . . . 84,787 60,652 750 85,025 61,103 399 0 .7 1 .24
RegionNortheast . . . . . . . . . . . . . . . . . . . . . . . . . . . . . . . . . . 21,774 54,989 1,498 22,125 54,627 1,601 –0 .7 3 .31Midwest . . . . . . . . . . . . . . . . . . . . . . . . . . . . . . . . . . . 26,865 49,740 1,162 27,093 50,479 777 1 .5 2 .16South . . . . . . . . . . . . . . . . . . . . . . . . . . . . . . . . . . . . . 45,604 47,879 753 45,938 48,033 857 0 .3 1 .71West . . . . . . . . . . . . . . . . . . . . . . . . . . . . . . . . . . . . . 26,840 53,470 1,008 27,303 55,157 1,022 *3 .2 2 .07
ResidenceInside metropolitan statistical areas . . . . . . . . . . . . . 101,526 52,651 441 102,784 52,988 717 0 .6 1 .26 Inside principal cities . . . . . . . . . . . . . . . . . . . . . . . 40,616 44,481 1,109 41,152 45,902 795 *3 .2 2 .37 Outside principal cities . . . . . . . . . . . . . . . . . . . . . . 60,910 58,474 772 61,631 58,780 930 0 .5 1 .51Outside metropolitan statistical areas4 . . . . . . . . . . . 19,558 41,374 965 19,676 41,198 1,031 –0 .4 2 .32
See footnotes at end of table .

U.S. Census Bureau Income, Poverty, and Health Insurance Coverage in the United States: 2012 7
Household Income
Median household income was $51,017 in 2012, not statistically different from the 2011 median ($51,100) in real terms, 8.3 percent lower than the 2007 (the year before the most recent recession) median ($55,627), and 9.0 percent lower than the median household income peak ($56,080) that occurred in 1999 (Figure 1 and Table A-1).5
5 The difference between the 1999 and 2007 median household incomes was not statistically significant. The difference between the 2007 to 2012 and 1999 to 2012 percentage changes was not statistically significant.
Type of Household
Real median incomes in 2012 for family households, $64,053, and nonfamily households, $30,880, were not statistically different from their respective 2011 medians (Table 1). Before 2012, family households had experienced four consecutive annual declines in median income. For nonfamily households, the experience was mixed: real median household income declined between 2007 and 2008, increased between 2008 and 2009, declined between 2009 and 2010, and did not experience a sta-tistically significant change between
2010 and 2011. Among the specific types of family and nonfamily house-holds, the changes in real income between 2011 and 2012 were also not statistically significant.
Married-couple households had the highest median income in 2012 ($75,694) among family households, followed by households main-tained by men with no wife present ($48,634). Family households main-tained by women with no husband present had the lowest income ($34,002).
Table 1.Income and Earnings Summary Measures by Selected Characteristics: 2011 and 2012—Con .(Income in 2012 dollars. Households and people as of March of the following year. For information on confidentiality protection, sampling error, nonsampling error, and definitions, see www.census.gov/prod/techdoc/cps/cpsmar13.pdf. Standard errors calculated using replicate weights)
Characteristic
2011 2012Percentage change*
in real median income (2012 less 2011)
Number (thousands)
Median income (dollars)
Number (thousands)
Median income (dollars)
Estimate
90 percent confidence interval1 (±)Estimate
90 percent confidence interval1 (±) Estimate
90 percent confidence interval1 (±)
EARNINGS OF FULL-TIME, YEAR-ROUND WORKERS
Men with earnings . . . . . . . . . . . . . . . . . . . . . . . . . . . 57,993 49,209 796 59,009 49,398 768 0 .4 1 .84Women with earnings . . . . . . . . . . . . . . . . . . . . . . . . 43,683 37,894 259 44,042 37,791 594 –0 .3 1 .51
Disability StatusWorkers without disability, age 15 and over3
Men with earnings . . . . . . . . . . . . . . . . . . . . . . . . . 55,655 49,506 793 56,551 49,806 719 0 .6 1 .82 Women with earnings . . . . . . . . . . . . . . . . . . . . . . . 42,462 37,951 263 42,750 37,988 630 0 .1 1 .58Workers with disability, age 15 and over3
Men with earnings . . . . . . . . . . . . . . . . . . . . . . . . . 1,622 43,093 2,757 1,739 41,540 1,504 –3 .6 6 .81 Women with earnings . . . . . . . . . . . . . . . . . . . . . . . 1,152 34,882 2,690 1,229 33,790 2,468 –3 .1 10 .85
* An asterisk preceding an estimate indicates change is statistically different from zero at the 90 percent confidence level . Z Represents or rounds to zero .1 A 90 percent confidence interval is a measure of an estimate’s variability . The larger the confidence interval in relation to the size of the estimate, the less reliable the
estimate . Confidence intervals shown in this table are based on standard errors calculated using replicate weights . For more information, see “Standard Errors and Their Use” at <www .census .gov/hhes/www/p60_245sa .pdf> .
2 Federal surveys give respondents the option of reporting more than one race . Therefore, two basic ways of defining a race group are possible . A group such as Asian may be defined as those who reported Asian and no other race (the race-alone or single-race concept) or as those who reported Asian regardless of whether they also reported another race (the race-alone-or-in-combination concept) . This table shows data using the first approach (race alone) . The use of the single-race population does not imply that it is the preferred method of presenting or analyzing data . The Census Bureau uses a variety of approaches . Information on people who reported more than one race, such as White and American Indian and Alaska Native or Asian and Black or African American, is available from Census 2010 through American FactFinder . About 2 .9 percent of people reported more than one race in Census 2010 . Data for American Indians and Alaska Natives, Native Hawaiians and Other Pacific Islanders, and those reporting two or more races are not shown separately .
3 The sum of those with and without a disability does not equal the total because disability status is not defined for individuals in the Armed Forces .4 The “Outside metropolitan statistical areas” category includes both micropolitan statistical areas and territory outside of metropolitan and micropolitan statistical areas .
For more information, see “About Metropolitan and Micropolitan Statistical Areas” at <www .census .gov/population/metro> . Source: U .S . Census Bureau, Current Population Survey, 2012 and 2013 Annual Social and Economic Supplements .
8 Income, Poverty, and Health Insurance Coverage in the United States: 2012 U.S. Census Bureau
Race and Hispanic origin
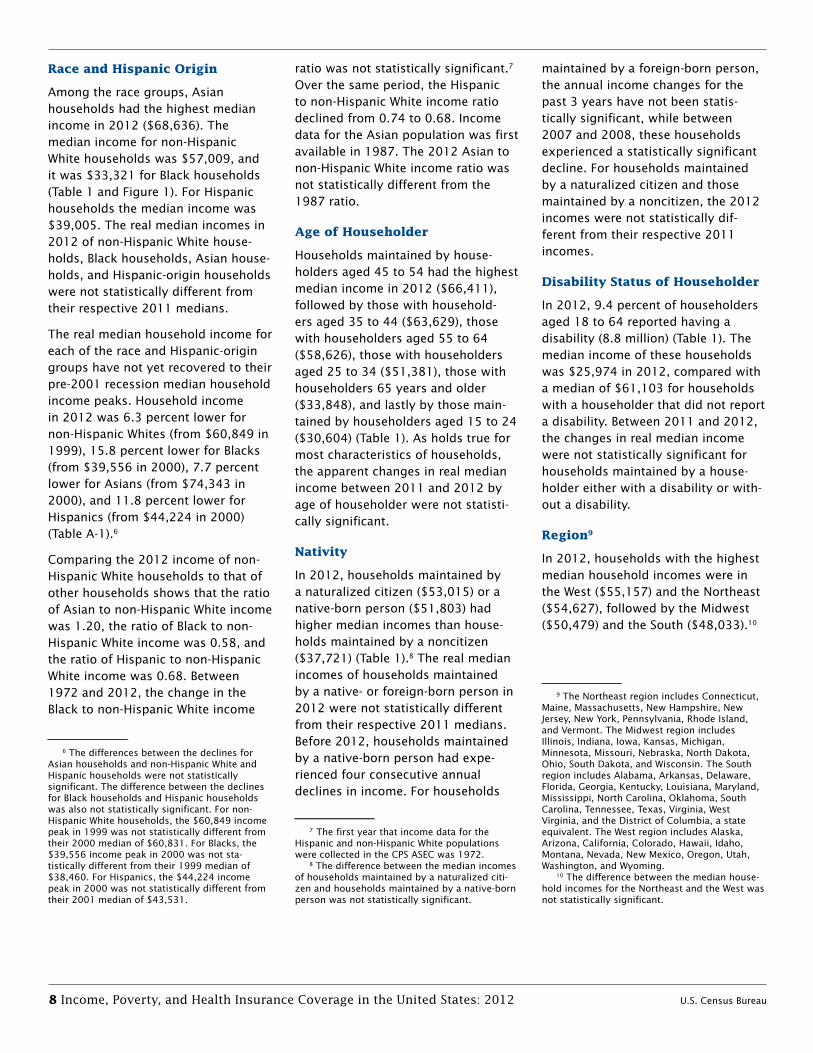
Among the race groups, Asian households had the highest median income in 2012 ($68,636). The median income for non-Hispanic White households was $57,009, and it was $33,321 for Black households (Table 1 and Figure 1). For Hispanic households the median income was $39,005. The real median incomes in 2012 of non-Hispanic White house-holds, Black households, Asian house-holds, and Hispanic-origin households were not statistically different from their respective 2011 medians.
The real median household income for each of the race and Hispanic-origin groups have not yet recovered to their pre-2001 recession median household income peaks. Household income in 2012 was 6.3 percent lower for non-Hispanic Whites (from $60,849 in 1999), 15.8 percent lower for Blacks (from $39,556 in 2000), 7.7 percent lower for Asians (from $74,343 in 2000), and 11.8 percent lower for Hispanics (from $44,224 in 2000) (Table A-1).6
Comparing the 2012 income of non-Hispanic White households to that of other households shows that the ratio of Asian to non-Hispanic White income was 1.20, the ratio of Black to non-Hispanic White income was 0.58, and the ratio of Hispanic to non-Hispanic White income was 0.68. Between 1972 and 2012, the change in the Black to non-Hispanic White income
6 The differences between the declines for Asian households and non-Hispanic White and Hispanic households were not statistically significant. The difference between the declines for Black households and Hispanic households was also not statistically significant. For non-Hispanic White households, the $60,849 income peak in 1999 was not statistically different from their 2000 median of $60,831. For Blacks, the $39,556 income peak in 2000 was not sta-tistically different from their 1999 median of $38,460. For Hispanics, the $44,224 income peak in 2000 was not statistically different from their 2001 median of $43,531.
ratio was not statistically significant.7
Over the same period, the Hispanic to non-Hispanic White income ratio declined from 0.74 to 0.68. Income data for the Asian population was first available in 1987. The 2012 Asian to non-Hispanic White income ratio was not statistically different from the 1987 ratio.
Age of Householder
Households maintained by house-holders aged 45 to 54 had the highest median income in 2012 ($66,411), followed by those with household-ers aged 35 to 44 ($63,629), those with householders aged 55 to 64 ($58,626), those with householders aged 25 to 34 ($51,381), those with householders 65 years and older ($33,848), and lastly by those main-tained by householders aged 15 to 24 ($30,604) (Table 1). As holds true for most characteristics of households, the apparent changes in real median income between 2011 and 2012 by age of householder were not statisti-cally significant.
Nativity
In 2012, households maintained by a naturalized citizen ($53,015) or a native-born person ($51,803) had higher median incomes than house-holds maintained by a noncitizen ($37,721) (Table 1).8 The real median incomes of households maintained by a native- or foreign-born person in 2012 were not statistically different from their respective 2011 medians. Before 2012, households maintained by a native-born person had expe-rienced four consecutive annual declines in income. For households
7 The first year that income data for the Hispanic and non-Hispanic White populations were collected in the CPS ASEC was 1972.
8 The difference between the median incomes of households maintained by a naturalized citi-zen and households maintained by a native-born person was not statistically significant.
maintained by a foreign-born person, the annual income changes for the past 3 years have not been statis-tically significant, while between 2007 and 2008, these households experienced a statistically significant decline. For households maintained by a naturalized citizen and those maintained by a noncitizen, the 2012 incomes were not statistically dif-ferent from their respective 2011 incomes.
Disability Status of Householder
In 2012, 9.4 percent of householders aged 18 to 64 reported having a disability (8.8 million) (Table 1). The median income of these households was $25,974 in 2012, compared with a median of $61,103 for households with a householder that did not report a disability. Between 2011 and 2012, the changes in real median income were not statistically significant for households maintained by a house-holder either with a disability or with-out a disability.
Region9
In 2012, households with the highest median household incomes were in the West ($55,157) and the Northeast ($54,627), followed by the Midwest ($50,479) and the South ($48,033).10
9 The Northeast region includes Connecticut, Maine, Massachusetts, New Hampshire, New Jersey, New York, Pennsylvania, Rhode Island, and Vermont. The Midwest region includes Illinois, Indiana, Iowa, Kansas, Michigan, Minnesota, Missouri, Nebraska, North Dakota, Ohio, South Dakota, and Wisconsin. The South region includes Alabama, Arkansas, Delaware, Florida, Georgia, Kentucky, Louisiana, Maryland, Mississippi, North Carolina, Oklahoma, South Carolina, Tennessee, Texas, Virginia, West Virginia, and the District of Columbia, a state equivalent. The West region includes Alaska, Arizona, California, Colorado, Hawaii, Idaho, Montana, Nevada, New Mexico, Oregon, Utah, Washington, and Wyoming.
10 The difference between the median house-hold incomes for the Northeast and the West was not statistically significant.
U.S. Census Bureau Income, Poverty, and Health Insurance Coverage in the United States: 2012 9
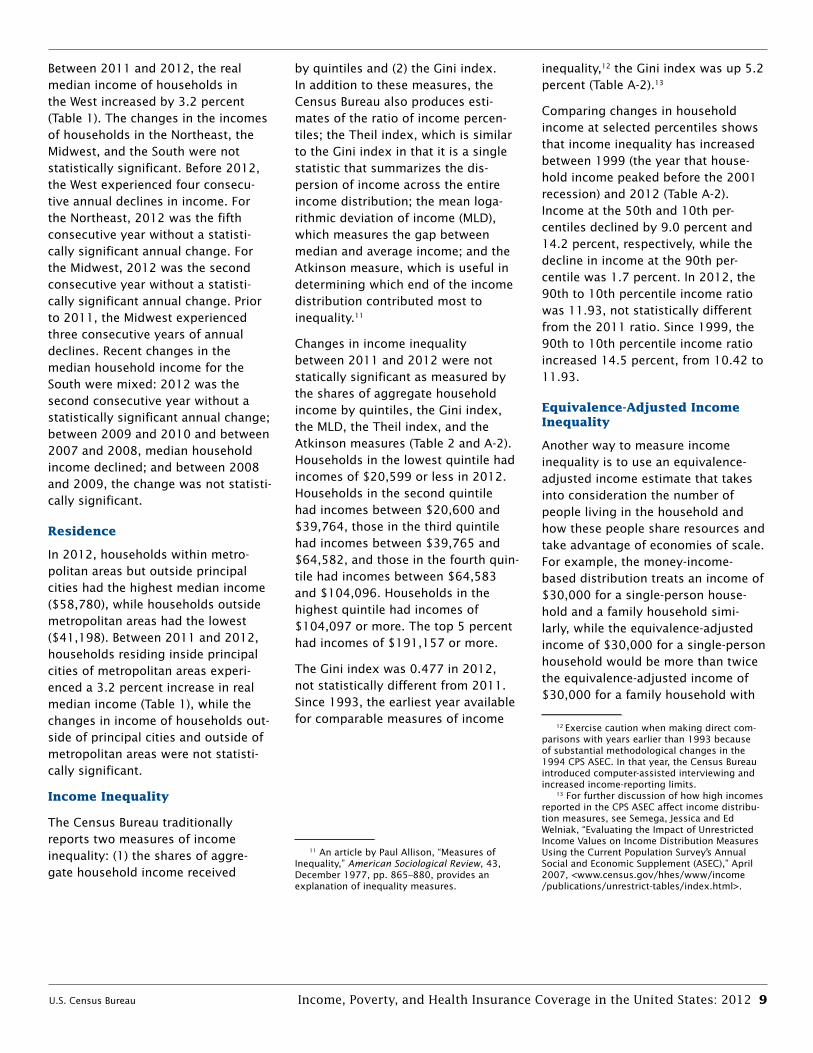
Between 2011 and 2012, the real median income of households in the West increased by 3.2 percent (Table 1). The changes in the incomes of households in the Northeast, the Midwest, and the South were not statistically significant. Before 2012, the West experienced four consecu-tive annual declines in income. For the Northeast, 2012 was the fifth consecutive year without a statisti-cally significant annual change. For the Midwest, 2012 was the second consecutive year without a statisti-cally significant annual change. Prior to 2011, the Midwest experienced three consecutive years of annual declines. Recent changes in the median household income for the South were mixed: 2012 was the second consecutive year without a statistically significant annual change; between 2009 and 2010 and between 2007 and 2008, median household income declined; and between 2008 and 2009, the change was not statisti-cally significant.
Residence
In 2012, households within metro-politan areas but outside principal cities had the highest median income ($58,780), while households outside metropolitan areas had the lowest ($41,198). Between 2011 and 2012, households residing inside principal cities of metropolitan areas experi-enced a 3.2 percent increase in real median income (Table 1), while the changes in income of households out-side of principal cities and outside of metropolitan areas were not statisti-cally significant.
Income Inequality
The Census Bureau traditionally reports two measures of income inequality: (1) the shares of aggre-gate household income received
by quintiles and (2) the Gini index. In addition to these measures, the Census Bureau also produces esti-mates of the ratio of income percen-tiles; the Theil index, which is similar to the Gini index in that it is a single statistic that summarizes the dis-persion of income across the entire income distribution; the mean loga-rithmic deviation of income (MLD), which measures the gap between median and average income; and the Atkinson measure, which is useful in determining which end of the income distribution contributed most to inequality.11
Changes in income inequality between 2011 and 2012 were not statically significant as measured by the shares of aggregate household income by quintiles, the Gini index, the MLD, the Theil index, and the Atkinson measures (Table 2 and A-2). Households in the lowest quintile had incomes of $20,599 or less in 2012. Households in the second quintile had incomes between $20,600 and $39,764, those in the third quintile had incomes between $39,765 and $64,582, and those in the fourth quin-tile had incomes between $64,583 and $104,096. Households in the highest quintile had incomes of $104,097 or more. The top 5 percent had incomes of $191,157 or more.
The Gini index was 0.477 in 2012, not statistically different from 2011. Since 1993, the earliest year available for comparable measures of income
11 An article by Paul Allison, “Measures of Inequality,” American Sociological Review, 43, December 1977, pp. 865 –880, provides an explanation of inequality measures.
inequality,12 the Gini index was up 5.2 percent (Table A-2).13
Comparing changes in household income at selected percentiles shows that income inequality has increased between 1999 (the year that house-hold income peaked before the 2001 recession) and 2012 (Table A-2). Income at the 50th and 10th per-centiles declined by 9.0 percent and 14.2 percent, respectively, while the decline in income at the 90th per-centile was 1.7 percent. In 2012, the 90th to 10th percentile income ratio was 11.93, not statistically different from the 2011 ratio. Since 1999, the 90th to 10th percentile income ratio increased 14.5 percent, from 10.42 to 11.93.
Equivalence-Adjusted Income Inequality
Another way to measure income inequality is to use an equivalence-adjusted income estimate that takes into consideration the number of people living in the household and how these people share resources and take advantage of economies of scale. For example, the money-income-based distribution treats an income of $30,000 for a single-person house-hold and a family household simi-larly, while the equivalence-adjusted income of $30,000 for a single-person household would be more than twice the equivalence-adjusted income of $30,000 for a family household with
12 Exercise caution when making direct com-parisons with years earlier than 1993 because of substantial methodological changes in the 1994 CPS ASEC. In that year, the Census Bureau introduced computer-assisted interviewing and increased income-reporting limits.
13 For further discussion of how high incomes reported in the CPS ASEC affect income distribu-tion measures, see Semega, Jessica and Ed Welniak, “Evaluating the Impact of Unrestricted Income Values on Income Distribution Measures Using the Current Population Survey’s Annual Social and Economic Supplement (ASEC),” April 2007, <www.census.gov/hhes/www/income /publications/unrestrict-tables/index.html>.

10 Income, Poverty, and Health Insurance Coverage in the United States: 2012 U.S. Census Bureau
two adults and two children. The equivalence adjustment used here is based on a three-parameter scale that reflects:14
14 The three-parameter scale used here is the same as the one used in the report The Effect of Taxes and Transfers on Income and Poverty in the United States: 2005, Current Population Reports, P60-232, U.S. Census Bureau, March 2007, <www.census.gov/prod/2007pubs /p60-232.pdf>. The three-parameter scale was applied to the incomes of families and unrelated individuals and assigned to each family member or unrelated individual living within the house-hold. For details on the derivation of the three-parameter scale, see Short, Kathleen, Experimen-tal Poverty Measures: 1999, Current Population Reports, P60-216, U.S. Census Bureau, October 2001, <www.census.gov/prod/2001pubs /p60-216.pdf>.
1. On average, children consume less than adults.
2. As family size increases, expenses do not increase at the same rate.
3. The increase in expenses is larger for a first child of a single-parent family than the first child of a two-adult family.
Table 2 shows several income inequal-ity measures, including aggregate income shares and the Gini index, using both money income and equivalence-adjusted income for 2011 and 2012. For both 2011 and 2012, the Gini index was lower when based
on an equivalence-adjusted income estimate than on the traditional money-income estimate, suggesting a more equal income distribution. Generally, the shares of aggregate household income received by quin-tiles show higher shares of income in the lower quintiles and lower shares in the higher quintiles for equiva-lence-adjusted income when com-pared with money income. This redis-tribution would be expected because the lower end of the income distribu-tion has a higher concentration of single-person households and smaller family sizes in relation to those at the upper end of the distribution. Thus,
Table 2. Income Distribution Measures Using Money Income and Equivalence-Adjusted Income: 2011 and 2012(For information on confidentiality protection, sampling error, nonsampling error, and definitions, see www.census.gov/prod/techdoc/cps/cpsmar13.pdf)
Measure
2011 2012 Percentage change1,*
Money income
Equivalence- adjusted income
Money income
Equivalence- adjusted income
Money income
Equivalence- adjusted income
Esti-mate
90 percent
C .I .2 (±)
Esti-mate
90 percent
C .I .2 (±)
Esti-mate
90 percent
C .I .2 (±)
Esti-mate
90 percent
C .I .2 (±)
Esti-mate
90 percent
C .I .2 (±)
Esti-mate
90 percent
C .I .2 (±)
Shares of Aggregate Income by Percentile
Lowest quintile . . . . . . . . . . . . . . . . . . . . . . . . 3 .2 0 .05 3 .4 0 .05 3 .2 0 .05 3 .4 0 .06 Z 1 .82 –1 .0 1 .91Second quintile . . . . . . . . . . . . . . . . . . . . . . . 8 .4 0 .07 9 .0 0 .07 8 .3 0 .08 9 .0 0 .08 –0 .6 1 .17 –0 .2 1 .02Middle quintile . . . . . . . . . . . . . . . . . . . . . . . . 14 .3 0 .10 14 .8 0 .10 14 .4 0 .12 14 .8 0 .12 0 .4 0 .94 0 .5 0 .87Fourth quintile . . . . . . . . . . . . . . . . . . . . . . . . 23 .0 0 .14 22 .8 0 .14 23 .0 0 .16 22 .9 0 .17 0 .2 0 .82 0 .4 0 .84Highest quintile . . . . . . . . . . . . . . . . . . . . . . . 51 .1 0 .28 50 .0 0 .30 51 .0 0 .32 49 .9 0 .35 –0 .1 0 .76 –0 .2 0 .78 Top 5 percent . . . . . . . . . . . . . . . . . . . . . . . 22 .3 0 .38 22 .1 0 .38 22 .3 0 .43 22 .1 0 .43 –0 .2 2 .39 –0 .1 2 .41
Summary MeasuresGini index of income inequality . . . . . . . . . . . 0 .477 0 .0029 0 .463 0 .0031 0 .477 0 .0033 0 .463 0 .0036 Z 0 .85 –0 .1 0 .87Mean logarithmic deviation of income . . . . . . 0 .585 0 .0110 0 .626 0 .0120 0 .586 0 .0112 0 .629 0 .0119 0 .2 2 .45 0 .6 2 .45Theil . . . . . . . . . . . . . . . . . . . . . . . . . . . . . . . . 0 .422 0 .0083 0 .404 0 .0087 0 .423 0 .0097 0 .405 0 .0102 0 .3 2 .84 0 .4 3 .03Atkinson: e=0 .25 . . . . . . . . . . . . . . . . . . . . . . . . . . 0 .101 0 .0016 0 .097 0 .0017 0 .101 0 .0019 0 .097 0 .0019 0 .2 2 .29 0 .2 2 .40 e=0 .50 . . . . . . . . . . . . . . . . . . . . . . . . . . 0 .198 0 .0026 0 .191 0 .0027 0 .198 0 .0029 0 .192 0 .0031 0 .1 1 .86 0 .1 1 .92 e=0 .75 . . . . . . . . . . . . . . . . . . . . . . . . . . 0 .300 0 .0035 0 .297 0 .0037 0 .300 0 .0038 0 .298 0 .0040 0 .1 1 .60 0 .2 1 .63
* An asterisk preceding an estimate indicates change is statistically different from zero at the 90 percent confidence level .Z Represents or rounds to zero .1 Calculated estimate may be different due to rounded components .2 A 90 percent confidence interval is a measure of an estimate’s variability . The larger the confidence interval in relation to the size of the estimate, the less reliable the
estimate . Confidence intervals shown in this table are based on standard errors calculated using replicate weights . For more information, see “Standard Errors and Their Use” at <www .census .gov/hhes/www/p60_245sa .pdf> .
Source: U . S . Census Bureau, Current Population Survey, 2012 and 2013 Annual Social and Economic Supplements .
U.S. Census Bureau Income, Poverty, and Health Insurance Coverage in the United States: 2012 11
equivalence adjusting increases the relative income of people living in lower-income groups.
Based on equivalence-adjusted income, changes in inequality between 2011 and 2012 were not statistically significant as measured by the shares of aggregate house-hold income by quintiles, the Gini index, the MLD, the Theil index, and the Atkinson measures (Table 2). The Gini index was 0.463 in 2012. The MLD was 0.629; the Theil index was 0.405; and the Atkinson mea-sure, calculated with e=0.25 was 0.097 and with e=0.75 was 0.298 in 2012. Table A-3 shows equivalence-adjusted measures of income distribu-tion as well as the Gini index, MLD, Theil index, and Atkinson measure
for income years 1967 to 2012. Since 1993, by shares, equivalence-adjusted aggregate income declined in the lowest, second, and third quintiles (13.2 percent, 8.0 percent, and 4.9 percent, respectively).15 The share of equivalence-adjusted aggre-gate income in the highest quintile increased 4.6 percent. Between 1993 and 2012, the Gini index was up 6.1 percent.16
15 The differences between the percent declines in the second and third shares of aggre-gate income were not statistically different from each other.
16 The change in the money income Gini index between 1993 and 2012 (5.2 percent) was not statistically different from the change in the equivalence-adjusted Gini index during the same period (6.1 percent). The percent changes for the equivalence-adjusted Gini index and the high-est quintile were not statistically different from each other.
Earnings and Work Experience
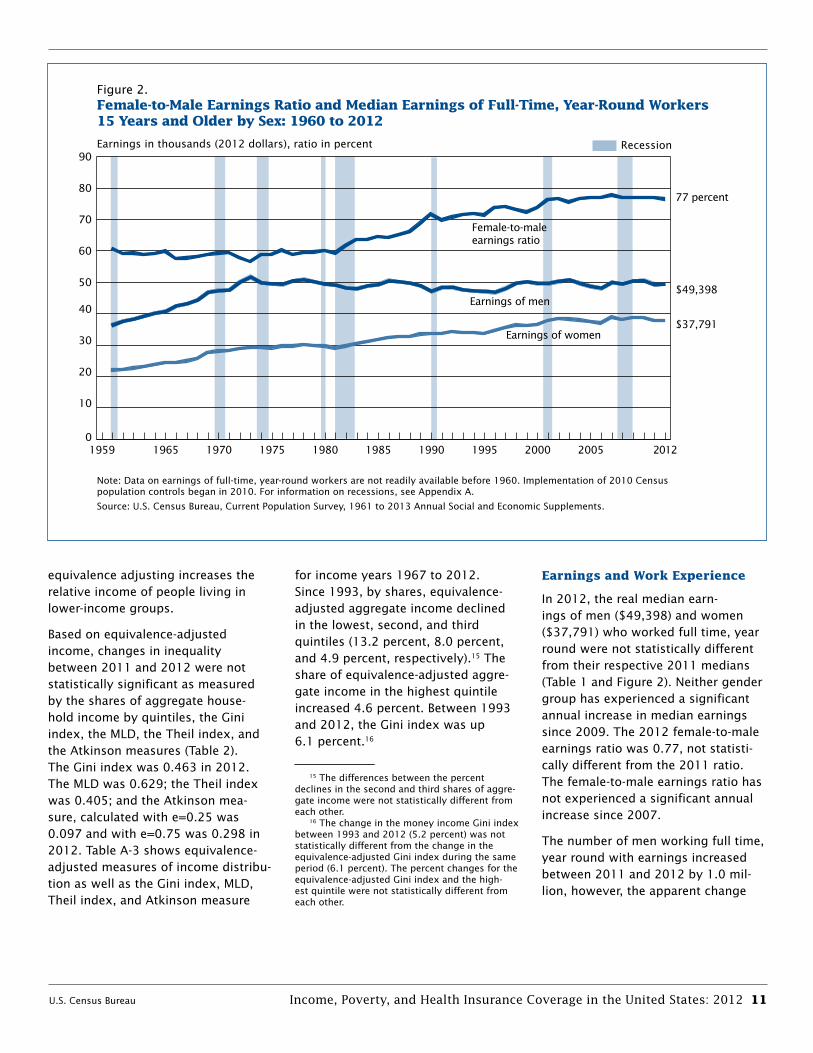
In 2012, the real median earn-ings of men ($49,398) and women ($37,791) who worked full time, year round were not statistically different from their respective 2011 medians (Table 1 and Figure 2). Neither gender group has experienced a significant annual increase in median earnings since 2009. The 2012 female-to-male earnings ratio was 0.77, not statisti-cally different from the 2011 ratio. The female-to-male earnings ratio has not experienced a significant annual increase since 2007.
The number of men working full time, year round with earnings increased between 2011 and 2012 by 1.0 mil-lion, however, the apparent change
Figure 2.Female-to-Male Earnings Ratio and Median Earnings of Full-Time, Year-Round Workers15 Years and Older by Sex: 1960 to 2012
0
10
20
30
40
50
60
70
80
90
201220052000 19951990198519801975197019651959
Note: Data on earnings of full-time, year-round workers are not readily available before 1960. Implementation of 2010 Census population controls began in 2010. For information on recessions, see Appendix A.
Source: U.S. Census Bureau, Current Population Survey, 1961 to 2013 Annual Social and Economic Supplements.
Earnings in thousands (2012 dollars), ratio in percent Recession
Earnings of women
Female-to-male earnings ratio
77 percent
$49,398
$37,791
Earnings of men
12 Income, Poverty, and Health Insurance Coverage in the United States: 2012 U.S. Census Bureau
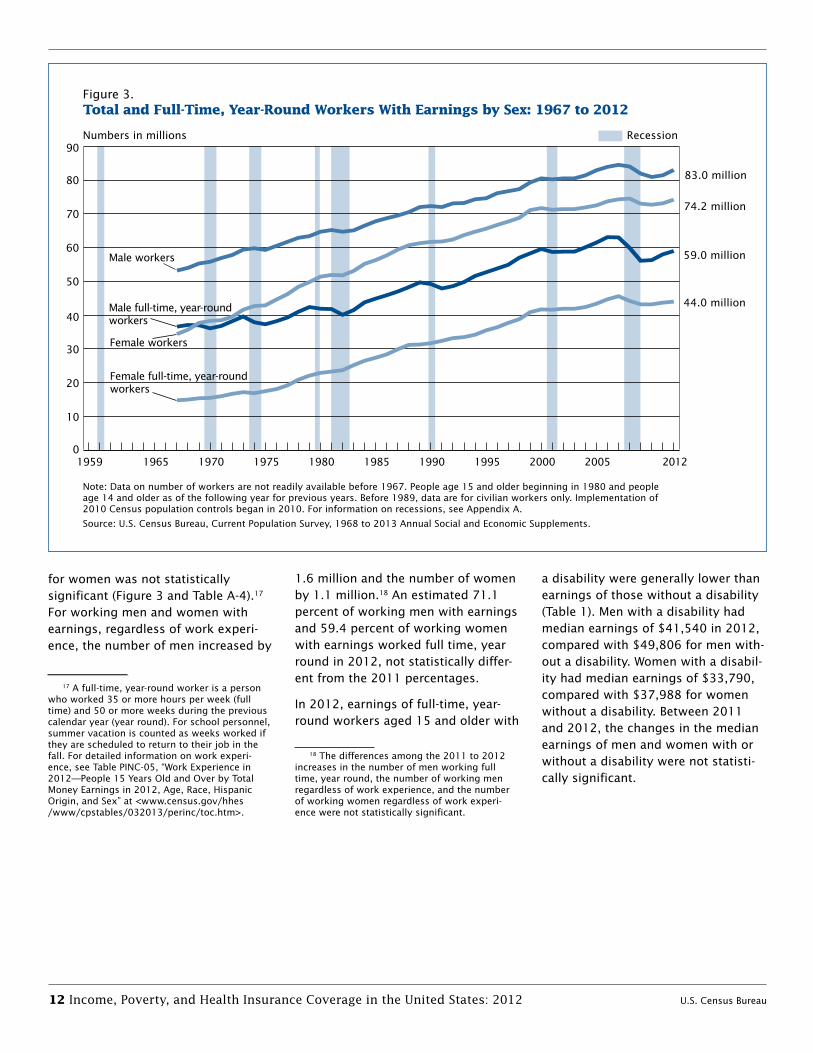
for women was not statistically significant (Figure 3 and Table A-4).17 For working men and women with earnings, regardless of work experi-ence, the number of men increased by
17 A full-time, year-round worker is a person who worked 35 or more hours per week (full time) and 50 or more weeks during the previous calendar year (year round). For school personnel, summer vacation is counted as weeks worked if they are scheduled to return to their job in the fall. For detailed information on work experi-ence, see Table PINC-05, “Work Experience in 2012—People 15 Years Old and Over by Total Money Earnings in 2012, Age, Race, Hispanic Origin, and Sex” at <www.census.gov/hhes /www/cpstables/032013/perinc/toc.htm>.
1.6 million and the number of women by 1.1 million.18 An estimated 71.1 percent of working men with earnings and 59.4 percent of working women with earnings worked full time, year round in 2012, not statistically differ-ent from the 2011 percentages.
In 2012, earnings of full-time, year-round workers aged 15 and older with
18 The differences among the 2011 to 2012 increases in the number of men working full time, year round, the number of working men regardless of work experience, and the number of working women regardless of work experi-ence were not statistically significant.
a disability were generally lower than earnings of those without a disability (Table 1). Men with a disability had median earnings of $41,540 in 2012, compared with $49,806 for men with-out a disability. Women with a disabil-ity had median earnings of $33,790, compared with $37,988 for women without a disability. Between 2011 and 2012, the changes in the median earnings of men and women with or without a disability were not statisti-cally significant.
Figure 3.Total and Full-Time, Year-Round Workers With Earnings by Sex: 1967 to 2012
Note: Data on number of workers are not readily available before 1967. People age 15 and older beginning in 1980 and people age 14 and older as of the following year for previous years. Before 1989, data are for civilian workers only. Implementation of 2010 Census population controls began in 2010. For information on recessions, see Appendix A.
Source: U.S. Census Bureau, Current Population Survey, 1968 to 2013 Annual Social and Economic Supplements.
Numbers in millions Recession
83.0 million
74.2 million
59.0 million
44.0 million
0
10
20
30
40
50
60
70
80
90
201220052000 19951990198519801975197019651959
Female full-time, year-round workers
Male workers
Female workers
Male full-time, year-round workers
U.S. Census Bureau Income, Poverty, and Health Insurance Coverage in the United States: 2012 13
PoVERTY IN THE UNITED STATES19
Highlights
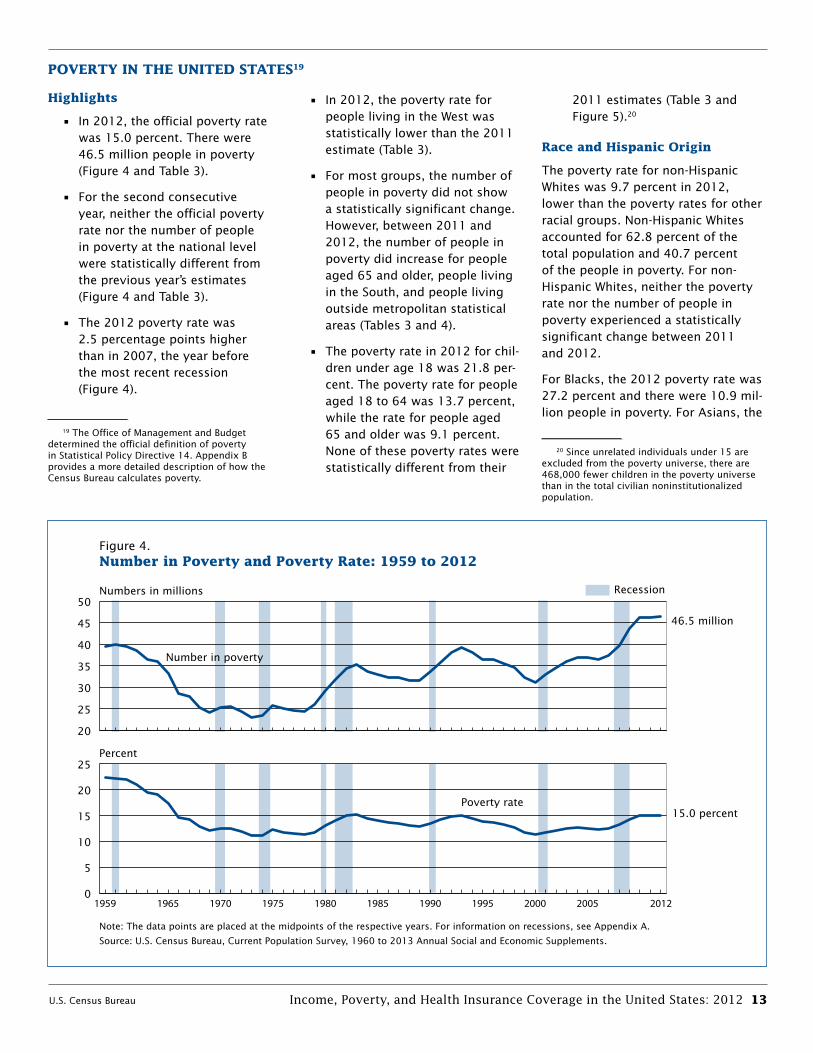
• In2012,theofficialpovertyratewas 15.0 percent. There were 46.5 million people in poverty (Figure 4 and Table 3).
• Forthesecondconsecutiveyear, neither the official poverty rate nor the number of people in poverty at the national level were statistically different from the previous year’s estimates (Figure 4 and Table 3).
• The2012povertyratewas2.5 percentage points higher than in 2007, the year before the most recent recession (Figure 4).19
19 The Office of Management and Budget determined the official definition of poverty in Statistical Policy Directive 14. Appendix B provides a more detailed description of how the Census Bureau calculates poverty.
• In2012,thepovertyrateforpeople living in the West was statistically lower than the 2011 estimate (Table 3).
• Formostgroups,thenumberofpeople in poverty did not show a statistically significant change. However, between 2011 and 2012, the number of people in poverty did increase for people aged 65 and older, people living in the South, and people living outside metropolitan statistical areas (Tables 3 and 4).
• Thepovertyratein2012forchil-dren under age 18 was 21.8 per-cent. The poverty rate for people aged 18 to 64 was 13.7 percent, while the rate for people aged 65 and older was 9.1 percent. None of these poverty rates were statistically different from their
2011 estimates (Table 3 and Figure 5).20
Race and Hispanic origin
The poverty rate for non-Hispanic Whites was 9.7 percent in 2012, lower than the poverty rates for other racial groups. Non-Hispanic Whites accounted for 62.8 percent of the total population and 40.7 percent of the people in poverty. For non- Hispanic Whites, neither the poverty rate nor the number of people in poverty experienced a statistically significant change between 2011 and 2012.
For Blacks, the 2012 poverty rate was 27.2 percent and there were 10.9 mil-lion people in poverty. For Asians, the
20 Since unrelated individuals under 15 are excluded from the poverty universe, there are 468,000 fewer children in the poverty universe than in the total civilian noninstitutionalized population.
Figure 4.Number in Poverty and Poverty Rate: 1959 to 2012
Note: The data points are placed at the midpoints of the respective years. For information on recessions, see Appendix A.
Source: U.S. Census Bureau, Current Population Survey, 1960 to 2013 Annual Social and Economic Supplements.
Numbers in millions Recession
46.5 million
15.0 percent
Number in poverty
Poverty rate
Percent
20
25
30
35
40
45
50
0
5
10
15
20
25
201220052000 19951990198519801975197019651959

14 Income, Poverty, and Health Insurance Coverage in the United States: 2012 U.S. Census Bureau
Table 3.People in Poverty by Selected Characteristics: 2011 and 2012(Numbers in thousands, confidence intervals [C.I.] in thousands or percentage points as appropriate. People as of March of the following year. For information on confidentiality protection, sampling error, nonsampling error, and definitions, see www.census.gov/prod/techdoc/cps/cpsmar13.pdf)
Characteristic
2011 2012 Change in poverty (2012 less 2011)1,*
Total
Below poverty
Total
Below poverty
Number
90 percentC .I .2 (±) Percent
90 percentC .I .2 (±) Number
90 percentC .I .2 (±) Percent
90 percentC .I .2 (±) Number Percent
PEOPLE Total . . . . . . . . . . . . . . . . . . . . . . . . . 308,456 46,247 761 15 .0 0 .2 310,648 46,496 899 15 .0 0 .3 249 Z
Family StatusIn families . . . . . . . . . . . . . . . . . . . . . . . . . . . . 252,316 33,126 729 13 .1 0 .3 252,863 33,198 823 13 .1 0 .3 72 Z Householder . . . . . . . . . . . . . . . . . . . . . . . . . 80,529 9,497 218 11 .8 0 .3 80,944 9,520 230 11 .8 0 .3 24 Z Related children under age 18 . . . . . . . . . . . 72,568 15,539 377 21 .4 0 .5 72,545 15,437 431 21 .3 0 .6 –102 –0 .1 Related children under age 6 . . . . . . . . . . 23,860 5,844 191 24 .5 0 .8 23,604 5,769 221 24 .4 0 .9 –75 –0 .1In unrelated subfamilies . . . . . . . . . . . . . . . . . . 1,623 705 109 43 .4 4 .5 1,599 740 99 46 .3 4 .9 35 2 .9 Reference person . . . . . . . . . . . . . . . . . . . . 671 272 41 40 .6 4 .4 641 278 36 43 .3 4 .6 5 2 .7 Children under age 18 . . . . . . . . . . . . . . . . . 846 409 70 48 .4 5 .1 855 440 65 51 .4 5 .3 30 3 .0Unrelated individuals . . . . . . . . . . . . . . . . . . . . 54,517 12,416 347 22 .8 0 .5 56,185 12,558 344 22 .4 0 .5 142 –0 .4
Race3 and Hispanic OriginWhite . . . . . . . . . . . . . . . . . . . . . . . . . . . . . . . . 241,334 30,849 646 12 .8 0 .3 242,147 30,816 709 12 .7 0 .3 –33 –0 .1 White, not Hispanic . . . . . . . . . . . . . . . . . . . 194,960 19,171 548 9 .8 0 .3 195,112 18,940 595 9 .7 0 .3 –231 –0 .1Black . . . . . . . . . . . . . . . . . . . . . . . . . . . . . . . . 39,609 10,929 404 27 .6 1 .0 40,125 10,911 422 27 .2 1 .1 –18 –0 .4Asian . . . . . . . . . . . . . . . . . . . . . . . . . . . . . . . . 16,086 1,973 194 12 .3 1 .2 16,417 1,921 191 11 .7 1 .1 –52 –0 .6
Hispanic (any race) . . . . . . . . . . . . . . . . . . . . . 52,279 13,244 433 25 .3 0 .8 53,105 13,616 458 25 .6 0 .9 371 0 .3
SexMale . . . . . . . . . . . . . . . . . . . . . . . . . . . . . . . . . 150,990 20,501 369 13 .6 0 .2 152,058 20,656 464 13 .6 0 .3 155 ZFemale . . . . . . . . . . . . . . . . . . . . . . . . . . . . . . . 157,466 25,746 492 16 .3 0 .3 158,590 25,840 529 16 .3 0 .3 94 –0 .1
AgeUnder age 18 . . . . . . . . . . . . . . . . . . . . . . . . . . 73,737 16,134 376 21 .9 0 .5 73,719 16,073 447 21 .8 0 .6 –61 –0 .1Aged 18 to 64 . . . . . . . . . . . . . . . . . . . . . . . . . 193,213 26,492 472 13 .7 0 .2 193,642 26,497 522 13 .7 0 .3 4 ZAged 65 and older . . . . . . . . . . . . . . . . . . . . . . 41,507 3,620 167 8 .7 0 .4 43,287 3,926 174 9 .1 0 .4 *305 0 .3
NativityNative born . . . . . . . . . . . . . . . . . . . . . . . . . . . 268,490 38,661 681 14 .4 0 .3 270,570 38,803 827 14 .3 0 .3 142 –0 .1Foreign born . . . . . . . . . . . . . . . . . . . . . . . . . . 39,966 7,586 311 19 .0 0 .7 40,078 7,693 304 19 .2 0 .6 107 0 .2 Naturalized citizen . . . . . . . . . . . . . . . . . . . . 17,934 2,233 152 12 .5 0 .8 18,193 2,252 159 12 .4 0 .8 19 –0 .1 Not a citizen . . . . . . . . . . . . . . . . . . . . . . . . . 22,032 5,353 274 24 .3 1 .1 21,885 5,441 254 24 .9 1 .0 87 0 .6
RegionNortheast . . . . . . . . . . . . . . . . . . . . . . . . . . . . . 54,977 7,208 319 13 .1 0 .6 55,050 7,490 302 13 .6 0 .6 282 0 .5Midwest . . . . . . . . . . . . . . . . . . . . . . . . . . . . . . 66,023 9,221 403 14 .0 0 .6 66,337 8,851 388 13 .3 0 .6 –370 –0 .6South . . . . . . . . . . . . . . . . . . . . . . . . . . . . . . . . 114,936 18,380 576 16 .0 0 .5 115,957 19,106 686 16 .5 0 .6 *726 0 .5West . . . . . . . . . . . . . . . . . . . . . . . . . . . . . . . . 72,520 11,437 425 15 .8 0 .6 73,303 11,049 409 15 .1 0 .6 –388 *–0 .7
ResidenceInside metropolitan statistical areas . . . . . . . . 261,155 38,202 848 14 .6 0 .3 262,949 38,033 914 14 .5 0 .3 –169 –0 .2 Inside principal cities . . . . . . . . . . . . . . . . . . 100,183 20,007 659 20 .0 0 .6 101,225 19,934 610 19 .7 0 .5 –73 –0 .3 Outside principal cities . . . . . . . . . . . . . . . . . 160,973 18,195 625 11 .3 0 .3 161,724 18,099 669 11 .2 0 .4 –96 –0 .1Outside metropolitan statistical areas4 . . . . . . 47,301 8,045 596 17 .0 0 .8 47,698 8,463 639 17 .7 0 .9 *418 0 .7
Work Experience Total, aged 18 to 64 . . . . . . . . . . . . . . 193,213 26,492 472 13 .7 0 .2 193,642 26,497 522 13 .7 0 .3 4 ZAll workers . . . . . . . . . . . . . . . . . . . . . . . . . . . . 144,163 10,345 257 7 .2 0 .2 145,814 10,672 294 7 .3 0 .2 327 0 .1 Worked full-time, year-round . . . . . . . . . . . . 97,443 2,732 122 2 .8 0 .1 98,715 2,867 133 2 .9 0 .1 135 0 .1 Less than full-time, year-round . . . . . . . . . . . 46,720 7,614 230 16 .3 0 .5 47,099 7,805 233 16 .6 0 .5 191 0 .3Did not work at least 1 week . . . . . . . . . . . . . . 49,049 16,147 379 32 .9 0 .7 47,828 15,825 369 33 .1 0 .6 –322 0 .2
Disability Status5
Total, aged 18 to 64 . . . . . . . . . . . . . . 193,213 26,492 472 13 .7 0 .2 193,642 26,497 522 13 .7 0 .3 4 ZWith a disability . . . . . . . . . . . . . . . . . . . . . . . . 14,968 4,313 175 28 .8 1 .0 14,996 4,257 161 28 .4 0 .9 –56 –0 .4With no disability . . . . . . . . . . . . . . . . . . . . . . . 177,309 22,105 459 12 .5 0 .3 177,727 22,189 478 12 .5 0 .3 84 Z
Z Represents or rounds to zero .*An asterisk preceding an estimate indicates change is statistically different from zero at the 90 percent confidence level .1 Details may not sum to totals because of rounding .2 A 90 percent confidence interval is a measure of an estimate’s variability . The larger the confidence interval in relation to the size of the estimate, the less reliable the estimate . Confidence intervals
shown in this table are based on standard errors calculated using replicate weights . For more information see “Standard Errors and Their Use” at <www .census .gov/hhes/www/p60_245sa .pdf> . 3 Federal surveys give respondents the option of reporting more than one race . Therefore, two basic ways of defining a race group are possible . A group such as Asian may be defined as those who
reported Asian and no other race (the race-alone or single-race concept) or as those who reported Asian regardless of whether they also reported another race (the race-alone-or-in-combination concept) . This table shows data using the first approach (race alone) . The use of the single-race population does not imply that it is the preferred method of presenting or analyzing data . The Census Bureau uses a variety of approaches . Information on people who reported more than one race, such as White and American Indian and Alaska Native or Asian and Black or African American, is available from Census 2010 through American FactFinder . About 2 .9 percent of people reported more than one race in Census 2010 . Data for American Indians and Alaska Natives, Native Hawaiians and Other Pacific Islanders, and those reporting two or more races are not shown separately .
4 The “Outside metropolitan statistical areas” category includes both micropolitan statistical areas and territory outside of metropolitan and micropolitan statistical areas . For more information, see “About Metropolitan and Micropolitan Statistical Areas” at <www .census .gov/population/www/estimates/aboutmetro .html> .
5 The sum of those with and without a disability does not equal the total because disability status is not defined for individuals in the Armed Forces .Source: U .S . Census Bureau, Current Population Survey, 2012 and 2013 Annual Social and Economic Supplements .
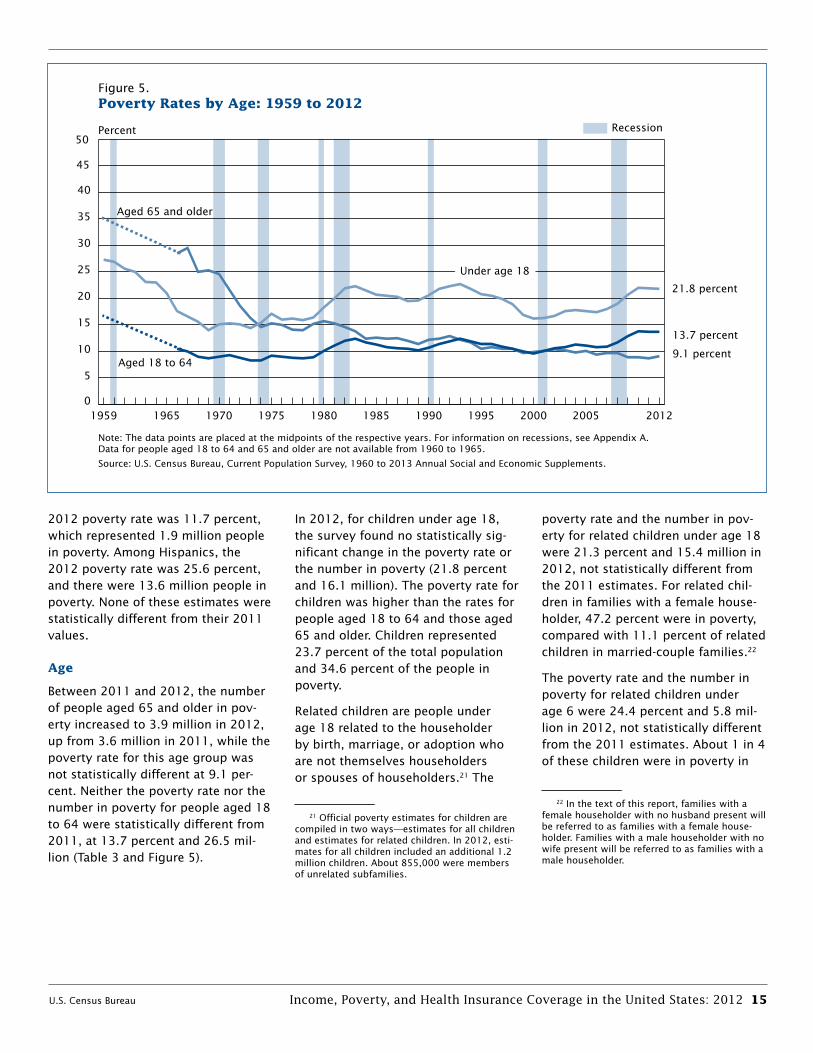
U.S. Census Bureau Income, Poverty, and Health Insurance Coverage in the United States: 2012 15
2012 poverty rate was 11.7 percent, which represented 1.9 million people in poverty. Among Hispanics, the 2012 poverty rate was 25.6 percent, and there were 13.6 million people in poverty. None of these estimates were statistically different from their 2011 values.
Age
Between 2011 and 2012, the number of people aged 65 and older in pov-erty increased to 3.9 million in 2012, up from 3.6 million in 2011, while the poverty rate for this age group was not statistically different at 9.1 per-cent. Neither the poverty rate nor the number in poverty for people aged 18 to 64 were statistically different from 2011, at 13.7 percent and 26.5 mil-lion (Table 3 and Figure 5).
In 2012, for children under age 18, the survey found no statistically sig-nificant change in the poverty rate or the number in poverty (21.8 percent and 16.1 million). The poverty rate for children was higher than the rates for people aged 18 to 64 and those aged 65 and older. Children represented 23.7 percent of the total population and 34.6 percent of the people in poverty.
Related children are people under age 18 related to the householder by birth, marriage, or adoption who are not themselves householders or spouses of householders.21 The
21 Official poverty estimates for children are compiled in two ways—estimates for all children and estimates for related children. In 2012, esti-mates for all children included an additional 1.2 million children. About 855,000 were members of unrelated subfamilies.
poverty rate and the number in pov-erty for related children under age 18 were 21.3 percent and 15.4 million in 2012, not statistically different from the 2011 estimates. For related chil-dren in families with a female house-holder, 47.2 percent were in poverty, compared with 11.1 percent of related children in married-couple families.22
The poverty rate and the number in poverty for related children under age 6 were 24.4 percent and 5.8 mil-lion in 2012, not statistically different from the 2011 estimates. About 1 in 4 of these children were in poverty in
22 In the text of this report, families with a female householder with no husband present will be referred to as families with a female house-holder. Families with a male householder with no wife present will be referred to as families with a male householder.
Figure 5.Poverty Rates by Age: 1959 to 2012
Note: The data points are placed at the midpoints of the respective years. For information on recessions, see Appendix A. Data for people aged 18 to 64 and 65 and older are not available from 1960 to 1965.
Source: U.S. Census Bureau, Current Population Survey, 1960 to 2013 Annual Social and Economic Supplements.
Percent
0
5
10
15
20
25
30
35
40
45
50
201220052000 19951990198519801975197019651959
Recession
13.7 percent
9.1 percent
21.8 percent
Aged 18 to 64
Under age 18
Aged 65 and older
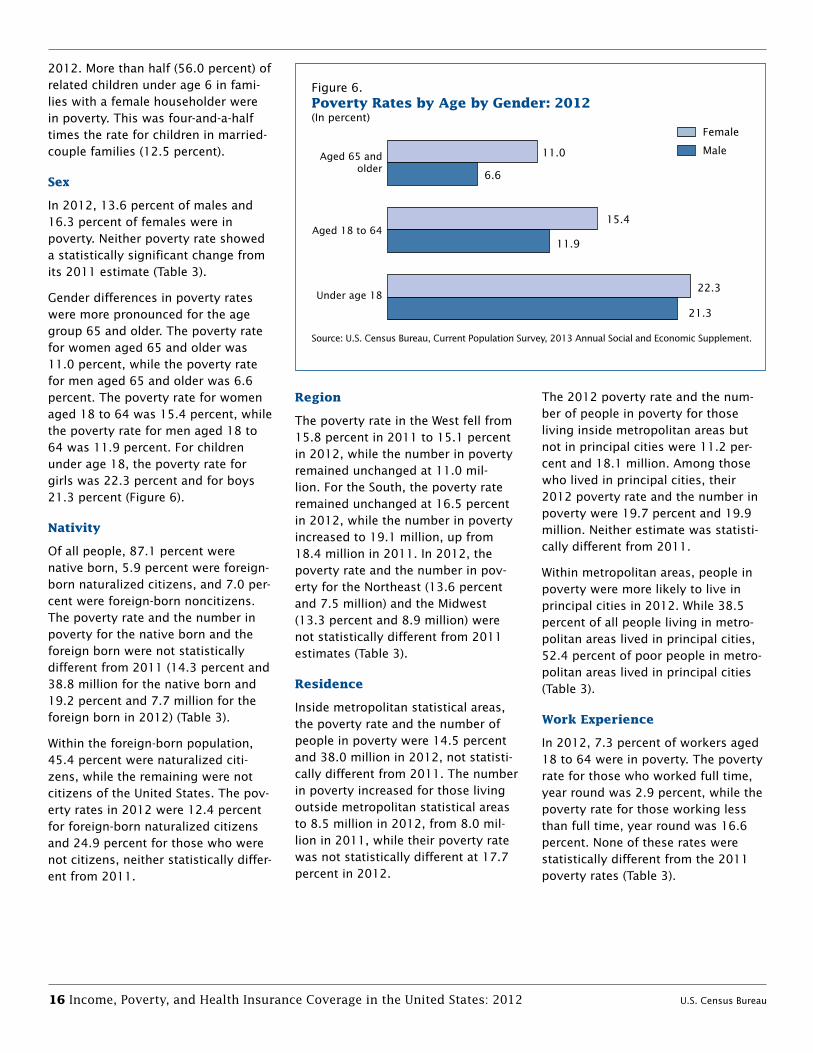
16 Income, Poverty, and Health Insurance Coverage in the United States: 2012 U.S. Census Bureau
2012. More than half (56.0 percent) of related children under age 6 in fami-lies with a female householder were in poverty. This was four-and-a-half times the rate for children in married-couple families (12.5 percent).
Sex
In 2012, 13.6 percent of males and 16.3 percent of females were in poverty. Neither poverty rate showed a statistically significant change from its 2011 estimate (Table 3).
Gender differences in poverty rates were more pronounced for the age group 65 and older. The poverty rate for women aged 65 and older was 11.0 percent, while the poverty rate for men aged 65 and older was 6.6 percent. The poverty rate for women aged 18 to 64 was 15.4 percent, while the poverty rate for men aged 18 to 64 was 11.9 percent. For children under age 18, the poverty rate for girls was 22.3 percent and for boys 21.3 percent (Figure 6).
Nativity
Of all people, 87.1 percent were native born, 5.9 percent were foreign-born naturalized citizens, and 7.0 per-cent were foreign-born noncitizens. The poverty rate and the number in poverty for the native born and the foreign born were not statistically different from 2011 (14.3 percent and 38.8 million for the native born and 19.2 percent and 7.7 million for the foreign born in 2012) (Table 3).
Within the foreign-born population, 45.4 percent were naturalized citi-zens, while the remaining were not citizens of the United States. The pov-erty rates in 2012 were 12.4 percent for foreign-born naturalized citizens and 24.9 percent for those who were not citizens, neither statistically differ-ent from 2011.
Region
The poverty rate in the West fell from 15.8 percent in 2011 to 15.1 percent in 2012, while the number in poverty remained unchanged at 11.0 mil-lion. For the South, the poverty rate remained unchanged at 16.5 percent in 2012, while the number in poverty increased to 19.1 million, up from 18.4 million in 2011. In 2012, the poverty rate and the number in pov-erty for the Northeast (13.6 percent and 7.5 million) and the Midwest (13.3 percent and 8.9 million) were not statistically different from 2011 estimates (Table 3).
Residence
Inside metropolitan statistical areas, the poverty rate and the number of people in poverty were 14.5 percent and 38.0 million in 2012, not statisti-cally different from 2011. The number in poverty increased for those living outside metropolitan statistical areas to 8.5 million in 2012, from 8.0 mil-lion in 2011, while their poverty rate was not statistically different at 17.7 percent in 2012.
The 2012 poverty rate and the num-ber of people in poverty for those living inside metropolitan areas but not in principal cities were 11.2 per-cent and 18.1 million. Among those who lived in principal cities, their 2012 poverty rate and the number in poverty were 19.7 percent and 19.9 million. Neither estimate was statisti-cally different from 2011.
Within metropolitan areas, people in poverty were more likely to live in principal cities in 2012. While 38.5 percent of all people living in metro-politan areas lived in principal cities, 52.4 percent of poor people in metro-politan areas lived in principal cities (Table 3).
Work Experience
In 2012, 7.3 percent of workers aged 18 to 64 were in poverty. The poverty rate for those who worked full time, year round was 2.9 percent, while the poverty rate for those working less than full time, year round was 16.6 percent. None of these rates were statistically different from the 2011 poverty rates (Table 3).
Figure 6.Poverty Rates by Age by Gender: 2012
Source: U.S. Census Bureau, Current Population Survey, 2013 Annual Social and Economic Supplement.
(In percent)Female
Male
21.3
22.3
11.9
15.4
6.6
11.0
Under age 18
Aged 18 to 64
Aged 65 and older
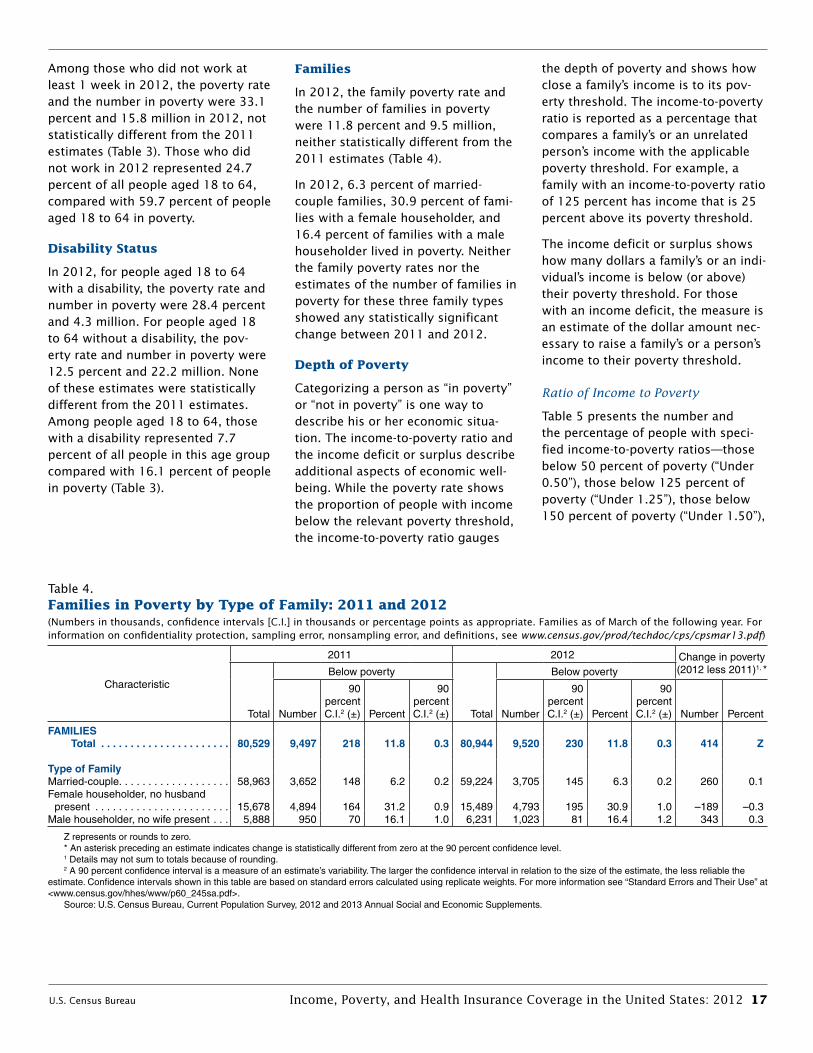
U.S. Census Bureau Income, Poverty, and Health Insurance Coverage in the United States: 2012 17
Among those who did not work at least 1 week in 2012, the poverty rate and the number in poverty were 33.1 percent and 15.8 million in 2012, not statistically different from the 2011 estimates (Table 3). Those who did not work in 2012 represented 24.7 percent of all people aged 18 to 64, compared with 59.7 percent of people aged 18 to 64 in poverty.
Disability Status
In 2012, for people aged 18 to 64 with a disability, the poverty rate and number in poverty were 28.4 percent and 4.3 million. For people aged 18 to 64 without a disability, the pov-erty rate and number in poverty were 12.5 percent and 22.2 million. None of these estimates were statistically different from the 2011 estimates. Among people aged 18 to 64, those with a disability represented 7.7 percent of all people in this age group compared with 16.1 percent of people in poverty (Table 3).
Families
In 2012, the family poverty rate and the number of families in poverty were 11.8 percent and 9.5 million, neither statistically different from the 2011 estimates (Table 4).
In 2012, 6.3 percent of married- couple families, 30.9 percent of fami-lies with a female householder, and 16.4 percent of families with a male householder lived in poverty. Neither the family poverty rates nor the estimates of the number of families in poverty for these three family types showed any statistically significant change between 2011 and 2012.
Depth of Poverty
Categorizing a person as “in poverty” or “not in poverty” is one way to describe his or her economic situa-tion. The income-to-poverty ratio and the income deficit or surplus describe additional aspects of economic well-being. While the poverty rate shows the proportion of people with income below the relevant poverty threshold, the income-to-poverty ratio gauges
the depth of poverty and shows how close a family’s income is to its pov-erty threshold. The income-to-poverty ratio is reported as a percentage that compares a family’s or an unrelated person’s income with the applicable poverty threshold. For example, a family with an income-to-poverty ratio of 125 percent has income that is 25 percent above its poverty threshold.
The income deficit or surplus shows how many dollars a family’s or an indi-vidual’s income is below (or above) their poverty threshold. For those with an income deficit, the measure is an estimate of the dollar amount nec-essary to raise a family’s or a person’s income to their poverty threshold.
Ratio of Income to Poverty
Table 5 presents the number and the percentage of people with speci-fied income-to-poverty ratios—those below 50 percent of poverty (“Under 0.50”), those below 125 percent of poverty (“Under 1.25”), those below 150 percent of poverty (“Under 1.50”),
Table 4.Families in Poverty by Type of Family: 2011 and 2012(Numbers in thousands, confidence intervals [C.I.] in thousands or percentage points as appropriate. Families as of March of the following year. For information on confidentiality protection, sampling error, nonsampling error, and definitions, see www.census.gov/prod/techdoc/cps/cpsmar13.pdf)
Characteristic
2011 2012 Change in poverty (2012 less 2011)1, *
Total
Below poverty
Total
Below poverty
Number
90 percentC .I .2 (±) Percent
90 percentC .I .2 (±) Number
90 percentC .I .2 (±) Percent
90 percentC .I .2 (±) Number Percent
FAMILIES Total . . . . . . . . . . . . . . . . . . . . . . 80,529 9,497 218 11 .8 0 .3 80,944 9,520 230 11 .8 0 .3 414 Z
Type of FamilyMarried-couple . . . . . . . . . . . . . . . . . . . 58,963 3,652 148 6 .2 0 .2 59,224 3,705 145 6 .3 0 .2 260 0 .1Female householder, no husband
present . . . . . . . . . . . . . . . . . . . . . . . 15,678 4,894 164 31 .2 0 .9 15,489 4,793 195 30 .9 1 .0 –189 –0 .3Male householder, no wife present . . . 5,888 950 70 16 .1 1 .0 6,231 1,023 81 16 .4 1 .2 343 0 .3
Z represents or rounds to zero .* An asterisk preceding an estimate indicates change is statistically different from zero at the 90 percent confidence level .1 Details may not sum to totals because of rounding .2 A 90 percent confidence interval is a measure of an estimate’s variability . The larger the confidence interval in relation to the size of the estimate, the less reliable the
estimate . Confidence intervals shown in this table are based on standard errors calculated using replicate weights . For more information see “Standard Errors and Their Use” at <www .census .gov/hhes/www/p60_245sa .pdf> .
Source: U .S . Census Bureau, Current Population Survey, 2012 and 2013 Annual Social and Economic Supplements .
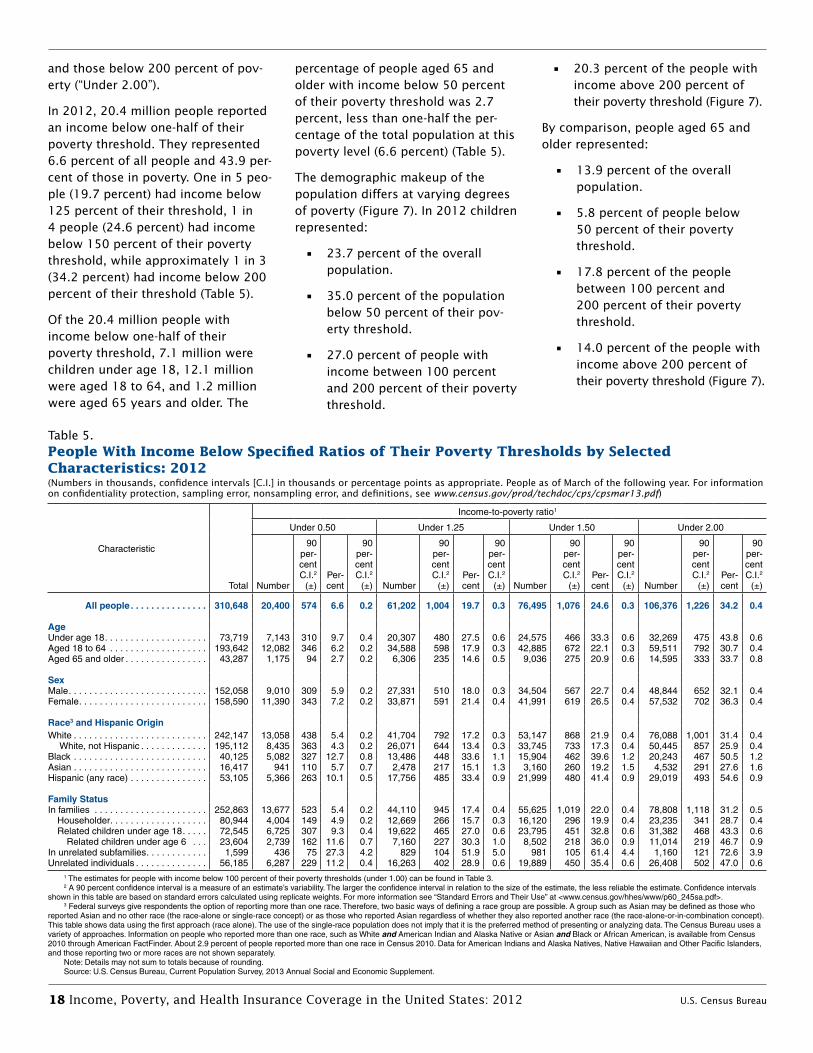
18 Income, Poverty, and Health Insurance Coverage in the United States: 2012 U.S. Census Bureau
and those below 200 percent of pov-erty (“Under 2.00”).
In 2012, 20.4 million people reported an income below one-half of their poverty threshold. They represented 6.6 percent of all people and 43.9 per-cent of those in poverty. One in 5 peo-ple (19.7 percent) had income below 125 percent of their threshold, 1 in 4 people (24.6 percent) had income below 150 percent of their poverty threshold, while approximately 1 in 3 (34.2 percent) had income below 200 percent of their threshold (Table 5).
Of the 20.4 million people with income below one-half of their poverty threshold, 7.1 million were children under age 18, 12.1 million were aged 18 to 64, and 1.2 million were aged 65 years and older. The
percentage of people aged 65 and older with income below 50 percent of their poverty threshold was 2.7 percent, less than one-half the per-centage of the total population at this poverty level (6.6 percent) (Table 5).
The demographic makeup of the population differs at varying degrees of poverty (Figure 7). In 2012 children represented:
• 23.7percentoftheoverallpopulation.
• 35.0percentofthepopulationbelow 50 percent of their pov-erty threshold.
• 27.0percentofpeoplewithincome between 100 percent and 200 percent of their poverty threshold.
• 20.3percentofthepeoplewithincome above 200 percent of their poverty threshold (Figure 7).
By comparison, people aged 65 and older represented:
• 13.9percentoftheoverallpopulation.
• 5.8percentofpeoplebelow50 percent of their poverty threshold.
• 17.8percentofthepeoplebetween 100 percent and 200 percent of their poverty threshold.
• 14.0percentofthepeoplewithincome above 200 percent of their poverty threshold (Figure 7).
Table 5.People With Income Below Specified Ratios of Their Poverty Thresholds by Selected Characteristics: 2012(Numbers in thousands, confidence intervals [C.I.] in thousands or percentage points as appropriate. People as of March of the following year. For information on confidentiality protection, sampling error, nonsampling error, and definitions, see www.census.gov/prod/techdoc/cps/cpsmar13.pdf)
Characteristic
Total
Income-to-poverty ratio1
Under 0 .50 Under 1 .25 Under 1 .50 Under 2 .00
Number
90 per-cent C .I .2
(±)Per-cent
90 per-cent C .I .2
(±) Number
90 per-cent C .I .2
(±)Per-cent
90 per-cent C .I .2
(±) Number
90 per-cent C .I .2
(±)Per-cent
90 per-cent C .I .2
(±) Number
90 per-cent C .I .2
(±)Per-cent
90 per-cent C .I .2
(±)
All people . . . . . . . . . . . . . . . 310,648 20,400 574 6 .6 0 .2 61,202 1,004 19 .7 0 .3 76,495 1,076 24 .6 0 .3 106,376 1,226 34 .2 0 .4
AgeUnder age 18 . . . . . . . . . . . . . . . . . . . . 73,719 7,143 310 9 .7 0 .4 20,307 480 27 .5 0 .6 24,575 466 33 .3 0 .6 32,269 475 43 .8 0 .6Aged 18 to 64 . . . . . . . . . . . . . . . . . . . 193,642 12,082 346 6 .2 0 .2 34,588 598 17 .9 0 .3 42,885 672 22 .1 0 .3 59,511 792 30 .7 0 .4Aged 65 and older . . . . . . . . . . . . . . . . 43,287 1,175 94 2 .7 0 .2 6,306 235 14 .6 0 .5 9,036 275 20 .9 0 .6 14,595 333 33 .7 0 .8
SexMale . . . . . . . . . . . . . . . . . . . . . . . . . . . 152,058 9,010 309 5 .9 0 .2 27,331 510 18 .0 0 .3 34,504 567 22 .7 0 .4 48,844 652 32 .1 0 .4Female . . . . . . . . . . . . . . . . . . . . . . . . . 158,590 11,390 343 7 .2 0 .2 33,871 591 21 .4 0 .4 41,991 619 26 .5 0 .4 57,532 702 36 .3 0 .4
Race3 and Hispanic OriginWhite . . . . . . . . . . . . . . . . . . . . . . . . . . 242,147 13,058 438 5 .4 0 .2 41,704 792 17 .2 0 .3 53,147 868 21 .9 0 .4 76,088 1,001 31 .4 0 .4 White, not Hispanic . . . . . . . . . . . . . 195,112 8,435 363 4 .3 0 .2 26,071 644 13 .4 0 .3 33,745 733 17 .3 0 .4 50,445 857 25 .9 0 .4Black . . . . . . . . . . . . . . . . . . . . . . . . . . 40,125 5,082 327 12 .7 0 .8 13,486 448 33 .6 1 .1 15,904 462 39 .6 1 .2 20,243 467 50 .5 1 .2Asian . . . . . . . . . . . . . . . . . . . . . . . . . . 16,417 941 110 5 .7 0 .7 2,478 217 15 .1 1 .3 3,160 260 19 .2 1 .5 4,532 291 27 .6 1 .6Hispanic (any race) . . . . . . . . . . . . . . . 53,105 5,366 263 10 .1 0 .5 17,756 485 33 .4 0 .9 21,999 480 41 .4 0 .9 29,019 493 54 .6 0 .9
Family StatusIn families . . . . . . . . . . . . . . . . . . . . . . 252,863 13,677 523 5 .4 0 .2 44,110 945 17 .4 0 .4 55,625 1,019 22 .0 0 .4 78,808 1,118 31 .2 0 .5 Householder . . . . . . . . . . . . . . . . . . . 80,944 4,004 149 4 .9 0 .2 12,669 266 15 .7 0 .3 16,120 296 19 .9 0 .4 23,235 341 28 .7 0 .4 Related children under age 18 . . . . . 72,545 6,725 307 9 .3 0 .4 19,622 465 27 .0 0 .6 23,795 451 32 .8 0 .6 31,382 468 43 .3 0 .6 Related children under age 6 . . . 23,604 2,739 162 11 .6 0 .7 7,160 227 30 .3 1 .0 8,502 218 36 .0 0 .9 11,014 219 46 .7 0 .9In unrelated subfamilies . . . . . . . . . . . . 1,599 436 75 27 .3 4 .2 829 104 51 .9 5 .0 981 105 61 .4 4 .4 1,160 121 72 .6 3 .9Unrelated individuals . . . . . . . . . . . . . . 56,185 6,287 229 11 .2 0 .4 16,263 402 28 .9 0 .6 19,889 450 35 .4 0 .6 26,408 502 47 .0 0 .6
1 The estimates for people with income below 100 percent of their poverty thresholds (under 1 .00) can be found in Table 3 .2 A 90 percent confidence interval is a measure of an estimate’s variability . The larger the confidence interval in relation to the size of the estimate, the less reliable the estimate . Confidence intervals
shown in this table are based on standard errors calculated using replicate weights . For more information see “Standard Errors and Their Use” at <www .census .gov/hhes/www/p60_245sa .pdf> .3 Federal surveys give respondents the option of reporting more than one race . Therefore, two basic ways of defining a race group are possible . A group such as Asian may be defined as those who
reported Asian and no other race (the race-alone or single-race concept) or as those who reported Asian regardless of whether they also reported another race (the race-alone-or-in-combination concept) . This table shows data using the first approach (race alone) . The use of the single-race population does not imply that it is the preferred method of presenting or analyzing data . The Census Bureau uses a variety of approaches . Information on people who reported more than one race, such as White and American Indian and Alaska Native or Asian and Black or African American, is available from Census 2010 through American FactFinder . About 2 .9 percent of people reported more than one race in Census 2010 . Data for American Indians and Alaska Natives, Native Hawaiian and Other Pacific Islanders, and those reporting two or more races are not shown separately .
Note: Details may not sum to totals because of rounding .Source: U .S . Census Bureau, Current Population Survey, 2013 Annual Social and Economic Supplement .
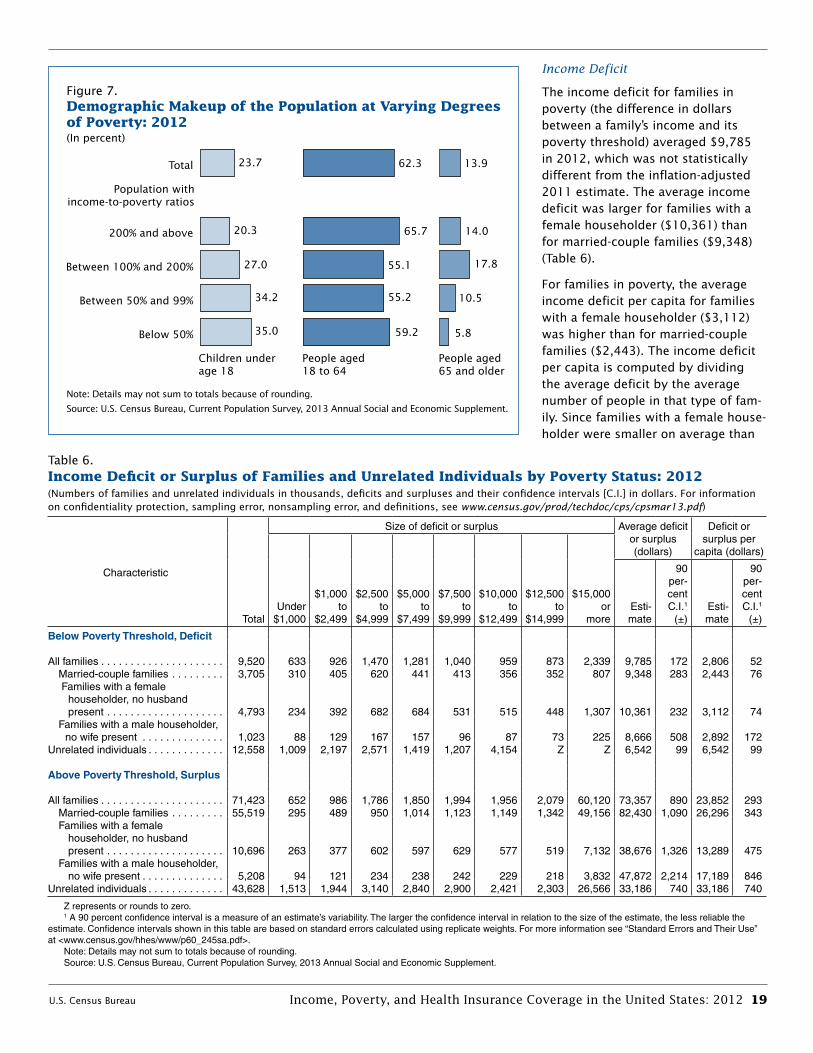
U.S. Census Bureau Income, Poverty, and Health Insurance Coverage in the United States: 2012 19
Income Deficit
The income deficit for families in poverty (the difference in dollars between a family’s income and its poverty threshold) averaged $9,785 in 2012, which was not statistically different from the inflation-adjusted 2011 estimate. The average income deficit was larger for families with a female householder ($10,361) than for married-couple families ($9,348) (Table 6).
For families in poverty, the average income deficit per capita for families with a female householder ($3,112) was higher than for married-couple families ($2,443). The income deficit per capita is computed by dividing the average deficit by the average number of people in that type of fam-ily. Since families with a female house-holder were smaller on average than
Figure 7.Demographic Makeup of the Population at Varying Degrees of Poverty: 2012
Below 50%
Between 50% and 99%
Between 100% and 200%
200% and above
Population with income-to-poverty ratios
Total
Children underage 18
(In percent)
23.7 62.3 13.9
65.7 14.0
17.8
10.5
5.8
55.1
55.2
59.2
20.3
27.0
34.2
35.0
People aged 18 to 64
People aged 65 and older
Note: Details may not sum to totals because of rounding.
Source: U.S. Census Bureau, Current Population Survey, 2013 Annual Social and Economic Supplement.
Table 6.Income Deficit or Surplus of Families and Unrelated Individuals by Poverty Status: 2012(Numbers of families and unrelated individuals in thousands, deficits and surpluses and their confidence intervals [C.I.] in dollars. For information on confidentiality protection, sampling error, nonsampling error, and definitions, see www.census.gov/prod/techdoc/cps/cpsmar13.pdf)
Characteristic
Total
Size of deficit or surplus Average deficit or surplus (dollars)
Deficit or surplus per
capita (dollars)
Under$1,000
$1,000 to
$2,499
$2,500 to
$4,999
$5,000 to
$7,499
$7,500 to
$9,999
$10,000 to
$12,499
$12,500 to
$14,999
$15,000 or
moreEsti-mate
90 per-cent C .I .1
(±)Esti-mate
90 per-cent C .I .1
(±)
Below Poverty Threshold, Deficit
All families . . . . . . . . . . . . . . . . . . . . . 9,520 633 926 1,470 1,281 1,040 959 873 2,339 9,785 172 2,806 52 Married-couple families . . . . . . . . . 3,705 310 405 620 441 413 356 352 807 9,348 283 2,443 76 Families with a female
householder, no husband present . . . . . . . . . . . . . . . . . . . . 4,793 234 392 682 684 531 515 448 1,307 10,361 232 3,112 74
Families with a male householder, no wife present . . . . . . . . . . . . . . 1,023 88 129 167 157 96 87 73 225 8,666 508 2,892 172
Unrelated individuals . . . . . . . . . . . . . 12,558 1,009 2,197 2,571 1,419 1,207 4,154 Z Z 6,542 99 6,542 99
Above Poverty Threshold, Surplus
All families . . . . . . . . . . . . . . . . . . . . . 71,423 652 986 1,786 1,850 1,994 1,956 2,079 60,120 73,357 890 23,852 293 Married-couple families . . . . . . . . . 55,519 295 489 950 1,014 1,123 1,149 1,342 49,156 82,430 1,090 26,296 343 Families with a female
householder, no husband present . . . . . . . . . . . . . . . . . . . . 10,696 263 377 602 597 629 577 519 7,132 38,676 1,326 13,289 475
Families with a male householder, no wife present . . . . . . . . . . . . . . 5,208 94 121 234 238 242 229 218 3,832 47,872 2,214 17,189 846
Unrelated individuals . . . . . . . . . . . . . 43,628 1,513 1,944 3,140 2,840 2,900 2,421 2,303 26,566 33,186 740 33,186 740
Z represents or rounds to zero .1 A 90 percent confidence interval is a measure of an estimate’s variability . The larger the confidence interval in relation to the size of the estimate, the less reliable the
estimate . Confidence intervals shown in this table are based on standard errors calculated using replicate weights . For more information see “Standard Errors and Their Use” at <www .census .gov/hhes/www/p60_245sa .pdf> .
Note: Details may not sum to totals because of rounding .Source: U .S . Census Bureau, Current Population Survey, 2013 Annual Social and Economic Supplement .

20 Income, Poverty, and Health Insurance Coverage in the United States: 2012 U.S. Census Bureau
married-couple families, the larger per capita deficit for female householder families reflects their smaller average family size as well as their lower aver-age family income.
For unrelated individuals, the average income deficit for those in poverty was $6,542 in 2012. The $6,279 deficit for women was lower than the $6,873 deficit for men.
Shared Households23
While poverty estimates are based on income in the previous calendar year, estimates of shared households reflect household composition at the time of the survey, which is conducted dur-ing the months of February, March, and April of each year. In 2013, the number and percentage of shared households was higher than in 2007, prior to the recession. In 2007, there were 19.7 million shared households, representing 17.0 percent of all households; by 2013, there were 23.2 million shared households, represent-ing 19.0 percent of all households. The number of adults in shared households grew from 61.7 million (27.7 percent) in 2007 to 71.5 million (30.2 percent) in 2013.
Between 2012 and 2013, the number and percentage of shared households increased by an estimated 889,000
23 Shared households are defined as house-holds that include at least one “additional” adult, a person aged 18 years or older who is not the householder, spouse, or cohabiting partner of the householder. Adults aged 18 to 24 years who are enrolled in school are not counted as additional adults.
households (0.5 percentage points).24 However, change in the number and percentage of additional adults resid-ing in shared households between 2012 and 2013 was not statistically significant. Indeed, there has been no change in the number or proportion of additional adults living in shared households since 2010.
In 2013, an estimated 10.1 million adults aged 25 to 34 (24.1 percent) were additional adults in someone else’s household. Of these young adults, 5.8 million (13.9 percent) lived with their parents. The change between 2012 and 2013 in the number and percentage of additional adults in this age group living in their parents’ household was not statisti-cally significant.25 Further, there has been no change since 2011 in the number and percent of adults aged 25 to 34 living with their parents.
It is difficult to assess the precise impact of household sharing on over-all poverty rates. In 2012, adults aged 25 to 34 living with their parents had an official poverty rate of 9.7 percent (when the entire family’s income is compared with the threshold that includes the young adult as a member of the family). However, if poverty status were determined using only the additional adult’s own income,
24 There was no change in the number of shared households between 2010 and 2012.
25 There was no change in the number or proportion of additional adults aged 18 to 24 years, 35 to 64 years, or 65 years and older residing in someone else’s household between 2012 and 2013.
43.3 percent of those aged 25 to 34 would have been below the poverty threshold for a single person under age 65.
Alternative/Experimental Poverty Measures
The poverty estimates in this report compare the official poverty thresh-olds to money income before taxes, not including the value of noncash benefits. The money income mea-sure does not completely capture the economic well-being of individu-als and families, and there are many questions about the adequacy of the official poverty thresholds. Families and individuals also derive economic well-being from noncash benefits, such as food and housing subsidies, and their disposable income is deter-mined by both taxes paid and tax credits received. The official poverty thresholds developed more than 40 years ago do not take into account ris-ing standards of living or such things as childcare expenses, other work-related expenses, variations in medi-cal costs across population groups, or geographic differences in the cost of living. Poverty estimates using the Supplemental Poverty Measure (SPM) address many of these concerns. SPM estimates for 2011 were published in November 2012 (www.census.gov /hhes/povmeas/methodology /supplemental/research/Short _ResearchSPM2011.pdf). SPM esti-mates for 2012 will be released in fall 2013. For more details, see the text box “Supplemental Poverty Measure” on page 2.

U.S. Census Bureau Income, Poverty, and Health Insurance Coverage in the United States: 2012 21
National Academy of Sciences (NAS)-Based Measures
The Census Bureau currently com-putes alternative poverty measures based on the 1995 recommenda-tions of the National Academy of Sciences Panel on Poverty and Family Assistance. The NAS-based measures, which use both alternative poverty thresholds and an expanded income definition, provide a consistent time series available from 1999 to the present (www.census.gov/prod /2001pubs/p60-216.pdf).26 The Census Bureau will release estimates for these alternative measures for 2012 in fall 2013. Estimates for 2011 for the NAS-based measures can be found at <www.census.gov/hhes /www/povmeas/tables.html>.
Research Files
The Census Bureau makes available microdata research files that provide the variables used to construct SPM estimates and NAS-based alternative measures at <www.census.gov/hhes /povmeas/data/public-use.html>. An expanded version of the CPS ASEC public use file includes estimates of the value of taxes and noncash
26 However, many of the elements of these measures are no longer being updated.
benefits at <http://thedataweb.rm.census.gov/ftp/cps_ftp.html>. Microdata files are currently avail-able for 2011. Data for 2012 will be released later this year.
CPS Table Creator
CPS Table Creator is a Web-based tool designed to help researchers explore alternative income and poverty mea-sures. The tool is available from a link on the Census Bureau’s poverty Web site at <www.census.gov/cps/data /cpstablecreator.html>. Table Creator allows researchers to produce pov-erty and income estimates using their own combinations of threshold and resource definitions and to see the incremental impact of the addition or subtraction of a single resource element. For example:
• In2012,thenumberofpeopleaged 65 and older in poverty would be higher by almost 15.3 million if social secu-rity payments were excluded from money income, close to quadrupling the number of elderly people in poverty.
• Ifunemploymentinsuranceben-efits were excluded from money income, 1.7 million more people would be counted as in poverty in 2012.
• IfSNAPbenefitswerecountedasincome, 4 million fewer people would be categorized as in poverty in 2012.
• Takingaccountofthevalueofthe federal earned income tax credit would reduce the number of children classified as in pov-erty in 2011 by 3.1 million.27
Researchers can also estimate pov-erty rates using alternative poverty thresholds. Many other countries use relative poverty measures with thresh-olds that are based on a percentage of median or mean income.28 The Table Creator allows researchers to estimate poverty rates using a relative poverty threshold calculated as any percent-age of mean or median equivalence- adjusted income. For example, using poverty thresholds based on 50 percent of median income rather than the official poverty thresholds would increase the overall poverty rate from 15.0 percent to 22.5 per-cent in 2011.
27 At this time, Table Creator can calculate these estimates for 2011. Data for 2012 from the 2013 CPS ASEC will be added to the Table Creator later this year when the enhanced CPS ASEC file with estimates of noncash benefits, tax credits, and tax liabilities is released to the public.
28 For example, the Organization for Economic Cooperation and Development (OECD) uses a poverty threshold of 50 percent of median income. The European Union defines poverty as an income below 60 percent of the national median equalized disposable income after social transfers.
22 Income, Poverty, and Health Insurance Coverage in the United States: 2012 U.S. Census Bureau
HEALTH INSURANCE CoVERAGE IN THE UNITED STATES
Highlights
• In2012,thepercentageofpeople without health insur-ance decreased to 15.4 percent from 15.7 percent in 2011. The number of uninsured people in 2012 was not statistically differ-ent from 2011, at 48.0 million (Table 7 and Figure 8).29
29 For a brief description of how the Census Bureau collects and reports on health insurance data, see the text box “What Is Health Insurance Coverage?” For a discussion of the quality of ASEC health insurance coverage estimates, see Appendix C.
• Boththepercentageandnumberof people with health insurance increased in 2012 to 84.6 per-cent and 263.2 million, up from 84.3 percent and 260.2 million in 2011 (Table C-1).
• Thepercentageofpeoplecov-ered by private health insurance in 2012 was not statistically different from 2011, at 63.9 percent. This is the second con-secutive year that the percent-age of people covered by private health insurance was not statisti-cally different from the previous
year’s estimate. The number of people covered by private health insurance increased in 2012 to 198.8 million, up from 197.3 million in 2011 (Tables 8 and C-1).
• Thepercentageandnumberofpeople covered by government health insurance increased to 32.6 percent and 101.5 million in 2012 from 32.2 percent and 99.5 million in 2011 (Tables 8 and C-1).
What Is Health Insurance Coverage?
The Current Population Survey Annual Social and Economic Supplement (CPS ASEC) asks about health insurance coverage in the previous calendar year. Specifically, the survey asks separate questions about the major types of health insurance. People who answer “no” to each of the coverage questions are then asked to verify that they were, in fact, not covered by any type of health insurance. For reporting purposes, the Census Bureau broadly classifies health insurance coverage as private coverage or government coverage. The CPS ASEC classifies private health insurance as a plan provided through an employer or a union or purchased by an individual from a private company. Government health insurance includes such federal programs as Medicare, Medicaid, and military health care; the Children’s Health Insurance Program (CHIP); and individual state health plans.*
The American Community Survey (ACS) classification dif-fers slightly. Private health insurance includes plans pro-vided through an employer or union, plans purchased by an individual from a private company, and TRICARE or other military health coverage plans. Government health insurance includes such programs as Medicare and Medicaid, CHIP, individual state health plans, and VA Health Care.
In the CPS ASEC, people were considered “insured” if they were covered by any type of health insurance for part or all of the previous calendar year. They were con-sidered “uninsured” if, for the entire year, they were not covered by any type of health insurance.
Research shows health insurance coverage is under-reported in the CPS ASEC for a variety of reasons. Annual retrospective questions appear to cause few problems when collecting income data (possibly because the inter-view period is close to when people pay their taxes). However, because health insurance coverage status can change over the course of a year, answering questions about this long reference period may lead to response errors. For example, some people may report their insurance coverage status at the time of their interview rather than their coverage status during the previous calendar year. Compared with other national surveys, the CPS ASEC’s estimate of the number of people without health insurance more closely approximates the number of people who were uninsured at a specific point in time during the year than the number of people uninsured for the entire year. There are several ongoing projects aimed at improving the quality of health coverage data from the CPS ASEC, including cognitive research and field testing to improve the wording of the CPS ASEC health coverage questions.
For more information on the quality of CPS ASEC health insurance estimates, see Appendix C, “Estimates of Health Insurance Coverage.” For a comparison between health insurance coverage rates from the major fed-eral surveys, see Changes to the Imputation Routine for Health Insurance in the CPS ASEC: Description and Evaluation at <www.census.gov/hhes/www/hlthins /data/revhlth/SHADAC.pdf>.
*Types of insurance are not mutually exclusive; people may be cov-ered by more than one during the year.
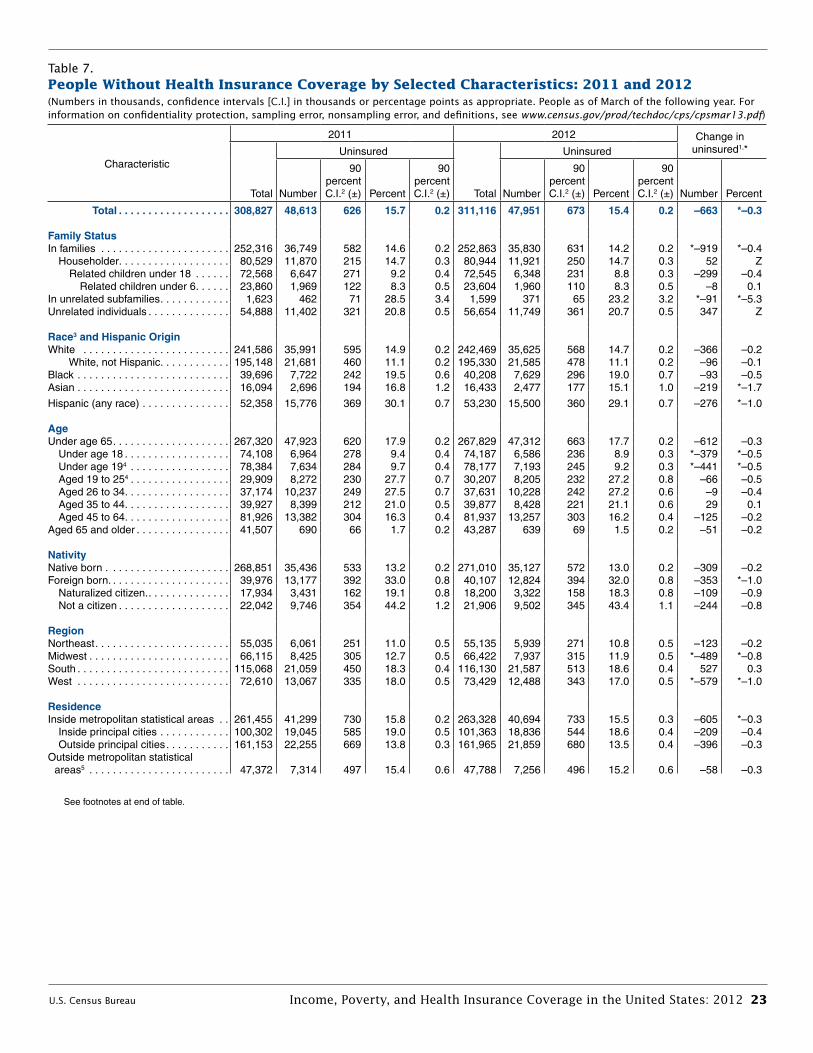
U.S. Census Bureau Income, Poverty, and Health Insurance Coverage in the United States: 2012 23
Table 7. People Without Health Insurance Coverage by Selected Characteristics: 2011 and 2012—Con .(Numbers in thousands, confidence intervals [C.I.] in thousands or percentage points as appropriate. People as of March of the following year. For information on confidentiality protection, sampling error, nonsampling error, and definitions, see www.census.gov/prod/techdoc/cps/cpsmar13.pdf)
Characteristic
2011 2012 Change in uninsured1,*
Total
Uninsured
Total
Uninsured
Number
90percent
C .I .2 (±) Percent
90percent
C .I .2 (±) Number
90percent
C .I .2 (±) Percent
90percent
C .I .2 (±) Number Percent
Total . . . . . . . . . . . . . . . . . . . 308,827 48,613 626 15 .7 0 .2 311,116 47,951 673 15 .4 0 .2 –663 *–0 .3
Family StatusIn families . . . . . . . . . . . . . . . . . . . . . . 252,316 36,749 582 14 .6 0 .2 252,863 35,830 631 14 .2 0 .2 *–919 *–0 .4 Householder . . . . . . . . . . . . . . . . . . . 80,529 11,870 215 14 .7 0 .3 80,944 11,921 250 14 .7 0 .3 52 Z Related children under 18 . . . . . . 72,568 6,647 271 9 .2 0 .4 72,545 6,348 231 8 .8 0 .3 –299 –0 .4 Related children under 6 . . . . . . 23,860 1,969 122 8 .3 0 .5 23,604 1,960 110 8 .3 0 .5 –8 0 .1In unrelated subfamilies . . . . . . . . . . . . 1,623 462 71 28 .5 3 .4 1,599 371 65 23 .2 3 .2 *–91 *–5 .3Unrelated individuals . . . . . . . . . . . . . . 54,888 11,402 321 20 .8 0 .5 56,654 11,749 361 20 .7 0 .5 347 Z
Race3 and Hispanic OriginWhite . . . . . . . . . . . . . . . . . . . . . . . . . 241,586 35,991 595 14 .9 0 .2 242,469 35,625 568 14 .7 0 .2 –366 –0 .2 White, not Hispanic . . . . . . . . . . . . 195,148 21,681 460 11 .1 0 .2 195,330 21,585 478 11 .1 0 .2 –96 –0 .1Black . . . . . . . . . . . . . . . . . . . . . . . . . . 39,696 7,722 242 19 .5 0 .6 40,208 7,629 296 19 .0 0 .7 –93 –0 .5Asian . . . . . . . . . . . . . . . . . . . . . . . . . . 16,094 2,696 194 16 .8 1 .2 16,433 2,477 177 15 .1 1 .0 –219 *–1 .7
Hispanic (any race) . . . . . . . . . . . . . . . 52,358 15,776 369 30 .1 0 .7 53,230 15,500 360 29 .1 0 .7 –276 *–1 .0
AgeUnder age 65 . . . . . . . . . . . . . . . . . . . . 267,320 47,923 620 17 .9 0 .2 267,829 47,312 663 17 .7 0 .2 –612 –0 .3 Under age 18 . . . . . . . . . . . . . . . . . . 74,108 6,964 278 9 .4 0 .4 74,187 6,586 236 8 .9 0 .3 *–379 *–0 .5 Under age 194 . . . . . . . . . . . . . . . . . 78,384 7,634 284 9 .7 0 .4 78,177 7,193 245 9 .2 0 .3 *–441 *–0 .5 Aged 19 to 254 . . . . . . . . . . . . . . . . . 29,909 8,272 230 27 .7 0 .7 30,207 8,205 232 27 .2 0 .8 –66 –0 .5 Aged 26 to 34 . . . . . . . . . . . . . . . . . . 37,174 10,237 249 27 .5 0 .7 37,631 10,228 242 27 .2 0 .6 –9 –0 .4 Aged 35 to 44 . . . . . . . . . . . . . . . . . . 39,927 8,399 212 21 .0 0 .5 39,877 8,428 221 21 .1 0 .6 29 0 .1 Aged 45 to 64 . . . . . . . . . . . . . . . . . . 81,926 13,382 304 16 .3 0 .4 81,937 13,257 303 16 .2 0 .4 –125 –0 .2Aged 65 and older . . . . . . . . . . . . . . . . 41,507 690 66 1 .7 0 .2 43,287 639 69 1 .5 0 .2 –51 –0 .2
NativityNative born . . . . . . . . . . . . . . . . . . . . . 268,851 35,436 533 13 .2 0 .2 271,010 35,127 572 13 .0 0 .2 –309 –0 .2Foreign born . . . . . . . . . . . . . . . . . . . . . 39,976 13,177 392 33 .0 0 .8 40,107 12,824 394 32 .0 0 .8 –353 *–1 .0 Naturalized citizen . . . . . . . . . . . . . . . 17,934 3,431 162 19 .1 0 .8 18,200 3,322 158 18 .3 0 .8 –109 –0 .9 Not a citizen . . . . . . . . . . . . . . . . . . . 22,042 9,746 354 44 .2 1 .2 21,906 9,502 345 43 .4 1 .1 –244 –0 .8
RegionNortheast . . . . . . . . . . . . . . . . . . . . . . . 55,035 6,061 251 11 .0 0 .5 55,135 5,939 271 10 .8 0 .5 –123 –0 .2Midwest . . . . . . . . . . . . . . . . . . . . . . . . 66,115 8,425 305 12 .7 0 .5 66,422 7,937 315 11 .9 0 .5 *–489 *–0 .8South . . . . . . . . . . . . . . . . . . . . . . . . . . 115,068 21,059 450 18 .3 0 .4 116,130 21,587 513 18 .6 0 .4 527 0 .3West . . . . . . . . . . . . . . . . . . . . . . . . . . 72,610 13,067 335 18 .0 0 .5 73,429 12,488 343 17 .0 0 .5 *–579 *–1 .0
ResidenceInside metropolitan statistical areas . . 261,455 41,299 730 15 .8 0 .2 263,328 40,694 733 15 .5 0 .3 –605 *–0 .3 Inside principal cities . . . . . . . . . . . . 100,302 19,045 585 19 .0 0 .5 101,363 18,836 544 18 .6 0 .4 –209 –0 .4 Outside principal cities . . . . . . . . . . . 161,153 22,255 669 13 .8 0 .3 161,965 21,859 680 13 .5 0 .4 –396 –0 .3Outside metropolitan statistical
areas5 . . . . . . . . . . . . . . . . . . . . . . . . 47,372 7,314 497 15 .4 0 .6 47,788 7,256 496 15 .2 0 .6 –58 –0 .3
See footnotes at end of table .
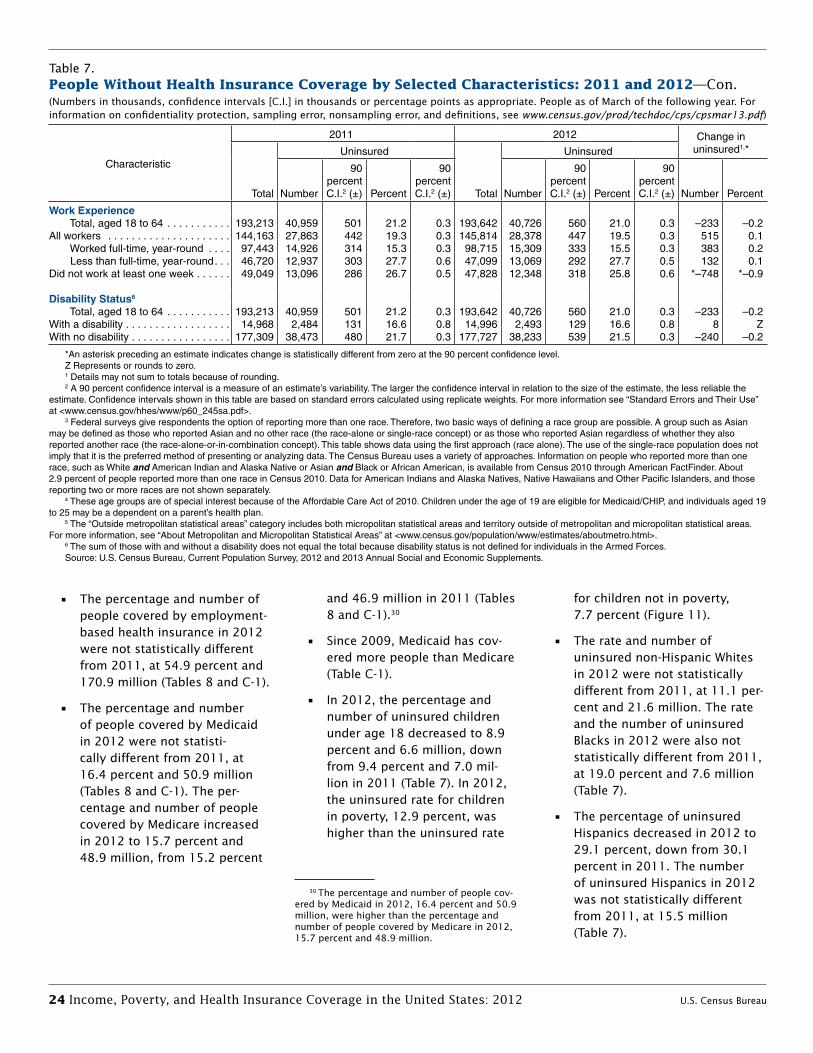
24 Income, Poverty, and Health Insurance Coverage in the United States: 2012 U.S. Census Bureau
• Thepercentageandnumberofpeople covered by employment-based health insurance in 2012 were not statistically different from 2011, at 54.9 percent and 170.9 million (Tables 8 and C-1).
• Thepercentageandnumberof people covered by Medicaid in 2012 were not statisti-cally different from 2011, at 16.4 percent and 50.9 million (Tables 8 and C-1). The per-centage and number of people covered by Medicare increased in 2012 to 15.7 percent and 48.9 million, from 15.2 percent
and 46.9 million in 2011 (Tables 8 and C-1).30
• Since2009,Medicaidhascov-ered more people than Medicare (Table C-1).
• In2012,thepercentageandnumber of uninsured children under age 18 decreased to 8.9 percent and 6.6 million, down from 9.4 percent and 7.0 mil-lion in 2011 (Table 7). In 2012, the uninsured rate for children in poverty, 12.9 percent, was higher than the uninsured rate
30 The percentage and number of people cov-ered by Medicaid in 2012, 16.4 percent and 50.9 million, were higher than the percentage and number of people covered by Medicare in 2012, 15.7 percent and 48.9 million.
for children not in poverty, 7.7 percent (Figure 11).
• Therateandnumberof uninsured non-Hispanic Whites in 2012 were not statistically different from 2011, at 11.1 per-cent and 21.6 million. The rate and the number of uninsured Blacks in 2012 were also not statistically different from 2011, at 19.0 percent and 7.6 million (Table 7).
• ThepercentageofuninsuredHispanics decreased in 2012 to 29.1 percent, down from 30.1 percent in 2011. The number of uninsured Hispanics in 2012 was not statistically different from 2011, at 15.5 million (Table 7).
Table 7. People Without Health Insurance Coverage by Selected Characteristics: 2011 and 2012—Con .(Numbers in thousands, confidence intervals [C.I.] in thousands or percentage points as appropriate. People as of March of the following year. For information on confidentiality protection, sampling error, nonsampling error, and definitions, see www.census.gov/prod/techdoc/cps/cpsmar13.pdf)
Characteristic
2011 2012 Change in uninsured1,*
Total
Uninsured
Total
Uninsured
Number
90percent
C .I .2 (±) Percent
90percent
C .I .2 (±) Number
90percent
C .I .2 (±) Percent
90percent
C .I .2 (±) Number Percent
Work Experience Total, aged 18 to 64 . . . . . . . . . . . 193,213 40,959 501 21 .2 0 .3 193,642 40,726 560 21 .0 0 .3 –233 –0 .2All workers . . . . . . . . . . . . . . . . . . . . . 144,163 27,863 442 19 .3 0 .3 145,814 28,378 447 19 .5 0 .3 515 0 .1 Worked full-time, year-round . . . . 97,443 14,926 314 15 .3 0 .3 98,715 15,309 333 15 .5 0 .3 383 0 .2 Less than full-time, year-round . . . 46,720 12,937 303 27 .7 0 .6 47,099 13,069 292 27 .7 0 .5 132 0 .1Did not work at least one week . . . . . . 49,049 13,096 286 26 .7 0 .5 47,828 12,348 318 25 .8 0 .6 *–748 *–0 .9
Disability Status6
Total, aged 18 to 64 . . . . . . . . . . . 193,213 40,959 501 21 .2 0 .3 193,642 40,726 560 21 .0 0 .3 –233 –0 .2With a disability . . . . . . . . . . . . . . . . . . 14,968 2,484 131 16 .6 0 .8 14,996 2,493 129 16 .6 0 .8 8 ZWith no disability . . . . . . . . . . . . . . . . . 177,309 38,473 480 21 .7 0 .3 177,727 38,233 539 21 .5 0 .3 –240 –0 .2
*An asterisk preceding an estimate indicates change is statistically different from zero at the 90 percent confidence level . Z Represents or rounds to zero .1 Details may not sum to totals because of rounding . 2 A 90 percent confidence interval is a measure of an estimate’s variability . The larger the confidence interval in relation to the size of the estimate, the less reliable the
estimate . Confidence intervals shown in this table are based on standard errors calculated using replicate weights . For more information see “Standard Errors and Their Use” at <www .census .gov/hhes/www/p60_245sa .pdf> .
3 Federal surveys give respondents the option of reporting more than one race . Therefore, two basic ways of defining a race group are possible . A group such as Asian may be defined as those who reported Asian and no other race (the race-alone or single-race concept) or as those who reported Asian regardless of whether they also reported another race (the race-alone-or-in-combination concept) . This table shows data using the first approach (race alone) . The use of the single-race population does not imply that it is the preferred method of presenting or analyzing data . The Census Bureau uses a variety of approaches . Information on people who reported more than one race, such as White and American Indian and Alaska Native or Asian and Black or African American, is available from Census 2010 through American FactFinder . About 2 .9 percent of people reported more than one race in Census 2010 . Data for American Indians and Alaska Natives, Native Hawaiians and Other Pacific Islanders, and those reporting two or more races are not shown separately .
4 These age groups are of special interest because of the Affordable Care Act of 2010 . Children under the age of 19 are eligible for Medicaid/CHIP, and individuals aged 19 to 25 may be a dependent on a parent’s health plan .
5 The “Outside metropolitan statistical areas” category includes both micropolitan statistical areas and territory outside of metropolitan and micropolitan statistical areas . For more information, see “About Metropolitan and Micropolitan Statistical Areas” at <www .census .gov/population/www/estimates/aboutmetro .html> .
6 The sum of those with and without a disability does not equal the total because disability status is not defined for individuals in the Armed Forces . Source: U .S . Census Bureau, Current Population Survey, 2012 and 2013 Annual Social and Economic Supplements .
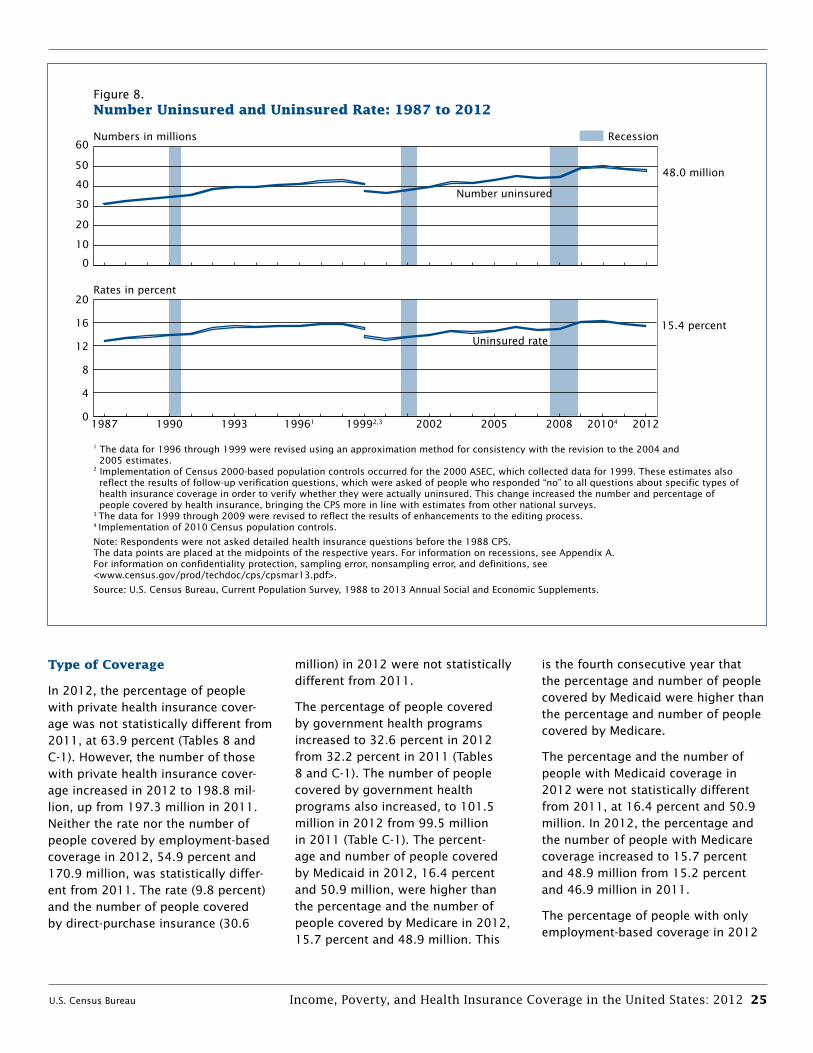
U.S. Census Bureau Income, Poverty, and Health Insurance Coverage in the United States: 2012 25
Type of Coverage
In 2012, the percentage of people with private health insurance cover-age was not statistically different from 2011, at 63.9 percent (Tables 8 and C-1). However, the number of those with private health insurance cover-age increased in 2012 to 198.8 mil-lion, up from 197.3 million in 2011. Neither the rate nor the number of people covered by employment-based coverage in 2012, 54.9 percent and 170.9 million, was statistically differ-ent from 2011. The rate (9.8 percent) and the number of people covered by direct-purchase insurance (30.6
million) in 2012 were not statistically different from 2011.
The percentage of people covered by government health programs increased to 32.6 percent in 2012 from 32.2 percent in 2011 (Tables 8 and C-1). The number of people covered by government health programs also increased, to 101.5 million in 2012 from 99.5 million in 2011 (Table C-1). The percent-age and number of people covered by Medicaid in 2012, 16.4 percent and 50.9 million, were higher than the percentage and the number of people covered by Medicare in 2012, 15.7 percent and 48.9 million. This
is the fourth consecutive year that the percentage and number of people covered by Medicaid were higher than the percentage and number of people covered by Medicare.
The percentage and the number of people with Medicaid coverage in 2012 were not statistically different from 2011, at 16.4 percent and 50.9 million. In 2012, the percentage and the number of people with Medicare coverage increased to 15.7 percent and 48.9 million from 15.2 percent and 46.9 million in 2011.
The percentage of people with only employment-based coverage in 2012
Figure 8.Number Uninsured and Uninsured Rate: 1987 to 2012
1 The data for 1996 through 1999 were revised using an approximation method for consistency with the revision to the 2004 and 2005 estimates. 2 Implementation of Census 2000-based population controls occurred for the 2000 ASEC, which collected data for 1999. These estimates also reflect the results of follow-up verification questions, which were asked of people who responded “no” to all questions about specific types of health insurance coverage in order to verify whether they were actually uninsured. This change increased the number and percentage of people covered by health insurance, bringing the CPS more in line with estimates from other national surveys.3 The data for 1999 through 2009 were revised to reflect the results of enhancements to the editing process.4 Implementation of 2010 Census population controls.
Note: Respondents were not asked detailed health insurance questions before the 1988 CPS. The data points are placed at the midpoints of the respective years. For information on recessions, see Appendix A.For information on confidentiality protection, sampling error, nonsampling error, and definitions, see <www.census.gov/prod/techdoc/cps/cpsmar13.pdf>.
Source: U.S. Census Bureau, Current Population Survey, 1988 to 2013 Annual Social and Economic Supplements.
Numbers in millions
0
10
20
30
40
50
60
48.0 million
15.4 percent
Rates in percent
Number uninsured
Uninsured rate
RecessionNumbers in millions, rates in percent
0
10
20
30
40
50
60
20112010420082005200219991996199319901987
48.6 million
15.7 percent
Number uninsured
Uninsured rate
Recession
0
4
8
12
16
20
20122010420082005200219992,319961199319901987
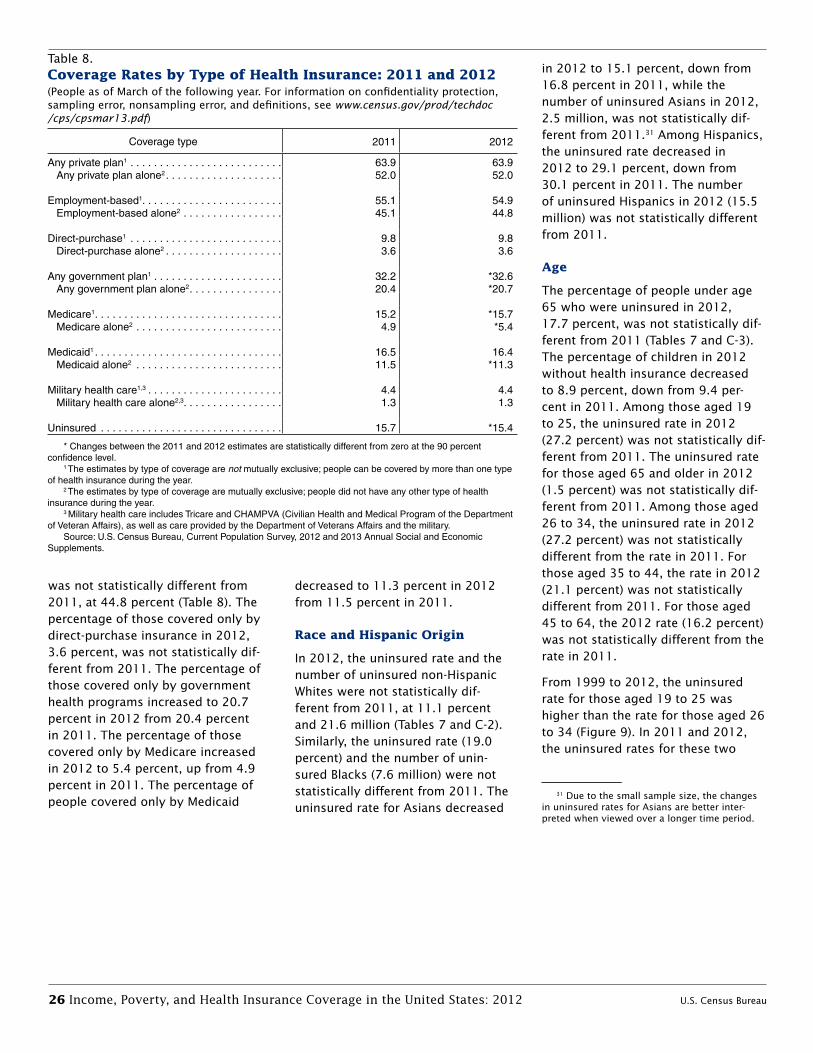
26 Income, Poverty, and Health Insurance Coverage in the United States: 2012 U.S. Census Bureau
was not statistically different from 2011, at 44.8 percent (Table 8). The percentage of those covered only by direct-purchase insurance in 2012, 3.6 percent, was not statistically dif-ferent from 2011. The percentage of those covered only by government health programs increased to 20.7 percent in 2012 from 20.4 percent in 2011. The percentage of those covered only by Medicare increased in 2012 to 5.4 percent, up from 4.9 percent in 2011. The percentage of people covered only by Medicaid
decreased to 11.3 percent in 2012 from 11.5 percent in 2011.
Race and Hispanic Origin
In 2012, the uninsured rate and the number of uninsured non-Hispanic Whites were not statistically dif-ferent from 2011, at 11.1 percent and 21.6 million (Tables 7 and C-2). Similarly, the uninsured rate (19.0 percent) and the number of unin-sured Blacks (7.6 million) were not statistically different from 2011. The uninsured rate for Asians decreased
in 2012 to 15.1 percent, down from 16.8 percent in 2011, while the number of uninsured Asians in 2012, 2.5 million, was not statistically dif-ferent from 2011.31 Among Hispanics, the uninsured rate decreased in 2012 to 29.1 percent, down from 30.1 percent in 2011. The number of uninsured Hispanics in 2012 (15.5 million) was not statistically different from 2011.
Age
The percentage of people under age 65 who were uninsured in 2012, 17.7 percent, was not statistically dif-ferent from 2011 (Tables 7 and C-3). The percentage of children in 2012 without health insurance decreased to 8.9 percent, down from 9.4 per-cent in 2011. Among those aged 19 to 25, the uninsured rate in 2012 (27.2 percent) was not statistically dif-ferent from 2011. The uninsured rate for those aged 65 and older in 2012 (1.5 percent) was not statistically dif-ferent from 2011. Among those aged 26 to 34, the uninsured rate in 2012 (27.2 percent) was not statistically different from the rate in 2011. For those aged 35 to 44, the rate in 2012 (21.1 percent) was not statistically different from 2011. For those aged 45 to 64, the 2012 rate (16.2 percent) was not statistically different from the rate in 2011.
From 1999 to 2012, the uninsured rate for those aged 19 to 25 was higher than the rate for those aged 26 to 34 (Figure 9). In 2011 and 2012, the uninsured rates for these two
31 Due to the small sample size, the changes in uninsured rates for Asians are better inter-preted when viewed over a longer time period.
Table 8. Coverage Rates by Type of Health Insurance: 2011 and 2012(People as of March of the following year. For information on confidentiality protection, sampling error, nonsampling error, and definitions, see www.census.gov/prod/techdoc /cps/cpsmar13.pdf)
Coverage type 2011 2012
Any private plan1 . . . . . . . . . . . . . . . . . . . . . . . . . . 63 .9 63 .9 Any private plan alone2 . . . . . . . . . . . . . . . . . . . . 52 .0 52 .0
Employment-based1 . . . . . . . . . . . . . . . . . . . . . . . . 55 .1 54 .9 Employment-based alone2 . . . . . . . . . . . . . . . . . 45 .1 44 .8
Direct-purchase1 . . . . . . . . . . . . . . . . . . . . . . . . . . 9 .8 9 .8 Direct-purchase alone2 . . . . . . . . . . . . . . . . . . . . 3 .6 3 .6
Any government plan1 . . . . . . . . . . . . . . . . . . . . . . 32 .2 *32 .6 Any government plan alone2 . . . . . . . . . . . . . . . . 20 .4 *20 .7
Medicare1 . . . . . . . . . . . . . . . . . . . . . . . . . . . . . . . . 15 .2 *15 .7 Medicare alone2 . . . . . . . . . . . . . . . . . . . . . . . . . 4 .9 *5 .4
Medicaid1 . . . . . . . . . . . . . . . . . . . . . . . . . . . . . . . . 16 .5 16 .4 Medicaid alone2 . . . . . . . . . . . . . . . . . . . . . . . . . 11 .5 *11 .3
Military health care1,3 . . . . . . . . . . . . . . . . . . . . . . . 4 .4 4 .4 Military health care alone2,3 . . . . . . . . . . . . . . . . . 1 .3 1 .3
Uninsured . . . . . . . . . . . . . . . . . . . . . . . . . . . . . . . 15 .7 *15 .4
* Changes between the 2011 and 2012 estimates are statistically different from zero at the 90 percent confidence level .
1 The estimates by type of coverage are not mutually exclusive; people can be covered by more than one type of health insurance during the year .
2 The estimates by type of coverage are mutually exclusive; people did not have any other type of health insurance during the year .
3 Military health care includes Tricare and CHAMPVA (Civilian Health and Medical Program of the Department of Veteran Affairs), as well as care provided by the Department of Veterans Affairs and the military .
Source: U .S . Census Bureau, Current Population Survey, 2012 and 2013 Annual Social and Economic Supplements .
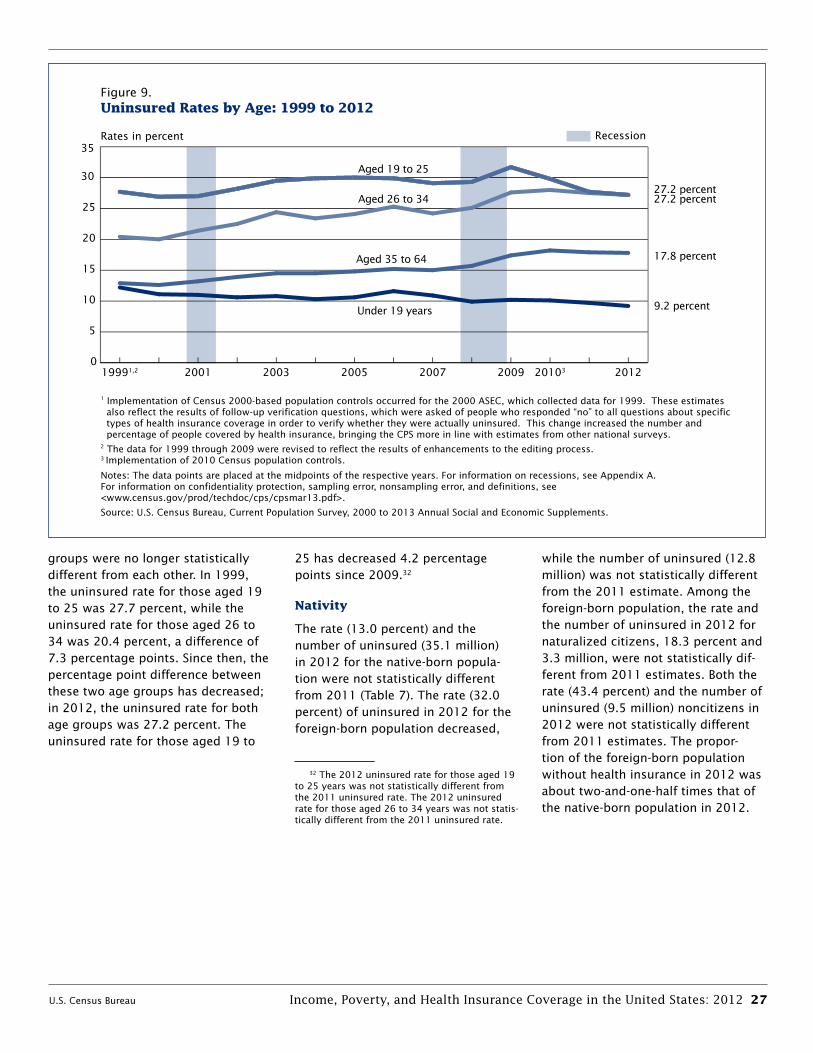
U.S. Census Bureau Income, Poverty, and Health Insurance Coverage in the United States: 2012 27
groups were no longer statistically different from each other. In 1999, the uninsured rate for those aged 19 to 25 was 27.7 percent, while the uninsured rate for those aged 26 to 34 was 20.4 percent, a difference of 7.3 percentage points. Since then, the percentage point difference between these two age groups has decreased; in 2012, the uninsured rate for both age groups was 27.2 percent. The uninsured rate for those aged 19 to
25 has decreased 4.2 percentage points since 2009.32
Nativity
The rate (13.0 percent) and the number of uninsured (35.1 million) in 2012 for the native-born popula-tion were not statistically different from 2011 (Table 7). The rate (32.0 percent) of uninsured in 2012 for the foreign-born population decreased,
32 The 2012 uninsured rate for those aged 19 to 25 years was not statistically different from the 2011 uninsured rate. The 2012 uninsured rate for those aged 26 to 34 years was not statis-tically different from the 2011 uninsured rate.
while the number of uninsured (12.8 million) was not statistically different from the 2011 estimate. Among the foreign-born population, the rate and the number of uninsured in 2012 for naturalized citizens, 18.3 percent and 3.3 million, were not statistically dif-ferent from 2011 estimates. Both the rate (43.4 percent) and the number of uninsured (9.5 million) noncitizens in 2012 were not statistically different from 2011 estimates. The propor-tion of the foreign-born population without health insurance in 2012 was about two-and-one-half times that of the native-born population in 2012.
Figure 9.Uninsured Rates by Age: 1999 to 2012
Rates in percent Recession
Aged 19 to 25
Aged 35 to 64
Under 19 years
Aged 26 to 3427.2 percent27.2 percent
17.8 percent
9.2 percent
1 Implementation of Census 2000-based population controls occurred for the 2000 ASEC, which collected data for 1999. These estimates also reflect the results of follow-up verification questions, which were asked of people who responded “no” to all questions about specific types of health insurance coverage in order to verify whether they were actually uninsured. This change increased the number and percentage of people covered by health insurance, bringing the CPS more in line with estimates from other national surveys.2 The data for 1999 through 2009 were revised to reflect the results of enhancements to the editing process.3 Implementation of 2010 Census population controls.
Notes: The data points are placed at the midpoints of the respective years. For information on recessions, see Appendix A.For information on confidentiality protection, sampling error, nonsampling error, and definitions, see <www.census.gov/prod/techdoc/cps/cpsmar13.pdf>.
Source: U.S. Census Bureau, Current Population Survey, 2000 to 2013 Annual Social and Economic Supplements.
0
5
10
15
20
25
30
35
2012201032009200720052003200119991,2

28 Income, Poverty, and Health Insurance Coverage in the United States: 2012 U.S. Census Bureau
Economic Status
The uninsured rate was higher among people with lower incomes and was lower among people with higher incomes (Figure 10). In 2012, 24.9 percent of people in households with annual income less than $25,000 had no health insurance coverage. In 2012, the uninsured rates decreased as household income increased—21.4 percent of people in households with income ranging from $25,000 to $49,999 were uninsured; 15.0 percent of people in households with income ranging from $50,000 to $74,999 were uninsured; and 7.9 percent of people in households with income of $75,000 or more were uninsured. In 2012, the uninsured rate was not sta-tistically different from 2011 for any of the four inflation-adjusted house-hold income ranges.
Work Experience
For people aged 18 to 64 who worked at some time during the year, 19.5 percent or 28.4 million, were unin-sured in 2012. This percent and number were not statistically different from the 2011 estimates (Table 7). In 2012, full-time, year-round workers were more likely to be covered by health insurance (84.5 percent) than those who worked less than full time, year round (72.3 percent) or nonwork-ers (74.2 percent).33 Among full-time, year-round workers, the percent and the number of uninsured in 2012 (15.5 percent and 15.3 million) were not statistically different from the
33 A full-time, year-round worker is a person who worked 35 or more hours per week (full-time) and 50 or more weeks during the previous calendar year (year-round). For school personnel, summer vacation is counted as weeks worked if they are scheduled to return to their job in the fall.
2011 estimates. Among less-than-full-time, year-round workers, the per-cent and the number of uninsured in 2012 (27.7 percent and 13.1 million) were not statistically different from 2011. For nonworkers, the uninsured rate and the number of uninsured decreased in 2012 to 25.8 percent and 12.3 million, from 26.7 percent and 13.1 million in 2011.
Disability Status
Among those aged 18 to 64 with a disability, both the rate and the num-ber of uninsured in 2012 were not statistically different from 2011 esti-mates, at 16.6 percent and 2.5 million (Table 7). For those aged 18 to 64 without a disability, the rate and the number of uninsured in 2012 (21.5 percent and 38.2 million) were also not statistically different from 2011.
Figure 10.Uninsured Rates by Real Household Income: 1999 to 2012
Rates in percent Recession
Less than $25,000
$50,000 to $74,999
$75,000 and over
$25,000 to $49,999
24.9 percent
21.4 percent
15.0 percent
7.9 percent
0
10
20
30
40
50
60
70
80
90
201120052000 19951990198519801975197019651959
Earnings of women
Female-to-male earnings ratio
77 percent
$48,202
$37,118
Earnings of men
1 Implementation of Census 2000-based population controls occurred for the 2000 ASEC, which collected data for 1999. These estimates also reflect the results of follow-up verification questions, which were asked of people who responded “no” to all questions about specific types of health insurance coverage in order to verify whether they were actually uninsured. This change increased the number and percentage of people covered by health insurance, bringing the CPS more in line with estimates from other national surveys.2 The data for 1999 through 2009 were revised to reflect the results of enhancements to the editing process.3 Implementation of 2010 Census population controls.
Notes: Income in 2012 dollars. The data points are placed at the midpoints of the respective years. For information on recessions, see Appendix A. For information on confidentiality protection, sampling error, nonsampling error, and definitions, see <www.census.gov/prod/techdoc/cps/cpsmar13.pdf>.
Source: U.S. Census Bureau, Current Population Survey, 2000 to 2013 Annual Social and Economic Supplements.
0
5
10
15
20
25
30
2012201032009200720052003200119991,2
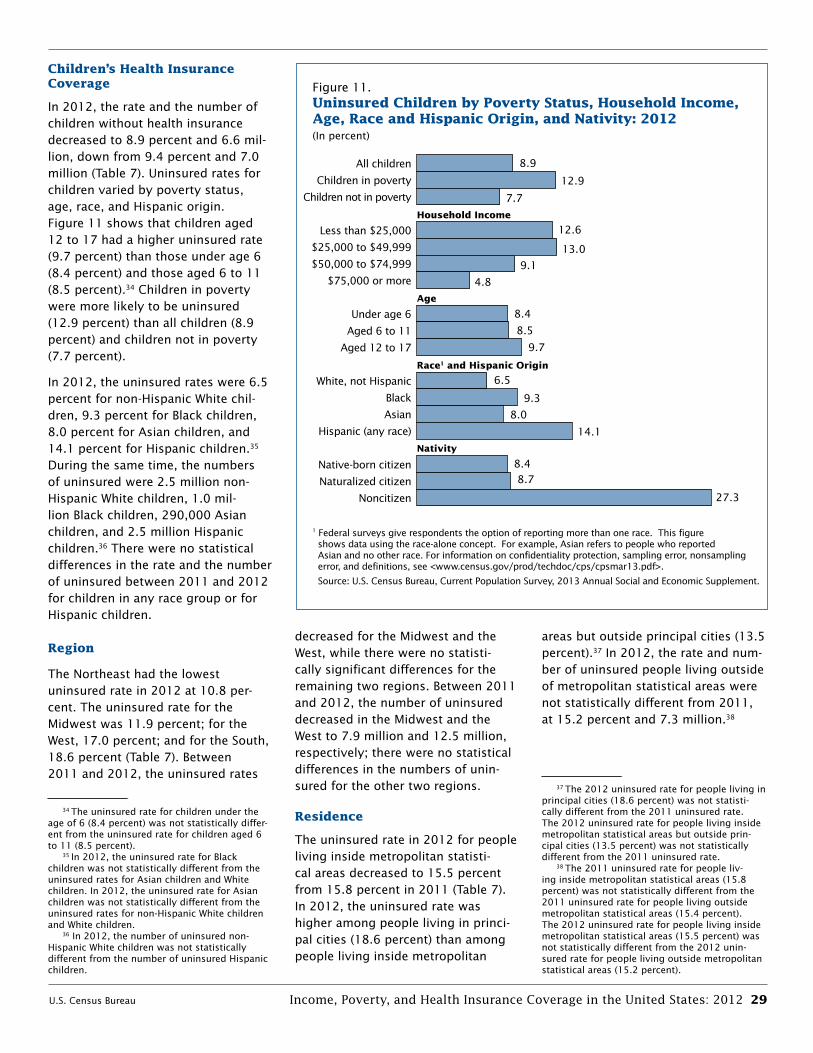
U.S. Census Bureau Income, Poverty, and Health Insurance Coverage in the United States: 2012 29
Children’s Health Insurance Coverage
In 2012, the rate and the number of children without health insurance decreased to 8.9 percent and 6.6 mil-lion, down from 9.4 percent and 7.0 million (Table 7). Uninsured rates for children varied by poverty status, age, race, and Hispanic origin. Figure 11 shows that children aged 12 to 17 had a higher uninsured rate (9.7 percent) than those under age 6 (8.4 percent) and those aged 6 to 11 (8.5 percent).34 Children in poverty were more likely to be uninsured (12.9 percent) than all children (8.9 percent) and children not in poverty (7.7 percent).
In 2012, the uninsured rates were 6.5 percent for non-Hispanic White chil-dren, 9.3 percent for Black children, 8.0 percent for Asian children, and 14.1 percent for Hispanic children.35
During the same time, the numbers of uninsured were 2.5 million non- Hispanic White children, 1.0 mil-lion Black children, 290,000 Asian children, and 2.5 million Hispanic children.36 There were no statistical differences in the rate and the number of uninsured between 2011 and 2012 for children in any race group or for Hispanic children. Region
The Northeast had the lowest uninsured rate in 2012 at 10.8 per-cent. The uninsured rate for the Midwest was 11.9 percent; for the West, 17.0 percent; and for the South, 18.6 percent (Table 7). Between 2011 and 2012, the uninsured rates
34 The uninsured rate for children under the age of 6 (8.4 percent) was not statistically differ-ent from the uninsured rate for children aged 6 to 11 (8.5 percent).
35 In 2012, the uninsured rate for Black children was not statistically different from the uninsured rates for Asian children and White children. In 2012, the uninsured rate for Asian children was not statistically different from the uninsured rates for non-Hispanic White children and White children.
36 In 2012, the number of uninsured non-Hispanic White children was not statistically different from the number of uninsured Hispanic children.
decreased for the Midwest and the West, while there were no statisti-cally significant differences for the remaining two regions. Between 2011 and 2012, the number of uninsured decreased in the Midwest and the West to 7.9 million and 12.5 million, respectively; there were no statistical differences in the numbers of unin-sured for the other two regions.
Residence
The uninsured rate in 2012 for people living inside metropolitan statisti-cal areas decreased to 15.5 percent from 15.8 percent in 2011 (Table 7). In 2012, the uninsured rate was higher among people living in princi-pal cities (18.6 percent) than among people living inside metropolitan
areas but outside principal cities (13.5 percent).37 In 2012, the rate and num-ber of uninsured people living outside of metropolitan statistical areas were not statistically different from 2011, at 15.2 percent and 7.3 million.38
37 The 2012 uninsured rate for people living in principal cities (18.6 percent) was not statisti-cally different from the 2011 uninsured rate. The 2012 uninsured rate for people living inside metropolitan statistical areas but outside prin-cipal cities (13.5 percent) was not statistically different from the 2011 uninsured rate.
38 The 2011 uninsured rate for people liv-ing inside metropolitan statistical areas (15.8 percent) was not statistically different from the 2011 uninsured rate for people living outside metropolitan statistical areas (15.4 percent). The 2012 uninsured rate for people living inside metropolitan statistical areas (15.5 percent) was not statistically different from the 2012 unin-sured rate for people living outside metropolitan statistical areas (15.2 percent).
Noncitizen
Naturalized citizen
Native-born citizen
Hispanic (any race)
Asian
Black
White, not Hispanic
Aged 12 to 17
Aged 6 to 11
Under age 6
$75,000 or more
$50,000 to $74,999
$25,000 to $49,999
Less than $25,000
Children not in poverty
Children in poverty
All children
Figure 11.Uninsured Children by Poverty Status, Household Income, Age, Race and Hispanic Origin, and Nativity: 2012(In percent)
1 Federal surveys give respondents the option of reporting more than one race. This figure shows data using the race-alone concept. For example, Asian refers to people who reported Asian and no other race. For information on confidentiality protection, sampling error, nonsampling error, and definitions, see <www.census.gov/prod/techdoc/cps/cpsmar13.pdf>.
Source: U.S. Census Bureau, Current Population Survey, 2013 Annual Social and Economic Supplement.
Household Income
Age
Nativity
Race1 and Hispanic Origin
27.3
8.78.4
14.1
8.0
9.3
6.5
9.7
8.5
8.4
4.8
9.1
13.0
12.6
12.9
7.7
8.9
30 Income, Poverty, and Health Insurance Coverage in the United States: 2012 U.S. Census Bureau
Additional Data and Contacts
Detailed tables, historical tables, press releases, and briefings are available electronically on the Census Bureau’s Income, Poverty, and Health Insurance Web sites. The Web sites may be accessed through the Census Bureau’s home page at <www.census.gov> or directly at <www.census.gov/hhes/www/income/> for income data, <www.census.gov/hhes/www/poverty/> for poverty data, and <www.census.gov/hhes/www /hlthins/> for health insurance data.
The CPS Table Creator at <www.census.gov/cps/data /cpstablecreator.html> gives you the ability to create customized tables from the CPS ASEC.
Microdata are available for download by clicking on “Data Tools” on the Census Bureau’s home page and then clicking the “DataFerrett” link. Technical methods have been applied to CPS microdata to avoid disclosing the identities of individuals from whom data were collected.
For assistance with income, poverty, or health insurance data or questions about them, contact the U.S. Census Bureau Customer Services Center at 1-800-923-8282 (toll free) or search your topic of interest using the Census Bureau’s “Question and Answer Center” found at <ask.census.gov>.
CoMMENTS
The Census Bureau welcomes the com-ments and advice of data and report users. If you have suggestions or com-ments on the income and poverty data, please write to:
Charles T. Nelson Assistant Division Chief, Economic Characteristics Social, Economic, and Housing Statistics Division U.S. Census Bureau Washington, D.C. 20233-8500
or send e-mail to <[email protected]>
If you have suggestions or comments on the health insurance coverage data, please write to:
Jennifer Cheeseman Day Assistant Division Chief, Employment Characteristics Social, Economic, and Housing Statistics Division U.S. Census Bureau Washington, D.C. 20233-8500
or send e-mail to <jennifer.cheeseman.day@census .gov>
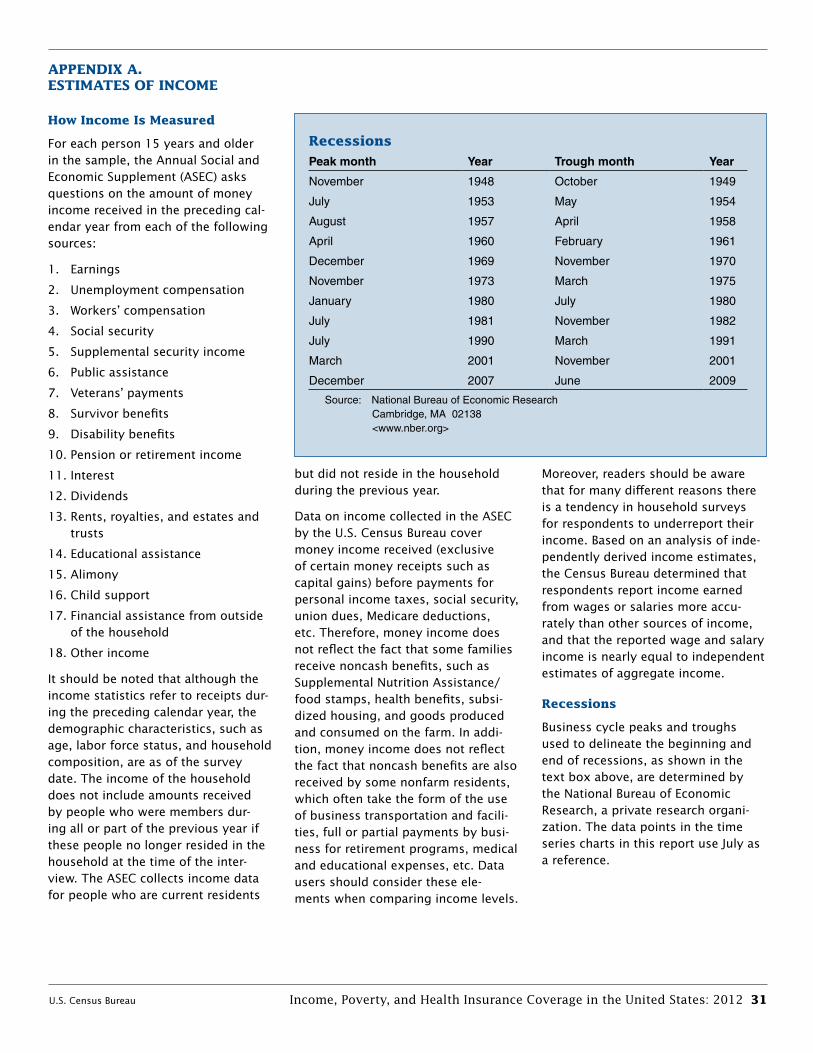
U.S. Census Bureau Income, Poverty, and Health Insurance Coverage in the United States: 2012 31
How Income Is Measured
For each person 15 years and older in the sample, the Annual Social and Economic Supplement (ASEC) asks questions on the amount of money income received in the preceding cal-endar year from each of the following sources:
1. Earnings
2. Unemployment compensation
3. Workers’ compensation
4. Social security
5. Supplemental security income
6. Public assistance
7. Veterans’ payments
8. Survivor benefits
9. Disability benefits
10. Pension or retirement income
11. Interest
12. Dividends
13. Rents, royalties, and estates and trusts
14. Educational assistance
15. Alimony
16. Child support
17. Financial assistance from outside of the household
18. Other income
It should be noted that although the income statistics refer to receipts dur-ing the preceding calendar year, the demographic characteristics, such as age, labor force status, and household composition, are as of the survey date. The income of the household does not include amounts received by people who were members dur-ing all or part of the previous year if these people no longer resided in the household at the time of the inter-view. The ASEC collects income data for people who are current residents
but did not reside in the household during the previous year.
Data on income collected in the ASEC by the U.S. Census Bureau cover money income received (exclusive of certain money receipts such as capital gains) before payments for personal income taxes, social security, union dues, Medicare deductions, etc. Therefore, money income does not reflect the fact that some families receive noncash benefits, such as Supplemental Nutrition Assistance/food stamps, health benefits, subsi-dized housing, and goods produced and consumed on the farm. In addi-tion, money income does not reflect the fact that noncash benefits are also received by some nonfarm residents, which often take the form of the use of business transportation and facili-ties, full or partial payments by busi-ness for retirement programs, medical and educational expenses, etc. Data users should consider these ele-ments when comparing income levels.
Moreover, readers should be aware that for many different reasons there is a tendency in household surveys for respondents to underreport their income. Based on an analysis of inde-pendently derived income estimates, the Census Bureau determined that respondents report income earned from wages or salaries more accu-rately than other sources of income, and that the reported wage and salary income is nearly equal to independent estimates of aggregate income.
Recessions
Business cycle peaks and troughs used to delineate the beginning and end of recessions, as shown in the text box above, are determined by the National Bureau of Economic Research, a private research organi-zation. The data points in the time series charts in this report use July as a reference.
APPENDIX A. ESTIMATES oF INCoME
Recessions
Peak month Year Trough month Year
November 1948 October 1949
July 1953 May 1954
August 1957 April 1958
April 1960 February 1961
December 1969 November 1970
November 1973 March 1975
January 1980 July 1980
July 1981 November 1982
July 1990 March 1991
March 2001 November 2001
December 2007 June 2009
Source: National Bureau of Economic Research Cambridge, MA 02138 <www .nber .org>
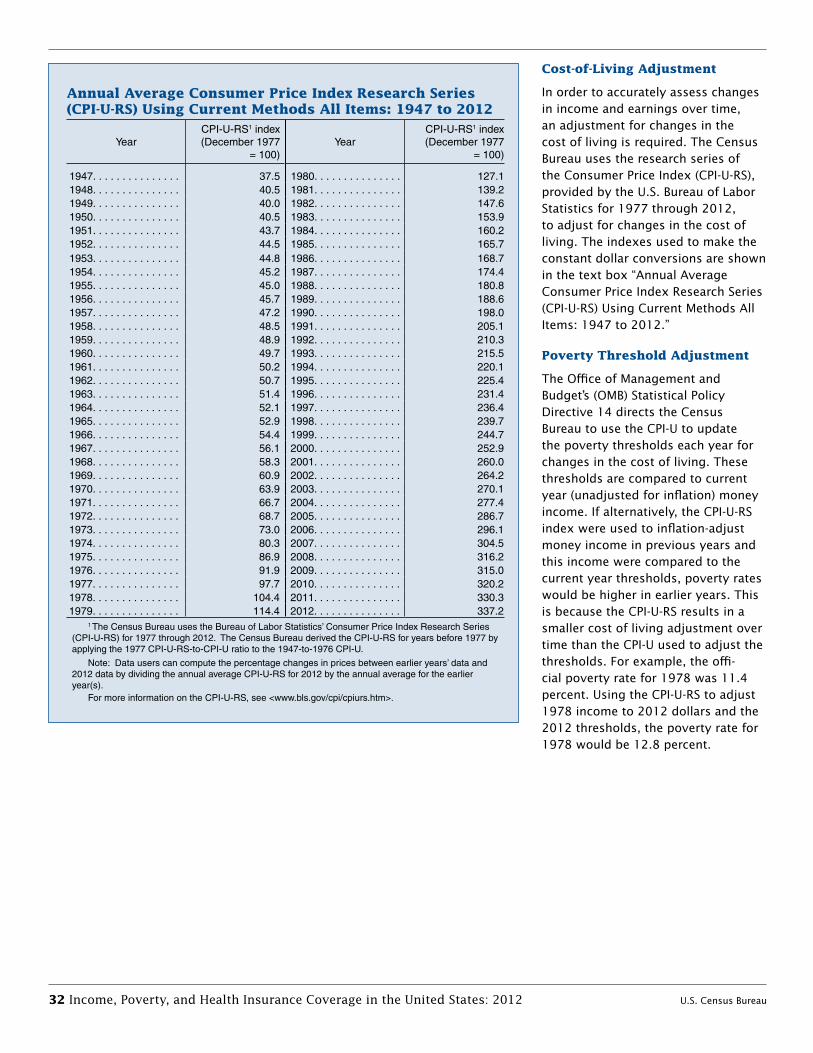
32 Income, Poverty, and Health Insurance Coverage in the United States: 2012 U.S. Census Bureau
Annual Average Consumer Price Index Research Series (CPI-U-RS) Using Current Methods All Items: 1947 to 2012
YearCPI-U-RS1 index(December 1977
= 100)Year
CPI-U-RS1 index(December 1977
= 100)
1947 . . . . . . . . . . . . . . . 37 .5 1980 . . . . . . . . . . . . . . . 127 .11948 . . . . . . . . . . . . . . . 40 .5 1981 . . . . . . . . . . . . . . . 139 .21949 . . . . . . . . . . . . . . . 40 .0 1982 . . . . . . . . . . . . . . . 147 .61950 . . . . . . . . . . . . . . . 40 .5 1983 . . . . . . . . . . . . . . . 153 .91951 . . . . . . . . . . . . . . . 43 .7 1984 . . . . . . . . . . . . . . . 160 .21952 . . . . . . . . . . . . . . . 44 .5 1985 . . . . . . . . . . . . . . . 165 .71953 . . . . . . . . . . . . . . . 44 .8 1986 . . . . . . . . . . . . . . . 168 .71954 . . . . . . . . . . . . . . . 45 .2 1987 . . . . . . . . . . . . . . . 174 .41955 . . . . . . . . . . . . . . . 45 .0 1988 . . . . . . . . . . . . . . . 180 .81956 . . . . . . . . . . . . . . . 45 .7 1989 . . . . . . . . . . . . . . . 188 .61957 . . . . . . . . . . . . . . . 47 .2 1990 . . . . . . . . . . . . . . . 198 .01958 . . . . . . . . . . . . . . . 48 .5 1991 . . . . . . . . . . . . . . . 205 .11959 . . . . . . . . . . . . . . . 48 .9 1992 . . . . . . . . . . . . . . . 210 .31960 . . . . . . . . . . . . . . . 49 .7 1993 . . . . . . . . . . . . . . . 215 .51961 . . . . . . . . . . . . . . . 50 .2 1994 . . . . . . . . . . . . . . . 220 .11962 . . . . . . . . . . . . . . . 50 .7 1995 . . . . . . . . . . . . . . . 225 .41963 . . . . . . . . . . . . . . . 51 .4 1996 . . . . . . . . . . . . . . . 231 .41964 . . . . . . . . . . . . . . . 52 .1 1997 . . . . . . . . . . . . . . . 236 .41965 . . . . . . . . . . . . . . . 52 .9 1998 . . . . . . . . . . . . . . . 239 .71966 . . . . . . . . . . . . . . . 54 .4 1999 . . . . . . . . . . . . . . . 244 .71967 . . . . . . . . . . . . . . . 56 .1 2000 . . . . . . . . . . . . . . . 252 .91968 . . . . . . . . . . . . . . . 58 .3 2001 . . . . . . . . . . . . . . . 260 .01969 . . . . . . . . . . . . . . . 60 .9 2002 . . . . . . . . . . . . . . . 264 .21970 . . . . . . . . . . . . . . . 63 .9 2003 . . . . . . . . . . . . . . . 270 .11971 . . . . . . . . . . . . . . . 66 .7 2004 . . . . . . . . . . . . . . . 277 .41972 . . . . . . . . . . . . . . . 68 .7 2005 . . . . . . . . . . . . . . . 286 .71973 . . . . . . . . . . . . . . . 73 .0 2006 . . . . . . . . . . . . . . . 296 .11974 . . . . . . . . . . . . . . . 80 .3 2007 . . . . . . . . . . . . . . . 304 .51975 . . . . . . . . . . . . . . . 86 .9 2008 . . . . . . . . . . . . . . . 316 .21976 . . . . . . . . . . . . . . . 91 .9 2009 . . . . . . . . . . . . . . . 315 .01977 . . . . . . . . . . . . . . . 97 .7 2010 . . . . . . . . . . . . . . . 320 .21978 . . . . . . . . . . . . . . . 104 .4 2011 . . . . . . . . . . . . . . . 330 .31979 . . . . . . . . . . . . . . . 114 .4 2012 . . . . . . . . . . . . . . . 337 .2
1 The Census Bureau uses the Bureau of Labor Statistics’ Consumer Price Index Research Series (CPI-U-RS) for 1977 through 2012 . The Census Bureau derived the CPI-U-RS for years before 1977 by applying the 1977 CPI-U-RS-to-CPI-U ratio to the 1947-to-1976 CPI-U .
Note: Data users can compute the percentage changes in prices between earlier years’ data and 2012 data by dividing the annual average CPI-U-RS for 2012 by the annual average for the earlier year(s) .
For more information on the CPI-U-RS, see <www .bls .gov/cpi/cpiurs .htm> .
Cost-of-Living Adjustment
In order to accurately assess changes in income and earnings over time, an adjustment for changes in the cost of living is required. The Census Bureau uses the research series of the Consumer Price Index (CPI-U-RS), provided by the U.S. Bureau of Labor Statistics for 1977 through 2012, to adjust for changes in the cost of living. The indexes used to make the constant dollar conversions are shown in the text box “Annual Average Consumer Price Index Research Series (CPI-U-RS) Using Current Methods All Items: 1947 to 2012.”
Poverty Threshold Adjustment
The Office of Management and Budget’s (OMB) Statistical Policy Directive 14 directs the Census Bureau to use the CPI-U to update the poverty thresholds each year for changes in the cost of living. These thresholds are compared to current year (unadjusted for inflation) money income. If alternatively, the CPI-U-RS index were used to inflation-adjust money income in previous years and this income were compared to the current year thresholds, poverty rates would be higher in earlier years. This is because the CPI-U-RS results in a smaller cost of living adjustment over time than the CPI-U used to adjust the thresholds. For example, the offi-cial poverty rate for 1978 was 11.4 percent. Using the CPI-U-RS to adjust 1978 income to 2012 dollars and the 2012 thresholds, the poverty rate for 1978 would be 12.8 percent.
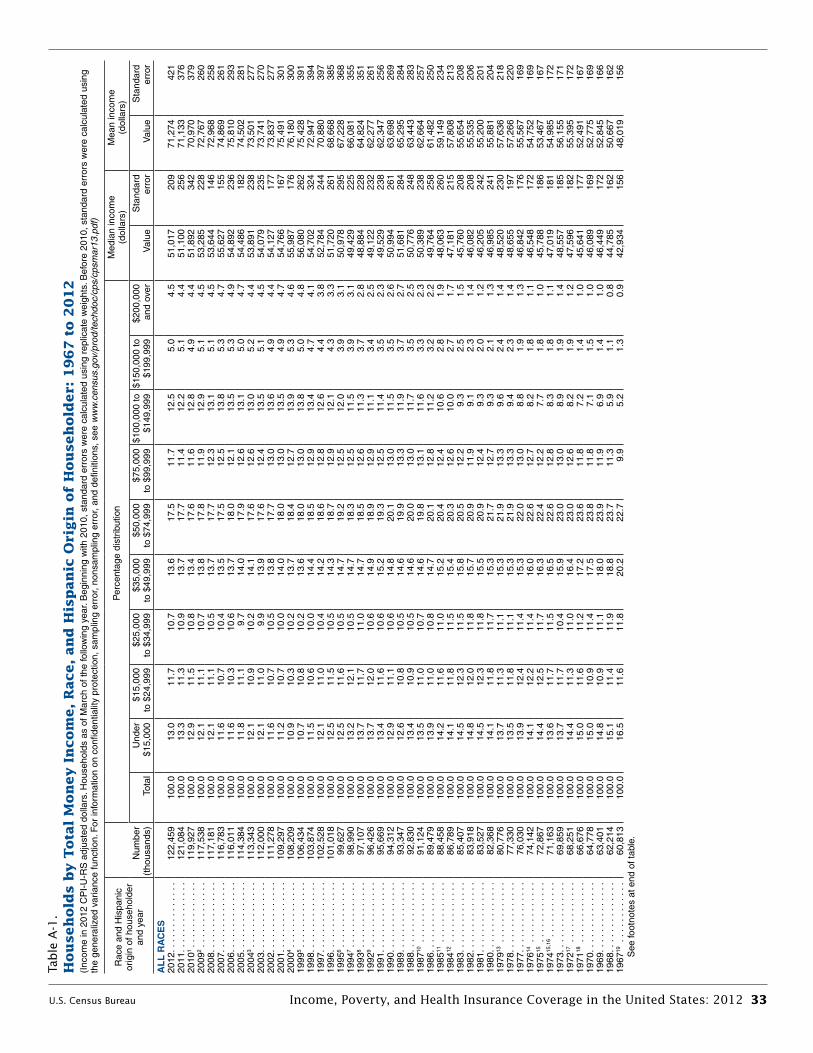
U.S. Census Bureau Income, Poverty, and Health Insurance Coverage in the United States: 2012 33
Table
A-1
.H
ou
seh
old
s b
y T
ota
l M
on
ey I
ncom
e, R
ace, an
d H
isp
an
ic o
rigin
of
Hou
seh
old
er:
19
67
to 2
01
2—
Con
.(I
ncom
e in
201
2 C
PI-
U-R
S a
djus
ted
dolla
rs . H
ouse
hold
s as
of M
arch
of t
he fo
llow
ing
year
. Beg
inni
ng w
ith 2
010,
sta
ndar
d er
rors
wer
e ca
lcul
ated
usi
ng r
eplic
ate
wei
ghts
. Bef
ore
2010
, sta
ndar
d er
rors
wer
e ca
lcul
ated
usi
ng
the
gene
raliz
ed v
aria
nce
func
tion .
For
info
rmat
ion
on c
onfid
entia
lity
prot
ectio
n, s
ampl
ing
erro
r, no
nsam
plin
g er
ror,
and
defin
ition
s, s
ee w
ww
.cen
sus.
gov/
prod
/tech
doc/
cps/
cpsm
ar13
)
Rac
e an
d H
ispa
nic
orig
in o
f hou
seho
lder
an
d ye
arN
umbe
r (t
hous
ands
)
Per
cent
age
dist
ribut
ion
Med
ian
inco
me
(dol
lars
)M
ean
inco
me
(dol
lars
)
Tota
lU
nder
$1
5,00
0$1
5,00
0 to
$24
,999
$25,
000
to $
34,9
99$3
5,00
0 to
$49
,999
$50,
000
to $
74,9
99$7
5,00
0 to
$99
,999
$100
,000
to
$149
,999
$150
,000
to
$199
,999
$200
,000
an
d ov
erV
alue
Sta
ndar
d er
ror
Val
ueS
tand
ard
erro
r
AL
L R
AC
ES
2012
. . .
. . .
. . .
. . .
. .
122
,459
1
00 .0
1
3 .0
11 .
7 1
0 .7
13 .
6 1
7 .5
11 .
7 1
2 .5
5 .0
4
.5
51,
017
209
7
1,27
4 4
21
2011
. . .
. . .
. . .
. . .
. .
121
,084
1
00 .0
1
3 .3
11 .
3 1
0 .9
13 .
7 1
7 .7
11 .
4 1
2 .2
5 .1
4
.4
51,
100
256
7
1,13
3 3
76
2010
1 . . .
. . . .
. . . .
. . 1
19,9
27
100
.0
12 .
9 1
1 .5
10 .
8 1
3 .4
17 .
6 1
1 .6
12 .
8 4
.9
4 .4
5
1,89
2 3
42
70,
970
379
20
092 .
. . . .
. . . .
. . . .
117
,538
1
00 .0
1
2 .1
11 .
1 1
0 .7
13 .
8 1
7 .8
11 .
9 1
2 .9
5 .1
4
.5
53,
285
228
7
2,76
7 2
60
2008
. . .
. . .
. . .
. . .
. .
117
,181
1
00 .0
1
2 .1
11 .
1 1
0 .5
13 .
7 1
7 .7
12 .
3 1
3 .1
5 .1
4
.5
53,
644
146
7
2,96
8 2
58
2007
. . .
. . .
. . .
. . .
. .
116
,783
1
00 .0
1
1 .6
10 .
7 1
0 .4
13 .
5 1
7 .5
12 .
5 1
3 .8
5 .3
4
.7
55,
627
155
7
4,86
9 2
61
2006
. . .
. . .
. . .
. . .
. .
116
,011
1
00 .0
1
1 .6
10 .
3 1
0 .6
13 .
7 1
8 .0
12 .
1 1
3 .5
5 .3
4
.9
54,
892
236
7
5,81
0 2
93
2005
. . .
. . .
. . .
. . .
. .
114
,384
1
00 .0
1
1 .8
11 .
1 9
.7
14 .
0 1
7 .9
12 .
6 1
3 .1
5 .0
4
.7
54,
486
182
7
4,50
2 2
81
2004
3 . . .
. . . .
. . . .
. . 1
13,3
43
100
.0
12 .
1 1
0 .9
10 .
2 1
4 .1
17 .
6 1
2 .6
13 .
0 5
.2
4 .4
5
3,89
1 2
38
73,
501
277
20
03 . .
. . .
. . .
. . .
. . .
1
12,0
00
100
.0
12 .
1 1
1 .0
9 .9
1
3 .9
17 .
6 1
2 .4
13 .
5 5
.1
4 .5
5
4,07
9 2
35
73,
741
270
20
02 . .
. . .
. . .
. . .
. . .
1
11,2
78
100
.0
11 .
6 1
0 .7
10 .
5 1
3 .8
17 .
7 1
3 .0
13 .
6 4
.9
4 .4
5
4,12
7 1
77
73,
837
277
20
01 . .
. . .
. . .
. . .
. . .
1
09,2
97
100
.0
11 .
2 1
0 .7
10 .
0 1
4 .0
18 .
0 1
3 .0
13 .
5 4
.9
4 .7
5
4,76
6 1
67
75,
491
301
20
004 .
. . . .
. . . .
. . . .
108
,209
1
00 .0
1
0 .9
10 .
3 1
0 .2
13 .
7 1
8 .4
12 .
7 1
3 .9
5 .3
4
.6
55,
987
176
7
6,18
0 3
00
1999
5 . . .
. . . .
. . . .
. . 1
06,4
34
100
.0
10 .
7 1
0 .8
10 .
2 1
3 .6
18 .
0 1
3 .0
13 .
8 5
.0
4 .8
5
6,08
0 2
62
75,
428
391
19
98 . .
. . .
. . .
. . .
. . .
1
03,8
74
100
.0
11 .
5 1
0 .6
10 .
0 1
4 .4
18 .
5 1
2 .9
13 .
4 4
.7
4 .1
5
4,70
2 3
24
72,
947
394
19
97 . .
. . .
. . .
. . .
. . .
1
02,5
28
100
.0
12 .
1 1
1 .0
10 .
4 1
4 .2
18 .
6 1
2 .8
12 .
6 4
.4
3 .8
5
2,78
4 2
44
70,
880
397
19
96 . .
. . .
. . .
. . .
. . .
1
01,0
18
100
.0
12 .
5 1
1 .5
10 .
5 1
4 .3
18 .
7 1
2 .9
12 .
1 4
.3
3 .3
5
1,72
0 2
61
68,
668
385
19
956 .
. . . .
. . . .
. . . .
99,
627
100
.0
12 .
5 1
1 .6
10 .
5 1
4 .7
19 .
2 1
2 .5
12 .
0 3
.9
3 .1
5
0,97
8 2
95
67,
228
368
19
947 .
. . . .
. . . .
. . . .
98,
990
100
.0
13 .
2 1
2 .1
10 .
5 1
4 .7
18 .
3 1
2 .5
11 .
5 3
.9
3 .1
4
9,42
9 2
25
66,
081
355
19
938 .
. . . .
. . . .
. . . .
97,
107
100
.0
13 .
7 1
1 .7
11 .
0 1
4 .7
18 .
5 1
2 .6
11 .
3 3
.7
2 .8
4
8,88
4 2
28
64,
824
351
19
929 .
. . . .
. . . .
. . . .
96,
426
100
.0
13 .
7 1
2 .0
10 .
6 1
4 .9
18 .
9 1
2 .9
11 .
1 3
.4
2 .5
4
9,12
2 2
32
62,
277
261
19
91 . .
. . .
. . .
. . .
. . .
9
5,66
9 1
00 .0
1
3 .4
11 .
6 1
0 .6
15 .
2 1
9 .3
12 .
5 1
1 .4
3 .5
2
.3
49,
529
238
6
2,34
7 2
56
1990
. . .
. . .
. . .
. . .
. .
94,
312
100
.0
12 .
9 1
1 .1
10 .
6 1
4 .8
20 .
1 1
3 .0
11 .
5 3
.5
2 .6
5
0,99
4 2
61
63,
698
269
19
89 . .
. . .
. . .
. . .
. . .
9
3,34
7 1
00 .0
1
2 .6
10 .
8 1
0 .5
14 .
6 1
9 .9
13 .
3 1
1 .9
3 .7
2
.7
51,
681
284
6
5,29
5 2
84
1988
. . .
. . .
. . .
. . .
. .
92,
830
100
.0
13 .
4 1
0 .9
10 .
5 1
4 .6
20 .
0 1
3 .0
11 .
7 3
.5
2 .5
5
0,77
6 2
48
63,
443
283
19
8710
. . .
. . . .
. . . .
. 9
1,12
4 1
00 .0
1
3 .5
11 .
0 1
0 .7
14 .
6 1
9 .8
13 .
1 1
1 .6
3 .3
2
.3
50,
389
238
6
2,66
4 2
57
1986
. . .
. . .
. . .
. . .
. .
89,
479
100
.0
13 .
9 1
1 .0
10 .
8 1
4 .7
20 .
1 1
2 .8
11 .
2 3
.2
2 .2
4
9,76
4 2
58
61,
482
250
19
8511
. . .
. . . .
. . . .
. 8
8,45
8 1
00 .0
1
4 .2
11 .
6 1
1 .0
15 .
2 2
0 .4
12 .
4 1
0 .6
2 .8
1
.9
48,
063
260
5
9,14
9 2
34
1984
12 .
. . . .
. . . .
. . .
86,
789
100
.0
14 .
1 1
1 .8
11 .
5 1
5 .4
20 .
3 1
2 .6
10 .
0 2
.7
1 .7
4
7,18
1 2
15
57,
808
213
19
83 . .
. . .
. . .
. . .
. . .
8
5,40
7 1
00 .0
1
4 .5
12 .
3 1
1 .5
15 .
8 2
0 .5
12 .
2 9
.3
2 .5
1
.5
45,
760
208
5
5,65
4 2
08
1982
. . .
. . .
. . .
. . .
. .
83,
918
100
.0
14 .
8 1
2 .0
11 .
8 1
5 .7
20 .
9 1
1 .9
9 .1
2
.3
1 .4
4
6,08
2 2
08
55,
535
206
19
81 . .
. . .
. . .
. . .
. . .
8
3,52
7 1
00 .0
1
4 .5
12 .
3 1
1 .8
15 .
5 2
0 .9
12 .
4 9
.3
2 .0
1
.2
46,
205
242
5
5,20
0 2
01
1980
. . .
. . .
. . .
. . .
. .
82,
368
100
.0
14 .
1 1
1 .8
11 .
7 1
5 .3
21 .
7 1
2 .7
9 .3
2
.1
1 .3
4
6,98
5 2
41
55,
881
204
19
7913
. . .
. . . .
. . . .
. 8
0,77
6 1
00 .0
1
3 .7
11 .
3 1
1 .1
15 .
3 2
1 .9
13 .
3 9
.6
2 .4
1
.4
48,
520
230
5
7,63
6 2
18
1978
. . .
. . .
. . .
. . .
. .
77,
330
100
.0
13 .
5 1
1 .8
11 .
1 1
5 .3
21 .
9 1
3 .3
9 .4
2
.3
1 .4
4
8,65
5 1
97
57,
266
220
19
77 . .
. . .
. . .
. . .
. . .
7
6,03
0 1
00 .0
1
3 .9
12 .
4 1
1 .4
15 .
3 2
2 .0
13 .
0 8
.8
1 .9
1
.3
46,
842
176
5
5,56
7 1
69
1976
14 .
. . . .
. . . .
. . .
74,
142
100
.0
14 .
1 1
2 .2
11 .
4 1
6 .0
22 .
6 1
2 .7
8 .2
1
.8
1 .1
4
6,54
8 1
72
54,
752
169
19
7515
. . .
. . . .
. . . .
. 7
2,86
7 1
00 .0
1
4 .4
12 .
5 1
1 .7
16 .
3 2
2 .4
12 .
2 7
.7
1 .8
1
.0
45,
788
186
5
3,46
7 1
67
1974
15,1
6 . . .
. . . .
. . . .
71,
163
100
.0
13 .
6 1
1 .7
11 .
5 1
6 .5
22 .
6 1
2 .8
8 .3
1
.8
1 .1
4
7,01
9 1
81
54,
985
172
19
73 . .
. . .
. . .
. . .
. . .
6
9,85
9 1
00 .0
1
3 .7
11 .
7 1
0 .4
15 .
9 2
3 .0
13 .
0 8
.9
1 .9
1
.4
48,
557
185
5
6,15
5 1
71
1972
17 .
. . . .
. . . .
. . .
68,
251
100
.0
14 .
4 1
1 .3
11 .
0 1
6 .4
23 .
0 1
2 .6
8 .2
1
.9
1 .2
4
7,59
6 1
82
55,
395
172
19
7118
. . .
. . . .
. . . .
. 6
6,67
6 1
00 .0
1
5 .0
11 .
6 1
1 .2
17 .
2 2
3 .6
11 .
8 7
.2
1 .4
1
.0
45,
641
177
5
2,49
1 1
67
1970
. . .
. . .
. . .
. . .
. .
64,
778
100
.0
15 .
0 1
0 .9
11 .
4 1
7 .5
23 .
8 1
1 .8
7 .1
1
.5
1 .0
4
6,08
9 1
69
52,
775
169
19
69 . .
. . .
. . .
. . .
. . .
6
3,40
1 1
00 .0
1
4 .8
10 .
9 1
1 .1
18 .
0 2
3 .9
11 .
9 6
.9
1 .4
1
.0
46,
449
172
5
2,84
5 1
66
1968
. . .
. . .
. . .
. . .
. .
62,
214
100
.0
15 .
1 1
1 .4
11 .
9 1
8 .8
23 .
7 1
1 .3
5 .9
1
.1
0 .8
4
4,78
5 1
62
50,
667
162
19
6719
. . .
. . . .
. . . .
. 6
0,81
3 1
00 .0
1
6 .5
11 .
6 1
1 .8
20 .
2 2
2 .7
9 .9
5
.2
1 .3
0
.9
42,
934
156
4
8,01
9 1
56
See
foot
note
s at
end
of t
able
.
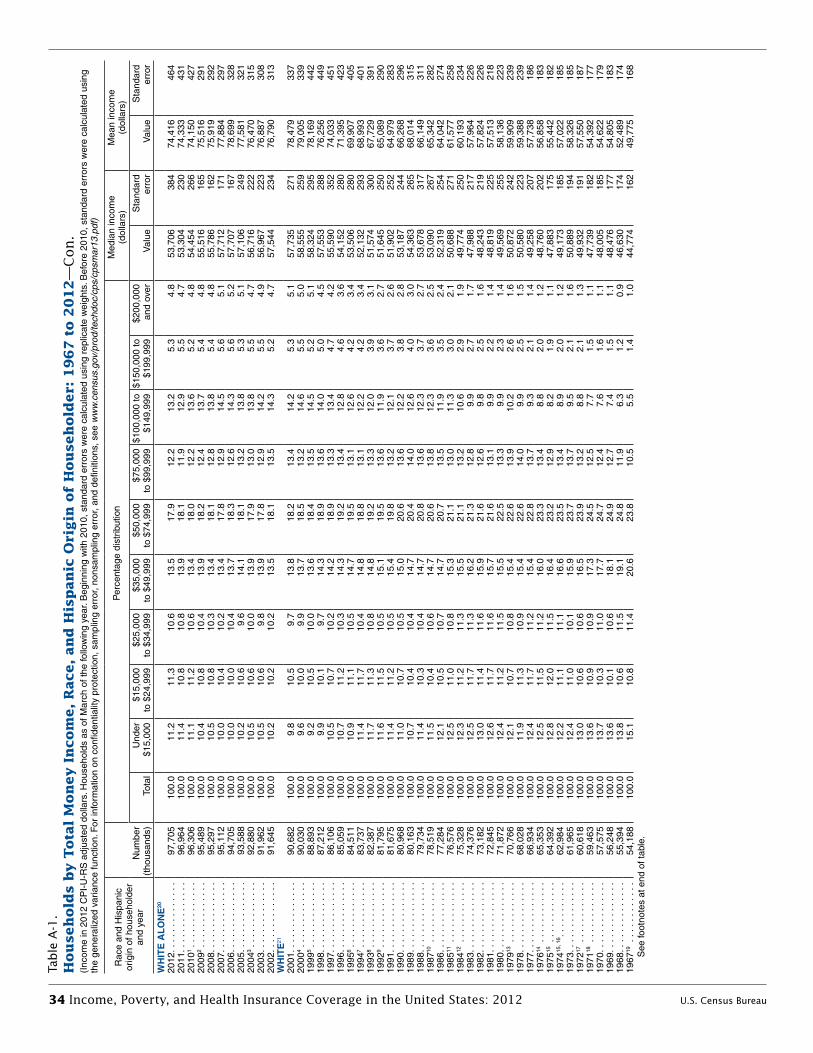
34 Income, Poverty, and Health Insurance Coverage in the United States: 2012 U.S. Census Bureau
Table
A-1
.H
ou
seh
old
s b
y T
ota
l M
on
ey I
ncom
e, R
ace, an
d H
isp
an
ic o
rigin
of
Hou
seh
old
er:
19
67
to 2
01
2—
Con
.(I
ncom
e in
201
2 C
PI-
U-R
S a
djus
ted
dolla
rs . H
ouse
hold
s as
of M
arch
of t
he fo
llow
ing
year
. Beg
inni
ng w
ith 2
010,
sta
ndar
d er
rors
wer
e ca
lcul
ated
usi
ng r
eplic
ate
wei
ghts
. Bef
ore
2010
, sta
ndar
d er
rors
wer
e ca
lcul
ated
usi
ng
the
gene
raliz
ed v
aria
nce
func
tion .
For
info
rmat
ion
on c
onfid
entia
lity
prot
ectio
n, s
ampl
ing
erro
r, no
nsam
plin
g er
ror,
and
defin
ition
s, s
ee w
ww
.cen
sus.
gov/
prod
/tech
doc/
cps/
cpsm
ar13
)
Rac
e an
d H
ispa
nic
orig
in o
f hou
seho
lder
an
d ye
arN
umbe
r (t
hous
ands
)
Per
cent
age
dist
ribut
ion
Med
ian
inco
me
(dol
lars
)M
ean
inco
me
(dol
lars
)
Tota
lU
nder
$1
5,00
0$1
5,00
0 to
$24
,999
$25,
000
to $
34,9
99$3
5,00
0 to
$49
,999
$50,
000
to $
74,9
99$7
5,00
0 to
$99
,999
$100
,000
to
$149
,999
$150
,000
to
$199
,999
$200
,000
an
d ov
erV
alue
Sta
ndar
d er
ror
Val
ueS
tand
ard
erro
r
WH
ITE
AL
ON
E20
2012
. . .
. . .
. . .
. . .
. .
97,
705
100
.0
11 .
2 1
1 .3
10 .
6 1
3 .5
17 .
9 1
2 .2
13 .
2 5
.3
4 .8
5
3,70
6 3
84
74,
416
464
20
11 . .
. . .
. . .
. . .
. . .
9
6,96
4 1
00 .0
1
1 .4
10 .
8 1
0 .8
13 .
9 1
8 .1
11 .
9 1
2 .9
5 .5
4
.7
53,
304
230
7
4,33
3 4
31
2010
1 . . .
. . . .
. . . .
. . 9
6,30
6 1
00 .0
1
1 .1
11 .
2 1
0 .6
13 .
4 1
8 .0
12 .
2 1
3 .6
5 .2
4
.8
54,
454
266
7
4,15
0 4
27
2009
2 . . .
. . . .
. . . .
. . 9
5,48
9 1
00 .0
1
0 .4
10 .
8 1
0 .4
13 .
9 1
8 .2
12 .
4 1
3 .7
5 .4
4
.8
55,
516
165
7
5,51
6 2
91
2008
. . .
. . .
. . .
. . .
. .
95,
297
100
.0
10 .
5 1
0 .8
10 .
3 1
3 .4
18 .
1 1
2 .8
13 .
8 5
.4
4 .8
5
5,78
6 1
62
75,
919
292
20
07 . .
. . .
. . .
. . .
. . .
9
5,11
2 1
00 .0
1
0 .0
10 .
4 1
0 .2
13 .
4 1
7 .8
12 .
9 1
4 .5
5 .6
5
.1
57,
712
171
7
7,88
4 2
97
2006
. . .
. . .
. . .
. . .
. .
94,
705
100
.0
10 .
0 1
0 .0
10 .
4 1
3 .7
18 .
3 1
2 .6
14 .
3 5
.6
5 .2
5
7,70
7 1
67
78,
699
328
20
05 . .
. . .
. . .
. . .
. . .
9
3,58
8 1
00 .0
1
0 .2
10 .
6 9
.6
14 .
1 1
8 .1
13 .
2 1
3 .8
5 .3
5
.1
57,
106
249
7
7,58
1 3
21
2004
3 . . .
. . . .
. . . .
. . 9
2,88
0 1
00 .0
1
0 .5
10 .
6 1
0 .0
13 .
9 1
7 .9
13 .
0 1
3 .8
5 .5
4
.7
56,
716
222
7
6,47
0 3
15
2003
. . .
. . .
. . .
. . .
. .
91,
962
100
.0
10 .
5 1
0 .6
9 .8
1
3 .9
17 .
8 1
2 .9
14 .
2 5
.5
4 .9
5
6,96
7 2
23
76,
887
308
20
02 . .
. . .
. . .
. . .
. . .
9
1,64
5 1
00 .0
1
0 .2
10 .
2 1
0 .2
13 .
5 1
8 .1
13 .
5 1
4 .3
5 .2
4
.7
57,
544
234
7
6,79
0 3
13
WH
ITE
21
2001
. . .
. . .
. . .
. . .
. .
90,
682
100
.0
9 .8
1
0 .5
9 .7
1
3 .8
18 .
2 1
3 .4
14 .
2 5
.3
5 .1
5
7,73
5 2
71
78,
479
337
20
004 .
. . . .
. . . .
. . . .
90,
030
100
.0
9 .6
1
0 .0
9 .9
1
3 .7
18 .
5 1
3 .2
14 .
6 5
.5
5 .0
5
8,55
5 2
59
79,
005
339
19
995 .
. . . .
. . . .
. . . .
88,
893
100
.0
9 .2
1
0 .5
10 .
0 1
3 .6
18 .
4 1
3 .5
14 .
5 5
.2
5 .1
5
8,32
4 2
95
78,
169
442
19
98 . .
. . .
. . .
. . .
. . .
8
7,21
2 1
00 .0
9
.9
10 .
1 9
.7
14 .
3 1
8 .9
13 .
6 1
4 .0
5 .0
4
.5
57,
553
288
7
6,25
6 4
49
1997
. . .
. . .
. . .
. . .
. .
86,
106
100
.0
10 .
5 1
0 .7
10 .
2 1
4 .2
18 .
9 1
3 .3
13 .
4 4
.7
4 .2
5
5,59
0 3
52
74,
033
451
19
96 . .
. . .
. . .
. . .
. . .
8
5,05
9 1
00 .0
1
0 .7
11 .
2 1
0 .3
14 .
3 1
9 .2
13 .
4 1
2 .8
4 .6
3
.6
54,
152
280
7
1,39
5 4
23
1995
6 . . .
. . . .
. . . .
. . 8
4,51
1 1
00 .0
1
0 .9
11 .
1 1
0 .5
14 .
7 1
9 .5
13 .
1 1
2 .6
4 .2
3
.4
53,
506
280
6
9,90
7 4
05
1994
7 . . .
. . . .
. . . .
. . 8
3,73
7 1
00 .0
1
1 .4
11 .
7 1
0 .4
14 .
8 1
8 .8
13 .
1 1
2 .2
4 .2
3
.4
52,
132
293
6
8,99
3 4
01
1993
8 . . .
. . . .
. . . .
. . 8
2,38
7 1
00 .0
1
1 .7
11 .
3 1
0 .8
14 .
8 1
9 .2
13 .
3 1
2 .0
3 .9
3
.1
51,
574
300
6
7,72
9 3
91
1992
9 . . .
. . . .
. . . .
. . 8
1,79
5 1
00 .0
1
1 .6
11 .
5 1
0 .5
15 .
1 1
9 .5
13 .
6 1
1 .9
3 .6
2
.7
51,
645
250
6
5,08
9 2
90
1991
. . .
. . .
. . .
. . .
. .
81,
675
100
.0
11 .
4 1
1 .2
10 .
5 1
5 .4
19 .
8 1
3 .2
12 .
1 3
.7
2 .6
5
1,90
2 2
52
64,
979
283
19
90 . .
. . .
. . .
. . .
. . .
8
0,96
8 1
00 .0
1
1 .0
10 .
7 1
0 .5
15 .
0 2
0 .6
13 .
6 1
2 .2
3 .8
2
.8
53,
187
244
6
6,26
8 2
96
1989
. . .
. . .
. . .
. . .
. .
80,
163
100
.0
10 .
7 1
0 .4
10 .
4 1
4 .7
20 .
4 1
4 .0
12 .
6 4
.0
3 .0
5
4,36
3 2
65
68,
014
315
19
88 . .
. . .
. . .
. . .
. . .
7
9,73
4 1
00 .0
1
1 .4
10 .
3 1
0 .4
14 .
7 2
0 .8
13 .
6 1
2 .3
3 .7
2
.7
53,
678
317
6
6,14
9 3
11
1987
10 .
. . . .
. . . .
. . .
78,
519
100
.0
11 .
5 1
0 .4
10 .
6 1
4 .7
20 .
6 1
3 .8
12 .
3 3
.6
2 .5
5
3,09
0 2
67
65,
342
282
19
86 . .
. . .
. . .
. . .
. . .
7
7,28
4 1
00 .0
1
2 .1
10 .
5 1
0 .7
14 .
7 2
0 .7
13 .
5 1
1 .9
3 .5
2
.4
52,
319
254
6
4,04
2 2
74
1985
11 .
. . . .
. . . .
. . .
76,
576
100
.0
12 .
5 1
1 .0
10 .
8 1
5 .3
21 .
1 1
3 .0
11 .
3 3
.0
2 .1
5
0,68
8 2
71
61,
577
258
19
8412
. . .
. . . .
. . . .
. 7
5,32
8 1
00 .0
1
2 .3
11 .
2 1
1 .3
15 .
5 2
1 .1
13 .
2 1
0 .6
2 .9
1
.9
49,
774
250
6
0,19
3 2
34
1983
. . .
. . .
. . .
. . .
. .
74,
376
100
.0
12 .
5 1
1 .7
11 .
3 1
6 .2
21 .
3 1
2 .8
9 .9
2
.7
1 .7
4
7,98
8 2
17
57,
964
226
19
82 . .
. . .
. . .
. . .
. . .
7
3,18
2 1
00 .0
1
3 .0
11 .
4 1
1 .6
15 .
9 2
1 .6
12 .
6 9
.8
2 .5
1
.6
48,
243
219
5
7,82
4 2
26
1981
. . .
. . .
. . .
. . .
. .
72,
845
100
.0
12 .
6 1
1 .7
11 .
6 1
5 .7
21 .
6 1
3 .1
9 .9
2
.2
1 .4
4
8,81
9 2
25
57,
513
218
19
80 . .
. . .
. . .
. . .
. . .
7
1,87
2 1
00 .0
1
2 .4
11 .
2 1
1 .5
15 .
5 2
2 .5
13 .
3 9
.9
2 .3
1
.4
49,
569
255
5
8,13
6 2
23
1979
13 .
. . . .
. . . .
. . .
70,
766
100
.0
12 .
1 1
0 .7
10 .
8 1
5 .4
22 .
6 1
3 .9
10 .
2 2
.6
1 .6
5
0,87
2 2
42
59,
909
239
19
78 . .
. . .
. . .
. . .
. . .
6
8,02
8 1
00 .0
1
1 .9
11 .
3 1
0 .9
15 .
4 2
2 .6
14 .
0 9
.9
2 .5
1
.5
50,
580
223
5
9,38
8 2
39
1977
. . .
. . .
. . .
. . .
. .
66,
934
100
.0
12 .
4 1
1 .7
11 .
2 1
5 .4
22 .
8 1
3 .7
9 .3
2
.1
1 .4
4
9,25
8 2
07
57,
738
186
19
7614
. . .
. . . .
. . . .
. 6
5,35
3 1
00 .0
1
2 .5
11 .
5 1
1 .2
16 .
0 2
3 .3
13 .
4 8
.8
2 .0
1
.2
48,
760
202
5
6,85
8 1
83
1975
15 .
. . . .
. . . .
. . .
64,
392
100
.0
12 .
8 1
2 .0
11 .
5 1
6 .4
23 .
2 1
2 .9
8 .2
1
.9
1 .1
4
7,88
3 1
75
55,
442
182
19
7415
, 16 .
. . . .
. . . .
. . 6
2,98
4 1
00 .0
1
2 .2
11 .
1 1
1 .1
16 .
6 2
3 .5
13 .
4 8
.9
2 .0
1
.2
49,
173
185
5
7,02
2 1
85
1973
. . .
. . .
. . .
. . .
. .
61,
965
100
.0
12 .
4 1
1 .0
10 .
1 1
5 .9
23 .
7 1
3 .7
9 .5
2
.1
1 .6
5
0,88
9 1
94
58,
326
185
19
7217
. . .
. . . .
. . . .
. 6
0,61
8 1
00 .0
1
3 .0
10 .
6 1
0 .6
16 .
5 2
3 .9
13 .
2 8
.8
2 .1
1
.3
49,
932
191
5
7,55
0 1
87
1971
18 .
. . . .
. . . .
. . .
59,
463
100
.0
13 .
6 1
0 .9
10 .
9 1
7 .3
24 .
5 1
2 .5
7 .7
1
.5
1 .1
4
7,73
9 1
82
54,
392
177
19
70 . .
. . .
. . .
. . .
. . .
5
7,57
5 1
00 .0
1
3 .7
10 .
3 1
1 .0
17 .
7 2
4 .7
12 .
4 7
.6
1 .6
1
.1
48,
005
185
5
4,62
2 1
79
1969
. . .
. . .
. . .
. . .
. .
56,
248
100
.0
13 .
6 1
0 .1
10 .
6 1
8 .1
24 .
9 1
2 .7
7 .4
1
.5
1 .1
4
8,47
6 1
77
54,
805
183
19
68 . .
. . .
. . .
. . .
. . .
5
5,39
4 1
00 .0
1
3 .8
10 .
6 1
1 .5
19 .
1 2
4 .8
11 .
9 6
.3
1 .2
0
.9
46,
630
174
5
2,48
9 1
74
1967
19 .
. . . .
. . . .
. . .
54,
188
100
.0
15 .
1 1
0 .8
11 .
4 2
0 .6
23 .
8 1
0 .5
5 .5
1
.4
1 .0
4
4,77
4 1
62
49,
775
168
S
ee fo
otno
tes
at e
nd o
f tab
le .
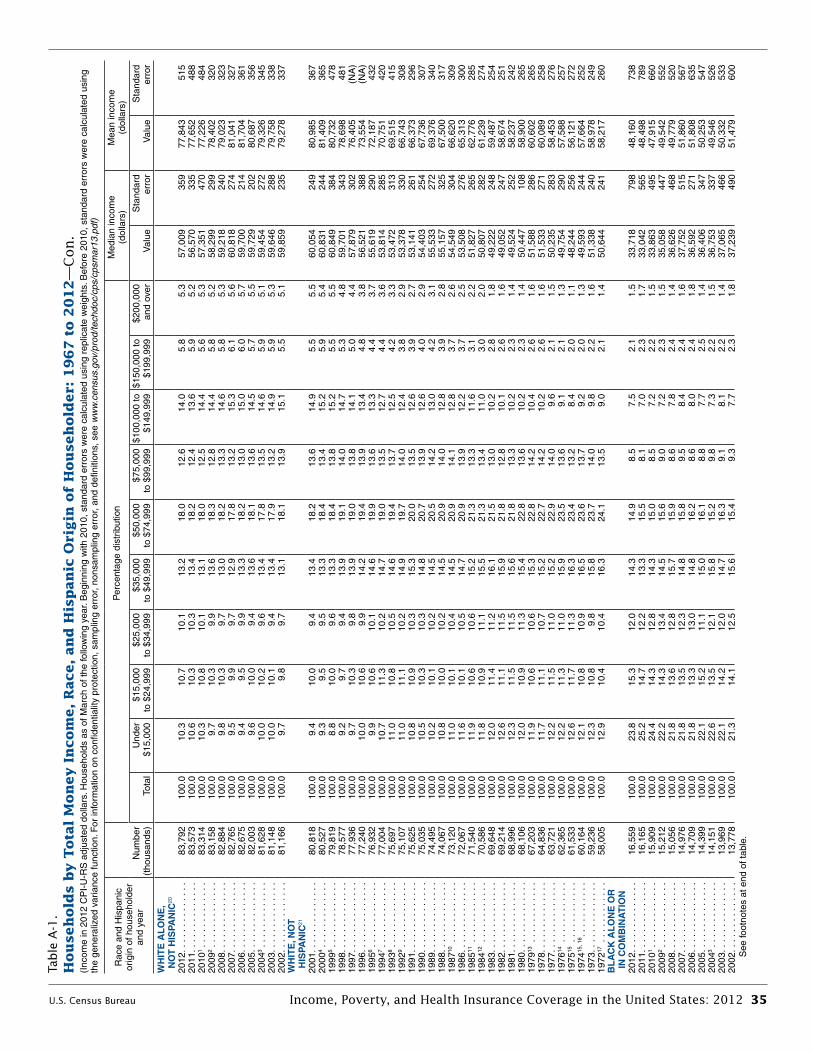
U.S. Census Bureau Income, Poverty, and Health Insurance Coverage in the United States: 2012 35
Table
A-1
.H
ou
seh
old
s b
y T
ota
l M
on
ey I
ncom
e, R
ace, an
d H
isp
an
ic o
rigin
of
Hou
seh
old
er:
19
67
to 2
01
2—
Con
.(I
ncom
e in
201
2 C
PI-
U-R
S a
djus
ted
dolla
rs . H
ouse
hold
s as
of M
arch
of t
he fo
llow
ing
year
. Beg
inni
ng w
ith 2
010,
sta
ndar
d er
rors
wer
e ca
lcul
ated
usi
ng r
eplic
ate
wei
ghts
. Bef
ore
2010
, sta
ndar
d er
rors
wer
e ca
lcul
ated
usi
ng
the
gene
raliz
ed v
aria
nce
func
tion .
For
info
rmat
ion
on c
onfid
entia
lity
prot
ectio
n, s
ampl
ing
erro
r, no
nsam
plin
g er
ror,
and
defin
ition
s, s
ee w
ww
.cen
sus.
gov/
prod
/tech
doc/
cps/
cpsm
ar13
)
Rac
e an
d H
ispa
nic
orig
in o
f hou
seho
lder
an
d ye
arN
umbe
r (t
hous
ands
)
Per
cent
age
dist
ribut
ion
Med
ian
inco
me
(dol
lars
)M
ean
inco
me
(dol
lars
)
Tota
lU
nder
$1
5,00
0$1
5,00
0 to
$24
,999
$25,
000
to $
34,9
99$3
5,00
0 to
$49
,999
$50,
000
to $
74,9
99$7
5,00
0 to
$99
,999
$100
,000
to
$149
,999
$150
,000
to
$199
,999
$200
,000
an
d ov
erV
alue
Sta
ndar
d er
ror
Val
ueS
tand
ard
erro
r
WH
ITE
AL
ON
E,
NO
T H
ISPA
NIC
20
2012
. . .
. . .
. . .
. . .
. .
83,
792
100
.0
10 .
3 1
0 .7
10 .
1 1
3 .2
18 .
0 1
2 .6
14 .
0 5
.8
5 .3
5
7,00
9 3
59
77,
843
515
20
11 . .
. . .
. . .
. . .
. . .
8
3,57
3 1
00 .0
1
0 .6
10 .
3 1
0 .3
13 .
4 1
8 .2
12 .
4 1
3 .6
5 .9
5
.2
56,
570
335
7
7,65
2 4
88
2010
1 . . .
. . . .
. . . .
. . 8
3,31
4 1
00 .0
1
0 .3
10 .
8 1
0 .1
13 .
1 1
8 .0
12 .
5 1
4 .4
5 .6
5
.3
57,
351
470
7
7,22
6 4
84
2009
2 . . .
. . . .
. . . .
. . 8
3,15
8 1
00 .0
9
.7
10 .
3 9
.9
13 .
6 1
8 .3
12 .
8 1
4 .4
5 .8
5
.2
58,
299
299
7
8,40
2 3
20
2008
. . .
. . .
. . .
. . .
. .
82,
884
100
.0
9 .8
1
0 .3
9 .7
1
3 .0
18 .
2 1
3 .3
14 .
6 5
.8
5 .3
5
9,21
8 2
40
79,
023
323
20
07 . .
. . .
. . .
. . .
. . .
8
2,76
5 1
00 .0
9
.5
9 .9
9
.7
12 .
9 1
7 .8
13 .
2 1
5 .3
6 .1
5
.6
60,
818
274
8
1,04
1 3
27
2006
. . .
. . .
. . .
. . .
. .
82,
675
100
.0
9 .4
9
.5
9 .9
1
3 .3
18 .
2 1
3 .0
15 .
0 6
.0
5 .7
5
9,70
0 2
14
81,
704
361
20
05 . .
. . .
. . .
. . .
. . .
8
2,00
3 1
00 .0
9
.6
10 .
0 9
.4
13 .
6 1
8 .1
13 .
6 1
4 .5
5 .7
5
.5
59,
729
202
8
0,68
7 3
56
2004
3 . . .
. . . .
. . . .
. . 8
1,62
8 1
00 .0
1
0 .0
10 .
2 9
.6
13 .
4 1
7 .8
13 .
5 1
4 .6
5 .9
5
.1
59,
454
272
7
9,32
6 3
45
2003
. . .
. . .
. . .
. . .
. .
81,
148
100
.0
10 .
0 1
0 .1
9 .4
1
3 .4
17 .
9 1
3 .2
14 .
9 5
.9
5 .3
5
9,64
6 2
88
79,
758
338
20
02 . .
. . .
. . .
. . .
. . .
8
1,16
6 1
00 .0
9
.7
9 .8
9
.7
13 .
1 1
8 .1
13 .
9 1
5 .1
5 .5
5
.1
59,
859
235
7
9,27
8 3
37
WH
ITE
, NO
T
HIS
PAN
IC21
2001
. . .
. . .
. . .
. . .
. .
80,
818
100
.0
9 .4
1
0 .0
9 .4
1
3 .4
18 .
2 1
3 .6
14 .
9 5
.5
5 .5
6
0,05
4 2
49
80,
985
367
20
004 .
. . . .
. . . .
. . . .
80,
527
100
.0
9 .3
9
.5
9 .5
1
3 .3
18 .
4 1
3 .4
15 .
2 5
.9
5 .4
6
0,83
1 2
44
81,
409
365
19
995 .
. . . .
. . . .
. . . .
79,
819
100
.0
8 .8
1
0 .0
9 .6
1
3 .3
18 .
4 1
3 .8
15 .
2 5
.5
5 .5
6
0,84
9 3
84
80,
732
478
19
98 . .
. . .
. . .
. . .
. . .
7
8,57
7 1
00 .0
9
.2
9 .7
9
.4
13 .
9 1
9 .1
14 .
0 1
4 .7
5 .3
4
.8
59,
701
343
7
8,69
8 4
81
1997
. . .
. . .
. . .
. . .
. .
77,
936
100
.0
9 .7
1
0 .3
9 .8
1
3 .9
19 .
0 1
3 .8
14 .
1 5
.0
4 .4
5
7,87
9 3
02
76,
405
(N
A)
1996
. . .
. . .
. . .
. . .
. .
77,
240
100
.0
10 .
0 1
0 .6
9 .9
1
4 .2
19 .
4 1
3 .9
13 .
4 4
.8
3 .8
5
6,52
1 3
88
73,
554
(N
A)
1995
6 . . .
. . . .
. . . .
. . 7
6,93
2 1
00 .0
9
.9
10 .
6 1
0 .1
14 .
6 1
9 .9
13 .
6 1
3 .3
4 .4
3
.7
55,
619
290
7
2,18
7 4
32
1994
7 . . .
. . . .
. . . .
. . 7
7,00
4 1
00 .0
1
0 .7
11 .
3 1
0 .2
14 .
7 1
9 .0
13 .
5 1
2 .7
4 .4
3
.6
53,
814
285
7
0,75
1 4
20
1993
8 . . .
. . . .
. . . .
. . 7
5,69
7 1
00 .0
1
1 .0
10 .
8 1
0 .5
14 .
6 1
9 .4
13 .
7 1
2 .5
4 .2
3
.3
53,
472
313
6
9,51
5 4
15
1992
9 . . .
. . . .
. . . .
. . 7
5,10
7 1
00 .0
1
1 .0
11 .
1 1
0 .2
14 .
9 1
9 .7
14 .
0 1
2 .4
3 .8
2
.9
53,
378
330
6
6,74
3 3
08
1991
. . .
. . .
. . .
. . .
. .
75,
625
100
.0
10 .
8 1
0 .9
10 .
3 1
5 .3
20 .
0 1
3 .5
12 .
6 3
.9
2 .7
5
3,14
1 2
61
66,
373
296
19
90 . .
. . .
. . .
. . .
. . .
7
5,03
5 1
00 .0
1
0 .5
10 .
3 1
0 .3
14 .
8 2
0 .7
13 .
9 1
2 .6
4 .0
2
.9
54,
403
254
6
7,73
6 3
07
1989
. . .
. . .
. . .
. . .
. .
74,
495
100
.0
10 .
2 1
0 .1
10 .
2 1
4 .5
20 .
5 1
4 .2
13 .
0 4
.2
3 .1
5
5,53
3 2
72
69,
376
340
19
88 . .
. . .
. . .
. . .
. . .
7
4,06
7 1
00 .0
1
0 .8
10 .
0 1
0 .2
14 .
5 2
0 .9
14 .
0 1
2 .8
3 .9
2
.8
55,
157
325
6
7,50
0 3
17
1987
10 .
. . . .
. . . .
. . .
73,
120
100
.0
11 .
0 1
0 .1
10 .
4 1
4 .5
20 .
9 1
4 .1
12 .
8 3
.7
2 .6
5
4,54
9 3
04
66,
620
309
19
86 . .
. . .
. . .
. . .
. . .
7
2,06
7 1
00 .0
1
1 .6
10 .
1 1
0 .5
14 .
7 2
0 .9
13 .
9 1
2 .2
3 .7
2
.5
53,
508
276
6
5,31
3 3
00
1985
11 .
. . . .
. . . .
. . .
71,
540
100
.0
11 .
9 1
0 .6
10 .
6 1
5 .2
21 .
3 1
3 .3
11 .
6 3
.1
2 .2
5
1,82
7 2
65
62,
776
285
19
8412
. . .
. . . .
. . . .
. 7
0,58
6 1
00 .0
1
1 .8
10 .
9 1
1 .1
15 .
5 2
1 .3
13 .
4 1
1 .0
3 .0
2
.0
50,
807
282
6
1,23
9 2
74
1983
. . .
. . .
. . .
. . .
. .
69,
648
100
.0
12 .
0 1
1 .4
11 .
2 1
6 .1
21 .
5 1
3 .0
10 .
2 2
.8
1 .8
4
9,22
2 2
48
59,
487
254
19
82 . .
. . .
. . .
. . .
. . .
6
9,21
4 1
00 .0
1
2 .6
11 .
1 1
1 .5
15 .
9 2
1 .8
12 .
8 1
0 .1
2 .6
1
.6
49,
052
247
5
8,67
4 2
51
1981
. . .
. . .
. . .
. . .
. .
68,
996
100
.0
12 .
3 1
1 .5
11 .
5 1
5 .6
21 .
8 1
3 .3
10 .
2 2
.3
1 .4
4
9,52
4 2
52
58,
237
242
19
80 . .
. . .
. . .
. . .
. . .
6
8,10
6 1
00 .0
1
2 .0
10 .
9 1
1 .3
15 .
4 2
2 .8
13 .
6 1
0 .2
2 .3
1
.4
50,
447
108
5
8,90
0 2
65
1979
13 .
. . . .
. . . .
. . .
67,
203
100
.0
11 .
9 1
0 .6
10 .
6 1
5 .3
22 .
8 1
4 .2
10 .
4 2
.6
1 .6
5
1,58
8 2
86
60,
602
265
19
78 . .
. . .
. . .
. . .
. . .
6
4,83
6 1
00 .0
1
1 .7
11 .
1 1
0 .7
15 .
2 2
2 .7
14 .
2 1
0 .2
2 .6
1
.6
51,
533
271
6
0,08
9 2
58
1977
. . .
. . .
. . .
. . .
. .
63,
721
100
.0
12 .
2 1
1 .5
11 .
0 1
5 .2
22 .
9 1
4 .0
9 .6
2
.1
1 .5
5
0,23
5 2
83
58,
453
276
19
7614
. . .
. . . .
. . . .
. 6
2,36
5 1
00 .0
1
2 .2
11 .
3 1
1 .0
15 .
9 2
3 .5
13 .
6 9
.1
2 .1
1
.3
49,
754
290
5
7,58
8 2
57
1975
15 .
. . . .
. . . .
. . .
61,
533
100
.0
12 .
6 1
1 .7
11 .
3 1
6 .3
23 .
4 1
3 .2
8 .4
2
.0
1 .1
4
8,24
4 2
56
56,
121
272
19
7415
, 16 .
. . . .
. . . .
. . 6
0,16
4 1
00 .0
1
2 .1
10 .
8 1
0 .9
16 .
5 2
3 .6
13 .
7 9
.2
2 .0
1
.3
49,
593
244
5
7,66
4 2
52
1973
. . .
. . .
. . .
. . .
. .
59,
236
100
.0
12 .
3 1
0 .8
9 .8
1
5 .8
23 .
7 1
4 .0
9 .8
2
.2
1 .6
5
1,33
8 2
40
58,
978
249
19
7217
. . .
. . . .
. . . .
. 5
8,00
5 1
00 .0
1
2 .9
10 .
4 1
0 .4
16 .
3 2
4 .1
13 .
5 9
.0
2 .1
1
.4
50,
644
241
5
8,21
7 2
60
BL
AC
K A
LO
NE
OR
I
N C
OM
BIN
AT
ION
2012
. . .
. . .
. . .
. . .
. .
16,
559
100
.0
23 .
8 1
5 .3
12 .
0 1
4 .3
14 .
9 8
.5
7 .5
2
.1
1 .5
3
3,71
8 7
98
48,
160
738
20
11 . .
. . .
. . .
. . .
. . .
1
6,16
5 1
00 .0
2
5 .2
14 .
7 1
2 .2
13 .
3 1
5 .5
8 .1
7
.0
2 .3
1
.7
33,
042
565
4
8,49
8 7
89
2010
1 . . .
. . . .
. . . .
. . 1
5,90
9 1
00 .0
2
4 .4
14 .
3 1
2 .8
14 .
3 1
5 .0
8 .5
7
.2
2 .2
1
.5
33,
863
495
4
7,91
5 6
60
2009
2 . . .
. . . .
. . . .
. . 1
5,21
2 1
00 .0
2
2 .2
14 .
3 1
3 .4
14 .
5 1
5 .6
9 .0
7
.2
2 .3
1
.5
35,
058
447
4
9,54
2 5
52
2008
. . .
. . .
. . .
. . .
. .
15,
056
100
.0
21 .
8 1
3 .6
12 .
8 1
5 .7
15 .
9 8
.6
7 .8
2
.4
1 .4
3
6,62
6 4
68
49,
779
520
20
07 . .
. . .
. . .
. . .
. . .
1
4,97
6 1
00 .0
2
1 .8
13 .
5 1
2 .3
14 .
8 1
5 .8
9 .5
8
.4
2 .4
1
.6
37,
752
515
5
1,86
0 5
67
2006
. . .
. . .
. . .
. . .
. .
14,
709
100
.0
21 .
8 1
3 .3
13 .
0 1
4 .8
16 .
2 8
.6
8 .0
2
.4
1 .8
3
6,59
2 2
71
51,
808
635
20
05 . .
. . .
. . .
. . .
. . .
1
4,39
9 1
00 .0
2
2 .1
15 .
2 1
1 .1
15 .
0 1
6 .1
8 .8
7
.7
2 .5
1
.4
36,
406
347
5
0,25
3 5
47
2004
3 . . .
. . . .
. . . .
. . 1
4,15
1 1
00 .0
2
2 .6
13 .
5 1
2 .1
15 .
8 1
5 .2
9 .8
7
.3
2 .2
1
.5
36,
753
337
4
9,54
6 5
26
2003
. . .
. . .
. . .
. . .
. .
13,
969
100
.0
22 .
1 1
4 .2
12 .
0 1
4 .7
16 .
3 9
.1
8 .1
2
.2
1 .4
3
7,06
5 4
66
50,
332
533
20
02 . .
. . .
. . .
. . .
. . .
1
3,77
8 1
00 .0
2
1 .3
14 .
1 1
2 .5
15 .
6 1
5 .4
9 .3
7
.7
2 .3
1
.8
37,
239
490
5
1,47
9 6
00
See
foot
note
s at
end
of t
able
.

36 Income, Poverty, and Health Insurance Coverage in the United States: 2012 U.S. Census Bureau
Table
A-1
.H
ou
seh
old
s b
y T
ota
l M
on
ey I
ncom
e, R
ace, an
d H
isp
an
ic o
rigin
of
Hou
seh
old
er:
19
67
to 2
01
2—
Con
.(I
ncom
e in
201
2 C
PI-
U-R
S a
djus
ted
dolla
rs . H
ouse
hold
s as
of M
arch
of t
he fo
llow
ing
year
. Beg
inni
ng w
ith 2
010,
sta
ndar
d er
rors
wer
e ca
lcul
ated
usi
ng r
eplic
ate
wei
ghts
. Bef
ore
2010
, sta
ndar
d er
rors
wer
e ca
lcul
ated
usi
ng
the
gene
raliz
ed v
aria
nce
func
tion .
For
info
rmat
ion
on c
onfid
entia
lity
prot
ectio
n, s
ampl
ing
erro
r, no
nsam
plin
g er
ror,
and
defin
ition
s, s
ee w
ww
.cen
sus.
gov/
prod
/tech
doc/
cps/
cpsm
ar13
)
Rac
e an
d H
ispa
nic
orig
in o
f hou
seho
lder
an
d ye
arN
umbe
r (t
hous
ands
)
Per
cent
age
dist
ribut
ion
Med
ian
inco
me
(dol
lars
)M
ean
inco
me
(dol
lars
)
Tota
lU
nder
$1
5,00
0$1
5,00
0 to
$24
,999
$25,
000
to $
34,9
99$3
5,00
0 to
$49
,999
$50,
000
to $
74,9
99$7
5,00
0 to
$99
,999
$100
,000
to
$149
,999
$150
,000
to
$199
,999
$200
,000
an
d ov
erV
alue
Sta
ndar
d er
ror
Val
ueS
tand
ard
erro
r
BL
AC
K A
LO
NE
22
2012
. . .
. . .
. . .
. . .
. .
15,
872
100
.0
24 .
0 1
5 .5
12 .
0 1
4 .3
15 .
0 8
.5
7 .3
2
.1
1 .5
3
3,32
1 7
90
47,
737
753
20
11 . .
. . .
. . .
. . .
. . .
1
5,58
3 1
00 .0
2
5 .3
14 .
7 1
2 .3
13 .
3 1
5 .5
8 .1
6
.9
2 .3
1
.6
32,
902
520
4
8,24
2 8
20
2010
1 . . .
. . . .
. . . .
. . 1
5,26
5 1
00 .0
2
4 .6
14 .
2 1
2 .6
14 .
3 1
5 .2
8 .4
7
.1
2 .1
1
.4
33,
830
525
4
7,34
4 6
59
2009
2 . . .
. . . .
. . . .
. . 1
4,73
0 1
00 .0
2
2 .3
14 .
4 1
3 .5
14 .
5 1
5 .5
9 .0
7
.2
2 .3
1
.4
34,
880
422
4
9,29
1 5
62
2008
. . .
. . .
. . .
. . .
. .
14,
595
100
.0
22 .
0 1
3 .6
12 .
8 1
5 .7
16 .
0 8
.6
7 .7
2
.3
1 .4
3
6,49
1 4
70
49,
623
531
20
07 . .
. . .
. . .
. . .
. . .
1
4,55
1 1
00 .0
2
1 .8
13 .
5 1
2 .4
14 .
7 1
5 .9
9 .6
8
.3
2 .3
1
.5
37,
558
526
5
1,63
9 5
76
2006
. . .
. . .
. . .
. . .
. .
14,
354
100
.0
22 .
0 1
3 .4
13 .
1 1
4 .7
16 .
1 8
.7
7 .9
2
.3
1 .8
3
6,40
6 2
74
51,
391
635
20
05 . .
. . .
. . .
. . .
. . .
1
4,00
2 1
00 .0
2
2 .2
15 .
3 1
1 .2
15 .
1 1
6 .1
8 .8
7
.6
2 .5
1
.3
36,
293
354
4
9,93
2 5
42
2004
3 . . .
. . . .
. . . .
. . 1
3,80
9 1
00 .0
2
2 .8
13 .
6 1
2 .2
15 .
9 1
5 .0
9 .8
7
.2
2 .2
1
.5
36,
583
380
4
9,39
2 5
35
2003
. . .
. . .
. . .
. . .
. .
13,
629
100
.0
22 .
2 1
4 .2
11 .
9 1
4 .8
16 .
3 9
.0
8 .1
2
.2
1 .3
3
7,01
0 4
82
50,
101
537
20
02 . .
. . .
. . .
. . .
. . .
1
3,46
5 1
00 .0
2
1 .3
14 .
1 1
2 .6
15 .
6 1
5 .3
9 .4
7
.6
2 .3
1
.7
37,
046
499
5
1,06
6 5
90
BL
AC
K21
2001
. . .
. . .
. . .
. . .
. .
13,
315
100
.0
20 .
7 1
3 .6
12 .
0 1
5 .3
16 .
8 1
0 .1
8 .1
2
.0
1 .3
3
8,22
0 4
50
50,
902
537
20
004 .
. . . .
. . . .
. . . .
13,
174
100
.0
19 .
4 1
3 .4
13 .
1 1
4 .3
18 .
0 9
.3
8 .6
2
.6
1 .3
3
9,55
6 5
24
52,
237
529
19
995 .
. . . .
. . . .
. . . .
12,
838
100
.0
20 .
4 1
3 .7
12 .
2 1
4 .2
16 .
4 9
.9
8 .6
3
.2
1 .5
3
8,46
0 7
17
53,
001
761
19
98 . .
. . .
. . .
. . .
. . .
1
2,57
9 1
00 .0
2
3 .0
14 .
3 1
2 .0
15 .
1 1
5 .7
8 .9
7
.7
2 .1
1
.1
35,
663
558
4
8,02
5 6
41
1997
. . .
. . .
. . .
. . .
. .
12,
474
100
.0
22 .
9 1
4 .1
12 .
5 1
5 .2
16 .
7 9
.4
6 .6
1
.8
1 .0
3
5,73
1 6
15
47,
018
675
19
96 . .
. . .
. . .
. . .
. . .
1
2,10
9 1
00 .0
2
4 .3
14 .
5 1
2 .4
14 .
4 1
5 .9
9 .7
6
.4
1 .5
1
.0
34,
218
673
4
7,30
1 9
24
1995
6 . . .
. . . .
. . . .
. . 1
1,57
7 1
00 .0
2
4 .5
15 .
3 1
1 .8
15 .
0 1
6 .4
8 .0
6
.8
1 .4
0
.9
33,
500
571
4
5,47
9 7
78
1994
7 . . .
. . . .
. . . .
. . 1
1,65
5 1
00 .0
2
6 .1
15 .
4 1
1 .8
14 .
3 1
4 .9
8 .4
6
.5
1 .7
1
.0
32,
214
599
4
4,82
6 6
43
1993
8 . . .
. . . .
. . . .
. . 1
1,28
1 1
00 .0
2
7 .7
15 .
2 1
2 .7
14 .
3 1
4 .2
7 .6
6
.0
1 .4
0
.8
30,
564
604
4
2,60
6 7
07
1992
9 . . .
. . . .
. . . .
. . 1
1,26
9 1
00 .0
2
8 .6
15 .
7 1
1 .4
14 .
6 1
4 .8
8 .0
5
.1
1 .2
0
.6
30,
072
614
4
0,80
7 5
53
1991
. . .
. . .
. . .
. . .
. .
11,
083
100
.0
28 .
9 1
4 .5
11 .
5 1
4 .3
15 .
9 7
.6
5 .4
1
.4
0 .5
3
0,92
0 6
49
41,
173
538
19
90 . .
. . .
. . .
. . .
. . .
1
0,67
1 1
00 .0
2
7 .4
14 .
6 1
1 .9
14 .
0 1
6 .1
8 .3
5
.8
1 .4
0
.6
31,
806
725
4
2,25
9 5
71
1989
. . .
. . .
. . .
. . .
. .
10,
486
100
.0
26 .
9 1
4 .3
11 .
8 1
4 .3
16 .
0 8
.1
6 .5
1
.5
0 .5
3
2,33
1 6
58
42,
901
583
19
88 . .
. . .
. . .
. . .
. . .
1
0,56
1 1
00 .0
2
8 .4
15 .
1 1
1 .6
14 .
2 1
4 .6
8 .0
6
.0
1 .5
0
.6
30,
600
638
4
1,92
1 6
12
1987
10 .
. . . .
. . . .
. . .
10,
192
100
.0
28 .
7 1
4 .8
12 .
4 1
4 .8
14 .
3 7
.9
5 .1
1
.3
0 .6
3
0,30
2 5
80
40,
915
563
19
86 . .
. . .
. . .
. . .
. . .
9
,922
1
00 .0
2
8 .7
14 .
8 1
2 .3
14 .
5 1
5 .1
7 .7
5
.2
1 .2
0
.5
30,
142
592
4
0,44
0 5
50
1985
11 .
. . . .
. . . .
. . .
9,7
97
100
.0
28 .
0 1
5 .9
13 .
0 1
4 .0
15 .
4 7
.6
4 .9
0
.9
0 .3
3
0,15
7 5
86
39,
347
511
19
8412
. . .
. . . .
. . . .
. 9
,480
1
00 .0
2
8 .6
16 .
8 1
3 .3
14 .
4 1
3 .9
7 .4
4
.7
0 .8
0
.2
28,
355
545
3
7,81
6 4
65
1983
. . .
. . .
. . .
. . .
. .
9,2
36
100
.0
29 .
8 1
6 .5
13 .
4 1
4 .2
14 .
4 6
.9
4 .3
0
.5
0 .1
2
7,23
2 5
11
36,
220
447
19
82 . .
. . .
. . .
. . .
. . .
8
,916
1
00 .0
2
9 .6
16 .
9 1
3 .0
14 .
4 1
5 .5
6 .8
3
.1
0 .4
0
.2
27,
342
439
3
5,97
5 4
50
1981
. . .
. . .
. . .
. . .
. .
8,9
61
100
.0
29 .
7 1
7 .2
13 .
5 1
3 .9
14 .
8 6
.9
3 .5
0
.4
0 .1
2
7,39
5 4
60
35,
987
436
19
80 . .
. . .
. . .
. . .
. . .
8
,847
1
00 .0
2
8 .0
17 .
2 1
3 .8
14 .
0 1
5 .2
7 .2
3
.9
0 .6
0
.2
28,
557
539
3
7,06
3 4
56
1979
13 .
. . . .
. . . .
. . .
8,5
86
100
.0
27 .
0 1
6 .4
13 .
4 1
4 .5
15 .
9 7
.7
4 .4
0
.4
0 .2
2
9,86
8 5
45
38,
324
472
19
78 . .
. . .
. . .
. . .
. . .
8
,066
1
00 .0
2
6 .8
16 .
0 1
3 .3
14 .
9 1
6 .2
7 .4
4
.7
0 .7
0
.1
30,
396
643
3
8,84
6 5
07
1977
. . .
. . .
. . .
. . .
. .
7,9
77
100
.0
26 .
2 1
8 .7
14 .
0 1
4 .6
15 .
4 6
.8
3 .7
0
.4
0 .3
2
9,06
8 3
90
37,
244
331
19
7614
. . .
. . . .
. . . .
. 7
,776
1
00 .0
2
6 .6
17 .
6 1
3 .3
15 .
2 1
6 .7
6 .9
3
.2
0 .3
0
.2
28,
994
360
3
7,04
4 3
30
1975
15 .
. . . .
. . . .
. . .
7,4
89
100
.0
27 .
5 1
7 .6
13 .
3 1
6 .2
15 .
7 6
.2
3 .0
0
.4
Z
28,
745
423
3
5,88
1 3
18
1974
15, 1
6 . . .
. . . .
. . . .
7,2
63
100
.0
26 .
1 1
6 .8
15 .
3 1
5 .8
15 .
7 7
.0
2 .9
0
.3
0 .1
2
9,24
4 3
53
36,
370
323
19
73 . .
. . .
. . .
. . .
. . .
7
,040
1
00 .0
2
5 .2
18 .
0 1
3 .3
15 .
8 1
7 .4
6 .1
3
.4
0 .6
0
.2
29,
955
467
3
7,19
8 3
70
1972
17 .
. . . .
. . . .
. . .
6,8
09
100
.0
27 .
1 1
7 .4
13 .
9 1
6 .0
15 .
1 7
.1
2 .6
0
.4
0 .3
2
9,14
5 4
37
36,
817
393
19
7118
. . .
. . . .
. . . .
. 6
,578
1
00 .0
2
7 .8
17 .
4 1
4 .4
16 .
3 1
5 .3
5 .8
2
.6
0 .3
0
.1
28,
199
420
3
4,94
3 3
59
1970
. . .
. . .
. . .
. . .
. .
6,1
80
100
.0
27 .
1 1
6 .6
15 .
4 1
6 .0
15 .
7 5
.9
2 .8
0
.4
0 .2
2
9,21
9 4
01
35,
678
385
19
69 . .
. . .
. . .
. . .
. . .
6
,053
1
00 .0
2
6 .4
17 .
6 1
5 .8
17 .
1 1
5 .2
5 .2
2
.3
0 .3
0
.1
29,
302
432
3
4,88
3 3
71
1968
. . .
. . .
. . .
. . .
. .
5,8
70
100
.0
27 .
1 1
9 .2
15 .
8 1
6 .4
13 .
8 5
.1
2 .2
0
.3
Z
27,
497
399
3
3,48
9 3
53
1967
19 .
. . . .
. . . .
. . .
5,7
28
100
.0
30 .
0 1
8 .9
15 .
6 1
6 .6
12 .
3 3
.9
2 .2
0
.3
0 .2
2
5,99
6 4
33
31,
238
349
S
ee fo
otno
tes
at e
nd o
f tab
le .
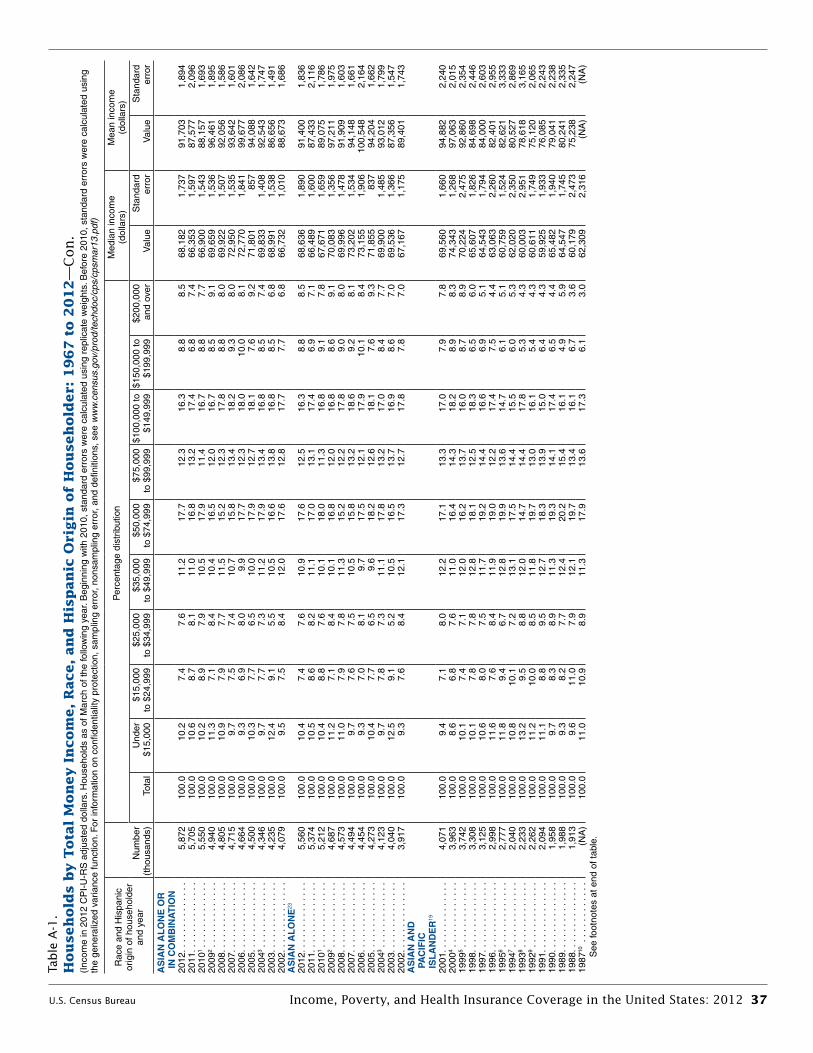
U.S. Census Bureau Income, Poverty, and Health Insurance Coverage in the United States: 2012 37
Table
A-1
.H
ou
seh
old
s b
y T
ota
l M
on
ey I
ncom
e, R
ace, an
d H
isp
an
ic o
rigin
of
Hou
seh
old
er:
19
67
to 2
01
2—
Con
.(I
ncom
e in
201
2 C
PI-
U-R
S a
djus
ted
dolla
rs . H
ouse
hold
s as
of M
arch
of t
he fo
llow
ing
year
. Beg
inni
ng w
ith 2
010,
sta
ndar
d er
rors
wer
e ca
lcul
ated
usi
ng r
eplic
ate
wei
ghts
. Bef
ore
2010
, sta
ndar
d er
rors
wer
e ca
lcul
ated
usi
ng
the
gene
raliz
ed v
aria
nce
func
tion .
For
info
rmat
ion
on c
onfid
entia
lity
prot
ectio
n, s
ampl
ing
erro
r, no
nsam
plin
g er
ror,
and
defin
ition
s, s
ee w
ww
.cen
sus.
gov/
prod
/tech
doc/
cps/
cpsm
ar13
)
Rac
e an
d H
ispa
nic
orig
in o
f hou
seho
lder
an
d ye
arN
umbe
r (t
hous
ands
)
Per
cent
age
dist
ribut
ion
Med
ian
inco
me
(dol
lars
)M
ean
inco
me
(dol
lars
)
Tota
lU
nder
$1
5,00
0$1
5,00
0 to
$24
,999
$25,
000
to $
34,9
99$3
5,00
0 to
$49
,999
$50,
000
to $
74,9
99$7
5,00
0 to
$99
,999
$100
,000
to
$149
,999
$150
,000
to
$199
,999
$200
,000
an
d ov
erV
alue
Sta
ndar
d er
ror
Val
ueS
tand
ard
erro
r
AS
IAN
AL
ON
E O
R
IN
CO
MB
INA
TIO
N20
12 . .
. . .
. . .
. . .
. . .
5
,872
1
00 .0
1
0 .2
7 .4
7
.6
11 .
2 1
7 .7
12 .
3 1
6 .3
8 .8
8
.5
68,
182
1,7
37
91,
703
1,8
94
2011
. . .
. . .
. . .
. . .
. .
5,7
05
100
.0
10 .
6 8
.7
8 .1
1
1 .0
16 .
8 1
3 .2
17 .
4 6
.8
7 .4
6
6,35
3 1
,597
8
7,57
7 2
,096
20
101 .
. . . .
. . . .
. . . .
5,5
50
100
.0
10 .
2 8
.9
7 .9
1
0 .5
17 .
9 1
1 .4
16 .
7 8
.8
7 .7
6
6,90
0 1
,543
8
8,15
7 1
,693
20
092 .
. . . .
. . . .
. . . .
4,9
40
100
.0
11 .
3 7
.1
8 .4
1
0 .4
16 .
5 1
2 .0
16 .
7 8
.5
9 .1
6
9,65
9 1
,536
9
6,46
1 1
,895
20
08 . .
. . .
. . .
. . .
. . .
4
,805
1
00 .0
1
0 .9
7 .9
7
.7
11 .
5 1
5 .2
12 .
3 1
7 .8
8 .8
8
.0
69,
922
1,5
07
92,
056
1,5
86
2007
. . .
. . .
. . .
. . .
. .
4,7
15
100
.0
9 .7
7
.5
7 .4
1
0 .7
15 .
8 1
3 .4
18 .
2 9
.3
8 .0
7
2,95
0 1
,535
9
3,64
2 1
,601
20
06 . .
. . .
. . .
. . .
. . .
4
,664
1
00 .0
9
.3
6 .9
8
.0
9 .9
1
7 .7
12 .
3 1
8 .0
10 .
0 8
.1
72,
770
1,8
41
99,
677
2,0
86
2005
. . .
. . .
. . .
. . .
. .
4,5
00
100
.0
10 .
3 7
.7
6 .5
1
0 .0
17 .
9 1
2 .7
18 .
1 7
.6
9 .2
7
1,80
1 8
57
94,
088
1,6
42
2004
3 . . .
. . . .
. . . .
. . 4
,346
1
00 .0
9
.7
7 .7
7
.3
11 .
2 1
7 .9
13 .
4 1
6 .8
8 .5
7
.4
69,
833
1,4
08
92,
543
1,7
47
2003
. . .
. . .
. . .
. . .
. .
4,2
35
100
.0
12 .
4 9
.1
5 .5
1
0 .5
16 .
6 1
3 .8
16 .
8 8
.5
6 .8
6
8,99
1 1
,538
8
6,65
6 1
,491
20
02 . .
. . .
. . .
. . .
. . .
4
,079
1
00 .0
9
.5
7 .5
8
.4
12 .
0 1
7 .6
12 .
8 1
7 .7
7 .7
6
.8
66,
732
1,0
10
88,
673
1,6
86
AS
IAN
AL
ON
E23
2012
. . .
. . .
. . .
. . .
. .
5,5
60
100
.0
10 .
4 7
.4
7 .6
1
0 .9
17 .
6 1
2 .5
16 .
3 8
.8
8 .5
6
8,63
6 1
,890
9
1,40
0 1
,836
20
11 . .
. . .
. . .
. . .
. . .
5
,374
1
00 .0
1
0 .5
8 .6
8
.2
11 .
1 1
7 .0
13 .
1 1
7 .4
6 .9
7
.1
66,
489
1,6
00
87,
433
2,1
16
2010
1 . . .
. . . .
. . . .
. . 5
,212
1
00 .0
1
0 .4
8 .8
7
.6
10 .
1 1
8 .0
11 .
3 1
6 .8
9 .1
7
.8
67,
671
1,6
59
89,
075
1,7
86
2009
2 . . .
. . . .
. . . .
. . 4
,687
1
00 .0
1
1 .2
7 .1
8
.4
10 .
1 1
6 .8
12 .
0 1
6 .8
8 .6
9
.1
70,
083
1,3
56
97,
211
1,9
75
2008
. . .
. . .
. . .
. . .
. .
4,5
73
100
.0
11 .
0 7
.9
7 .8
1
1 .3
15 .
2 1
2 .2
17 .
8 9
.0
8 .0
6
9,99
6 1
,478
9
1,90
9 1
,603
20
07 . .
. . .
. . .
. . .
. . .
4
,494
1
00 .0
9
.7
7 .6
7
.5
10 .
5 1
5 .8
13 .
2 1
8 .6
9 .2
8
.1
73,
202
1,5
34
94,
148
1,6
61
2006
. . .
. . .
. . .
. . .
. .
4,4
54
100
.0
9 .3
7
.0
8 .1
9
.7
17 .
5 1
2 .1
17 .
9 1
0 .1
8 .4
7
3,15
5 1
,906
1
00,5
48
2,1
64
2005
. . .
. . .
. . .
. . .
. .
4,2
73
100
.0
10 .
4 7
.7
6 .5
9
.6
18 .
2 1
2 .6
18 .
1 7
.6
9 .3
7
1,85
5 8
37
94,
204
1,6
62
2004
3 . . .
. . . .
. . . .
. . 4
,123
1
00 .0
9
.7
7 .8
7
.3
11 .
1 1
7 .8
13 .
2 1
7 .0
8 .4
7
.7
69,
900
1,4
85
93,
012
1,7
99
2003
. . .
. . .
. . .
. . .
. .
4,0
40
100
.0
12 .
5 9
.1
5 .2
1
0 .5
16 .
5 1
3 .7
16 .
9 8
.6
7 .0
6
9,53
6 1
,366
8
7,35
6 1
,547
20
02 . .
. . .
. . .
. . .
. . .
3
,917
1
00 .0
9
.3
7 .6
8
.4
12 .
1 1
7 .3
12 .
7 1
7 .8
7 .8
7
.0
67,
167
1,1
75
89,
401
1,7
43
AS
IAN
AN
D
PA
CIF
IC
IS
LA
ND
ER
19
2001
. . .
. . .
. . .
. . .
. .
4,0
71
100
.0
9 .4
7
.1
8 .0
1
2 .2
17 .
1 1
3 .3
17 .
0 7
.9
7 .8
6
9,56
0 1
,660
9
4,88
2 2
,240
20
004 .
. . . .
. . . .
. . . .
3,9
63
100
.0
8 .6
6
.8
7 .6
1
1 .0
16 .
4 1
4 .3
18 .
2 8
.9
8 .3
7
4,34
3 1
,268
9
7,06
3 2
,015
19
995 .
. . . .
. . . .
. . . .
3,7
42
100
.0
10 .
1 7
.4
7 .1
1
2 .0
16 .
2 1
3 .7
16 .
0 8
.7
8 .9
7
0,22
4 2
,475
9
2,86
0 2
,354
19
98 . .
. . .
. . .
. . .
. . .
3
,308
1
00 .0
1
0 .1
7 .8
7
.8
12 .
8 1
8 .1
12 .
5 1
8 .3
6 .5
6
.0
65,
607
1,8
26
84,
698
2,4
46
1997
. . .
. . .
. . .
. . .
. .
3,1
25
100
.0
10 .
6 8
.0
7 .5
1
1 .7
19 .
2 1
4 .4
16 .
6 6
.9
5 .1
6
4,54
3 1
,794
8
4,00
0 2
,603
19
96 . .
. . .
. . .
. . .
. . .
2
,998
1
00 .0
1
1 .6
7 .6
8
.4
11 .
9 1
9 .0
12 .
2 1
7 .4
7 .5
4
.4
63,
063
2,2
60
82,
401
2,9
55
1995
6 . . .
. . . .
. . . .
. . 2
,777
1
00 .0
1
1 .8
9 .4
6
.7
12 .
8 1
9 .9
13 .
6 1
4 .7
6 .1
5
.1
60,
759
1,5
24
82,
621
3,3
33
1994
7 . . .
. . . .
. . . .
. . 2
,040
1
00 .0
1
0 .8
10 .
1 7
.2
13 .
1 1
7 .5
14 .
4 1
5 .5
6 .0
5
.3
62,
020
2,3
50
80,
527
2,8
69
1993
8 . . .
. . . .
. . . .
. . 2
,233
1
00 .0
1
3 .2
9 .5
8
.8
12 .
0 1
4 .7
14 .
4 1
7 .8
5 .3
4
.3
60,
003
2,9
51
78,
618
3,1
65
1992
9 . . .
. . . .
. . . .
. . 2
,262
1
00 .0
1
1 .2
10 .
0 8
.5
11 .
8 1
9 .7
13 .
0 1
6 .1
5 .4
4
.3
60,
611
1,7
49
75,
120
2,0
65
1991
. . .
. . .
. . .
. . .
. .
2,0
94
100
.0
11 .
1 8
.8
9 .5
1
2 .7
18 .
3 1
3 .9
15 .
0 6
.4
4 .3
5
9,92
5 1
,933
7
6,08
5 2
,243
19
90 . .
. . .
. . .
. . .
. . .
1
,958
1
00 .0
9
.7
8 .3
8
.9
11 .
3 1
9 .3
14 .
1 1
7 .4
6 .5
4
.4
65,
482
1,9
40
79,
041
2,2
38
1989
. . .
. . .
. . .
. . .
. .
1,9
88
100
.0
9 .3
8
.2
7 .7
1
2 .4
20 .
2 1
5 .4
16 .
1 4
.9
5 .9
6
4,54
7 1
,745
8
0,24
1 2
,335
19
88 . .
. . .
. . .
. . .
. . .
1
,913
1
00 .0
9
.6
11 .
0 7
.9
12 .
1 1
9 .7
13 .
4 1
6 .1
6 .7
3
.6
60,
179
2,4
73
75,
238
2,2
47
1987
10 .
. . . .
. . . .
. . .
(N
A)
100
.0
11 .
0 1
0 .9
8 .9
1
1 .3
17 .
9 1
3 .6
17 .
3 6
.1
3 .0
6
2,30
9 2
,316
(
NA
) (
NA
) S
ee fo
otno
tes
at e
nd o
f tab
le .

38 Income, Poverty, and Health Insurance Coverage in the United States: 2012 U.S. Census Bureau
Table
A-1
.H
ou
seh
old
s b
y T
ota
l M
on
ey I
ncom
e, R
ace, an
d H
isp
an
ic o
rigin
of
Hou
seh
old
er:
19
67
to 2
01
2—
Con
.(I
ncom
e in
201
2 C
PI-
U-R
S a
djus
ted
dolla
rs . H
ouse
hold
s as
of M
arch
of t
he fo
llow
ing
year
. Beg
inni
ng w
ith 2
010,
sta
ndar
d er
rors
wer
e ca
lcul
ated
usi
ng r
eplic
ate
wei
ghts
. Bef
ore
2010
, sta
ndar
d er
rors
wer
e ca
lcul
ated
usi
ng
the
gene
raliz
ed v
aria
nce
func
tion .
For
info
rmat
ion
on c
onfid
entia
lity
prot
ectio
n, s
ampl
ing
erro
r, no
nsam
plin
g er
ror,
and
defin
ition
s, s
ee w
ww
.cen
sus.
gov/
prod
/tech
doc/
cps/
cpsm
ar13
)
Rac
e an
d H
ispa
nic
orig
in o
f hou
seho
lder
an
d ye
arN
umbe
r (t
hous
ands
)
Per
cent
age
dist
ribut
ion
Med
ian
inco
me
(dol
lars
)M
ean
inco
me
(dol
lars
)
Tota
lU
nder
$1
5,00
0$1
5,00
0 to
$24
,999
$25,
000
to $
34,9
99$3
5,00
0 to
$49
,999
$50,
000
to $
74,9
99$7
5,00
0 to
$99
,999
$100
,000
to
$149
,999
$150
,000
to
$199
,999
$200
,000
an
d ov
erV
alue
Sta
ndar
d er
ror
Val
ueS
tand
ard
erro
r
(NA
) N
ot a
vaila
ble .
Z R
epre
sent
s or
rou
nds
to z
ero .
1 Im
plem
enta
tion
of C
ensu
s 20
10-b
ased
pop
ulat
ion
cont
rols
.2
Med
ian
inco
me
is c
alcu
late
d us
ing
$2,5
00 in
com
e in
terv
als .
Beg
inni
ng w
ith 2
009
inco
me
data
, the
Cen
sus
Bur
eau
expa
nded
the
uppe
r in
com
e in
terv
als
used
to c
alcu
late
med
ians
to $
250,
000
or m
ore .
Med
ians
falli
ng in
the
uppe
r op
en-e
nded
inte
rval
are
pl
ugge
d w
ith “
$250
,000
.” B
efor
e 20
09, t
he u
pper
ope
n-en
ded
inte
rval
was
$10
0,00
0 an
d a
plug
of “
$100
,000
” was
use
d .
3 D
ata
have
bee
n re
vise
d to
refl
ect a
cor
rect
ion
to th
e w
eigh
ts in
the
2005
AS
EC
.4
Impl
emen
tatio
n of
a 2
8,00
0 ho
useh
old
sam
ple
expa
nsio
n .5
Impl
emen
tatio
n of
Cen
sus
2000
-bas
ed p
opul
atio
n co
ntro
ls .
6 F
ull i
mpl
emen
tatio
n of
199
0 ce
nsus
-bas
ed s
ampl
e de
sign
and
met
ropo
litan
defi
nitio
ns, 7
,000
hou
seho
ld s
ampl
e re
duct
ion,
and
rev
ised
edi
ting
of r
espo
nses
on
race
.7
Intr
oduc
tion
of 1
990
cens
us s
ampl
e de
sign
.8
Dat
a co
llect
ion
met
hod
chan
ged
from
pap
er a
nd p
enci
l to
com
pute
r-as
sist
ed in
terv
iew
ing .
In a
dditi
on, t
he 1
994
AS
EC
was
rev
ised
to a
llow
for
the
codi
ng o
f diff
eren
t inc
ome
amou
nts
on s
elec
ted
ques
tionn
aire
item
s . L
imits
eith
er in
crea
sed
or d
ecre
ased
in
the
follo
win
g ca
tego
ries:
ear
ning
s lim
its in
crea
sed
to $
999,
999;
soc
ial s
ecur
ity li
mits
incr
ease
d to
$49
,999
; sup
plem
enta
l sec
urity
inco
me
and
publ
ic a
ssis
tanc
e lim
its in
crea
sed
to $
24,9
99; v
eter
ans’
ben
efits
lim
its in
crea
sed
to $
99,9
99; c
hild
sup
port
and
al
imon
y lim
its d
ecre
ased
to $
49,9
99 .
9 Im
plem
enta
tion
of 1
990
cens
us p
opul
atio
n co
ntro
ls .
10 Im
plem
enta
tion
of a
new
CP
S A
SE
C p
roce
ssin
g sy
stem
.11
Rec
ordi
ng o
f am
ount
s fo
r ea
rnin
gs fr
om lo
nges
t job
incr
ease
d to
$29
9,99
9 . F
ull i
mpl
emen
tatio
n of
198
0 ce
nsus
-bas
ed s
ampl
e de
sign
.12
Impl
emen
tatio
n of
His
pani
c po
pula
tion
wei
ghtin
g co
ntro
ls a
nd in
trod
uctio
n of
198
0 ce
nsus
-bas
ed s
ampl
e de
sign
.13
Impl
emen
tatio
n of
198
0 ce
nsus
pop
ulat
ion
cont
rols
. Que
stio
nnai
re e
xpan
ded
to s
how
27
poss
ible
val
ues
from
51
poss
ible
sou
rces
of i
ncom
e .14
Firs
t yea
r m
edia
ns w
ere
deriv
ed u
sing
bot
h P
aret
o an
d lin
ear
inte
rpol
atio
n . B
efor
e th
is y
ear,
all m
edia
ns w
ere
deriv
ed u
sing
line
ar in
terp
olat
ion .
15 S
ome
of th
ese
estim
ates
wer
e de
rived
usi
ng P
aret
o in
terp
olat
ion
and
may
diff
er fr
om p
ublis
hed
data
, whi
ch w
ere
deriv
ed u
sing
line
ar in
terp
olat
ion .
16 Im
plem
enta
tion
of a
new
CP
S A
SE
C p
roce
ssin
g sy
stem
. Que
stio
nnai
re e
xpan
ded
to a
sk 1
1 in
com
e qu
estio
ns .
17 F
ull i
mpl
emen
tatio
n of
197
0 ce
nsus
-bas
ed s
ampl
e de
sign
.18
Intr
oduc
tion
of 1
970
cens
us s
ampl
e de
sign
and
pop
ulat
ion
cont
rols
.19
Impl
emen
tatio
n of
new
CP
S A
SE
C p
roce
ssin
g sy
stem
.20
Beg
inni
ng w
ith th
e 20
03 C
PS
, res
pond
ents
wer
e al
low
ed to
cho
ose
one
or m
ore
race
s . W
hite
alo
ne r
efer
s to
peo
ple
who
rep
orte
d W
hite
and
did
not
rep
ort a
ny o
ther
rac
e ca
tego
ry . T
he u
se o
f thi
s si
ngle
-rac
e po
pula
tion
does
not
impl
y th
at it
is th
e pr
efer
red
met
hod
of p
rese
ntin
g or
ana
lyzi
ng th
e da
ta . T
he C
ensu
s B
urea
u us
es a
var
iety
of a
ppro
ache
s . In
form
atio
n on
peo
ple
who
rep
orte
d m
ore
than
one
rac
e, s
uch
as W
hite
an
d A
mer
ican
Indi
an a
nd A
lask
a N
ativ
e or
Asi
an a
nd
Bla
ck o
r A
fric
an A
mer
ican
, is
ava
ilabl
e fr
om C
ensu
s 20
10 th
roug
h A
mer
ican
Fac
tFin
der .
Abo
ut 2
.9 p
erce
nt o
f peo
ple
repo
rted
mor
e th
an o
ne r
ace
in C
ensu
s 20
10 .
21 F
or th
e ye
ar 2
001
and
earli
er, t
he C
PS
allo
wed
res
pond
ents
to r
epor
t onl
y on
e ra
ce g
roup
.22
Bla
ck a
lone
ref
ers
to p
eopl
e w
ho r
epor
ted
Bla
ck a
nd d
id n
ot r
epor
t any
oth
er r
ace
cate
gory
.23
Asi
an a
lone
ref
ers
to p
eopl
e w
ho r
epor
ted
Asi
an a
nd d
id n
ot r
epor
t any
oth
er r
ace
cate
gory
.24
Bec
ause
His
pani
cs m
ay b
e an
y ra
ce, d
ata
in th
is r
epor
t for
His
pani
cs o
verla
p w
ith d
ata
for
raci
al g
roup
s . B
eing
His
pani
c w
as r
epor
ted
by 1
4 .2
perc
ent o
f Whi
te h
ouse
hold
ers
who
rep
orte
d on
ly o
ne r
ace,
4 .6
per
cent
of B
lack
hou
seho
lder
s w
ho r
epor
ted
only
one
rac
e, a
nd 2
.6 p
erce
nt o
f Asi
an h
ouse
hold
ers
who
rep
orte
d on
ly o
ne r
ace .
Dat
a us
ers
shou
ld e
xerc
ise
caut
ion
whe
n in
terp
retin
g ag
greg
ate
resu
lts fo
r th
e H
ispa
nic
popu
latio
n an
d fo
r ra
ce g
roup
s be
caus
e th
ese
popu
latio
ns c
onsi
st o
f man
y di
stin
ct
grou
ps th
at d
iffer
in s
ocio
econ
omic
cha
ract
eris
tics,
cul
ture
, and
rec
ency
of i
mm
igra
tion .
Dat
a w
ere
first
col
lect
ed fo
r H
ispa
nics
in 1
972 .
Sou
rce:
U .S
. Cen
sus
Bur
eau,
Cur
rent
Pop
ulat
ion
Sur
vey,
196
8 th
roug
h 20
13 A
nnua
l Soc
ial a
nd E
cono
mic
Sup
plem
ents
.
Table
A-1
.H
ou
seh
old
s b
y T
ota
l M
on
ey I
ncom
e, R
ace, an
d H
isp
an
ic o
rigin
of
Hou
seh
old
er:
19
67
to 2
01
2—
Con
.(I
ncom
e in
201
2 C
PI-
U-R
S a
djus
ted
dolla
rs . H
ouse
hold
s as
of M
arch
of t
he fo
llow
ing
year
. Beg
inni
ng w
ith 2
010,
sta
ndar
d er
rors
wer
e ca
lcul
ated
usi
ng r
eplic
ate
wei
ghts
. Bef
ore
2010
, sta
ndar
d er
rors
wer
e ca
lcul
ated
usi
ng
the
gene
raliz
ed v
aria
nce
func
tion .
For
info
rmat
ion
on c
onfid
entia
lity
prot
ectio
n, s
ampl
ing
erro
r, no
nsam
plin
g er
ror,
and
defin
ition
s, s
ee w
ww
.cen
sus.
gov/
prod
/tech
doc/
cps/
cpsm
ar13
)
Rac
e an
d H
ispa
nic
orig
in o
f hou
seho
lder
an
d ye
arN
umbe
r (t
hous
ands
)
Per
cent
age
dist
ribut
ion
Med
ian
inco
me
(dol
lars
)M
ean
inco
me
(dol
lars
)
Tota
lU
nder
$1
5,00
0$1
5,00
0 to
$24
,999
$25,
000
to $
34,9
99$3
5,00
0 to
$49
,999
$50,
000
to $
74,9
99$7
5,00
0 to
$99
,999
$100
,000
to
$149
,999
$150
,000
to
$199
,999
$200
,000
an
d ov
erV
alue
Sta
ndar
d er
ror
Val
ueS
tand
ard
erro
r
HIS
PAN
IC
(A
NY
RA
CE
)24
2012
. . .
. . .
. . .
. . .
. .
15,
589
100
.0
16 .
8 1
4 .6
13 .
6 1
5 .8
17 .
1 9
.7
7 .9
2
.6
1 .9
3
9,00
5 5
34
53,
422
698
20
11 . .
. . .
. . .
. . .
. . .
1
4,93
9 1
00 .0
1
6 .3
14 .
4 1
3 .9
16 .
6 1
7 .3
9 .1
7
.8
2 .8
1
.7
39,
430
558
5
3,44
6 6
06
2010
1 . . .
. . . .
. . . .
. . 1
4,43
5 1
00 .0
1
6 .6
14 .
1 1
4 .2
15 .
0 1
7 .7
9 .8
8
.2
2 .8
1
.7
39,
629
613
5
4,12
3 6
95
2009
2 . . .
. . . .
. . . .
. . 1
3,29
8 1
00 .0
1
5 .5
14 .
2 1
3 .6
15 .
6 1
7 .8
9 .6
8
.9
2 .7
2
.0
40,
720
537
5
5,91
0 6
13
2008
. . .
. . .
. . .
. . .
. .
13,
425
100
.0
15 .
6 1
4 .0
14 .
0 1
6 .3
17 .
2 9
.4
8 .8
3
.0
1 .7
4
0,43
1 5
18
54,
997
569
20
07 . .
. . .
. . .
. . .
. . .
1
3,33
9 1
00 .0
1
4 .3
13 .
5 1
3 .5
16 .
4 1
8 .1
11 .
1 8
.7
2 .6
1
.8
42,
833
576
5
6,28
6 5
92
2006
. . .
. . .
. . .
. . .
. .
12,
973
100
.0
14 .
4 1
3 .2
13 .
2 1
6 .3
19 .
0 1
0 .0
9 .0
3
.1
1 .8
4
3,02
5 5
75
57,
595
661
20
05 . .
. . .
. . .
. . .
. . .
1
2,51
9 1
00 .0
1
4 .3
14 .
7 1
1 .7
17 .
7 1
8 .6
10 .
2 8
.3
2 .5
2
.1
42,
302
420
5
5,44
1 5
57
2004
3 . . .
. . . .
. . . .
. . 1
2,17
8 1
00 .0
1
4 .7
13 .
9 1
3 .6
16 .
8 1
8 .7
9 .7
8
.2
2 .6
1
.8
41,
659
583
5
5,76
7 6
82
2003
. . .
. . .
. . .
. . .
. .
11,
693
100
.0
14 .
7 1
4 .6
12 .
8 1
7 .7
17 .
4 1
0 .2
8 .4
2
.3
1 .9
4
1,19
4 5
73
55,
515
614
20
02 . .
. . .
. . .
. . .
. . .
1
1,33
9 1
00 .0
1
3 .6
13 .
5 1
4 .1
16 .
8 1
8 .0
10 .
9 8
.6
2 .5
2
.0
42,
250
615
5
7,29
0 7
66
2001
. . .
. . .
. . .
. . .
. .
10,
499
100
.0
13 .
2 1
4 .3
12 .
4 1
6 .9
18 .
4 1
1 .5
8 .7
2
.9
1 .7
4
3,53
1 5
52
57,
561
728
20
004 .
. . . .
. . . .
. . . .
10,
034
100
.0
12 .
9 1
3 .7
12 .
7 1
6 .8
19 .
5 1
0 .9
9 .0
2
.4
2 .1
4
4,22
4 6
37
58,
637
844
19
995 .
. . . .
. . . .
. . . .
9,5
79
100
.0
13 .
6 1
4 .6
13 .
6 1
6 .8
18 .
2 1
0 .2
9 .1
2
.2
1 .8
4
2,36
8 6
16
55,
658
988
19
98 . .
. . .
. . .
. . .
. . .
9
,060
1
00 .0
1
6 .8
14 .
1 1
2 .7
17 .
8 1
7 .4
9 .6
7
.9
2 .0
1
.7
39,
853
768
5
3,85
1 1
,145
19
97 . .
. . .
. . .
. . .
. . .
8
,590
1
00 .0
1
8 .5
14 .
5 1
3 .5
16 .
5 1
7 .7
8 .8
7
.1
1 .9
1
.6
37,
982
678
5
1,18
3 1
,033
19
96 . .
. . .
. . .
. . .
. . .
8
,225
1
00 .0
1
8 .3
16 .
5 1
4 .1
15 .
7 1
7 .0
8 .8
6
.5
1 .8
1
.3
36,
293
704
4
9,55
3 1
,147
19
956 .
. . . .
. . . .
. . . .
7,9
39
100
.0
20 .
6 1
6 .1
14 .
2 1
6 .0
15 .
6 9
.0
6 .0
1
.4
0 .9
3
4,19
9 7
45
46,
677
1,0
47
1994
7 . . .
. . . .
. . . .
. . 7
,735
1
00 .0
2
0 .1
16 .
1 1
2 .5
16 .
3 1
6 .6
8 .9
6
.6
1 .8
1
.1
35,
882
666
4
8,38
5 1
,207
19
938 .
. . . .
. . . .
. . . .
7,3
62
100
.0
19 .
3 1
5 .9
13 .
8 1
7 .2
16 .
5 8
.6
6 .3
1
.4
1 .1
3
5,81
0 7
20
47,
397
997
19
929 .
. . . .
. . . .
. . . .
7,1
53
100
.0
19 .
5 1
5 .5
13 .
6 1
7 .2
16 .
7 8
.9
6 .1
1
.5
0 .8
3
6,23
3 7
49
46,
214
726
19
91 . .
. . .
. . .
. . .
. . .
6
,379
1
00 .0
1
8 .3
15 .
8 1
2 .9
17 .
1 1
7 .7
8 .9
6
.5
1 .8
0
.9
37,
306
776
4
7,46
8 7
60
1990
. . .
. . .
. . .
. . .
. .
6,2
20
100
.0
17 .
9 1
5 .8
12 .
8 1
6 .4
19 .
0 9
.1
6 .4
1
.6
0 .9
3
8,02
9 7
80
47,
637
785
19
89 . .
. . .
. . .
. . .
. . .
5
,933
1
00 .0
1
8 .0
13 .
6 1
3 .2
16 .
1 1
8 .2
10 .
9 6
.9
1 .8
1
.2
39,
193
760
5
0,04
7 8
60
1988
. . .
. . .
. . .
. . .
. .
5,9
10
100
.0
19 .
5 1
4 .3
12 .
9 1
6 .4
18 .
4 9
.4
6 .3
1
.9
1 .0
3
7,97
0 9
62
48,
478
1,0
28
1987
10 .
. . . .
. . . .
. . .
5,6
42
100
.0
19 .
5 1
5 .0
13 .
1 1
6 .8
17 .
0 9
.8
6 .2
1
.6
1 .1
3
7,38
6 8
12
47,
923
887
19
86 . .
. . .
. . .
. . .
. . .
5
,418
1
00 .0
1
9 .0
16 .
2 1
3 .4
15 .
7 1
7 .9
8 .8
7
.2
1 .3
0
.5
36,
682
955
4
6,31
9 7
62
1985
11 .
. . . .
. . . .
. . .
5,2
13
100
.0
20 .
2 1
6 .7
12 .
7 1
6 .3
17 .
6 8
.9
6 .0
1
.1
0 .5
3
5,54
1 8
30
44,
410
722
19
8412
. . .
. . . .
. . . .
. 4
,883
1
00 .0
2
0 .5
14 .
6 1
4 .5
15 .
4 1
8 .7
9 .1
5
.5
1 .1
0
.5
35,
766
897
4
4,47
4 8
67
1983
. . .
. . .
. . .
. . .
. .
4,3
26
100
.0
20 .
9 1
6 .1
13 .
4 1
7 .6
17 .
4 8
.4
4 .9
1
.0
0 .3
3
4,85
1 8
83
42,
438
815
19
82 . .
. . .
. . .
. . .
. . .
4
,085
1
00 .0
2
0 .3
16 .
7 1
4 .2
16 .
8 1
7 .7
8 .2
4
.7
0 .9
0
.5
34,
675
916
4
2,79
4 8
68
1981
. . .
. . .
. . .
. . .
. .
3,9
80
100
.0
17 .
9 1
5 .9
13 .
6 1
8 .3
18 .
9 9
.1
5 .0
0
.9
0 .4
3
7,06
3 1
,015
4
4,50
7 8
50
1980
. . .
. . .
. . .
. . .
. .
3,9
06
100
.0
18 .
1 1
6 .0
14 .
8 1
6 .9
18 .
8 9
.1
4 .9
1
.0
0 .5
3
6,21
7 9
82
44,
237
881
19
7913
. . .
. . . .
. . . .
. 3
,684
1
00 .0
1
6 .6
14 .
6 1
4 .5
17 .
7 2
0 .2
9 .1
5
.7
1 .1
0
.6
38,
442
1,1
08
46,
512
934
19
78 . .
. . .
. . .
. . .
. . .
3
,291
1
00 .0
1
6 .3
15 .
2 1
4 .4
18 .
4 2
0 .6
9 .3
4
.8
1 .0
0
.3
38,
122
924
4
5,03
1 9
11
1977
. . .
. . .
. . .
. . .
. .
3,3
04
100
.0
16 .
9 1
5 .8
15 .
2 1
8 .7
19 .
6 8
.2
4 .4
0
.8
0 .3
3
6,74
7 6
45
43,
367
670
19
7614
. . .
. . . .
. . . .
. 3
,081
1
00 .0
1
9 .1
16 .
7 1
4 .6
18 .
3 1
9 .4
7 .7
3
.5
0 .5
0
.2
35,
111
749
4
1,49
1 6
75
1975
15 .
. . . .
. . . .
. . .
2,9
48
100
.0
18 .
4 1
7 .4
15 .
5 1
8 .2
19 .
6 6
.9
3 .1
0
.5
0 .4
3
4,39
9 7
61
40,
837
726
19
7415
, 16 .
. . . .
. . . .
. . 2
,897
1
00 .0
1
5 .5
16 .
6 1
5 .3
18 .
8 2
1 .2
7 .4
4
.1
0 .6
0
.4
37,
399
819
4
3,32
4 7
05
1973
. . .
. . .
. . .
. . .
. .
2,7
22
100
.0
14 .
6 1
6 .3
15 .
2 1
8 .7
22 .
6 7
.7
4 .1
0
.4
0 .3
3
7,61
9 8
55
43,
707
711
19
7217
. . .
. . . .
. . . .
. 2
,655
1
00 .0
1
5 .2
16 .
5 1
5 .3
22 .
0 1
9 .3
7 .3
3
.4
0 .6
0
.5
37,
681
736
4
3,31
1 7
36
See
foot
note
s at
end
of t
able
.
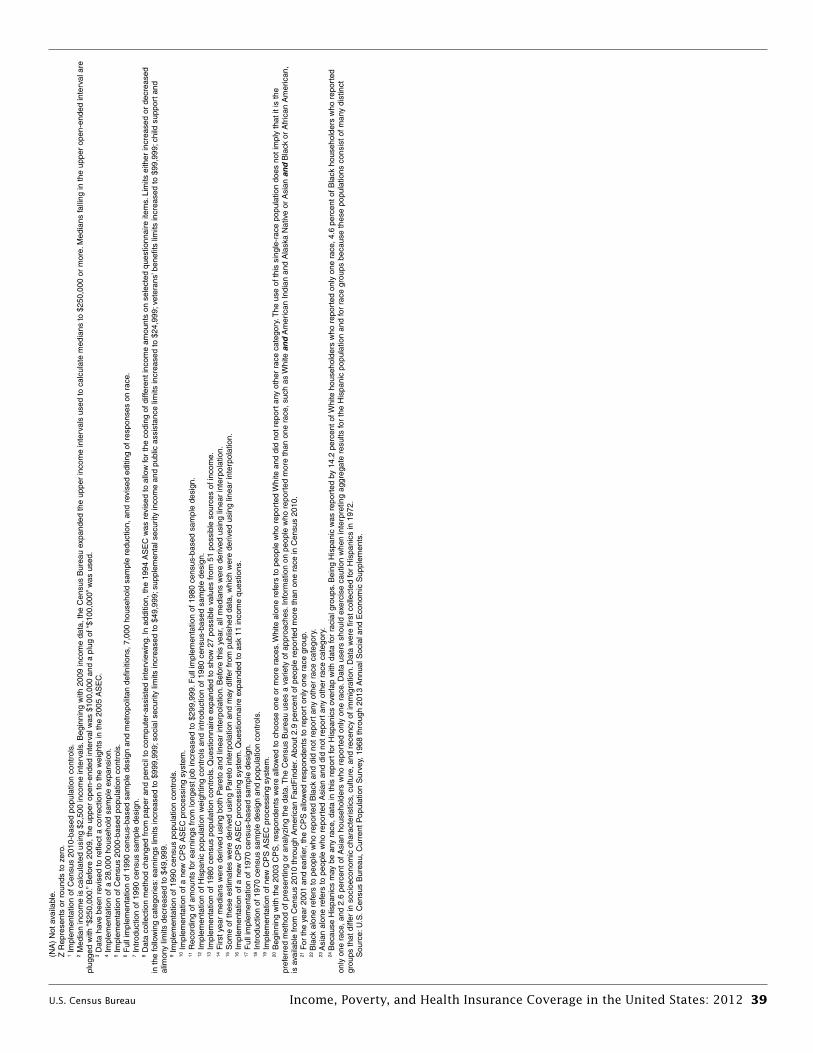
U.S. Census Bureau Income, Poverty, and Health Insurance Coverage in the United States: 2012 39
Table
A-1
.H
ou
seh
old
s b
y T
ota
l M
on
ey I
ncom
e, R
ace, an
d H
isp
an
ic o
rigin
of
Hou
seh
old
er:
19
67
to 2
01
2—
Con
.(I
ncom
e in
201
2 C
PI-
U-R
S a
djus
ted
dolla
rs . H
ouse
hold
s as
of M
arch
of t
he fo
llow
ing
year
. Beg
inni
ng w
ith 2
010,
sta
ndar
d er
rors
wer
e ca
lcul
ated
usi
ng r
eplic
ate
wei
ghts
. Bef
ore
2010
, sta
ndar
d er
rors
wer
e ca
lcul
ated
usi
ng
the
gene
raliz
ed v
aria
nce
func
tion .
For
info
rmat
ion
on c
onfid
entia
lity
prot
ectio
n, s
ampl
ing
erro
r, no
nsam
plin
g er
ror,
and
defin
ition
s, s
ee w
ww
.cen
sus.
gov/
prod
/tech
doc/
cps/
cpsm
ar13
)
Rac
e an
d H
ispa
nic
orig
in o
f hou
seho
lder
an
d ye
arN
umbe
r (t
hous
ands
)
Per
cent
age
dist
ribut
ion
Med
ian
inco
me
(dol
lars
)M
ean
inco
me
(dol
lars
)
Tota
lU
nder
$1
5,00
0$1
5,00
0 to
$24
,999
$25,
000
to $
34,9
99$3
5,00
0 to
$49
,999
$50,
000
to $
74,9
99$7
5,00
0 to
$99
,999
$100
,000
to
$149
,999
$150
,000
to
$199
,999
$200
,000
an
d ov
erV
alue
Sta
ndar
d er
ror
Val
ueS
tand
ard
erro
r
(NA
) N
ot a
vaila
ble .
Z R
epre
sent
s or
rou
nds
to z
ero .
1 Im
plem
enta
tion
of C
ensu
s 20
10-b
ased
pop
ulat
ion
cont
rols
.2
Med
ian
inco
me
is c
alcu
late
d us
ing
$2,5
00 in
com
e in
terv
als .
Beg
inni
ng w
ith 2
009
inco
me
data
, the
Cen
sus
Bur
eau
expa
nded
the
uppe
r in
com
e in
terv
als
used
to c
alcu
late
med
ians
to $
250,
000
or m
ore .
Med
ians
falli
ng in
the
uppe
r op
en-e
nded
inte
rval
are
pl
ugge
d w
ith “
$250
,000
.” B
efor
e 20
09, t
he u
pper
ope
n-en
ded
inte
rval
was
$10
0,00
0 an
d a
plug
of “
$100
,000
” was
use
d .
3 D
ata
have
bee
n re
vise
d to
refl
ect a
cor
rect
ion
to th
e w
eigh
ts in
the
2005
AS
EC
.4
Impl
emen
tatio
n of
a 2
8,00
0 ho
useh
old
sam
ple
expa
nsio
n .5
Impl
emen
tatio
n of
Cen
sus
2000
-bas
ed p
opul
atio
n co
ntro
ls .
6 F
ull i
mpl
emen
tatio
n of
199
0 ce
nsus
-bas
ed s
ampl
e de
sign
and
met
ropo
litan
defi
nitio
ns, 7
,000
hou
seho
ld s
ampl
e re
duct
ion,
and
rev
ised
edi
ting
of r
espo
nses
on
race
.7
Intr
oduc
tion
of 1
990
cens
us s
ampl
e de
sign
.8
Dat
a co
llect
ion
met
hod
chan
ged
from
pap
er a
nd p
enci
l to
com
pute
r-as
sist
ed in
terv
iew
ing .
In a
dditi
on, t
he 1
994
AS
EC
was
rev
ised
to a
llow
for
the
codi
ng o
f diff
eren
t inc
ome
amou
nts
on s
elec
ted
ques
tionn
aire
item
s . L
imits
eith
er in
crea
sed
or d
ecre
ased
in
the
follo
win
g ca
tego
ries:
ear
ning
s lim
its in
crea
sed
to $
999,
999;
soc
ial s
ecur
ity li
mits
incr
ease
d to
$49
,999
; sup
plem
enta
l sec
urity
inco
me
and
publ
ic a
ssis
tanc
e lim
its in
crea
sed
to $
24,9
99; v
eter
ans’
ben
efits
lim
its in
crea
sed
to $
99,9
99; c
hild
sup
port
and
al
imon
y lim
its d
ecre
ased
to $
49,9
99 .
9 Im
plem
enta
tion
of 1
990
cens
us p
opul
atio
n co
ntro
ls .
10 Im
plem
enta
tion
of a
new
CP
S A
SE
C p
roce
ssin
g sy
stem
.11
Rec
ordi
ng o
f am
ount
s fo
r ea
rnin
gs fr
om lo
nges
t job
incr
ease
d to
$29
9,99
9 . F
ull i
mpl
emen
tatio
n of
198
0 ce
nsus
-bas
ed s
ampl
e de
sign
.12
Impl
emen
tatio
n of
His
pani
c po
pula
tion
wei
ghtin
g co
ntro
ls a
nd in
trod
uctio
n of
198
0 ce
nsus
-bas
ed s
ampl
e de
sign
.13
Impl
emen
tatio
n of
198
0 ce
nsus
pop
ulat
ion
cont
rols
. Que
stio
nnai
re e
xpan
ded
to s
how
27
poss
ible
val
ues
from
51
poss
ible
sou
rces
of i
ncom
e .14
Firs
t yea
r m
edia
ns w
ere
deriv
ed u
sing
bot
h P
aret
o an
d lin
ear
inte
rpol
atio
n . B
efor
e th
is y
ear,
all m
edia
ns w
ere
deriv
ed u
sing
line
ar in
terp
olat
ion .
15 S
ome
of th
ese
estim
ates
wer
e de
rived
usi
ng P
aret
o in
terp
olat
ion
and
may
diff
er fr
om p
ublis
hed
data
, whi
ch w
ere
deriv
ed u
sing
line
ar in
terp
olat
ion .
16 Im
plem
enta
tion
of a
new
CP
S A
SE
C p
roce
ssin
g sy
stem
. Que
stio
nnai
re e
xpan
ded
to a
sk 1
1 in
com
e qu
estio
ns .
17 F
ull i
mpl
emen
tatio
n of
197
0 ce
nsus
-bas
ed s
ampl
e de
sign
.18
Intr
oduc
tion
of 1
970
cens
us s
ampl
e de
sign
and
pop
ulat
ion
cont
rols
.19
Impl
emen
tatio
n of
new
CP
S A
SE
C p
roce
ssin
g sy
stem
.20
Beg
inni
ng w
ith th
e 20
03 C
PS
, res
pond
ents
wer
e al
low
ed to
cho
ose
one
or m
ore
race
s . W
hite
alo
ne r
efer
s to
peo
ple
who
rep
orte
d W
hite
and
did
not
rep
ort a
ny o
ther
rac
e ca
tego
ry . T
he u
se o
f thi
s si
ngle
-rac
e po
pula
tion
does
not
impl
y th
at it
is th
e pr
efer
red
met
hod
of p
rese
ntin
g or
ana
lyzi
ng th
e da
ta . T
he C
ensu
s B
urea
u us
es a
var
iety
of a
ppro
ache
s . In
form
atio
n on
peo
ple
who
rep
orte
d m
ore
than
one
rac
e, s
uch
as W
hite
an
d A
mer
ican
Indi
an a
nd A
lask
a N
ativ
e or
Asi
an a
nd
Bla
ck o
r A
fric
an A
mer
ican
, is
ava
ilabl
e fr
om C
ensu
s 20
10 th
roug
h A
mer
ican
Fac
tFin
der .
Abo
ut 2
.9 p
erce
nt o
f peo
ple
repo
rted
mor
e th
an o
ne r
ace
in C
ensu
s 20
10 .
21 F
or th
e ye
ar 2
001
and
earli
er, t
he C
PS
allo
wed
res
pond
ents
to r
epor
t onl
y on
e ra
ce g
roup
.22
Bla
ck a
lone
ref
ers
to p
eopl
e w
ho r
epor
ted
Bla
ck a
nd d
id n
ot r
epor
t any
oth
er r
ace
cate
gory
.23
Asi
an a
lone
ref
ers
to p
eopl
e w
ho r
epor
ted
Asi
an a
nd d
id n
ot r
epor
t any
oth
er r
ace
cate
gory
.24
Bec
ause
His
pani
cs m
ay b
e an
y ra
ce, d
ata
in th
is r
epor
t for
His
pani
cs o
verla
p w
ith d
ata
for
raci
al g
roup
s . B
eing
His
pani
c w
as r
epor
ted
by 1
4 .2
perc
ent o
f Whi
te h
ouse
hold
ers
who
rep
orte
d on
ly o
ne r
ace,
4 .6
per
cent
of B
lack
hou
seho
lder
s w
ho r
epor
ted
only
one
rac
e, a
nd 2
.6 p
erce
nt o
f Asi
an h
ouse
hold
ers
who
rep
orte
d on
ly o
ne r
ace .
Dat
a us
ers
shou
ld e
xerc
ise
caut
ion
whe
n in
terp
retin
g ag
greg
ate
resu
lts fo
r th
e H
ispa
nic
popu
latio
n an
d fo
r ra
ce g
roup
s be
caus
e th
ese
popu
latio
ns c
onsi
st o
f man
y di
stin
ct
grou
ps th
at d
iffer
in s
ocio
econ
omic
cha
ract
eris
tics,
cul
ture
, and
rec
ency
of i
mm
igra
tion .
Dat
a w
ere
first
col
lect
ed fo
r H
ispa
nics
in 1
972 .
Sou
rce:
U .S
. Cen
sus
Bur
eau,
Cur
rent
Pop
ulat
ion
Sur
vey,
196
8 th
roug
h 20
13 A
nnua
l Soc
ial a
nd E
cono
mic
Sup
plem
ents
.
ContentsHouseholds by Total Money Income, Race, and Hispanic origin of Householder: 1967 to 2010—Con . 34
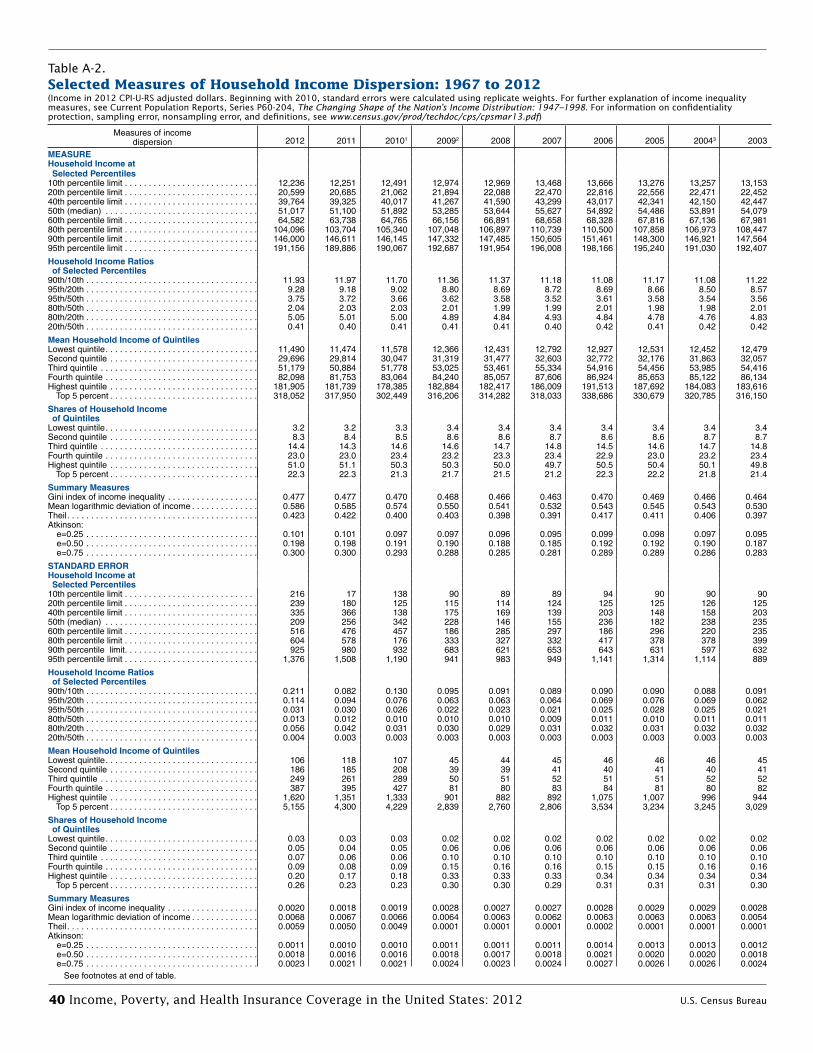
40 Income, Poverty, and Health Insurance Coverage in the United States: 2012 U.S. Census Bureau
Table A-2.Selected Measures of Household Income Dispersion: 1967 to 2012—Con .(Income in 2012 CPI-U-RS adjusted dollars. Beginning with 2010, standard errors were calculated using replicate weights. For further explanation of income inequality measures, see Current Population Reports, Series P60-204, The Changing Shape of the Nation’s Income Distribution: 1947–1998. For information on confidentiality protection, sampling error, nonsampling error, and definitions, see www.census.gov/prod/techdoc/cps/cpsmar13.pdf)
Measures of income dispersion 2012 2011 20101 20092 2008 2007 2006 2005 20043 2003
MEASUREHousehold Income at Selected Percentiles10th percentile limit . . . . . . . . . . . . . . . . . . . . . . . . . . . . 12,236 12,251 12,491 12,974 12,969 13,468 13,666 13,276 13,257 13,15320th percentile limit . . . . . . . . . . . . . . . . . . . . . . . . . . . . 20,599 20,685 21,062 21,894 22,088 22,470 22,816 22,556 22,471 22,45240th percentile limit . . . . . . . . . . . . . . . . . . . . . . . . . . . . 39,764 39,325 40,017 41,267 41,590 43,299 43,017 42,341 42,150 42,44750th (median) . . . . . . . . . . . . . . . . . . . . . . . . . . . . . . . . 51,017 51,100 51,892 53,285 53,644 55,627 54,892 54,486 53,891 54,07960th percentile limit . . . . . . . . . . . . . . . . . . . . . . . . . . . . 64,582 63,738 64,765 66,156 66,891 68,658 68,328 67,816 67,136 67,98180th percentile limit . . . . . . . . . . . . . . . . . . . . . . . . . . . . 104,096 103,704 105,340 107,048 106,897 110,739 110,500 107,858 106,973 108,44790th percentile limit . . . . . . . . . . . . . . . . . . . . . . . . . . . . 146,000 146,611 146,145 147,332 147,485 150,605 151,461 148,300 146,921 147,56495th percentile limit . . . . . . . . . . . . . . . . . . . . . . . . . . . . 191,156 189,886 190,067 192,687 191,954 196,008 198,166 195,240 191,030 192,407
Household Income Ratios of Selected Percentiles90th/10th . . . . . . . . . . . . . . . . . . . . . . . . . . . . . . . . . . . . 11 .93 11 .97 11 .70 11 .36 11 .37 11 .18 11 .08 11 .17 11 .08 11 .2295th/20th . . . . . . . . . . . . . . . . . . . . . . . . . . . . . . . . . . . . 9 .28 9 .18 9 .02 8 .80 8 .69 8 .72 8 .69 8 .66 8 .50 8 .5795th/50th . . . . . . . . . . . . . . . . . . . . . . . . . . . . . . . . . . . . 3 .75 3 .72 3 .66 3 .62 3 .58 3 .52 3 .61 3 .58 3 .54 3 .5680th/50th . . . . . . . . . . . . . . . . . . . . . . . . . . . . . . . . . . . . 2 .04 2 .03 2 .03 2 .01 1 .99 1 .99 2 .01 1 .98 1 .98 2 .0180th/20th . . . . . . . . . . . . . . . . . . . . . . . . . . . . . . . . . . . . 5 .05 5 .01 5 .00 4 .89 4 .84 4 .93 4 .84 4 .78 4 .76 4 .8320th/50th . . . . . . . . . . . . . . . . . . . . . . . . . . . . . . . . . . . . 0 .41 0 .40 0 .41 0 .41 0 .41 0 .40 0 .42 0 .41 0 .42 0 .42
Mean Household Income of QuintilesLowest quintile . . . . . . . . . . . . . . . . . . . . . . . . . . . . . . . . 11,490 11,474 11,578 12,366 12,431 12,792 12,927 12,531 12,452 12,479Second quintile . . . . . . . . . . . . . . . . . . . . . . . . . . . . . . . 29,696 29,814 30,047 31,319 31,477 32,603 32,772 32,176 31,863 32,057Third quintile . . . . . . . . . . . . . . . . . . . . . . . . . . . . . . . . . 51,179 50,884 51,778 53,025 53,461 55,334 54,916 54,456 53,985 54,416Fourth quintile . . . . . . . . . . . . . . . . . . . . . . . . . . . . . . . . 82,098 81,753 83,064 84,240 85,057 87,606 86,924 85,653 85,122 86,134Highest quintile . . . . . . . . . . . . . . . . . . . . . . . . . . . . . . . 181,905 181,739 178,385 182,884 182,417 186,009 191,513 187,692 184,083 183,616 Top 5 percent . . . . . . . . . . . . . . . . . . . . . . . . . . . . . . . 318,052 317,950 302,449 316,206 314,282 318,033 338,686 330,679 320,785 316,150
Shares of Household Income of QuintilesLowest quintile . . . . . . . . . . . . . . . . . . . . . . . . . . . . . . . . 3 .2 3 .2 3 .3 3 .4 3 .4 3 .4 3 .4 3 .4 3 .4 3 .4Second quintile . . . . . . . . . . . . . . . . . . . . . . . . . . . . . . . 8 .3 8 .4 8 .5 8 .6 8 .6 8 .7 8 .6 8 .6 8 .7 8 .7Third quintile . . . . . . . . . . . . . . . . . . . . . . . . . . . . . . . . . 14 .4 14 .3 14 .6 14 .6 14 .7 14 .8 14 .5 14 .6 14 .7 14 .8Fourth quintile . . . . . . . . . . . . . . . . . . . . . . . . . . . . . . . . 23 .0 23 .0 23 .4 23 .2 23 .3 23 .4 22 .9 23 .0 23 .2 23 .4Highest quintile . . . . . . . . . . . . . . . . . . . . . . . . . . . . . . . 51 .0 51 .1 50 .3 50 .3 50 .0 49 .7 50 .5 50 .4 50 .1 49 .8 Top 5 percent . . . . . . . . . . . . . . . . . . . . . . . . . . . . . . . 22 .3 22 .3 21 .3 21 .7 21 .5 21 .2 22 .3 22 .2 21 .8 21 .4
Summary MeasuresGini index of income inequality . . . . . . . . . . . . . . . . . . . 0 .477 0 .477 0 .470 0 .468 0 .466 0 .463 0 .470 0 .469 0 .466 0 .464Mean logarithmic deviation of income . . . . . . . . . . . . . . 0 .586 0 .585 0 .574 0 .550 0 .541 0 .532 0 .543 0 .545 0 .543 0 .530Theil . . . . . . . . . . . . . . . . . . . . . . . . . . . . . . . . . . . . . . . . 0 .423 0 .422 0 .400 0 .403 0 .398 0 .391 0 .417 0 .411 0 .406 0 .397Atkinson: e=0 .25 . . . . . . . . . . . . . . . . . . . . . . . . . . . . . . . . . . . . 0 .101 0 .101 0 .097 0 .097 0 .096 0 .095 0 .099 0 .098 0 .097 0 .095 e=0 .50 . . . . . . . . . . . . . . . . . . . . . . . . . . . . . . . . . . . . 0 .198 0 .198 0 .191 0 .190 0 .188 0 .185 0 .192 0 .192 0 .190 0 .187 e=0 .75 . . . . . . . . . . . . . . . . . . . . . . . . . . . . . . . . . . . . 0 .300 0 .300 0 .293 0 .288 0 .285 0 .281 0 .289 0 .289 0 .286 0 .283
STANDARD ERRORHousehold Income at Selected Percentiles10th percentile limit . . . . . . . . . . . . . . . . . . . . . . . . . . . 216 17 138 90 89 89 94 90 90 9020th percentile limit . . . . . . . . . . . . . . . . . . . . . . . . . . . . 239 180 125 115 114 124 125 125 126 12540th percentile limit . . . . . . . . . . . . . . . . . . . . . . . . . . . . 335 366 138 175 169 139 203 148 158 20350th (median) . . . . . . . . . . . . . . . . . . . . . . . . . . . . . . . . 209 256 342 228 146 155 236 182 238 23560th percentile limit . . . . . . . . . . . . . . . . . . . . . . . . . . . . 516 476 457 186 285 297 186 296 220 23580th percentile limit . . . . . . . . . . . . . . . . . . . . . . . . . . . . 604 578 176 333 327 332 417 378 378 39990th percentile limit . . . . . . . . . . . . . . . . . . . . . . . . . . . . 925 980 932 683 621 653 643 631 597 63295th percentile limit . . . . . . . . . . . . . . . . . . . . . . . . . . . . 1,376 1,508 1,190 941 983 949 1,141 1,314 1,114 889
Household Income Ratios of Selected Percentiles90th/10th . . . . . . . . . . . . . . . . . . . . . . . . . . . . . . . . . . . . 0 .211 0 .082 0 .130 0 .095 0 .091 0 .089 0 .090 0 .090 0 .088 0 .09195th/20th . . . . . . . . . . . . . . . . . . . . . . . . . . . . . . . . . . . . 0 .114 0 .094 0 .076 0 .063 0 .063 0 .064 0 .069 0 .076 0 .069 0 .06295th/50th . . . . . . . . . . . . . . . . . . . . . . . . . . . . . . . . . . . . 0 .031 0 .030 0 .026 0 .022 0 .023 0 .021 0 .025 0 .028 0 .025 0 .02180th/50th . . . . . . . . . . . . . . . . . . . . . . . . . . . . . . . . . . . . 0 .013 0 .012 0 .010 0 .010 0 .010 0 .009 0 .011 0 .010 0 .011 0 .01180th/20th . . . . . . . . . . . . . . . . . . . . . . . . . . . . . . . . . . . . 0 .056 0 .042 0 .031 0 .030 0 .029 0 .031 0 .032 0 .031 0 .032 0 .03220th/50th . . . . . . . . . . . . . . . . . . . . . . . . . . . . . . . . . . . . 0 .004 0 .003 0 .003 0 .003 0 .003 0 .003 0 .003 0 .003 0 .003 0 .003
Mean Household Income of QuintilesLowest quintile . . . . . . . . . . . . . . . . . . . . . . . . . . . . . . . . 106 118 107 45 44 45 46 46 46 45Second quintile . . . . . . . . . . . . . . . . . . . . . . . . . . . . . . . 186 185 208 39 39 41 40 41 40 41Third quintile . . . . . . . . . . . . . . . . . . . . . . . . . . . . . . . . . 249 261 289 50 51 52 51 51 52 52Fourth quintile . . . . . . . . . . . . . . . . . . . . . . . . . . . . . . . . 387 395 427 81 80 83 84 81 80 82Highest quintile . . . . . . . . . . . . . . . . . . . . . . . . . . . . . . . 1,620 1,351 1,333 901 882 892 1,075 1,007 996 944 Top 5 percent . . . . . . . . . . . . . . . . . . . . . . . . . . . . . . . 5,155 4,300 4,229 2,839 2,760 2,806 3,534 3,234 3,245 3,029
Shares of Household Income of QuintilesLowest quintile . . . . . . . . . . . . . . . . . . . . . . . . . . . . . . . . 0 .03 0 .03 0 .03 0 .02 0 .02 0 .02 0 .02 0 .02 0 .02 0 .02Second quintile . . . . . . . . . . . . . . . . . . . . . . . . . . . . . . . 0 .05 0 .04 0 .05 0 .06 0 .06 0 .06 0 .06 0 .06 0 .06 0 .06Third quintile . . . . . . . . . . . . . . . . . . . . . . . . . . . . . . . . . 0 .07 0 .06 0 .06 0 .10 0 .10 0 .10 0 .10 0 .10 0 .10 0 .10Fourth quintile . . . . . . . . . . . . . . . . . . . . . . . . . . . . . . . . 0 .09 0 .08 0 .09 0 .15 0 .16 0 .16 0 .15 0 .15 0 .16 0 .16Highest quintile . . . . . . . . . . . . . . . . . . . . . . . . . . . . . . . 0 .20 0 .17 0 .18 0 .33 0 .33 0 .33 0 .34 0 .34 0 .34 0 .34 Top 5 percent . . . . . . . . . . . . . . . . . . . . . . . . . . . . . . . 0 .26 0 .23 0 .23 0 .30 0 .30 0 .29 0 .31 0 .31 0 .31 0 .30
Summary MeasuresGini index of income inequality . . . . . . . . . . . . . . . . . . . 0 .0020 0 .0018 0 .0019 0 .0028 0 .0027 0 .0027 0 .0028 0 .0029 0 .0029 0 .0028Mean logarithmic deviation of income . . . . . . . . . . . . . . 0 .0068 0 .0067 0 .0066 0 .0064 0 .0063 0 .0062 0 .0063 0 .0063 0 .0063 0 .0054Theil . . . . . . . . . . . . . . . . . . . . . . . . . . . . . . . . . . . . . . . . 0 .0059 0 .0050 0 .0049 0 .0001 0 .0001 0 .0001 0 .0002 0 .0001 0 .0001 0 .0001Atkinson: e=0 .25 . . . . . . . . . . . . . . . . . . . . . . . . . . . . . . . . . . . . 0 .0011 0 .0010 0 .0010 0 .0011 0 .0011 0 .0011 0 .0014 0 .0013 0 .0013 0 .0012 e=0 .50 . . . . . . . . . . . . . . . . . . . . . . . . . . . . . . . . . . . . 0 .0018 0 .0016 0 .0016 0 .0018 0 .0017 0 .0018 0 .0021 0 .0020 0 .0020 0 .0018 e=0 .75 . . . . . . . . . . . . . . . . . . . . . . . . . . . . . . . . . . . . 0 .0023 0 .0021 0 .0021 0 .0024 0 .0023 0 .0024 0 .0027 0 .0026 0 .0026 0 .0024
See footnotes at end of table .
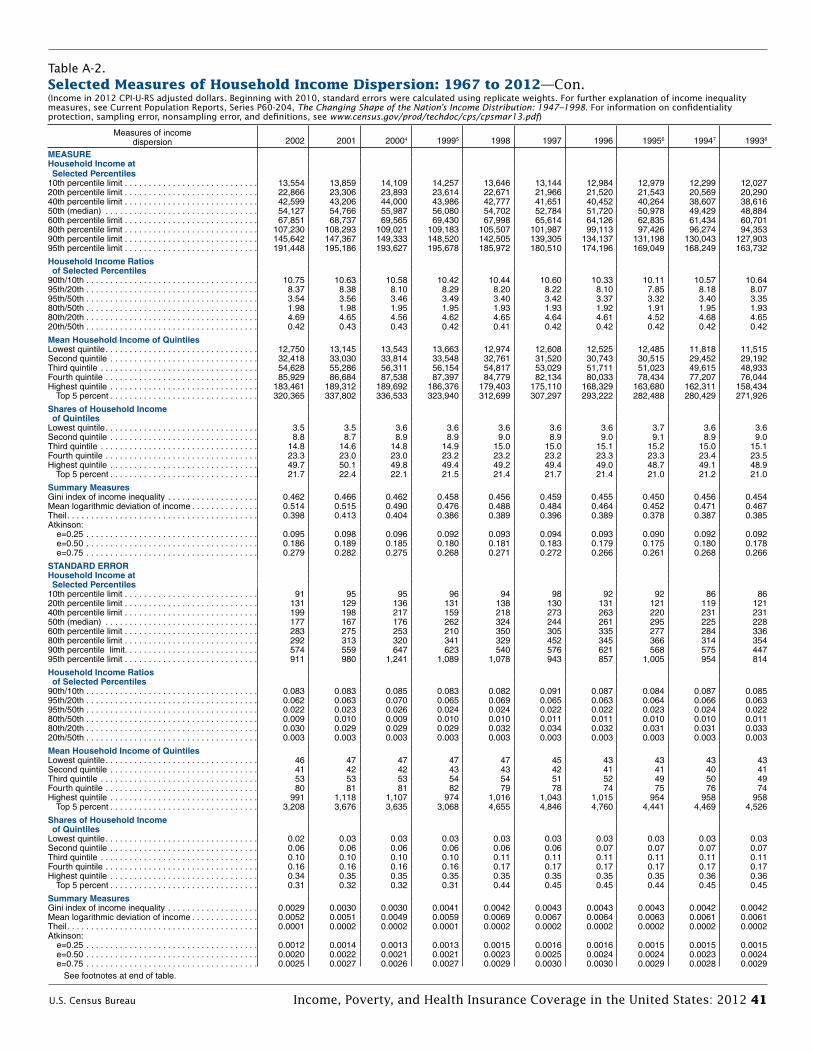
U.S. Census Bureau Income, Poverty, and Health Insurance Coverage in the United States: 2012 41
Table A-2.Selected Measures of Household Income Dispersion: 1967 to 2012—Con .(Income in 2012 CPI-U-RS adjusted dollars. Beginning with 2010, standard errors were calculated using replicate weights. For further explanation of income inequality measures, see Current Population Reports, Series P60-204, The Changing Shape of the Nation’s Income Distribution: 1947–1998. For information on confidentiality protection, sampling error, nonsampling error, and definitions, see www.census.gov/prod/techdoc/cps/cpsmar13.pdf)
Measures of incomedispersion 2002 2001 20004 19995 1998 1997 1996 19956 19947 19938
MEASUREHousehold Income at Selected Percentiles10th percentile limit . . . . . . . . . . . . . . . . . . . . . . . . . . . . 13,554 13,859 14,109 14,257 13,646 13,144 12,984 12,979 12,299 12,02720th percentile limit . . . . . . . . . . . . . . . . . . . . . . . . . . . . 22,866 23,306 23,893 23,614 22,671 21,966 21,520 21,543 20,569 20,29040th percentile limit . . . . . . . . . . . . . . . . . . . . . . . . . . . . 42,599 43,206 44,000 43,986 42,777 41,651 40,452 40,264 38,607 38,61650th (median) . . . . . . . . . . . . . . . . . . . . . . . . . . . . . . . . 54,127 54,766 55,987 56,080 54,702 52,784 51,720 50,978 49,429 48,88460th percentile limit . . . . . . . . . . . . . . . . . . . . . . . . . . . . 67,851 68,737 69,565 69,430 67,998 65,614 64,126 62,835 61,434 60,70180th percentile limit . . . . . . . . . . . . . . . . . . . . . . . . . . . . 107,230 108,293 109,021 109,183 105,507 101,987 99,113 97,426 96,274 94,35390th percentile limit . . . . . . . . . . . . . . . . . . . . . . . . . . . . 145,642 147,367 149,333 148,520 142,505 139,305 134,137 131,198 130,043 127,90395th percentile limit . . . . . . . . . . . . . . . . . . . . . . . . . . . . 191,448 195,186 193,627 195,678 185,972 180,510 174,196 169,049 168,249 163,732
Household Income Ratios of Selected Percentiles90th/10th . . . . . . . . . . . . . . . . . . . . . . . . . . . . . . . . . . . . 10 .75 10 .63 10 .58 10 .42 10 .44 10 .60 10 .33 10 .11 10 .57 10 .6495th/20th . . . . . . . . . . . . . . . . . . . . . . . . . . . . . . . . . . . . 8 .37 8 .38 8 .10 8 .29 8 .20 8 .22 8 .10 7 .85 8 .18 8 .0795th/50th . . . . . . . . . . . . . . . . . . . . . . . . . . . . . . . . . . . . 3 .54 3 .56 3 .46 3 .49 3 .40 3 .42 3 .37 3 .32 3 .40 3 .3580th/50th . . . . . . . . . . . . . . . . . . . . . . . . . . . . . . . . . . . . 1 .98 1 .98 1 .95 1 .95 1 .93 1 .93 1 .92 1 .91 1 .95 1 .9380th/20th . . . . . . . . . . . . . . . . . . . . . . . . . . . . . . . . . . . . 4 .69 4 .65 4 .56 4 .62 4 .65 4 .64 4 .61 4 .52 4 .68 4 .6520th/50th . . . . . . . . . . . . . . . . . . . . . . . . . . . . . . . . . . . . 0 .42 0 .43 0 .43 0 .42 0 .41 0 .42 0 .42 0 .42 0 .42 0 .42
Mean Household Income of QuintilesLowest quintile . . . . . . . . . . . . . . . . . . . . . . . . . . . . . . . . 12,750 13,145 13,543 13,663 12,974 12,608 12,525 12,485 11,818 11,515Second quintile . . . . . . . . . . . . . . . . . . . . . . . . . . . . . . . 32,418 33,030 33,814 33,548 32,761 31,520 30,743 30,515 29,452 29,192Third quintile . . . . . . . . . . . . . . . . . . . . . . . . . . . . . . . . . 54,628 55,286 56,311 56,154 54,817 53,029 51,711 51,023 49,615 48,933Fourth quintile . . . . . . . . . . . . . . . . . . . . . . . . . . . . . . . . 85,929 86,684 87,538 87,397 84,779 82,134 80,033 78,434 77,207 76,044Highest quintile . . . . . . . . . . . . . . . . . . . . . . . . . . . . . . . 183,461 189,312 189,692 186,376 179,403 175,110 168,329 163,680 162,311 158,434 Top 5 percent . . . . . . . . . . . . . . . . . . . . . . . . . . . . . . . 320,365 337,802 336,533 323,940 312,699 307,297 293,222 282,488 280,429 271,926
Shares of Household Income of QuintilesLowest quintile . . . . . . . . . . . . . . . . . . . . . . . . . . . . . . . . 3 .5 3 .5 3 .6 3 .6 3 .6 3 .6 3 .6 3 .7 3 .6 3 .6Second quintile . . . . . . . . . . . . . . . . . . . . . . . . . . . . . . . 8 .8 8 .7 8 .9 8 .9 9 .0 8 .9 9 .0 9 .1 8 .9 9 .0Third quintile . . . . . . . . . . . . . . . . . . . . . . . . . . . . . . . . . 14 .8 14 .6 14 .8 14 .9 15 .0 15 .0 15 .1 15 .2 15 .0 15 .1Fourth quintile . . . . . . . . . . . . . . . . . . . . . . . . . . . . . . . . 23 .3 23 .0 23 .0 23 .2 23 .2 23 .2 23 .3 23 .3 23 .4 23 .5Highest quintile . . . . . . . . . . . . . . . . . . . . . . . . . . . . . . . 49 .7 50 .1 49 .8 49 .4 49 .2 49 .4 49 .0 48 .7 49 .1 48 .9 Top 5 percent . . . . . . . . . . . . . . . . . . . . . . . . . . . . . . . 21 .7 22 .4 22 .1 21 .5 21 .4 21 .7 21 .4 21 .0 21 .2 21 .0
Summary MeasuresGini index of income inequality . . . . . . . . . . . . . . . . . . . 0 .462 0 .466 0 .462 0 .458 0 .456 0 .459 0 .455 0 .450 0 .456 0 .454Mean logarithmic deviation of income . . . . . . . . . . . . . . 0 .514 0 .515 0 .490 0 .476 0 .488 0 .484 0 .464 0 .452 0 .471 0 .467Theil . . . . . . . . . . . . . . . . . . . . . . . . . . . . . . . . . . . . . . . . 0 .398 0 .413 0 .404 0 .386 0 .389 0 .396 0 .389 0 .378 0 .387 0 .385Atkinson: e=0 .25 . . . . . . . . . . . . . . . . . . . . . . . . . . . . . . . . . . . . 0 .095 0 .098 0 .096 0 .092 0 .093 0 .094 0 .093 0 .090 0 .092 0 .092 e=0 .50 . . . . . . . . . . . . . . . . . . . . . . . . . . . . . . . . . . . . 0 .186 0 .189 0 .185 0 .180 0 .181 0 .183 0 .179 0 .175 0 .180 0 .178 e=0 .75 . . . . . . . . . . . . . . . . . . . . . . . . . . . . . . . . . . . . 0 .279 0 .282 0 .275 0 .268 0 .271 0 .272 0 .266 0 .261 0 .268 0 .266
STANDARD ERRORHousehold Income at Selected Percentiles10th percentile limit . . . . . . . . . . . . . . . . . . . . . . . . . . . . 91 95 95 96 94 98 92 92 86 8620th percentile limit . . . . . . . . . . . . . . . . . . . . . . . . . . . . 131 129 136 131 138 130 131 121 119 12140th percentile limit . . . . . . . . . . . . . . . . . . . . . . . . . . . . 199 198 217 159 218 273 263 220 231 23150th (median) . . . . . . . . . . . . . . . . . . . . . . . . . . . . . . . . 177 167 176 262 324 244 261 295 225 22860th percentile limit . . . . . . . . . . . . . . . . . . . . . . . . . . . . 283 275 253 210 350 305 335 277 284 33680th percentile limit . . . . . . . . . . . . . . . . . . . . . . . . . . . . 292 313 320 341 329 452 345 366 314 35490th percentile limit . . . . . . . . . . . . . . . . . . . . . . . . . . . . 574 559 647 623 540 576 621 568 575 44795th percentile limit . . . . . . . . . . . . . . . . . . . . . . . . . . . . 911 980 1,241 1,089 1,078 943 857 1,005 954 814
Household Income Ratios of Selected Percentiles90th/10th . . . . . . . . . . . . . . . . . . . . . . . . . . . . . . . . . . . . 0 .083 0 .083 0 .085 0 .083 0 .082 0 .091 0 .087 0 .084 0 .087 0 .08595th/20th . . . . . . . . . . . . . . . . . . . . . . . . . . . . . . . . . . . . 0 .062 0 .063 0 .070 0 .065 0 .069 0 .065 0 .063 0 .064 0 .066 0 .06395th/50th . . . . . . . . . . . . . . . . . . . . . . . . . . . . . . . . . . . . 0 .022 0 .023 0 .026 0 .024 0 .024 0 .022 0 .022 0 .023 0 .024 0 .02280th/50th . . . . . . . . . . . . . . . . . . . . . . . . . . . . . . . . . . . . 0 .009 0 .010 0 .009 0 .010 0 .010 0 .011 0 .011 0 .010 0 .010 0 .01180th/20th . . . . . . . . . . . . . . . . . . . . . . . . . . . . . . . . . . . . 0 .030 0 .029 0 .029 0 .029 0 .032 0 .034 0 .032 0 .031 0 .031 0 .03320th/50th . . . . . . . . . . . . . . . . . . . . . . . . . . . . . . . . . . . . 0 .003 0 .003 0 .003 0 .003 0 .003 0 .003 0 .003 0 .003 0 .003 0 .003
Mean Household Income of QuintilesLowest quintile . . . . . . . . . . . . . . . . . . . . . . . . . . . . . . . . 46 47 47 47 47 45 43 43 43 43Second quintile . . . . . . . . . . . . . . . . . . . . . . . . . . . . . . . 41 42 42 43 43 42 41 41 40 41Third quintile . . . . . . . . . . . . . . . . . . . . . . . . . . . . . . . . . 53 53 53 54 54 51 52 49 50 49Fourth quintile . . . . . . . . . . . . . . . . . . . . . . . . . . . . . . . . 80 81 81 82 79 78 74 75 76 74Highest quintile . . . . . . . . . . . . . . . . . . . . . . . . . . . . . . . 991 1,118 1,107 974 1,016 1,043 1,015 954 958 958 Top 5 percent . . . . . . . . . . . . . . . . . . . . . . . . . . . . . . . 3,208 3,676 3,635 3,068 4,655 4,846 4,760 4,441 4,469 4,526
Shares of Household Income of QuintilesLowest quintile . . . . . . . . . . . . . . . . . . . . . . . . . . . . . . . . 0 .02 0 .03 0 .03 0 .03 0 .03 0 .03 0 .03 0 .03 0 .03 0 .03Second quintile . . . . . . . . . . . . . . . . . . . . . . . . . . . . . . . 0 .06 0 .06 0 .06 0 .06 0 .06 0 .06 0 .07 0 .07 0 .07 0 .07Third quintile . . . . . . . . . . . . . . . . . . . . . . . . . . . . . . . . . 0 .10 0 .10 0 .10 0 .10 0 .11 0 .11 0 .11 0 .11 0 .11 0 .11Fourth quintile . . . . . . . . . . . . . . . . . . . . . . . . . . . . . . . . 0 .16 0 .16 0 .16 0 .16 0 .17 0 .17 0 .17 0 .17 0 .17 0 .17Highest quintile . . . . . . . . . . . . . . . . . . . . . . . . . . . . . . . 0 .34 0 .35 0 .35 0 .35 0 .35 0 .35 0 .35 0 .35 0 .36 0 .36 Top 5 percent . . . . . . . . . . . . . . . . . . . . . . . . . . . . . . . 0 .31 0 .32 0 .32 0 .31 0 .44 0 .45 0 .45 0 .44 0 .45 0 .45
Summary MeasuresGini index of income inequality . . . . . . . . . . . . . . . . . . . 0 .0029 0 .0030 0 .0030 0 .0041 0 .0042 0 .0043 0 .0043 0 .0043 0 .0042 0 .0042Mean logarithmic deviation of income . . . . . . . . . . . . . . 0 .0052 0 .0051 0 .0049 0 .0059 0 .0069 0 .0067 0 .0064 0 .0063 0 .0061 0 .0061Theil . . . . . . . . . . . . . . . . . . . . . . . . . . . . . . . . . . . . . . . . 0 .0001 0 .0002 0 .0002 0 .0001 0 .0002 0 .0002 0 .0002 0 .0002 0 .0002 0 .0002Atkinson: e=0 .25 . . . . . . . . . . . . . . . . . . . . . . . . . . . . . . . . . . . . 0 .0012 0 .0014 0 .0013 0 .0013 0 .0015 0 .0016 0 .0016 0 .0015 0 .0015 0 .0015 e=0 .50 . . . . . . . . . . . . . . . . . . . . . . . . . . . . . . . . . . . . 0 .0020 0 .0022 0 .0021 0 .0021 0 .0023 0 .0025 0 .0024 0 .0024 0 .0023 0 .0024 e=0 .75 . . . . . . . . . . . . . . . . . . . . . . . . . . . . . . . . . . . . 0 .0025 0 .0027 0 .0026 0 .0027 0 .0029 0 .0030 0 .0030 0 .0029 0 .0028 0 .0029
See footnotes at end of table .
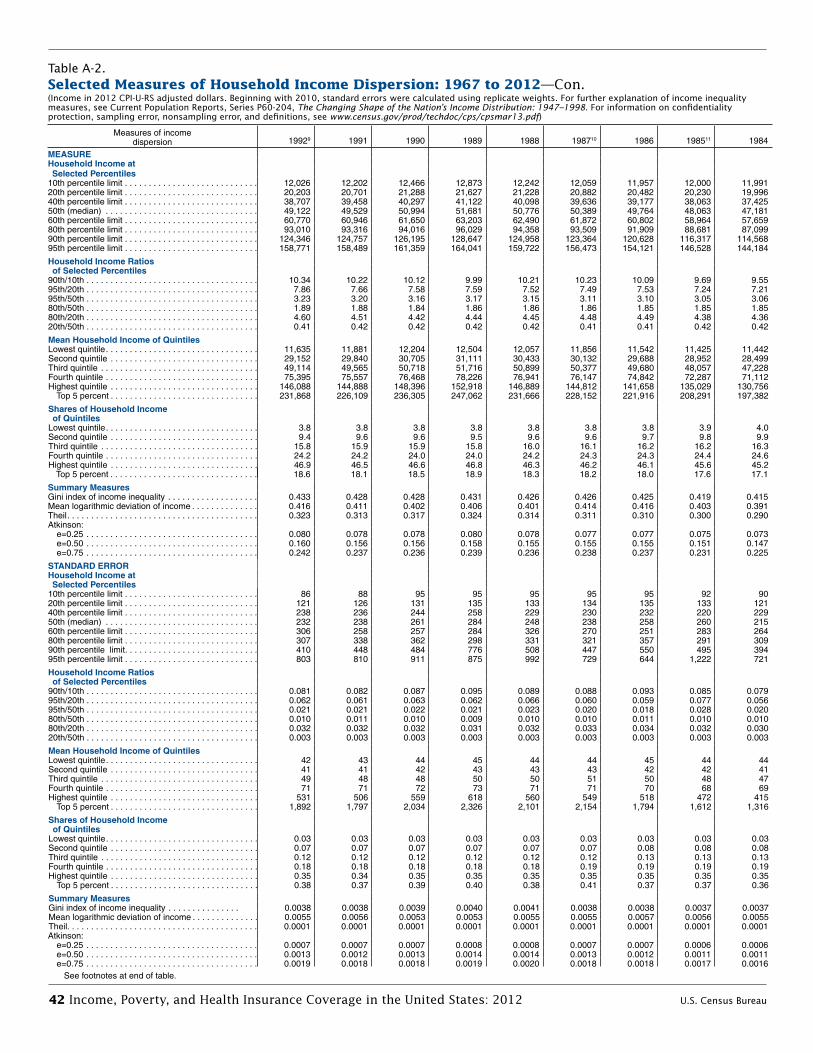
42 Income, Poverty, and Health Insurance Coverage in the United States: 2012 U.S. Census Bureau
Table A-2.Selected Measures of Household Income Dispersion: 1967 to 2012—Con .(Income in 2012 CPI-U-RS adjusted dollars. Beginning with 2010, standard errors were calculated using replicate weights. For further explanation of income inequality measures, see Current Population Reports, Series P60-204, The Changing Shape of the Nation’s Income Distribution: 1947–1998. For information on confidentiality protection, sampling error, nonsampling error, and definitions, see www.census.gov/prod/techdoc/cps/cpsmar13.pdf)
Measures of incomedispersion 19929 1991 1990 1989 1988 198710 1986 198511 1984
MEASUREHousehold Income at Selected Percentiles10th percentile limit . . . . . . . . . . . . . . . . . . . . . . . . . . . . 12,026 12,202 12,466 12,873 12,242 12,059 11,957 12,000 11,99120th percentile limit . . . . . . . . . . . . . . . . . . . . . . . . . . . . 20,203 20,701 21,288 21,627 21,228 20,882 20,482 20,230 19,99640th percentile limit . . . . . . . . . . . . . . . . . . . . . . . . . . . . 38,707 39,458 40,297 41,122 40,098 39,636 39,177 38,063 37,42550th (median) . . . . . . . . . . . . . . . . . . . . . . . . . . . . . . . . 49,122 49,529 50,994 51,681 50,776 50,389 49,764 48,063 47,18160th percentile limit . . . . . . . . . . . . . . . . . . . . . . . . . . . . 60,770 60,946 61,650 63,203 62,490 61,872 60,802 58,964 57,65980th percentile limit . . . . . . . . . . . . . . . . . . . . . . . . . . . . 93,010 93,316 94,016 96,029 94,358 93,509 91,909 88,681 87,09990th percentile limit . . . . . . . . . . . . . . . . . . . . . . . . . . . . 124,346 124,757 126,195 128,647 124,958 123,364 120,628 116,317 114,56895th percentile limit . . . . . . . . . . . . . . . . . . . . . . . . . . . . 158,771 158,489 161,359 164,041 159,722 156,473 154,121 146,528 144,184
Household Income Ratios of Selected Percentiles90th/10th . . . . . . . . . . . . . . . . . . . . . . . . . . . . . . . . . . . . 10 .34 10 .22 10 .12 9 .99 10 .21 10 .23 10 .09 9 .69 9 .5595th/20th . . . . . . . . . . . . . . . . . . . . . . . . . . . . . . . . . . . . 7 .86 7 .66 7 .58 7 .59 7 .52 7 .49 7 .53 7 .24 7 .2195th/50th . . . . . . . . . . . . . . . . . . . . . . . . . . . . . . . . . . . . 3 .23 3 .20 3 .16 3 .17 3 .15 3 .11 3 .10 3 .05 3 .0680th/50th . . . . . . . . . . . . . . . . . . . . . . . . . . . . . . . . . . . . 1 .89 1 .88 1 .84 1 .86 1 .86 1 .86 1 .85 1 .85 1 .8580th/20th . . . . . . . . . . . . . . . . . . . . . . . . . . . . . . . . . . . . 4 .60 4 .51 4 .42 4 .44 4 .45 4 .48 4 .49 4 .38 4 .3620th/50th . . . . . . . . . . . . . . . . . . . . . . . . . . . . . . . . . . . . 0 .41 0 .42 0 .42 0 .42 0 .42 0 .41 0 .41 0 .42 0 .42
Mean Household Income of QuintilesLowest quintile . . . . . . . . . . . . . . . . . . . . . . . . . . . . . . . . 11,635 11,881 12,204 12,504 12,057 11,856 11,542 11,425 11,442Second quintile . . . . . . . . . . . . . . . . . . . . . . . . . . . . . . . 29,152 29,840 30,705 31,111 30,433 30,132 29,688 28,952 28,499Third quintile . . . . . . . . . . . . . . . . . . . . . . . . . . . . . . . . . 49,114 49,565 50,718 51,716 50,899 50,377 49,680 48,057 47,228Fourth quintile . . . . . . . . . . . . . . . . . . . . . . . . . . . . . . . . 75,395 75,557 76,468 78,226 76,941 76,147 74,842 72,287 71,112Highest quintile . . . . . . . . . . . . . . . . . . . . . . . . . . . . . . . 146,088 144,888 148,396 152,918 146,889 144,812 141,658 135,029 130,756 Top 5 percent . . . . . . . . . . . . . . . . . . . . . . . . . . . . . . . 231,868 226,109 236,305 247,062 231,666 228,152 221,916 208,291 197,382
Shares of Household Income of QuintilesLowest quintile . . . . . . . . . . . . . . . . . . . . . . . . . . . . . . . . 3 .8 3 .8 3 .8 3 .8 3 .8 3 .8 3 .8 3 .9 4 .0Second quintile . . . . . . . . . . . . . . . . . . . . . . . . . . . . . . . 9 .4 9 .6 9 .6 9 .5 9 .6 9 .6 9 .7 9 .8 9 .9Third quintile . . . . . . . . . . . . . . . . . . . . . . . . . . . . . . . . . 15 .8 15 .9 15 .9 15 .8 16 .0 16 .1 16 .2 16 .2 16 .3Fourth quintile . . . . . . . . . . . . . . . . . . . . . . . . . . . . . . . . 24 .2 24 .2 24 .0 24 .0 24 .2 24 .3 24 .3 24 .4 24 .6Highest quintile . . . . . . . . . . . . . . . . . . . . . . . . . . . . . . . 46 .9 46 .5 46 .6 46 .8 46 .3 46 .2 46 .1 45 .6 45 .2 Top 5 percent . . . . . . . . . . . . . . . . . . . . . . . . . . . . . . . 18 .6 18 .1 18 .5 18 .9 18 .3 18 .2 18 .0 17 .6 17 .1
Summary MeasuresGini index of income inequality . . . . . . . . . . . . . . . . . . . 0 .433 0 .428 0 .428 0 .431 0 .426 0 .426 0 .425 0 .419 0 .415Mean logarithmic deviation of income . . . . . . . . . . . . . . 0 .416 0 .411 0 .402 0 .406 0 .401 0 .414 0 .416 0 .403 0 .391Theil . . . . . . . . . . . . . . . . . . . . . . . . . . . . . . . . . . . . . . . . 0 .323 0 .313 0 .317 0 .324 0 .314 0 .311 0 .310 0 .300 0 .290Atkinson: e=0 .25 . . . . . . . . . . . . . . . . . . . . . . . . . . . . . . . . . . . . 0 .080 0 .078 0 .078 0 .080 0 .078 0 .077 0 .077 0 .075 0 .073 e=0 .50 . . . . . . . . . . . . . . . . . . . . . . . . . . . . . . . . . . . . 0 .160 0 .156 0 .156 0 .158 0 .155 0 .155 0 .155 0 .151 0 .147 e=0 .75 . . . . . . . . . . . . . . . . . . . . . . . . . . . . . . . . . . . . 0 .242 0 .237 0 .236 0 .239 0 .236 0 .238 0 .237 0 .231 0 .225
STANDARD ERRORHousehold Income at Selected Percentiles10th percentile limit . . . . . . . . . . . . . . . . . . . . . . . . . . . . 86 88 95 95 95 95 95 92 9020th percentile limit . . . . . . . . . . . . . . . . . . . . . . . . . . . . 121 126 131 135 133 134 135 133 12140th percentile limit . . . . . . . . . . . . . . . . . . . . . . . . . . . . 238 236 244 258 229 230 232 220 22950th (median) . . . . . . . . . . . . . . . . . . . . . . . . . . . . . . . . 232 238 261 284 248 238 258 260 21560th percentile limit . . . . . . . . . . . . . . . . . . . . . . . . . . . . 306 258 257 284 326 270 251 283 26480th percentile limit . . . . . . . . . . . . . . . . . . . . . . . . . . . . 307 338 362 298 331 321 357 291 30990th percentile limit . . . . . . . . . . . . . . . . . . . . . . . . . . . . 410 448 484 776 508 447 550 495 39495th percentile limit . . . . . . . . . . . . . . . . . . . . . . . . . . . . 803 810 911 875 992 729 644 1,222 721
Household Income Ratios of Selected Percentiles90th/10th . . . . . . . . . . . . . . . . . . . . . . . . . . . . . . . . . . . . 0 .081 0 .082 0 .087 0 .095 0 .089 0 .088 0 .093 0 .085 0 .07995th/20th . . . . . . . . . . . . . . . . . . . . . . . . . . . . . . . . . . . . 0 .062 0 .061 0 .063 0 .062 0 .066 0 .060 0 .059 0 .077 0 .05695th/50th . . . . . . . . . . . . . . . . . . . . . . . . . . . . . . . . . . . . 0 .021 0 .021 0 .022 0 .021 0 .023 0 .020 0 .018 0 .028 0 .02080th/50th . . . . . . . . . . . . . . . . . . . . . . . . . . . . . . . . . . . . 0 .010 0 .011 0 .010 0 .009 0 .010 0 .010 0 .011 0 .010 0 .01080th/20th . . . . . . . . . . . . . . . . . . . . . . . . . . . . . . . . . . . . 0 .032 0 .032 0 .032 0 .031 0 .032 0 .033 0 .034 0 .032 0 .03020th/50th . . . . . . . . . . . . . . . . . . . . . . . . . . . . . . . . . . . . 0 .003 0 .003 0 .003 0 .003 0 .003 0 .003 0 .003 0 .003 0 .003
Mean Household Income of QuintilesLowest quintile . . . . . . . . . . . . . . . . . . . . . . . . . . . . . . . . 42 43 44 45 44 44 45 44 44Second quintile . . . . . . . . . . . . . . . . . . . . . . . . . . . . . . . 41 41 42 43 43 43 42 42 41Third quintile . . . . . . . . . . . . . . . . . . . . . . . . . . . . . . . . . 49 48 48 50 50 51 50 48 47Fourth quintile . . . . . . . . . . . . . . . . . . . . . . . . . . . . . . . . 71 71 72 73 71 71 70 68 69Highest quintile . . . . . . . . . . . . . . . . . . . . . . . . . . . . . . . 531 506 559 618 560 549 518 472 415 Top 5 percent . . . . . . . . . . . . . . . . . . . . . . . . . . . . . . . 1,892 1,797 2,034 2,326 2,101 2,154 1,794 1,612 1,316
Shares of Household Income of QuintilesLowest quintile . . . . . . . . . . . . . . . . . . . . . . . . . . . . . . . . 0 .03 0 .03 0 .03 0 .03 0 .03 0 .03 0 .03 0 .03 0 .03Second quintile . . . . . . . . . . . . . . . . . . . . . . . . . . . . . . . 0 .07 0 .07 0 .07 0 .07 0 .07 0 .07 0 .08 0 .08 0 .08Third quintile . . . . . . . . . . . . . . . . . . . . . . . . . . . . . . . . . 0 .12 0 .12 0 .12 0 .12 0 .12 0 .12 0 .13 0 .13 0 .13Fourth quintile . . . . . . . . . . . . . . . . . . . . . . . . . . . . . . . . 0 .18 0 .18 0 .18 0 .18 0 .18 0 .19 0 .19 0 .19 0 .19Highest quintile . . . . . . . . . . . . . . . . . . . . . . . . . . . . . . . 0 .35 0 .34 0 .35 0 .35 0 .35 0 .35 0 .35 0 .35 0 .35 Top 5 percent . . . . . . . . . . . . . . . . . . . . . . . . . . . . . . . 0 .38 0 .37 0 .39 0 .40 0 .38 0 .41 0 .37 0 .37 0 .36
Summary MeasuresGini index of income inequality . . . . . . . . . . . . . . . 0 .0038 0 .0038 0 .0039 0 .0040 0 .0041 0 .0038 0 .0038 0 .0037 0 .0037Mean logarithmic deviation of income . . . . . . . . . . . . . . 0 .0055 0 .0056 0 .0053 0 .0053 0 .0055 0 .0055 0 .0057 0 .0056 0 .0055Theil . . . . . . . . . . . . . . . . . . . . . . . . . . . . . . . . . . . . . . . . 0 .0001 0 .0001 0 .0001 0 .0001 0 .0001 0 .0001 0 .0001 0 .0001 0 .0001Atkinson: e=0 .25 . . . . . . . . . . . . . . . . . . . . . . . . . . . . . . . . . . . . 0 .0007 0 .0007 0 .0007 0 .0008 0 .0008 0 .0007 0 .0007 0 .0006 0 .0006 e=0 .50 . . . . . . . . . . . . . . . . . . . . . . . . . . . . . . . . . . . . 0 .0013 0 .0012 0 .0013 0 .0014 0 .0014 0 .0013 0 .0012 0 .0011 0 .0011 e=0 .75 . . . . . . . . . . . . . . . . . . . . . . . . . . . . . . . . . . . . 0 .0019 0 .0018 0 .0018 0 .0019 0 .0020 0 .0018 0 .0018 0 .0017 0 .0016
See footnotes at end of table .

U.S. Census Bureau Income, Poverty, and Health Insurance Coverage in the United States: 2012 43
Table A-2.Selected Measures of Household Income Dispersion: 1967 to 2012—Con .(Income in 2012 CPI-U-RS adjusted dollars. Beginning with 2010, standard errors were calculated using replicate weights. For further explanation of income inequality measures, see Current Population Reports, Series P60-204, The Changing Shape of the Nation’s Income Distribution: 1947–1998. For information on confidentiality protection, sampling error, nonsampling error, and definitions, see www.census.gov/prod/techdoc/cps/cpsmar13.pdf)
Measures of incomedispersion 198312 1982 1981 1980 197913 1978 1977 197614 197515
MEASUREHousehold Income at Selected Percentiles10th percentile limit . . . . . . . . . . . . . . . . . . . . . . . . . . . . 11,518 11,562 11,773 11,939 12,100 12,335 12,087 11,940 11,87420th percentile limit . . . . . . . . . . . . . . . . . . . . . . . . . . . . 19,608 19,190 19,437 19,839 20,633 20,406 19,790 19,832 19,40240th percentile limit . . . . . . . . . . . . . . . . . . . . . . . . . . . . 36,459 36,498 36,336 37,206 38,318 38,584 37,275 36,949 36,41350th (median) . . . . . . . . . . . . . . . . . . . . . . . . . . . . . . . . 45,760 46,082 46,205 46,985 48,520 48,655 46,842 46,548 45,78860th percentile limit . . . . . . . . . . . . . . . . . . . . . . . . . . . . 55,957 55,766 56,200 57,040 58,954 58,380 56,817 56,286 55,02380th percentile limit . . . . . . . . . . . . . . . . . . . . . . . . . . . . 84,565 83,158 83,089 83,517 85,479 84,907 82,833 80,979 79,00390th percentile limit . . . . . . . . . . . . . . . . . . . . . . . . . . . . 110,680 109,665 108,536 108,517 110,648 109,816 105,647 103,839 101,27695th percentile limit . . . . . . . . . . . . . . . . . . . . . . . . . . . . 139,131 137,270 133,717 134,405 138,122 135,833 131,153 128,422 124,671
Household Income Ratios of Selected Percentiles90th/10th . . . . . . . . . . . . . . . . . . . . . . . . . . . . . . . . . . . . 9 .61 9 .49 9 .22 9 .09 9 .15 8 .90 8 .74 8 .70 8 .5395th/20th . . . . . . . . . . . . . . . . . . . . . . . . . . . . . . . . . . . . 7 .10 7 .15 6 .88 6 .78 6 .69 6 .66 6 .63 6 .48 6 .4395th/50th . . . . . . . . . . . . . . . . . . . . . . . . . . . . . . . . . . . . 3 .04 2 .98 2 .89 2 .86 2 .85 2 .79 2 .80 2 .76 2 .7280th/50th . . . . . . . . . . . . . . . . . . . . . . . . . . . . . . . . . . . . 1 .85 1 .80 1 .80 1 .78 1 .76 1 .75 1 .77 1 .74 1 .7380th/20th . . . . . . . . . . . . . . . . . . . . . . . . . . . . . . . . . . . . 4 .31 4 .33 4 .28 4 .21 4 .14 4 .16 4 .19 4 .08 4 .0720th/50th . . . . . . . . . . . . . . . . . . . . . . . . . . . . . . . . . . . . 0 .43 0 .42 0 .42 0 .42 0 .43 0 .42 0 .42 0 .43 0 .42
Mean Household Income of QuintilesLowest quintile . . . . . . . . . . . . . . . . . . . . . . . . . . . . . . . . 11,071 10,942 11,148 11,435 11,808 11,903 11,510 11,567 11,289Second quintile . . . . . . . . . . . . . . . . . . . . . . . . . . . . . . . 27,812 27,692 27,770 28,460 29,370 29,231 28,331 28,317 27,728Third quintile . . . . . . . . . . . . . . . . . . . . . . . . . . . . . . . . . 45,981 45,837 46,004 46,962 48,423 48,265 46,868 46,567 45,494Fourth quintile . . . . . . . . . . . . . . . . . . . . . . . . . . . . . . . . 68,999 68,172 68,576 69,187 71,059 70,701 68,669 67,625 66,104Highest quintile . . . . . . . . . . . . . . . . . . . . . . . . . . . . . . . 126,684 125,032 122,497 123,357 127,527 126,227 122,454 119,684 116,711 Top 5 percent . . . . . . . . . . . . . . . . . . . . . . . . . . . . . . . 191,406 188,925 182,029 184,344 194,492 192,131 187,332 182,361 177,114
Shares of Household Income of QuintilesLowest quintile . . . . . . . . . . . . . . . . . . . . . . . . . . . . . . . . 4 .0 4 .0 4 .1 4 .2 4 .1 4 .2 4 .2 4 .3 4 .3Second quintile . . . . . . . . . . . . . . . . . . . . . . . . . . . . . . . 9 .9 10 .0 10 .1 10 .2 10 .2 10 .2 10 .2 10 .3 10 .4Third quintile . . . . . . . . . . . . . . . . . . . . . . . . . . . . . . . . . 16 .4 16 .5 16 .7 16 .8 16 .8 16 .8 16 .9 17 .0 17 .0Fourth quintile . . . . . . . . . . . . . . . . . . . . . . . . . . . . . . . . 24 .6 24 .5 24 .8 24 .7 24 .6 24 .7 24 .7 24 .7 24 .7Highest quintile . . . . . . . . . . . . . . . . . . . . . . . . . . . . . . . 45 .1 45 .0 44 .3 44 .1 44 .2 44 .1 44 .0 43 .7 43 .6 Top 5 percent . . . . . . . . . . . . . . . . . . . . . . . . . . . . . . . 17 .0 17 .0 16 .5 16 .5 16 .9 16 .8 16 .8 16 .6 16 .5
Summary MeasuresGini index of income inequality . . . . . . . . . . . . . . . . . . . 0 .414 0 .412 0 .406 0 .403 0 .404 0 .402 0 .402 0 .398 0 .397Mean logarithmic deviation of income . . . . . . . . . . . . . . 0 .397 0 .401 0 .387 0 .375 0 .369 0 .363 0 .364 0 .361 0 .361Theil . . . . . . . . . . . . . . . . . . . . . . . . . . . . . . . . . . . . . . . . 0 .288 0 .287 0 .277 0 .274 0 .279 0 .275 0 .276 0 .271 0 .270Atkinson: e=0 .25 . . . . . . . . . . . . . . . . . . . . . . . . . . . . . . . . . . . . 0 .072 0 .072 0 .070 0 .069 0 .070 0 .069 0 .069 0 .068 0 .067 e=0 .50 . . . . . . . . . . . . . . . . . . . . . . . . . . . . . . . . . . . . 0 .147 0 .146 0 .141 0 .140 0 .141 0 .139 0 .139 0 .137 0 .136 e=0 .75 . . . . . . . . . . . . . . . . . . . . . . . . . . . . . . . . . . . . 0 .226 0 .226 0 .220 0 .216 0 .216 0 .213 0 .213 0 .211 0 .210
STANDARD ERRORHousehold Income at Selected Percentiles10th percentile limit . . . . . . . . . . . . . . . . . . . . . . . . . . . . 92 92 139 136 134 135 129 129 12320th percentile limit . . . . . . . . . . . . . . . . . . . . . . . . . . . . 123 123 125 131 140 141 138 141 14340th percentile limit . . . . . . . . . . . . . . . . . . . . . . . . . . . . 198 209 217 226 233 205 213 214 21450th (median) . . . . . . . . . . . . . . . . . . . . . . . . . . . . . . . . 208 208 242 241 230 197 176 172 18660th percentile limit . . . . . . . . . . . . . . . . . . . . . . . . . . . . 246 256 283 235 246 267 233 235 24380th percentile limit . . . . . . . . . . . . . . . . . . . . . . . . . . . . 280 309 247 292 247 315 243 280 33590th percentile limit . . . . . . . . . . . . . . . . . . . . . . . . . . . . 488 421 406 461 444 364 500 365 45995th percentile limit . . . . . . . . . . . . . . . . . . . . . . . . . . . . 665 791 744 713 763 742 643 740 672
Household Income Ratios of Selected Percentiles90th/10th . . . . . . . . . . . . . . . . . . . . . . . . . . . . . . . . . . . . 0 .088 0 .084 0 .114 0 .110 0 .108 0 .102 0 .102 0 .099 0 .09795th/20th . . . . . . . . . . . . . . . . . . . . . . . . . . . . . . . . . . . . 0 .056 0 .062 0 .059 0 .057 0 .059 0 .059 0 .056 0 .059 0 .05995th/50th . . . . . . . . . . . . . . . . . . . . . . . . . . . . . . . . . . . . 0 .019 0 .021 0 .020 0 .019 0 .020 0 .020 0 .018 0 .020 0 .01980th/50th . . . . . . . . . . . . . . . . . . . . . . . . . . . . . . . . . . . . 0 .010 0 .010 0 .009 0 .010 0 .009 0 .010 0 .009 0 .010 0 .01080th/20th . . . . . . . . . . . . . . . . . . . . . . . . . . . . . . . . . . . . 0 .031 0 .032 0 .030 0 .031 0 .031 0 .033 0 .032 0 .032 0 .03520th/50th . . . . . . . . . . . . . . . . . . . . . . . . . . . . . . . . . . . . 0 .003 0 .003 0 .003 0 .003 0 .003 0 .003 0 .003 0 .004 0 .004
Mean Household Income of QuintilesLowest quintile . . . . . . . . . . . . . . . . . . . . . . . . . . . . . . . . 44 45 46 45 46 47 49 48 48Second quintile . . . . . . . . . . . . . . . . . . . . . . . . . . . . . . . 40 40 39 41 43 44 44 44 44Third quintile . . . . . . . . . . . . . . . . . . . . . . . . . . . . . . . . . 47 46 48 48 50 50 49 49 47Fourth quintile . . . . . . . . . . . . . . . . . . . . . . . . . . . . . . . . 66 65 63 63 64 65 64 62 61Highest quintile . . . . . . . . . . . . . . . . . . . . . . . . . . . . . . . 401 403 378 408 455 453 464 460 461 Top 5 percent . . . . . . . . . . . . . . . . . . . . . . . . . . . . . . . 1,238 1,267 1,191 1,388 1,483 1,465 1,560 1,573 1,623
Shares of Household Income of QuintilesLowest quintile . . . . . . . . . . . . . . . . . . . . . . . . . . . . . . . . 0 .03 0 .03 0 .03 0 .03 0 .04 0 .04 0 .04 0 .04 0 .04Second quintile . . . . . . . . . . . . . . . . . . . . . . . . . . . . . . . 0 .08 0 .08 0 .08 0 .08 0 .08 0 .09 0 .09 0 .09 0 .09Third quintile . . . . . . . . . . . . . . . . . . . . . . . . . . . . . . . . . 0 .13 0 .13 0 .13 0 .14 0 .14 0 .14 0 .14 0 .15 0 .15Fourth quintile . . . . . . . . . . . . . . . . . . . . . . . . . . . . . . . . 0 .19 0 .20 0 .20 0 .20 0 .20 0 .21 0 .21 0 .21 0 .21Highest quintile . . . . . . . . . . . . . . . . . . . . . . . . . . . . . . . 0 .36 0 .36 0 .35 0 .36 0 .36 0 .37 0 .37 0 .37 0 .38 Top 5 percent . . . . . . . . . . . . . . . . . . . . . . . . . . . . . . . 0 .36 0 .36 0 .35 0 .36 0 .35 0 .35 0 .36 0 .36 0 .36
Summary MeasuresGini index of income inequality . . . . . . . . . . . . . . . 0 .0037 0 .0038 0 .0038 0 .0036 0 .0038 0 .0039 0 .0039 0 .0041 0 .0056Mean logarithmic deviation of income . . . . . . . . . . . . . . 0 .0056 0 .0057 0 .0056 0 .0051 0 .0050 0 .0054 0 .0054 0 .0054 0 .0059Theil . . . . . . . . . . . . . . . . . . . . . . . . . . . . . . . . . . . . . . . . 0 .0001 0 .0001 0 .0001 0 .0001 0 .0001 0 .0001 0 .0001 0 .0001 0 .0001Atkinson: e=0 .25 . . . . . . . . . . . . . . . . . . . . . . . . . . . . . . . . . . . . 0 .0006 0 .0006 0 .0006 0 .0006 0 .0006 0 .0006 0 .0006 0 .0006 0 .0007 e=0 .50 . . . . . . . . . . . . . . . . . . . . . . . . . . . . . . . . . . . . 0 .0011 0 .0011 0 .0011 0 .0010 0 .0011 0 .0011 0 .0011 0 .0011 0 .0012 e=0 .75 . . . . . . . . . . . . . . . . . . . . . . . . . . . . . . . . . . . . 0 .0016 0 .0017 0 .0017 0 .0016 0 .0017 0 .0016 0 .0017 0 .0017 0 .0018
See footnotes at end of table .
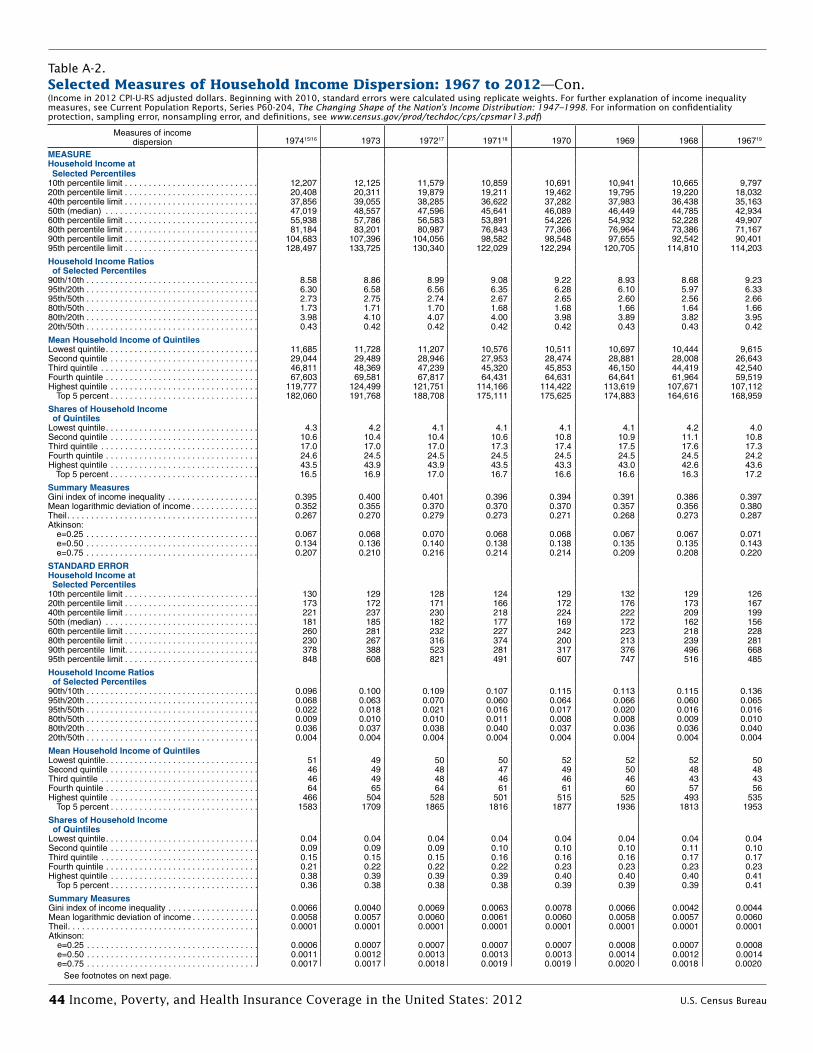
44 Income, Poverty, and Health Insurance Coverage in the United States: 2012 U.S. Census Bureau
Table A-2.Selected Measures of Household Income Dispersion: 1967 to 2012—Con .(Income in 2012 CPI-U-RS adjusted dollars. Beginning with 2010, standard errors were calculated using replicate weights. For further explanation of income inequality measures, see Current Population Reports, Series P60-204, The Changing Shape of the Nation’s Income Distribution: 1947–1998. For information on confidentiality protection, sampling error, nonsampling error, and definitions, see www.census.gov/prod/techdoc/cps/cpsmar13.pdf)
Measures of incomedispersion 197415/16 1973 197217 197118 1970 1969 1968 196719
MEASUREHousehold Income at Selected Percentiles10th percentile limit . . . . . . . . . . . . . . . . . . . . . . . . . . . . 12,207 12,125 11,579 10,859 10,691 10,941 10,665 9,79720th percentile limit . . . . . . . . . . . . . . . . . . . . . . . . . . . . 20,408 20,311 19,879 19,211 19,462 19,795 19,220 18,03240th percentile limit . . . . . . . . . . . . . . . . . . . . . . . . . . . . 37,856 39,055 38,285 36,622 37,282 37,983 36,438 35,16350th (median) . . . . . . . . . . . . . . . . . . . . . . . . . . . . . . . . 47,019 48,557 47,596 45,641 46,089 46,449 44,785 42,93460th percentile limit . . . . . . . . . . . . . . . . . . . . . . . . . . . . 55,938 57,786 56,583 53,891 54,226 54,932 52,228 49,90780th percentile limit . . . . . . . . . . . . . . . . . . . . . . . . . . . . 81,184 83,201 80,987 76,843 77,366 76,964 73,386 71,16790th percentile limit . . . . . . . . . . . . . . . . . . . . . . . . . . . . 104,683 107,396 104,056 98,582 98,548 97,655 92,542 90,40195th percentile limit . . . . . . . . . . . . . . . . . . . . . . . . . . . . 128,497 133,725 130,340 122,029 122,294 120,705 114,810 114,203
Household Income Ratios of Selected Percentiles90th/10th . . . . . . . . . . . . . . . . . . . . . . . . . . . . . . . . . . . . 8 .58 8 .86 8 .99 9 .08 9 .22 8 .93 8 .68 9 .2395th/20th . . . . . . . . . . . . . . . . . . . . . . . . . . . . . . . . . . . . 6 .30 6 .58 6 .56 6 .35 6 .28 6 .10 5 .97 6 .3395th/50th . . . . . . . . . . . . . . . . . . . . . . . . . . . . . . . . . . . . 2 .73 2 .75 2 .74 2 .67 2 .65 2 .60 2 .56 2 .6680th/50th . . . . . . . . . . . . . . . . . . . . . . . . . . . . . . . . . . . . 1 .73 1 .71 1 .70 1 .68 1 .68 1 .66 1 .64 1 .6680th/20th . . . . . . . . . . . . . . . . . . . . . . . . . . . . . . . . . . . . 3 .98 4 .10 4 .07 4 .00 3 .98 3 .89 3 .82 3 .9520th/50th . . . . . . . . . . . . . . . . . . . . . . . . . . . . . . . . . . . . 0 .43 0 .42 0 .42 0 .42 0 .42 0 .43 0 .43 0 .42
Mean Household Income of QuintilesLowest quintile . . . . . . . . . . . . . . . . . . . . . . . . . . . . . . . . 11,685 11,728 11,207 10,576 10,511 10,697 10,444 9,615Second quintile . . . . . . . . . . . . . . . . . . . . . . . . . . . . . . . 29,044 29,489 28,946 27,953 28,474 28,881 28,008 26,643Third quintile . . . . . . . . . . . . . . . . . . . . . . . . . . . . . . . . . 46,811 48,369 47,239 45,320 45,853 46,150 44,419 42,540Fourth quintile . . . . . . . . . . . . . . . . . . . . . . . . . . . . . . . . 67,603 69,581 67,817 64,431 64,631 64,641 61,964 59,519Highest quintile . . . . . . . . . . . . . . . . . . . . . . . . . . . . . . . 119,777 124,499 121,751 114,166 114,422 113,619 107,671 107,112 Top 5 percent . . . . . . . . . . . . . . . . . . . . . . . . . . . . . . . 182,060 191,768 188,708 175,111 175,625 174,883 164,616 168,959
Shares of Household Income of QuintilesLowest quintile . . . . . . . . . . . . . . . . . . . . . . . . . . . . . . . . 4 .3 4 .2 4 .1 4 .1 4 .1 4 .1 4 .2 4 .0Second quintile . . . . . . . . . . . . . . . . . . . . . . . . . . . . . . . 10 .6 10 .4 10 .4 10 .6 10 .8 10 .9 11 .1 10 .8Third quintile . . . . . . . . . . . . . . . . . . . . . . . . . . . . . . . . . 17 .0 17 .0 17 .0 17 .3 17 .4 17 .5 17 .6 17 .3Fourth quintile . . . . . . . . . . . . . . . . . . . . . . . . . . . . . . . . 24 .6 24 .5 24 .5 24 .5 24 .5 24 .5 24 .5 24 .2Highest quintile . . . . . . . . . . . . . . . . . . . . . . . . . . . . . . . 43 .5 43 .9 43 .9 43 .5 43 .3 43 .0 42 .6 43 .6 Top 5 percent . . . . . . . . . . . . . . . . . . . . . . . . . . . . . . . 16 .5 16 .9 17 .0 16 .7 16 .6 16 .6 16 .3 17 .2
Summary MeasuresGini index of income inequality . . . . . . . . . . . . . . . . . . . 0 .395 0 .400 0 .401 0 .396 0 .394 0 .391 0 .386 0 .397Mean logarithmic deviation of income . . . . . . . . . . . . . . 0 .352 0 .355 0 .370 0 .370 0 .370 0 .357 0 .356 0 .380Theil . . . . . . . . . . . . . . . . . . . . . . . . . . . . . . . . . . . . . . . . 0 .267 0 .270 0 .279 0 .273 0 .271 0 .268 0 .273 0 .287Atkinson: e=0 .25 . . . . . . . . . . . . . . . . . . . . . . . . . . . . . . . . . . . . 0 .067 0 .068 0 .070 0 .068 0 .068 0 .067 0 .067 0 .071 e=0 .50 . . . . . . . . . . . . . . . . . . . . . . . . . . . . . . . . . . . . 0 .134 0 .136 0 .140 0 .138 0 .138 0 .135 0 .135 0 .143 e=0 .75 . . . . . . . . . . . . . . . . . . . . . . . . . . . . . . . . . . . . 0 .207 0 .210 0 .216 0 .214 0 .214 0 .209 0 .208 0 .220
STANDARD ERRORHousehold Income at Selected Percentiles10th percentile limit . . . . . . . . . . . . . . . . . . . . . . . . . . . . 130 129 128 124 129 132 129 12620th percentile limit . . . . . . . . . . . . . . . . . . . . . . . . . . . . 173 172 171 166 172 176 173 16740th percentile limit . . . . . . . . . . . . . . . . . . . . . . . . . . . . 221 237 230 218 224 222 209 19950th (median) . . . . . . . . . . . . . . . . . . . . . . . . . . . . . . . . 181 185 182 177 169 172 162 15660th percentile limit . . . . . . . . . . . . . . . . . . . . . . . . . . . . 260 281 232 227 242 223 218 22880th percentile limit . . . . . . . . . . . . . . . . . . . . . . . . . . . . 230 267 316 374 200 213 239 28190th percentile limit . . . . . . . . . . . . . . . . . . . . . . . . . . . . 378 388 523 281 317 376 496 66895th percentile limit . . . . . . . . . . . . . . . . . . . . . . . . . . . . 848 608 821 491 607 747 516 485
Household Income Ratios of Selected Percentiles90th/10th . . . . . . . . . . . . . . . . . . . . . . . . . . . . . . . . . . . . 0 .096 0 .100 0 .109 0 .107 0 .115 0 .113 0 .115 0 .13695th/20th . . . . . . . . . . . . . . . . . . . . . . . . . . . . . . . . . . . . 0 .068 0 .063 0 .070 0 .060 0 .064 0 .066 0 .060 0 .06595th/50th . . . . . . . . . . . . . . . . . . . . . . . . . . . . . . . . . . . . 0 .022 0 .018 0 .021 0 .016 0 .017 0 .020 0 .016 0 .01680th/50th . . . . . . . . . . . . . . . . . . . . . . . . . . . . . . . . . . . . 0 .009 0 .010 0 .010 0 .011 0 .008 0 .008 0 .009 0 .01080th/20th . . . . . . . . . . . . . . . . . . . . . . . . . . . . . . . . . . . . 0 .036 0 .037 0 .038 0 .040 0 .037 0 .036 0 .036 0 .04020th/50th . . . . . . . . . . . . . . . . . . . . . . . . . . . . . . . . . . . . 0 .004 0 .004 0 .004 0 .004 0 .004 0 .004 0 .004 0 .004
Mean Household Income of QuintilesLowest quintile . . . . . . . . . . . . . . . . . . . . . . . . . . . . . . . . 51 49 50 50 52 52 52 50Second quintile . . . . . . . . . . . . . . . . . . . . . . . . . . . . . . . 46 49 48 47 49 50 48 48Third quintile . . . . . . . . . . . . . . . . . . . . . . . . . . . . . . . . . 46 49 48 46 46 46 43 43Fourth quintile . . . . . . . . . . . . . . . . . . . . . . . . . . . . . . . . 64 65 64 61 61 60 57 56Highest quintile . . . . . . . . . . . . . . . . . . . . . . . . . . . . . . . 466 504 528 501 515 525 493 535 Top 5 percent . . . . . . . . . . . . . . . . . . . . . . . . . . . . . . . 1583 1709 1865 1816 1877 1936 1813 1953
Shares of Household Income of QuintilesLowest quintile . . . . . . . . . . . . . . . . . . . . . . . . . . . . . . . . 0 .04 0 .04 0 .04 0 .04 0 .04 0 .04 0 .04 0 .04Second quintile . . . . . . . . . . . . . . . . . . . . . . . . . . . . . . . 0 .09 0 .09 0 .09 0 .10 0 .10 0 .10 0 .11 0 .10Third quintile . . . . . . . . . . . . . . . . . . . . . . . . . . . . . . . . . 0 .15 0 .15 0 .15 0 .16 0 .16 0 .16 0 .17 0 .17Fourth quintile . . . . . . . . . . . . . . . . . . . . . . . . . . . . . . . . 0 .21 0 .22 0 .22 0 .22 0 .23 0 .23 0 .23 0 .23Highest quintile . . . . . . . . . . . . . . . . . . . . . . . . . . . . . . . 0 .38 0 .39 0 .39 0 .39 0 .40 0 .40 0 .40 0 .41 Top 5 percent . . . . . . . . . . . . . . . . . . . . . . . . . . . . . . . 0 .36 0 .38 0 .38 0 .38 0 .39 0 .39 0 .39 0 .41
Summary MeasuresGini index of income inequality . . . . . . . . . . . . . . . . . . . 0 .0066 0 .0040 0 .0069 0 .0063 0 .0078 0 .0066 0 .0042 0 .0044Mean logarithmic deviation of income . . . . . . . . . . . . . . 0 .0058 0 .0057 0 .0060 0 .0061 0 .0060 0 .0058 0 .0057 0 .0060Theil . . . . . . . . . . . . . . . . . . . . . . . . . . . . . . . . . . . . . . . . 0 .0001 0 .0001 0 .0001 0 .0001 0 .0001 0 .0001 0 .0001 0 .0001Atkinson: e=0 .25 . . . . . . . . . . . . . . . . . . . . . . . . . . . . . . . . . . . . 0 .0006 0 .0007 0 .0007 0 .0007 0 .0007 0 .0008 0 .0007 0 .0008 e=0 .50 . . . . . . . . . . . . . . . . . . . . . . . . . . . . . . . . . . . . 0 .0011 0 .0012 0 .0013 0 .0013 0 .0013 0 .0014 0 .0012 0 .0014 e=0 .75 . . . . . . . . . . . . . . . . . . . . . . . . . . . . . . . . . . . . 0 .0017 0 .0017 0 .0018 0 .0019 0 .0019 0 .0020 0 .0018 0 .0020
See footnotes on next page .
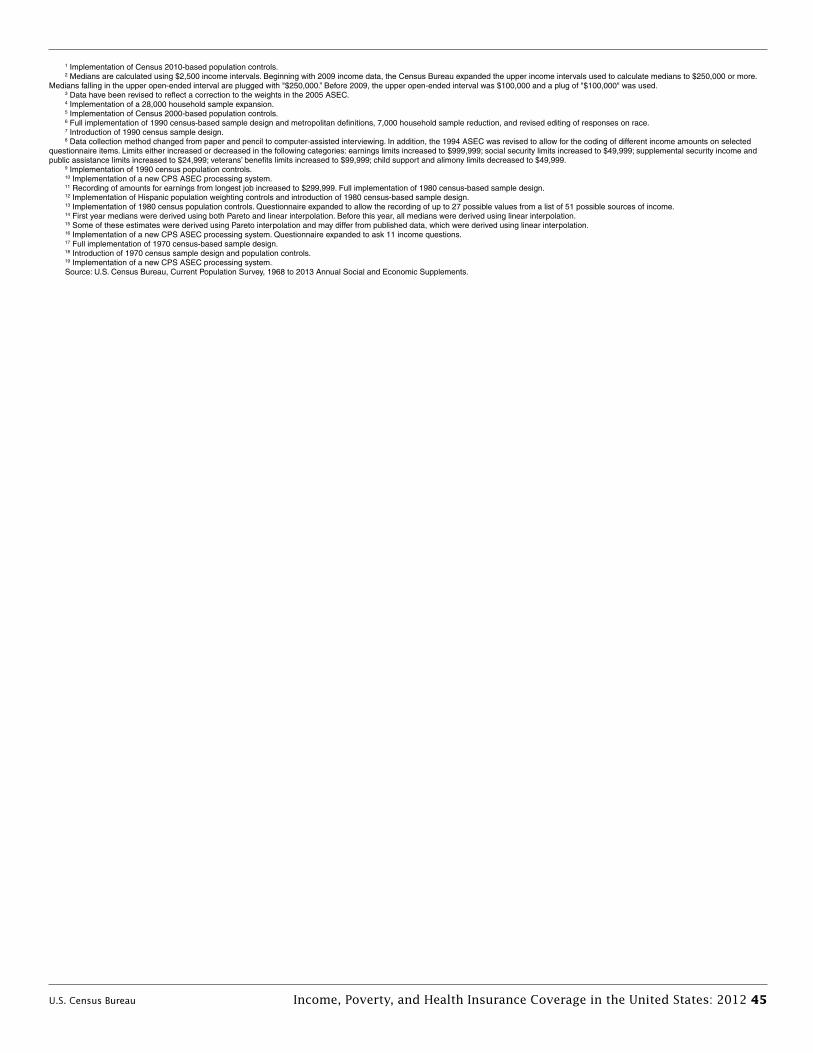
U.S. Census Bureau Income, Poverty, and Health Insurance Coverage in the United States: 2012 45
1 Implementation of Census 2010-based population controls .2 Medians are calculated using $2,500 income intervals . Beginning with 2009 income data, the Census Bureau expanded the upper income intervals used to calculate medians to $250,000 or more .
Medians falling in the upper open-ended interval are plugged with "$250,000 .” Before 2009, the upper open-ended interval was $100,000 and a plug of "$100,000" was used .3 Data have been revised to reflect a correction to the weights in the 2005 ASEC .4 Implementation of a 28,000 household sample expansion .5 Implementation of Census 2000-based population controls .6 Full implementation of 1990 census-based sample design and metropolitan definitions, 7,000 household sample reduction, and revised editing of responses on race .7 Introduction of 1990 census sample design .8 Data collection method changed from paper and pencil to computer-assisted interviewing . In addition, the 1994 ASEC was revised to allow for the coding of different income amounts on selected
questionnaire items . Limits either increased or decreased in the following categories: earnings limits increased to $999,999; social security limits increased to $49,999; supplemental security income and public assistance limits increased to $24,999; veterans’ benefits limits increased to $99,999; child support and alimony limits decreased to $49,999 .
9 Implementation of 1990 census population controls .10 Implementation of a new CPS ASEC processing system .11 Recording of amounts for earnings from longest job increased to $299,999 . Full implementation of 1980 census-based sample design . 12 Implementation of Hispanic population weighting controls and introduction of 1980 census-based sample design .13 Implementation of 1980 census population controls . Questionnaire expanded to allow the recording of up to 27 possible values from a list of 51 possible sources of income .14 First year medians were derived using both Pareto and linear interpolation . Before this year, all medians were derived using linear interpolation .15 Some of these estimates were derived using Pareto interpolation and may differ from published data, which were derived using linear interpolation .16 Implementation of a new CPS ASEC processing system . Questionnaire expanded to ask 11 income questions . 17 Full implementation of 1970 census-based sample design .18 Introduction of 1970 census sample design and population controls .19 Implementation of a new CPS ASEC processing system . Source: U .S . Census Bureau, Current Population Survey, 1968 to 2013 Annual Social and Economic Supplements .
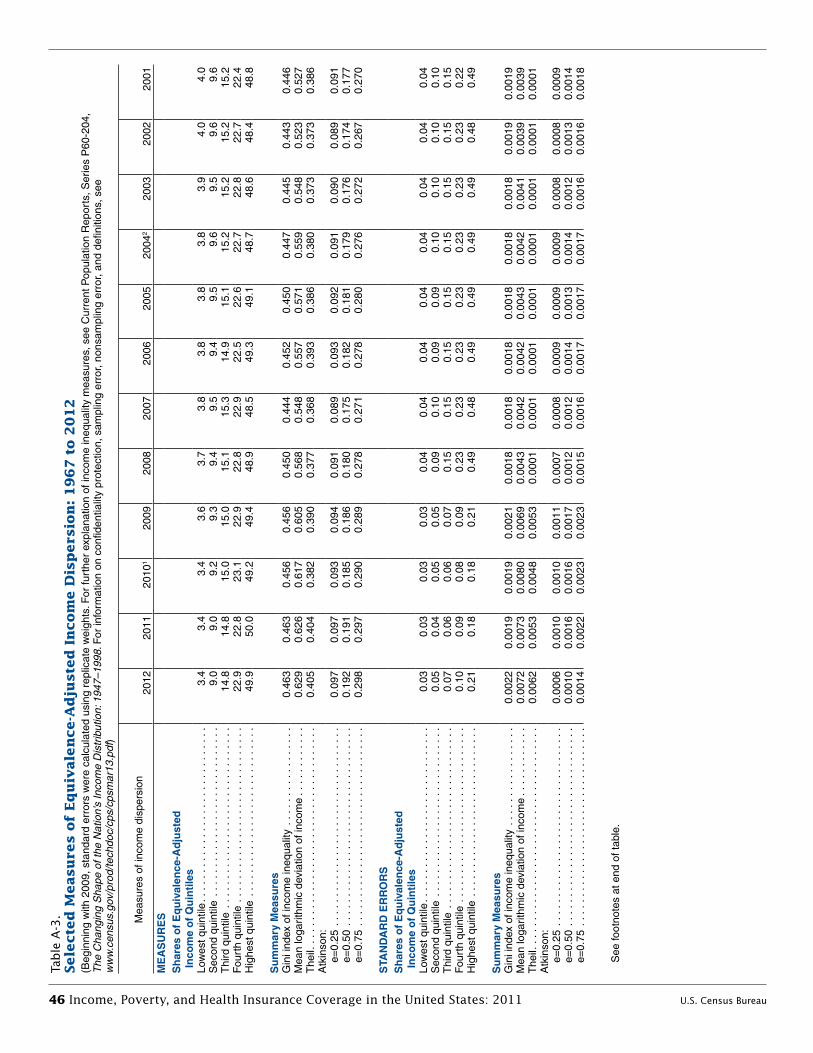
46 Income, Poverty, and Health Insurance Coverage in the United States: 2011 U.S. Census Bureau
Table
A-3
. Sele
cte
d M
easu
res o
f Eq
uiv
ale
nce-A
dju
ste
d I
ncom
e D
isp
ers
ion
: 1
96
7 t
o 2
01
2(B
egin
ning
with
200
9, s
tand
ard
erro
rs w
ere
calc
ulat
ed u
sing
rep
licat
e w
eigh
ts . F
or fu
rthe
r ex
plan
atio
n of
inco
me
ineq
ualit
y m
easu
res,
see
Cur
rent
Pop
ulat
ion
Rep
orts
, Ser
ies
P60
-204
, T
he C
hang
ing
Sha
pe o
f the
Nat
ion’
s In
com
e D
istr
ibut
ion:
194
7–19
98 . F
or in
form
atio
n on
con
fiden
tialit
y pr
otec
tion,
sam
plin
g er
ror,
nons
ampl
ing
erro
r, an
d de
finiti
ons,
see
w
ww
.cen
sus.
gov/
prod
/tech
doc/
cps/
cpsm
ar13
)
S
ee fo
otno
tes
at e
nd o
f tab
le .
Mea
sure
s of
inco
me
disp
ersi
on20
1220
1120
101
2009
2008
2007
2006
2005
2004
220
0320
0220
01M
EA
SU
RE
SS
har
es o
f E
qu
ival
ence
-Ad
just
ed
In
com
e o
f Q
uin
tile
sLo
wes
t qui
ntile
. . .
. . .
. . .
. . .
. . .
. . .
. . .
. . .
. . .
. . .
3 .
43 .
43 .
43 .
63 .
73 .
83 .
83 .
83 .
83 .
94 .
04 .
0S
econ
d qu
intil
e .
. . .
. . .
. . .
. . .
. . .
. . .
. . .
. . .
. . .
. 9 .
09 .
09 .
29 .
39 .
49 .
59 .
49 .
59 .
69 .
59 .
69 .
6T
hird
qui
ntile
. . .
. . .
. . .
. . .
. . .
. . .
. . .
. . .
. . .
. . .
.
14 .8
14 .8
15 .0
15 .0
15 .1
15 .3
14 .9
15 .1
15 .2
15 .2
15 .2
15 .2
Fou
rth
quin
tile
. . .
. . .
. . .
. . .
. . .
. . .
. . .
. . .
. . .
. . .
22
.922
.823
.122
.922
.822
.922
.522
.622
.722
.822
.722
.4H
ighe
st q
uint
ile .
. . .
. . .
. . .
. . .
. . .
. . .
. . .
. . .
. . .
. 49
.950
.049
.249
.448
.948
.549
.349
.148
.748
.648
.448
.8
Su
mm
ary
Mea
sure
sG
ini i
ndex
of i
ncom
e in
equa
lity
. . .
. . .
. . .
. . .
. . .
. .
0 .46
30 .
463
0 .45
60 .
456
0 .45
00 .
444
0 .45
20 .
450
0 .44
70 .
445
0 .44
30 .
446
Mea
n lo
garit
hmic
dev
iatio
n of
inco
me
. . .
. . .
. . .
. . .
0 .
629
0 .62
60 .
617
0 .60
50 .
568
0 .54
80 .
557
0 .57
10 .
559
0 .54
80 .
523
0 .52
7T
heil .
. . .
. . .
. . .
. . .
. . .
. . .
. . .
. . .
. . .
. . .
. . .
. . .
.
0 .40
50 .
404
0 .38
20 .
390
0 .37
70 .
368
0 .39
30 .
386
0 .38
00 .
373
0 .37
30 .
386
Atk
inso
n:
e=0 .
25 .
. . .
. . .
. . .
. . .
. . .
. . .
. . .
. . .
. . .
. . .
. . .
0 .
097
0 .09
70 .
093
0 .09
40 .
091
0 .08
90 .
093
0 .09
20 .
091
0 .09
00 .
089
0 .09
1
e=0 .
50 .
. . .
. . .
. . .
. . .
. . .
. . .
. . .
. . .
. . .
. . .
. . .
0 .
192
0 .19
10 .
185
0 .18
60 .
180
0 .17
50 .
182
0 .18
10 .
179
0 .17
60 .
174
0 .17
7
e=0 .
75 .
. . .
. . .
. . .
. . .
. . .
. . .
. . .
. . .
. . .
. . .
. . .
0 .
298
0 .29
70 .
290
0 .28
90 .
278
0 .27
10 .
278
0 .28
00 .
276
0 .27
20 .
267
0 .27
0
STA
ND
AR
D E
RR
OR
SS
har
es o
f E
qu
ival
ence
-Ad
just
ed
In
com
e o
f Q
uin
tile
sLo
wes
t qui
ntile
. . .
. . .
. . .
. . .
. . .
. . .
. . .
. . .
. . .
. . .
0 .
030 .
030 .
030 .
030 .
040 .
040 .
040 .
040 .
040 .
040 .
040 .
04S
econ
d qu
intil
e .
. . .
. . .
. . .
. . .
. . .
. . .
. . .
. . .
. . .
. 0 .
050 .
040 .
050 .
050 .
090 .
100 .
090 .
090 .
100 .
100 .
100 .
10T
hird
qui
ntile
. . .
. . .
. . .
. . .
. . .
. . .
. . .
. . .
. . .
. . .
.
0 .07
0 .06
0 .06
0 .07
0 .15
0 .15
0 .15
0 .15
0 .15
0 .15
0 .15
0 .15
Fou
rth
quin
tile
. . .
. . .
. . .
. . .
. . .
. . .
. . .
. . .
. . .
. . .
0 .
100 .
090 .
080 .
090 .
230 .
230 .
230 .
230 .
230 .
230 .
230 .
22H
ighe
st q
uint
ile .
. . .
. . .
. . .
. . .
. . .
. . .
. . .
. . .
. . .
. 0 .
210 .
180 .
180 .
210 .
490 .
480 .
490 .
490 .
490 .
490 .
480 .
49
Su
mm
ary
Mea
sure
sG
ini i
ndex
of i
ncom
e in
equa
lity
. . .
. . .
. . .
. . .
. . .
. .
0 .00
220 .
0019
0 .00
190 .
0021
0 .00
180 .
0018
0 .00
180 .
0018
0 .00
180 .
0018
0 .00
190 .
0019
Mea
n lo
garit
hmic
dev
iatio
n of
inco
me
. . .
. . .
. . .
. . .
0 .
0072
0 .00
730 .
0080
0 .00
690 .
0043
0 .00
420 .
0042
0 .00
430 .
0042
0 .00
410 .
0039
0 .00
39T
heil .
. . .
. . .
. . .
. . .
. . .
. . .
. . .
. . .
. . .
. . .
. . .
. . .
.
0 .00
620 .
0053
0 .00
480 .
0053
0 .00
010 .
0001
0 .00
010 .
0001
0 .00
010 .
0001
0 .00
010 .
0001
Atk
inso
n:
e=0 .
25 .
. . .
. . .
. . .
. . .
. . .
. . .
. . .
. . .
. . .
. . .
. . .
0 .
0006
0 .00
100 .
0010
0 .00
110 .
0007
0 .00
080 .
0009
0 .00
090 .
0009
0 .00
080 .
0008
0 .00
09
e=0 .
50 .
. . .
. . .
. . .
. . .
. . .
. . .
. . .
. . .
. . .
. . .
. . .
0 .
0010
0 .00
160 .
0016
0 .00
170 .
0012
0 .00
120 .
0014
0 .00
130 .
0014
0 .00
120 .
0013
0 .00
14
e=0 .
75 .
. . .
. . .
. . .
. . .
. . .
. . .
. . .
. . .
. . .
. . .
. . .
0 .
0014
0 .00
220 .
0023
0 .00
230 .
0015
0 .00
160 .
0017
0 .00
170 .
0017
0 .00
160 .
0016
0 .00
18
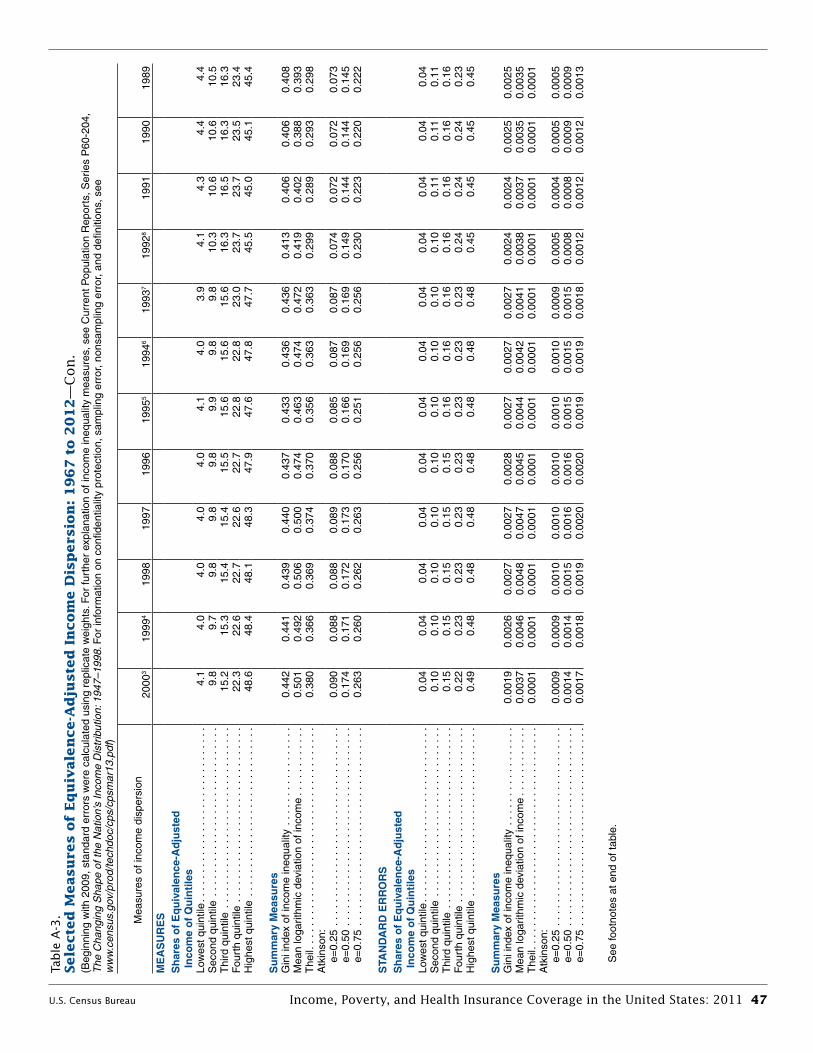
U.S. Census Bureau Income, Poverty, and Health Insurance Coverage in the United States: 2011 47
S
ee fo
otno
tes
at e
nd o
f tab
le .
Table
A-3
. Sele
cte
d M
easu
res o
f Eq
uiv
ale
nce-A
dju
ste
d I
ncom
e D
isp
ers
ion
: 1
96
7 t
o 2
01
2—
Con
.(B
egin
ning
with
200
9, s
tand
ard
erro
rs w
ere
calc
ulat
ed u
sing
rep
licat
e w
eigh
ts . F
or fu
rthe
r ex
plan
atio
n of
inco
me
ineq
ualit
y m
easu
res,
see
Cur
rent
Pop
ulat
ion
Rep
orts
, Ser
ies
P60
-204
, T
he C
hang
ing
Sha
pe o
f the
Nat
ion’
s In
com
e D
istr
ibut
ion:
194
7–19
98 . F
or in
form
atio
n on
con
fiden
tialit
y pr
otec
tion,
sam
plin
g er
ror,
nons
ampl
ing
erro
r, an
d de
finiti
ons,
see
w
ww
.cen
sus.
gov/
prod
/tech
doc/
cps/
cpsm
ar13
)
Mea
sure
s of
inco
me
disp
ersi
on
2000
319
994
1998
1997
1996
1995
519
946
1993
719
928
1991
1990
1989
ME
AS
UR
ES
Sh
ares
of
Eq
uiv
alen
ce-A
dju
sted
I
nco
me
of
Qu
inti
les
Low
est q
uint
ile .
. . .
. . .
. . .
. . .
. . .
. . .
. . .
. . .
. . .
. .
4 .1
4 .0
4 .0
4 .0
4 .0
4 .1
4 .0
3 .9
4 .1
4 .3
4 .4
4 .4
Sec
ond
quin
tile
. . .
. . .
. . .
. . .
. . .
. . .
. . .
. . .
. . .
. .
9 .8
9 .7
9 .8
9 .8
9 .8
9 .9
9 .8
9 .8
10 .3
10 .6
10 .6
10 .5
Thi
rd q
uint
ile .
. . .
. . .
. . .
. . .
. . .
. . .
. . .
. . .
. . .
. . .
15
.215
.315
.415
.415
.515
.615
.615
.616
.316
.516
.316
.3F
ourt
h qu
intil
e .
. . .
. . .
. . .
. . .
. . .
. . .
. . .
. . .
. . .
. .
22 .3
22 .6
22 .7
22 .6
22 .7
22 .8
22 .8
23 .0
23 .7
23 .7
23 .5
23 .4
Hig
hest
qui
ntile
. . .
. . .
. . .
. . .
. . .
. . .
. . .
. . .
. . .
. .
48 .6
48 .4
48 .1
48 .3
47 .9
47 .6
47 .8
47 .7
45 .5
45 .0
45 .1
45 .4
Su
mm
ary
Mea
sure
sG
ini i
ndex
of i
ncom
e in
equa
lity
. . .
. . .
. . .
. . .
. . .
. .
0 .44
20 .
441
0 .43
90 .
440
0 .43
70 .
433
0 .43
60 .
436
0 .41
30 .
406
0 .40
60 .
408
Mea
n lo
garit
hmic
dev
iatio
n of
inco
me
. . .
. . .
. . .
. . .
0 .
501
0 .49
20 .
506
0 .50
00 .
474
0 .46
30 .
474
0 .47
20 .
419
0 .40
20 .
388
0 .39
3T
heil .
. . .
. . .
. . .
. . .
. . .
. . .
. . .
. . .
. . .
. . .
. . .
. . .
.
0 .38
00 .
366
0 .36
90 .
374
0 .37
00 .
356
0 .36
30 .
363
0 .29
90 .
289
0 .29
30 .
298
Atk
inso
n:
e=0 .
25 .
. . .
. . .
. . .
. . .
. . .
. . .
. . .
. . .
. . .
. . .
. . .
0 .
090
0 .08
80 .
088
0 .08
90 .
088
0 .08
50 .
087
0 .08
70 .
074
0 .07
20 .
072
0 .07
3
e=0 .
50 .
. . .
. . .
. . .
. . .
. . .
. . .
. . .
. . .
. . .
. . .
. . .
0 .
174
0 .17
10 .
172
0 .17
30 .
170
0 .16
60 .
169
0 .16
90 .
149
0 .14
40 .
144
0 .14
5
e=0 .
75 .
. . .
. . .
. . .
. . .
. . .
. . .
. . .
. . .
. . .
. . .
. . .
0 .
263
0 .26
00 .
262
0 .26
30 .
256
0 .25
10 .
256
0 .25
60 .
230
0 .22
30 .
220
0 .22
2
STA
ND
AR
D E
RR
OR
SS
har
es o
f E
qu
ival
ence
-Ad
just
ed
In
com
e o
f Q
uin
tile
sLo
wes
t qui
ntile
. . .
. . .
. . .
. . .
. . .
. . .
. . .
. . .
. . .
. . .
0 .
040 .
040 .
040 .
040 .
040 .
040 .
040 .
040 .
040 .
040 .
040 .
04S
econ
d qu
intil
e .
. . .
. . .
. . .
. . .
. . .
. . .
. . .
. . .
. . .
. 0 .
100 .
100 .
100 .
100 .
100 .
100 .
100 .
100 .
100 .
110 .
110 .
11T
hird
qui
ntile
. . .
. . .
. . .
. . .
. . .
. . .
. . .
. . .
. . .
. . .
.
0 .15
0 .15
0 .15
0 .15
0 .15
0 .16
0 .16
0 .16
0 .16
0 .16
0 .16
0 .16
Fou
rth
quin
tile
. . .
. . .
. . .
. . .
. . .
. . .
. . .
. . .
. . .
. . .
0 .
220 .
230 .
230 .
230 .
230 .
230 .
230 .
230 .
240 .
240 .
240 .
23H
ighe
st q
uint
ile .
. . .
. . .
. . .
. . .
. . .
. . .
. . .
. . .
. . .
. 0 .
490 .
480 .
480 .
480 .
480 .
480 .
480 .
480 .
450 .
450 .
450 .
45
Su
mm
ary
Mea
sure
sG
ini i
ndex
of i
ncom
e in
equa
lity
. . .
. . .
. . .
. . .
. . .
. .
0 .00
190 .
0026
0 .00
270 .
0027
0 .00
280 .
0027
0 .00
270 .
0027
0 .00
240 .
0024
0 .00
250 .
0025
Mea
n lo
garit
hmic
dev
iatio
n of
inco
me
. . .
. . .
. . .
. . .
0 .
0037
0 .00
460 .
0048
0 .00
470 .
0045
0 .00
440 .
0042
0 .00
410 .
0038
0 .00
370 .
0035
0 .00
35T
heil .
. . .
. . .
. . .
. . .
. . .
. . .
. . .
. . .
. . .
. . .
. . .
. . .
.
0 .00
010 .
0001
0 .00
010 .
0001
0 .00
010 .
0001
0 .00
010 .
0001
0 .00
010 .
0001
0 .00
010 .
0001
Atk
inso
n:
e=0 .
25 .
. . .
. . .
. . .
. . .
. . .
. . .
. . .
. . .
. . .
. . .
. . .
0 .
0009
0 .00
090 .
0010
0 .00
100 .
0010
0 .00
100 .
0010
0 .00
090 .
0005
0 .00
040 .
0005
0 .00
05
e=0 .
50 .
. . .
. . .
. . .
. . .
. . .
. . .
. . .
. . .
. . .
. . .
. . .
0 .
0014
0 .00
140 .
0015
0 .00
160 .
0016
0 .00
150 .
0015
0 .00
150 .
0008
0 .00
080 .
0009
0 .00
09
e=0 .
75 .
. . .
. . .
. . .
. . .
. . .
. . .
. . .
. . .
. . .
. . .
. . .
0 .
0017
0 .00
180 .
0019
0 .00
200 .
0020
0 .00
190 .
0019
0 .00
180 .
0012
0 .00
120 .
0012
0 .00
13

48 Income, Poverty, and Health Insurance Coverage in the United States: 2011 U.S. Census Bureau
S
ee fo
otno
tes
at e
nd o
f tab
le .
Table
A-3
. Sele
cte
d M
easu
res o
f Eq
uiv
ale
nce-A
dju
ste
d I
ncom
e D
isp
ers
ion
: 1
96
7 t
o 2
01
2—
Con
.(B
egin
ning
with
200
9, s
tand
ard
erro
rs w
ere
calc
ulat
ed u
sing
rep
licat
e w
eigh
ts . F
or fu
rthe
r ex
plan
atio
n of
inco
me
ineq
ualit
y m
easu
res,
see
Cur
rent
Pop
ulat
ion
Rep
orts
, Ser
ies
P60
-204
, T
he C
hang
ing
Sha
pe o
f the
Nat
ion’
s In
com
e D
istr
ibut
ion:
194
7–19
98 . F
or in
form
atio
n on
con
fiden
tialit
y pr
otec
tion,
sam
plin
g er
ror,
nons
ampl
ing
erro
r, an
d de
finiti
ons,
see
w
ww
.cen
sus.
gov/
prod
/tech
doc/
cps/
cpsm
ar13
)
Mea
sure
s of
inco
me
disp
ersi
on
19
8819
879
1986
1985
1019
8419
8311
1982
1981
1980
1979
1219
7819
77M
EA
SU
RE
SS
har
es o
f E
qu
ival
ence
-Ad
just
ed
In
com
es o
f Q
uin
tile
sLo
wes
t qui
ntile
. . .
. . .
. . .
. . .
. . .
. . .
. . .
. . .
. . .
. .
4 .
44 .
44 .
54 .
64 .
64 .
64 .
75 .
05 .
25 .
35 .
45 .
5S
econ
d qu
intil
e .
. . .
. . .
. . .
. . .
. . .
. . .
. . .
. . .
. . .
10 .7
10 .8
10 .8
10 .9
11 .0
11 .0
11 .1
11 .4
11 .6
11 .7
11 .8
11 .7
Thi
rd q
uint
ile .
. . .
. . .
. . .
. . .
. . .
. . .
. . .
. . .
. . .
. .
16 .5
16 .7
16 .6
16 .7
16 .8
16 .9
17 .0
17 .2
17 .3
17 .2
17 .3
17 .3
Fou
rth
quin
tile
. . .
. . .
. . .
. . .
. . .
. . .
. . .
. . .
. . .
. .
23
.723
.823
.823
.724
.024
.023
.924
.024
.023
.823
.723
.7H
ighe
st q
uint
ile .
. . .
. . .
. . .
. . .
. . .
. . .
. . .
. . .
. . .
44
.744
.444
.344
.143
.643
.543
.242
.441
.941
.941
.841
.7
Su
mm
ary
Mea
sure
sG
ini i
ndex
of i
ncom
e in
equa
lity
. . .
. . .
. . .
. . .
. . .
.
0 .40
20 .
399
0 .39
70 .
394
0 .38
90 .
389
0 .38
40 .
373
0 .36
70 .
366
0 .36
30 .
362
Mea
n lo
garit
hmic
dev
iatio
n of
inco
me
. . .
. . .
. . .
. .
0 .38
00 .
381
0 .37
50 .
369
0 .36
60 .
373
0 .37
00 .
352
0 .33
00 .
322
0 .31
50 .
315
The
il . .
. . .
. . .
. . .
. . .
. . .
. . .
. . .
. . .
. . .
. . .
. . .
. .
0 .28
50 .
281
0 .27
60 .
269
0 .26
10 .
260
0 .25
50 .
241
0 .23
40 .
234
0 .23
10 .
231
Atk
inso
n:
e=0 .
25 .
. . .
. . .
. . .
. . .
. . .
. . .
. . .
. . .
. . .
. . .
. .
0 .07
00 .
069
0 .06
80 .
067
0 .06
50 .
065
0 .06
40 .
060
0 .05
80 .
058
0 .05
70 .
057
e=
0 .50
. . .
. . .
. . .
. . .
. . .
. . .
. . .
. . .
. . .
. . .
. . .
0 .
141
0 .13
90 .
137
0 .13
50 .
132
0 .13
20 .
129
0 .12
30 .
119
0 .11
80 .
116
0 .11
6
e=0 .
75 .
. . .
. . .
. . .
. . .
. . .
. . .
. . .
. . .
. . .
. . .
. .
0 .21
60 .
215
0 .21
20 .
208
0 .20
50 .
207
0 .20
30 .
194
0 .18
60 .
184
0 .18
00 .
180
STA
ND
AR
D E
RR
OR
SS
har
es o
f E
qu
ival
ence
-Ad
just
ed
In
com
e o
f Q
uin
tile
sLo
wes
t qui
ntile
. . .
. . .
. . .
. . .
. . .
. . .
. . .
. . .
. . .
. .
0 .
040 .
040 .
050 .
050 .
050 .
050 .
050 .
050 .
050 .
050 .
050 .
05S
econ
d qu
intil
e .
. . .
. . .
. . .
. . .
. . .
. . .
. . .
. . .
. . .
0 .
110 .
110 .
110 .
110 .
110 .
110 .
110 .
110 .
120 .
120 .
120 .
12T
hird
qui
ntile
. . .
. . .
. . .
. . .
. . .
. . .
. . .
. . .
. . .
. . .
0 .
170 .
170 .
170 .
170 .
170 .
170 .
170 .
170 .
170 .
170 .
170 .
17F
ourt
h qu
intil
e .
. . .
. . .
. . .
. . .
. . .
. . .
. . .
. . .
. . .
.
0 .24
0 .24
0 .24
0 .24
0 .24
0 .24
0 .24
0 .24
0 .24
0 .24
0 .24
0 .24
Hig
hest
qui
ntile
. . .
. . .
. . .
. . .
. . .
. . .
. . .
. . .
. . .
.
0 .45
0 .44
0 .44
0 .44
0 .44
0 .44
0 .43
0 .42
0 .42
0 .42
0 .42
0 .42
Su
mm
ary
Mea
sure
sG
ini i
ndex
of i
ncom
e in
equa
lity
. . .
. . .
. . .
. . .
. . .
.
0 .00
260 .
0024
0 .00
240 .
0024
0 .00
230 .
0023
0 .00
230 .
0023
0 .00
220 .
0023
0 .00
230 .
0023
Mea
n lo
garit
hmic
dev
iatio
n of
inco
me
. . .
. . .
. . .
. .
0 .00
360 .
0035
0 .00
350 .
0035
0 .00
350 .
0035
0 .00
360 .
0035
0 .00
310 .
0030
0 .00
320 .
0032
The
il . .
. . .
. . .
. . .
. . .
. . .
. . .
. . .
. . .
. . .
. . .
. . .
. .
0 .00
010 .
0001
0 .00
010 .
0001
0 .00
010 .
0001
0 .00
010 .
0001
0 .00
010 .
0001
0 .00
010 .
0001
Atk
inso
n:
e=0 .
25 .
. . .
. . .
. . .
. . .
. . .
. . .
. . .
. . .
. . .
. . .
. .
0 .00
060 .
0005
0 .00
040 .
0004
0 .00
040 .
0004
0 .00
040 .
0004
0 .00
030 .
0004
0 .00
040 .
0004
e=
0 .50
. . .
. . .
. . .
. . .
. . .
. . .
. . .
. . .
. . .
. . .
. . .
0 .
0010
0 .00
080 .
0008
0 .00
070 .
0007
0 .00
070 .
0007
0 .00
070 .
0006
0 .00
070 .
0007
0 .00
07
e=0 .
75 .
. . .
. . .
. . .
. . .
. . .
. . .
. . .
. . .
. . .
. . .
. .
0 .00
130 .
0012
0 .00
110 .
0011
0 .00
110 .
0011
0 .00
110 .
0011
0 .00
100 .
0010
0 .00
100 .
0011

U.S. Census Bureau Income, Poverty, and Health Insurance Coverage in the United States: 2011 49
Table
A-3
. Sele
cte
d M
easu
res o
f Eq
uiv
ale
nce-A
dju
ste
d I
ncom
e D
isp
ers
ion
: 1
96
7 t
o 2
01
2—
Con
.(B
egin
ning
with
200
9, s
tand
ard
erro
rs w
ere
calc
ulat
ed u
sing
rep
licat
e w
eigh
ts . F
or fu
rthe
r ex
plan
atio
n of
inco
me
ineq
ualit
y m
easu
res,
see
Cur
rent
Pop
ulat
ion
Rep
orts
, Ser
ies
P60
-204
, T
he C
hang
ing
Sha
pe o
f the
Nat
ion’
s In
com
e D
istr
ibut
ion:
194
7–19
98 . F
or in
form
atio
n on
con
fiden
tialit
y pr
otec
tion,
sam
plin
g er
ror,
nons
ampl
ing
erro
r, an
d de
finiti
ons,
see
w
ww
.cen
sus.
gov/
prod
/tech
doc/
cps/
cpsm
ar13
)
Mea
sure
s of
inco
me
disp
ersi
on
1976
1319
7514
1974
14, 1
519
7319
7216
1971
1719
7019
6919
6819
6718
ME
AS
UR
ES
Sh
ares
of
Eq
uiv
alen
ce-A
dju
sted
I
nco
mes
of
Qu
inti
les
Low
est q
uint
ile .
. . .
. . .
. . .
. . .
. . .
. . .
. . .
. . .
. . .
. .
5 .6
5 .6
5 .8
5 .6
5 .6
5 .7
5 .7
5 .8
5 .8
5 .6
Sec
ond
quin
tile
. . .
. . .
. . .
. . .
. . .
. . .
. . .
. . .
. . .
. .
11
.811
.912
.112
.011
.912
.012
.112
.212
.312
.0T
hird
qui
ntile
. . .
. . .
. . .
. . .
. . .
. . .
. . .
. . .
. . .
. . .
.
17 .4
17 .3
17 .3
17 .2
17 .2
17 .2
17 .3
17 .3
17 .4
17 .1
Fou
rth
quin
tile
. . .
. . .
. . .
. . .
. . .
. . .
. . .
. . .
. . .
. . .
23
.823
.623
.623
.523
.423
.423
.423
.423
.423
.2H
ighe
st q
uint
ile .
. . .
. . .
. . .
. . .
. . .
. . .
. . .
. . .
. . .
.
41 .5
41 .6
41 .2
41 .7
41 .9
41 .7
41 .5
41 .3
41 .1
42 .1
Su
mm
ary
Mea
sure
sG
ini i
ndex
of i
ncom
e in
equa
lity
. . .
. . .
. . .
. . .
. . .
. .
0 .
359
0 .35
90 .
354
0 .36
00 .
362
0 .35
90 .
357
0 .35
30 .
351
0 .36
2M
ean
loga
rithm
ic d
evia
tion
of in
com
e . .
. . .
. . .
. . .
.
0 .31
10 .
306
0 .29
50 .
298
0 .30
20 .
300
0 .29
90 .
283
0 .28
50 .
303
The
il . .
. . .
. . .
. . .
. . .
. . .
. . .
. . .
. . .
. . .
. . .
. . .
. . .
0 .
227
0 .22
70 .
221
0 .23
00 .
233
0 .22
90 .
228
0 .22
40 .
220
0 .23
8A
tkin
son:
e=
0 .25
. . .
. . .
. . .
. . .
. . .
. . .
. . .
. . .
. . .
. . .
. . .
.
0 .05
60 .
056
0 .05
50 .
057
0 .05
70 .
057
0 .05
60 .
055
0 .05
40 .
058
e=
0 .50
. . .
. . .
. . .
. . .
. . .
. . .
. . .
. . .
. . .
. . .
. . .
.
0 .11
30 .
114
0 .11
00 .
114
0 .11
50 .
113
0 .11
30 .
110
0 .10
90 .
116
e=
0 .75
. . .
. . .
. . .
. . .
. . .
. . .
. . .
. . .
. . .
. . .
. . .
.
0 .17
70 .
176
0 .17
10 .
176
0 .17
70 .
175
0 .17
50 .
169
0 .16
90 .
179
STA
ND
AR
D E
RR
OR
SS
har
es o
f E
qu
ival
ence
-Ad
just
ed
In
com
e o
f Q
uin
tile
sLo
wes
t qui
ntile
. . .
. . .
. . .
. . .
. . .
. . .
. . .
. . .
. . .
. . .
0 .
060 .
060 .
060 .
060 .
060 .
060 .
060 .
060 .
060 .
06S
econ
d qu
intil
e .
. . .
. . .
. . .
. . .
. . .
. . .
. . .
. . .
. . .
.
0 .12
0 .12
0 .12
0 .12
0 .12
0 .12
0 .12
0 .12
0 .12
0 .12
Thi
rd q
uint
ile .
. . .
. . .
. . .
. . .
. . .
. . .
. . .
. . .
. . .
. . .
0 .
170 .
170 .
170 .
170 .
170 .
170 .
170 .
170 .
170 .
17F
ourt
h qu
intil
e .
. . .
. . .
. . .
. . .
. . .
. . .
. . .
. . .
. . .
. .
0 .24
0 .24
0 .24
0 .23
0 .23
0 .23
0 .23
0 .23
0 .23
0 .23
Hig
hest
qui
ntile
. . .
. . .
. . .
. . .
. . .
. . .
. . .
. . .
. . .
. .
0 .
410 .
420 .
410 .
420 .
420 .
420 .
420 .
410 .
410 .
42
Su
mm
ary
Mea
sure
sG
ini i
ndex
of i
ncom
e in
equa
lity
. . .
. . .
. . .
. . .
. . .
. .
0 .
0024
0 .00
240 .
0026
0 .00
270 .
0029
0 .00
280 .
0035
0 .00
620 .
0070
0 .00
25M
ean
loga
rithm
ic d
evia
tion
of in
com
e . .
. . .
. . .
. . .
.
0 .00
320 .
0034
0 .00
330 .
0032
0 .00
330 .
0032
0 .00
310 .
0030
0 .00
300 .
0031
The
il . .
. . .
. . .
. . .
. . .
. . .
. . .
. . .
. . .
. . .
. . .
. . .
. . .
0 .
0001
0 .00
010 .
0001
0 .00
010 .
0001
0 .00
010 .
0001
0 .00
010 .
0001
0 .00
01A
tkin
son:
e=
0 .25
. . .
. . .
. . .
. . .
. . .
. . .
. . .
. . .
. . .
. . .
. . .
.
0 .00
040 .
0004
0 .00
040 .
0004
0 .00
040 .
0004
0 .00
040 .
0004
0 .00
040 .
0005
e=
0 .50
. . .
. . .
. . .
. . .
. . .
. . .
. . .
. . .
. . .
. . .
. . .
.
0 .00
070 .
0007
0 .00
070 .
0007
0 .00
070 .
0007
0 .00
070 .
0008
0 .00
070 .
0008
e=
0 .75
. . .
. . .
. . .
. . .
. . .
. . .
. . .
. . .
. . .
. . .
. . .
.
0 .00
100 .
0011
0 .00
100 .
0011
0 .00
110 .
0011
0 .00
110 .
0011
0 .00
100 .
0011
1 Im
plem
enta
tion
of C
ensu
s 20
10-b
ased
pop
ulat
ion
cont
rols
.2
Dat
a ha
ve b
een
revi
sed
to r
eflec
t a c
orre
ctio
n to
the
wei
ghts
in th
e 20
05 A
SE
C .
3 Im
plem
enta
tion
of a
28,
000
hous
ehol
d sa
mpl
e ex
pans
ion .
4 Im
plem
enta
tion
of C
ensu
s 20
00-b
ased
pop
ulat
ion
cont
rols
.5
Ful
l im
plem
enta
tion
of 1
990
cens
us-b
ased
sam
ple
desi
gn a
nd m
etro
polit
an d
efini
tions
, 7,0
00
hous
ehol
d sa
mpl
e re
duct
ion,
and
rev
ised
edi
ting
of r
espo
nses
on
race
.6
Intr
oduc
tion
of 1
990
cens
us s
ampl
e de
sign
.7
Dat
a co
llect
ion
met
hod
chan
ged
from
pap
er a
nd p
enci
l to
com
pute
r-as
sist
ed in
terv
iew
ing .
In a
dditi
on,
the
1994
AS
EC
was
rev
ised
to a
llow
for
the
codi
ng o
f diff
eren
t inc
ome
amou
nts
on s
elec
ted
ques
tionn
aire
ite
ms .
Lim
its e
ither
incr
ease
d or
dec
reas
ed in
the
follo
win
g ca
tego
ries:
ear
ning
s lim
its in
crea
sed
to
$999
,999
; soc
ial s
ecur
ity li
mits
incr
ease
d to
$49
,999
; sup
plem
enta
l sec
urity
inco
me
and
publ
ic a
ssis
tanc
e lim
its in
crea
sed
to $
24,9
99; v
eter
ans’
ben
efits
lim
its in
crea
sed
to $
99,9
99; c
hild
sup
port
and
alim
ony
limits
de
crea
sed
to $
49,9
99 .
8 Im
plem
enta
tion
of 1
990
cens
us p
opul
atio
n co
ntro
ls .
9 Im
plem
enta
tion
of a
new
CP
S A
SE
C p
roce
ssin
g sy
stem
.10
Rec
ordi
ng o
f am
ount
s fo
r ea
rnin
gs fr
om lo
nges
t job
incr
ease
d to
$29
9,99
9 . F
ull i
mpl
emen
tatio
n of
19
80 c
ensu
s-ba
sed
sam
ple
desi
gn .
11 Im
plem
enta
tion
of H
ispa
nic
popu
latio
n w
eigh
ting
cont
rols
and
intr
oduc
tion
of 1
980
cens
us-b
ased
sa
mpl
e de
sign
.12
Impl
emen
tatio
n of
198
0 ce
nsus
pop
ulat
ion
cont
rols
. Que
stio
nnai
re e
xpan
ded
to a
llow
the
reco
rdin
g of
up
to 2
7 po
ssib
le v
alue
s fr
om a
list
of 5
1 po
ssib
le s
ourc
es o
f inc
ome .
13 F
irst y
ear
med
ians
wer
e de
rived
usi
ng b
oth
Par
eto
and
linea
r in
terp
olat
ion .
Bef
ore
this
yea
r, al
l m
edia
ns w
ere
deriv
ed u
sing
line
ar in
terp
olat
ion .
14 S
ome
of th
ese
estim
ates
wer
e de
rived
usi
ng P
aret
o in
terp
olat
ion
and
may
diff
er fr
om p
ublis
hed
data
w
hich
wer
e de
rived
usi
ng li
near
inte
rpol
atio
n .15
Impl
emen
tatio
n of
a n
ew C
PS
AS
EC
pro
cess
ing
syst
em . Q
uest
ionn
aire
exp
ande
d to
ask
11
inco
me
ques
tions
.16
Ful
l im
plem
enta
tion
of 1
970
cens
us-b
ased
sam
ple
desi
gn .
17 In
trod
uctio
n of
197
0 ce
nsus
sam
ple
desi
gn a
nd p
opul
atio
n co
ntro
ls .
18 Im
plem
enta
tion
of a
new
CP
S A
SE
C p
roce
ssin
g sy
stem
.S
ourc
e: U
.S . C
ensu
s B
urea
u, C
urre
nt P
opul
atio
n S
urve
y, 1
968
to 2
013
Ann
ual S
ocia
l and
Eco
nom
ic
Sup
plem
ents
.
Contents
Selected Measures of Equivalence-Adjusted Income Dispersion: 1967 to 2011 46
Selected Measures of Equivalence-Adjusted Income Dispersion: 1967 to 2011—Con. 47
Selected Measures of Equivalence-Adjusted Income Dispersion: 1967 to 2011—Con. 48
Selected Measures of Equivalence-Adjusted Income Dispersion: 1967 to 2011—Con. 49
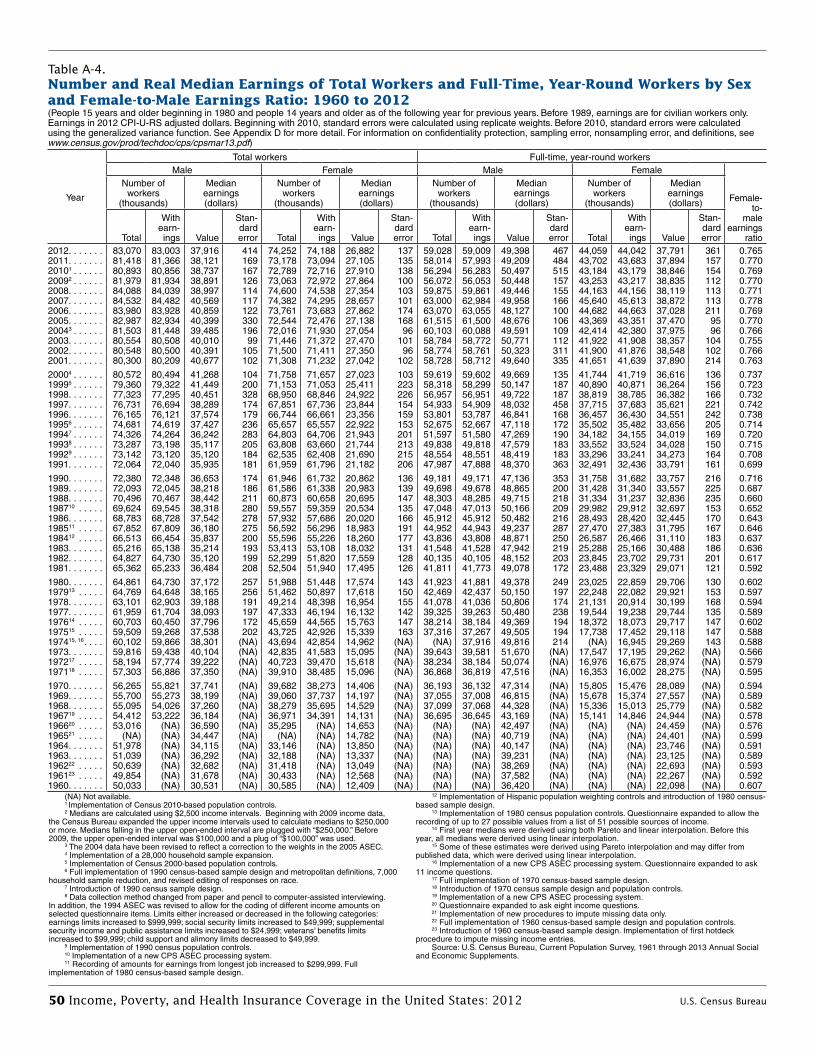
50 Income, Poverty, and Health Insurance Coverage in the United States: 2012 U.S. Census Bureau
Table A-4.Number and Real Median Earnings of Total Workers and Full-Time, Year-Round Workers by Sex and Female-to-Male Earnings Ratio: 1960 to 2012(People 15 years and older beginning in 1980 and people 14 years and older as of the following year for previous years . Before 1989, earnings are for civilian workers only . Earnings in 2012 CPI-U-RS adjusted dollars . Beginning with 2010, standard errors were calculated using replicate weights . Before 2010, standard errors were calculated using the generalized variance function . See Appendix D for more detail . For information on confidentiality protection, sampling error, nonsampling error, and definitions, see www.census.gov/prod/techdoc/cps/cpsmar13.pdf)
Year
Total workers Full-time, year-round workersMale Female Male Female
Female-to-
maleearnings
ratio
Number of workers
(thousands)
Median earnings (dollars)
Number of workers
(thousands)
Median earnings (dollars)
Number of workers
(thousands)
Median earnings (dollars)
Number of workers
(thousands)
Median earnings (dollars)
Total
With earn-ings Value
Stan-dard error Total
With earn-ings Value
Stan-dard error Total
With earn-ings Value
Stan-dard error Total
With earn-ings Value
Stan-dard error
2012 . . . . . . . 83,070 83,003 37,916 414 74,252 74,188 26,882 137 59,028 59,009 49,398 467 44,059 44,042 37,791 361 0 .765 2011 . . . . . . . 81,418 81,366 38,121 169 73,178 73,094 27,105 135 58,014 57,993 49,209 484 43,702 43,683 37,894 157 0 .770 20101 . . . . . . 80,893 80,856 38,737 167 72,789 72,716 27,910 138 56,294 56,283 50,497 515 43,184 43,179 38,846 154 0 .769 20092 . . . . . . 81,979 81,934 38,891 126 73,063 72,972 27,864 100 56,072 56,053 50,448 157 43,253 43,217 38,835 112 0 .770 2008 . . . . . . . 84,088 84,039 38,997 114 74,600 74,538 27,354 103 59,875 59,861 49,446 155 44,163 44,156 38,119 113 0 .771 2007 . . . . . . . 84,532 84,482 40,569 117 74,382 74,295 28,657 101 63,000 62,984 49,958 166 45,640 45,613 38,872 113 0 .778 2006 . . . . . . . 83,980 83,928 40,859 122 73,761 73,683 27,862 174 63,070 63,055 48,127 100 44,682 44,663 37,028 211 0 .769 2005 . . . . . . . 82,987 82,934 40,399 330 72,544 72,476 27,138 168 61,515 61,500 48,676 106 43,369 43,351 37,470 95 0 .770 20043 . . . . . . 81,503 81,448 39,485 196 72,016 71,930 27,054 96 60,103 60,088 49,591 109 42,414 42,380 37,975 96 0 .766 2003 . . . . . . . 80,554 80,508 40,010 99 71,446 71,372 27,470 101 58,784 58,772 50,771 112 41,922 41,908 38,357 104 0 .755 2002 . . . . . . . 80,548 80,500 40,391 105 71,500 71,411 27,350 96 58,774 58,761 50,323 311 41,900 41,876 38,548 102 0 .766 2001 . . . . . . . 80,300 80,209 40,677 102 71,308 71,232 27,042 102 58,728 58,712 49,640 335 41,651 41,639 37,890 214 0 .763
20004 . . . . . . 80,572 80,494 41,268 104 71,758 71,657 27,023 103 59,619 59,602 49,669 135 41,744 41,719 36,616 136 0 .737 19995 . . . . . . 79,360 79,322 41,449 200 71,153 71,053 25,411 223 58,318 58,299 50,147 187 40,890 40,871 36,264 156 0 .723 1998 . . . . . . . 77,323 77,295 40,451 328 68,950 68,846 24,922 226 56,957 56,951 49,722 187 38,819 38,785 36,382 166 0 .732 1997 . . . . . . . 76,731 76,694 38,289 174 67,851 67,736 23,844 154 54,933 54,909 48,032 458 37,715 37,683 35,621 221 0 .742 1996 . . . . . . . 76,165 76,121 37,574 179 66,744 66,661 23,356 159 53,801 53,787 46,841 168 36,457 36,430 34,551 242 0 .738 19956 . . . . . . 74,681 74,619 37,427 236 65,657 65,557 22,922 153 52,675 52,667 47,118 172 35,502 35,482 33,656 205 0 .714 19947 . . . . . . 74,326 74,264 36,242 283 64,803 64,706 21,943 201 51,597 51,580 47,269 190 34,182 34,155 34,019 169 0 .720 19938 . . . . . . 73,287 73,198 35,117 205 63,808 63,660 21,744 213 49,838 49,818 47,579 183 33,552 33,524 34,028 150 0 .715 19929 . . . . . . 73,142 73,120 35,120 184 62,535 62,408 21,690 215 48,554 48,551 48,419 183 33,296 33,241 34,273 164 0 .708 1991 . . . . . . . 72,064 72,040 35,935 181 61,959 61,796 21,182 206 47,987 47,888 48,370 363 32,491 32,436 33,791 161 0 .699
1990 . . . . . . . 72,380 72,348 36,653 174 61,946 61,732 20,862 136 49,181 49,171 47,136 353 31,758 31,682 33,757 216 0 .716 1989 . . . . . . . 72,093 72,045 38,218 186 61,586 61,338 20,983 139 49,698 49,678 48,865 200 31,428 31,340 33,557 225 0 .687 1988 . . . . . . . 70,496 70,467 38,442 211 60,873 60,658 20,695 147 48,303 48,285 49,715 218 31,334 31,237 32,836 235 0 .660 198710 . . . . . 69,624 69,545 38,318 280 59,557 59,359 20,534 135 47,048 47,013 50,166 209 29,982 29,912 32,697 153 0 .652 1986 . . . . . . . 68,783 68,728 37,542 278 57,932 57,686 20,020 166 45,912 45,912 50,482 216 28,493 28,420 32,445 170 0 .643 198511 . . . . . 67,852 67,809 36,180 275 56,592 56,296 18,983 191 44,952 44,943 49,237 287 27,470 27,383 31,795 167 0 .646 198412 . . . . . 66,513 66,454 35,837 200 55,596 55,226 18,260 177 43,836 43,808 48,871 250 26,587 26,466 31,110 183 0 .637 1983 . . . . . . . 65,216 65,138 35,214 193 53,413 53,108 18,032 131 41,548 41,528 47,942 219 25,288 25,166 30,488 186 0 .636 1982 . . . . . . . 64,827 64,730 35,120 199 52,299 51,820 17,559 128 40,135 40,105 48,152 203 23,845 23,702 29,731 201 0 .617 1981 . . . . . . . 65,362 65,233 36,484 208 52,504 51,940 17,495 126 41,811 41,773 49,078 172 23,488 23,329 29,071 121 0 .592
1980 . . . . . . . 64,861 64,730 37,172 257 51,988 51,448 17,574 143 41,923 41,881 49,378 249 23,025 22,859 29,706 130 0 .602 197913 . . . . . 64,769 64,648 38,165 256 51,462 50,897 17,618 150 42,469 42,437 50,150 197 22,248 22,082 29,921 153 0 .597 1978 . . . . . . . 63,101 62,903 39,188 191 49,214 48,398 16,954 155 41,078 41,036 50,806 174 21,131 20,914 30,199 168 0 .594 1977 . . . . . . . 61,959 61,704 38,093 197 47,333 46,194 16,132 142 39,325 39,263 50,480 238 19,544 19,238 29,744 135 0 .589 197614 . . . . . 60,703 60,450 37,796 172 45,659 44,565 15,763 147 38,214 38,184 49,369 194 18,372 18,073 29,717 147 0 .602 197515 . . . . . 59,509 59,268 37,538 202 43,725 42,926 15,339 163 37,316 37,267 49,505 194 17,738 17,452 29,118 147 0 .588 197415, 16 . . . . 60,102 59,866 38,301 (NA) 43,694 42,854 14,962 (NA) (NA) 37,916 49,816 214 (NA) 16,945 29,269 143 0 .588 1973 . . . . . . . 59,816 59,438 40,104 (NA) 42,835 41,583 15,095 (NA) 39,643 39,581 51,670 (NA) 17,547 17,195 29,262 (NA) 0 .566 197217 . . . . . 58,194 57,774 39,222 (NA) 40,723 39,470 15,618 (NA) 38,234 38,184 50,074 (NA) 16,976 16,675 28,974 (NA) 0 .579 197118 . . . . . 57,303 56,886 37,350 (NA) 39,910 38,485 15,096 (NA) 36,868 36,819 47,516 (NA) 16,353 16,002 28,275 (NA) 0 .595
1970 . . . . . . . 56,265 55,821 37,741 (NA) 39,682 38,273 14,406 (NA) 36,193 36,132 47,314 (NA) 15,805 15,476 28,089 (NA) 0 .594 1969 . . . . . . . 55,700 55,273 38,199 (NA) 39,060 37,737 14,197 (NA) 37,055 37,008 46,815 (NA) 15,678 15,374 27,557 (NA) 0 .589 1968 . . . . . . . 55,095 54,026 37,260 (NA) 38,279 35,695 14,529 (NA) 37,099 37,068 44,328 (NA) 15,336 15,013 25,779 (NA) 0 .582 196719 . . . . . 54,412 53,222 36,184 (NA) 36,971 34,391 14,131 (NA) 36,695 36,645 43,169 (NA) 15,141 14,846 24,944 (NA) 0 .578 196620 . . . . . 53,016 (NA) 36,590 (NA) 35,295 (NA) 14,653 (NA) (NA) (NA) 42,497 (NA) (NA) (NA) 24,459 (NA) 0 .576 196521 . . . . . (NA) (NA) 34,447 (NA) (NA) (NA) 14,782 (NA) (NA) (NA) 40,719 (NA) (NA) (NA) 24,401 (NA) 0 .599 1964 . . . . . . . 51,978 (NA) 34,115 (NA) 33,146 (NA) 13,850 (NA) (NA) (NA) 40,147 (NA) (NA) (NA) 23,746 (NA) 0 .591 1963 . . . . . . . 51,039 (NA) 36,292 (NA) 32,188 (NA) 13,337 (NA) (NA) (NA) 39,231 (NA) (NA) (NA) 23,125 (NA) 0 .589 196222 . . . . . 50,639 (NA) 32,682 (NA) 31,418 (NA) 13,049 (NA) (NA) (NA) 38,269 (NA) (NA) (NA) 22,693 (NA) 0 .593 196123 . . . . . 49,854 (NA) 31,678 (NA) 30,433 (NA) 12,568 (NA) (NA) (NA) 37,582 (NA) (NA) (NA) 22,267 (NA) 0 .592 1960 . . . . . . . 50,033 (NA) 30,531 (NA) 30,585 (NA) 12,409 (NA) (NA) (NA) 36,420 (NA) (NA) (NA) 22,098 (NA) 0 .607
(NA) Not available .1 Implementation of Census 2010-based population controls .2 Medians are calculated using $2,500 income intervals . Beginning with 2009 income data,
the Census Bureau expanded the upper income intervals used to calculate medians to $250,000 or more . Medians falling in the upper open-ended interval are plugged with “$250,000 .” Before 2009, the upper open-ended interval was $100,000 and a plug of “$100,000” was used .
3 The 2004 data have been revised to reflect a correction to the weights in the 2005 ASEC .4 Implementation of a 28,000 household sample expansion .5 Implementation of Census 2000-based population controls .6 Full implementation of 1990 census-based sample design and metropolitan definitions, 7,000
household sample reduction, and revised editing of responses on race .7 Introduction of 1990 census sample design .8 Data collection method changed from paper and pencil to computer-assisted interviewing .
In addition, the 1994 ASEC was revised to allow for the coding of different income amounts on selected questionnaire items . Limits either increased or decreased in the following categories: earnings limits increased to $999,999; social security limits increased to $49,999; supplemental security income and public assistance limits increased to $24,999; veterans’ benefits limits increased to $99,999; child support and alimony limits decreased to $49,999 .
9 Implementation of 1990 census population controls .10 Implementation of a new CPS ASEC processing system .11 Recording of amounts for earnings from longest job increased to $299,999 . Full
implementation of 1980 census-based sample design .
12 Implementation of Hispanic population weighting controls and introduction of 1980 census-based sample design .
13 Implementation of 1980 census population controls . Questionnaire expanded to allow the recording of up to 27 possible values from a list of 51 possible sources of income .
14 First year medians were derived using both Pareto and linear interpolation . Before this year, all medians were derived using linear interpolation .
15 Some of these estimates were derived using Pareto interpolation and may differ from published data, which were derived using linear interpolation .
16 Implementation of a new CPS ASEC processing system . Questionnaire expanded to ask 11 income questions .
17 Full implementation of 1970 census-based sample design .18 Introduction of 1970 census sample design and population controls .19 Implementation of a new CPS ASEC processing system .20 Questionnaire expanded to ask eight income questions .21 Implementation of new procedures to impute missing data only .22 Full implementation of 1960 census-based sample design and population controls .23 Introduction of 1960 census-based sample design . Implementation of first hotdeck
procedure to impute missing income entries .Source: U .S . Census Bureau, Current Population Survey, 1961 through 2013 Annual Social
and Economic Supplements .
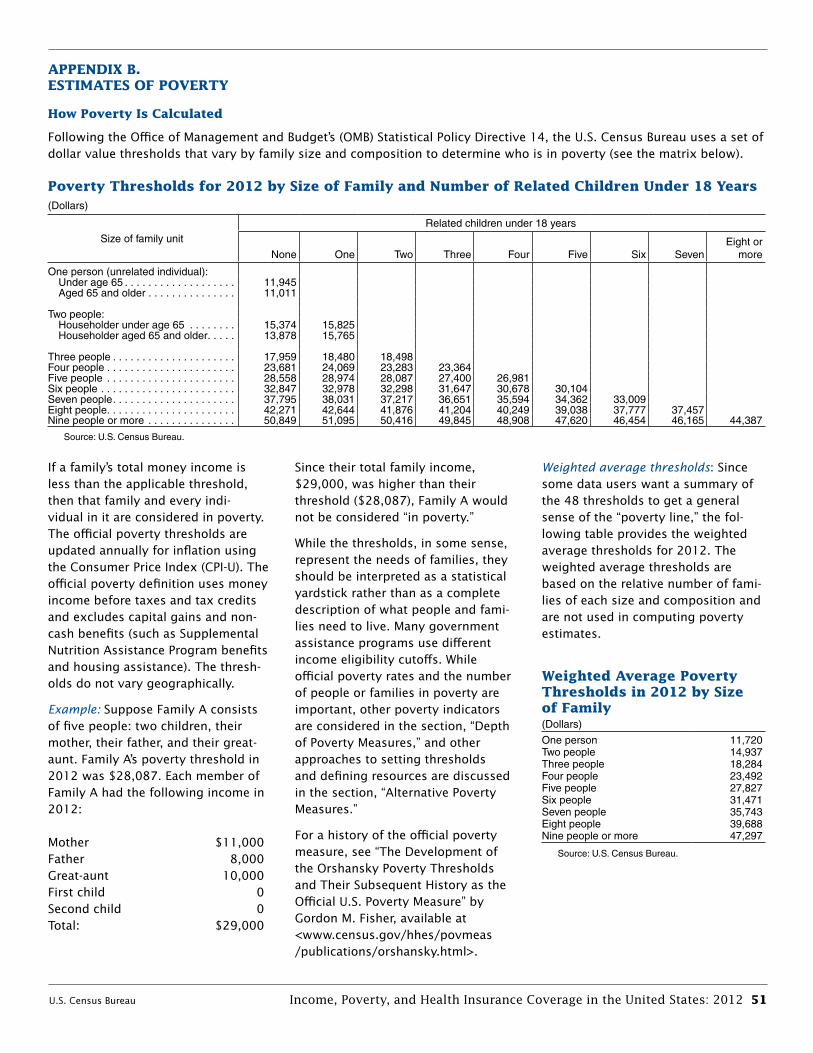
U.S. Census Bureau Income, Poverty, and Health Insurance Coverage in the United States: 2012 51
Since their total family income, $29,000, was higher than their threshold ($28,087), Family A would not be considered “in poverty.”
While the thresholds, in some sense, represent the needs of families, they should be interpreted as a statistical yardstick rather than as a complete description of what people and fami-lies need to live. Many government assistance programs use different income eligibility cutoffs. While official poverty rates and the number of people or families in poverty are important, other poverty indicators are considered in the section, “Depth of Poverty Measures,” and other approaches to setting thresholds and defining resources are discussed in the section, “Alternative Poverty Measures.”
For a history of the official poverty measure, see “The Development of the Orshansky Poverty Thresholds and Their Subsequent History as the Official U.S. Poverty Measure” by Gordon M. Fisher, available at <www.census.gov/hhes/povmeas /publications/orshansky.html>.
APPENDIX B. ESTIMATES oF PoVERTY
How Poverty Is Calculated
Following the Office of Management and Budget’s (OMB) Statistical Policy Directive 14, the U.S. Census Bureau uses a set of dollar value thresholds that vary by family size and composition to determine who is in poverty (see the matrix below).
If a family’s total money income is less than the applicable threshold, then that family and every indi-vidual in it are considered in poverty. The official poverty thresholds are updated annually for inflation using the Consumer Price Index (CPI-U). The official poverty definition uses money income before taxes and tax credits and excludes capital gains and non-cash benefits (such as Supplemental Nutrition Assistance Program benefits and housing assistance). The thresh-olds do not vary geographically.
Example: Suppose Family A consists of five people: two children, their mother, their father, and their great-aunt. Family A’s poverty threshold in 2012 was $28,087. Each member of Family A had the following income in 2012:
Weighted average thresholds: Since some data users want a summary of the 48 thresholds to get a general sense of the “poverty line,” the fol-lowing table provides the weighted average thresholds for 2012. The weighted average thresholds are based on the relative number of fami-lies of each size and composition and are not used in computing poverty estimates.
Poverty Thresholds for 2012 by Size of Family and Number of Related Children Under 18 Years(Dollars)
Size of family unit
Related children under 18 years
None One Two Three Four Five Six Seven Eight or
more
One person (unrelated individual): Under age 65 . . . . . . . . . . . . . . . . . . . 11,945 Aged 65 and older . . . . . . . . . . . . . . . 11,011
Two people: Householder under age 65 . . . . . . . . 15,374 15,825 Householder aged 65 and older . . . . . 13,878 15,765
Three people . . . . . . . . . . . . . . . . . . . . . 17,959 18,480 18,498Four people . . . . . . . . . . . . . . . . . . . . . . 23,681 24,069 23,283 23,364Five people . . . . . . . . . . . . . . . . . . . . . . 28,558 28,974 28,087 27,400 26,981Six people . . . . . . . . . . . . . . . . . . . . . . . 32,847 32,978 32,298 31,647 30,678 30,104Seven people . . . . . . . . . . . . . . . . . . . . . 37,795 38,031 37,217 36,651 35,594 34,362 33,009Eight people . . . . . . . . . . . . . . . . . . . . . . 42,271 42,644 41,876 41,204 40,249 39,038 37,777 37,457Nine people or more . . . . . . . . . . . . . . . 50,849 51,095 50,416 49,845 48,908 47,620 46,454 46,165 44,387
Source: U .S . Census Bureau .
Weighted Average Poverty Thresholds in 2012 by Size of Family(Dollars)
One person 11,720 Two people 14,937 Three people 18,284 Four people 23,492 Five people 27,827 Six people 31,471 Seven people 35,743 Eight people 39,688 Nine people or more 47,297
Source: U .S . Census Bureau .Mother $11,000 Father 8,000 Great-aunt 10,000 First child 0 Second child 0 Total: $29,000

52 Income, Poverty, and Health Insurance Coverage in the United States: 2012 U.S. Census Bureau
Race, Hispanic origin, and year
All people People in families Unrelated individuals
Total
Below poverty All familiesFamilies with female
householder, no husband present
Total
Below poverty
Number Percent Total
Below poverty
Total
Below poverty
Number PercentNumber Percent Number PercentALL RACES2012 . . . . . . . . . . . . . . . . . . 310,648 46,496 15 .0 252,863 33,198 13 .1 47,085 15,957 33 .9 56,185 12,558 22 .42011 . . . . . . . . . . . . . . . . . . 308,456 46,247 15 .0 252,316 33,126 13 .1 48,103 16,451 34 .2 54,517 12,416 22 .820101 . . . . . . . . . . . . . . . . . 306,130 46,343 15 .1 250,200 33,120 13 .2 46,454 15,911 34 .3 54,250 12,449 22 .92009 . . . . . . . . . . . . . . . . . . 303,820 43,569 14 .3 249,384 31,197 12 .5 45,315 14,746 32 .5 53,079 11,678 22 .02008 . . . . . . . . . . . . . . . . . . 301,041 39,829 13 .2 248,301 28,564 11 .5 44,027 13,812 31 .4 51,534 10,710 20 .82007 . . . . . . . . . . . . . . . . . . 298,699 37,276 12 .5 245,443 26,509 10 .8 43,961 13,478 30 .7 51,740 10,189 19 .7
2006 . . . . . . . . . . . . . . . . . . 296,450 36,460 12 .3 245,199 25,915 10 .6 43,223 13,199 30 .5 49,884 9,977 20 .02005 . . . . . . . . . . . . . . . . . . 293,135 36,950 12 .6 242,389 26,068 10 .8 42,244 13,153 31 .1 49,526 10,425 21 .120042 . . . . . . . . . . . . . . . . . 290,617 37,040 12 .7 240,754 26,544 11 .0 42,053 12,832 30 .5 48,609 9,926 20 .42003 . . . . . . . . . . . . . . . . . . 287,699 35,861 12 .5 238,903 25,684 10 .8 41,311 12,413 30 .0 47,594 9,713 20 .42002 . . . . . . . . . . . . . . . . . . 285,317 34,570 12 .1 236,921 24,534 10 .4 40,529 11,657 28 .8 47,156 9,618 20 .4
2001 . . . . . . . . . . . . . . . . . . 281,475 32,907 11 .7 233,911 23,215 9 .9 39,261 11,223 28 .6 46,392 9,226 19 .920003 . . . . . . . . . . . . . . . . . 278,944 31,581 11 .3 231,909 22,347 9 .6 38,375 10,926 28 .5 45,624 8,653 19 .019994 . . . . . . . . . . . . . . . . . 276,208 32,791 11 .9 230,789 23,830 10 .3 38,580 11,764 30 .5 43,977 8,400 19 .11998 . . . . . . . . . . . . . . . . . . 271,059 34,476 12 .7 227,229 25,370 11 .2 39,000 12,907 33 .1 42,539 8,478 19 .91997 . . . . . . . . . . . . . . . . . . 268,480 35,574 13 .3 225,369 26,217 11 .6 38,412 13,494 35 .1 41,672 8,687 20 .8
1996 . . . . . . . . . . . . . . . . . . 266,218 36,529 13 .7 223,955 27,376 12 .2 38,584 13,796 35 .8 40,727 8,452 20 .81995 . . . . . . . . . . . . . . . . . . 263,733 36,425 13 .8 222,792 27,501 12 .3 38,908 14,205 36 .5 39,484 8,247 20 .91994 . . . . . . . . . . . . . . . . . . 261,616 38,059 14 .5 221,430 28,985 13 .1 37,253 14,380 38 .6 38,538 8,287 21 .51993 . . . . . . . . . . . . . . . . . . 259,278 39,265 15 .1 219,489 29,927 13 .6 37,861 14,636 38 .7 38,038 8,388 22 .119925 . . . . . . . . . . . . . . . . . 256,549 38,014 14 .8 217,936 28,961 13 .3 36,446 14,205 39 .0 36,842 8,075 21 .9
19916 . . . . . . . . . . . . . . . . . 251,192 35,708 14 .2 212,723 27,143 12 .8 34,795 13,824 39 .7 36,845 7,773 21 .11990 . . . . . . . . . . . . . . . . . . 248,644 33,585 13 .5 210,967 25,232 12 .0 33,795 12,578 37 .2 36,056 7,446 20 .71989 . . . . . . . . . . . . . . . . . . 245,992 31,528 12 .8 209,515 24,066 11 .5 32,525 11,668 35 .9 35,185 6,760 19 .219887 . . . . . . . . . . . . . . . . . 243,530 31,745 13 .0 208,056 24,048 11 .6 32,164 11,972 37 .2 34,340 7,070 20 .619877 . . . . . . . . . . . . . . . . . 240,982 32,221 13 .4 206,877 24,725 12 .0 31,893 12,148 38 .1 32,992 6,857 20 .8
1986 . . . . . . . . . . . . . . . . . . 238,554 32,370 13 .6 205,459 24,754 12 .0 31,152 11,944 38 .3 31,679 6,846 21 .61985 . . . . . . . . . . . . . . . . . . 236,594 33,064 14 .0 203,963 25,729 12 .6 30,878 11,600 37 .6 31,351 6,725 21 .51984 . . . . . . . . . . . . . . . . . . 233,816 33,700 14 .4 202,288 26,458 13 .1 30,844 11,831 38 .4 30,268 6,609 21 .81983 . . . . . . . . . . . . . . . . . . 231,700 35,303 15 .2 201,338 27,933 13 .9 30,049 12,072 40 .2 29,158 6,740 23 .11982 . . . . . . . . . . . . . . . . . . 229,412 34,398 15 .0 200,385 27,349 13 .6 28,834 11,701 40 .6 27,908 6,458 23 .1
1981 . . . . . . . . . . . . . . . . . . 227,157 31,822 14 .0 198,541 24,850 12 .5 28,587 11,051 38 .7 27,714 6,490 23 .41980 . . . . . . . . . . . . . . . . . . 225,027 29,272 13 .0 196,963 22,601 11 .5 27,565 10,120 36 .7 27,133 6,227 22 .91979 . . . . . . . . . . . . . . . . . . 222,903 26,072 11 .7 195,860 19,964 10 .2 26,927 9,400 34 .9 26,170 5,743 21 .91978 . . . . . . . . . . . . . . . . . . 215,656 24,497 11 .4 191,071 19,062 10 .0 26,032 9,269 35 .6 24,585 5,435 22 .11977 . . . . . . . . . . . . . . . . . . 213,867 24,720 11 .6 190,757 19,505 10 .2 25,404 9,205 36 .2 23,110 5,216 22 .6
1976 . . . . . . . . . . . . . . . . . . 212,303 24,975 11 .8 190,844 19,632 10 .3 24,204 9,029 37 .3 21,459 5,344 24 .91975 . . . . . . . . . . . . . . . . . . 210,864 25,877 12 .3 190,630 20,789 10 .9 23,580 8,846 37 .5 20,234 5,088 25 .11974 . . . . . . . . . . . . . . . . . . 209,362 23,370 11 .2 190,436 18,817 9 .9 23,165 8,462 36 .5 18,926 4,553 24 .11973 . . . . . . . . . . . . . . . . . . 207,621 22,973 11 .1 189,361 18,299 9 .7 21,823 8,178 37 .5 18,260 4,674 25 .61972 . . . . . . . . . . . . . . . . . . 206,004 24,460 11 .9 189,193 19,577 10 .3 21,264 8,114 38 .2 16,811 4,883 29 .0
1971 . . . . . . . . . . . . . . . . . . 204,554 25,559 12 .5 188,242 20,405 10 .8 20,153 7,797 38 .7 16,311 5,154 31 .61970 . . . . . . . . . . . . . . . . . . 202,183 25,420 12 .6 186,692 20,330 10 .9 19,673 7,503 38 .1 15,491 5,090 32 .91969 . . . . . . . . . . . . . . . . . . 199,517 24,147 12 .1 184,891 19,175 10 .4 17,995 6,879 38 .2 14,626 4,972 34 .01968 . . . . . . . . . . . . . . . . . . 197,628 25,389 12 .8 183,825 20,695 11 .3 18,048 6,990 38 .7 13,803 4,694 34 .01967 . . . . . . . . . . . . . . . . . . 195,672 27,769 14 .2 182,558 22,771 12 .5 17,788 6,898 38 .8 13,114 4,998 38 .1
1966 . . . . . . . . . . . . . . . . . . 193,388 28,510 14 .7 181,117 23,809 13 .1 17,240 6,861 39 .8 12,271 4,701 38 .31965 . . . . . . . . . . . . . . . . . . 191,413 33,185 17 .3 179,281 28,358 15 .8 16,371 7,524 46 .0 12,132 4,827 39 .81964 . . . . . . . . . . . . . . . . . . 189,710 36,055 19 .0 177,653 30,912 17 .4 (NA) 7,297 44 .4 12,057 5,143 42 .71963 . . . . . . . . . . . . . . . . . . 187,258 36,436 19 .5 176,076 31,498 17 .9 (NA) 7,646 47 .7 11,182 4,938 44 .21962 . . . . . . . . . . . . . . . . . . 184,276 38,625 21 .0 173,263 33,623 19 .4 (NA) 7,781 50 .3 11,013 5,002 45 .4
1961 . . . . . . . . . . . . . . . . . . 181,277 39,628 21 .9 170,131 34,509 20 .3 (NA) 7,252 48 .1 11,146 5,119 45 .91960 . . . . . . . . . . . . . . . . . . 179,503 39,851 22 .2 168,615 34,925 20 .7 (NA) 7,247 48 .9 10,888 4,926 45 .21959 . . . . . . . . . . . . . . . . . . 176,557 39,490 22 .4 165,858 34,562 20 .8 (NA) 7,014 49 .4 10,699 4,928 46 .1
Table B-1.Poverty Status of People by Family Relationship, Race, and Hispanic origin: 1959 to 2012(Numbers in thousands . People as of March of the following year . For information on confidentiality protection, sampling error, nonsampling error, and definitions, see www.census.gov/prod/techdoc/cps/cpsmar13.pdf)
See footnotes at end of table .
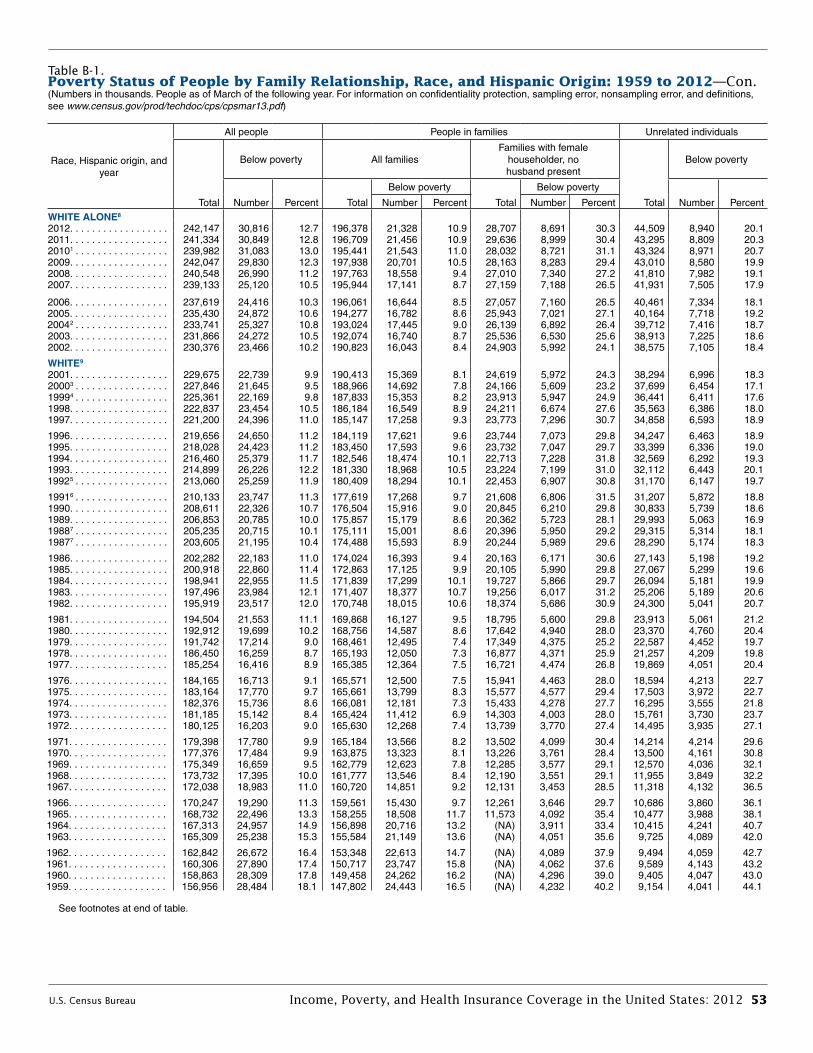
U.S. Census Bureau Income, Poverty, and Health Insurance Coverage in the United States: 2012 53
Race, Hispanic origin, and year
All people People in families Unrelated individuals
Total
Below poverty All familiesFamilies with female
householder, no husband present
Total
Below poverty
Number Percent Total
Below poverty
Total
Below poverty
Number PercentNumber Percent Number PercentWHITE ALONE8
2012 . . . . . . . . . . . . . . . . . . 242,147 30,816 12 .7 196,378 21,328 10 .9 28,707 8,691 30 .3 44,509 8,940 20 .12011 . . . . . . . . . . . . . . . . . . 241,334 30,849 12 .8 196,709 21,456 10 .9 29,636 8,999 30 .4 43,295 8,809 20 .320101 . . . . . . . . . . . . . . . . . 239,982 31,083 13 .0 195,441 21,543 11 .0 28,032 8,721 31 .1 43,324 8,971 20 .72009 . . . . . . . . . . . . . . . . . . 242,047 29,830 12 .3 197,938 20,701 10 .5 28,163 8,283 29 .4 43,010 8,580 19 .92008 . . . . . . . . . . . . . . . . . . 240,548 26,990 11 .2 197,763 18,558 9 .4 27,010 7,340 27 .2 41,810 7,982 19 .12007 . . . . . . . . . . . . . . . . . . 239,133 25,120 10 .5 195,944 17,141 8 .7 27,159 7,188 26 .5 41,931 7,505 17 .9
2006 . . . . . . . . . . . . . . . . . . 237,619 24,416 10 .3 196,061 16,644 8 .5 27,057 7,160 26 .5 40,461 7,334 18 .12005 . . . . . . . . . . . . . . . . . . 235,430 24,872 10 .6 194,277 16,782 8 .6 25,943 7,021 27 .1 40,164 7,718 19 .220042 . . . . . . . . . . . . . . . . . 233,741 25,327 10 .8 193,024 17,445 9 .0 26,139 6,892 26 .4 39,712 7,416 18 .72003 . . . . . . . . . . . . . . . . . . 231,866 24,272 10 .5 192,074 16,740 8 .7 25,536 6,530 25 .6 38,913 7,225 18 .62002 . . . . . . . . . . . . . . . . . . 230,376 23,466 10 .2 190,823 16,043 8 .4 24,903 5,992 24 .1 38,575 7,105 18 .4
WHITE9
2001 . . . . . . . . . . . . . . . . . . 229,675 22,739 9 .9 190,413 15,369 8 .1 24,619 5,972 24 .3 38,294 6,996 18 .320003 . . . . . . . . . . . . . . . . . 227,846 21,645 9 .5 188,966 14,692 7 .8 24,166 5,609 23 .2 37,699 6,454 17 .119994 . . . . . . . . . . . . . . . . . 225,361 22,169 9 .8 187,833 15,353 8 .2 23,913 5,947 24 .9 36,441 6,411 17 .61998 . . . . . . . . . . . . . . . . . . 222,837 23,454 10 .5 186,184 16,549 8 .9 24,211 6,674 27 .6 35,563 6,386 18 .01997 . . . . . . . . . . . . . . . . . . 221,200 24,396 11 .0 185,147 17,258 9 .3 23,773 7,296 30 .7 34,858 6,593 18 .9
1996 . . . . . . . . . . . . . . . . . . 219,656 24,650 11 .2 184,119 17,621 9 .6 23,744 7,073 29 .8 34,247 6,463 18 .91995 . . . . . . . . . . . . . . . . . . 218,028 24,423 11 .2 183,450 17,593 9 .6 23,732 7,047 29 .7 33,399 6,336 19 .01994 . . . . . . . . . . . . . . . . . . 216,460 25,379 11 .7 182,546 18,474 10 .1 22,713 7,228 31 .8 32,569 6,292 19 .31993 . . . . . . . . . . . . . . . . . . 214,899 26,226 12 .2 181,330 18,968 10 .5 23,224 7,199 31 .0 32,112 6,443 20 .119925 . . . . . . . . . . . . . . . . . 213,060 25,259 11 .9 180,409 18,294 10 .1 22,453 6,907 30 .8 31,170 6,147 19 .7
19916 . . . . . . . . . . . . . . . . . 210,133 23,747 11 .3 177,619 17,268 9 .7 21,608 6,806 31 .5 31,207 5,872 18 .81990 . . . . . . . . . . . . . . . . . . 208,611 22,326 10 .7 176,504 15,916 9 .0 20,845 6,210 29 .8 30,833 5,739 18 .61989 . . . . . . . . . . . . . . . . . . 206,853 20,785 10 .0 175,857 15,179 8 .6 20,362 5,723 28 .1 29,993 5,063 16 .919887 . . . . . . . . . . . . . . . . . 205,235 20,715 10 .1 175,111 15,001 8 .6 20,396 5,950 29 .2 29,315 5,314 18 .119877 . . . . . . . . . . . . . . . . . 203,605 21,195 10 .4 174,488 15,593 8 .9 20,244 5,989 29 .6 28,290 5,174 18 .3
1986 . . . . . . . . . . . . . . . . . . 202,282 22,183 11 .0 174,024 16,393 9 .4 20,163 6,171 30 .6 27,143 5,198 19 .21985 . . . . . . . . . . . . . . . . . . 200,918 22,860 11 .4 172,863 17,125 9 .9 20,105 5,990 29 .8 27,067 5,299 19 .61984 . . . . . . . . . . . . . . . . . . 198,941 22,955 11 .5 171,839 17,299 10 .1 19,727 5,866 29 .7 26,094 5,181 19 .91983 . . . . . . . . . . . . . . . . . . 197,496 23,984 12 .1 171,407 18,377 10 .7 19,256 6,017 31 .2 25,206 5,189 20 .61982 . . . . . . . . . . . . . . . . . . 195,919 23,517 12 .0 170,748 18,015 10 .6 18,374 5,686 30 .9 24,300 5,041 20 .7
1981 . . . . . . . . . . . . . . . . . . 194,504 21,553 11 .1 169,868 16,127 9 .5 18,795 5,600 29 .8 23,913 5,061 21 .21980 . . . . . . . . . . . . . . . . . . 192,912 19,699 10 .2 168,756 14,587 8 .6 17,642 4,940 28 .0 23,370 4,760 20 .41979 . . . . . . . . . . . . . . . . . . 191,742 17,214 9 .0 168,461 12,495 7 .4 17,349 4,375 25 .2 22,587 4,452 19 .71978 . . . . . . . . . . . . . . . . . . 186,450 16,259 8 .7 165,193 12,050 7 .3 16,877 4,371 25 .9 21,257 4,209 19 .81977 . . . . . . . . . . . . . . . . . . 185,254 16,416 8 .9 165,385 12,364 7 .5 16,721 4,474 26 .8 19,869 4,051 20 .4
1976 . . . . . . . . . . . . . . . . . . 184,165 16,713 9 .1 165,571 12,500 7 .5 15,941 4,463 28 .0 18,594 4,213 22 .71975 . . . . . . . . . . . . . . . . . . 183,164 17,770 9 .7 165,661 13,799 8 .3 15,577 4,577 29 .4 17,503 3,972 22 .71974 . . . . . . . . . . . . . . . . . . 182,376 15,736 8 .6 166,081 12,181 7 .3 15,433 4,278 27 .7 16,295 3,555 21 .81973 . . . . . . . . . . . . . . . . . . 181,185 15,142 8 .4 165,424 11,412 6 .9 14,303 4,003 28 .0 15,761 3,730 23 .71972 . . . . . . . . . . . . . . . . . . 180,125 16,203 9 .0 165,630 12,268 7 .4 13,739 3,770 27 .4 14,495 3,935 27 .1
1971 . . . . . . . . . . . . . . . . . . 179,398 17,780 9 .9 165,184 13,566 8 .2 13,502 4,099 30 .4 14,214 4,214 29 .61970 . . . . . . . . . . . . . . . . . . 177,376 17,484 9 .9 163,875 13,323 8 .1 13,226 3,761 28 .4 13,500 4,161 30 .81969 . . . . . . . . . . . . . . . . . . 175,349 16,659 9 .5 162,779 12,623 7 .8 12,285 3,577 29 .1 12,570 4,036 32 .11968 . . . . . . . . . . . . . . . . . . 173,732 17,395 10 .0 161,777 13,546 8 .4 12,190 3,551 29 .1 11,955 3,849 32 .21967 . . . . . . . . . . . . . . . . . . 172,038 18,983 11 .0 160,720 14,851 9 .2 12,131 3,453 28 .5 11,318 4,132 36 .5
1966 . . . . . . . . . . . . . . . . . . 170,247 19,290 11 .3 159,561 15,430 9 .7 12,261 3,646 29 .7 10,686 3,860 36 .11965 . . . . . . . . . . . . . . . . . . 168,732 22,496 13 .3 158,255 18,508 11 .7 11,573 4,092 35 .4 10,477 3,988 38 .11964 . . . . . . . . . . . . . . . . . . 167,313 24,957 14 .9 156,898 20,716 13 .2 (NA) 3,911 33 .4 10,415 4,241 40 .71963 . . . . . . . . . . . . . . . . . . 165,309 25,238 15 .3 155,584 21,149 13 .6 (NA) 4,051 35 .6 9,725 4,089 42 .0
1962 . . . . . . . . . . . . . . . . . . 162,842 26,672 16 .4 153,348 22,613 14 .7 (NA) 4,089 37 .9 9,494 4,059 42 .71961 . . . . . . . . . . . . . . . . . . 160,306 27,890 17 .4 150,717 23,747 15 .8 (NA) 4,062 37 .6 9,589 4,143 43 .21960 . . . . . . . . . . . . . . . . . . 158,863 28,309 17 .8 149,458 24,262 16 .2 (NA) 4,296 39 .0 9,405 4,047 43 .01959 . . . . . . . . . . . . . . . . . . 156,956 28,484 18 .1 147,802 24,443 16 .5 (NA) 4,232 40 .2 9,154 4,041 44 .1
Table B-1.Poverty Status of People by Family Relationship, Race, and Hispanic origin: 1959 to 2012—Con .(Numbers in thousands . People as of March of the following year . For information on confidentiality protection, sampling error, nonsampling error, and definitions, see www.census.gov/prod/techdoc/cps/cpsmar13.pdf)
See footnotes at end of table .
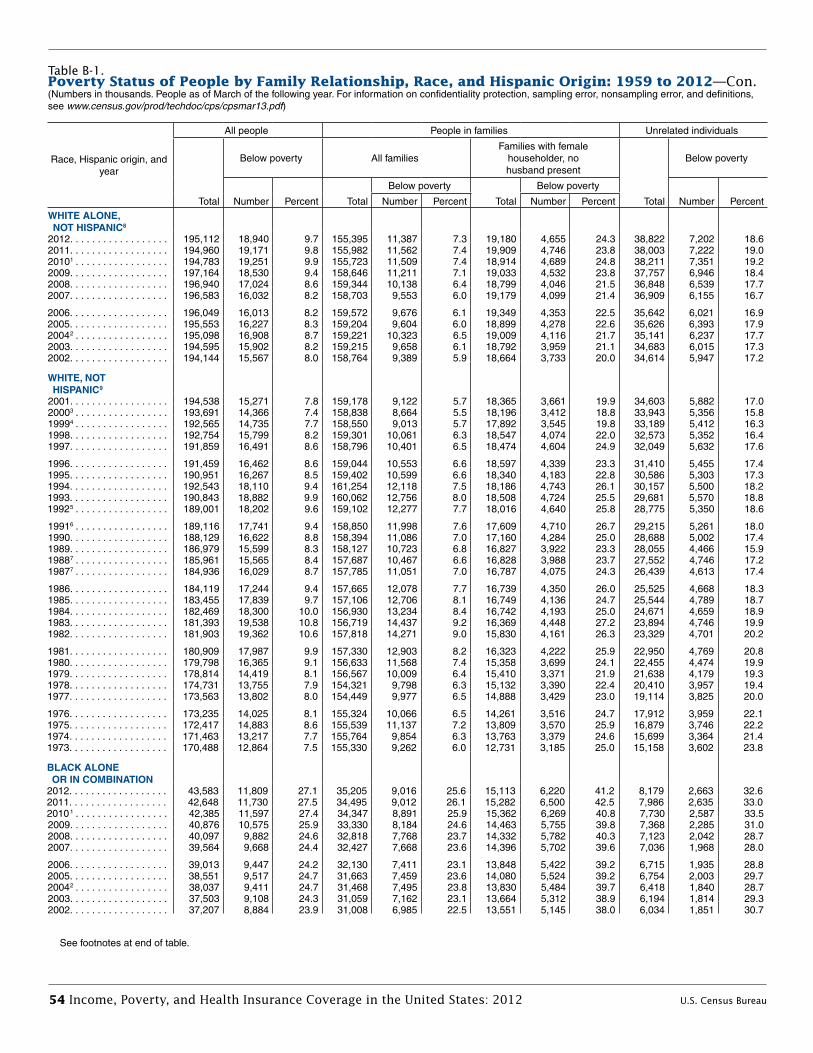
54 Income, Poverty, and Health Insurance Coverage in the United States: 2012 U.S. Census Bureau
Race, Hispanic origin, and year
All people People in families Unrelated individuals
Total
Below poverty All familiesFamilies with female
householder, no husband present
Total
Below poverty
Number Percent Total
Below poverty
Total
Below poverty
Number PercentNumber Percent Number PercentWHITE ALONE, NOT HISPANIC8
2012 . . . . . . . . . . . . . . . . . . 195,112 18,940 9 .7 155,395 11,387 7 .3 19,180 4,655 24 .3 38,822 7,202 18 .62011 . . . . . . . . . . . . . . . . . . 194,960 19,171 9 .8 155,982 11,562 7 .4 19,909 4,746 23 .8 38,003 7,222 19 .020101 . . . . . . . . . . . . . . . . . 194,783 19,251 9 .9 155,723 11,509 7 .4 18,914 4,689 24 .8 38,211 7,351 19 .22009 . . . . . . . . . . . . . . . . . . 197,164 18,530 9 .4 158,646 11,211 7 .1 19,033 4,532 23 .8 37,757 6,946 18 .42008 . . . . . . . . . . . . . . . . . . 196,940 17,024 8 .6 159,344 10,138 6 .4 18,799 4,046 21 .5 36,848 6,539 17 .72007 . . . . . . . . . . . . . . . . . . 196,583 16,032 8 .2 158,703 9,553 6 .0 19,179 4,099 21 .4 36,909 6,155 16 .7
2006 . . . . . . . . . . . . . . . . . . 196,049 16,013 8 .2 159,572 9,676 6 .1 19,349 4,353 22 .5 35,642 6,021 16 .92005 . . . . . . . . . . . . . . . . . . 195,553 16,227 8 .3 159,204 9,604 6 .0 18,899 4,278 22 .6 35,626 6,393 17 .920042 . . . . . . . . . . . . . . . . . 195,098 16,908 8 .7 159,221 10,323 6 .5 19,009 4,116 21 .7 35,141 6,237 17 .72003 . . . . . . . . . . . . . . . . . . 194,595 15,902 8 .2 159,215 9,658 6 .1 18,792 3,959 21 .1 34,683 6,015 17 .32002 . . . . . . . . . . . . . . . . . . 194,144 15,567 8 .0 158,764 9,389 5 .9 18,664 3,733 20 .0 34,614 5,947 17 .2
WHITE, NOT HISPANIC9
2001 . . . . . . . . . . . . . . . . . . 194,538 15,271 7 .8 159,178 9,122 5 .7 18,365 3,661 19 .9 34,603 5,882 17 .020003 . . . . . . . . . . . . . . . . . 193,691 14,366 7 .4 158,838 8,664 5 .5 18,196 3,412 18 .8 33,943 5,356 15 .819994 . . . . . . . . . . . . . . . . . 192,565 14,735 7 .7 158,550 9,013 5 .7 17,892 3,545 19 .8 33,189 5,412 16 .31998 . . . . . . . . . . . . . . . . . . 192,754 15,799 8 .2 159,301 10,061 6 .3 18,547 4,074 22 .0 32,573 5,352 16 .41997 . . . . . . . . . . . . . . . . . . 191,859 16,491 8 .6 158,796 10,401 6 .5 18,474 4,604 24 .9 32,049 5,632 17 .6
1996 . . . . . . . . . . . . . . . . . . 191,459 16,462 8 .6 159,044 10,553 6 .6 18,597 4,339 23 .3 31,410 5,455 17 .41995 . . . . . . . . . . . . . . . . . . 190,951 16,267 8 .5 159,402 10,599 6 .6 18,340 4,183 22 .8 30,586 5,303 17 .31994 . . . . . . . . . . . . . . . . . . 192,543 18,110 9 .4 161,254 12,118 7 .5 18,186 4,743 26 .1 30,157 5,500 18 .21993 . . . . . . . . . . . . . . . . . . 190,843 18,882 9 .9 160,062 12,756 8 .0 18,508 4,724 25 .5 29,681 5,570 18 .819925 . . . . . . . . . . . . . . . . . 189,001 18,202 9 .6 159,102 12,277 7 .7 18,016 4,640 25 .8 28,775 5,350 18 .6
19916 . . . . . . . . . . . . . . . . . 189,116 17,741 9 .4 158,850 11,998 7 .6 17,609 4,710 26 .7 29,215 5,261 18 .01990 . . . . . . . . . . . . . . . . . . 188,129 16,622 8 .8 158,394 11,086 7 .0 17,160 4,284 25 .0 28,688 5,002 17 .41989 . . . . . . . . . . . . . . . . . . 186,979 15,599 8 .3 158,127 10,723 6 .8 16,827 3,922 23 .3 28,055 4,466 15 .919887 . . . . . . . . . . . . . . . . . 185,961 15,565 8 .4 157,687 10,467 6 .6 16,828 3,988 23 .7 27,552 4,746 17 .219877 . . . . . . . . . . . . . . . . . 184,936 16,029 8 .7 157,785 11,051 7 .0 16,787 4,075 24 .3 26,439 4,613 17 .4
1986 . . . . . . . . . . . . . . . . . . 184,119 17,244 9 .4 157,665 12,078 7 .7 16,739 4,350 26 .0 25,525 4,668 18 .31985 . . . . . . . . . . . . . . . . . . 183,455 17,839 9 .7 157,106 12,706 8 .1 16,749 4,136 24 .7 25,544 4,789 18 .71984 . . . . . . . . . . . . . . . . . . 182,469 18,300 10 .0 156,930 13,234 8 .4 16,742 4,193 25 .0 24,671 4,659 18 .91983 . . . . . . . . . . . . . . . . . . 181,393 19,538 10 .8 156,719 14,437 9 .2 16,369 4,448 27 .2 23,894 4,746 19 .91982 . . . . . . . . . . . . . . . . . . 181,903 19,362 10 .6 157,818 14,271 9 .0 15,830 4,161 26 .3 23,329 4,701 20 .2
1981 . . . . . . . . . . . . . . . . . . 180,909 17,987 9 .9 157,330 12,903 8 .2 16,323 4,222 25 .9 22,950 4,769 20 .81980 . . . . . . . . . . . . . . . . . . 179,798 16,365 9 .1 156,633 11,568 7 .4 15,358 3,699 24 .1 22,455 4,474 19 .91979 . . . . . . . . . . . . . . . . . . 178,814 14,419 8 .1 156,567 10,009 6 .4 15,410 3,371 21 .9 21,638 4,179 19 .31978 . . . . . . . . . . . . . . . . . . 174,731 13,755 7 .9 154,321 9,798 6 .3 15,132 3,390 22 .4 20,410 3,957 19 .41977 . . . . . . . . . . . . . . . . . . 173,563 13,802 8 .0 154,449 9,977 6 .5 14,888 3,429 23 .0 19,114 3,825 20 .0
1976 . . . . . . . . . . . . . . . . . . 173,235 14,025 8 .1 155,324 10,066 6 .5 14,261 3,516 24 .7 17,912 3,959 22 .11975 . . . . . . . . . . . . . . . . . . 172,417 14,883 8 .6 155,539 11,137 7 .2 13,809 3,570 25 .9 16,879 3,746 22 .21974 . . . . . . . . . . . . . . . . . . 171,463 13,217 7 .7 155,764 9,854 6 .3 13,763 3,379 24 .6 15,699 3,364 21 .41973 . . . . . . . . . . . . . . . . . . 170,488 12,864 7 .5 155,330 9,262 6 .0 12,731 3,185 25 .0 15,158 3,602 23 .8
BLACK ALONE OR IN COMBINATION2012 . . . . . . . . . . . . . . . . . . 43,583 11,809 27 .1 35,205 9,016 25 .6 15,113 6,220 41 .2 8,179 2,663 32 .62011 . . . . . . . . . . . . . . . . . . 42,648 11,730 27 .5 34,495 9,012 26 .1 15,282 6,500 42 .5 7,986 2,635 33 .020101 . . . . . . . . . . . . . . . . . 42,385 11,597 27 .4 34,347 8,891 25 .9 15,362 6,269 40 .8 7,730 2,587 33 .52009 . . . . . . . . . . . . . . . . . . 40,876 10,575 25 .9 33,330 8,184 24 .6 14,463 5,755 39 .8 7,368 2,285 31 .02008 . . . . . . . . . . . . . . . . . . 40,097 9,882 24 .6 32,818 7,768 23 .7 14,332 5,782 40 .3 7,123 2,042 28 .72007 . . . . . . . . . . . . . . . . . . 39,564 9,668 24 .4 32,427 7,668 23 .6 14,396 5,702 39 .6 7,036 1,968 28 .0
2006 . . . . . . . . . . . . . . . . . . 39,013 9,447 24 .2 32,130 7,411 23 .1 13,848 5,422 39 .2 6,715 1,935 28 .82005 . . . . . . . . . . . . . . . . . . 38,551 9,517 24 .7 31,663 7,459 23 .6 14,080 5,524 39 .2 6,754 2,003 29 .720042 . . . . . . . . . . . . . . . . . 38,037 9,411 24 .7 31,468 7,495 23 .8 13,830 5,484 39 .7 6,418 1,840 28 .72003 . . . . . . . . . . . . . . . . . . 37,503 9,108 24 .3 31,059 7,162 23 .1 13,664 5,312 38 .9 6,194 1,814 29 .32002 . . . . . . . . . . . . . . . . . . 37,207 8,884 23 .9 31,008 6,985 22 .5 13,551 5,145 38 .0 6,034 1,851 30 .7
Table B-1.Poverty Status of People by Family Relationship, Race, and Hispanic origin: 1959 to 2012—Con .(Numbers in thousands . People as of March of the following year . For information on confidentiality protection, sampling error, nonsampling error, and definitions, see www.census.gov/prod/techdoc/cps/cpsmar13.pdf)
See footnotes at end of table .
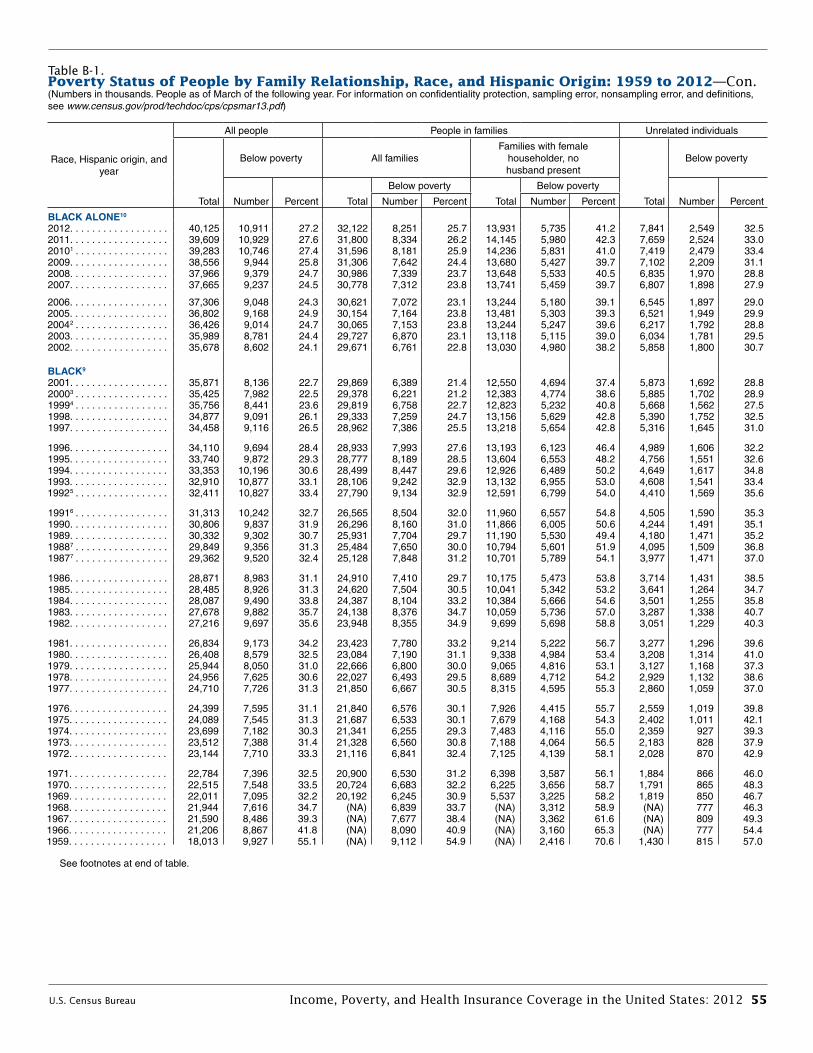
U.S. Census Bureau Income, Poverty, and Health Insurance Coverage in the United States: 2012 55
Race, Hispanic origin, and year
All people People in families Unrelated individuals
Total
Below poverty All familiesFamilies with female
householder, no husband present
Total
Below poverty
Number Percent Total
Below poverty
Total
Below poverty
Number PercentNumber Percent Number Percent
BLACK ALONE10
2012 . . . . . . . . . . . . . . . . . . 40,125 10,911 27 .2 32,122 8,251 25 .7 13,931 5,735 41 .2 7,841 2,549 32 .52011 . . . . . . . . . . . . . . . . . . 39,609 10,929 27 .6 31,800 8,334 26 .2 14,145 5,980 42 .3 7,659 2,524 33 .020101 . . . . . . . . . . . . . . . . . 39,283 10,746 27 .4 31,596 8,181 25 .9 14,236 5,831 41 .0 7,419 2,479 33 .42009 . . . . . . . . . . . . . . . . . . 38,556 9,944 25 .8 31,306 7,642 24 .4 13,680 5,427 39 .7 7,102 2,209 31 .12008 . . . . . . . . . . . . . . . . . . 37,966 9,379 24 .7 30,986 7,339 23 .7 13,648 5,533 40 .5 6,835 1,970 28 .82007 . . . . . . . . . . . . . . . . . . 37,665 9,237 24 .5 30,778 7,312 23 .8 13,741 5,459 39 .7 6,807 1,898 27 .9
2006 . . . . . . . . . . . . . . . . . . 37,306 9,048 24 .3 30,621 7,072 23 .1 13,244 5,180 39 .1 6,545 1,897 29 .02005 . . . . . . . . . . . . . . . . . . 36,802 9,168 24 .9 30,154 7,164 23 .8 13,481 5,303 39 .3 6,521 1,949 29 .920042 . . . . . . . . . . . . . . . . . 36,426 9,014 24 .7 30,065 7,153 23 .8 13,244 5,247 39 .6 6,217 1,792 28 .82003 . . . . . . . . . . . . . . . . . . 35,989 8,781 24 .4 29,727 6,870 23 .1 13,118 5,115 39 .0 6,034 1,781 29 .52002 . . . . . . . . . . . . . . . . . . 35,678 8,602 24 .1 29,671 6,761 22 .8 13,030 4,980 38 .2 5,858 1,800 30 .7
BLACK9
2001 . . . . . . . . . . . . . . . . . . 35,871 8,136 22 .7 29,869 6,389 21 .4 12,550 4,694 37 .4 5,873 1,692 28 .820003 . . . . . . . . . . . . . . . . . 35,425 7,982 22 .5 29,378 6,221 21 .2 12,383 4,774 38 .6 5,885 1,702 28 .919994 . . . . . . . . . . . . . . . . . 35,756 8,441 23 .6 29,819 6,758 22 .7 12,823 5,232 40 .8 5,668 1,562 27 .51998 . . . . . . . . . . . . . . . . . . 34,877 9,091 26 .1 29,333 7,259 24 .7 13,156 5,629 42 .8 5,390 1,752 32 .51997 . . . . . . . . . . . . . . . . . . 34,458 9,116 26 .5 28,962 7,386 25 .5 13,218 5,654 42 .8 5,316 1,645 31 .0
1996 . . . . . . . . . . . . . . . . . . 34,110 9,694 28 .4 28,933 7,993 27 .6 13,193 6,123 46 .4 4,989 1,606 32 .21995 . . . . . . . . . . . . . . . . . . 33,740 9,872 29 .3 28,777 8,189 28 .5 13,604 6,553 48 .2 4,756 1,551 32 .61994 . . . . . . . . . . . . . . . . . . 33,353 10,196 30 .6 28,499 8,447 29 .6 12,926 6,489 50 .2 4,649 1,617 34 .81993 . . . . . . . . . . . . . . . . . . 32,910 10,877 33 .1 28,106 9,242 32 .9 13,132 6,955 53 .0 4,608 1,541 33 .419925 . . . . . . . . . . . . . . . . . 32,411 10,827 33 .4 27,790 9,134 32 .9 12,591 6,799 54 .0 4,410 1,569 35 .6
19916 . . . . . . . . . . . . . . . . . 31,313 10,242 32 .7 26,565 8,504 32 .0 11,960 6,557 54 .8 4,505 1,590 35 .31990 . . . . . . . . . . . . . . . . . . 30,806 9,837 31 .9 26,296 8,160 31 .0 11,866 6,005 50 .6 4,244 1,491 35 .11989 . . . . . . . . . . . . . . . . . . 30,332 9,302 30 .7 25,931 7,704 29 .7 11,190 5,530 49 .4 4,180 1,471 35 .219887 . . . . . . . . . . . . . . . . . 29,849 9,356 31 .3 25,484 7,650 30 .0 10,794 5,601 51 .9 4,095 1,509 36 .819877 . . . . . . . . . . . . . . . . . 29,362 9,520 32 .4 25,128 7,848 31 .2 10,701 5,789 54 .1 3,977 1,471 37 .0
1986 . . . . . . . . . . . . . . . . . . 28,871 8,983 31 .1 24,910 7,410 29 .7 10,175 5,473 53 .8 3,714 1,431 38 .51985 . . . . . . . . . . . . . . . . . . 28,485 8,926 31 .3 24,620 7,504 30 .5 10,041 5,342 53 .2 3,641 1,264 34 .71984 . . . . . . . . . . . . . . . . . . 28,087 9,490 33 .8 24,387 8,104 33 .2 10,384 5,666 54 .6 3,501 1,255 35 .81983 . . . . . . . . . . . . . . . . . . 27,678 9,882 35 .7 24,138 8,376 34 .7 10,059 5,736 57 .0 3,287 1,338 40 .71982 . . . . . . . . . . . . . . . . . . 27,216 9,697 35 .6 23,948 8,355 34 .9 9,699 5,698 58 .8 3,051 1,229 40 .3
1981 . . . . . . . . . . . . . . . . . . 26,834 9,173 34 .2 23,423 7,780 33 .2 9,214 5,222 56 .7 3,277 1,296 39 .61980 . . . . . . . . . . . . . . . . . . 26,408 8,579 32 .5 23,084 7,190 31 .1 9,338 4,984 53 .4 3,208 1,314 41 .01979 . . . . . . . . . . . . . . . . . . 25,944 8,050 31 .0 22,666 6,800 30 .0 9,065 4,816 53 .1 3,127 1,168 37 .31978 . . . . . . . . . . . . . . . . . . 24,956 7,625 30 .6 22,027 6,493 29 .5 8,689 4,712 54 .2 2,929 1,132 38 .61977 . . . . . . . . . . . . . . . . . . 24,710 7,726 31 .3 21,850 6,667 30 .5 8,315 4,595 55 .3 2,860 1,059 37 .0
1976 . . . . . . . . . . . . . . . . . . 24,399 7,595 31 .1 21,840 6,576 30 .1 7,926 4,415 55 .7 2,559 1,019 39 .81975 . . . . . . . . . . . . . . . . . . 24,089 7,545 31 .3 21,687 6,533 30 .1 7,679 4,168 54 .3 2,402 1,011 42 .11974 . . . . . . . . . . . . . . . . . . 23,699 7,182 30 .3 21,341 6,255 29 .3 7,483 4,116 55 .0 2,359 927 39 .31973 . . . . . . . . . . . . . . . . . . 23,512 7,388 31 .4 21,328 6,560 30 .8 7,188 4,064 56 .5 2,183 828 37 .91972 . . . . . . . . . . . . . . . . . . 23,144 7,710 33 .3 21,116 6,841 32 .4 7,125 4,139 58 .1 2,028 870 42 .9
1971 . . . . . . . . . . . . . . . . . . 22,784 7,396 32 .5 20,900 6,530 31 .2 6,398 3,587 56 .1 1,884 866 46 .01970 . . . . . . . . . . . . . . . . . . 22,515 7,548 33 .5 20,724 6,683 32 .2 6,225 3,656 58 .7 1,791 865 48 .31969 . . . . . . . . . . . . . . . . . . 22,011 7,095 32 .2 20,192 6,245 30 .9 5,537 3,225 58 .2 1,819 850 46 .71968 . . . . . . . . . . . . . . . . . . 21,944 7,616 34 .7 (NA) 6,839 33 .7 (NA) 3,312 58 .9 (NA) 777 46 .31967 . . . . . . . . . . . . . . . . . . 21,590 8,486 39 .3 (NA) 7,677 38 .4 (NA) 3,362 61 .6 (NA) 809 49 .31966 . . . . . . . . . . . . . . . . . . 21,206 8,867 41 .8 (NA) 8,090 40 .9 (NA) 3,160 65 .3 (NA) 777 54 .41959 . . . . . . . . . . . . . . . . . . 18,013 9,927 55 .1 (NA) 9,112 54 .9 (NA) 2,416 70 .6 1,430 815 57 .0
Table B-1.Poverty Status of People by Family Relationship, Race, and Hispanic origin: 1959 to 2012—Con .(Numbers in thousands . People as of March of the following year . For information on confidentiality protection, sampling error, nonsampling error, and definitions, see www.census.gov/prod/techdoc/cps/cpsmar13.pdf)
See footnotes at end of table .

56 Income, Poverty, and Health Insurance Coverage in the United States: 2012 U.S. Census Bureau
Race, Hispanic origin, and year
All people People in families Unrelated individuals
Total
Below poverty All familiesFamilies with female
householder, no husband present
Total
Below poverty
Number Percent Total
Below poverty
Total
Below poverty
Number PercentNumber Percent Number PercentASIAN ALONE OR IN COMBINATION2012 . . . . . . . . . . . . . . . . . . 18,173 2,072 11 .4 15,751 1,467 9 .3 1,756 374 21 .3 2,334 580 24 .82011 . . . . . . . . . . . . . . . . . . 17,813 2,189 12 .3 15,591 1,550 9 .9 1,847 411 22 .2 2,133 614 28 .820101 . . . . . . . . . . . . . . . . . 17,237 2,064 12 .0 14,950 1,463 9 .8 1,804 386 21 .4 2,208 578 26 .22009 . . . . . . . . . . . . . . . . . . 15,272 1,901 12 .4 13,403 1,361 10 .2 1,539 290 18 .9 1,826 527 28 .82008 . . . . . . . . . . . . . . . . . . 14,543 1,686 11 .6 12,817 1,270 9 .9 1,471 228 15 .5 1,707 410 24 .02007 . . . . . . . . . . . . . . . . . . 14,430 1,467 10 .2 12,527 1,012 8 .1 1,421 250 17 .6 1,837 426 23 .2
2006 . . . . . . . . . . . . . . . . . . 14,331 1,447 10 .1 12,463 984 7 .9 1,210 220 18 .1 1,801 449 24 .92005 . . . . . . . . . . . . . . . . . . 13,731 1,501 10 .9 11,931 1,039 8 .7 1,223 220 18 .0 1,771 457 25 .820042 . . . . . . . . . . . . . . . . . 13,291 1,295 9 .7 11,661 876 7 .5 1,190 170 14 .3 1,599 417 26 .12003 . . . . . . . . . . . . . . . . . . 12,891 1,527 11 .8 11,266 1,116 9 .9 1,184 294 24 .8 1,590 402 25 .32002 . . . . . . . . . . . . . . . . . . 12,487 1,243 10 .0 10,742 816 7 .6 1,146 175 15 .3 1,708 417 24 .4
ASIAN ALONE11
2012 . . . . . . . . . . . . . . . . . . 16,417 1,921 11 .7 14,190 1,357 9 .6 1,515 309 20 .4 2,156 547 25 .42011 . . . . . . . . . . . . . . . . . . 16,086 1,973 12 .3 14,100 1,389 9 .9 1,570 327 20 .8 1,921 571 29 .720101 . . . . . . . . . . . . . . . . . 15,611 1,899 12 .2 13,515 1,341 9 .9 1,471 327 22 .2 2,040 547 26 .82009 . . . . . . . . . . . . . . . . . . 14,005 1,746 12 .5 12,296 1,244 10 .1 1,353 250 18 .5 1,673 491 29 .32008 . . . . . . . . . . . . . . . . . . 13,310 1,576 11 .8 11,719 1,192 10 .2 1,308 209 16 .0 1,574 378 24 .02007 . . . . . . . . . . . . . . . . . . 13,257 1,349 10 .2 11,471 930 8 .1 1,256 217 17 .3 1,720 391 22 .7
2006 . . . . . . . . . . . . . . . . . . 13,177 1,353 10 .3 11,428 912 8 .0 1,057 187 17 .7 1,683 428 25 .42005 . . . . . . . . . . . . . . . . . . 12,580 1,402 11 .1 10,911 970 8 .9 1,059 189 17 .8 1,645 427 26 .020042 . . . . . . . . . . . . . . . . . 12,231 1,201 9 .8 10,734 812 7 .6 1,024 135 13 .2 1,472 388 26 .32003 . . . . . . . . . . . . . . . . . . 11,856 1,401 11 .8 10,333 1,017 9 .8 1,028 242 23 .6 1,494 375 25 .12002 . . . . . . . . . . . . . . . . . . 11,541 1,161 10 .1 9,899 763 7 .7 1,019 155 15 .2 1,613 390 24 .2
ASIAN AND PACIFIC ISLANDER9
2001 . . . . . . . . . . . . . . . . . . 12,465 1,275 10 .2 10,745 873 8 .1 1,333 198 14 .8 1,682 393 23 .420003 . . . . . . . . . . . . . . . . . 12,672 1,258 9 .9 11,044 895 8 .1 1,231 289 23 .4 1,588 350 22 .019994 . . . . . . . . . . . . . . . . . 11,955 1,285 10 .7 10,507 1,010 9 .6 1,201 275 22 .9 1,415 270 19 .11998 . . . . . . . . . . . . . . . . . . 10,873 1,360 12 .5 9,576 1,087 11 .4 1,123 373 33 .2 1,266 257 20 .31997 . . . . . . . . . . . . . . . . . . 10,482 1,468 14 .0 9,312 1,116 12 .0 932 313 33 .6 1,134 327 28 .9
1996 . . . . . . . . . . . . . . . . . . 10,054 1,454 14 .5 8,900 1,172 13 .2 1,018 300 29 .5 1,120 255 22 .81995 . . . . . . . . . . . . . . . . . . 9,644 1,411 14 .6 8,582 1,112 13 .0 919 266 28 .9 1,013 260 25 .61994 . . . . . . . . . . . . . . . . . . 6,654 974 14 .6 5,915 776 13 .1 582 137 23 .6 696 179 25 .71993 . . . . . . . . . . . . . . . . . . 7,434 1,134 15 .3 6,609 898 13 .6 725 126 17 .4 791 228 28 .819925 . . . . . . . . . . . . . . . . . 7,779 985 12 .7 6,922 787 11 .4 729 183 25 .0 828 193 23 .3
19916 . . . . . . . . . . . . . . . . . 7,192 996 13 .8 6,367 773 12 .1 721 177 24 .6 785 209 26 .61990 . . . . . . . . . . . . . . . . . . 7,014 858 12 .2 6,300 712 11 .3 638 132 20 .7 668 124 18 .51989 . . . . . . . . . . . . . . . . . . 6,673 939 14 .1 5,917 779 13 .2 614 212 34 .6 712 144 20 .219887 . . . . . . . . . . . . . . . . . 6,447 1,117 17 .3 5,767 942 16 .3 650 263 40 .5 651 160 24 .519877 . . . . . . . . . . . . . . . . . 6,322 1,021 16 .1 5,785 875 15 .1 584 187 32 .0 516 138 26 .8
Table B-1.Poverty Status of People by Family Relationship, Race, and Hispanic origin: 1959 to 2012—Con .(Numbers in thousands . People as of March of the following year . For information on confidentiality protection, sampling error, nonsampling error, and definitions, see www.census.gov/prod/techdoc/cps/cpsmar13.pdf)
See footnotes at end of table .

U.S. Census Bureau Income, Poverty, and Health Insurance Coverage in the United States: 2012 57
Race, Hispanic origin, and year
All people People in families Unrelated individuals
Total
Below poverty All familiesFamilies with female
householder, no husband present
Total
Below poverty
Number Percent Total
Below poverty
Total
Below poverty
Number PercentNumber Percent Number PercentHISPANIC (ANY RACE)2012 . . . . . . . . . . . . . . . . . . 53,105 13,616 25 .6 46,183 11,358 24 .6 11,255 4,816 42 .8 6,502 2,018 31 .02011 . . . . . . . . . . . . . . . . . . 52,279 13,244 25 .3 45,781 11,143 24 .3 11,368 4,996 44 .0 6,096 1,882 30 .920101 . . . . . . . . . . . . . . . . . 50,971 13,522 26 .5 44,612 11,384 25 .5 10,719 4,748 44 .3 5,846 1,863 31 .92009 . . . . . . . . . . . . . . . . . . 48,811 12,350 25 .3 42,717 10,345 24 .2 10,283 4,176 40 .6 5,718 1,801 31 .52008 . . . . . . . . . . . . . . . . . . 47,398 10,987 23 .2 41,732 9,303 22 .3 9,265 3,751 40 .5 5,417 1,577 29 .12007 . . . . . . . . . . . . . . . . . . 45,933 9,890 21 .5 40,125 8,248 20 .6 8,917 3,527 39 .6 5,508 1,490 27 .1
2006 . . . . . . . . . . . . . . . . . . 44,784 9,243 20 .6 39,177 7,650 19 .5 8,652 3,189 36 .9 5,317 1,468 27 .62005 . . . . . . . . . . . . . . . . . . 43,020 9,368 21 .8 37,759 7,767 20 .6 7,868 3,069 39 .0 4,971 1,451 29 .220042 . . . . . . . . . . . . . . . . . 41,690 9,122 21 .9 36,438 7,705 21 .1 7,825 3,072 39 .3 4,971 1,293 26 .02003 . . . . . . . . . . . . . . . . . . 40,300 9,051 22 .5 35,469 7,637 21 .5 7,452 2,861 38 .4 4,620 1,325 28 .72002 . . . . . . . . . . . . . . . . . . 39,216 8,555 21 .8 34,598 7,184 20 .8 7,013 2,554 36 .4 4,364 1,255 28 .8
2001 . . . . . . . . . . . . . . . . . . 37,312 7,997 21 .4 33,110 6,674 20 .2 6,830 2,585 37 .8 3,981 1,211 30 .420003 . . . . . . . . . . . . . . . . . 35,955 7,747 21 .5 31,700 6,430 20 .3 6,469 2,444 37 .8 3,978 1,163 29 .219994 . . . . . . . . . . . . . . . . . 34,632 7,876 22 .7 30,872 6,702 21 .7 6,527 2,642 40 .5 3,481 1,068 30 .71998 . . . . . . . . . . . . . . . . . . 31,515 8,070 25 .6 28,055 6,814 24 .3 6,074 2,837 46 .7 3,218 1,097 34 .11997 . . . . . . . . . . . . . . . . . . 30,637 8,308 27 .1 27,467 7,198 26 .2 5,718 2,911 50 .9 2,976 1,017 34 .2
1996 . . . . . . . . . . . . . . . . . . 29,614 8,697 29 .4 26,340 7,515 28 .5 5,641 3,020 53 .5 2,985 1,066 35 .71995 . . . . . . . . . . . . . . . . . . 28,344 8,574 30 .3 25,165 7,341 29 .2 5,785 3,053 52 .8 2,947 1,092 37 .01994 . . . . . . . . . . . . . . . . . . 27,442 8,416 30 .7 24,390 7,357 30 .2 5,328 2,920 54 .8 2,798 926 33 .11993 . . . . . . . . . . . . . . . . . . 26,559 8,126 30 .6 23,439 6,876 29 .3 5,333 2,837 53 .2 2,717 972 35 .819925 . . . . . . . . . . . . . . . . . 25,646 7,592 29 .6 22,695 6,455 28 .4 4,806 2,474 51 .5 2,577 881 34 .2
19916 . . . . . . . . . . . . . . . . . 22,070 6,339 28 .7 19,658 5,541 28 .2 4,326 2,282 52 .7 2,146 667 31 .11990 . . . . . . . . . . . . . . . . . . 21,405 6,006 28 .1 18,912 5,091 26 .9 3,993 2,115 53 .0 2,254 774 34 .31989 . . . . . . . . . . . . . . . . . . 20,746 5,430 26 .2 18,488 4,659 25 .2 3,763 1,902 50 .6 2,045 634 31 .019887 . . . . . . . . . . . . . . . . . 20,064 5,357 26 .7 18,102 4,700 26 .0 3,734 2,052 55 .0 1,864 597 32 .019877 . . . . . . . . . . . . . . . . . 19,395 5,422 28 .0 17,342 4,761 27 .5 3,678 2,045 55 .6 1,933 598 31 .0
1986 . . . . . . . . . . . . . . . . . . 18,758 5,117 27 .3 16,880 4,469 26 .5 3,631 1,921 52 .9 1,685 553 32 .81985 . . . . . . . . . . . . . . . . . . 18,075 5,236 29 .0 16,276 4,605 28 .3 3,561 1,983 55 .7 1,602 532 33 .21984 . . . . . . . . . . . . . . . . . . 16,916 4,806 28 .4 15,293 4,192 27 .4 3,139 1,764 56 .2 1,481 545 36 .81983 . . . . . . . . . . . . . . . . . . 16,544 4,633 28 .0 15,075 4,113 27 .3 3,032 1,670 55 .1 1,364 457 33 .51982 . . . . . . . . . . . . . . . . . . 14,385 4,301 29 .9 13,242 3,865 29 .2 2,664 1,601 60 .1 1,018 358 35 .1
1981 . . . . . . . . . . . . . . . . . . 14,021 3,713 26 .5 12,922 3,349 25 .9 2,622 1,465 55 .9 1,005 313 31 .11980 . . . . . . . . . . . . . . . . . . 13,600 3,491 25 .7 12,547 3,143 25 .1 2,421 1,319 54 .5 970 312 32 .21979 . . . . . . . . . . . . . . . . . . 13,371 2,921 21 .8 12,291 2,599 21 .1 2,058 1,053 51 .2 991 286 28 .81978 . . . . . . . . . . . . . . . . . . 12,079 2,607 21 .6 11,193 2,343 20 .9 1,817 1,024 56 .4 886 264 29 .81977 . . . . . . . . . . . . . . . . . . 12,046 2,700 22 .4 11,249 2,463 21 .9 1,901 1,077 56 .7 797 237 29 .8
1976 . . . . . . . . . . . . . . . . . . 11,269 2,783 24 .7 10,552 2,516 23 .8 1,766 1,000 56 .6 716 266 37 .21975 . . . . . . . . . . . . . . . . . . 11,117 2,991 26 .9 10,472 2,755 26 .3 1,842 1,053 57 .2 645 236 36 .61974 . . . . . . . . . . . . . . . . . . 11,201 2,575 23 .0 10,584 2,374 22 .4 1,723 915 53 .1 617 201 32 .61973 . . . . . . . . . . . . . . . . . . 10,795 2,366 21 .9 10,269 2,209 21 .5 1,534 881 57 .4 526 157 29 .91972 . . . . . . . . . . . . . . . . . . 10,588 2,414 22 .8 10,099 2,252 22 .3 1,370 733 53 .5 488 162 33 .2
(NA) Not available .1 Implementation of Census 2010-based population controls .2 For 2004, figures are revised to reflect a correction to the weights in the 2005 ASEC .3 Implementation of Census 2000-based population controls and a 28,000 household sample expansion .4 For 1999, figures are based on Census 2000 population controls .5 For 1992, figures are based on 1990 census population controls .6 For 1991, figures are revised to correct for nine omitted weights from the original March 1992 CPS file .7 For 1988 and 1987, figures are based on new processing procedures and are also revised to reflect corrections to the files after publication of the 1988 advance report Money Income
and Poverty Status in the United States: 1988, P-60, No . 166 .8 The 2003 CPS allowed respondents to choose more than one race . White alone refers to people who reported White and did not report any other race category . The use of this single-
race population does not imply that it is the preferred method of presenting or analyzing data . The Census Bureau uses a variety of approaches . Information on people who reported more than one race, such as White and American Indian and Alaska Native or Asian and Black or African American, is available from Census 2010 through American FactFinder . About 2 .9 percent of people reported more than one race in Census 2010 .
9 For 2001 and earlier years, the CPS allowed respondents to report only one race group . The reference race groups for 2001 and earlier poverty data are White, non-Hispanic White, Black, and Asian and Pacific Islander .
10 Black alone refers to people who reported Black and did not report any other race .11 Asian alone refers to people who reported Asian and did not report any other race .Note: Prior to 1979, people in unrelated subfamilies were included in people in families . Beginning in 1979, people in unrelated subfamilies are included in all people but are excluded
from people in families .Source: U .S . Census Bureau, Current Population Survey, 1960 to 2013 Annual Social and Economic Supplements .
Table B-1.Poverty Status of People by Family Relationship, Race, and Hispanic origin: 1959 to 2012—Con .(Numbers in thousands . People as of March of the following year . For information on confidentiality protection, sampling error, nonsampling error, and definitions, see www.census.gov/prod/techdoc/cps/cpsmar13.pdf)
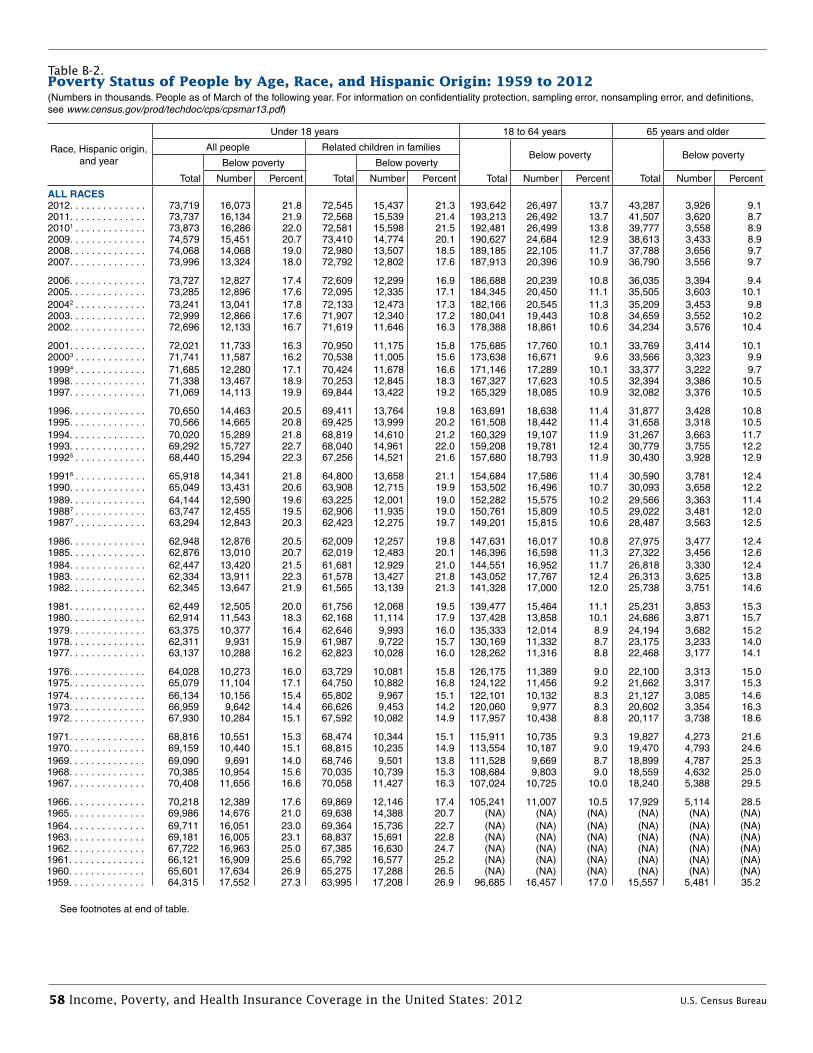
58 Income, Poverty, and Health Insurance Coverage in the United States: 2012 U.S. Census Bureau
Race, Hispanic origin, and year
Under 18 years 18 to 64 years 65 years and older
All people Related children in families
Total
Below poverty
Total
Below poverty
Total
Below poverty
Total
Below poverty
Number Percent Number Percent Number Percent Number Percent
ALL RACES2012 . . . . . . . . . . . . . . 73,719 16,073 21 .8 72,545 15,437 21 .3 193,642 26,497 13 .7 43,287 3,926 9 .12011 . . . . . . . . . . . . . . 73,737 16,134 21 .9 72,568 15,539 21 .4 193,213 26,492 13 .7 41,507 3,620 8 .720101 . . . . . . . . . . . . . 73,873 16,286 22 .0 72,581 15,598 21 .5 192,481 26,499 13 .8 39,777 3,558 8 .92009 . . . . . . . . . . . . . . 74,579 15,451 20 .7 73,410 14,774 20 .1 190,627 24,684 12 .9 38,613 3,433 8 .92008 . . . . . . . . . . . . . . 74,068 14,068 19 .0 72,980 13,507 18 .5 189,185 22,105 11 .7 37,788 3,656 9 .72007 . . . . . . . . . . . . . . 73,996 13,324 18 .0 72,792 12,802 17 .6 187,913 20,396 10 .9 36,790 3,556 9 .7
2006 . . . . . . . . . . . . . . 73,727 12,827 17 .4 72,609 12,299 16 .9 186,688 20,239 10 .8 36,035 3,394 9 .42005 . . . . . . . . . . . . . . 73,285 12,896 17 .6 72,095 12,335 17 .1 184,345 20,450 11 .1 35,505 3,603 10 .120042 . . . . . . . . . . . . . 73,241 13,041 17 .8 72,133 12,473 17 .3 182,166 20,545 11 .3 35,209 3,453 9 .82003 . . . . . . . . . . . . . . 72,999 12,866 17 .6 71,907 12,340 17 .2 180,041 19,443 10 .8 34,659 3,552 10 .22002 . . . . . . . . . . . . . . 72,696 12,133 16 .7 71,619 11,646 16 .3 178,388 18,861 10 .6 34,234 3,576 10 .4
2001 . . . . . . . . . . . . . . 72,021 11,733 16 .3 70,950 11,175 15 .8 175,685 17,760 10 .1 33,769 3,414 10 .120003 . . . . . . . . . . . . . 71,741 11,587 16 .2 70,538 11,005 15 .6 173,638 16,671 9 .6 33,566 3,323 9 .919994 . . . . . . . . . . . . . 71,685 12,280 17 .1 70,424 11,678 16 .6 171,146 17,289 10 .1 33,377 3,222 9 .71998 . . . . . . . . . . . . . . 71,338 13,467 18 .9 70,253 12,845 18 .3 167,327 17,623 10 .5 32,394 3,386 10 .51997 . . . . . . . . . . . . . . 71,069 14,113 19 .9 69,844 13,422 19 .2 165,329 18,085 10 .9 32,082 3,376 10 .5
1996 . . . . . . . . . . . . . . 70,650 14,463 20 .5 69,411 13,764 19 .8 163,691 18,638 11 .4 31,877 3,428 10 .81995 . . . . . . . . . . . . . . 70,566 14,665 20 .8 69,425 13,999 20 .2 161,508 18,442 11 .4 31,658 3,318 10 .51994 . . . . . . . . . . . . . . 70,020 15,289 21 .8 68,819 14,610 21 .2 160,329 19,107 11 .9 31,267 3,663 11 .71993 . . . . . . . . . . . . . . 69,292 15,727 22 .7 68,040 14,961 22 .0 159,208 19,781 12 .4 30,779 3,755 12 .219925 . . . . . . . . . . . . . 68,440 15,294 22 .3 67,256 14,521 21 .6 157,680 18,793 11 .9 30,430 3,928 12 .9
19916 . . . . . . . . . . . . . 65,918 14,341 21 .8 64,800 13,658 21 .1 154,684 17,586 11 .4 30,590 3,781 12 .41990 . . . . . . . . . . . . . . 65,049 13,431 20 .6 63,908 12,715 19 .9 153,502 16,496 10 .7 30,093 3,658 12 .21989 . . . . . . . . . . . . . . 64,144 12,590 19 .6 63,225 12,001 19 .0 152,282 15,575 10 .2 29,566 3,363 11 .419887 . . . . . . . . . . . . . 63,747 12,455 19 .5 62,906 11,935 19 .0 150,761 15,809 10 .5 29,022 3,481 12 .019877 . . . . . . . . . . . . . 63,294 12,843 20 .3 62,423 12,275 19 .7 149,201 15,815 10 .6 28,487 3,563 12 .5
1986 . . . . . . . . . . . . . . 62,948 12,876 20 .5 62,009 12,257 19 .8 147,631 16,017 10 .8 27,975 3,477 12 .41985 . . . . . . . . . . . . . . 62,876 13,010 20 .7 62,019 12,483 20 .1 146,396 16,598 11 .3 27,322 3,456 12 .61984 . . . . . . . . . . . . . . 62,447 13,420 21 .5 61,681 12,929 21 .0 144,551 16,952 11 .7 26,818 3,330 12 .41983 . . . . . . . . . . . . . . 62,334 13,911 22 .3 61,578 13,427 21 .8 143,052 17,767 12 .4 26,313 3,625 13 .81982 . . . . . . . . . . . . . . 62,345 13,647 21 .9 61,565 13,139 21 .3 141,328 17,000 12 .0 25,738 3,751 14 .6
1981 . . . . . . . . . . . . . . 62,449 12,505 20 .0 61,756 12,068 19 .5 139,477 15,464 11 .1 25,231 3,853 15 .31980 . . . . . . . . . . . . . . 62,914 11,543 18 .3 62,168 11,114 17 .9 137,428 13,858 10 .1 24,686 3,871 15 .71979 . . . . . . . . . . . . . . 63,375 10,377 16 .4 62,646 9,993 16 .0 135,333 12,014 8 .9 24,194 3,682 15 .21978 . . . . . . . . . . . . . . 62,311 9,931 15 .9 61,987 9,722 15 .7 130,169 11,332 8 .7 23,175 3,233 14 .01977 . . . . . . . . . . . . . . 63,137 10,288 16 .2 62,823 10,028 16 .0 128,262 11,316 8 .8 22,468 3,177 14 .1
1976 . . . . . . . . . . . . . . 64,028 10,273 16 .0 63,729 10,081 15 .8 126,175 11,389 9 .0 22,100 3,313 15 .01975 . . . . . . . . . . . . . . 65,079 11,104 17 .1 64,750 10,882 16 .8 124,122 11,456 9 .2 21,662 3,317 15 .31974 . . . . . . . . . . . . . . 66,134 10,156 15 .4 65,802 9,967 15 .1 122,101 10,132 8 .3 21,127 3,085 14 .61973 . . . . . . . . . . . . . . 66,959 9,642 14 .4 66,626 9,453 14 .2 120,060 9,977 8 .3 20,602 3,354 16 .31972 . . . . . . . . . . . . . . 67,930 10,284 15 .1 67,592 10,082 14 .9 117,957 10,438 8 .8 20,117 3,738 18 .6
1971 . . . . . . . . . . . . . . 68,816 10,551 15 .3 68,474 10,344 15 .1 115,911 10,735 9 .3 19,827 4,273 21 .61970 . . . . . . . . . . . . . . 69,159 10,440 15 .1 68,815 10,235 14 .9 113,554 10,187 9 .0 19,470 4,793 24 .61969 . . . . . . . . . . . . . . 69,090 9,691 14 .0 68,746 9,501 13 .8 111,528 9,669 8 .7 18,899 4,787 25 .31968 . . . . . . . . . . . . . . 70,385 10,954 15 .6 70,035 10,739 15 .3 108,684 9,803 9 .0 18,559 4,632 25 .01967 . . . . . . . . . . . . . . 70,408 11,656 16 .6 70,058 11,427 16 .3 107,024 10,725 10 .0 18,240 5,388 29 .5
1966 . . . . . . . . . . . . . . 70,218 12,389 17 .6 69,869 12,146 17 .4 105,241 11,007 10 .5 17,929 5,114 28 .51965 . . . . . . . . . . . . . . 69,986 14,676 21 .0 69,638 14,388 20 .7 (NA) (NA) (NA) (NA) (NA) (NA)1964 . . . . . . . . . . . . . . 69,711 16,051 23 .0 69,364 15,736 22 .7 (NA) (NA) (NA) (NA) (NA) (NA)1963 . . . . . . . . . . . . . . 69,181 16,005 23 .1 68,837 15,691 22 .8 (NA) (NA) (NA) (NA) (NA) (NA)1962 . . . . . . . . . . . . . . 67,722 16,963 25 .0 67,385 16,630 24 .7 (NA) (NA) (NA) (NA) (NA) (NA)1961 . . . . . . . . . . . . . . 66,121 16,909 25 .6 65,792 16,577 25 .2 (NA) (NA) (NA) (NA) (NA) (NA)1960 . . . . . . . . . . . . . . 65,601 17,634 26 .9 65,275 17,288 26 .5 (NA) (NA) (NA) (NA) (NA) (NA)1959 . . . . . . . . . . . . . . 64,315 17,552 27 .3 63,995 17,208 26 .9 96,685 16,457 17 .0 15,557 5,481 35 .2
Table B-2.Poverty Status of People by Age, Race, and Hispanic origin: 1959 to 2012(Numbers in thousands . People as of March of the following year . For information on confidentiality protection, sampling error, nonsampling error, and definitions, see www.census.gov/prod/techdoc/cps/cpsmar13.pdf)
See footnotes at end of table .
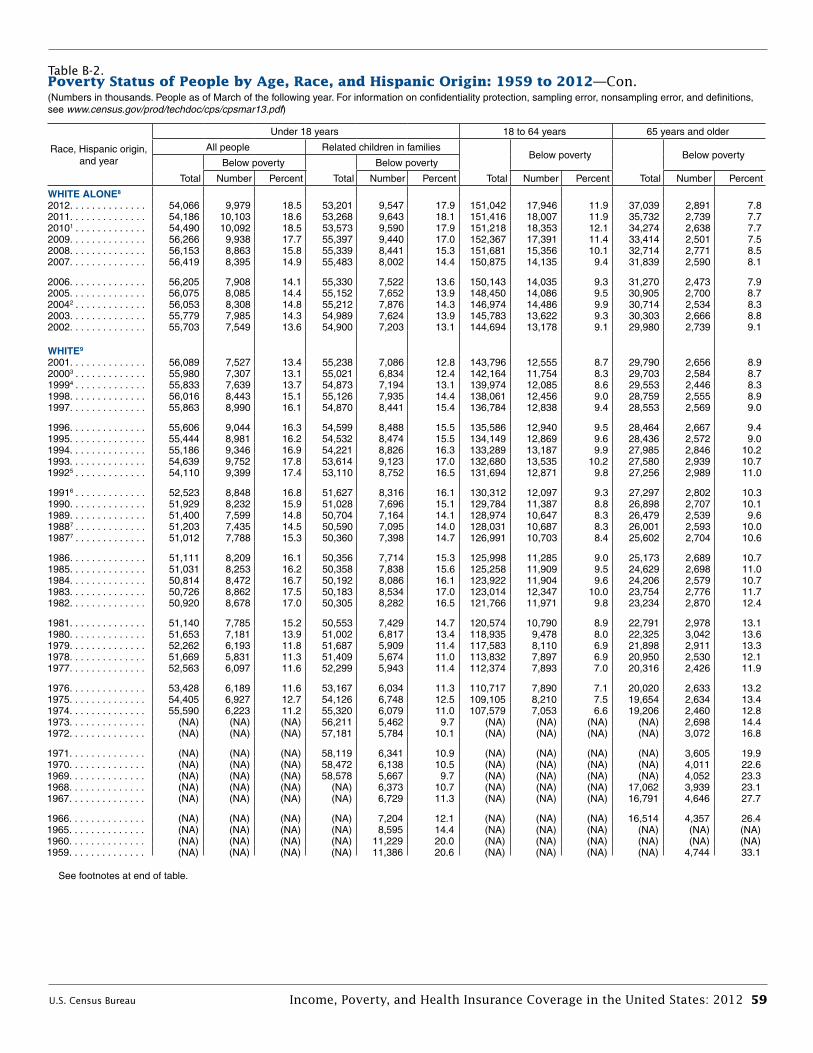
U.S. Census Bureau Income, Poverty, and Health Insurance Coverage in the United States: 2012 59
Race, Hispanic origin, and year
Under 18 years 18 to 64 years 65 years and older
All people Related children in families
Total
Below poverty
Total
Below poverty
Total
Below poverty
Total
Below poverty
Number Percent Number Percent Number Percent Number Percent
WHITE ALONE8
2012 . . . . . . . . . . . . . . 54,066 9,979 18 .5 53,201 9,547 17 .9 151,042 17,946 11 .9 37,039 2,891 7 .82011 . . . . . . . . . . . . . . 54,186 10,103 18 .6 53,268 9,643 18 .1 151,416 18,007 11 .9 35,732 2,739 7 .720101 . . . . . . . . . . . . . 54,490 10,092 18 .5 53,573 9,590 17 .9 151,218 18,353 12 .1 34,274 2,638 7 .72009 . . . . . . . . . . . . . . 56,266 9,938 17 .7 55,397 9,440 17 .0 152,367 17,391 11 .4 33,414 2,501 7 .52008 . . . . . . . . . . . . . . 56,153 8,863 15 .8 55,339 8,441 15 .3 151,681 15,356 10 .1 32,714 2,771 8 .52007 . . . . . . . . . . . . . . 56,419 8,395 14 .9 55,483 8,002 14 .4 150,875 14,135 9 .4 31,839 2,590 8 .1
2006 . . . . . . . . . . . . . . 56,205 7,908 14 .1 55,330 7,522 13 .6 150,143 14,035 9 .3 31,270 2,473 7 .92005 . . . . . . . . . . . . . . 56,075 8,085 14 .4 55,152 7,652 13 .9 148,450 14,086 9 .5 30,905 2,700 8 .720042 . . . . . . . . . . . . . 56,053 8,308 14 .8 55,212 7,876 14 .3 146,974 14,486 9 .9 30,714 2,534 8 .32003 . . . . . . . . . . . . . . 55,779 7,985 14 .3 54,989 7,624 13 .9 145,783 13,622 9 .3 30,303 2,666 8 .82002 . . . . . . . . . . . . . . 55,703 7,549 13 .6 54,900 7,203 13 .1 144,694 13,178 9 .1 29,980 2,739 9 .1
WHITE9
2001 . . . . . . . . . . . . . . 56,089 7,527 13 .4 55,238 7,086 12 .8 143,796 12,555 8 .7 29,790 2,656 8 .920003 . . . . . . . . . . . . . 55,980 7,307 13 .1 55,021 6,834 12 .4 142,164 11,754 8 .3 29,703 2,584 8 .719994 . . . . . . . . . . . . . 55,833 7,639 13 .7 54,873 7,194 13 .1 139,974 12,085 8 .6 29,553 2,446 8 .31998 . . . . . . . . . . . . . . 56,016 8,443 15 .1 55,126 7,935 14 .4 138,061 12,456 9 .0 28,759 2,555 8 .91997 . . . . . . . . . . . . . . 55,863 8,990 16 .1 54,870 8,441 15 .4 136,784 12,838 9 .4 28,553 2,569 9 .0
1996 . . . . . . . . . . . . . . 55,606 9,044 16 .3 54,599 8,488 15 .5 135,586 12,940 9 .5 28,464 2,667 9 .41995 . . . . . . . . . . . . . . 55,444 8,981 16 .2 54,532 8,474 15 .5 134,149 12,869 9 .6 28,436 2,572 9 .01994 . . . . . . . . . . . . . . 55,186 9,346 16 .9 54,221 8,826 16 .3 133,289 13,187 9 .9 27,985 2,846 10 .21993 . . . . . . . . . . . . . . 54,639 9,752 17 .8 53,614 9,123 17 .0 132,680 13,535 10 .2 27,580 2,939 10 .719925 . . . . . . . . . . . . . 54,110 9,399 17 .4 53,110 8,752 16 .5 131,694 12,871 9 .8 27,256 2,989 11 .0
19916 . . . . . . . . . . . . . 52,523 8,848 16 .8 51,627 8,316 16 .1 130,312 12,097 9 .3 27,297 2,802 10 .31990 . . . . . . . . . . . . . . 51,929 8,232 15 .9 51,028 7,696 15 .1 129,784 11,387 8 .8 26,898 2,707 10 .11989 . . . . . . . . . . . . . . 51,400 7,599 14 .8 50,704 7,164 14 .1 128,974 10,647 8 .3 26,479 2,539 9 .619887 . . . . . . . . . . . . . 51,203 7,435 14 .5 50,590 7,095 14 .0 128,031 10,687 8 .3 26,001 2,593 10 .019877 . . . . . . . . . . . . . 51,012 7,788 15 .3 50,360 7,398 14 .7 126,991 10,703 8 .4 25,602 2,704 10 .6
1986 . . . . . . . . . . . . . . 51,111 8,209 16 .1 50,356 7,714 15 .3 125,998 11,285 9 .0 25,173 2,689 10 .71985 . . . . . . . . . . . . . . 51,031 8,253 16 .2 50,358 7,838 15 .6 125,258 11,909 9 .5 24,629 2,698 11 .01984 . . . . . . . . . . . . . . 50,814 8,472 16 .7 50,192 8,086 16 .1 123,922 11,904 9 .6 24,206 2,579 10 .71983 . . . . . . . . . . . . . . 50,726 8,862 17 .5 50,183 8,534 17 .0 123,014 12,347 10 .0 23,754 2,776 11 .71982 . . . . . . . . . . . . . . 50,920 8,678 17 .0 50,305 8,282 16 .5 121,766 11,971 9 .8 23,234 2,870 12 .4
1981 . . . . . . . . . . . . . . 51,140 7,785 15 .2 50,553 7,429 14 .7 120,574 10,790 8 .9 22,791 2,978 13 .11980 . . . . . . . . . . . . . . 51,653 7,181 13 .9 51,002 6,817 13 .4 118,935 9,478 8 .0 22,325 3,042 13 .61979 . . . . . . . . . . . . . . 52,262 6,193 11 .8 51,687 5,909 11 .4 117,583 8,110 6 .9 21,898 2,911 13 .31978 . . . . . . . . . . . . . . 51,669 5,831 11 .3 51,409 5,674 11 .0 113,832 7,897 6 .9 20,950 2,530 12 .11977 . . . . . . . . . . . . . . 52,563 6,097 11 .6 52,299 5,943 11 .4 112,374 7,893 7 .0 20,316 2,426 11 .9
1976 . . . . . . . . . . . . . . 53,428 6,189 11 .6 53,167 6,034 11 .3 110,717 7,890 7 .1 20,020 2,633 13 .21975 . . . . . . . . . . . . . . 54,405 6,927 12 .7 54,126 6,748 12 .5 109,105 8,210 7 .5 19,654 2,634 13 .41974 . . . . . . . . . . . . . . 55,590 6,223 11 .2 55,320 6,079 11 .0 107,579 7,053 6 .6 19,206 2,460 12 .81973 . . . . . . . . . . . . . . (NA) (NA) (NA) 56,211 5,462 9 .7 (NA) (NA) (NA) (NA) 2,698 14 .41972 . . . . . . . . . . . . . . (NA) (NA) (NA) 57,181 5,784 10 .1 (NA) (NA) (NA) (NA) 3,072 16 .8
1971 . . . . . . . . . . . . . . (NA) (NA) (NA) 58,119 6,341 10 .9 (NA) (NA) (NA) (NA) 3,605 19 .91970 . . . . . . . . . . . . . . (NA) (NA) (NA) 58,472 6,138 10 .5 (NA) (NA) (NA) (NA) 4,011 22 .61969 . . . . . . . . . . . . . . (NA) (NA) (NA) 58,578 5,667 9 .7 (NA) (NA) (NA) (NA) 4,052 23 .31968 . . . . . . . . . . . . . . (NA) (NA) (NA) (NA) 6,373 10 .7 (NA) (NA) (NA) 17,062 3,939 23 .11967 . . . . . . . . . . . . . . (NA) (NA) (NA) (NA) 6,729 11 .3 (NA) (NA) (NA) 16,791 4,646 27 .7
1966 . . . . . . . . . . . . . . (NA) (NA) (NA) (NA) 7,204 12 .1 (NA) (NA) (NA) 16,514 4,357 26 .41965 . . . . . . . . . . . . . . (NA) (NA) (NA) (NA) 8,595 14 .4 (NA) (NA) (NA) (NA) (NA) (NA)1960 . . . . . . . . . . . . . . (NA) (NA) (NA) (NA) 11,229 20 .0 (NA) (NA) (NA) (NA) (NA) (NA)1959 . . . . . . . . . . . . . . (NA) (NA) (NA) (NA) 11,386 20 .6 (NA) (NA) (NA) (NA) 4,744 33 .1
Table B-2.Poverty Status of People by Age, Race, and Hispanic origin: 1959 to 2012—Con .(Numbers in thousands . People as of March of the following year . For information on confidentiality protection, sampling error, nonsampling error, and definitions, see www.census.gov/prod/techdoc/cps/cpsmar13.pdf)
See footnotes at end of table .

60 Income, Poverty, and Health Insurance Coverage in the United States: 2012 U.S. Census Bureau
Race, Hispanic origin, and year
Under 18 years 18 to 64 years 65 years and older
All people Related children in families
Total
Below poverty
Total
Below poverty
Total
Below poverty
Total
Below poverty
Number Percent Number Percent Number Percent Number Percent
WHITE ALONE, NOT HISPANIC8
2012 . . . . . . . . . . . . . . 38,759 4,782 12 .3 38,167 4,510 11 .8 122,221 11,833 9 .7 34,131 2,324 6 .82011 . . . . . . . . . . . . . . 38,955 4,850 12 .5 38,322 4,554 11 .9 123,101 12,112 9 .8 32,904 2,210 6 .720101 . . . . . . . . . . . . . 39,437 4,866 12 .3 38,823 4,544 11 .7 123,731 12,230 9 .9 31,616 2,155 6 .82009 . . . . . . . . . . . . . . 40,917 4,850 11 .9 40,319 4,518 11 .2 125,511 11,658 9 .3 30,736 2,022 6 .62008 . . . . . . . . . . . . . . 41,309 4,364 10 .6 40,707 4,059 10 .0 125,482 10,380 8 .3 30,149 2,280 7 .62007 . . . . . . . . . . . . . . 41,979 4,255 10 .1 41,304 3,996 9 .7 125,161 9,598 7 .7 29,442 2,179 7 .4
2006 . . . . . . . . . . . . . . 42,212 4,208 10 .0 41,563 3,930 9 .5 124,847 9,761 7 .8 28,990 2,044 7 .02005 . . . . . . . . . . . . . . 42,523 4,254 10 .0 41,867 3,973 9 .5 124,326 9,708 7 .8 28,704 2,264 7 .920042 . . . . . . . . . . . . . 42,978 4,519 10 .5 42,363 4,190 9 .9 123,481 10,236 8 .3 28,639 2,153 7 .52003 . . . . . . . . . . . . . . 43,150 4,233 9 .8 42,547 3,957 9 .3 123,110 9,391 7 .6 28,335 2,277 8 .02002 . . . . . . . . . . . . . . 43,614 4,090 9 .4 43,017 3,848 8 .9 122,511 9,157 7 .5 28,018 2,321 8 .3
WHITE, NOT HISPANIC9
2001 . . . . . . . . . . . . . . 44,095 4,194 9 .5 43,459 3,887 8 .9 122,470 8,811 7 .2 27,973 2,266 8 .120003 . . . . . . . . . . . . . 44,244 4,018 9 .1 43,554 3,715 8 .5 121,499 8,130 6 .7 27,948 2,218 7 .919994 . . . . . . . . . . . . . 44,272 4,155 9 .4 43,570 3,832 8 .8 120,341 8,462 7 .0 27,952 2,118 7 .61998 . . . . . . . . . . . . . . 45,355 4,822 10 .6 44,670 4,458 10 .0 120,282 8,760 7 .3 27,118 2,217 8 .21997 . . . . . . . . . . . . . . 45,491 5,204 11 .4 44,665 4,759 10 .7 119,373 9,088 7 .6 26,995 2,200 8 .1
1996 . . . . . . . . . . . . . . 45,605 5,072 11 .1 44,844 4,656 10 .4 118,822 9,074 7 .6 27,033 2,316 8 .61995 . . . . . . . . . . . . . . 45,689 5,115 11 .2 44,973 4,745 10 .6 118,228 8,908 7 .5 27,034 2,243 8 .31994 . . . . . . . . . . . . . . 46,668 5,823 12 .5 45,874 5,404 11 .8 119,192 9,732 8 .2 26,684 2,556 9 .61993 . . . . . . . . . . . . . . 46,096 6,255 13 .6 45,322 5,819 12 .8 118,475 9,964 8 .4 26,272 2,663 10 .119925 . . . . . . . . . . . . . 45,590 6,017 13 .2 44,833 5,558 12 .4 117,386 9,461 8 .1 26,025 2,724 10 .5
19916 . . . . . . . . . . . . . 45,236 5,918 13 .1 44,506 5,497 12 .4 117,672 9,244 7 .9 26,208 2,580 9 .81990 . . . . . . . . . . . . . . 44,797 5,532 12 .3 44,045 5,106 11 .6 117,477 8,619 7 .3 25,854 2,471 9 .61989 . . . . . . . . . . . . . . 44,492 5,110 11 .5 43,938 4,779 10 .9 116,983 8,154 7 .0 25,504 2,335 9 .219887 . . . . . . . . . . . . . 44,438 4,888 11 .0 43,910 4,594 10 .5 116,479 8,293 7 .1 25,044 2,384 9 .519877 . . . . . . . . . . . . . 44,461 5,230 11 .8 43,907 4,902 11 .2 115,721 8,327 7 .2 24,754 2,472 10 .0
1986 . . . . . . . . . . . . . . 44,664 5,789 13 .0 44,041 5,388 12 .2 115,157 8,963 7 .8 24,298 2,492 10 .31985 . . . . . . . . . . . . . . 44,752 5,745 12 .8 44,199 5,421 12 .3 114,969 9,608 8 .4 23,734 2,486 10 .51984 . . . . . . . . . . . . . . 44,886 6,156 13 .7 44,349 5,828 13 .1 114,180 9,734 8 .5 23,402 2,410 10 .31983 . . . . . . . . . . . . . . 44,830 6,649 14 .8 44,374 6,381 14 .4 113,570 10,279 9 .1 22,992 2,610 11 .41982 . . . . . . . . . . . . . . 45,531 6,566 14 .4 45,001 6,229 13 .8 113,717 10,082 8 .9 22,655 2,714 12 .0
1981 . . . . . . . . . . . . . . 45,950 5,946 12 .9 45,440 5,639 12 .4 112,722 9,207 8 .2 22,237 2,834 12 .71980 . . . . . . . . . . . . . . 46,578 5,510 11 .8 45,989 5,174 11 .3 111,460 7,990 7 .2 21,760 2,865 13 .21979 . . . . . . . . . . . . . . 46,967 4,730 10 .1 46,448 4,476 9 .6 110,509 6,930 6 .3 21,339 2,759 12 .91978 . . . . . . . . . . . . . . 46,819 4,506 9 .6 46,606 4,383 9 .4 107,481 6,837 6 .4 20,431 2,412 11 .8
1977 . . . . . . . . . . . . . . 47,689 4,714 9 .9 47,459 4,582 9 .7 106,063 6,772 6 .4 19,812 2,316 11 .71976 . . . . . . . . . . . . . . 48,824 4,799 9 .8 48,601 4,664 9 .6 104,846 6,720 6 .4 19,565 2,506 12 .81975 . . . . . . . . . . . . . . 49,670 5,342 10 .8 49,421 5,185 10 .5 103,496 7,039 6 .8 19,251 2,503 13 .01974 . . . . . . . . . . . . . . 50,759 4,820 9 .5 50,520 4,697 9 .3 101,894 6,051 5 .9 18,810 2,346 12 .5
BLACK ALONE OR IN COMBINATION2012 . . . . . . . . . . . . . . 13,108 4,815 36 .7 12,908 4,675 36 .2 26,482 6,265 23 .7 3,993 730 18 .32011 . . . . . . . . . . . . . . 12,968 4,849 37 .4 12,815 4,762 37 .2 25,962 6,241 24 .0 3,718 640 17 .220101 . . . . . . . . . . . . . 13,015 4,923 37 .8 12,759 4,814 37 .7 25,815 6,031 23 .4 3,555 643 18 .12009 . . . . . . . . . . . . . . 12,655 4,480 35 .4 12,445 4,349 34 .9 24,815 5,441 21 .9 3,405 655 19 .22008 . . . . . . . . . . . . . . 12,388 4,202 33 .9 12,201 4,104 33 .6 24,404 5,017 20 .6 3,305 663 20 .02007 . . . . . . . . . . . . . . 12,380 4,178 33 .7 12,227 4,106 33 .6 23,968 4,742 19 .8 3,215 748 23 .32006 . . . . . . . . . . . . . . 12,375 4,086 33 .0 12,206 3,977 32 .6 23,510 4,652 19 .8 3,128 710 22 .7
2005 . . . . . . . . . . . . . . 12,159 4,074 33 .5 11,975 3,972 33 .2 23,338 4,735 20 .3 3,053 708 23 .220042 . . . . . . . . . . . . . 12,190 4,059 33 .3 12,012 3,962 33 .0 22,842 4,638 20 .3 3,005 714 23 .82003 . . . . . . . . . . . . . . 12,215 4,108 33 .6 11,989 3,977 33 .2 22,355 4,313 19 .3 2,933 688 23 .52002 . . . . . . . . . . . . . . 12,114 3,817 31 .5 11,931 3,733 31 .3 22,170 4,376 19 .7 2,922 691 23 .6
Table B-2.Poverty Status of People by Age, Race, and Hispanic origin: 1959 to 2012—Con .(Numbers in thousands . People as of March of the following year . For information on confidentiality protection, sampling error, nonsampling error, and definitions, see www.census.gov/prod/techdoc/cps/cpsmar13.pdf)
See footnotes at end of table .
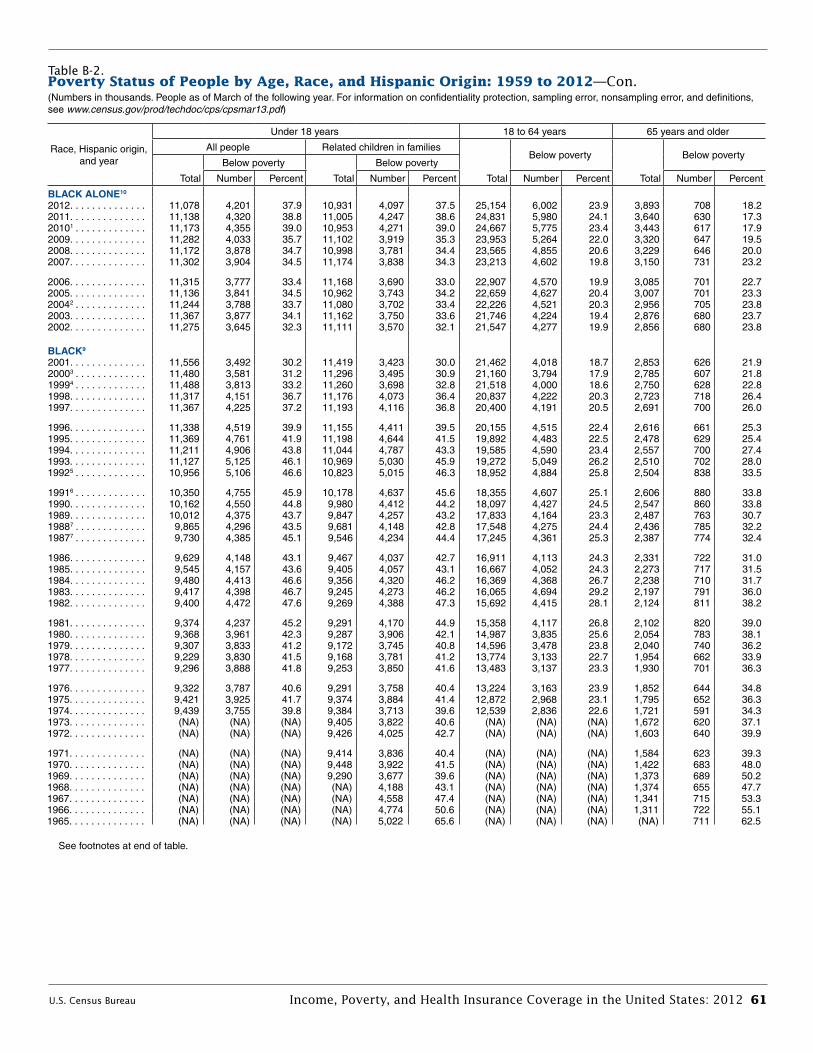
U.S. Census Bureau Income, Poverty, and Health Insurance Coverage in the United States: 2012 61
Race, Hispanic origin, and year
Under 18 years 18 to 64 years 65 years and older
All people Related children in families
Total
Below poverty
Total
Below poverty
Total
Below poverty
Total
Below poverty
Number Percent Number Percent Number Percent Number Percent
BLACK ALONE10
2012 . . . . . . . . . . . . . . 11,078 4,201 37 .9 10,931 4,097 37 .5 25,154 6,002 23 .9 3,893 708 18 .22011 . . . . . . . . . . . . . . 11,138 4,320 38 .8 11,005 4,247 38 .6 24,831 5,980 24 .1 3,640 630 17 .320101 . . . . . . . . . . . . . 11,173 4,355 39 .0 10,953 4,271 39 .0 24,667 5,775 23 .4 3,443 617 17 .92009 . . . . . . . . . . . . . . 11,282 4,033 35 .7 11,102 3,919 35 .3 23,953 5,264 22 .0 3,320 647 19 .52008 . . . . . . . . . . . . . . 11,172 3,878 34 .7 10,998 3,781 34 .4 23,565 4,855 20 .6 3,229 646 20 .02007 . . . . . . . . . . . . . . 11,302 3,904 34 .5 11,174 3,838 34 .3 23,213 4,602 19 .8 3,150 731 23 .2
2006 . . . . . . . . . . . . . . 11,315 3,777 33 .4 11,168 3,690 33 .0 22,907 4,570 19 .9 3,085 701 22 .72005 . . . . . . . . . . . . . . 11,136 3,841 34 .5 10,962 3,743 34 .2 22,659 4,627 20 .4 3,007 701 23 .320042 . . . . . . . . . . . . . 11,244 3,788 33 .7 11,080 3,702 33 .4 22,226 4,521 20 .3 2,956 705 23 .82003 . . . . . . . . . . . . . . 11,367 3,877 34 .1 11,162 3,750 33 .6 21,746 4,224 19 .4 2,876 680 23 .72002 . . . . . . . . . . . . . . 11,275 3,645 32 .3 11,111 3,570 32 .1 21,547 4,277 19 .9 2,856 680 23 .8
BLACK9
2001 . . . . . . . . . . . . . . 11,556 3,492 30 .2 11,419 3,423 30 .0 21,462 4,018 18 .7 2,853 626 21 .920003 . . . . . . . . . . . . . 11,480 3,581 31 .2 11,296 3,495 30 .9 21,160 3,794 17 .9 2,785 607 21 .819994 . . . . . . . . . . . . . 11,488 3,813 33 .2 11,260 3,698 32 .8 21,518 4,000 18 .6 2,750 628 22 .81998 . . . . . . . . . . . . . . 11,317 4,151 36 .7 11,176 4,073 36 .4 20,837 4,222 20 .3 2,723 718 26 .41997 . . . . . . . . . . . . . . 11,367 4,225 37 .2 11,193 4,116 36 .8 20,400 4,191 20 .5 2,691 700 26 .0
1996 . . . . . . . . . . . . . . 11,338 4,519 39 .9 11,155 4,411 39 .5 20,155 4,515 22 .4 2,616 661 25 .31995 . . . . . . . . . . . . . . 11,369 4,761 41 .9 11,198 4,644 41 .5 19,892 4,483 22 .5 2,478 629 25 .41994 . . . . . . . . . . . . . . 11,211 4,906 43 .8 11,044 4,787 43 .3 19,585 4,590 23 .4 2,557 700 27 .41993 . . . . . . . . . . . . . . 11,127 5,125 46 .1 10,969 5,030 45 .9 19,272 5,049 26 .2 2,510 702 28 .019925 . . . . . . . . . . . . . 10,956 5,106 46 .6 10,823 5,015 46 .3 18,952 4,884 25 .8 2,504 838 33 .5
19916 . . . . . . . . . . . . . 10,350 4,755 45 .9 10,178 4,637 45 .6 18,355 4,607 25 .1 2,606 880 33 .81990 . . . . . . . . . . . . . . 10,162 4,550 44 .8 9,980 4,412 44 .2 18,097 4,427 24 .5 2,547 860 33 .81989 . . . . . . . . . . . . . . 10,012 4,375 43 .7 9,847 4,257 43 .2 17,833 4,164 23 .3 2,487 763 30 .719887 . . . . . . . . . . . . . 9,865 4,296 43 .5 9,681 4,148 42 .8 17,548 4,275 24 .4 2,436 785 32 .219877 . . . . . . . . . . . . . 9,730 4,385 45 .1 9,546 4,234 44 .4 17,245 4,361 25 .3 2,387 774 32 .4
1986 . . . . . . . . . . . . . . 9,629 4,148 43 .1 9,467 4,037 42 .7 16,911 4,113 24 .3 2,331 722 31 .01985 . . . . . . . . . . . . . . 9,545 4,157 43 .6 9,405 4,057 43 .1 16,667 4,052 24 .3 2,273 717 31 .51984 . . . . . . . . . . . . . . 9,480 4,413 46 .6 9,356 4,320 46 .2 16,369 4,368 26 .7 2,238 710 31 .71983 . . . . . . . . . . . . . . 9,417 4,398 46 .7 9,245 4,273 46 .2 16,065 4,694 29 .2 2,197 791 36 .01982 . . . . . . . . . . . . . . 9,400 4,472 47 .6 9,269 4,388 47 .3 15,692 4,415 28 .1 2,124 811 38 .2
1981 . . . . . . . . . . . . . . 9,374 4,237 45 .2 9,291 4,170 44 .9 15,358 4,117 26 .8 2,102 820 39 .01980 . . . . . . . . . . . . . . 9,368 3,961 42 .3 9,287 3,906 42 .1 14,987 3,835 25 .6 2,054 783 38 .11979 . . . . . . . . . . . . . . 9,307 3,833 41 .2 9,172 3,745 40 .8 14,596 3,478 23 .8 2,040 740 36 .21978 . . . . . . . . . . . . . . 9,229 3,830 41 .5 9,168 3,781 41 .2 13,774 3,133 22 .7 1,954 662 33 .91977 . . . . . . . . . . . . . . 9,296 3,888 41 .8 9,253 3,850 41 .6 13,483 3,137 23 .3 1,930 701 36 .3
1976 . . . . . . . . . . . . . . 9,322 3,787 40 .6 9,291 3,758 40 .4 13,224 3,163 23 .9 1,852 644 34 .81975 . . . . . . . . . . . . . . 9,421 3,925 41 .7 9,374 3,884 41 .4 12,872 2,968 23 .1 1,795 652 36 .31974 . . . . . . . . . . . . . . 9,439 3,755 39 .8 9,384 3,713 39 .6 12,539 2,836 22 .6 1,721 591 34 .31973 . . . . . . . . . . . . . . (NA) (NA) (NA) 9,405 3,822 40 .6 (NA) (NA) (NA) 1,672 620 37 .11972 . . . . . . . . . . . . . . (NA) (NA) (NA) 9,426 4,025 42 .7 (NA) (NA) (NA) 1,603 640 39 .9
1971 . . . . . . . . . . . . . . (NA) (NA) (NA) 9,414 3,836 40 .4 (NA) (NA) (NA) 1,584 623 39 .31970 . . . . . . . . . . . . . . (NA) (NA) (NA) 9,448 3,922 41 .5 (NA) (NA) (NA) 1,422 683 48 .01969 . . . . . . . . . . . . . . (NA) (NA) (NA) 9,290 3,677 39 .6 (NA) (NA) (NA) 1,373 689 50 .21968 . . . . . . . . . . . . . . (NA) (NA) (NA) (NA) 4,188 43 .1 (NA) (NA) (NA) 1,374 655 47 .71967 . . . . . . . . . . . . . . (NA) (NA) (NA) (NA) 4,558 47 .4 (NA) (NA) (NA) 1,341 715 53 .31966 . . . . . . . . . . . . . . (NA) (NA) (NA) (NA) 4,774 50 .6 (NA) (NA) (NA) 1,311 722 55 .11965 . . . . . . . . . . . . . . (NA) (NA) (NA) (NA) 5,022 65 .6 (NA) (NA) (NA) (NA) 711 62 .5
Table B-2.Poverty Status of People by Age, Race, and Hispanic origin: 1959 to 2012—Con .(Numbers in thousands . People as of March of the following year . For information on confidentiality protection, sampling error, nonsampling error, and definitions, see www.census.gov/prod/techdoc/cps/cpsmar13.pdf)
See footnotes at end of table .
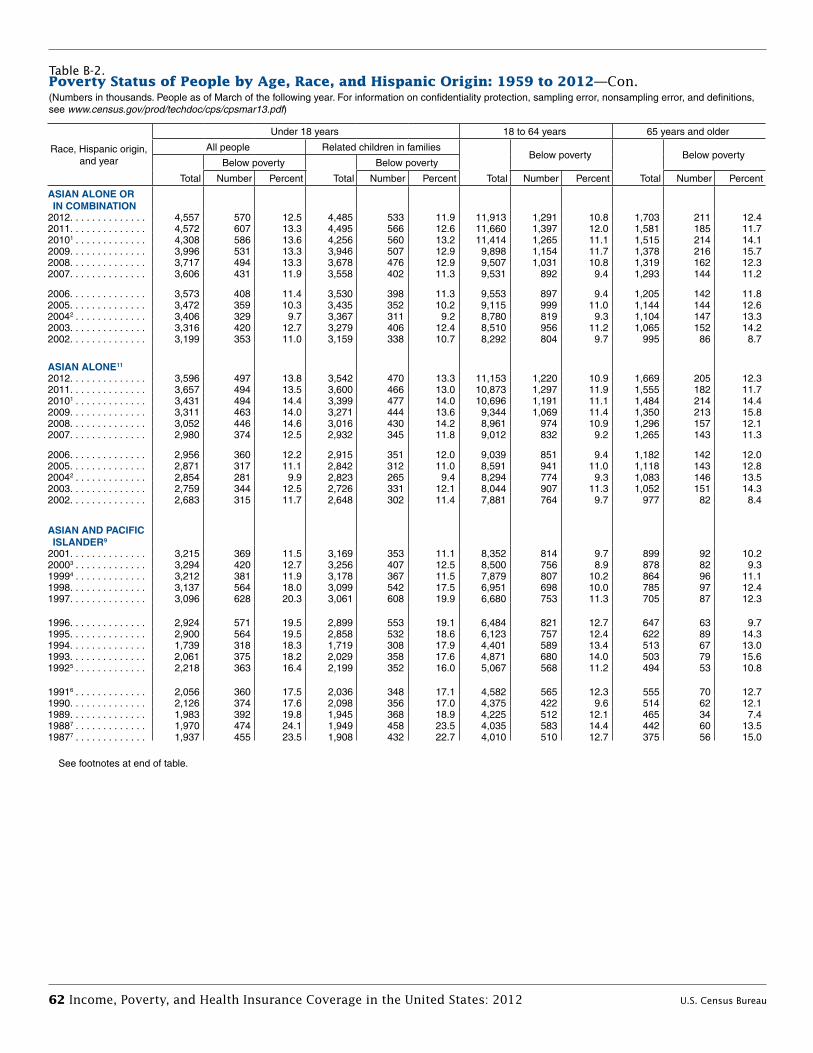
62 Income, Poverty, and Health Insurance Coverage in the United States: 2012 U.S. Census Bureau
Race, Hispanic origin, and year
Under 18 years 18 to 64 years 65 years and older
All people Related children in families
Total
Below poverty
Total
Below poverty
Total
Below poverty
Total
Below poverty
Number Percent Number Percent Number Percent Number Percent
ASIAN ALONE OR IN COMBINATION2012 . . . . . . . . . . . . . . 4,557 570 12 .5 4,485 533 11 .9 11,913 1,291 10 .8 1,703 211 12 .42011 . . . . . . . . . . . . . . 4,572 607 13 .3 4,495 566 12 .6 11,660 1,397 12 .0 1,581 185 11 .720101 . . . . . . . . . . . . . 4,308 586 13 .6 4,256 560 13 .2 11,414 1,265 11 .1 1,515 214 14 .12009 . . . . . . . . . . . . . . 3,996 531 13 .3 3,946 507 12 .9 9,898 1,154 11 .7 1,378 216 15 .72008 . . . . . . . . . . . . . . 3,717 494 13 .3 3,678 476 12 .9 9,507 1,031 10 .8 1,319 162 12 .32007 . . . . . . . . . . . . . . 3,606 431 11 .9 3,558 402 11 .3 9,531 892 9 .4 1,293 144 11 .2
2006 . . . . . . . . . . . . . . 3,573 408 11 .4 3,530 398 11 .3 9,553 897 9 .4 1,205 142 11 .82005 . . . . . . . . . . . . . . 3,472 359 10 .3 3,435 352 10 .2 9,115 999 11 .0 1,144 144 12 .620042 . . . . . . . . . . . . . 3,406 329 9 .7 3,367 311 9 .2 8,780 819 9 .3 1,104 147 13 .32003 . . . . . . . . . . . . . . 3,316 420 12 .7 3,279 406 12 .4 8,510 956 11 .2 1,065 152 14 .22002 . . . . . . . . . . . . . . 3,199 353 11 .0 3,159 338 10 .7 8,292 804 9 .7 995 86 8 .7
ASIAN ALONE11
2012 . . . . . . . . . . . . . . 3,596 497 13 .8 3,542 470 13 .3 11,153 1,220 10 .9 1,669 205 12 .32011 . . . . . . . . . . . . . . 3,657 494 13 .5 3,600 466 13 .0 10,873 1,297 11 .9 1,555 182 11 .720101 . . . . . . . . . . . . . 3,431 494 14 .4 3,399 477 14 .0 10,696 1,191 11 .1 1,484 214 14 .42009 . . . . . . . . . . . . . . 3,311 463 14 .0 3,271 444 13 .6 9,344 1,069 11 .4 1,350 213 15 .82008 . . . . . . . . . . . . . . 3,052 446 14 .6 3,016 430 14 .2 8,961 974 10 .9 1,296 157 12 .12007 . . . . . . . . . . . . . . 2,980 374 12 .5 2,932 345 11 .8 9,012 832 9 .2 1,265 143 11 .3
2006 . . . . . . . . . . . . . . 2,956 360 12 .2 2,915 351 12 .0 9,039 851 9 .4 1,182 142 12 .02005 . . . . . . . . . . . . . . 2,871 317 11 .1 2,842 312 11 .0 8,591 941 11 .0 1,118 143 12 .820042 . . . . . . . . . . . . . 2,854 281 9 .9 2,823 265 9 .4 8,294 774 9 .3 1,083 146 13 .52003 . . . . . . . . . . . . . . 2,759 344 12 .5 2,726 331 12 .1 8,044 907 11 .3 1,052 151 14 .32002 . . . . . . . . . . . . . . 2,683 315 11 .7 2,648 302 11 .4 7,881 764 9 .7 977 82 8 .4
ASIAN AND PACIFIC ISLANDER9
2001 . . . . . . . . . . . . . . 3,215 369 11 .5 3,169 353 11 .1 8,352 814 9 .7 899 92 10 .220003 . . . . . . . . . . . . . 3,294 420 12 .7 3,256 407 12 .5 8,500 756 8 .9 878 82 9 .319994 . . . . . . . . . . . . . 3,212 381 11 .9 3,178 367 11 .5 7,879 807 10 .2 864 96 11 .11998 . . . . . . . . . . . . . . 3,137 564 18 .0 3,099 542 17 .5 6,951 698 10 .0 785 97 12 .41997 . . . . . . . . . . . . . . 3,096 628 20 .3 3,061 608 19 .9 6,680 753 11 .3 705 87 12 .3
1996 . . . . . . . . . . . . . . 2,924 571 19 .5 2,899 553 19 .1 6,484 821 12 .7 647 63 9 .71995 . . . . . . . . . . . . . . 2,900 564 19 .5 2,858 532 18 .6 6,123 757 12 .4 622 89 14 .31994 . . . . . . . . . . . . . . 1,739 318 18 .3 1,719 308 17 .9 4,401 589 13 .4 513 67 13 .01993 . . . . . . . . . . . . . . 2,061 375 18 .2 2,029 358 17 .6 4,871 680 14 .0 503 79 15 .619925 . . . . . . . . . . . . . 2,218 363 16 .4 2,199 352 16 .0 5,067 568 11 .2 494 53 10 .8
19916 . . . . . . . . . . . . . 2,056 360 17 .5 2,036 348 17 .1 4,582 565 12 .3 555 70 12 .71990 . . . . . . . . . . . . . . 2,126 374 17 .6 2,098 356 17 .0 4,375 422 9 .6 514 62 12 .11989 . . . . . . . . . . . . . . 1,983 392 19 .8 1,945 368 18 .9 4,225 512 12 .1 465 34 7 .419887 . . . . . . . . . . . . . 1,970 474 24 .1 1,949 458 23 .5 4,035 583 14 .4 442 60 13 .519877 . . . . . . . . . . . . . 1,937 455 23 .5 1,908 432 22 .7 4,010 510 12 .7 375 56 15 .0
Table B-2.Poverty Status of People by Age, Race, and Hispanic origin: 1959 to 2012—Con .(Numbers in thousands . People as of March of the following year . For information on confidentiality protection, sampling error, nonsampling error, and definitions, see www.census.gov/prod/techdoc/cps/cpsmar13.pdf)
See footnotes at end of table .
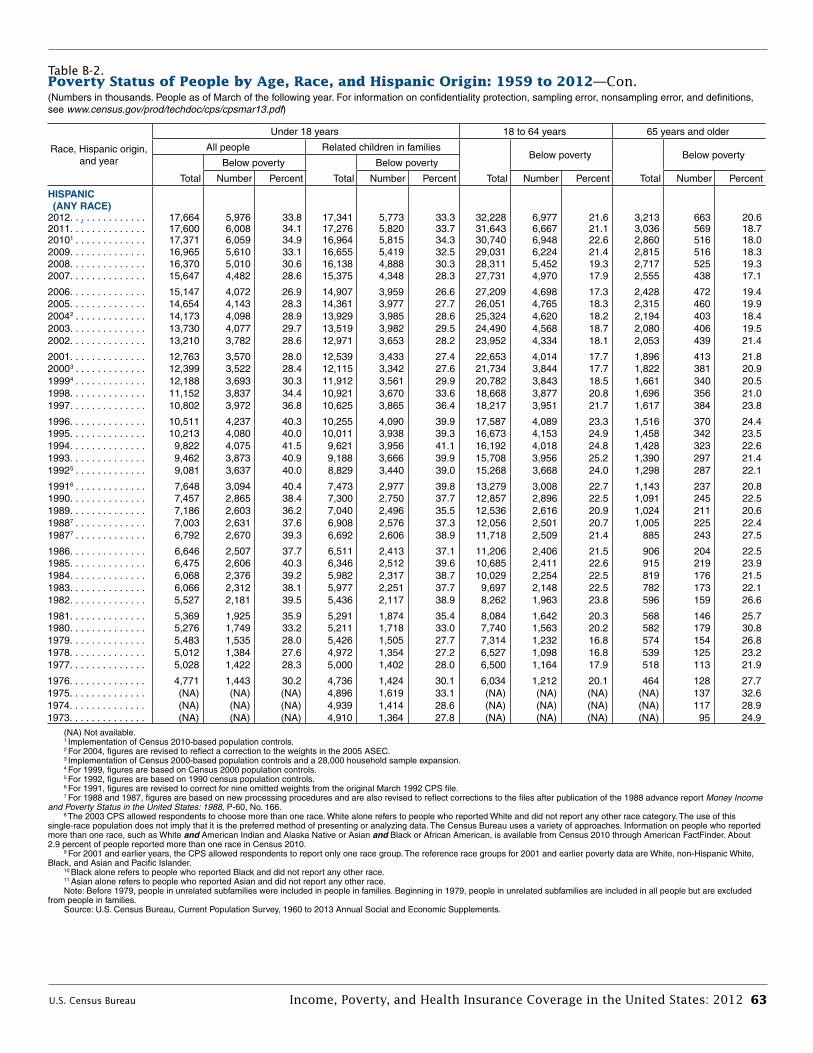
U.S. Census Bureau Income, Poverty, and Health Insurance Coverage in the United States: 2012 63
Race, Hispanic origin, and year
Under 18 years 18 to 64 years 65 years and older
All people Related children in families
Total
Below poverty
Total
Below poverty
Total
Below poverty
Total
Below poverty
Number Percent Number Percent Number Percent Number Percent
HISPANIC (ANY RACE)2012 . . . . . . . . . . . . . . 17,664 5,976 33 .8 17,341 5,773 33 .3 32,228 6,977 21 .6 3,213 663 20 .62011 . . . . . . . . . . . . . . 17,600 6,008 34 .1 17,276 5,820 33 .7 31,643 6,667 21 .1 3,036 569 18 .720101 . . . . . . . . . . . . . 17,371 6,059 34 .9 16,964 5,815 34 .3 30,740 6,948 22 .6 2,860 516 18 .02009 . . . . . . . . . . . . . . 16,965 5,610 33 .1 16,655 5,419 32 .5 29,031 6,224 21 .4 2,815 516 18 .32008 . . . . . . . . . . . . . . 16,370 5,010 30 .6 16,138 4,888 30 .3 28,311 5,452 19 .3 2,717 525 19 .32007 . . . . . . . . . . . . . . 15,647 4,482 28 .6 15,375 4,348 28 .3 27,731 4,970 17 .9 2,555 438 17 .1
2006 . . . . . . . . . . . . . . 15,147 4,072 26 .9 14,907 3,959 26 .6 27,209 4,698 17 .3 2,428 472 19 .42005 . . . . . . . . . . . . . . 14,654 4,143 28 .3 14,361 3,977 27 .7 26,051 4,765 18 .3 2,315 460 19 .920042 . . . . . . . . . . . . . 14,173 4,098 28 .9 13,929 3,985 28 .6 25,324 4,620 18 .2 2,194 403 18 .42003 . . . . . . . . . . . . . . 13,730 4,077 29 .7 13,519 3,982 29 .5 24,490 4,568 18 .7 2,080 406 19 .52002 . . . . . . . . . . . . . . 13,210 3,782 28 .6 12,971 3,653 28 .2 23,952 4,334 18 .1 2,053 439 21 .4
2001 . . . . . . . . . . . . . . 12,763 3,570 28 .0 12,539 3,433 27 .4 22,653 4,014 17 .7 1,896 413 21 .820003 . . . . . . . . . . . . . 12,399 3,522 28 .4 12,115 3,342 27 .6 21,734 3,844 17 .7 1,822 381 20 .919994 . . . . . . . . . . . . . 12,188 3,693 30 .3 11,912 3,561 29 .9 20,782 3,843 18 .5 1,661 340 20 .51998 . . . . . . . . . . . . . . 11,152 3,837 34 .4 10,921 3,670 33 .6 18,668 3,877 20 .8 1,696 356 21 .01997 . . . . . . . . . . . . . . 10,802 3,972 36 .8 10,625 3,865 36 .4 18,217 3,951 21 .7 1,617 384 23 .8
1996 . . . . . . . . . . . . . . 10,511 4,237 40 .3 10,255 4,090 39 .9 17,587 4,089 23 .3 1,516 370 24 .41995 . . . . . . . . . . . . . . 10,213 4,080 40 .0 10,011 3,938 39 .3 16,673 4,153 24 .9 1,458 342 23 .51994 . . . . . . . . . . . . . . 9,822 4,075 41 .5 9,621 3,956 41 .1 16,192 4,018 24 .8 1,428 323 22 .61993 . . . . . . . . . . . . . . 9,462 3,873 40 .9 9,188 3,666 39 .9 15,708 3,956 25 .2 1,390 297 21 .419925 . . . . . . . . . . . . . 9,081 3,637 40 .0 8,829 3,440 39 .0 15,268 3,668 24 .0 1,298 287 22 .1
19916 . . . . . . . . . . . . . 7,648 3,094 40 .4 7,473 2,977 39 .8 13,279 3,008 22 .7 1,143 237 20 .81990 . . . . . . . . . . . . . . 7,457 2,865 38 .4 7,300 2,750 37 .7 12,857 2,896 22 .5 1,091 245 22 .51989 . . . . . . . . . . . . . . 7,186 2,603 36 .2 7,040 2,496 35 .5 12,536 2,616 20 .9 1,024 211 20 .619887 . . . . . . . . . . . . . 7,003 2,631 37 .6 6,908 2,576 37 .3 12,056 2,501 20 .7 1,005 225 22 .419877 . . . . . . . . . . . . . 6,792 2,670 39 .3 6,692 2,606 38 .9 11,718 2,509 21 .4 885 243 27 .5
1986 . . . . . . . . . . . . . . 6,646 2,507 37 .7 6,511 2,413 37 .1 11,206 2,406 21 .5 906 204 22 .51985 . . . . . . . . . . . . . . 6,475 2,606 40 .3 6,346 2,512 39 .6 10,685 2,411 22 .6 915 219 23 .91984 . . . . . . . . . . . . . . 6,068 2,376 39 .2 5,982 2,317 38 .7 10,029 2,254 22 .5 819 176 21 .51983 . . . . . . . . . . . . . . 6,066 2,312 38 .1 5,977 2,251 37 .7 9,697 2,148 22 .5 782 173 22 .11982 . . . . . . . . . . . . . . 5,527 2,181 39 .5 5,436 2,117 38 .9 8,262 1,963 23 .8 596 159 26 .6
1981 . . . . . . . . . . . . . . 5,369 1,925 35 .9 5,291 1,874 35 .4 8,084 1,642 20 .3 568 146 25 .71980 . . . . . . . . . . . . . . 5,276 1,749 33 .2 5,211 1,718 33 .0 7,740 1,563 20 .2 582 179 30 .81979 . . . . . . . . . . . . . . 5,483 1,535 28 .0 5,426 1,505 27 .7 7,314 1,232 16 .8 574 154 26 .81978 . . . . . . . . . . . . . . 5,012 1,384 27 .6 4,972 1,354 27 .2 6,527 1,098 16 .8 539 125 23 .21977 . . . . . . . . . . . . . . 5,028 1,422 28 .3 5,000 1,402 28 .0 6,500 1,164 17 .9 518 113 21 .9
1976 . . . . . . . . . . . . . . 4,771 1,443 30 .2 4,736 1,424 30 .1 6,034 1,212 20 .1 464 128 27 .71975 . . . . . . . . . . . . . . (NA) (NA) (NA) 4,896 1,619 33 .1 (NA) (NA) (NA) (NA) 137 32 .61974 . . . . . . . . . . . . . . (NA) (NA) (NA) 4,939 1,414 28 .6 (NA) (NA) (NA) (NA) 117 28 .91973 . . . . . . . . . . . . . . (NA) (NA) (NA) 4,910 1,364 27 .8 (NA) (NA) (NA) (NA) 95 24 .9
(NA) Not available . 1 Implementation of Census 2010-based population controls .2 For 2004, figures are revised to reflect a correction to the weights in the 2005 ASEC .3 Implementation of Census 2000-based population controls and a 28,000 household sample expansion .4 For 1999, figures are based on Census 2000 population controls .5 For 1992, figures are based on 1990 census population controls .6 For 1991, figures are revised to correct for nine omitted weights from the original March 1992 CPS file .7 For 1988 and 1987, figures are based on new processing procedures and are also revised to reflect corrections to the files after publication of the 1988 advance report Money Income
and Poverty Status in the United States: 1988, P-60, No . 166 .8 The 2003 CPS allowed respondents to choose more than one race . White alone refers to people who reported White and did not report any other race category . The use of this
single-race population does not imply that it is the preferred method of presenting or analyzing data . The Census Bureau uses a variety of approaches . Information on people who reported more than one race, such as White and American Indian and Alaska Native or Asian and Black or African American, is available from Census 2010 through American FactFinder . About 2 .9 percent of people reported more than one race in Census 2010 .
9 For 2001 and earlier years, the CPS allowed respondents to report only one race group . The reference race groups for 2001 and earlier poverty data are White, non-Hispanic White, Black, and Asian and Pacific Islander .
10 Black alone refers to people who reported Black and did not report any other race .11 Asian alone refers to people who reported Asian and did not report any other race .Note: Before 1979, people in unrelated subfamilies were included in people in families . Beginning in 1979, people in unrelated subfamilies are included in all people but are excluded
from people in families .Source: U .S . Census Bureau, Current Population Survey, 1960 to 2013 Annual Social and Economic Supplements .
Table B-2.Poverty Status of People by Age, Race, and Hispanic origin: 1959 to 2012—Con .(Numbers in thousands . People as of March of the following year . For information on confidentiality protection, sampling error, nonsampling error, and definitions, see www.census.gov/prod/techdoc/cps/cpsmar13.pdf)
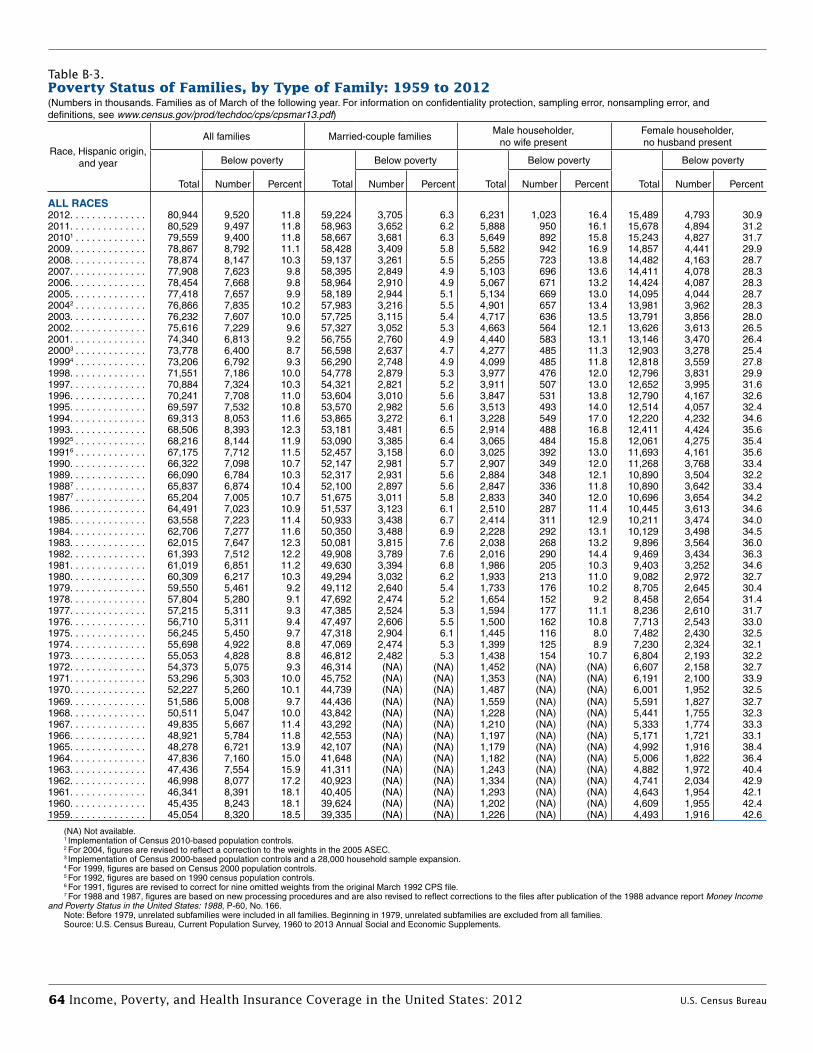
64 Income, Poverty, and Health Insurance Coverage in the United States: 2012 U.S. Census Bureau
Table B-3.Poverty Status of Families, by Type of Family: 1959 to 2012(Numbers in thousands . Families as of March of the following year . For information on confidentiality protection, sampling error, nonsampling error, and definitions, see www.census.gov/prod/techdoc/cps/cpsmar13.pdf)
Race, Hispanic origin, and year
All families Married-couple familiesMale householder,
no wife presentFemale householder, no husband present
Total
Below poverty
Total
Below poverty
Total
Below poverty
Total
Below poverty
Number Percent Number Percent Number Percent Number Percent
ALL RACES2012 . . . . . . . . . . . . . . 80,944 9,520 11 .8 59,224 3,705 6 .3 6,231 1,023 16 .4 15,489 4,793 30 .92011 . . . . . . . . . . . . . . 80,529 9,497 11 .8 58,963 3,652 6 .2 5,888 950 16 .1 15,678 4,894 31 .220101 . . . . . . . . . . . . . 79,559 9,400 11 .8 58,667 3,681 6 .3 5,649 892 15 .8 15,243 4,827 31 .72009 . . . . . . . . . . . . . . 78,867 8,792 11 .1 58,428 3,409 5 .8 5,582 942 16 .9 14,857 4,441 29 .92008 . . . . . . . . . . . . . . 78,874 8,147 10 .3 59,137 3,261 5 .5 5,255 723 13 .8 14,482 4,163 28 .72007 . . . . . . . . . . . . . . 77,908 7,623 9 .8 58,395 2,849 4 .9 5,103 696 13 .6 14,411 4,078 28 .32006 . . . . . . . . . . . . . . 78,454 7,668 9 .8 58,964 2,910 4 .9 5,067 671 13 .2 14,424 4,087 28 .32005 . . . . . . . . . . . . . . 77,418 7,657 9 .9 58,189 2,944 5 .1 5,134 669 13 .0 14,095 4,044 28 .720042 . . . . . . . . . . . . . 76,866 7,835 10 .2 57,983 3,216 5 .5 4,901 657 13 .4 13,981 3,962 28 .32003 . . . . . . . . . . . . . . 76,232 7,607 10 .0 57,725 3,115 5 .4 4,717 636 13 .5 13,791 3,856 28 .02002 . . . . . . . . . . . . . . 75,616 7,229 9 .6 57,327 3,052 5 .3 4,663 564 12 .1 13,626 3,613 26 .52001 . . . . . . . . . . . . . . 74,340 6,813 9 .2 56,755 2,760 4 .9 4,440 583 13 .1 13,146 3,470 26 .420003 . . . . . . . . . . . . . 73,778 6,400 8 .7 56,598 2,637 4 .7 4,277 485 11 .3 12,903 3,278 25 .419994 . . . . . . . . . . . . . 73,206 6,792 9 .3 56,290 2,748 4 .9 4,099 485 11 .8 12,818 3,559 27 .81998 . . . . . . . . . . . . . . 71,551 7,186 10 .0 54,778 2,879 5 .3 3,977 476 12 .0 12,796 3,831 29 .91997 . . . . . . . . . . . . . . 70,884 7,324 10 .3 54,321 2,821 5 .2 3,911 507 13 .0 12,652 3,995 31 .61996 . . . . . . . . . . . . . . 70,241 7,708 11 .0 53,604 3,010 5 .6 3,847 531 13 .8 12,790 4,167 32 .61995 . . . . . . . . . . . . . . 69,597 7,532 10 .8 53,570 2,982 5 .6 3,513 493 14 .0 12,514 4,057 32 .41994 . . . . . . . . . . . . . . 69,313 8,053 11 .6 53,865 3,272 6 .1 3,228 549 17 .0 12,220 4,232 34 .61993 . . . . . . . . . . . . . . 68,506 8,393 12 .3 53,181 3,481 6 .5 2,914 488 16 .8 12,411 4,424 35 .619925 . . . . . . . . . . . . . 68,216 8,144 11 .9 53,090 3,385 6 .4 3,065 484 15 .8 12,061 4,275 35 .419916 . . . . . . . . . . . . . 67,175 7,712 11 .5 52,457 3,158 6 .0 3,025 392 13 .0 11,693 4,161 35 .61990 . . . . . . . . . . . . . . 66,322 7,098 10 .7 52,147 2,981 5 .7 2,907 349 12 .0 11,268 3,768 33 .41989 . . . . . . . . . . . . . . 66,090 6,784 10 .3 52,317 2,931 5 .6 2,884 348 12 .1 10,890 3,504 32 .219887 . . . . . . . . . . . . . 65,837 6,874 10 .4 52,100 2,897 5 .6 2,847 336 11 .8 10,890 3,642 33 .419877 . . . . . . . . . . . . . 65,204 7,005 10 .7 51,675 3,011 5 .8 2,833 340 12 .0 10,696 3,654 34 .21986 . . . . . . . . . . . . . . 64,491 7,023 10 .9 51,537 3,123 6 .1 2,510 287 11 .4 10,445 3,613 34 .61985 . . . . . . . . . . . . . . 63,558 7,223 11 .4 50,933 3,438 6 .7 2,414 311 12 .9 10,211 3,474 34 .01984 . . . . . . . . . . . . . . 62,706 7,277 11 .6 50,350 3,488 6 .9 2,228 292 13 .1 10,129 3,498 34 .51983 . . . . . . . . . . . . . . 62,015 7,647 12 .3 50,081 3,815 7 .6 2,038 268 13 .2 9,896 3,564 36 .01982 . . . . . . . . . . . . . . 61,393 7,512 12 .2 49,908 3,789 7 .6 2,016 290 14 .4 9,469 3,434 36 .31981 . . . . . . . . . . . . . . 61,019 6,851 11 .2 49,630 3,394 6 .8 1,986 205 10 .3 9,403 3,252 34 .61980 . . . . . . . . . . . . . . 60,309 6,217 10 .3 49,294 3,032 6 .2 1,933 213 11 .0 9,082 2,972 32 .71979 . . . . . . . . . . . . . . 59,550 5,461 9 .2 49,112 2,640 5 .4 1,733 176 10 .2 8,705 2,645 30 .41978 . . . . . . . . . . . . . . 57,804 5,280 9 .1 47,692 2,474 5 .2 1,654 152 9 .2 8,458 2,654 31 .41977 . . . . . . . . . . . . . . 57,215 5,311 9 .3 47,385 2,524 5 .3 1,594 177 11 .1 8,236 2,610 31 .71976 . . . . . . . . . . . . . . 56,710 5,311 9 .4 47,497 2,606 5 .5 1,500 162 10 .8 7,713 2,543 33 .01975 . . . . . . . . . . . . . . 56,245 5,450 9 .7 47,318 2,904 6 .1 1,445 116 8 .0 7,482 2,430 32 .51974 . . . . . . . . . . . . . . 55,698 4,922 8 .8 47,069 2,474 5 .3 1,399 125 8 .9 7,230 2,324 32 .11973 . . . . . . . . . . . . . . 55,053 4,828 8 .8 46,812 2,482 5 .3 1,438 154 10 .7 6,804 2,193 32 .21972 . . . . . . . . . . . . . . 54,373 5,075 9 .3 46,314 (NA) (NA) 1,452 (NA) (NA) 6,607 2,158 32 .71971 . . . . . . . . . . . . . . 53,296 5,303 10 .0 45,752 (NA) (NA) 1,353 (NA) (NA) 6,191 2,100 33 .91970 . . . . . . . . . . . . . . 52,227 5,260 10 .1 44,739 (NA) (NA) 1,487 (NA) (NA) 6,001 1,952 32 .51969 . . . . . . . . . . . . . . 51,586 5,008 9 .7 44,436 (NA) (NA) 1,559 (NA) (NA) 5,591 1,827 32 .71968 . . . . . . . . . . . . . . 50,511 5,047 10 .0 43,842 (NA) (NA) 1,228 (NA) (NA) 5,441 1,755 32 .31967 . . . . . . . . . . . . . . 49,835 5,667 11 .4 43,292 (NA) (NA) 1,210 (NA) (NA) 5,333 1,774 33 .31966 . . . . . . . . . . . . . . 48,921 5,784 11 .8 42,553 (NA) (NA) 1,197 (NA) (NA) 5,171 1,721 33 .11965 . . . . . . . . . . . . . . 48,278 6,721 13 .9 42,107 (NA) (NA) 1,179 (NA) (NA) 4,992 1,916 38 .41964 . . . . . . . . . . . . . . 47,836 7,160 15 .0 41,648 (NA) (NA) 1,182 (NA) (NA) 5,006 1,822 36 .41963 . . . . . . . . . . . . . . 47,436 7,554 15 .9 41,311 (NA) (NA) 1,243 (NA) (NA) 4,882 1,972 40 .41962 . . . . . . . . . . . . . . 46,998 8,077 17 .2 40,923 (NA) (NA) 1,334 (NA) (NA) 4,741 2,034 42 .91961 . . . . . . . . . . . . . . 46,341 8,391 18 .1 40,405 (NA) (NA) 1,293 (NA) (NA) 4,643 1,954 42 .11960 . . . . . . . . . . . . . . 45,435 8,243 18 .1 39,624 (NA) (NA) 1,202 (NA) (NA) 4,609 1,955 42 .41959 . . . . . . . . . . . . . . 45,054 8,320 18 .5 39,335 (NA) (NA) 1,226 (NA) (NA) 4,493 1,916 42 .6
(NA) Not available .1 Implementation of Census 2010-based population controls .2 For 2004, figures are revised to reflect a correction to the weights in the 2005 ASEC .3 Implementation of Census 2000-based population controls and a 28,000 household sample expansion .4 For 1999, figures are based on Census 2000 population controls .5 For 1992, figures are based on 1990 census population controls .6 For 1991, figures are revised to correct for nine omitted weights from the original March 1992 CPS file .7 For 1988 and 1987, figures are based on new processing procedures and are also revised to reflect corrections to the files after publication of the 1988 advance report Money Income
and Poverty Status in the United States: 1988, P-60, No . 166 .Note: Before 1979, unrelated subfamilies were included in all families . Beginning in 1979, unrelated subfamilies are excluded from all families .Source: U .S . Census Bureau, Current Population Survey, 1960 to 2013 Annual Social and Economic Supplements .
U.S. Census Bureau Income, Poverty, and Health Insurance Coverage in the United States: 2012 65
National surveys and health insurance coverage. Health insurance coverage is likely to be underreported on the Current Population Survey (CPS). While underreporting affects most, if not all, surveys, underreporting of health insurance coverage appears to be a larger problem in the Annual Social and Economic Supplement (ASEC) than in other national surveys that ask about insurance. Some reasons for the disparity may include the fact that income, not health insurance, is the main focus of the ASEC questionnaire. In addition, the ASEC collects health insurance information in February through April but asks about the pre-vious year’s coverage. Asking annual retrospective questions appears to cause few problems when collect-ing income data (possibly because the interview period is close to when people pay their taxes), but it may be less than ideal when asking about health insurance coverage. Compared with other national surveys, the CPS estimate of the number of people without health insurance more closely approximates the number of people who are uninsured at a specific point in time during the year than the num-ber of people uninsured for the entire year. For a comparison of health insur-ance coverage rates from the major federal surveys, see How Many People Lack Insurance and for How Long? (Congressional Budget Office, May 2003) at <www.cbo.gov/doc .cfm?index=4210>.
Reporting of coverage through major federal health insurance programs. The CPS ASEC data underreport Medicare and Medicaid coverage compared with enrollment and participation data from the Centers for Medicare and Medicaid Services (CMS).1 Because the CPS is largely
1CMS is the federal agency primarily responsi-ble for administering the Medicare and Medicaid programs at the national level.
a labor force survey, interviewers receive less training on health insur-ance concepts than labor concepts. Additionally, many people may not be aware that a health insurance pro-gram covers them or their children if they have not used covered services recently. CMS data, on the other hand, represent the actual number of people who have enrolled or participated in these programs.
The State Health Access Data Assistance Center (SHADAC) of the University of Minnesota has worked with the U.S. Census Bureau, CMS, and the Office of the Assistant Secretary for Planning and Evaluation (ASPE) on a research project to evalu-ate why CPS ASEC estimates of the number of people with Medicaid are lower than counts of the number of people enrolled in the program from CMS. Reports from all four phases of the research project are available from the Census Bureau’s Web site at <www.census.gov/did/www/snacc/>.
During Phase 1, a database of Medicaid and Medicare enrollment was built using the CMS Medicaid Statistical Information System (MSIS) files merged with CMS Medicare Enrollment Database (EDB) files. The quality of the database was evalu-ated using two Census Bureau files: the Master Address File/Auxiliary Reference File (MAFARF) and the Person Characteristics File (PCF).
During Phase 2, files from the MSIS were linked with the CPS ASEC files, and the individual records were compared. The report from Phase 2 showed a gap between CPS ASEC estimates and MSIS files of 2.8 mil-lion Medicaid enrollees. A key finding indicating survey response error in the CPS ASEC was that 16.9 percent of people with an MSIS record indicat-ing Medicaid coverage reported in the
CPS ASEC that they were uninsured.2 The report found that Medicaid sub-scribers with longer and more recent enrollment were more likely to report coverage. Respondents for children enrolled in Medicaid were more apt to report coverage for those chil-dren than for enrolled adults within the household. Families with lower incomes tended to report coverage more frequently. Individuals who received Medicaid services during the reporting cycle tended to report coverage more often than individu-als who had not received services. Reporting differences were also appar-ent among states.
Phase 3 of the research project was further broken down into three steps that attempted to account for discrep-ancies found in Phase 2 between the MSIS records and the CPS ASEC files. These steps focused on determining the number of enrollees who were out-of-scope for the 2001 March CPS interview (people living in institu-tions and other group quarters are not eligible for CPS ASEC interview; MSIS counts all people, regardless of their living situation). Phase 3 narrowed the gap between CPS ASEC estimates and MSIS files by 1.0 million, to 1.8 million Medicaid enrollees.
Phase 4 consisted of repeating the Phase 2 process using the National Health Interview Survey (NHIS) data instead of CPS ASEC data. The pur-pose of this was twofold: to provide explanations for the differences found between NHIS data and MSIS files and to examine how differing survey designs and methodologies affect the survey data and estimates. The report found that the NHIS Medicaid
2 For consistency purposes across the MSIS and the CPS, SHADAC removed all MSIS enrollees who received only partial coverage, those who had died before the CPS reporting cycle, and all duplicate person records. Also, all Children’s Health Insurance Program (CHIP) enrollees were removed from the MSIS count.
APPENDIX C. ESTIMATES oF HEALTH INSURANCE CoVERAGE
Quality of Health Insurance Coverage Estimates

66 Income, Poverty, and Health Insurance Coverage in the United States: 2012 U.S. Census Bureau
undercount was 27.3 percent in 2001 and 21.7 percent in 2002, but noted that the NHIS added questions in 2004 and these results may not apply to more recent data. The report found higher false-negative reporting for enrollees who were older, had higher incomes, and also had private insur-ance. False-negative reporting was lower for very low-income enrollees, those on other benefits programs, and those who had recently used Medicaid services. The report found that the dynamics of false-negative reporting was similar in the NHIS and CPS ASEC.
SHADAC released an imputation adjustment for public use CPS ASEC microdata through its website to help researchers interested in partially adjusting for CPS ASEC Medicaid underreporting.3 This is an experi-mental imputation and was produced for interested parties to use in their research. The Census Bureau has not evaluated the methodology, and users should be aware that this is not an official data product.
Enhancements in 2010. SHADAC has also done research to improve the CPS ASEC imputation and allocation
3 See <www.shadac.org/publications / medicaid-under-reporting-in-cps-and-one-approach-partial-correction> for more information.
processes.4 After evaluating the methodology, the Census Bureau decided to implement these changes for data from the 2000 to 2010 CPS ASEC Supplements. From this point forward, this methodology will be used and is now incorporated into the approved historical series from the 2000 to 2010 CPS ASEC Supplements. For more information on this, see <www.census.gov/hhes/www /hlthins/data/usernote/index.html>.
There are several ongoing projects aimed at improving the quality of health coverage data from the CPS ASEC. This research includes: 1) cognitive research and field test-ing to improve the wording of the CPS ASEC health coverage questions; 2) editing and imputation research, including additional research on the use of models that attempt to account for Medicaid underreporting; and 3) expanding the number of studies that match administrative Medicaid data to current survey data to include other surveys, such as the National Health Interview Survey (NHIS) and the American Community Survey (ACS). This research will make it pos-sible to compare and contrast CPS
4 See <www.shadac.org/publications/are -current-population-survey-uninsurance-esti-mates-too-high-examination-imputation-pro>.
ASEC underreporting rates with other surveys, allowing Census Bureau ana-lysts to better understand the nature and impact of CPS ASEC health cover-age underreporting.
After consulting with health insurance experts, the Census Bureau modified the definition of the population with-out health insurance in the supple-ment to the March 1998 CPS, which collected data about coverage in 1997. Previously, people with no cov-erage other than access to the Indian Health Service were counted as part of the insured population. Subsequently, the Census Bureau has counted these people as uninsured.
In 2009, a modification to uninsured foster children was made. Health insurance experts informed the Census Bureau that all foster children were eligible for Medicaid. The effect of these changes on the overall esti-mates of health insurance coverage was negligible. This modification was later incorporated into the revision of data from 1999 to 2009.
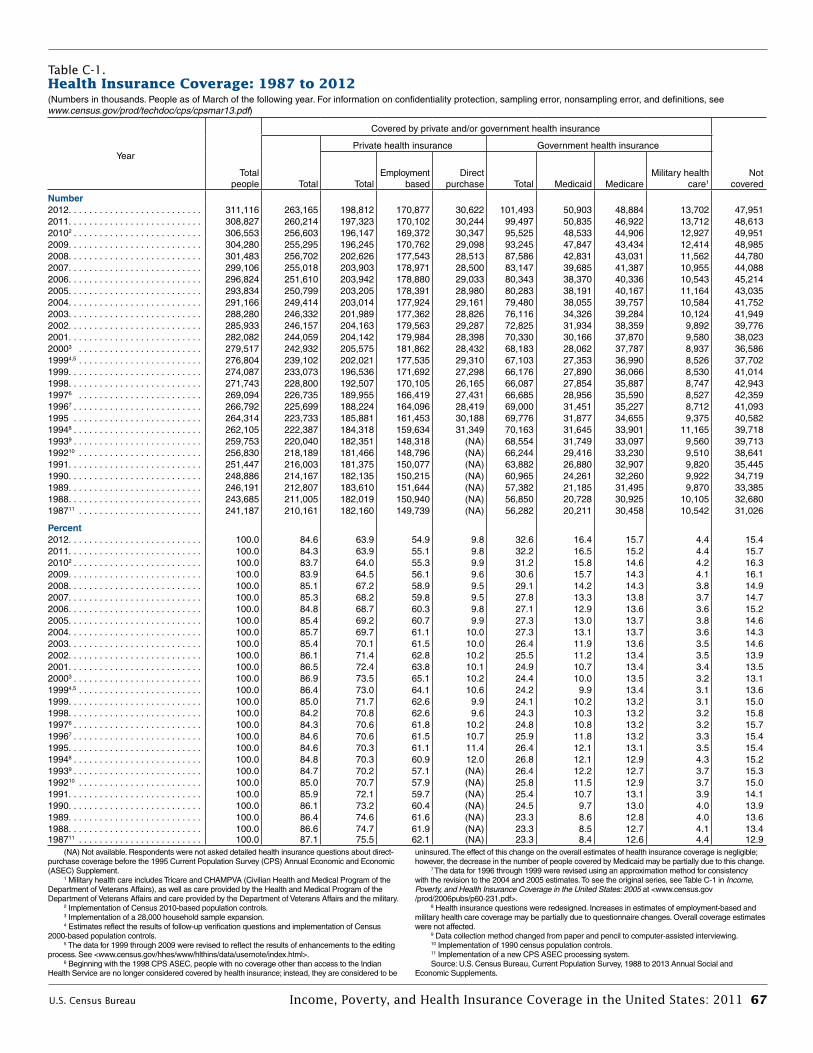
U.S. Census Bureau Income, Poverty, and Health Insurance Coverage in the United States: 2011 67
Table C-1.Health Insurance Coverage: 1987 to 2012(Numbers in thousands . People as of March of the following year . For information on confidentiality protection, sampling error, nonsampling error, and definitions, see www.census.gov/prod/techdoc/cps/cpsmar13.pdf)
Year
Total people
Covered by private and/or government health insurance
Not coveredTotal
Private health insurance Government health insurance
TotalEmploy ment
basedDirect
purchase Total Medicaid MedicareMilitary health
care1
Number2012 . . . . . . . . . . . . . . . . . . . . . . . . . . 311,116 263,165 198,812 170,877 30,622 101,493 50,903 48,884 13,702 47,9512011 . . . . . . . . . . . . . . . . . . . . . . . . . . 308,827 260,214 197,323 170,102 30,244 99,497 50,835 46,922 13,712 48,61320102 . . . . . . . . . . . . . . . . . . . . . . . . . 306,553 256,603 196,147 169,372 30,347 95,525 48,533 44,906 12,927 49,9512009 . . . . . . . . . . . . . . . . . . . . . . . . . . 304,280 255,295 196,245 170,762 29,098 93,245 47,847 43,434 12,414 48,9852008 . . . . . . . . . . . . . . . . . . . . . . . . . . 301,483 256,702 202,626 177,543 28,513 87,586 42,831 43,031 11,562 44,7802007 . . . . . . . . . . . . . . . . . . . . . . . . . . 299,106 255,018 203,903 178,971 28,500 83,147 39,685 41,387 10,955 44,0882006 . . . . . . . . . . . . . . . . . . . . . . . . . . 296,824 251,610 203,942 178,880 29,033 80,343 38,370 40,336 10,543 45,2142005 . . . . . . . . . . . . . . . . . . . . . . . . . . 293,834 250,799 203,205 178,391 28,980 80,283 38,191 40,167 11,164 43,0352004 . . . . . . . . . . . . . . . . . . . . . . . . . . 291,166 249,414 203,014 177,924 29,161 79,480 38,055 39,757 10,584 41,7522003 . . . . . . . . . . . . . . . . . . . . . . . . . . 288,280 246,332 201,989 177,362 28,826 76,116 34,326 39,284 10,124 41,9492002 . . . . . . . . . . . . . . . . . . . . . . . . . . 285,933 246,157 204,163 179,563 29,287 72,825 31,934 38,359 9,892 39,7762001 . . . . . . . . . . . . . . . . . . . . . . . . . . 282,082 244,059 204,142 179,984 28,398 70,330 30,166 37,870 9,580 38,02320003 . . . . . . . . . . . . . . . . . . . . . . . . 279,517 242,932 205,575 181,862 28,432 68,183 28,062 37,787 8,937 36,58619994,5 . . . . . . . . . . . . . . . . . . . . . . . . 276,804 239,102 202,021 177,535 29,310 67,103 27,353 36,990 8,526 37,7021999 . . . . . . . . . . . . . . . . . . . . . . . . . . 274,087 233,073 196,536 171,692 27,298 66,176 27,890 36,066 8,530 41,0141998 . . . . . . . . . . . . . . . . . . . . . . . . . . 271,743 228,800 192,507 170,105 26,165 66,087 27,854 35,887 8,747 42,94319976 . . . . . . . . . . . . . . . . . . . . . . . . 269,094 226,735 189,955 166,419 27,431 66,685 28,956 35,590 8,527 42,35919967 . . . . . . . . . . . . . . . . . . . . . . . . . 266,792 225,699 188,224 164,096 28,419 69,000 31,451 35,227 8,712 41,0931995 . . . . . . . . . . . . . . . . . . . . . . . . . 264,314 223,733 185,881 161,453 30,188 69,776 31,877 34,655 9,375 40,58219948 . . . . . . . . . . . . . . . . . . . . . . . . . 262,105 222,387 184,318 159,634 31,349 70,163 31,645 33,901 11,165 39,71819939 . . . . . . . . . . . . . . . . . . . . . . . . . 259,753 220,040 182,351 148,318 (NA) 68,554 31,749 33,097 9,560 39,713199210 . . . . . . . . . . . . . . . . . . . . . . . . 256,830 218,189 181,466 148,796 (NA) 66,244 29,416 33,230 9,510 38,6411991 . . . . . . . . . . . . . . . . . . . . . . . . . . 251,447 216,003 181,375 150,077 (NA) 63,882 26,880 32,907 9,820 35,4451990 . . . . . . . . . . . . . . . . . . . . . . . . . . 248,886 214,167 182,135 150,215 (NA) 60,965 24,261 32,260 9,922 34,7191989 . . . . . . . . . . . . . . . . . . . . . . . . . . 246,191 212,807 183,610 151,644 (NA) 57,382 21,185 31,495 9,870 33,3851988 . . . . . . . . . . . . . . . . . . . . . . . . . . 243,685 211,005 182,019 150,940 (NA) 56,850 20,728 30,925 10,105 32,680198711 . . . . . . . . . . . . . . . . . . . . . . . . 241,187 210,161 182,160 149,739 (NA) 56,282 20,211 30,458 10,542 31,026
Percent2012 . . . . . . . . . . . . . . . . . . . . . . . . . . 100 .0 84 .6 63 .9 54 .9 9 .8 32 .6 16 .4 15 .7 4 .4 15 .42011 . . . . . . . . . . . . . . . . . . . . . . . . . . 100 .0 84 .3 63 .9 55 .1 9 .8 32 .2 16 .5 15 .2 4 .4 15 .720102 . . . . . . . . . . . . . . . . . . . . . . . . . 100 .0 83 .7 64 .0 55 .3 9 .9 31 .2 15 .8 14 .6 4 .2 16 .32009 . . . . . . . . . . . . . . . . . . . . . . . . . . 100 .0 83 .9 64 .5 56 .1 9 .6 30 .6 15 .7 14 .3 4 .1 16 .12008 . . . . . . . . . . . . . . . . . . . . . . . . . . 100 .0 85 .1 67 .2 58 .9 9 .5 29 .1 14 .2 14 .3 3 .8 14 .92007 . . . . . . . . . . . . . . . . . . . . . . . . . . 100 .0 85 .3 68 .2 59 .8 9 .5 27 .8 13 .3 13 .8 3 .7 14 .72006 . . . . . . . . . . . . . . . . . . . . . . . . . . 100 .0 84 .8 68 .7 60 .3 9 .8 27 .1 12 .9 13 .6 3 .6 15 .22005 . . . . . . . . . . . . . . . . . . . . . . . . . . 100 .0 85 .4 69 .2 60 .7 9 .9 27 .3 13 .0 13 .7 3 .8 14 .62004 . . . . . . . . . . . . . . . . . . . . . . . . . . 100 .0 85 .7 69 .7 61 .1 10 .0 27 .3 13 .1 13 .7 3 .6 14 .32003 . . . . . . . . . . . . . . . . . . . . . . . . . . 100 .0 85 .4 70 .1 61 .5 10 .0 26 .4 11 .9 13 .6 3 .5 14 .62002 . . . . . . . . . . . . . . . . . . . . . . . . . . 100 .0 86 .1 71 .4 62 .8 10 .2 25 .5 11 .2 13 .4 3 .5 13 .92001 . . . . . . . . . . . . . . . . . . . . . . . . . . 100 .0 86 .5 72 .4 63 .8 10 .1 24 .9 10 .7 13 .4 3 .4 13 .520003 . . . . . . . . . . . . . . . . . . . . . . . . . 100 .0 86 .9 73 .5 65 .1 10 .2 24 .4 10 .0 13 .5 3 .2 13 .119994,5 . . . . . . . . . . . . . . . . . . . . . . . . 100 .0 86 .4 73 .0 64 .1 10 .6 24 .2 9 .9 13 .4 3 .1 13 .61999 . . . . . . . . . . . . . . . . . . . . . . . . . . 100 .0 85 .0 71 .7 62 .6 9 .9 24 .1 10 .2 13 .2 3 .1 15 .01998 . . . . . . . . . . . . . . . . . . . . . . . . . . 100 .0 84 .2 70 .8 62 .6 9 .6 24 .3 10 .3 13 .2 3 .2 15 .819976 . . . . . . . . . . . . . . . . . . . . . . . . . 100 .0 84 .3 70 .6 61 .8 10 .2 24 .8 10 .8 13 .2 3 .2 15 .719967 . . . . . . . . . . . . . . . . . . . . . . . . . 100 .0 84 .6 70 .6 61 .5 10 .7 25 .9 11 .8 13 .2 3 .3 15 .41995 . . . . . . . . . . . . . . . . . . . . . . . . . . 100 .0 84 .6 70 .3 61 .1 11 .4 26 .4 12 .1 13 .1 3 .5 15 .419948 . . . . . . . . . . . . . . . . . . . . . . . . . 100 .0 84 .8 70 .3 60 .9 12 .0 26 .8 12 .1 12 .9 4 .3 15 .219939 . . . . . . . . . . . . . . . . . . . . . . . . . 100 .0 84 .7 70 .2 57 .1 (NA) 26 .4 12 .2 12 .7 3 .7 15 .3199210 . . . . . . . . . . . . . . . . . . . . . . . . 100 .0 85 .0 70 .7 57 .9 (NA) 25 .8 11 .5 12 .9 3 .7 15 .01991 . . . . . . . . . . . . . . . . . . . . . . . . . . 100 .0 85 .9 72 .1 59 .7 (NA) 25 .4 10 .7 13 .1 3 .9 14 .11990 . . . . . . . . . . . . . . . . . . . . . . . . . . 100 .0 86 .1 73 .2 60 .4 (NA) 24 .5 9 .7 13 .0 4 .0 13 .91989 . . . . . . . . . . . . . . . . . . . . . . . . . . 100 .0 86 .4 74 .6 61 .6 (NA) 23 .3 8 .6 12 .8 4 .0 13 .61988 . . . . . . . . . . . . . . . . . . . . . . . . . . 100 .0 86 .6 74 .7 61 .9 (NA) 23 .3 8 .5 12 .7 4 .1 13 .4198711 . . . . . . . . . . . . . . . . . . . . . . . . 100 .0 87 .1 75 .5 62 .1 (NA) 23 .3 8 .4 12 .6 4 .4 12 .9
(NA) Not available . Respondents were not asked detailed health insurance questions about direct-purchase coverage before the 1995 Current Population Survey (CPS) Annual Economic and Economic (ASEC) Supplement .
1 Military health care includes Tricare and CHAMPVA (Civilian Health and Medical Program of the Department of Veterans Affairs), as well as care provided by the Health and Medical Program of the Department of Veterans Affairs and care provided by the Department of Veterans Affairs and the military .
2 Implementation of Census 2010-based population controls .3 Implementation of a 28,000 household sample expansion .4 Estimates reflect the results of follow-up verification questions and implementation of Census
2000-based population controls .5 The data for 1999 through 2009 were revised to reflect the results of enhancements to the editing
process . See <www .census .gov/hhes/www/hlthins/data/usernote/index .html> .6 Beginning with the 1998 CPS ASEC, people with no coverage other than access to the Indian
Health Service are no longer considered covered by health insurance; instead, they are considered to be
uninsured . The effect of this change on the overall estimates of health insurance coverage is negligible; however, the decrease in the number of people covered by Medicaid may be partially due to this change .
7 The data for 1996 through 1999 were revised using an approximation method for consistency with the revision to the 2004 and 2005 estimates . To see the original series, see Table C-1 in Income, Poverty, and Health Insurance Coverage in the United States: 2005 at <www .census .gov /prod/2006pubs/p60-231 .pdf> .
8 Health insurance questions were redesigned . Increases in estimates of employment-based and military health care coverage may be partially due to questionnaire changes . Overall coverage estimates were not affected .
9 Data collection method changed from paper and pencil to computer-assisted interviewing . 10 Implementation of 1990 census population controls . 11 Implementation of a new CPS ASEC processing system .Source: U .S . Census Bureau, Current Population Survey, 1988 to 2013 Annual Social and
Economic Supplements .
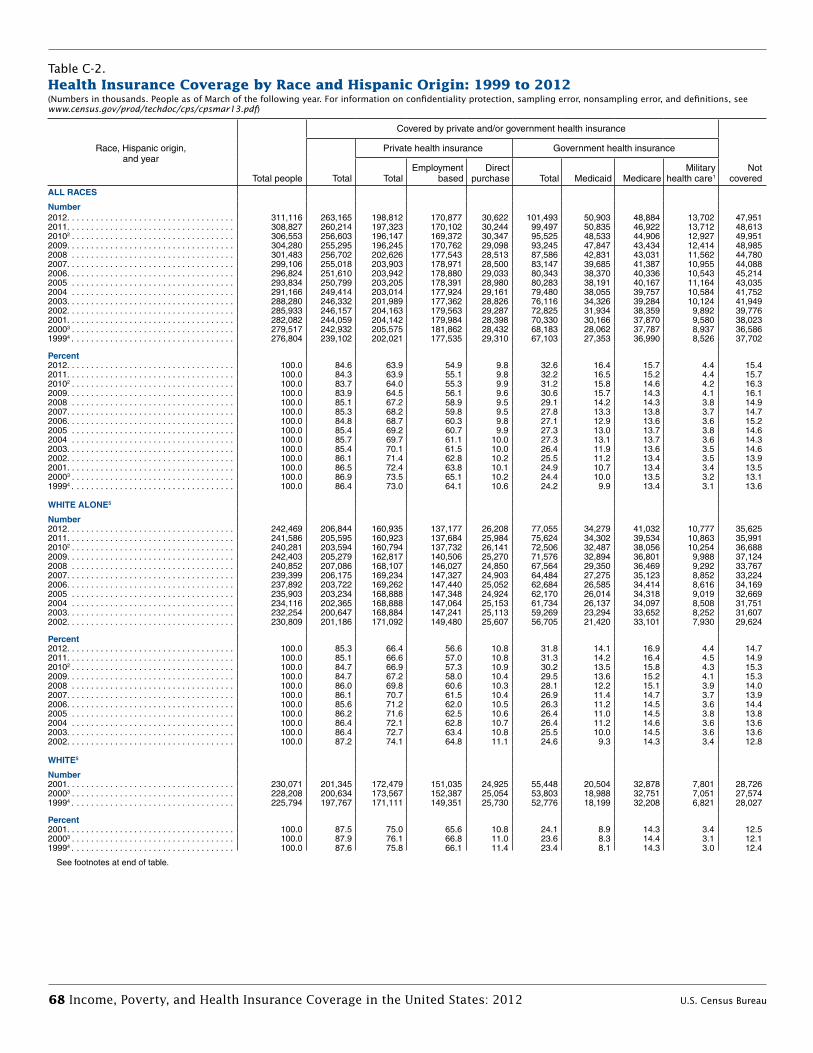
68 Income, Poverty, and Health Insurance Coverage in the United States: 2012 U.S. Census Bureau
Table C-2.Health Insurance Coverage by Race and Hispanic origin: 1999 to 2012—Con .(Numbers in thousands. People as of March of the following year. For information on confidentiality protection, sampling error, nonsampling error, and definitions, see www.census.gov/prod/techdoc/cps/cpsmar13.pdf)
Race, Hispanic origin, and year
Total people
Covered by private and/or government health insurance
Not coveredTotal
Private health insurance Government health insurance
TotalEmployment
basedDirect
purchase Total Medicaid MedicareMilitary
health care1
ALL RACES
Number2012 . . . . . . . . . . . . . . . . . . . . . . . . . . . . . . . . . . . 311,116 263,165 198,812 170,877 30,622 101,493 50,903 48,884 13,702 47,9512011 . . . . . . . . . . . . . . . . . . . . . . . . . . . . . . . . . . . 308,827 260,214 197,323 170,102 30,244 99,497 50,835 46,922 13,712 48,61320102 . . . . . . . . . . . . . . . . . . . . . . . . . . . . . . . . . . 306,553 256,603 196,147 169,372 30,347 95,525 48,533 44,906 12,927 49,9512009 . . . . . . . . . . . . . . . . . . . . . . . . . . . . . . . . . . . 304,280 255,295 196,245 170,762 29,098 93,245 47,847 43,434 12,414 48,9852008 . . . . . . . . . . . . . . . . . . . . . . . . . . . . . . . . . . 301,483 256,702 202,626 177,543 28,513 87,586 42,831 43,031 11,562 44,7802007 . . . . . . . . . . . . . . . . . . . . . . . . . . . . . . . . . . . 299,106 255,018 203,903 178,971 28,500 83,147 39,685 41,387 10,955 44,0882006 . . . . . . . . . . . . . . . . . . . . . . . . . . . . . . . . . . . 296,824 251,610 203,942 178,880 29,033 80,343 38,370 40,336 10,543 45,2142005 . . . . . . . . . . . . . . . . . . . . . . . . . . . . . . . . . . 293,834 250,799 203,205 178,391 28,980 80,283 38,191 40,167 11,164 43,0352004 . . . . . . . . . . . . . . . . . . . . . . . . . . . . . . . . . . 291,166 249,414 203,014 177,924 29,161 79,480 38,055 39,757 10,584 41,7522003 . . . . . . . . . . . . . . . . . . . . . . . . . . . . . . . . . . . 288,280 246,332 201,989 177,362 28,826 76,116 34,326 39,284 10,124 41,9492002 . . . . . . . . . . . . . . . . . . . . . . . . . . . . . . . . . . . 285,933 246,157 204,163 179,563 29,287 72,825 31,934 38,359 9,892 39,7762001 . . . . . . . . . . . . . . . . . . . . . . . . . . . . . . . . . . . 282,082 244,059 204,142 179,984 28,398 70,330 30,166 37,870 9,580 38,02320003 . . . . . . . . . . . . . . . . . . . . . . . . . . . . . . . . . . 279,517 242,932 205,575 181,862 28,432 68,183 28,062 37,787 8,937 36,58619994 . . . . . . . . . . . . . . . . . . . . . . . . . . . . . . . . . . 276,804 239,102 202,021 177,535 29,310 67,103 27,353 36,990 8,526 37,702
Percent2012 . . . . . . . . . . . . . . . . . . . . . . . . . . . . . . . . . . . 100 .0 84 .6 63 .9 54 .9 9 .8 32 .6 16 .4 15 .7 4 .4 15 .42011 . . . . . . . . . . . . . . . . . . . . . . . . . . . . . . . . . . . 100 .0 84 .3 63 .9 55 .1 9 .8 32 .2 16 .5 15 .2 4 .4 15 .720102 . . . . . . . . . . . . . . . . . . . . . . . . . . . . . . . . . . 100 .0 83 .7 64 .0 55 .3 9 .9 31 .2 15 .8 14 .6 4 .2 16 .32009 . . . . . . . . . . . . . . . . . . . . . . . . . . . . . . . . . . . 100 .0 83 .9 64 .5 56 .1 9 .6 30 .6 15 .7 14 .3 4 .1 16 .12008 . . . . . . . . . . . . . . . . . . . . . . . . . . . . . . . . . . 100 .0 85 .1 67 .2 58 .9 9 .5 29 .1 14 .2 14 .3 3 .8 14 .92007 . . . . . . . . . . . . . . . . . . . . . . . . . . . . . . . . . . . 100 .0 85 .3 68 .2 59 .8 9 .5 27 .8 13 .3 13 .8 3 .7 14 .72006 . . . . . . . . . . . . . . . . . . . . . . . . . . . . . . . . . . . 100 .0 84 .8 68 .7 60 .3 9 .8 27 .1 12 .9 13 .6 3 .6 15 .22005 . . . . . . . . . . . . . . . . . . . . . . . . . . . . . . . . . . 100 .0 85 .4 69 .2 60 .7 9 .9 27 .3 13 .0 13 .7 3 .8 14 .62004 . . . . . . . . . . . . . . . . . . . . . . . . . . . . . . . . . . 100 .0 85 .7 69 .7 61 .1 10 .0 27 .3 13 .1 13 .7 3 .6 14 .32003 . . . . . . . . . . . . . . . . . . . . . . . . . . . . . . . . . . . 100 .0 85 .4 70 .1 61 .5 10 .0 26 .4 11 .9 13 .6 3 .5 14 .62002 . . . . . . . . . . . . . . . . . . . . . . . . . . . . . . . . . . . 100 .0 86 .1 71 .4 62 .8 10 .2 25 .5 11 .2 13 .4 3 .5 13 .92001 . . . . . . . . . . . . . . . . . . . . . . . . . . . . . . . . . . . 100 .0 86 .5 72 .4 63 .8 10 .1 24 .9 10 .7 13 .4 3 .4 13 .520003 . . . . . . . . . . . . . . . . . . . . . . . . . . . . . . . . . . 100 .0 86 .9 73 .5 65 .1 10 .2 24 .4 10 .0 13 .5 3 .2 13 .119994 . . . . . . . . . . . . . . . . . . . . . . . . . . . . . . . . . . 100 .0 86 .4 73 .0 64 .1 10 .6 24 .2 9 .9 13 .4 3 .1 13 .6
WHITE ALONE5
Number2012 . . . . . . . . . . . . . . . . . . . . . . . . . . . . . . . . . . . 242,469 206,844 160,935 137,177 26,208 77,055 34,279 41,032 10,777 35,6252011 . . . . . . . . . . . . . . . . . . . . . . . . . . . . . . . . . . . 241,586 205,595 160,923 137,684 25,984 75,624 34,302 39,534 10,863 35,99120102 . . . . . . . . . . . . . . . . . . . . . . . . . . . . . . . . . . 240,281 203,594 160,794 137,732 26,141 72,506 32,487 38,056 10,254 36,6882009 . . . . . . . . . . . . . . . . . . . . . . . . . . . . . . . . . . . 242,403 205,279 162,817 140,506 25,270 71,576 32,894 36,801 9,988 37,1242008 . . . . . . . . . . . . . . . . . . . . . . . . . . . . . . . . . . 240,852 207,086 168,107 146,027 24,850 67,564 29,350 36,469 9,292 33,7672007 . . . . . . . . . . . . . . . . . . . . . . . . . . . . . . . . . . . 239,399 206,175 169,234 147,327 24,903 64,484 27,275 35,123 8,852 33,2242006 . . . . . . . . . . . . . . . . . . . . . . . . . . . . . . . . . . . 237,892 203,722 169,262 147,440 25,052 62,684 26,585 34,414 8,616 34,1692005 . . . . . . . . . . . . . . . . . . . . . . . . . . . . . . . . . . 235,903 203,234 168,888 147,348 24,924 62,170 26,014 34,318 9,019 32,6692004 . . . . . . . . . . . . . . . . . . . . . . . . . . . . . . . . . . 234,116 202,365 168,888 147,064 25,153 61,734 26,137 34,097 8,508 31,7512003 . . . . . . . . . . . . . . . . . . . . . . . . . . . . . . . . . . . 232,254 200,647 168,884 147,241 25,113 59,269 23,294 33,652 8,252 31,6072002 . . . . . . . . . . . . . . . . . . . . . . . . . . . . . . . . . . . 230,809 201,186 171,092 149,480 25,607 56,705 21,420 33,101 7,930 29,624
Percent2012 . . . . . . . . . . . . . . . . . . . . . . . . . . . . . . . . . . . 100 .0 85 .3 66 .4 56 .6 10 .8 31 .8 14 .1 16 .9 4 .4 14 .72011 . . . . . . . . . . . . . . . . . . . . . . . . . . . . . . . . . . . 100 .0 85 .1 66 .6 57 .0 10 .8 31 .3 14 .2 16 .4 4 .5 14 .920102 . . . . . . . . . . . . . . . . . . . . . . . . . . . . . . . . . . 100 .0 84 .7 66 .9 57 .3 10 .9 30 .2 13 .5 15 .8 4 .3 15 .32009 . . . . . . . . . . . . . . . . . . . . . . . . . . . . . . . . . . . 100 .0 84 .7 67 .2 58 .0 10 .4 29 .5 13 .6 15 .2 4 .1 15 .32008 . . . . . . . . . . . . . . . . . . . . . . . . . . . . . . . . . . 100 .0 86 .0 69 .8 60 .6 10 .3 28 .1 12 .2 15 .1 3 .9 14 .02007 . . . . . . . . . . . . . . . . . . . . . . . . . . . . . . . . . . . 100 .0 86 .1 70 .7 61 .5 10 .4 26 .9 11 .4 14 .7 3 .7 13 .92006 . . . . . . . . . . . . . . . . . . . . . . . . . . . . . . . . . . . 100 .0 85 .6 71 .2 62 .0 10 .5 26 .3 11 .2 14 .5 3 .6 14 .42005 . . . . . . . . . . . . . . . . . . . . . . . . . . . . . . . . . . 100 .0 86 .2 71 .6 62 .5 10 .6 26 .4 11 .0 14 .5 3 .8 13 .82004 . . . . . . . . . . . . . . . . . . . . . . . . . . . . . . . . . . 100 .0 86 .4 72 .1 62 .8 10 .7 26 .4 11 .2 14 .6 3 .6 13 .62003 . . . . . . . . . . . . . . . . . . . . . . . . . . . . . . . . . . . 100 .0 86 .4 72 .7 63 .4 10 .8 25 .5 10 .0 14 .5 3 .6 13 .62002 . . . . . . . . . . . . . . . . . . . . . . . . . . . . . . . . . . . 100 .0 87 .2 74 .1 64 .8 11 .1 24 .6 9 .3 14 .3 3 .4 12 .8
WHITE5
Number2001 . . . . . . . . . . . . . . . . . . . . . . . . . . . . . . . . . . . 230,071 201,345 172,479 151,035 24,925 55,448 20,504 32,878 7,801 28,72620003 . . . . . . . . . . . . . . . . . . . . . . . . . . . . . . . . . . 228,208 200,634 173,567 152,387 25,054 53,803 18,988 32,751 7,051 27,57419994 . . . . . . . . . . . . . . . . . . . . . . . . . . . . . . . . . . 225,794 197,767 171,111 149,351 25,730 52,776 18,199 32,208 6,821 28,027
Percent2001 . . . . . . . . . . . . . . . . . . . . . . . . . . . . . . . . . . . 100 .0 87 .5 75 .0 65 .6 10 .8 24 .1 8 .9 14 .3 3 .4 12 .520003 . . . . . . . . . . . . . . . . . . . . . . . . . . . . . . . . . . 100 .0 87 .9 76 .1 66 .8 11 .0 23 .6 8 .3 14 .4 3 .1 12 .119994 . . . . . . . . . . . . . . . . . . . . . . . . . . . . . . . . . . 100 .0 87 .6 75 .8 66 .1 11 .4 23 .4 8 .1 14 .3 3 .0 12 .4
See footnotes at end of table .
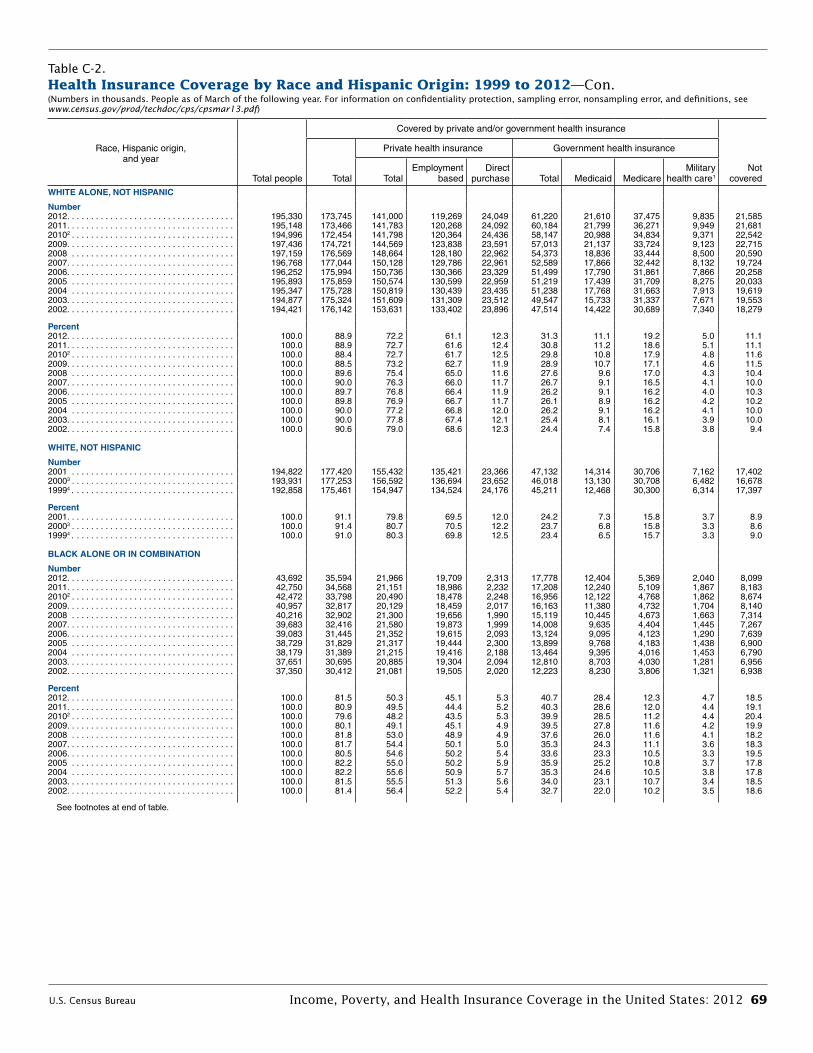
U.S. Census Bureau Income, Poverty, and Health Insurance Coverage in the United States: 2012 69
Table C-2.Health Insurance Coverage by Race and Hispanic origin: 1999 to 2012—Con .(Numbers in thousands. People as of March of the following year. For information on confidentiality protection, sampling error, nonsampling error, and definitions, see www.census.gov/prod/techdoc/cps/cpsmar13.pdf)
Race, Hispanic origin, and year
Total people
Covered by private and/or government health insurance
Not coveredTotal
Private health insurance Government health insurance
TotalEmployment
basedDirect
purchase Total Medicaid MedicareMilitary
health care1
WHITE ALONE, NOT HISPANIC
Number2012 . . . . . . . . . . . . . . . . . . . . . . . . . . . . . . . . . . . 195,330 173,745 141,000 119,269 24,049 61,220 21,610 37,475 9,835 21,5852011 . . . . . . . . . . . . . . . . . . . . . . . . . . . . . . . . . . . 195,148 173,466 141,783 120,268 24,092 60,184 21,799 36,271 9,949 21,68120102 . . . . . . . . . . . . . . . . . . . . . . . . . . . . . . . . . . 194,996 172,454 141,798 120,364 24,436 58,147 20,988 34,834 9,371 22,5422009 . . . . . . . . . . . . . . . . . . . . . . . . . . . . . . . . . . . 197,436 174,721 144,569 123,838 23,591 57,013 21,137 33,724 9,123 22,7152008 . . . . . . . . . . . . . . . . . . . . . . . . . . . . . . . . . . 197,159 176,569 148,664 128,180 22,962 54,373 18,836 33,444 8,500 20,5902007 . . . . . . . . . . . . . . . . . . . . . . . . . . . . . . . . . . . 196,768 177,044 150,128 129,786 22,961 52,589 17,866 32,442 8,132 19,7242006 . . . . . . . . . . . . . . . . . . . . . . . . . . . . . . . . . . . 196,252 175,994 150,736 130,366 23,329 51,499 17,790 31,861 7,866 20,2582005 . . . . . . . . . . . . . . . . . . . . . . . . . . . . . . . . . . 195,893 175,859 150,574 130,599 22,959 51,219 17,439 31,709 8,275 20,0332004 . . . . . . . . . . . . . . . . . . . . . . . . . . . . . . . . . . 195,347 175,728 150,819 130,439 23,435 51,238 17,768 31,663 7,913 19,6192003 . . . . . . . . . . . . . . . . . . . . . . . . . . . . . . . . . . . 194,877 175,324 151,609 131,309 23,512 49,547 15,733 31,337 7,671 19,5532002 . . . . . . . . . . . . . . . . . . . . . . . . . . . . . . . . . . . 194,421 176,142 153,631 133,402 23,896 47,514 14,422 30,689 7,340 18,279
Percent2012 . . . . . . . . . . . . . . . . . . . . . . . . . . . . . . . . . . . 100 .0 88 .9 72 .2 61 .1 12 .3 31 .3 11 .1 19 .2 5 .0 11 .12011 . . . . . . . . . . . . . . . . . . . . . . . . . . . . . . . . . . . 100 .0 88 .9 72 .7 61 .6 12 .4 30 .8 11 .2 18 .6 5 .1 11 .120102 . . . . . . . . . . . . . . . . . . . . . . . . . . . . . . . . . . 100 .0 88 .4 72 .7 61 .7 12 .5 29 .8 10 .8 17 .9 4 .8 11 .62009 . . . . . . . . . . . . . . . . . . . . . . . . . . . . . . . . . . . 100 .0 88 .5 73 .2 62 .7 11 .9 28 .9 10 .7 17 .1 4 .6 11 .52008 . . . . . . . . . . . . . . . . . . . . . . . . . . . . . . . . . . 100 .0 89 .6 75 .4 65 .0 11 .6 27 .6 9 .6 17 .0 4 .3 10 .42007 . . . . . . . . . . . . . . . . . . . . . . . . . . . . . . . . . . . 100 .0 90 .0 76 .3 66 .0 11 .7 26 .7 9 .1 16 .5 4 .1 10 .02006 . . . . . . . . . . . . . . . . . . . . . . . . . . . . . . . . . . . 100 .0 89 .7 76 .8 66 .4 11 .9 26 .2 9 .1 16 .2 4 .0 10 .32005 . . . . . . . . . . . . . . . . . . . . . . . . . . . . . . . . . . 100 .0 89 .8 76 .9 66 .7 11 .7 26 .1 8 .9 16 .2 4 .2 10 .22004 . . . . . . . . . . . . . . . . . . . . . . . . . . . . . . . . . . 100 .0 90 .0 77 .2 66 .8 12 .0 26 .2 9 .1 16 .2 4 .1 10 .02003 . . . . . . . . . . . . . . . . . . . . . . . . . . . . . . . . . . . 100 .0 90 .0 77 .8 67 .4 12 .1 25 .4 8 .1 16 .1 3 .9 10 .02002 . . . . . . . . . . . . . . . . . . . . . . . . . . . . . . . . . . . 100 .0 90 .6 79 .0 68 .6 12 .3 24 .4 7 .4 15 .8 3 .8 9 .4
WHITE, NOT HISPANIC
Number2001 . . . . . . . . . . . . . . . . . . . . . . . . . . . . . . . . . . 194,822 177,420 155,432 135,421 23,366 47,132 14,314 30,706 7,162 17,40220003 . . . . . . . . . . . . . . . . . . . . . . . . . . . . . . . . . . 193,931 177,253 156,592 136,694 23,652 46,018 13,130 30,708 6,482 16,67819994 . . . . . . . . . . . . . . . . . . . . . . . . . . . . . . . . . . 192,858 175,461 154,947 134,524 24,176 45,211 12,468 30,300 6,314 17,397
Percent2001 . . . . . . . . . . . . . . . . . . . . . . . . . . . . . . . . . . . 100 .0 91 .1 79 .8 69 .5 12 .0 24 .2 7 .3 15 .8 3 .7 8 .920003 . . . . . . . . . . . . . . . . . . . . . . . . . . . . . . . . . . 100 .0 91 .4 80 .7 70 .5 12 .2 23 .7 6 .8 15 .8 3 .3 8 .619994 . . . . . . . . . . . . . . . . . . . . . . . . . . . . . . . . . . 100 .0 91 .0 80 .3 69 .8 12 .5 23 .4 6 .5 15 .7 3 .3 9 .0
BLACK ALONE OR IN COMBINATION
Number2012 . . . . . . . . . . . . . . . . . . . . . . . . . . . . . . . . . . . 43,692 35,594 21,966 19,709 2,313 17,778 12,404 5,369 2,040 8,0992011 . . . . . . . . . . . . . . . . . . . . . . . . . . . . . . . . . . . 42,750 34,568 21,151 18,986 2,232 17,208 12,240 5,109 1,867 8,18320102 . . . . . . . . . . . . . . . . . . . . . . . . . . . . . . . . . . 42,472 33,798 20,490 18,478 2,248 16,956 12,122 4,768 1,862 8,6742009 . . . . . . . . . . . . . . . . . . . . . . . . . . . . . . . . . . . 40,957 32,817 20,129 18,459 2,017 16,163 11,380 4,732 1,704 8,1402008 . . . . . . . . . . . . . . . . . . . . . . . . . . . . . . . . . . 40,216 32,902 21,300 19,656 1,990 15,119 10,445 4,673 1,663 7,3142007 . . . . . . . . . . . . . . . . . . . . . . . . . . . . . . . . . . . 39,683 32,416 21,580 19,873 1,999 14,008 9,635 4,404 1,445 7,2672006 . . . . . . . . . . . . . . . . . . . . . . . . . . . . . . . . . . . 39,083 31,445 21,352 19,615 2,093 13,124 9,095 4,123 1,290 7,6392005 . . . . . . . . . . . . . . . . . . . . . . . . . . . . . . . . . . 38,729 31,829 21,317 19,444 2,300 13,899 9,768 4,183 1,438 6,9002004 . . . . . . . . . . . . . . . . . . . . . . . . . . . . . . . . . . 38,179 31,389 21,215 19,416 2,188 13,464 9,395 4,016 1,453 6,7902003 . . . . . . . . . . . . . . . . . . . . . . . . . . . . . . . . . . . 37,651 30,695 20,885 19,304 2,094 12,810 8,703 4,030 1,281 6,9562002 . . . . . . . . . . . . . . . . . . . . . . . . . . . . . . . . . . . 37,350 30,412 21,081 19,505 2,020 12,223 8,230 3,806 1,321 6,938
Percent2012 . . . . . . . . . . . . . . . . . . . . . . . . . . . . . . . . . . . 100 .0 81 .5 50 .3 45 .1 5 .3 40 .7 28 .4 12 .3 4 .7 18 .52011 . . . . . . . . . . . . . . . . . . . . . . . . . . . . . . . . . . . 100 .0 80 .9 49 .5 44 .4 5 .2 40 .3 28 .6 12 .0 4 .4 19 .120102 . . . . . . . . . . . . . . . . . . . . . . . . . . . . . . . . . . 100 .0 79 .6 48 .2 43 .5 5 .3 39 .9 28 .5 11 .2 4 .4 20 .42009 . . . . . . . . . . . . . . . . . . . . . . . . . . . . . . . . . . . 100 .0 80 .1 49 .1 45 .1 4 .9 39 .5 27 .8 11 .6 4 .2 19 .92008 . . . . . . . . . . . . . . . . . . . . . . . . . . . . . . . . . . 100 .0 81 .8 53 .0 48 .9 4 .9 37 .6 26 .0 11 .6 4 .1 18 .22007 . . . . . . . . . . . . . . . . . . . . . . . . . . . . . . . . . . . 100 .0 81 .7 54 .4 50 .1 5 .0 35 .3 24 .3 11 .1 3 .6 18 .32006 . . . . . . . . . . . . . . . . . . . . . . . . . . . . . . . . . . . 100 .0 80 .5 54 .6 50 .2 5 .4 33 .6 23 .3 10 .5 3 .3 19 .52005 . . . . . . . . . . . . . . . . . . . . . . . . . . . . . . . . . . 100 .0 82 .2 55 .0 50 .2 5 .9 35 .9 25 .2 10 .8 3 .7 17 .82004 . . . . . . . . . . . . . . . . . . . . . . . . . . . . . . . . . . 100 .0 82 .2 55 .6 50 .9 5 .7 35 .3 24 .6 10 .5 3 .8 17 .82003 . . . . . . . . . . . . . . . . . . . . . . . . . . . . . . . . . . . 100 .0 81 .5 55 .5 51 .3 5 .6 34 .0 23 .1 10 .7 3 .4 18 .52002 . . . . . . . . . . . . . . . . . . . . . . . . . . . . . . . . . . . 100 .0 81 .4 56 .4 52 .2 5 .4 32 .7 22 .0 10 .2 3 .5 18 .6
See footnotes at end of table .
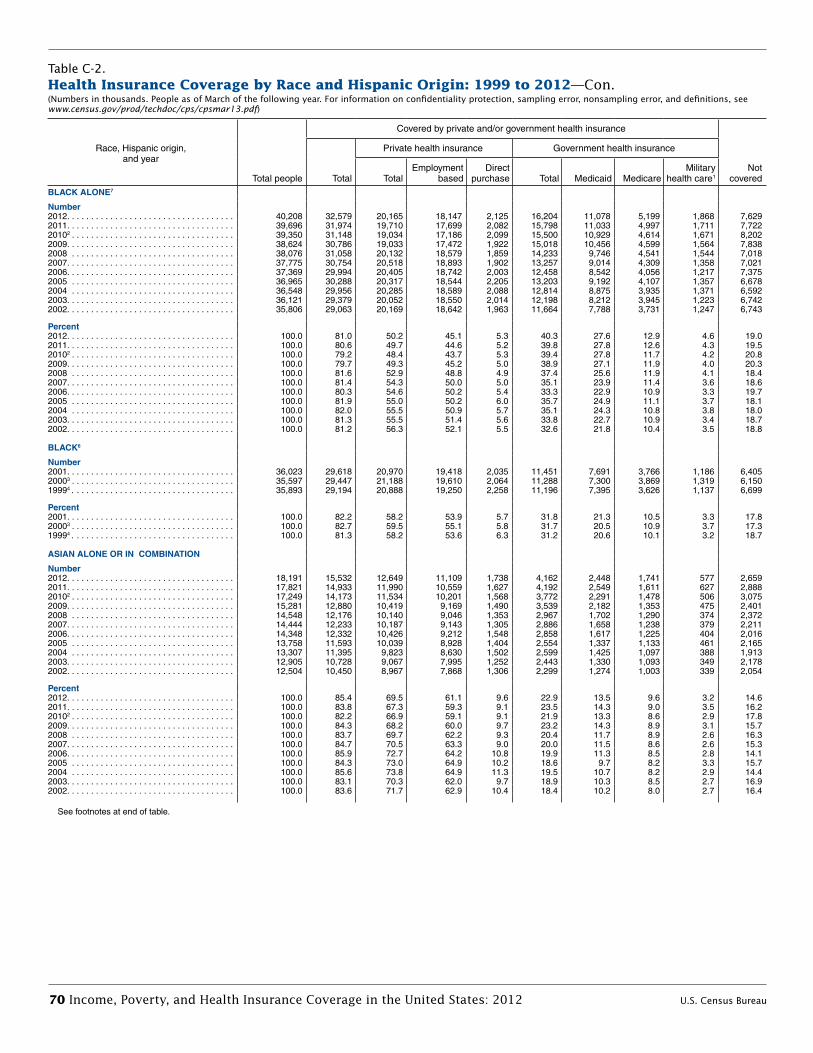
70 Income, Poverty, and Health Insurance Coverage in the United States: 2012 U.S. Census Bureau
Table C-2.Health Insurance Coverage by Race and Hispanic origin: 1999 to 2012—Con .(Numbers in thousands. People as of March of the following year. For information on confidentiality protection, sampling error, nonsampling error, and definitions, see www.census.gov/prod/techdoc/cps/cpsmar13.pdf)
Race, Hispanic origin, and year
Total people
Covered by private and/or government health insurance
Not coveredTotal
Private health insurance Government health insurance
TotalEmployment
basedDirect
purchase Total Medicaid MedicareMilitary
health care1
BLACK ALONE7
Number2012 . . . . . . . . . . . . . . . . . . . . . . . . . . . . . . . . . . . 40,208 32,579 20,165 18,147 2,125 16,204 11,078 5,199 1,868 7,6292011 . . . . . . . . . . . . . . . . . . . . . . . . . . . . . . . . . . . 39,696 31,974 19,710 17,699 2,082 15,798 11,033 4,997 1,711 7,72220102 . . . . . . . . . . . . . . . . . . . . . . . . . . . . . . . . . . 39,350 31,148 19,034 17,186 2,099 15,500 10,929 4,614 1,671 8,2022009 . . . . . . . . . . . . . . . . . . . . . . . . . . . . . . . . . . . 38,624 30,786 19,033 17,472 1,922 15,018 10,456 4,599 1,564 7,8382008 . . . . . . . . . . . . . . . . . . . . . . . . . . . . . . . . . . 38,076 31,058 20,132 18,579 1,859 14,233 9,746 4,541 1,544 7,0182007 . . . . . . . . . . . . . . . . . . . . . . . . . . . . . . . . . . . 37,775 30,754 20,518 18,893 1,902 13,257 9,014 4,309 1,358 7,0212006 . . . . . . . . . . . . . . . . . . . . . . . . . . . . . . . . . . . 37,369 29,994 20,405 18,742 2,003 12,458 8,542 4,056 1,217 7,3752005 . . . . . . . . . . . . . . . . . . . . . . . . . . . . . . . . . . 36,965 30,288 20,317 18,544 2,205 13,203 9,192 4,107 1,357 6,6782004 . . . . . . . . . . . . . . . . . . . . . . . . . . . . . . . . . . 36,548 29,956 20,285 18,589 2,088 12,814 8,875 3,935 1,371 6,5922003 . . . . . . . . . . . . . . . . . . . . . . . . . . . . . . . . . . . 36,121 29,379 20,052 18,550 2,014 12,198 8,212 3,945 1,223 6,7422002 . . . . . . . . . . . . . . . . . . . . . . . . . . . . . . . . . . . 35,806 29,063 20,169 18,642 1,963 11,664 7,788 3,731 1,247 6,743
Percent2012 . . . . . . . . . . . . . . . . . . . . . . . . . . . . . . . . . . . 100 .0 81 .0 50 .2 45 .1 5 .3 40 .3 27 .6 12 .9 4 .6 19 .02011 . . . . . . . . . . . . . . . . . . . . . . . . . . . . . . . . . . . 100 .0 80 .6 49 .7 44 .6 5 .2 39 .8 27 .8 12 .6 4 .3 19 .520102 . . . . . . . . . . . . . . . . . . . . . . . . . . . . . . . . . . 100 .0 79 .2 48 .4 43 .7 5 .3 39 .4 27 .8 11 .7 4 .2 20 .82009 . . . . . . . . . . . . . . . . . . . . . . . . . . . . . . . . . . . 100 .0 79 .7 49 .3 45 .2 5 .0 38 .9 27 .1 11 .9 4 .0 20 .32008 . . . . . . . . . . . . . . . . . . . . . . . . . . . . . . . . . . 100 .0 81 .6 52 .9 48 .8 4 .9 37 .4 25 .6 11 .9 4 .1 18 .42007 . . . . . . . . . . . . . . . . . . . . . . . . . . . . . . . . . . . 100 .0 81 .4 54 .3 50 .0 5 .0 35 .1 23 .9 11 .4 3 .6 18 .62006 . . . . . . . . . . . . . . . . . . . . . . . . . . . . . . . . . . . 100 .0 80 .3 54 .6 50 .2 5 .4 33 .3 22 .9 10 .9 3 .3 19 .72005 . . . . . . . . . . . . . . . . . . . . . . . . . . . . . . . . . . 100 .0 81 .9 55 .0 50 .2 6 .0 35 .7 24 .9 11 .1 3 .7 18 .12004 . . . . . . . . . . . . . . . . . . . . . . . . . . . . . . . . . . 100 .0 82 .0 55 .5 50 .9 5 .7 35 .1 24 .3 10 .8 3 .8 18 .02003 . . . . . . . . . . . . . . . . . . . . . . . . . . . . . . . . . . . 100 .0 81 .3 55 .5 51 .4 5 .6 33 .8 22 .7 10 .9 3 .4 18 .72002 . . . . . . . . . . . . . . . . . . . . . . . . . . . . . . . . . . . 100 .0 81 .2 56 .3 52 .1 5 .5 32 .6 21 .8 10 .4 3 .5 18 .8
BLACK6
Number2001 . . . . . . . . . . . . . . . . . . . . . . . . . . . . . . . . . . . 36,023 29,618 20,970 19,418 2,035 11,451 7,691 3,766 1,186 6,40520003 . . . . . . . . . . . . . . . . . . . . . . . . . . . . . . . . . . 35,597 29,447 21,188 19,610 2,064 11,288 7,300 3,869 1,319 6,15019994 . . . . . . . . . . . . . . . . . . . . . . . . . . . . . . . . . . 35,893 29,194 20,888 19,250 2,258 11,196 7,395 3,626 1,137 6,699
Percent2001 . . . . . . . . . . . . . . . . . . . . . . . . . . . . . . . . . . . 100 .0 82 .2 58 .2 53 .9 5 .7 31 .8 21 .3 10 .5 3 .3 17 .820003 . . . . . . . . . . . . . . . . . . . . . . . . . . . . . . . . . . 100 .0 82 .7 59 .5 55 .1 5 .8 31 .7 20 .5 10 .9 3 .7 17 .319994 . . . . . . . . . . . . . . . . . . . . . . . . . . . . . . . . . . 100 .0 81 .3 58 .2 53 .6 6 .3 31 .2 20 .6 10 .1 3 .2 18 .7
ASIAN ALONE OR IN COMBINATION
Number2012 . . . . . . . . . . . . . . . . . . . . . . . . . . . . . . . . . . . 18,191 15,532 12,649 11,109 1,738 4,162 2,448 1,741 577 2,6592011 . . . . . . . . . . . . . . . . . . . . . . . . . . . . . . . . . . . 17,821 14,933 11,990 10,559 1,627 4,192 2,549 1,611 627 2,88820102 . . . . . . . . . . . . . . . . . . . . . . . . . . . . . . . . . . 17,249 14,173 11,534 10,201 1,568 3,772 2,291 1,478 506 3,0752009 . . . . . . . . . . . . . . . . . . . . . . . . . . . . . . . . . . . 15,281 12,880 10,419 9,169 1,490 3,539 2,182 1,353 475 2,4012008 . . . . . . . . . . . . . . . . . . . . . . . . . . . . . . . . . . 14,548 12,176 10,140 9,046 1,353 2,967 1,702 1,290 374 2,3722007 . . . . . . . . . . . . . . . . . . . . . . . . . . . . . . . . . . . 14,444 12,233 10,187 9,143 1,305 2,886 1,658 1,238 379 2,2112006 . . . . . . . . . . . . . . . . . . . . . . . . . . . . . . . . . . . 14,348 12,332 10,426 9,212 1,548 2,858 1,617 1,225 404 2,0162005 . . . . . . . . . . . . . . . . . . . . . . . . . . . . . . . . . . 13,758 11,593 10,039 8,928 1,404 2,554 1,337 1,133 461 2,1652004 . . . . . . . . . . . . . . . . . . . . . . . . . . . . . . . . . . 13,307 11,395 9,823 8,630 1,502 2,599 1,425 1,097 388 1,9132003 . . . . . . . . . . . . . . . . . . . . . . . . . . . . . . . . . . . 12,905 10,728 9,067 7,995 1,252 2,443 1,330 1,093 349 2,1782002 . . . . . . . . . . . . . . . . . . . . . . . . . . . . . . . . . . . 12,504 10,450 8,967 7,868 1,306 2,299 1,274 1,003 339 2,054
Percent2012 . . . . . . . . . . . . . . . . . . . . . . . . . . . . . . . . . . . 100 .0 85 .4 69 .5 61 .1 9 .6 22 .9 13 .5 9 .6 3 .2 14 .62011 . . . . . . . . . . . . . . . . . . . . . . . . . . . . . . . . . . . 100 .0 83 .8 67 .3 59 .3 9 .1 23 .5 14 .3 9 .0 3 .5 16 .220102 . . . . . . . . . . . . . . . . . . . . . . . . . . . . . . . . . . 100 .0 82 .2 66 .9 59 .1 9 .1 21 .9 13 .3 8 .6 2 .9 17 .82009 . . . . . . . . . . . . . . . . . . . . . . . . . . . . . . . . . . . 100 .0 84 .3 68 .2 60 .0 9 .7 23 .2 14 .3 8 .9 3 .1 15 .72008 . . . . . . . . . . . . . . . . . . . . . . . . . . . . . . . . . . 100 .0 83 .7 69 .7 62 .2 9 .3 20 .4 11 .7 8 .9 2 .6 16 .32007 . . . . . . . . . . . . . . . . . . . . . . . . . . . . . . . . . . . 100 .0 84 .7 70 .5 63 .3 9 .0 20 .0 11 .5 8 .6 2 .6 15 .32006 . . . . . . . . . . . . . . . . . . . . . . . . . . . . . . . . . . . 100 .0 85 .9 72 .7 64 .2 10 .8 19 .9 11 .3 8 .5 2 .8 14 .12005 . . . . . . . . . . . . . . . . . . . . . . . . . . . . . . . . . . 100 .0 84 .3 73 .0 64 .9 10 .2 18 .6 9 .7 8 .2 3 .3 15 .72004 . . . . . . . . . . . . . . . . . . . . . . . . . . . . . . . . . . 100 .0 85 .6 73 .8 64 .9 11 .3 19 .5 10 .7 8 .2 2 .9 14 .42003 . . . . . . . . . . . . . . . . . . . . . . . . . . . . . . . . . . . 100 .0 83 .1 70 .3 62 .0 9 .7 18 .9 10 .3 8 .5 2 .7 16 .92002 . . . . . . . . . . . . . . . . . . . . . . . . . . . . . . . . . . . 100 .0 83 .6 71 .7 62 .9 10 .4 18 .4 10 .2 8 .0 2 .7 16 .4
See footnotes at end of table .

U.S. Census Bureau Income, Poverty, and Health Insurance Coverage in the United States: 2012 71
Table C-2.Health Insurance Coverage by Race and Hispanic origin: 1999 to 2012—Con .(Numbers in thousands. People as of March of the following year. For information on confidentiality protection, sampling error, nonsampling error, and definitions, see www.census.gov/prod/techdoc/cps/cpsmar13.pdf)
Race, Hispanic origin, and year
Total people
Covered by private and/or government health insurance
Not coveredTotal
Private health insurance Government health insurance
TotalEmployment
basedDirect
purchase Total Medicaid MedicareMilitary
health care1
ASIAN ALONE8
Number2012 . . . . . . . . . . . . . . . . . . . . . . . . . . . . . . . . . . . 16,433 13,956 11,388 9,973 1,632 3,715 2,199 1,697 391 2,4772011 . . . . . . . . . . . . . . . . . . . . . . . . . . . . . . . . . . . 16,094 13,398 10,715 9,436 1,498 3,760 2,277 1,574 476 2,69620102 . . . . . . . . . . . . . . . . . . . . . . . . . . . . . . . . . . 15,619 12,738 10,352 9,158 1,437 3,380 2,022 1,433 378 2,8812009 . . . . . . . . . . . . . . . . . . . . . . . . . . . . . . . . . . . 14,011 11,694 9,459 8,298 1,401 3,196 1,966 1,304 368 2,3172008 . . . . . . . . . . . . . . . . . . . . . . . . . . . . . . . . . . 13,315 11,081 9,219 8,189 1,270 2,708 1,540 1,258 292 2,2332007 . . . . . . . . . . . . . . . . . . . . . . . . . . . . . . . . . . . 13,268 11,137 9,252 8,294 1,201 2,648 1,526 1,195 296 2,1312006 . . . . . . . . . . . . . . . . . . . . . . . . . . . . . . . . . . . 13,194 11,289 9,539 8,377 1,475 2,635 1,482 1,185 335 1,9052005 . . . . . . . . . . . . . . . . . . . . . . . . . . . . . . . . . . 12,599 10,556 9,156 8,106 1,337 2,296 1,206 1,103 353 2,0432004 . . . . . . . . . . . . . . . . . . . . . . . . . . . . . . . . . . 12,241 10,442 9,001 7,901 1,407 2,383 1,302 1,066 316 1,7992003 . . . . . . . . . . . . . . . . . . . . . . . . . . . . . . . . . . . 11,869 9,818 8,326 7,327 1,170 2,208 1,177 1,063 288 2,0512002 . . . . . . . . . . . . . . . . . . . . . . . . . . . . . . . . . . . 11,558 9,591 8,239 7,191 1,253 2,089 1,148 982 260 1,968
Percent2012 . . . . . . . . . . . . . . . . . . . . . . . . . . . . . . . . . . . 100 .0 84 .9 69 .3 60 .7 9 .9 22 .6 13 .4 10 .3 2 .4 15 .12011 . . . . . . . . . . . . . . . . . . . . . . . . . . . . . . . . . . . 100 .0 83 .3 66 .6 58 .6 9 .3 23 .4 14 .2 9 .8 3 .0 16 .820102 . . . . . . . . . . . . . . . . . . . . . . . . . . . . . . . . . . 100 .0 81 .6 66 .3 58 .6 9 .2 21 .6 12 .9 9 .2 2 .4 18 .42009 . . . . . . . . . . . . . . . . . . . . . . . . . . . . . . . . . . . 100 .0 83 .5 67 .5 59 .2 10 .0 22 .8 14 .0 9 .3 2 .6 16 .52008 . . . . . . . . . . . . . . . . . . . . . . . . . . . . . . . . . . 100 .0 83 .2 69 .2 61 .5 9 .5 20 .3 11 .6 9 .5 2 .2 16 .82007 . . . . . . . . . . . . . . . . . . . . . . . . . . . . . . . . . . . 100 .0 83 .9 69 .7 62 .5 9 .1 20 .0 11 .5 9 .0 2 .2 16 .12006 . . . . . . . . . . . . . . . . . . . . . . . . . . . . . . . . . . . 100 .0 85 .6 72 .3 63 .5 11 .2 20 .0 11 .2 9 .0 2 .5 14 .42005 . . . . . . . . . . . . . . . . . . . . . . . . . . . . . . . . . . 100 .0 83 .8 72 .7 64 .3 10 .6 18 .2 9 .6 8 .8 2 .8 16 .22004 . . . . . . . . . . . . . . . . . . . . . . . . . . . . . . . . . . 100 .0 85 .3 73 .5 64 .5 11 .5 19 .5 10 .6 8 .7 2 .6 14 .72003 . . . . . . . . . . . . . . . . . . . . . . . . . . . . . . . . . . . 100 .0 82 .7 70 .2 61 .7 9 .9 18 .6 9 .9 9 .0 2 .4 17 .32002 . . . . . . . . . . . . . . . . . . . . . . . . . . . . . . . . . . . 100 .0 83 .0 71 .3 62 .2 10 .8 18 .1 9 .9 8 .5 2 .2 17 .0
ASIAN AND PACIFIC ISLANDER6
Number2001 . . . . . . . . . . . . . . . . . . . . . . . . . . . . . . . . . . . 12,500 10,467 8,949 7,942 1,259 2,265 1,179 921 435 2,03220003 . . . . . . . . . . . . . . . . . . . . . . . . . . . . . . . . . . 12,693 10,578 9,207 8,382 1,115 2,207 1,184 893 451 2,11519994 . . . . . . . . . . . . . . . . . . . . . . . . . . . . . . . . . . 11,964 9,932 8,520 7,593 1,130 2,196 1,067 893 507 2,033
Percent2001 . . . . . . . . . . . . . . . . . . . . . . . . . . . . . . . . . . . 100 .0 83 .7 71 .6 63 .5 10 .1 18 .1 9 .4 7 .4 3 .5 16 .320003 . . . . . . . . . . . . . . . . . . . . . . . . . . . . . . . . . . 100 .0 83 .3 72 .5 66 .0 8 .8 17 .4 9 .3 7 .0 3 .6 16 .719994 . . . . . . . . . . . . . . . . . . . . . . . . . . . . . . . . . . 100 .0 83 .0 71 .2 63 .5 9 .4 18 .4 8 .9 7 .5 4 .2 17 .0
HISPANIC (of any race)
Number2012 . . . . . . . . . . . . . . . . . . . . . . . . . . . . . . . . . . . 53,230 37,729 22,679 20,383 2,396 18,106 14,591 3,941 1,120 15,5002011 . . . . . . . . . . . . . . . . . . . . . . . . . . . . . . . . . . . 52,358 36,582 21,743 19,799 2,133 17,770 14,437 3,563 1,157 15,77620102 . . . . . . . . . . . . . . . . . . . . . . . . . . . . . . . . . . 51,074 35,408 21,479 19,647 1,954 16,542 13,320 3,539 1,076 15,6672009 . . . . . . . . . . . . . . . . . . . . . . . . . . . . . . . . . . . 48,901 33,451 19,886 18,184 1,844 16,015 12,968 3,273 989 15,4502008 . . . . . . . . . . . . . . . . . . . . . . . . . . . . . . . . . . 47,485 33,331 21,174 19,461 2,026 14,460 11,570 3,218 898 14,1542007 . . . . . . . . . . . . . . . . . . . . . . . . . . . . . . . . . . . 46,026 31,528 20,544 18,854 2,041 13,047 10,371 2,887 801 14,4982006 . . . . . . . . . . . . . . . . . . . . . . . . . . . . . . . . . . . 44,854 30,001 19,954 18,375 1,875 12,225 9,668 2,754 810 14,8532005 . . . . . . . . . . . . . . . . . . . . . . . . . . . . . . . . . . 43,168 29,645 19,797 18,094 2,115 11,963 9,365 2,770 869 13,5232004 . . . . . . . . . . . . . . . . . . . . . . . . . . . . . . . . . . 41,840 28,933 19,621 18,065 1,834 11,448 9,147 2,610 670 12,9072003 . . . . . . . . . . . . . . . . . . . . . . . . . . . . . . . . . . . 40,425 27,557 18,735 17,234 1,759 10,664 8,320 2,466 675 12,8672002 . . . . . . . . . . . . . . . . . . . . . . . . . . . . . . . . . . . 39,384 27,259 18,913 17,439 1,801 10,119 7,731 2,529 707 12,1252001 . . . . . . . . . . . . . . . . . . . . . . . . . . . . . . . . . . . 37,438 25,528 18,052 16,523 1,654 9,014 6,767 2,277 698 11,91020003 . . . . . . . . . . . . . . . . . . . . . . . . . . . . . . . . . . 36,093 24,754 17,904 16,541 1,525 8,336 6,288 2,132 633 11,33819994 . . . . . . . . . . . . . . . . . . . . . . . . . . . . . . . . . . 34,773 23,668 17,074 15,672 1,619 8,109 6,175 1,999 554 11,105
Percent2012 . . . . . . . . . . . . . . . . . . . . . . . . . . . . . . . . . . . 100 .0 70 .9 42 .6 38 .3 4 .5 34 .0 27 .4 7 .4 2 .1 29 .12011 . . . . . . . . . . . . . . . . . . . . . . . . . . . . . . . . . . . 100 .0 69 .9 41 .5 37 .8 4 .1 33 .9 27 .6 6 .8 2 .2 30 .120102 . . . . . . . . . . . . . . . . . . . . . . . . . . . . . . . . . . 100 .0 69 .3 42 .1 38 .5 3 .8 32 .4 26 .1 6 .9 2 .1 30 .72009 . . . . . . . . . . . . . . . . . . . . . . . . . . . . . . . . . . . 100 .0 68 .4 40 .7 37 .2 3 .8 32 .7 26 .5 6 .7 2 .0 31 .62008 . . . . . . . . . . . . . . . . . . . . . . . . . . . . . . . . . . 100 .0 70 .2 44 .6 41 .0 4 .3 30 .5 24 .4 6 .8 1 .9 29 .82007 . . . . . . . . . . . . . . . . . . . . . . . . . . . . . . . . . . . 100 .0 68 .5 44 .6 41 .0 4 .4 28 .3 22 .5 6 .3 1 .7 31 .52006 . . . . . . . . . . . . . . . . . . . . . . . . . . . . . . . . . . . 100 .0 66 .9 44 .5 41 .0 4 .2 27 .3 21 .6 6 .1 1 .8 33 .12005 . . . . . . . . . . . . . . . . . . . . . . . . . . . . . . . . . . 100 .0 68 .7 45 .9 41 .9 4 .9 27 .7 21 .7 6 .4 2 .0 31 .32004 . . . . . . . . . . . . . . . . . . . . . . . . . . . . . . . . . . 100 .0 69 .2 46 .9 43 .2 4 .4 27 .4 21 .9 6 .2 1 .6 30 .82003 . . . . . . . . . . . . . . . . . . . . . . . . . . . . . . . . . . . 100 .0 68 .2 46 .3 42 .6 4 .4 26 .4 20 .6 6 .1 1 .7 31 .82002 . . . . . . . . . . . . . . . . . . . . . . . . . . . . . . . . . . . 100 .0 69 .2 48 .0 44 .3 4 .6 25 .7 19 .6 6 .4 1 .8 30 .82001 . . . . . . . . . . . . . . . . . . . . . . . . . . . . . . . . . . . 100 .0 68 .2 48 .2 44 .1 4 .4 24 .1 18 .1 6 .1 1 .9 31 .820003 . . . . . . . . . . . . . . . . . . . . . . . . . . . . . . . . . . 100 .0 68 .6 49 .6 45 .8 4 .2 23 .1 17 .4 5 .9 1 .8 31 .419994 . . . . . . . . . . . . . . . . . . . . . . . . . . . . . . . . . . 100 .0 68 .1 49 .1 45 .1 4 .7 23 .3 17 .8 5 .7 1 .6 31 .9
1 Military health care includes Tricare and CHAMPVA (Civilian Health and Medical Program of the Department of Veterans Affairs), as well as care provided by the Health and Medical Program of the Department of Veterans Affairs and care provided by the Department of Veterans Affairs and the military .2 Implementation of Census 2010-based population controls .3 Implementation of a 28,000 household sample expansion . 4 The data for 1999 through 2009 were revised to reflect the results of enhancements to the editing process . See <www .census .gov/hhes/www/hlthins/data/usernote/index .html> .5 The 2003 CPS asked respondents to choose one or more races . White alone refers to people who reported White and did not report any other race category . The use of this single-race population does
not imply that it is the preferred method of presenting or analyzing data . The Census Bureau uses a variety of approaches . Information on people who reported more than one race, such as White and American Indian and Alaska Native or Asian and Black or African American, is available from the 2010 Census through American FactFinder . About 2 .9 percent of people reported more than one race in the 2010 Census .
6 The 2001 CPS and earlier years asked respondents to report only one race . The reference groups for these years are White, White not Hispanic, Black, and Asian and Pacific Islander . 7 Black alone refers to people who reported Black or African American and did not report any other race . 8 Asian alone refers to people who reported Asian and did not report any other race . Note: All years reflect the implementation of the verification question . Source: U .S . Census Bureau, Current Population Survey, 2000 to 2013 Annual Social and Economic Supplements .

72 Income, Poverty, and Health Insurance Coverage in the United States: 2012 U.S. Census Bureau
Table C-3. Health Insurance Coverage by Age: 1999 to 2012—Con .(Numbers in thousands. People as of March of the following year. For information on confidentiality protection, sampling error, nonsampling error, and definitions, see www.census.gov/prod/techdoc/cps/cpsmar13.pdf)
AgeTotal
people
Covered by private and/or government health insurance
Notcovered
Private health insurance Government health insurance
Total TotalEmployment
basedDirect
purchase Total Medicaid MedicareMilitary
health care1
ALL AGES
Number2012 . . . . . . . . . . . . . . . . . . . . . . . . . . . . . . . 311,116 263,165 198,812 170,877 30,622 101,493 50,903 48,884 13,702 47,9512011 . . . . . . . . . . . . . . . . . . . . . . . . . . . . . . . 308,827 260,214 197,323 170,102 30,244 99,497 50,835 46,922 13,712 48,61420102 . . . . . . . . . . . . . . . . . . . . . . . . . . . . . . 306,553 256,603 196,147 169,372 30,347 95,525 48,533 44,906 12,927 49,9512009 . . . . . . . . . . . . . . . . . . . . . . . . . . . . . . . 304,280 255,295 196,245 170,762 29,098 93,245 47,847 43,434 12,414 48,9852008 . . . . . . . . . . . . . . . . . . . . . . . . . . . . . . . 301,483 256,702 202,626 177,543 28,513 87,586 42,831 43,031 11,562 44,7802007 . . . . . . . . . . . . . . . . . . . . . . . . . . . . . . . 299,106 255,018 203,903 178,971 28,500 83,147 39,685 41,387 10,955 44,0882006 . . . . . . . . . . . . . . . . . . . . . . . . . . . . . . . 296,824 251,610 203,942 178,880 29,033 80,343 38,370 40,336 10,543 45,2142005 . . . . . . . . . . . . . . . . . . . . . . . . . . . . . . . 293,834 250,799 203,205 178,391 28,980 80,283 38,191 40,167 11,164 43,0352004 . . . . . . . . . . . . . . . . . . . . . . . . . . . . . . . 291,166 249,414 203,014 177,924 29,161 79,480 38,055 39,757 10,584 41,7522003 . . . . . . . . . . . . . . . . . . . . . . . . . . . . . . . 288,280 246,332 201,989 177,362 28,826 76,116 34,326 39,284 10,124 41,9492002 . . . . . . . . . . . . . . . . . . . . . . . . . . . . . . . 285,933 246,157 204,163 179,563 29,287 72,825 31,934 38,359 9,892 39,7762001 . . . . . . . . . . . . . . . . . . . . . . . . . . . . . . . 282,082 244,059 204,142 179,984 28,398 70,330 30,166 37,870 9,580 38,02320003 . . . . . . . . . . . . . . . . . . . . . . . . . . . . . . 279,517 242,932 205,575 181,862 28,432 68,183 28,062 37,787 8,937 36,58619994,5 . . . . . . . . . . . . . . . . . . . . . . . . . . . . . 276,804 239,102 202,021 177,535 29,310 67,103 27,353 36,990 8,526 37,702
Percent2012 . . . . . . . . . . . . . . . . . . . . . . . . . . . . . . . 100 .0 84 .6 63 .9 54 .9 9 .8 32 .6 16 .4 15 .7 4 .4 15 .42011 . . . . . . . . . . . . . . . . . . . . . . . . . . . . . . . 100 .0 84 .3 63 .9 55 .1 9 .8 32 .2 16 .5 15 .2 4 .4 15 .720102 . . . . . . . . . . . . . . . . . . . . . . . . . . . . . . 100 .0 83 .7 64 .0 55 .3 9 .9 31 .2 15 .8 14 .6 4 .2 16 .32009 . . . . . . . . . . . . . . . . . . . . . . . . . . . . . . . 100 .0 83 .9 64 .5 56 .1 9 .6 30 .6 15 .7 14 .3 4 .1 16 .12008 . . . . . . . . . . . . . . . . . . . . . . . . . . . . . . . 100 .0 85 .1 67 .2 58 .9 9 .5 29 .1 14 .2 14 .3 3 .8 14 .92007 . . . . . . . . . . . . . . . . . . . . . . . . . . . . . . . 100 .0 85 .3 68 .2 59 .8 9 .5 27 .8 13 .3 13 .8 3 .7 14 .72006 . . . . . . . . . . . . . . . . . . . . . . . . . . . . . . . 100 .0 84 .8 68 .7 60 .3 9 .8 27 .1 12 .9 13 .6 3 .6 15 .22005 . . . . . . . . . . . . . . . . . . . . . . . . . . . . . . . 100 .0 85 .4 69 .2 60 .7 9 .9 27 .3 13 .0 13 .7 3 .8 14 .62004 . . . . . . . . . . . . . . . . . . . . . . . . . . . . . . . 100 .0 85 .7 69 .7 61 .1 10 .0 27 .3 13 .1 13 .7 3 .6 14 .32003 . . . . . . . . . . . . . . . . . . . . . . . . . . . . . . . 100 .0 85 .4 70 .1 61 .5 10 .0 26 .4 11 .9 13 .6 3 .5 14 .62002 . . . . . . . . . . . . . . . . . . . . . . . . . . . . . . . 100 .0 86 .1 71 .4 62 .8 10 .2 25 .5 11 .2 13 .4 3 .5 13 .92001 . . . . . . . . . . . . . . . . . . . . . . . . . . . . . . . 100 .0 86 .5 72 .4 63 .8 10 .1 24 .9 10 .7 13 .4 3 .4 13 .520003 . . . . . . . . . . . . . . . . . . . . . . . . . . . . . . 100 .0 86 .9 73 .5 65 .1 10 .2 24 .4 10 .0 13 .5 3 .2 13 .119994,5 . . . . . . . . . . . . . . . . . . . . . . . . . . . . . 100 .0 86 .4 73 .0 64 .1 10 .6 24 .2 9 .9 13 .4 3 .1 13 .6
UNDER 18 YEARS
Number2012 . . . . . . . . . . . . . . . . . . . . . . . . . . . . . . . 74,187 67,601 44,586 41,095 4,325 29,055 26,610 764 2,595 6,5862011 . . . . . . . . . . . . . . . . . . . . . . . . . . . . . . . 74,108 67,143 44,047 40,561 4,254 28,747 26,345 611 2,586 6,96420102 . . . . . . . . . . . . . . . . . . . . . . . . . . . . . . 74,296 67,026 44,252 40,730 4,254 28,158 25,858 596 2,442 7,2702009 . . . . . . . . . . . . . . . . . . . . . . . . . . . . . . . 75,040 67,727 45,401 41,873 4,313 27,603 25,329 545 2,367 7,3132008 . . . . . . . . . . . . . . . . . . . . . . . . . . . . . . . 74,510 67,411 47,372 43,887 4,323 24,808 22,602 623 2,241 7,0992007 . . . . . . . . . . . . . . . . . . . . . . . . . . . . . . . 74,403 66,525 48,039 44,479 4,376 23,086 20,958 518 2,101 7,8772006 . . . . . . . . . . . . . . . . . . . . . . . . . . . . . . . 74,101 65,779 48,285 44,565 4,377 22,137 20,098 411 2,051 8,3222005 . . . . . . . . . . . . . . . . . . . . . . . . . . . . . . . 73,985 66,349 49,082 45,277 4,584 21,974 19,766 534 2,264 7,6362004 . . . . . . . . . . . . . . . . . . . . . . . . . . . . . . . 73,791 66,454 49,518 45,643 4,656 21,943 19,866 489 2,040 7,3372003 . . . . . . . . . . . . . . . . . . . . . . . . . . . . . . . 73,580 65,933 49,290 45,596 4,445 21,386 19,331 476 2,088 7,6482002 . . . . . . . . . . . . . . . . . . . . . . . . . . . . . . . 73,312 65,767 50,554 47,023 4,441 19,571 17,468 514 2,103 7,5452001 . . . . . . . . . . . . . . . . . . . . . . . . . . . . . . . 72,628 64,893 50,537 47,070 4,235 18,725 16,391 389 2,414 7,73520003 . . . . . . . . . . . . . . . . . . . . . . . . . . . . . . 72,314 64,558 51,505 48,269 4,189 17,466 14,931 510 2,496 7,75619994,5 . . . . . . . . . . . . . . . . . . . . . . . . . . . . . 72,281 63,640 50,881 47,172 4,818 16,808 14,754 384 1,991 8,641
Percent2012 . . . . . . . . . . . . . . . . . . . . . . . . . . . . . . . 100 .0 91 .1 60 .1 55 .4 5 .8 39 .2 35 .9 1 .0 3 .5 8 .92011 . . . . . . . . . . . . . . . . . . . . . . . . . . . . . . . 100 .0 90 .6 59 .4 54 .7 5 .7 38 .8 35 .6 0 .8 3 .5 9 .420102 . . . . . . . . . . . . . . . . . . . . . . . . . . . . . . 100 .0 90 .2 59 .6 54 .8 5 .7 37 .9 34 .8 0 .8 3 .3 9 .82009 . . . . . . . . . . . . . . . . . . . . . . . . . . . . . . . 100 .0 90 .3 60 .5 55 .8 5 .7 36 .8 33 .8 0 .7 3 .2 9 .72008 . . . . . . . . . . . . . . . . . . . . . . . . . . . . . . . 100 .0 90 .5 63 .6 58 .9 5 .8 33 .3 30 .3 0 .8 3 .0 9 .52007 . . . . . . . . . . . . . . . . . . . . . . . . . . . . . . . 100 .0 89 .4 64 .6 59 .8 5 .9 31 .0 28 .2 0 .7 2 .8 10 .62006 . . . . . . . . . . . . . . . . . . . . . . . . . . . . . . . 100 .0 88 .8 65 .2 60 .1 5 .9 29 .9 27 .1 0 .6 2 .8 11 .22005 . . . . . . . . . . . . . . . . . . . . . . . . . . . . . . . 100 .0 89 .7 66 .3 61 .2 6 .2 29 .7 26 .7 0 .7 3 .1 10 .32004 . . . . . . . . . . . . . . . . . . . . . . . . . . . . . . . 100 .0 90 .1 67 .1 61 .9 6 .3 29 .7 26 .9 0 .7 2 .8 9 .92003 . . . . . . . . . . . . . . . . . . . . . . . . . . . . . . . 100 .0 89 .6 67 .0 62 .0 6 .0 29 .1 26 .3 0 .6 2 .8 10 .42002 . . . . . . . . . . . . . . . . . . . . . . . . . . . . . . . 100 .0 89 .7 69 .0 64 .1 6 .1 26 .7 23 .8 0 .7 2 .9 10 .32001 . . . . . . . . . . . . . . . . . . . . . . . . . . . . . . . 100 .0 89 .4 69 .6 64 .8 5 .8 25 .8 22 .6 0 .5 3 .3 10 .620003 . . . . . . . . . . . . . . . . . . . . . . . . . . . . . . 100 .0 89 .3 71 .2 66 .7 5 .8 24 .2 20 .6 0 .7 3 .5 10 .719994,5 . . . . . . . . . . . . . . . . . . . . . . . . . . . . . 100 .0 88 .0 70 .4 65 .3 6 .7 23 .3 20 .4 0 .5 2 .8 12 .0
See footnotes at end of table .
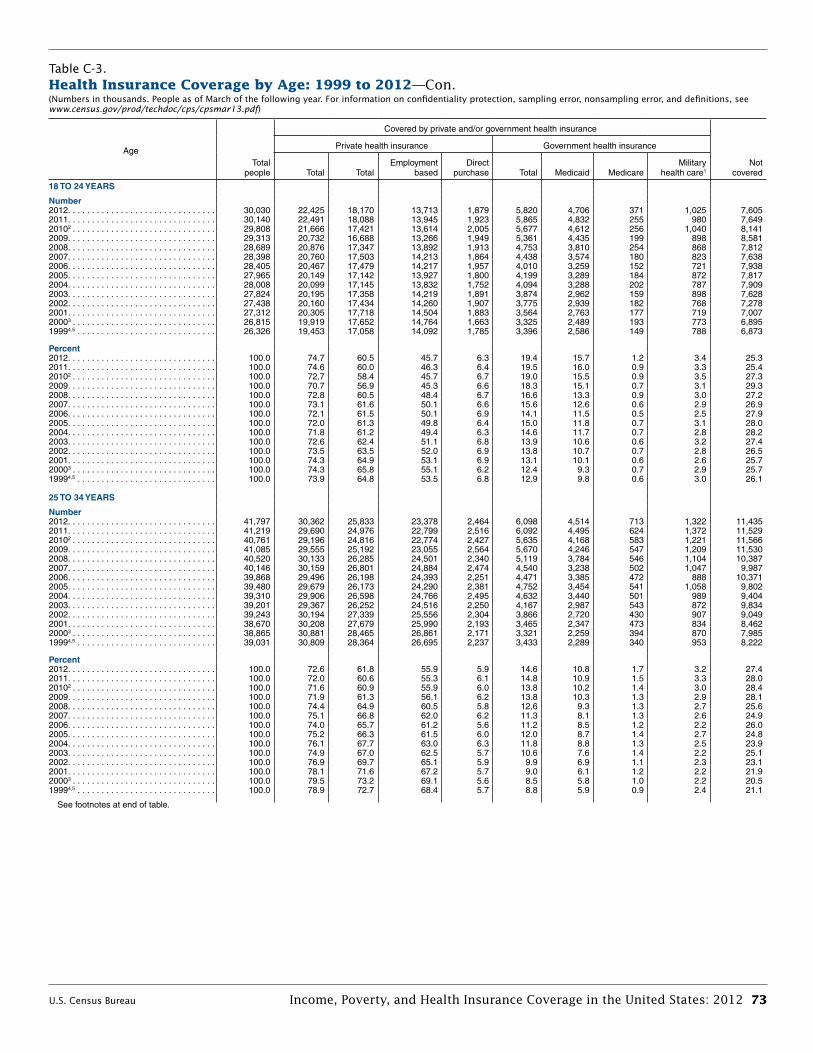
U.S. Census Bureau Income, Poverty, and Health Insurance Coverage in the United States: 2012 73
Table C-3. Health Insurance Coverage by Age: 1999 to 2012—Con .(Numbers in thousands. People as of March of the following year. For information on confidentiality protection, sampling error, nonsampling error, and definitions, see www.census.gov/prod/techdoc/cps/cpsmar13.pdf)
AgeTotal
people
Covered by private and/or government health insurance
Notcovered
Private health insurance Government health insurance
Total TotalEmployment
basedDirect
purchase Total Medicaid MedicareMilitary
health care1
18 TO 24 YEARS
Number2012 . . . . . . . . . . . . . . . . . . . . . . . . . . . . . . . 30,030 22,425 18,170 13,713 1,879 5,820 4,706 371 1,025 7,6052011 . . . . . . . . . . . . . . . . . . . . . . . . . . . . . . . 30,140 22,491 18,088 13,945 1,923 5,865 4,832 255 980 7,64920102 . . . . . . . . . . . . . . . . . . . . . . . . . . . . . . 29,808 21,666 17,421 13,614 2,005 5,677 4,612 256 1,040 8,1412009 . . . . . . . . . . . . . . . . . . . . . . . . . . . . . . . 29,313 20,732 16,688 13,266 1,949 5,361 4,435 199 898 8,5812008 . . . . . . . . . . . . . . . . . . . . . . . . . . . . . . . 28,689 20,876 17,347 13,892 1,913 4,753 3,810 254 868 7,8122007 . . . . . . . . . . . . . . . . . . . . . . . . . . . . . . . 28,398 20,760 17,503 14,213 1,864 4,438 3,574 180 823 7,6382006 . . . . . . . . . . . . . . . . . . . . . . . . . . . . . . . 28,405 20,467 17,479 14,217 1,957 4,010 3,259 152 721 7,9382005 . . . . . . . . . . . . . . . . . . . . . . . . . . . . . . . 27,965 20,149 17,142 13,927 1,800 4,199 3,289 184 872 7,8172004 . . . . . . . . . . . . . . . . . . . . . . . . . . . . . . . 28,008 20,099 17,145 13,832 1,752 4,094 3,288 202 787 7,9092003 . . . . . . . . . . . . . . . . . . . . . . . . . . . . . . . 27,824 20,195 17,358 14,219 1,891 3,874 2,962 159 898 7,6282002 . . . . . . . . . . . . . . . . . . . . . . . . . . . . . . . 27,438 20,160 17,434 14,260 1,907 3,775 2,939 182 768 7,2782001 . . . . . . . . . . . . . . . . . . . . . . . . . . . . . . . 27,312 20,305 17,718 14,504 1,883 3,564 2,763 177 719 7,00720003 . . . . . . . . . . . . . . . . . . . . . . . . . . . . . . 26,815 19,919 17,652 14,764 1,663 3,325 2,489 193 773 6,89519994,5 . . . . . . . . . . . . . . . . . . . . . . . . . . . . . 26,326 19,453 17,058 14,092 1,785 3,396 2,586 149 788 6,873
Percent2012 . . . . . . . . . . . . . . . . . . . . . . . . . . . . . . . 100 .0 74 .7 60 .5 45 .7 6 .3 19 .4 15 .7 1 .2 3 .4 25 .32011 . . . . . . . . . . . . . . . . . . . . . . . . . . . . . . . 100 .0 74 .6 60 .0 46 .3 6 .4 19 .5 16 .0 0 .9 3 .3 25 .420102 . . . . . . . . . . . . . . . . . . . . . . . . . . . . . . 100 .0 72 .7 58 .4 45 .7 6 .7 19 .0 15 .5 0 .9 3 .5 27 .32009 . . . . . . . . . . . . . . . . . . . . . . . . . . . . . . . 100 .0 70 .7 56 .9 45 .3 6 .6 18 .3 15 .1 0 .7 3 .1 29 .32008 . . . . . . . . . . . . . . . . . . . . . . . . . . . . . . . 100 .0 72 .8 60 .5 48 .4 6 .7 16 .6 13 .3 0 .9 3 .0 27 .22007 . . . . . . . . . . . . . . . . . . . . . . . . . . . . . . . 100 .0 73 .1 61 .6 50 .1 6 .6 15 .6 12 .6 0 .6 2 .9 26 .92006 . . . . . . . . . . . . . . . . . . . . . . . . . . . . . . . 100 .0 72 .1 61 .5 50 .1 6 .9 14 .1 11 .5 0 .5 2 .5 27 .92005 . . . . . . . . . . . . . . . . . . . . . . . . . . . . . . . 100 .0 72 .0 61 .3 49 .8 6 .4 15 .0 11 .8 0 .7 3 .1 28 .02004 . . . . . . . . . . . . . . . . . . . . . . . . . . . . . . . 100 .0 71 .8 61 .2 49 .4 6 .3 14 .6 11 .7 0 .7 2 .8 28 .22003 . . . . . . . . . . . . . . . . . . . . . . . . . . . . . . . 100 .0 72 .6 62 .4 51 .1 6 .8 13 .9 10 .6 0 .6 3 .2 27 .42002 . . . . . . . . . . . . . . . . . . . . . . . . . . . . . . . 100 .0 73 .5 63 .5 52 .0 6 .9 13 .8 10 .7 0 .7 2 .8 26 .52001 . . . . . . . . . . . . . . . . . . . . . . . . . . . . . . . 100 .0 74 .3 64 .9 53 .1 6 .9 13 .1 10 .1 0 .6 2 .6 25 .720003 . . . . . . . . . . . . . . . . . . . . . . . . . . . . . . 100 .0 74 .3 65 .8 55 .1 6 .2 12 .4 9 .3 0 .7 2 .9 25 .719994,5 . . . . . . . . . . . . . . . . . . . . . . . . . . . . . 100 .0 73 .9 64 .8 53 .5 6 .8 12 .9 9 .8 0 .6 3 .0 26 .1
25 TO 34 YEARS
Number2012 . . . . . . . . . . . . . . . . . . . . . . . . . . . . . . . 41,797 30,362 25,833 23,378 2,464 6,098 4,514 713 1,322 11,4352011 . . . . . . . . . . . . . . . . . . . . . . . . . . . . . . . 41,219 29,690 24,976 22,799 2,516 6,092 4,495 624 1,372 11,52920102 . . . . . . . . . . . . . . . . . . . . . . . . . . . . . . 40,761 29,196 24,816 22,774 2,427 5,635 4,168 583 1,221 11,5662009 . . . . . . . . . . . . . . . . . . . . . . . . . . . . . . . 41,085 29,555 25,192 23,055 2,564 5,670 4,246 547 1,209 11,5302008 . . . . . . . . . . . . . . . . . . . . . . . . . . . . . . . 40,520 30,133 26,285 24,501 2,340 5,119 3,784 546 1,104 10,3872007 . . . . . . . . . . . . . . . . . . . . . . . . . . . . . . . 40,146 30,159 26,801 24,884 2,474 4,540 3,238 502 1,047 9,9872006 . . . . . . . . . . . . . . . . . . . . . . . . . . . . . . . 39,868 29,496 26,198 24,393 2,251 4,471 3,385 472 888 10,3712005 . . . . . . . . . . . . . . . . . . . . . . . . . . . . . . . 39,480 29,679 26,173 24,290 2,381 4,752 3,454 541 1,058 9,8022004 . . . . . . . . . . . . . . . . . . . . . . . . . . . . . . . 39,310 29,906 26,598 24,766 2,495 4,632 3,440 501 989 9,4042003 . . . . . . . . . . . . . . . . . . . . . . . . . . . . . . . 39,201 29,367 26,252 24,516 2,250 4,167 2,987 543 872 9,8342002 . . . . . . . . . . . . . . . . . . . . . . . . . . . . . . . 39,243 30,194 27,339 25,556 2,304 3,866 2,720 430 907 9,0492001 . . . . . . . . . . . . . . . . . . . . . . . . . . . . . . . 38,670 30,208 27,679 25,990 2,193 3,465 2,347 473 834 8,46220003 . . . . . . . . . . . . . . . . . . . . . . . . . . . . . . 38,865 30,881 28,465 26,861 2,171 3,321 2,259 394 870 7,98519994,5 . . . . . . . . . . . . . . . . . . . . . . . . . . . . . 39,031 30,809 28,364 26,695 2,237 3,433 2,289 340 953 8,222
Percent2012 . . . . . . . . . . . . . . . . . . . . . . . . . . . . . . . 100 .0 72 .6 61 .8 55 .9 5 .9 14 .6 10 .8 1 .7 3 .2 27 .42011 . . . . . . . . . . . . . . . . . . . . . . . . . . . . . . . 100 .0 72 .0 60 .6 55 .3 6 .1 14 .8 10 .9 1 .5 3 .3 28 .020102 . . . . . . . . . . . . . . . . . . . . . . . . . . . . . . 100 .0 71 .6 60 .9 55 .9 6 .0 13 .8 10 .2 1 .4 3 .0 28 .42009 . . . . . . . . . . . . . . . . . . . . . . . . . . . . . . . 100 .0 71 .9 61 .3 56 .1 6 .2 13 .8 10 .3 1 .3 2 .9 28 .12008 . . . . . . . . . . . . . . . . . . . . . . . . . . . . . . . 100 .0 74 .4 64 .9 60 .5 5 .8 12 .6 9 .3 1 .3 2 .7 25 .62007 . . . . . . . . . . . . . . . . . . . . . . . . . . . . . . . 100 .0 75 .1 66 .8 62 .0 6 .2 11 .3 8 .1 1 .3 2 .6 24 .92006 . . . . . . . . . . . . . . . . . . . . . . . . . . . . . . . 100 .0 74 .0 65 .7 61 .2 5 .6 11 .2 8 .5 1 .2 2 .2 26 .02005 . . . . . . . . . . . . . . . . . . . . . . . . . . . . . . . 100 .0 75 .2 66 .3 61 .5 6 .0 12 .0 8 .7 1 .4 2 .7 24 .82004 . . . . . . . . . . . . . . . . . . . . . . . . . . . . . . . 100 .0 76 .1 67 .7 63 .0 6 .3 11 .8 8 .8 1 .3 2 .5 23 .92003 . . . . . . . . . . . . . . . . . . . . . . . . . . . . . . . 100 .0 74 .9 67 .0 62 .5 5 .7 10 .6 7 .6 1 .4 2 .2 25 .12002 . . . . . . . . . . . . . . . . . . . . . . . . . . . . . . . 100 .0 76 .9 69 .7 65 .1 5 .9 9 .9 6 .9 1 .1 2 .3 23 .12001 . . . . . . . . . . . . . . . . . . . . . . . . . . . . . . . 100 .0 78 .1 71 .6 67 .2 5 .7 9 .0 6 .1 1 .2 2 .2 21 .920003 . . . . . . . . . . . . . . . . . . . . . . . . . . . . . . 100 .0 79 .5 73 .2 69 .1 5 .6 8 .5 5 .8 1 .0 2 .2 20 .519994,5 . . . . . . . . . . . . . . . . . . . . . . . . . . . . . 100 .0 78 .9 72 .7 68 .4 5 .7 8 .8 5 .9 0 .9 2 .4 21 .1
See footnotes at end of table .
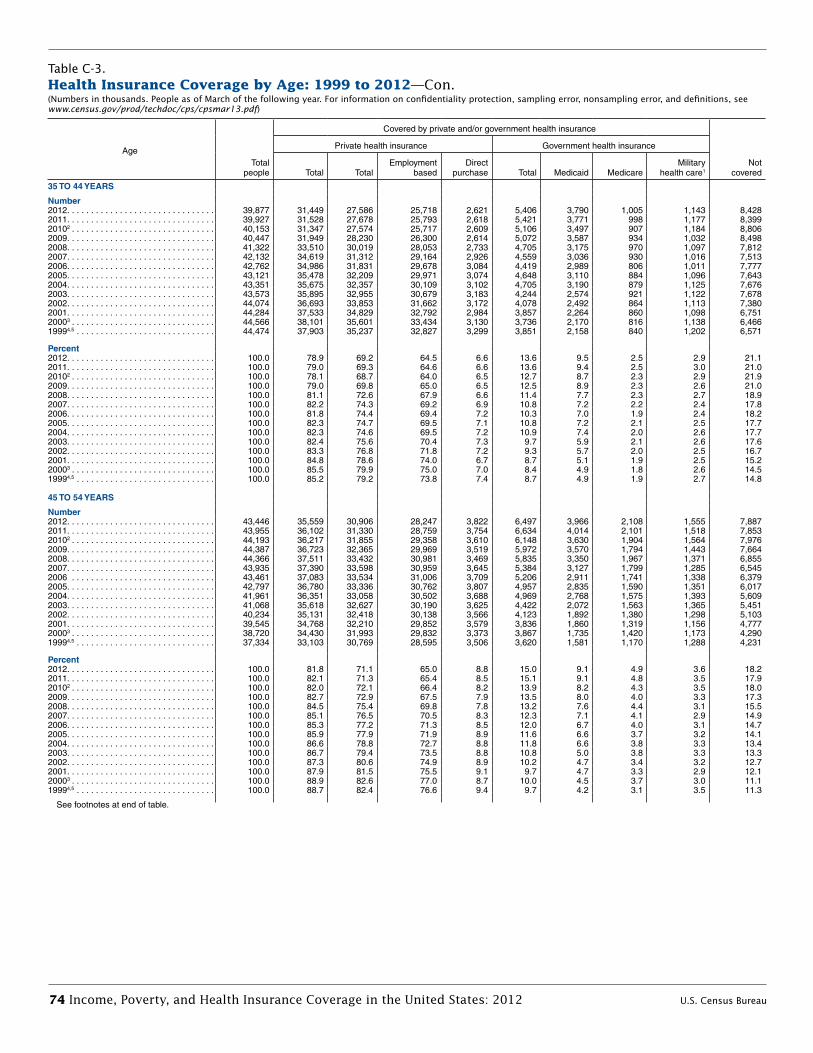
74 Income, Poverty, and Health Insurance Coverage in the United States: 2012 U.S. Census Bureau
Table C-3. Health Insurance Coverage by Age: 1999 to 2012—Con .(Numbers in thousands. People as of March of the following year. For information on confidentiality protection, sampling error, nonsampling error, and definitions, see www.census.gov/prod/techdoc/cps/cpsmar13.pdf)
AgeTotal
people
Covered by private and/or government health insurance
Notcovered
Private health insurance Government health insurance
Total TotalEmployment
basedDirect
purchase Total Medicaid MedicareMilitary
health care1
35 TO 44 YEARS
Number2012 . . . . . . . . . . . . . . . . . . . . . . . . . . . . . . . 39,877 31,449 27,586 25,718 2,621 5,406 3,790 1,005 1,143 8,4282011 . . . . . . . . . . . . . . . . . . . . . . . . . . . . . . . 39,927 31,528 27,678 25,793 2,618 5,421 3,771 998 1,177 8,39920102 . . . . . . . . . . . . . . . . . . . . . . . . . . . . . . 40,153 31,347 27,574 25,717 2,609 5,106 3,497 907 1,184 8,8062009 . . . . . . . . . . . . . . . . . . . . . . . . . . . . . . . 40,447 31,949 28,230 26,300 2,614 5,072 3,587 934 1,032 8,4982008 . . . . . . . . . . . . . . . . . . . . . . . . . . . . . . . 41,322 33,510 30,019 28,053 2,733 4,705 3,175 970 1,097 7,8122007 . . . . . . . . . . . . . . . . . . . . . . . . . . . . . . . 42,132 34,619 31,312 29,164 2,926 4,559 3,036 930 1,016 7,5132006 . . . . . . . . . . . . . . . . . . . . . . . . . . . . . . . 42,762 34,986 31,831 29,678 3,084 4,419 2,989 806 1,011 7,7772005 . . . . . . . . . . . . . . . . . . . . . . . . . . . . . . . 43,121 35,478 32,209 29,971 3,074 4,648 3,110 884 1,096 7,6432004 . . . . . . . . . . . . . . . . . . . . . . . . . . . . . . . 43,351 35,675 32,357 30,109 3,102 4,705 3,190 879 1,125 7,6762003 . . . . . . . . . . . . . . . . . . . . . . . . . . . . . . . 43,573 35,895 32,955 30,679 3,183 4,244 2,574 921 1,122 7,6782002 . . . . . . . . . . . . . . . . . . . . . . . . . . . . . . . 44,074 36,693 33,853 31,662 3,172 4,078 2,492 864 1,113 7,3802001 . . . . . . . . . . . . . . . . . . . . . . . . . . . . . . . 44,284 37,533 34,829 32,792 2,984 3,857 2,264 860 1,098 6,75120003 . . . . . . . . . . . . . . . . . . . . . . . . . . . . . . 44,566 38,101 35,601 33,434 3,130 3,736 2,170 816 1,138 6,46619994,5 . . . . . . . . . . . . . . . . . . . . . . . . . . . . . 44,474 37,903 35,237 32,827 3,299 3,851 2,158 840 1,202 6,571
Percent2012 . . . . . . . . . . . . . . . . . . . . . . . . . . . . . . . 100 .0 78 .9 69 .2 64 .5 6 .6 13 .6 9 .5 2 .5 2 .9 21 .12011 . . . . . . . . . . . . . . . . . . . . . . . . . . . . . . . 100 .0 79 .0 69 .3 64 .6 6 .6 13 .6 9 .4 2 .5 3 .0 21 .020102 . . . . . . . . . . . . . . . . . . . . . . . . . . . . . . 100 .0 78 .1 68 .7 64 .0 6 .5 12 .7 8 .7 2 .3 2 .9 21 .92009 . . . . . . . . . . . . . . . . . . . . . . . . . . . . . . . 100 .0 79 .0 69 .8 65 .0 6 .5 12 .5 8 .9 2 .3 2 .6 21 .02008 . . . . . . . . . . . . . . . . . . . . . . . . . . . . . . . 100 .0 81 .1 72 .6 67 .9 6 .6 11 .4 7 .7 2 .3 2 .7 18 .92007 . . . . . . . . . . . . . . . . . . . . . . . . . . . . . . . 100 .0 82 .2 74 .3 69 .2 6 .9 10 .8 7 .2 2 .2 2 .4 17 .82006 . . . . . . . . . . . . . . . . . . . . . . . . . . . . . . . 100 .0 81 .8 74 .4 69 .4 7 .2 10 .3 7 .0 1 .9 2 .4 18 .22005 . . . . . . . . . . . . . . . . . . . . . . . . . . . . . . . 100 .0 82 .3 74 .7 69 .5 7 .1 10 .8 7 .2 2 .1 2 .5 17 .72004 . . . . . . . . . . . . . . . . . . . . . . . . . . . . . . . 100 .0 82 .3 74 .6 69 .5 7 .2 10 .9 7 .4 2 .0 2 .6 17 .72003 . . . . . . . . . . . . . . . . . . . . . . . . . . . . . . . 100 .0 82 .4 75 .6 70 .4 7 .3 9 .7 5 .9 2 .1 2 .6 17 .62002 . . . . . . . . . . . . . . . . . . . . . . . . . . . . . . . 100 .0 83 .3 76 .8 71 .8 7 .2 9 .3 5 .7 2 .0 2 .5 16 .72001 . . . . . . . . . . . . . . . . . . . . . . . . . . . . . . . 100 .0 84 .8 78 .6 74 .0 6 .7 8 .7 5 .1 1 .9 2 .5 15 .220003 . . . . . . . . . . . . . . . . . . . . . . . . . . . . . . 100 .0 85 .5 79 .9 75 .0 7 .0 8 .4 4 .9 1 .8 2 .6 14 .519994,5 . . . . . . . . . . . . . . . . . . . . . . . . . . . . . 100 .0 85 .2 79 .2 73 .8 7 .4 8 .7 4 .9 1 .9 2 .7 14 .8
45 TO 54 YEARS
Number2012 . . . . . . . . . . . . . . . . . . . . . . . . . . . . . . . 43,446 35,559 30,906 28,247 3,822 6,497 3,966 2,108 1,555 7,8872011 . . . . . . . . . . . . . . . . . . . . . . . . . . . . . . . 43,955 36,102 31,330 28,759 3,754 6,634 4,014 2,101 1,518 7,85320102 . . . . . . . . . . . . . . . . . . . . . . . . . . . . . . 44,193 36,217 31,855 29,358 3,610 6,148 3,630 1,904 1,564 7,9762009 . . . . . . . . . . . . . . . . . . . . . . . . . . . . . . . 44,387 36,723 32,365 29,969 3,519 5,972 3,570 1,794 1,443 7,6642008 . . . . . . . . . . . . . . . . . . . . . . . . . . . . . . . 44,366 37,511 33,432 30,981 3,469 5,835 3,350 1,967 1,371 6,8552007 . . . . . . . . . . . . . . . . . . . . . . . . . . . . . . . 43,935 37,390 33,598 30,959 3,645 5,384 3,127 1,799 1,285 6,5452006 . . . . . . . . . . . . . . . . . . . . . . . . . . . . . . 43,461 37,083 33,534 31,006 3,709 5,206 2,911 1,741 1,338 6,3792005 . . . . . . . . . . . . . . . . . . . . . . . . . . . . . . . 42,797 36,780 33,336 30,762 3,807 4,957 2,835 1,590 1,351 6,0172004 . . . . . . . . . . . . . . . . . . . . . . . . . . . . . . . 41,961 36,351 33,058 30,502 3,688 4,969 2,768 1,575 1,393 5,6092003 . . . . . . . . . . . . . . . . . . . . . . . . . . . . . . . 41,068 35,618 32,627 30,190 3,625 4,422 2,072 1,563 1,365 5,4512002 . . . . . . . . . . . . . . . . . . . . . . . . . . . . . . . 40,234 35,131 32,418 30,138 3,566 4,123 1,892 1,380 1,298 5,1032001 . . . . . . . . . . . . . . . . . . . . . . . . . . . . . . . 39,545 34,768 32,210 29,852 3,579 3,836 1,860 1,319 1,156 4,77720003 . . . . . . . . . . . . . . . . . . . . . . . . . . . . . . 38,720 34,430 31,993 29,832 3,373 3,867 1,735 1,420 1,173 4,29019994,5 . . . . . . . . . . . . . . . . . . . . . . . . . . . . . 37,334 33,103 30,769 28,595 3,506 3,620 1,581 1,170 1,288 4,231
Percent2012 . . . . . . . . . . . . . . . . . . . . . . . . . . . . . . . 100 .0 81 .8 71 .1 65 .0 8 .8 15 .0 9 .1 4 .9 3 .6 18 .22011 . . . . . . . . . . . . . . . . . . . . . . . . . . . . . . . 100 .0 82 .1 71 .3 65 .4 8 .5 15 .1 9 .1 4 .8 3 .5 17 .920102 . . . . . . . . . . . . . . . . . . . . . . . . . . . . . . 100 .0 82 .0 72 .1 66 .4 8 .2 13 .9 8 .2 4 .3 3 .5 18 .02009 . . . . . . . . . . . . . . . . . . . . . . . . . . . . . . . 100 .0 82 .7 72 .9 67 .5 7 .9 13 .5 8 .0 4 .0 3 .3 17 .32008 . . . . . . . . . . . . . . . . . . . . . . . . . . . . . . . 100 .0 84 .5 75 .4 69 .8 7 .8 13 .2 7 .6 4 .4 3 .1 15 .52007 . . . . . . . . . . . . . . . . . . . . . . . . . . . . . . . 100 .0 85 .1 76 .5 70 .5 8 .3 12 .3 7 .1 4 .1 2 .9 14 .92006 . . . . . . . . . . . . . . . . . . . . . . . . . . . . . . . 100 .0 85 .3 77 .2 71 .3 8 .5 12 .0 6 .7 4 .0 3 .1 14 .72005 . . . . . . . . . . . . . . . . . . . . . . . . . . . . . . . 100 .0 85 .9 77 .9 71 .9 8 .9 11 .6 6 .6 3 .7 3 .2 14 .12004 . . . . . . . . . . . . . . . . . . . . . . . . . . . . . . . 100 .0 86 .6 78 .8 72 .7 8 .8 11 .8 6 .6 3 .8 3 .3 13 .42003 . . . . . . . . . . . . . . . . . . . . . . . . . . . . . . . 100 .0 86 .7 79 .4 73 .5 8 .8 10 .8 5 .0 3 .8 3 .3 13 .32002 . . . . . . . . . . . . . . . . . . . . . . . . . . . . . . . 100 .0 87 .3 80 .6 74 .9 8 .9 10 .2 4 .7 3 .4 3 .2 12 .72001 . . . . . . . . . . . . . . . . . . . . . . . . . . . . . . . 100 .0 87 .9 81 .5 75 .5 9 .1 9 .7 4 .7 3 .3 2 .9 12 .120003 . . . . . . . . . . . . . . . . . . . . . . . . . . . . . . 100 .0 88 .9 82 .6 77 .0 8 .7 10 .0 4 .5 3 .7 3 .0 11 .119994,5 . . . . . . . . . . . . . . . . . . . . . . . . . . . . . 100 .0 88 .7 82 .4 76 .6 9 .4 9 .7 4 .2 3 .1 3 .5 11 .3
See footnotes at end of table .
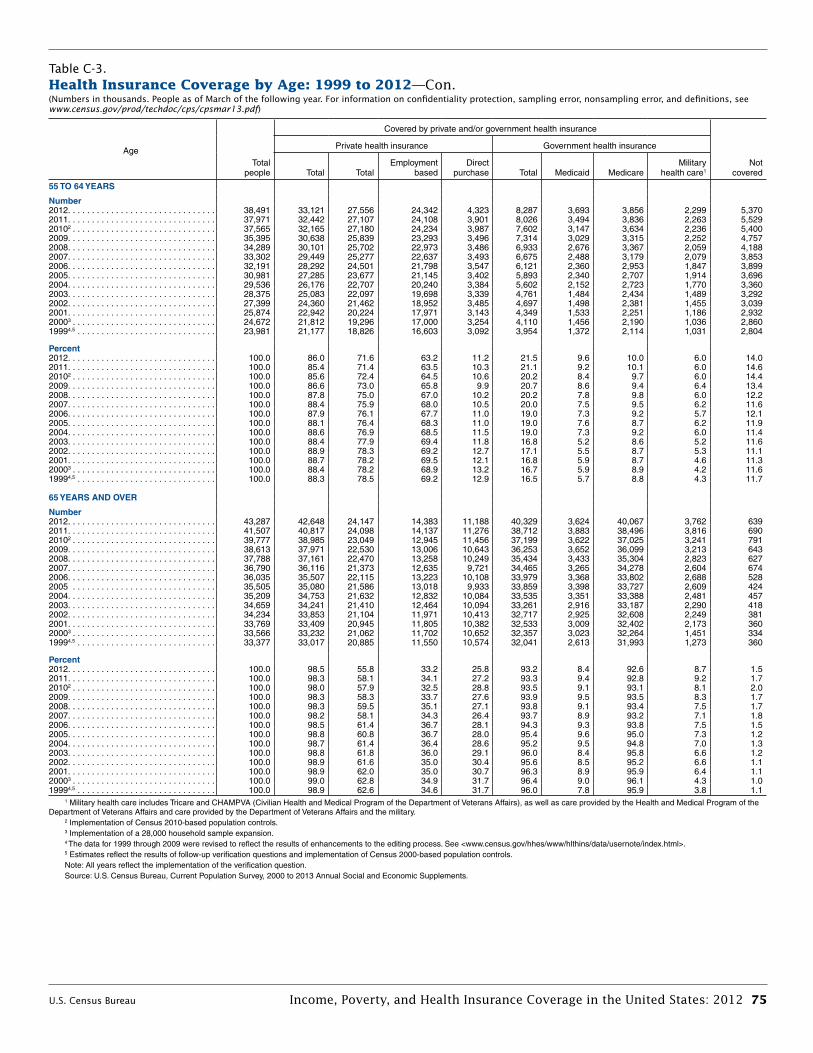
U.S. Census Bureau Income, Poverty, and Health Insurance Coverage in the United States: 2012 75
Table C-3. Health Insurance Coverage by Age: 1999 to 2012—Con .(Numbers in thousands. People as of March of the following year. For information on confidentiality protection, sampling error, nonsampling error, and definitions, see www.census.gov/prod/techdoc/cps/cpsmar13.pdf)
AgeTotal
people
Covered by private and/or government health insurance
Notcovered
Private health insurance Government health insurance
Total TotalEmployment
basedDirect
purchase Total Medicaid MedicareMilitary
health care1
55 TO 64 YEARS
Number2012 . . . . . . . . . . . . . . . . . . . . . . . . . . . . . . . 38,491 33,121 27,556 24,342 4,323 8,287 3,693 3,856 2,299 5,3702011 . . . . . . . . . . . . . . . . . . . . . . . . . . . . . . . 37,971 32,442 27,107 24,108 3,901 8,026 3,494 3,836 2,263 5,52920102 . . . . . . . . . . . . . . . . . . . . . . . . . . . . . . 37,565 32,165 27,180 24,234 3,987 7,602 3,147 3,634 2,236 5,4002009 . . . . . . . . . . . . . . . . . . . . . . . . . . . . . . . 35,395 30,638 25,839 23,293 3,496 7,314 3,029 3,315 2,252 4,7572008 . . . . . . . . . . . . . . . . . . . . . . . . . . . . . . . 34,289 30,101 25,702 22,973 3,486 6,933 2,676 3,367 2,059 4,1882007 . . . . . . . . . . . . . . . . . . . . . . . . . . . . . . . 33,302 29,449 25,277 22,637 3,493 6,675 2,488 3,179 2,079 3,8532006 . . . . . . . . . . . . . . . . . . . . . . . . . . . . . . . 32,191 28,292 24,501 21,798 3,547 6,121 2,360 2,953 1,847 3,8992005 . . . . . . . . . . . . . . . . . . . . . . . . . . . . . . . 30,981 27,285 23,677 21,145 3,402 5,893 2,340 2,707 1,914 3,6962004 . . . . . . . . . . . . . . . . . . . . . . . . . . . . . . . 29,536 26,176 22,707 20,240 3,384 5,602 2,152 2,723 1,770 3,3602003 . . . . . . . . . . . . . . . . . . . . . . . . . . . . . . . 28,375 25,083 22,097 19,698 3,339 4,761 1,484 2,434 1,489 3,2922002 . . . . . . . . . . . . . . . . . . . . . . . . . . . . . . . 27,399 24,360 21,462 18,952 3,485 4,697 1,498 2,381 1,455 3,0392001 . . . . . . . . . . . . . . . . . . . . . . . . . . . . . . . 25,874 22,942 20,224 17,971 3,143 4,349 1,533 2,251 1,186 2,93220003 . . . . . . . . . . . . . . . . . . . . . . . . . . . . . . 24,672 21,812 19,296 17,000 3,254 4,110 1,456 2,190 1,036 2,86019994,5 . . . . . . . . . . . . . . . . . . . . . . . . . . . . . 23,981 21,177 18,826 16,603 3,092 3,954 1,372 2,114 1,031 2,804
Percent2012 . . . . . . . . . . . . . . . . . . . . . . . . . . . . . . . 100 .0 86 .0 71 .6 63 .2 11 .2 21 .5 9 .6 10 .0 6 .0 14 .02011 . . . . . . . . . . . . . . . . . . . . . . . . . . . . . . . 100 .0 85 .4 71 .4 63 .5 10 .3 21 .1 9 .2 10 .1 6 .0 14 .620102 . . . . . . . . . . . . . . . . . . . . . . . . . . . . . . 100 .0 85 .6 72 .4 64 .5 10 .6 20 .2 8 .4 9 .7 6 .0 14 .42009 . . . . . . . . . . . . . . . . . . . . . . . . . . . . . . . 100 .0 86 .6 73 .0 65 .8 9 .9 20 .7 8 .6 9 .4 6 .4 13 .42008 . . . . . . . . . . . . . . . . . . . . . . . . . . . . . . . 100 .0 87 .8 75 .0 67 .0 10 .2 20 .2 7 .8 9 .8 6 .0 12 .22007 . . . . . . . . . . . . . . . . . . . . . . . . . . . . . . . 100 .0 88 .4 75 .9 68 .0 10 .5 20 .0 7 .5 9 .5 6 .2 11 .62006 . . . . . . . . . . . . . . . . . . . . . . . . . . . . . . . 100 .0 87 .9 76 .1 67 .7 11 .0 19 .0 7 .3 9 .2 5 .7 12 .12005 . . . . . . . . . . . . . . . . . . . . . . . . . . . . . . . 100 .0 88 .1 76 .4 68 .3 11 .0 19 .0 7 .6 8 .7 6 .2 11 .92004 . . . . . . . . . . . . . . . . . . . . . . . . . . . . . . . 100 .0 88 .6 76 .9 68 .5 11 .5 19 .0 7 .3 9 .2 6 .0 11 .42003 . . . . . . . . . . . . . . . . . . . . . . . . . . . . . . . 100 .0 88 .4 77 .9 69 .4 11 .8 16 .8 5 .2 8 .6 5 .2 11 .62002 . . . . . . . . . . . . . . . . . . . . . . . . . . . . . . . 100 .0 88 .9 78 .3 69 .2 12 .7 17 .1 5 .5 8 .7 5 .3 11 .12001 . . . . . . . . . . . . . . . . . . . . . . . . . . . . . . . 100 .0 88 .7 78 .2 69 .5 12 .1 16 .8 5 .9 8 .7 4 .6 11 .320003 . . . . . . . . . . . . . . . . . . . . . . . . . . . . . . 100 .0 88 .4 78 .2 68 .9 13 .2 16 .7 5 .9 8 .9 4 .2 11 .619994,5 . . . . . . . . . . . . . . . . . . . . . . . . . . . . . 100 .0 88 .3 78 .5 69 .2 12 .9 16 .5 5 .7 8 .8 4 .3 11 .7
65 YEARS AND OVER
Number2012 . . . . . . . . . . . . . . . . . . . . . . . . . . . . . . . 43,287 42,648 24,147 14,383 11,188 40,329 3,624 40,067 3,762 6392011 . . . . . . . . . . . . . . . . . . . . . . . . . . . . . . . 41,507 40,817 24,098 14,137 11,276 38,712 3,883 38,496 3,816 69020102 . . . . . . . . . . . . . . . . . . . . . . . . . . . . . . 39,777 38,985 23,049 12,945 11,456 37,199 3,622 37,025 3,241 7912009 . . . . . . . . . . . . . . . . . . . . . . . . . . . . . . . 38,613 37,971 22,530 13,006 10,643 36,253 3,652 36,099 3,213 6432008 . . . . . . . . . . . . . . . . . . . . . . . . . . . . . . . 37,788 37,161 22,470 13,258 10,249 35,434 3,433 35,304 2,823 6272007 . . . . . . . . . . . . . . . . . . . . . . . . . . . . . . . 36,790 36,116 21,373 12,635 9,721 34,465 3,265 34,278 2,604 6742006 . . . . . . . . . . . . . . . . . . . . . . . . . . . . . . . 36,035 35,507 22,115 13,223 10,108 33,979 3,368 33,802 2,688 5282005 . . . . . . . . . . . . . . . . . . . . . . . . . . . . . . 35,505 35,080 21,586 13,018 9,933 33,859 3,398 33,727 2,609 4242004 . . . . . . . . . . . . . . . . . . . . . . . . . . . . . . . 35,209 34,753 21,632 12,832 10,084 33,535 3,351 33,388 2,481 4572003 . . . . . . . . . . . . . . . . . . . . . . . . . . . . . . . 34,659 34,241 21,410 12,464 10,094 33,261 2,916 33,187 2,290 4182002 . . . . . . . . . . . . . . . . . . . . . . . . . . . . . . . 34,234 33,853 21,104 11,971 10,413 32,717 2,925 32,608 2,249 3812001 . . . . . . . . . . . . . . . . . . . . . . . . . . . . . . . 33,769 33,409 20,945 11,805 10,382 32,533 3,009 32,402 2,173 36020003 . . . . . . . . . . . . . . . . . . . . . . . . . . . . . . 33,566 33,232 21,062 11,702 10,652 32,357 3,023 32,264 1,451 33419994,5 . . . . . . . . . . . . . . . . . . . . . . . . . . . . . 33,377 33,017 20,885 11,550 10,574 32,041 2,613 31,993 1,273 360
Percent2012 . . . . . . . . . . . . . . . . . . . . . . . . . . . . . . . 100 .0 98 .5 55 .8 33 .2 25 .8 93 .2 8 .4 92 .6 8 .7 1 .52011 . . . . . . . . . . . . . . . . . . . . . . . . . . . . . . . 100 .0 98 .3 58 .1 34 .1 27 .2 93 .3 9 .4 92 .8 9 .2 1 .720102 . . . . . . . . . . . . . . . . . . . . . . . . . . . . . . 100 .0 98 .0 57 .9 32 .5 28 .8 93 .5 9 .1 93 .1 8 .1 2 .02009 . . . . . . . . . . . . . . . . . . . . . . . . . . . . . . . 100 .0 98 .3 58 .3 33 .7 27 .6 93 .9 9 .5 93 .5 8 .3 1 .72008 . . . . . . . . . . . . . . . . . . . . . . . . . . . . . . . 100 .0 98 .3 59 .5 35 .1 27 .1 93 .8 9 .1 93 .4 7 .5 1 .72007 . . . . . . . . . . . . . . . . . . . . . . . . . . . . . . . 100 .0 98 .2 58 .1 34 .3 26 .4 93 .7 8 .9 93 .2 7 .1 1 .82006 . . . . . . . . . . . . . . . . . . . . . . . . . . . . . . . 100 .0 98 .5 61 .4 36 .7 28 .1 94 .3 9 .3 93 .8 7 .5 1 .52005 . . . . . . . . . . . . . . . . . . . . . . . . . . . . . . . 100 .0 98 .8 60 .8 36 .7 28 .0 95 .4 9 .6 95 .0 7 .3 1 .22004 . . . . . . . . . . . . . . . . . . . . . . . . . . . . . . . 100 .0 98 .7 61 .4 36 .4 28 .6 95 .2 9 .5 94 .8 7 .0 1 .32003 . . . . . . . . . . . . . . . . . . . . . . . . . . . . . . . 100 .0 98 .8 61 .8 36 .0 29 .1 96 .0 8 .4 95 .8 6 .6 1 .22002 . . . . . . . . . . . . . . . . . . . . . . . . . . . . . . . 100 .0 98 .9 61 .6 35 .0 30 .4 95 .6 8 .5 95 .2 6 .6 1 .12001 . . . . . . . . . . . . . . . . . . . . . . . . . . . . . . . 100 .0 98 .9 62 .0 35 .0 30 .7 96 .3 8 .9 95 .9 6 .4 1 .120003 . . . . . . . . . . . . . . . . . . . . . . . . . . . . . . 100 .0 99 .0 62 .8 34 .9 31 .7 96 .4 9 .0 96 .1 4 .3 1 .019994,5 . . . . . . . . . . . . . . . . . . . . . . . . . . . . . 100 .0 98 .9 62 .6 34 .6 31 .7 96 .0 7 .8 95 .9 3 .8 1 .1
1 Military health care includes Tricare and CHAMPVA (Civilian Health and Medical Program of the Department of Veterans Affairs), as well as care provided by the Health and Medical Program of the Department of Veterans Affairs and care provided by the Department of Veterans Affairs and the military .
2 Implementation of Census 2010-based population controls .3 Implementation of a 28,000 household sample expansion . 4 The data for 1999 through 2009 were revised to reflect the results of enhancements to the editing process . See <www .census .gov/hhes/www/hlthins/data/usernote/index .html> .5 Estimates reflect the results of follow-up verification questions and implementation of Census 2000-based population controls . Note: All years reflect the implementation of the verification question . Source: U .S . Census Bureau, Current Population Survey, 2000 to 2013 Annual Social and Economic Supplements .

76 Income, Poverty, and Health Insurance Coverage in the United States: 2012 U.S. Census Bureau
Beginning in the 2011 CPS ASEC report, the variance of CPS ASEC esti-mates used to calculate the standard errors and confidence intervals dis-played in the text tables were calcu-lated using the Successive Difference Replication (SDR) method documented by Fay and Train (1995).1 This method involves the computation of a set of replicate weights which account for the complex survey design of the CPS. The SDR method has been used to estimate variances in the American Community Survey since its inception.
In previous years, the standard errors of CPS ASEC estimates were calculated using a Generalized Variance Function (GVF) approach. Under this approach, generalized variance parameters were used in formulas provided in the source and accuracy (S&A) statement to estimate standard errors.
A study by Davern et al. (2006) found that the CPS ASEC GVF standard errors performed poorly against more precise Survey Design-Based (SDB) estimates. In most cases, Davern’s results indicated that the published GVF parameters significantly under-estimated standard errors in the CPS ASEC. This and other critiques
1 In order to facilitate historical comparisons, the appendix tables display standard errors cal-culated using the Generalized Variance Function since replicate weights are not available for CPS ASEC collection years prior to 2005.
prompted the Census Bureau to tran-sition from using the GVF method of estimating standard errors to using the SDR method of estimating stan-dard errors for the CPS ASEC. In 2009, the Census Bureau released replicate weights for the 2005 through 2009 CPS ASEC collection years and has released replicate weights for 2010, 2011, and 2012 with the release of the CPS ASEC public use data.
Following the 2009 release of CPS ASEC replicate weights, Boudreaux, Davern, and Graven (2011) compared replicate weight standard error esti-mates with SDB estimates. Replicate weight estimates performed markedly better against SDB standard errors than those calculated using the pub-lished GVF parameters. The Census Bureau will continue to provide the GVF parameters in the source and accuracy statement.
Since the published GVF parameters generally underestimated standard errors, standard errors produced using SDR may be higher than in previous reports. For most CPS ASEC estimates, the increase in standard errors from GVF to SDR will not alter the findings. However, marginally significant differences using the GVF may not be significant using replicate weights.
References:
Boudreaux, Michel, Michael Davern, and Peter Graven. “Alternative Variance Estimates in the Current Population Survey and the American Community Survey,” presented at the 2011 Annual Meeting of the Population Association of America.
Davern, Michael, Arthur Jones, James Lepkowski, Gestur Davidson, and Lynn A. Blewett. “Unstable Inferences? An Examination of Complex Survey Sample Design Adjustments Using the Current Population Survey for Health Services Research,” Inquiry. Vol. 43, No. 3, 2006, pp. 283–297.
Fay, Robert E. and George F. Train. “Aspects of Survey and Model-Based Postcensal Estimation of Income and Poverty Characteristics for States and Counties,” Proceedings of the Section on Government Statistics, American Statistical Association, Alexandria, VA, 1995, pp. 154–159.
APPENDIX D. REPLICATE WEIGHTS
U.S. Census Bureau Income, Poverty, and Health Insurance Coverage in the United States: 2012 77
Detailed tables, historical tables, press releases, and briefings are available electronically on the Census Bureau’s Income, Poverty, and Health Insurance Web sites. The Web sites may be accessed through the Census Bureau’s home page at <www.census.gov> or directly at <www.census.gov/hhes /www/income/> for income data, <www.census.gov/hhes/www /poverty/> for poverty data, and <www.census.gov/hhes/www /hlthins/> for health insurance data.
For assistance with income, poverty, or health insurance data or ques-tions about them, contact the U.S. Census Bureau Customer Services Center at 1-800-923-8282 (toll free) or search your topic of interest using the Census Bureau’s “Question and Answer Center” found at <ask.census .gov>.
Customized Tables
The CPS Table Creator <www.census.gov/cps/data /cpstablecreator.html> Gives data users the ability to create customized tables from the Current Population Survey Annual Social and Economic Supplement (CPS ASEC). Table Creator can access data back to the 2003 CPS ASEC.
Data Ferrett <http://dataferrett.census.gov/> Users can also generate customized tables using the Data Ferrett tool. CPS ASEC files from 1992 to the present are available through Data Ferrett.
Public Use MicroData
CPS ASEC Microdata for the 2013 CPS ASEC and earlier years is available online at <http://thedataweb.rm.census .gov/ftp/cps_ftp.html#cpsmarch>
or via DataFerrett at <http:// dataferrett.census.gov>. Technical methods have been applied to CPS microdata to avoid disclosing the identities of individuals from whom data were collected.
Taxes and Noncash Benefits In the early 1980s, the Census Bureau embarked on a research program to examine the effects of taxes and noncash benefits on poverty and income distributional measures. Public use data containing these additional variables are typically released later in the year and are available online at <http://thedataweb.rm.census.gov /ftp/cps_ftp.html#cpsmarch>.
Research Files In addition, the Census Bureau produces special research files that enable researchers to replicate alternative poverty estimates. These files are typically released later in the year and are available online at <www.census.gov/hhes/povmeas /data/index.html>.
Topcoding
In its long history of releasing pub-lic use microdata files based on the CPS ASEC, the Census Bureau has censored the release of “high income” amounts in order to meet the requirements of Title 13. This process is often called topcoding. During the period prior to the March 1996 survey, this censorship was applied by limiting the values for income amounts to be no greater than a specified maximum value (the topcode). Values above the maximum were replaced by the maximum value. Maximum values varied by income source and year. Beginning with the 1996 survey, the censorship method
was modified so that mean values were substituted for all amounts above the topcode (for historically consistent extracts from 1975 to 1995, call the Income Surveys Branch, 301-763-3243).
Differences in the methods used to censor high-income amounts over time made it difficult to generate consistent time series for important measures of income distribution such as the Gini Coefficient of Income Concentration (GINI), and decile shares. Moreover, using the mean value for all amounts above the top-code made it impossible to examine the distribution of income above the topcode. In an effort to alleviate these problems and improve the overall usefulness of the ASEC, the Census Bureau sponsored research on meth-ods that both met Title 13 require-ments and preserved the income distribution above the topcode. This research led to the implementation in the 2011 ASEC of rank proxim-ity swapping methods that switch income amounts above the topcode for respondents that are of similar income rank. Swapped amounts are rounded following the swapping pro-cess to provide additional disclosure avoidance.
Extract files containing swapped income values for survey years 1975 to 2010 are now available on the Census Bureau’s FTP site at <www.census.gov/housing /extract_files>.
APPENDIX E. ADDITIoNAL DATA AND CoNTACTS


U.S. Department of CommerceEconomics and Statistics AdministrationU.S. CENSUS BUREAUWashington, DC 20233
OFFICIAL BUSINESS
Penalty for Private Use $300
FIRST-CLASS MAILPOSTAGE & FEES PAIDU.S. Census Bureau
Permit No. G-58