Income, Poverty, and Health Insurance Coverage in the ... Income, Poverty, and Health Insurance...
83
U S C E N S U S B U R E A U Helping You Make Informed Decisions P60-231 U.S. Department of Commerce Economics and Statistics Administration U.S. CENSUS BUREAU Income, Poverty, and Health Insurance Coverage in A the United States: 2005 Issued August 2006 By Carmen DeNavas-Walt Bernadette D. Proctor Cheryl Hill Lee Current Population Reports Consumer Income
Transcript of Income, Poverty, and Health Insurance Coverage in the ... Income, Poverty, and Health Insurance...
U S C E N S U S B U R E A U Helping You Make Informed Decisions
Demographic Programs
P60-231
U.S. Department of Commerce Economics and Statistics Administration
U.S. CENSUS BUREAU
Income, Poverty, and Health Insurance Coverage in A
the United States: 2005 Issued August 2006
By Carmen DeNavas-Walt Bernadette D. Proctor Cheryl Hill Lee
Current Population Reports
Consumer Income

Acknowledgments Carmen DeNavas-Walt prepared the income section of this reportunder the direction of Edward J. Welniak Jr., Chief of the IncomeSurveys Branch. Bernadette D. Proctor prepared the poverty sec-tion and Cheryl Hill Lee prepared the health insurance coverage sec-tion, both under the direction of Sharon Stern, Chief of the Povertyand Health Statistics Branch. Charles T. Nelson, Assistant DivisionChief for Income, Poverty, and Health Statistics, Housing andHousehold Economic Statistics Division, provided overall direction.
Adelle D. Berlinger, George M. Mitcham, Tim J. Marshall,Robert E. Rothhaas, and Gregory D. Weyland, DemographicSurveys Division, processed the Current Population Survey 2006Annual Social and Economic Supplement file. Caroline S.Carbaugh, Chief of the Survey Processing Branch, Stacy J. Lyons,Mary Thrift Bush, Kirk E. Davis, Jaime L. Hasiuk, and Thy K.Le programmed and produced the detailed and publication tables.
Rebecca A. Olson, Jana Shepherd, and Michael White, underthe supervision of David V. Hornick of the Demographic StatisticalMethods Division, conducted sample review.
Bonnie S. Tarsia, Michelle L. Wiland, and Tim J. Marshall,Demographic Surveys Division, and Andrew M. Stevenson,Technologies Management Office, prepared and programmed thecomputer-assisted interviewing instrument used to conduct theAnnual Social and Economic Supplement.
Additional people within the U.S. Census Bureau also made significantcontributions to the preparation of this report. Joseph Dalaker,Marjorie Hanson, John Hisnanick, Len Norry, and Jessica L.Semega reviewed the contents. Jessica Smith, Ann MargaretJensen, Kim Nguyen, and Miranda C. Hickman provided statisticalassistance. Doris Sansbury provided clerical assistance.
Census Bureau field representatives and telephone interviewerscollected the data. Without their dedication, the preparation of thisreport or any report from the Current Population Survey would be impossible.
Jan Sweeney, Jamie Peters, Theodora Forgione, and Don Meyd,of the Administrative and Customer Services Division, Walter C.Odom, Chief, provided publications and printing management, graph-ics design and composition, and editorial review for print and elec-tronic media. General direction and production management wereprovided by James R. Clark, Assistant Division Chief, and Wanda K.Cevis, Chief, Publications Services Branch.

P60-231
Income, Poverty, and HealthInsurance Coverage in the
United States: 2005 Issued August 2006
U.S. Department of CommerceCarlos M. Gutierrez,
Secretary
David A. Sampson,Deputy Secretary
Economics and Statistics AdministrationVacant,
Under Secretary for Economic Affairs
U.S. CENSUS BUREAU
Charles Louis Kincannon,
Director

Suggested Citation
DeNavas-Walt, Carmen, Bernadette D.Proctor, and Cheryl Hill Lee,
U.S. Census Bureau, Current Population Reports, P60-231,
Income, Poverty, and Health InsuranceCoverage in the United States: 2005,
U.S. Government Printing Office,Washington, DC,
2006. ECONOMICS
AND STATISTICS
ADMINISTRATION
Economics and StatisticsAdministration
Vacant,Under Secretary for Economic Affairs
U.S. CENSUS BUREAU
Charles Louis Kincannon,Director
Hermann Habermann,Deputy Director and Chief Operating Officer
Howard Hogan,Associate Director for Demographic Programs
David S. Johnson,Chief, Housing and Household Economic Statistics Division
For sale by the Superintendent of Documents, U.S. Government Printing Office
Internet: bookstore.gpo.gov Phone: toll-free 866-512-1800; DC area 202-512-1800
Fax: 202-512-2250 Mail: Stop SSOP, Washington, DC 20402-0001

U.S. Census Bureau Income, Poverty, and Health Insurance Coverage in the United States: 2005 iii
Contents
TEXT
Income, Poverty, and Health Insurance Coverage in the United States: 2005 . . . . . . . . . . . . . . . . . . . . . . . . . . . . . . . . . 1
Introduction . . . . . . . . . . . . . . . . . . . . . . . . . . . . . . . . . . . . . . . . . . 1Source of Estimates and Statistical Accuracy . . . . . . . . . . . . . . . . . . 1State and Local Estimates of Income, Poverty,
and Health Insurance . . . . . . . . . . . . . . . . . . . . . . . . . . . . . . . . . . 2Dynamics of Economic Well-Being . . . . . . . . . . . . . . . . . . . . . . . . . . 3
Income in the United States . . . . . . . . . . . . . . . . . . . . . . . . . . . . . . 4Highlights . . . . . . . . . . . . . . . . . . . . . . . . . . . . . . . . . . . . . . . . . . . . 4Household Income . . . . . . . . . . . . . . . . . . . . . . . . . . . . . . . . . . . . . 5Race and Hispanic Origin . . . . . . . . . . . . . . . . . . . . . . . . . . . . . . . . 5Nativity . . . . . . . . . . . . . . . . . . . . . . . . . . . . . . . . . . . . . . . . . . . . . . 8Region . . . . . . . . . . . . . . . . . . . . . . . . . . . . . . . . . . . . . . . . . . . . . . 8Income Inequality . . . . . . . . . . . . . . . . . . . . . . . . . . . . . . . . . . . . . . 8Work Experience and Earnings . . . . . . . . . . . . . . . . . . . . . . . . . . . . 12Per Capita Income . . . . . . . . . . . . . . . . . . . . . . . . . . . . . . . . . . . . . . 12
Poverty in the United States . . . . . . . . . . . . . . . . . . . . . . . . . . . . . . 13Highlights . . . . . . . . . . . . . . . . . . . . . . . . . . . . . . . . . . . . . . . . . . . . 13Race and Hispanic Origin . . . . . . . . . . . . . . . . . . . . . . . . . . . . . . . . 13Age . . . . . . . . . . . . . . . . . . . . . . . . . . . . . . . . . . . . . . . . . . . . . . . . . 15Nativity . . . . . . . . . . . . . . . . . . . . . . . . . . . . . . . . . . . . . . . . . . . . . . 16Region . . . . . . . . . . . . . . . . . . . . . . . . . . . . . . . . . . . . . . . . . . . . . . 16Residence . . . . . . . . . . . . . . . . . . . . . . . . . . . . . . . . . . . . . . . . . . . . 16Work Experience . . . . . . . . . . . . . . . . . . . . . . . . . . . . . . . . . . . . . . . 16Families . . . . . . . . . . . . . . . . . . . . . . . . . . . . . . . . . . . . . . . . . . . . . 16Depth of Poverty Measures . . . . . . . . . . . . . . . . . . . . . . . . . . . . . . . 17Ratio of Income to Poverty . . . . . . . . . . . . . . . . . . . . . . . . . . . . . . . 18Income Deficit . . . . . . . . . . . . . . . . . . . . . . . . . . . . . . . . . . . . . . . . 19
Health Insurance Coverage in the United States . . . . . . . . . . . . 20Highlights . . . . . . . . . . . . . . . . . . . . . . . . . . . . . . . . . . . . . . . . . . . . 20What Is Health Insurance Coverage? . . . . . . . . . . . . . . . . . . . . . . . . 20Type of Coverage . . . . . . . . . . . . . . . . . . . . . . . . . . . . . . . . . . . . . . 23Race and Hispanic Origin . . . . . . . . . . . . . . . . . . . . . . . . . . . . . . . . 23Nativity . . . . . . . . . . . . . . . . . . . . . . . . . . . . . . . . . . . . . . . . . . . . . . 24Economic Status . . . . . . . . . . . . . . . . . . . . . . . . . . . . . . . . . . . . . . . 24Children’s Health Insurance Coverage . . . . . . . . . . . . . . . . . . . . . . . 25Region . . . . . . . . . . . . . . . . . . . . . . . . . . . . . . . . . . . . . . . . . . . . . . 26Residence . . . . . . . . . . . . . . . . . . . . . . . . . . . . . . . . . . . . . . . . . . . . 26State Level Data . . . . . . . . . . . . . . . . . . . . . . . . . . . . . . . . . . . . . . . 26
CPS Data Collection . . . . . . . . . . . . . . . . . . . . . . . . . . . . . . . . . . . . . 28Additional Data and Contacts . . . . . . . . . . . . . . . . . . . . . . . . . . . . . 28
Comments . . . . . . . . . . . . . . . . . . . . . . . . . . . . . . . . . . . . . . . . . . . . . 28

iv Income, Poverty, and Health Insurance Coverage in the United States: 2005 U.S. Census Bureau
TEXT TABLES
1. Income and Earnings Summary Measures by Selected Characteristics: 2004 and 2005 . . . . . . . . . . . . . . 6
2. Income of Households by Race and Hispanic Origin Using 3-Year-Average Medians: 2003 to 2005 . . . . . 8
3. Distribution of Households by Selected Characteristics Within Income Quintiles: 2005 . . . . . . . . . . . . . . 9
4. People and Families in Poverty by Selected Characteristics: 2004 and 2005 . . . . . . . . . . . . . . . . . . . . . . 14
5. Number in Poverty and Poverty Rates by Race and Hispanic Origin Using 3-Year Average: 2003 to 2005 . . . . . . . . . . . . . . . . . . . . . . . . . . . . . . . . . . . . . . . . . . . . . . . . . . . . . . . 15
6. People With Income Below Specified Ratios of Their Poverty Thresholds by Selected Characteristics: 2005 . . . . . . . . . . . . . . . . . . . . . . . . . . . . . . . . . . . . . . . . . . . . . . . . . . . . . . . 17
7. Income Deficit or Surplus of Families and Unrelated Individuals by Poverty Status: 2005 . . . . . . . . . . . 18
8. People With or Without Health Insurance Coverage by Selected Characteristics: 2004 and 2005 . . . . . . . 22
9. People Without Health Insurance Coverage by Race and Hispanic Origin Using 3-Year Average: 2003 to 2005 . . . . . . . . . . . . . . . . . . . . . . . . . . . . . . . . . . . . . . . . . . . . . . . . . . . . . . . 24
10. Percentage of People Without Health Insurance Coverage by State Using 2- and 3-Year Averages: 2003 to 2005 . . . . . . . . . . . . . . . . . . . . . . . . . . . . . . . . . . . . . . . . . . . . . . . . . . . . . . 27
FIGURES
1. Real Median Household Income: 1967 to 2005 . . . . . . . . . . . . . . . . . . . . . . . . . . . . . . . . . . . . . . . . . . . . 4
2. Distribution of All Households and Households in the Lowest and Highest Income Quintiles by Selected Characteristics: 2005 . . . . . . . . . . . . . . . . . . . . . . . . . . . . . . . . . . . . . . . . . . . . . . . . . . . . 10
3. Female-to-Male Earnings Ratio and Median Earnings of Full-Time, Year-Round Workers 15 Years and Older by Sex: 1960 to 2005 . . . . . . . . . . . . . . . . . . . . . . . . . . . . . . . . . . . . . . . . . . . . . . . 11
4. Number in Poverty and Poverty Rate: 1959 to 2005 . . . . . . . . . . . . . . . . . . . . . . . . . . . . . . . . . . . . . . . . 13
5. Poverty Rates by Age: 1959 to 2005 . . . . . . . . . . . . . . . . . . . . . . . . . . . . . . . . . . . . . . . . . . . . . . . . . . . . 16
6. Coverage by Type of Health Insurance: 2004 and 2005 . . . . . . . . . . . . . . . . . . . . . . . . . . . . . . . . . . . . . 21
7. Number Uninsured and Uninsured Rate: 1987 to 2005 . . . . . . . . . . . . . . . . . . . . . . . . . . . . . . . . . . . . . . 23
8. Uninsured Children by Poverty Status, Age, and Race and Hispanic Origin: 2005 . . . . . . . . . . . . . . . . . 25
9. Differences in 2-Year-Average Uninsured Rates by State: 2004–2005 Less 2003–2004 . . . . . . . . . . . . . . 26
APPENDIXES
Appendix A. Estimates of Income . . . . . . . . . . . . . . . . . . . . . . . . . . . . . . . . . . . . . . . . . . . . . . . . . . . . . . . . 29How Income Is Measured . . . . . . . . . . . . . . . . . . . . . . . . . . . . . . . . . . . . . . . . . . . . . . . . . . . . . . . . . . . 29Cost of Living Adjustment . . . . . . . . . . . . . . . . . . . . . . . . . . . . . . . . . . . . . . . . . . . . . . . . . . . . . . . . . . . 29
Appendix B. Estimates of Poverty . . . . . . . . . . . . . . . . . . . . . . . . . . . . . . . . . . . . . . . . . . . . . . . . . . . . . . . 45How Poverty Is Calculated . . . . . . . . . . . . . . . . . . . . . . . . . . . . . . . . . . . . . . . . . . . . . . . . . . . . . . . . . . . 45
Appendix C. Estimates of Health Insurance Coverage . . . . . . . . . . . . . . . . . . . . . . . . . . . . . . . . . . . . . . 59Quality of Health Insurance Coverage Estimates . . . . . . . . . . . . . . . . . . . . . . . . . . . . . . . . . . . . . . . . . . 59
Appendix D. Comparison of State Estimates . . . . . . . . . . . . . . . . . . . . . . . . . . . . . . . . . . . . . . . . . . . . . . . 76

U.S. Census Bureau Income, Poverty, and Health Insurance Coverage in the United States: 2005 v
APPENDIX TABLES AND FIGURES
A-1. Households by Total Money Income, Race, and Hispanic Origin of Householder: 1967 to 2005 . . . . . . . 31
A-2. Real Median Earnings of Full-Time, Year-Round Workers by Sex and Female-to-MaleEarnings Ratio: 1960 to 2005 . . . . . . . . . . . . . . . . . . . . . . . . . . . . . . . . . . . . . . . . . . . . . . . . . . . . . . . . 38
A-3. Selected Measures of Household Income Dispersion: 1967 to 2005 . . . . . . . . . . . . . . . . . . . . . . . . . . . . 40
B-1. Poverty Status of People by Family Relationship, Race, and Hispanic Origin: 1959 to 2005 . . . . . . . . . . 46
B-2. Poverty Status of People by Age, Race, and Hispanic Origin: 1959 to 2005 . . . . . . . . . . . . . . . . . . . . . . 52
B-3. Poverty Status of Families by Type of Family: 1959 to 2005 . . . . . . . . . . . . . . . . . . . . . . . . . . . . . . . . . . 58
C-1. Health Insurance Coverage by Race and Hispanic Origin: 1987 to 2005 . . . . . . . . . . . . . . . . . . . . . . . . . 60
C-2. Health Insurance Coverage by Age: 1987 to 2005 . . . . . . . . . . . . . . . . . . . . . . . . . . . . . . . . . . . . . . . . . 68
D-1. Three-Year Average Percentage of People Without Health Insurance Coverage by State: 2003 to 2005 . . . . . . . . . . . . . . . . . . . . . . . . . . . . . . . . . . . . . . . . . . . . . . . . . . . . . . . . . . . . 76

h
Income, Poverty, and Health Insurance Coverage in the United States: 2005
U.S. Census Bureau Income, Poverty, and Health Insurance Coverage in the United States: 2005 1
INTRODUCTION
This report presents data on income,poverty, and health insurance cover-age in the United States based oninformation collected in the 2006 andearlier Annual Social and EconomicSupplements (ASEC) to the CurrentPopulation Survey (CPS) conducted bythe U.S. Census Bureau.1
Real median household incomeincreased between 2004 and 2005.2
Both the number of people in povertyand the poverty rate were not
1 This year’s report reflects some changes tothe 2005 ASEC data due to a correction to thesample weights made after the publication of lastyear’s report. In addition to the weighting correc-tion, the health insurance data from the 2005ASEC were revised to reflect improvements to thealgorithm that assigns coverage to dependents.
2 All income values are adjusted to reflect2005 dollars. “Real” refers to income afteradjusting for inflation. The adjustment is basedon percentage changes in prices between earlieryears and 2005 and is computed by dividing theannual average Consumer Price Index ResearchSeries for 2005 by the annual average for earlieryears. The CPI-U-RS values for 1947 to 2005are available in Appendix A and on the Internetat <www.census.gov/hhes/www/income/income05/cpiurs.html>. Inflation between2004 and 2005 was 3.3 percent.
statistically different between 2004and 2005. The number of people withealth insurance coverage increased,while the percentage of people withhealth insurance coverage decreasedbetween 2004 and 2005. Both thenumber and the percentage of peoplewithout health insurance coverageincreased between 2004 and 2005.These results were not uniform acrossdemographic groups. For example,the poverty rate for non-HispanicWhites decreased, while the overallrate was statistically unchanged.3
3 Federal surveys now give respondents theoption of reporting more than one race.Therefore, two basic ways of defining a racegroup are possible. A group such as Asian maybe defined as those who reported Asian and noother race (the race-alone or single-race con-cept) or as those who reported Asian regardlessof whether they also reported another race (therace-alone-or-in-combination concept). Thebody of this report (text, figures, and tables)shows data using the first approach (race alone).The appendix tables show data using bothapproaches. Use of the single-race populationdoes not imply that it is the preferred method ofpresenting or analyzing data. The CensusBureau uses a variety of approaches.
All comparative statements regarding race inthe text are based on the race-alone concept
This report has three main sections—income, poverty, and health insurancecoverage. Each one presents esti-mates by characteristics such as race,Hispanic origin, nativity, and region.Other topics include earnings of year-round, full-time workers; povertyamong families; and health insurancecoverage of children. This report alsocontains data by metropolitan area sta-tus, which were not included last yeardue to the transition from a 1990-based sample design to a 2000-basedsample design. This year, the reportuses a new system of metropolitan
and, unless noted to the contrary, are also truein terms of statistical significance for the race-alone-or-in-combination concept.
In this report, the term “non-Hispanic White”refers to people who are not Hispanic and whoreported White and no other race. The CensusBureau uses non-Hispanic Whites as the compar-ison group for other race groups and Hispanics.
Because Hispanics may be any race, data inthis report for Hispanics overlap with data forracial groups. Being Hispanic was reported by12.1 percent of White householders who reportedonly one race, 2.9 percent of Black householderswho reported only one race, 27.7 percent ofAmerican Indian and Alaska Native householderswho reported only one race, and 9.5 percent ofNative Hawaiian and Other Pacific Islander house-holders who reported only one race.
The data in this report are from the Annual Social andEconomic Supplement (ASEC) to the 2006 CurrentPopulation Survey (CPS). The population represented(the population universe) is the civilian noninstitutional-ized population living in the United States. Members ofthe Armed Forces living off post or with their familieson post are included if at least one civilian adult lives inthe household. Most of the data from the CPS ASECwere collected in March (with some data collected inFebruary and April), and the data were controlled toindependent population estimates for March 2006.
The estimates in this report (which may be shown in text,figures, and tables) are based on responses from a sam-ple of the population and may differ from actual valuesbecause of sampling variability or other factors. As aresult, apparent differences between the estimates fortwo or more groups may not be statistically significant.All comparative statements have undergone statisticaltesting and are significant at the 90-percent confidencelevel unless otherwise noted. Further information aboutthe source and accuracy of the estimates is available at<www.census.gov/hhes/www/p60_231sa.pdf>.
Figure 5.Percentage of People Below Their Three-Parameter Thresholds: 1978–2005

categorization. The data are now pre-sented as inside metropolitan statisti-cal areas, inside principal cities, out-side principal cities, and outsidemetropolitan statistical areas. Thereport concludes with a section dis-cussing health insurance coverage bystate using 2- and 3-year averages.
The income and poverty estimatesshown in this report are based solelyon money income before taxes anddo not include the value of noncashbenefits such as food stamps,Medicare, Medicaid, public housing,and employer-provided fringe bene-fits. Later this year, the CensusBureau will release detailed tables onalternative measures of income andpoverty, which include taxes andselected noncash benefits.
The CPS is one of the longest-runningsurveys conducted by the CensusBureau. The CPS ASEC asks detailedquestions categorizing income intoover 50 sources. The key purpose ofthe CPS ASEC is to provide timely anddetailed estimates of income, poverty,and health insurance coverage and tomeasure change in those estimates atthe national level. The CPS ASEC isthe official source of the nationalpoverty estimates calculated in accor-dance with the Office of Managementand Budget (OMB) Statistical PolicyDirective 14 (Appendix B).
2 Income, Poverty, and Health Insurance Coverage in the United States: 2005 U.S. Census Bureau
State and Local Estimates of Income, Poverty, and Health Insurance
In previous CPS ASEC reports, the Census Bureau produced state estimatesof income and poverty using 2-year and 3-year moving averages. With theexpansion of the American Community Survey (ACS) to approximately 3 mil-lion addresses in 2005 and the lower standard errors that result from thatsample size and design, the Census Bureau is now focusing on annual stateestimates of median household income and poverty from the ACS instead ofthe CPS ASEC. Since 2005 was the first year that the ACS was fully imple-mented, the Census Bureau will not make comparisons between estimatesfrom the 2005 survey and previous years. This report no longer includesstate income and poverty data. Estimates of change in median householdincome and poverty from the CPS ASEC will continue to be available on theInternet for people interested in trend data at the state level.
While the 2005 ACS has the capability to produce annual income andpoverty estimates for counties and places with population of 65,000 ormore, the Census Bureau also produces annual estimates of median house-hold income and poverty for states, as well as for counties and school dis-tricts, based on models using data from the CPS ASEC, the decennial cen-sus, administrative records, and personal income data published by theBureau of Economic Analysis. The model-based estimates have lower vari-ance than the CPS ASEC estimates but are released later due to lags in theavailability of administrative records. Estimates for 2003 are available onthe Internet at <www.census.gov/hhes/www/saipe/index.html>. Estimatesfor 2004 will be available in fall 2006.
Since the ACS does not measure health insurance coverage, this reportcontinues to include the state uninsured rates using 2-year and 3-yearmoving averages. The Census Bureau’s Small Area Health InsuranceEstimates (SAHIE) program has undertaken a project to estimate healthinsurance coverage rates for counties. In July 2005, SAHIE released thefirst estimates ever available on the number of people without healthinsurance coverage for counties for people of all ages and those under 18years old. Estimates for calendar year 2000 are available on the Internetat <www.census.gov/hhes/www/sahie/index.html>.

The Census Bureau also reports on and is designed to provide this infor-income and poverty based on data mation at many levels of geography,from the American Community Survey particularly for local communities. (ACS). The ACS is part of the 2010
Since the CPS ASEC produces theDecennial Census Program and will
most complete and thorough esti-eliminate the need for a long-form
mates of income and poverty, thesample questionnaire. The ACS offers
Census Bureau recommends that peo-broad, comprehensive information on
ple use this data source for nationalsocial, economic, and housing data
estimates. State-level estimates for
income and poverty can now befound in the ACS report Income,Earnings, and Poverty Data From the2005 American Community Survey.Since the ACS does not collect healthinsurance data, this CPS ASEC reportstill includes state-level estimates.For more information on state andlocal estimates, see the text box“State and Local Estimates of Income,Poverty, and Health Insurance.”
The CPS ASEC provides reliable esti-mates of the net change from oneyear to the next in the overall distri-bution of economic characteristics ofthe population, but it does not showhow those characteristics change forthe same person, family, or house-hold. Longitudinal measures ofincome, poverty, and health insurancecoverage that are based on followingthe same people over time are avail-able from the Survey of Income andProgram Participation (SIPP).Estimates derived from SIPP dataanswer questions such as:
• What percentage of householdsmove up or down the income dis-tribution over time?
• How many people remain inpoverty over time?
• How long do people without healthinsurance tend to remain unin-sured?
The text box “Dynamics of EconomicWell-Being” provides more information.
U.S. Census Bureau Income, Poverty, and Health Insurance Coverage in the United States: 2005 3
Dynamics of Economic Well-Being
The Survey of Income and Program Participation (SIPP) provides monthlydata about the labor force participation, income, and health insurance cov-erage of individuals, families, and households during the time span coveredby each of its panels. The data yield insights into the dynamic nature ofthese experiences and the economic mobility of U.S. residents. Informationbased on this data is available in a series of reports titled the Dynamics ofEconomic Well-Being. Topics covered include household income, poverty,health insurance coverage, labor force turnover, unemployment, and pro-gram participation. For example, these reports demonstrate that using alonger time frame to measure poverty (e.g., 2 years) yields, on average, alower poverty rate than the annual measures presented in this report, whileusing a shorter time frame (e.g., 1 month) yields higher poverty rates.
The Census Bureau is currently undertaking a new project to reengineerthe SIPP. The reengineered system, to be known as the Dynamics ofEconomic Well-Being system, is expected to reduce respondent burdenand attrition and to deliver data on a timely basis. Although it will notsupply the same level of detail as the SIPP, its design will offer policy-makers and researchers data that address the same basic issues. Thenew system will use data from current demographic surveys, administra-tive records, and a new demographic survey instrument to identify a pop-ulation cohort that will be measured longitudinally. A major goal of thisnew system is to develop monthly estimates of whether and how muchindividuals participate in cash assistance programs. For further informa-tion about the SIPP, copies of these reports, and information about thenew system, see <www.sipp.census.gov/sipp>.

INCOME IN THE UNITED STATES
Highlights
• The real median income of house-holds in the United States rose by1.1 percent between 2004 and2005, from $45,817 to $46,326(Figure 1 and Table 1).
• The difference in real medianhousehold income between 2004and 2005 was not statistically sig-nificant for each of the race groups
shown in Table 1 and for Hispanichouseholds. (Hispanic household-ers may be any race.4) 5, 6
4 Income, Poverty, and Health Insurance Coverage in the United States: 2005 U.S. Census Bureau
4 The householder is the person (or one of thepeople) in whose name the home is owned orrented and the person to whom the relationship ofother household members is recorded. If thehome is owned jointly by a married couple, eitherthe husband or the wife may be listed as thehouseholder. Since only one person in eachhousehold is designated as the householder, thenumber of householders is equal to the number ofhouseholds. This report uses the characteristicsof the householder to describe the household.
5 Data users should exercise caution wheninterpreting aggregate results for the Hispanicpopulation or for race groups because these
• Real median income of householdsrose in the Northeast (2.9 percent)and in the West (1.5 percent)
populations consist of many distinct groups thatdiffer in socioeconomic characteristics, culture,and recency of immigration. In addition, the CPSdoes not use separate population controls forweighting the Asian sample to national totals.Data were first collected for Hispanics in 1972and for Asian and Pacific Islanders in 1987. Forfurther information, see <www.bls.census.gov/cps/ads/adsmain.htm>.
6 Changes in overall median income do notnecessarily follow changes experienced by com-ponent subgroups because medians do not havethe same mathematical properties as other sum-mary measures, such as means.
Figure 1.Real Median Household Income: 1967 to 2005
Note: The data points are placed at the midpoints of the respective years. Median household income data are not available before 1967.
Source: U.S. Census Bureau, Current Population Survey, 1968 to 2006 Annual Social and Economic Supplements.
2005 dollars Recession
0
5,000
10,000
15,000
20,000
25,000
30,000
35,000
40,000
45,000
50,000
20052000 19951990198519801975197019651959
$46,326
$35,379

between 2004 and 2005. Theapparent change in the medianincome of households for the othertwo regions was not statisticallysignificant (Table 1).7
• The apparent change in householdincome inequality, as measured bythe Gini index and the shares ofaggregate income received by quin-tiles, between 2004 and 2005 wasnot statistically significant (Table 1).8
Over the past 10 years, the Giniindex has increased 4.2 percent.
• The real median earnings of bothmen and women who worked full-time, year-round declined between2004 and 2005 (Table 1). Themedian earnings of men declined1.8 percent to $41,386. Themedian earnings of womendeclined 1.3 percent to $31,858.9
Household Income
The real median income of house-holds in the United States rose by 1.1 percent between 2004 and 2005,from $45,817 to $46,326 (Figure 1and Table 1). The last time median
U.S. Census Bureau Income, Poverty, and Health Insurance Coverage in the United States: 2005 5
7 The Northeast region includes the states ofConnecticut, Maine, Massachusetts, NewHampshire, New Jersey, New York, Pennsylvania,Rhode Island, and Vermont. The Midwest regionincludes the states of Illinois, Indiana, Iowa,Kansas, Michigan, Minnesota, Missouri,Nebraska, North Dakota, Ohio, South Dakota,and Wisconsin. The South region includes thestates of Alabama, Arkansas, Delaware, Florida,Georgia, Kentucky, Louisiana, Maryland,Mississippi, North Carolina, Oklahoma, SouthCarolina, Tennessee, Texas, Virginia, WestVirginia, and the District of Columbia, a stateequivalent. The West region includes the statesof Alaska, Arizona, California, Colorado, Hawaii,Idaho, Montana, Nevada, New Mexico, Oregon,Utah, Washington, and Wyoming. The differencebetween the increases in median householdincome of the Northeast and the West was notstatistically significant.
8 See the article by Paul Allison, “Measures ofInequality,” American Sociological Review, 43,December 1977, pp. 865–880, for an explana-tion of inequality measures.
9 The difference between the declines in theearnings of men and women was not statisti-cally significant.
income of households experienced anannual increase was 1999. Comparedwith 1967, the first year for whichhousehold income statistics are avail-able, real median household incomehas increased 30.9 percent.10
Race and Hispanic Origin
The apparent change in real medianhousehold income between 2004 and2005 was not statistically significantfor each of the race groups shown inTable 1 and for Hispanic households.(Hispanic householders may be anyrace.) Black households had the lowestmedian income in 2005, $30,858,which was 61 percent of the medianfor non-Hispanic White households,$50,784.11 Asian households had thehighest median income among the racegroups. Their 2005 median incomewas $61,094, about 120 percent of themedian for non-Hispanic White house-holds. Median income for Hispanichouseholds was $35,967 in 2005,which was 71 percent of the medianfor non-Hispanic White households.
Table 2 shows income data for theAmerican Indian and Alaska Nativepopulation and the Native Hawaiianand Other Pacific Islander popula-tion.12 Because of the relatively small
10 Using the CPI-U, instead of the CPI-U-RS,real median household income increased 10.9percent since 1967. For a further discussionabout the Census Bureau’s use of the ConsumerPrice Index, see Appendixes C and D, CurrentPopulation Reports, Series P-60, No. 206, MoneyIncome in the United States: 1998, issuedSeptember 1999.
11 The distribution of household income isinfluenced by many factors, such as the numberof earners and household size.
12 Data users should exercise caution wheninterpreting aggregate results for the AmericanIndian and Alaska Native (AIAN) and the NativeHawaiian and Other Pacific Islander (PacificIslander) populations because these populationsconsist of groups that differ in economic char-acteristics. In addition, the CPS does not useseparate population controls for weighting theAIAN and the Pacific Islander samples tonational totals.
populations of these racial groups,the sampling variability of theirincome data is larger than for theother racial groups and may causesingle-year estimates to fluctuatemore widely. To moderate these fluc-tuations in income, the CensusBureau uses 3-year-average medianswhen comparing the incomes of theAmerican Indian and Alaska Nativeand the Native Hawaiian and OtherPacific Islander populations withother racial groups also shown inTable 2.13
The 3-year-average (2003–2005)median income for American Indianand Alaska Native households was:
• Higher than the median for Blackhouseholds.
• Lower than the medians for non-Hispanic White households, Asianhouseholds, Native Hawaiian andOther Pacific Islander households,and Hispanic households.14
The 3-year-average (2003–2005)median income for Native Hawaiianand Other Pacific Islander householdswas:
• Higher than the medians for Blackhouseholds, American Indian andAlaska Native households, andHispanic households.
• Not statistically different from themedian for non-Hispanic Whitehouseholds.
• Lower than the median for Asianhouseholds.
13 The 3-year-average median is the sum ofthree inflation-adjusted (real) single-year medi-ans divided by 3.
14 The median income of households whosehouseholder was American Indian and AlaskaNative alone or in combination was higher thanthe median income of households whose house-holder was American Indian and Alaska Nativealone and households whose householder wasHispanic.

6 Income, Poverty, and Health Insurance Coverage in the United States: 2005 U.S. Census Bureau
Table 1.Income and Earnings Summary Measures by Selected Characteristics: 2004 and 2005(Income in 2005 dollars. Households and people as of March of the following year)
Characteristic
20041 2005Percentage change inreal median income
(2005 less 2004)
Number(thousands)
Median income(dollars)
Number(thousands)
Median income(dollars)
Estimate
90-percentconfidence
interval2 (±)Estimate
90-percentconfidence
interval2 (±) Estimate
90-percentconfidence
interval2 (±)
HOUSEHOLDS
All households . . . . . . . . . . . . .
Type of Household
113,343 45,817 333 114,384 46,326 255 *1.1 0.75
Family households . . . . . . . . . . . . . . . . . . . 76,858 57,179 338 77,402 57,278 332 0.2 0.67Married-couple . . . . . . . . . . . . . . . . . . . .Female householder, no husband
57,975 65,946 490 58,179 66,067 401 0.2 0.78
present . . . . . . . . . . . . . . . . . . . . . . . . . . 13,981 30,823 530 14,093 30,650 431 –0.6 1.79Male householder, no wife present . . . 4,901 46,526 1,151 5,130 46,756 1,031 0.5 2.71
Nonfamily households . . . . . . . . . . . . . . . . 36,485 27,129 262 36,982 27,326 266 0.7 1.12Female householder . . . . . . . . . . . . . . . 19,942 22,594 321 20,230 22,688 413 0.4 1.90Male householder . . . . . . . . . . . . . . . . .
Race3 and Hispanic Origin ofHouseholder
16,543 33,083 386 16,753 34,048 706 *2.9 2.05
White . . . . . . . . . . . . . . . . . . . . . . . . . . . . . . 92,880 48,218 311 93,588 48,554 349 0.7 0.78White, not Hispanic . . . . . . . . . . . . . . . . 81,628 50,546 381 82,003 50,784 283 0.5 0.76
Black . . . . . . . . . . . . . . . . . . . . . . . . . . . . . . 13,809 31,101 532 14,002 30,858 495 –0.8 1.84Asian . . . . . . . . . . . . . . . . . . . . . . . . . . . . . . 4,123 59,427 2,077 4,273 61,094 1,171 2.8 3.42
Hispanic origin (any race) . . . . . . . . . . . .
Age of Householder
12,178 35,417 816 12,519 35,967 587 1.6 1.99
Under 65 years . . . . . . . . . . . . . . . . . . . . . 90,192 52,562 253 90,926 52,287 242 *–0.5 0.5315 to 24 years . . . . . . . . . . . . . . . . . . . . 6,733 28,497 782 6,795 28,770 776 1.0 3.1425 to 34 years . . . . . . . . . . . . . . . . . . . . 19,314 46,985 525 19,120 47,379 571 0.8 1.3435 to 44 years . . . . . . . . . . . . . . . . . . . . 23,248 58,578 551 23,016 58,084 885 –0.8 1.4745 to 54 years . . . . . . . . . . . . . . . . . . . . 23,393 63,068 559 23,731 62,424 724 –1.0 1.1755 to 64 years . . . . . . . . . . . . . . . . . . . . 17,503 52,077 597 18,264 52,260 683 0.4 1.41
65 years and older . . . . . . . . . . . . . . . . . .
Nativity of Householder
23,151 25,336 296 23,459 26,036 288 *2.8 1.33
Native . . . . . . . . . . . . . . . . . . . . . . . . . . . . . . 98,842 46,786 304 99,579 46,897 271 0.2 0.70Foreign born . . . . . . . . . . . . . . . . . . . . . . . . 14,502 40,692 976 14,806 42,040 678 *3.3 2.46
Naturalized citizen . . . . . . . . . . . . . . . . . 6,741 47,642 1,448 6,990 50,030 1,341 *5.0 3.43Not a citizen . . . . . . . . . . . . . . . . . . . . . .
Region
7,761 35,749 1,282 7,815 36,740 778 2.8 3.68
Northeast . . . . . . . . . . . . . . . . . . . . . . . . . . . 21,187 49,462 819 21,054 50,882 610 *2.9 1.72Midwest . . . . . . . . . . . . . . . . . . . . . . . . . . . . 25,939 46,134 661 26,351 45,950 579 –0.4 1.54South . . . . . . . . . . . . . . . . . . . . . . . . . . . . . . 41,224 42,108 374 41,805 42,138 349 0.1 0.98West . . . . . . . . . . . . . . . . . . . . . . . . . . . . . . .
Residence
24,993 49,245 668 25,174 50,002 609 *1.5 1.50
Inside metropolitan statistical areas . . . . (NA) (NA) (NA) 95,107 48,474 360 (X) (X)Inside principal cities . . . . . . . . . . . . . . . (NA) (NA) (NA) 38,008 41,166 354 (X) (X)Outside principal cities . . . . . . . . . . . . . (NA) (NA) (NA) 57,098 53,544 531 (X) (X)
4Outside metropolitan statistical areas . . (NA) (NA) (NA) 19,278 37,564 683 (X) (X)
See footnotes at end of table.

U.S. Census Bureau Income, Poverty, and Health Insurance Coverage in the United States: 2005 7
Table 1.Income and Earnings Summary Measures by Selected Characteristics: 2004 and 2005—Con.(Income in 2005 dollars. Households and people as of March of the following year)
Characteristic
20041 2005Percentage change inreal median income
(2005 less 2004)
Number(thousands)
Median income(dollars)
Number(thousands)
Median income(dollars)
Estimate
90-percentconfidence
interval2 (±)Estimate
90-percentconfidence
interval2 (±) Estimate
90-percentconfidence
interval2 (±)
Shares of Household IncomeQuintiles and Gini Index5
Lowest quintile . . . . . . . . . . . . . . . . . . . . . . 22,669 3.4 0.04 22,877 3.4 0.04 –0.7 1.27Second quintile . . . . . . . . . . . . . . . . . . . . . . 22,669 8.7 0.10 22,877 8.6 0.10 –0.4 1.26Third quintile . . . . . . . . . . . . . . . . . . . . . . . . 22,669 14.7 0.16 22,877 14.6 0.16 –0.5 1.26Fourth quintile . . . . . . . . . . . . . . . . . . . . . . . 22,669 23.2 0.26 22,877 23.0 0.25 –0.7 1.25Highest quintile . . . . . . . . . . . . . . . . . . . . . . 22,669 50.1 0.56 22,877 50.4 0.56 0.6 1.27
Gini index of income inequality . . . . . . . .
EARNINGS OF FULL-TIME,YEAR-ROUND WORKERS
113,343 0.466 0.0047 114,384 0.469 0.0047 0.6 1.17
Men with earnings . . . . . . . . . . . . . . . . . . . 60,088 42,160 153 61,500 41,386 148 *–1.8 0.42Women with earnings . . . . . . . . . . . . . . . .
PER CAPITA INCOME6
42,380 32,285 134 43,351 31,858 133 *–1.3 0.47
Total3 . . . . . . . . . . . . . . . . . . . . . . 291,166 24,655 156 293,834 25,036 160 *1.5 0.77White . . . . . . . . . . . . . . . . . . . . . . . . . . . . . . 234,116 26,067 182 235,903 26,496 188 *1.6 0.85
White, not Hispanic . . . . . . . . . . . . . . . . 195,347 28,357 209 195,893 28,946 219 *2.1 0.91Black . . . . . . . . . . . . . . . . . . . . . . . . . . . . . . 36,548 16,561 298 36,965 16,874 303 1.9 2.16Asian . . . . . . . . . . . . . . . . . . . . . . . . . . . . . . 12,241 27,040 918 12,599 27,331 832 1.1 3.87
Hispanic origin (any race) . . . . . . . . . . . . 41,840 14,577 304 43,168 14,483 253 –0.6 2.03
(NA) Not available.(X) Not applicable.* Statistically different from zero at the 90-percent confidence level.1 The 2004 data have been revised to reflect a correction to the weights in the 2005 ASEC.2 A 90-percent confidence interval is a measure of an estimate’s variability. The larger the confidence interval in relation to the size of the estimate, the less reliable the
estimate. For more information, see ‘‘Standard Errors and Their Use’’ at <www.census.gov/hhes/www/income/p60_231sa.pdf>.3 Federal surveys now give respondents the option of reporting more than one race. Therefore, two basic ways of defining a race group are possible. A group such as
Asian may be defined as those who reported Asian and no other race (the race-alone or single-race concept) or as those who reported Asian regardless of whether theyalso reported another race (the race-alone-or-in-combination concept). This table shows data using the first approach (race alone). The use of the single-race populationdoes not imply that it is the preferred method of presenting or analyzing data. The Census Bureau uses a variety of approaches. Information on people who reported morethan one race, such as White and American Indian and Alaska Native or Asian and Black or African American, is available from Census 2000 through American FactFinder.About 2.6 percent of people reported more than one race in Census 2000.
4 The ‘‘Outside metropolitan statistical areas’’ category includes both micropolitan statistical areas and territory outside of metropolitan and micropolitan statistical areas.For more information, see ‘‘About Metropolitan and Micropolitan Statistical Areas’’ at <www.census.gov/population/www/estimates/aboutmetro.html>.
5 The data shown in this section are shares of aggregate household income, the Gini index, and their respective confidence intervals. See the article by Paul Allison,‘‘Measures of Inequality,’’ American Sociological Review, 43, December 1977, pp. 865–880, for an explanation of inequality measures.
6 The data shown in this section are per capita incomes and their respective confidence intervals. Per capita income is the mean income computed for every man,woman, and child in a particular group. It is derived by dividing the total income of a particular group by the total population in that group (excluding patients or inmates ininstitutional quarters).
Source: U.S. Census Bureau, Current Population Survey, 2005 and 2006 Annual Social and Economic Supplements.

Nativity
Real median household income roseby 3.3 percent to $42,040 forforeign-born households between2004 and 2005 (Table 1). The appar-ent change for native households wasnot statistically significant.15 Amongforeign-born households, those main-tained by a householder who was anaturalized citizen experienced anincrease in median income of 5.0 per-cent to $50,030, which was higherthan that of native households($46,897).16
Region
Real median income of householdsrose in the Northeast (2.9 percent)and in the West (1.5 percent) between2004 and 2005. The apparentchange in the median income ofhouseholds for the other two regionswas not statistically significant (Table 1).17 The last time theNortheast experienced an annualincrease in median household incomewas in 2000; for the West it was in1999. In 2005, households in theNortheast had the highest householdincome ($50,882), followed by house-holds in the West ($50,002) and theMidwest ($45,950). Households inthe South had the lowest medianincome ($42,138).
8 Income, Poverty, and Health Insurance Coverage in the United States: 2005 U.S. Census Bureau
15 Native households are those in which thehouseholder was born in the United States,Puerto Rico, or certain U.S. island areas (Guam,the Northern Mariana islands, or the VirginIslands of the United States) or was born in aforeign country but had at least one parent whowas a U.S. citizen. All other households are con-sidered foreign born regardless of the date ofentry into the United States or citizenship status.The CPS does not interview households in PuertoRico. Of all households, 87.1 percent werenative households, 6.1 percent were householdswith foreign-born householders who were natu-ralized citizens, and 6.8 percent were noncitizenhouseholds.
16 The difference between the percentincreases in median household income offoreign-born households and households main-tained by a naturalized citizen was not statisti-cally significant.
17 The difference between the increases inmedian household income of the Northeast andthe West was not statistically significant.
Income Inequality
The Gini index, one of the mostwidely used inequality measures, didnot measure a statistically significantchange in household income inequal-ity between 2004 and 2005. Overthe past 10 years, the Gini index hasincreased 4.2 percent (from 0.450 to0.469), although the individualannual differences since then werenot statistically significant.(Appendix Table A-3 lists historicalinequality measures.)18
The Gini index is computed by usingthe shares of aggregate income
18 Direct comparisons with years earlier than1993 are not recommended because of substan-tial methodological changes in the 1994 ASEC.In that year, the Census Bureau introducedcomputer-assisted interviewing, increased incomereporting limits, and introduced new 1990 decen-nial-census-based population controls.
received by households at variouslevels in the distribution (e.g., per-centiles). The share of aggregateincome received by the quintiles canalso be used as an inequality meas-ure. The differences between 2004and 2005 in the shares for each ofthe five quintiles were not statisticallysignificant. In 2005, the share ofaggregate income received by thelowest household income quintilewas 3.4 percent. The second quintilereceived 8.6 percent; the third quin-tile, 14.6 percent; the fourth quintile,23.0 percent; and the highest quin-tile, 50.4 percent.
The ratio of household income at var-ious percentiles can also be used as ameasure of income inequality.Between 2004 and 2005, real medianincome rose by 1.1 percent, the
Table 2.Income of Households by Race and Hispanic Origin Using3-Year-Average Medians: 2003 to 2005(Income in 2005 dollars)
Race1 and Hispanic origin
3-year-averagemedian income2
2003–20053
(dollars)
Estimate
90-percentconfidence
interval4 (±)
All races . . . . . . . . . . . . . . . . . . . . . . . . . . . . . . . . . . . 46,037 216
White . . . . . . . . . . . . . . . . . . . . . . . . . . . . . . . . . . . . . . . . . . . . . . 48,399 226White, not Hispanic . . . . . . . . . . . . . . . . . . . . . . . . . . . . . . . . 50,677 252
Black . . . . . . . . . . . . . . . . . . . . . . . . . . . . . . . . . . . . . . . . . . . . . . . 31,140 397
American Indian and Alaska Native . . . . . . . . . . . . . . . . . . . . 33,627 1,680
Asian . . . . . . . . . . . . . . . . . . . . . . . . . . . . . . . . . . . . . . . . . . . . . . 59,877 1,239
Native Hawaiian and Other Pacific Islander . . . . . . . . . . . . . 54,318 4,183
Hispanic origin (any race) . . . . . . . . . . . . . . . . . . . . . . . . . . . . 35,467 521
1 Federal surveys now give respondents the option of reporting more than one race. Therefore, two basicways of defining a race group are possible. A group such as Asian may be defined as those who reported Asianand no other race (the race-alone or single-race concept) or as those who reported Asian regardless of whetherthey also reported another race (the race-alone-or-in-combination concept). This table shows data using the firstapproach (race alone). The use of the single-race population does not imply that it is the preferred method ofpresenting or analyzing data. The Census Bureau uses a variety of approaches. Information on people whoreported more than one race, such as White and American Indian and Alaska Native or Asian and Black orAfrican American, is available from Census 2000 through American FactFinder. About 2.6 percent of peoplereported more than one race in Census 2000.
2 The 3-year-average median is the sum of three inflation-adjusted single-year medians divided by 3.3 The 2004 data have been revised to reflect a correction to the weights in the 2005 ASEC.4 A 90-percent confidence interval is a measure of an estimate’s variability. The larger the confidence
interval in relation to the size of the estimate, the less reliable the estimate. For more information, see‘‘Standard Errors and Their Use’’ at <www.census.gov/hhes/www/income/p60_231sa.pdf>.
Source: U.S. Census Bureau, Current Population Survey, 2004 to 2006 Annual Social and EconomicSupplements.

U.S. Census Bureau Income, Poverty, and Health Insurance Coverage in the United States: 2005 9
Table 3.Distribution of Households by Selected Characteristics Within Income Quintiles: 2005(Households as of March 2006)
Total households Lowest quintile Middle three quintiles Highest quintile
Characteristic 90-percent 90-percent 90-percent 90-percentconfidence confidence confidence confidence
Estimate interval1 (±) Estimate interval1 (±) Estimate interval1(±) Estimate interval1 (±)
Total number of households . . . 114,384 419 22,877 252 68,630 385 22,877 252Percent . . . . . . . . . . . . . . . . . . . . . . . . . . . . . . . 100.0 (X) 100.0 (X) 100.0 (X) 100.0 (X)Upper income limit (dollars) . . . . . . . . . . . . . (X) (X) $19,178 107 $91,705 322 (NA) (X)
Residence
Inside metropolitan statistical areas . . . . . . 83.1 0.19 78.8 0.47 82.0 0.26 90.8 0.34Inside principal cities . . . . . . . . . . . . . . . . . 33.2 0.24 39.9 0.57 32.3 0.31 29.3 0.53Outside principal cities . . . . . . . . . . . . . . . 49.9 0.26 39.0 0.57 49.7 0.34 61.5 0.57
2Outside metropolitan statistical areas . . . . 16.9 0.19 21.2 0.47 18.0 0.26 9.2 0.34
Region
Northeast . . . . . . . . . . . . . . . . . . . . . . . . . . . . . 18.4 0.20 17.5 0.44 17.5 0.25 22.2 0.48Midwest . . . . . . . . . . . . . . . . . . . . . . . . . . . . . . 23.0 0.22 22.6 0.49 23.9 0.29 20.9 0.47South . . . . . . . . . . . . . . . . . . . . . . . . . . . . . . . . 36.5 0.25 40.2 0.57 36.8 0.32 32.0 0.54West . . . . . . . . . . . . . . . . . . . . . . . . . . . . . . . . . 22.0 0.22 19.6 0.46 21.9 0.28 24.9 0.50
Type of Household
Family household . . . . . . . . . . . . . . . . . . . . . . 67.7 0.24 41.0 0.57 70.0 0.31 87.5 0.38Married-couple family . . . . . . . . . . . . . . . . 50.9 0.26 17.9 0.45 52.5 0.33 79.0 0.47Female householder, no husband
present . . . . . . . . . . . . . . . . . . . . . . . . . . . . 12.3 0.17 19.7 0.46 12.4 0.22 4.8 0.25Male householder, no wife present . . . . . 4.5 0.11 3.4 0.21 5.1 0.15 3.6 0.22
Nonfamily householder . . . . . . . . . . . . . . . . . 32.3 0.24 59.0 0.57 30.0 0.31 12.5 0.38Householder living alone . . . . . . . . . . . . . 26.6 0.23 55.5 0.58 23.6 0.28 6.8 0.29
Age of Householder
15 to 34 years . . . . . . . . . . . . . . . . . . . . . . . . . 22.6 0.22 23.5 0.49 25.0 0.29 14.8 0.4135 to 54 years . . . . . . . . . . . . . . . . . . . . . . . . . 40.8 0.26 25.9 0.51 40.4 0.33 57.2 0.5755 to 64 years . . . . . . . . . . . . . . . . . . . . . . . . . 16.0 0.19 13.5 0.40 15.5 0.24 19.7 0.4665 years and older . . . . . . . . . . . . . . . . . . . . . 20.5 0.21 37.1 0.56 19.0 0.26 8.3 0.32
Race3 and Hispanic Origin ofHouseholder
White . . . . . . . . . . . . . . . . . . . . . . . . . . . . . . . . 81.8 0.20 73.6 0.51 82.9 0.25 86.7 0.39White, not Hispanic . . . . . . . . . . . . . . . . . . 71.7 0.23 61.4 0.57 72.0 0.30 81.2 0.45
Black . . . . . . . . . . . . . . . . . . . . . . . . . . . . . . . . . 12.2 0.17 20.6 0.47 11.6 0.21 5.8 0.27Asian . . . . . . . . . . . . . . . . . . . . . . . . . . . . . . . . . 3.7 0.10 3.0 0.20 3.3 0.12 5.8 0.27
Hispanic origin (any race) . . . . . . . . . . . . . . . 10.9 0.16 13.4 0.40 11.8 0.22 5.9 0.27
Number of Earners
No earners . . . . . . . . . . . . . . . . . . . . . . . . . . . . 21.2 0.21 58.7 0.57 14.9 0.24 2.6 0.18One earner . . . . . . . . . . . . . . . . . . . . . . . . . . . 36.8 0.25 35.9 0.56 42.3 0.33 21.1 0.47Two or more earners . . . . . . . . . . . . . . . . . . . 42.0 0.26 5.5 0.26 42.8 0.33 76.3 0.49
Work Experience of Householder
Worked . . . . . . . . . . . . . . . . . . . . . . . . . . . . . . . 69.1 0.24 35.8 0.56 73.7 0.30 88.7 0.37Worked full-time, year-round . . . . . . . . . . 50.2 0.26 14.0 0.40 54.7 0.33 73.0 0.52Worked part-time or part-year . . . . . . . . . 18.9 0.20 21.9 0.48 19.0 0.26 15.7 0.42
Did not work . . . . . . . . . . . . . . . . . . . . . . . . . . 30.9 0.24 64.2 0.56 26.3 0.30 11.3 0.37
(NA) Not available.(X) Not applicable.1 A 90-percent confidence interval is a measure of an estimate’s variability. The larger the confidence interval in relation to the size of the estimate, the less reliable the
estimate. For more information, see ‘‘Standard Errors and Their Use’’ at <www.census.gov/hhes/www/income/p60_231sa.pdf>.2 The ‘‘Outside metropolitan statistical areas’’ category includes both micropolitan statistical areas and territory outside of metropolitan and micropolitan statistical areas.
For more information, see ‘‘About Metropolitan and Micropolitan Statistical Areas’’ at <www.census.gov/population/www/estimates/aboutmetro.html>.3 Federal surveys now give respondents the option of reporting more than one race. Therefore, two basic ways of defining a race group are possible. A group such as
Asian may be defined as those who reported Asian and no other race (the race-alone or single-race concept) or as those who reported Asian regardless of whether theyalso reported another race (the race-alone-or-in-combination concept). This table shows data using the first approach (race alone). The use of the single-race populationdoes not imply that it is the preferred method of presenting or analyzing data. The Census Bureau uses a variety of approaches. Information on people who reported morethan one race, such as White and American Indian and Alaska Native or Asian and Black or African American, is available from Census 2000 through American FactFinder.About 2.6 percent of people reported more than one race in Census 2000.
Source: U.S. Census Bureau, Current Population Survey, 2006 Annual Social and Economic Supplement.

apparent change in real income at the10th percentile was not statisticallysignificant, and at the 90th percentileshowed an increase of 0.9 percent.Since 1995, real median income hasincreased 6.9 percent, while incomeat the 90th percentile has increased13.0 percent, and income at the 10thpercentile has increased 2.3 percent.Similar to the 10-year increase in theGini index (4.2 percent), the 50th-percentile-to-the-10th-percentile ratiohas increased 4.5 percent, while the90th-percentile-to-the-10th-percentileratio has increased 10.5 percent.19
Table 3 shows the characteristics of allhouseholds, and households in thelowest-income quintile, the combinedmiddle three income quintiles, and thehighest-income quintile. Households inthe lowest quintile had incomes of$19,178 or less in 2005. Householdsin the combined middle three hadincomes from $19,179 to $91,705,and households in the highest quintilehad incomes above $91,705.
Households were not evenly distrib-uted within quintiles by characteristic.For example, while the majority ofhouseholds are found in metropolitanareas (83.1 percent), a larger propor-tion was in the highest quintile group(90.8 percent) than in the lowest quin-tile group (78.8 percent). More pro-nounced was the unequal distributionof households found outside the prin-cipal cities in metropolitan areas(suburbs). While 49.9 percent ofhouseholds were in the suburbs, 61.5 percent of the highest-incomequintile households were in the sub-urbs, compared with 39.0 percent ofthe lowest quintile households.
10 Income, Poverty, and Health Insurance Coverage in the United States: 2005 U.S. Census Bureau
19 The differences among the following esti-mates were not statistically significant: the2004–2005 change in median householdincome, the 2004–2005 change in income at the90th percentile, and the 1995–2005 change inincome at the 10th percentile; the 1995–2005change in income at the 10th percentile, the1995–2005 changes in the Gini index and the50th-percentile-to-10th-percentile ratio.
Figure 2.Distribution of All Households and Households in the Lowest and Highest Income Quintiles by Selected Characteristics: 2005
Source: U.S. Census Bureau, Current Population Survey, 2006 Annual Social and Economic Supplement.
Did not work
Worked part-time or part-year
Worked full-time, year-round
Worked
Two or more earners
One earner
No earners
Hispanic origin (any race)
Asian
Black
White, not Hispanic
65 years and older
55 to 64 years
35 to 54 years
15 to 34 years
Nonfamily household
Family household
West
South
Midwest
Northeast
Percent of all households
Percent of households in the lowest quintile
Percent of households in the highest quintile
(Percent)
Type of household
Age of householder
Race and Hispanic origin of householder
Number of earners
Work experience of householder
Region
18.417.5
22.223.022.6
20.936.5
40.232.0
22.019.6
24.9
67.741.0
87.532.3
59.012.5
22.623.5
14.840.8
25.957.2
16.013.5
19.720.5
37.18.3
71.761.4
81.212.2
20.65.8
3.73.0
5.8
10.913.4
5.9
21.258.7
2.636.835.9
21.142.0
5.576.3
69.135.8
88.750.2
14.073.0
18.921.9
15.730.9
64.211.3

Household type also varied byincome quintile—the higher theincome, the more likely householdswere to be family households (Table 3and Figure 2). With 67.7 percent ofhouseholds made up of families, thehighest income quintile consisted of87.5 percent family households, whilethe lowest quintile contained 41.0percent. Conversely, the proportionof nonfamily households was 59.0percent of households in the lowestquintile and 12.5 percent of house-holds in the highest income quintile.20
U.S. Census Bureau Income, Poverty, and Health Insurance Coverage in the United States: 2005 11
20 A family household is a household main-tained by a householder who is in a family (andincludes any unrelated people who may beresiding there). A nonfamily household consistsof a householder living alone (a one-personhousehold) or a householder who shares thehome exclusively with people to whom he orshe is not related.
The race and Hispanic origin of thehouseholder varied by income quin-tile (Table 3 and Figure 2). Nearly 72 percent of households were non-Hispanic White households, 12.2 per-cent were Black, and 10.9 percentwere Hispanic. Non-Hispanic Whitehouseholds represented a larger pro-portion of households in the highestincome quintile (81.2 percent) than inthe lowest income quintile (61.4 per-cent), while Black households andHispanic households represented alarger proportion of households inthe lowest income quintile (20.6 per-cent and 13.4 percent, respectively)than in the highest (5.8 percent and5.9 percent, respectively).21
21 The difference between the percentage ofhouseholds in the highest quintile maintainedby Black householders and by Hispanic house-holders was not statistically significant.
The number of earners and the workexperience of the householder wererelated to the level of householdincome (Table 3 and Figure 2). Themajority of households in the lowestincome quintile either had no earneror only one earner (94.6 percent),while 58.0 percent of all householdshad fewer than two earners. Also,the majority of householders in thelowest quintile did not work orworked part-time or part-year in 2005(86.1 percent). In contrast, 42.0 per-cent of all households had two ormore earners, with the majority ofhouseholds in the highest incomequintile having two or more earners(76.3 percent) and a working house-holder (88.7 percent). Among house-holders in the highest quintile, 73.0percent worked full-time, year-round.
Figure 3.Female-to-Male Earnings Ratio and Median Earnings of Full-Time, Year-Round Workers 15 Years and Older by Sex: 1960 to 2005
Note: The data points are placed at the midpoints of the respective years. Data on earnings of full-time, year-round workers are not readily available before 1960.
Source: U.S. Census Bureau, Current Population Survey, 1961 to 2006 Annual Social and Economic Supplements.
Earnings in thousands (2005 dollars), ratio in percent Recession
0
10
20
30
40
50
60
70
80
90
20052000 19951990198519801975197019651959
Earnings of women
Female-to-male earnings ratio
Earnings of men
77%
$41,386
$31,858

Table 3 reflects the fact that peakearnings are most likely to occur inthe middle-age years. In 2005, about40.8 percent of householders wereaged 35 to 54. The highest incomequintile was made up of 57.2 percentof householders in this age group,while the lowest quintile had 25.9percent. This pattern is reversed forthe youngest and oldest age groups.Householders aged 15 to 34 or 65and older composed 43.1 percent ofall householders and represented60.6 percent of households in thelowest quintile and 23.1 percent ofhouseholds in the highest quintile.
Work Experience and Earnings
The number of working men aged 15and older increased by 1.5 millionbetween 2004 and 2005 to 83.0 mil-lion. An estimated 74.1 percentworked full-time, year-round, notstatistically different from the 2004
estimate.22 The number of womenworkers was 72.5 million, an increaseof 0.5 million from 2004. About 59.8percent of women worked full-time,year-round, a higher percentage thanin 2004 (58.8 percent).
Earnings represent the largest compo-nent of income; earnings trends andincome trends may not be perfectlycorrelated. While median householdincome in 2005 rose by 1.1 percent,the real median earnings of both menand women who worked full-time,year-round declined between 2004and 2005 (Table 1 and Figure 3). Themedian earnings of men declined 1.8 percent to $41,386. The medianearnings of women declined 1.3 per-cent to $31,858.23 This is the second
12 Income, Poverty, and Health Insurance Coverage in the United States: 2005 U.S. Census Bureau
22 A full-time, year-round worker is a personwho worked 35 or more hours per week (full-time) and 50 or more weeks during the previ-ous calendar year (year-round). For school per-sonnel, the summer vacation is counted asweeks worked if they are scheduled to return totheir job in the fall.
23 The difference between the declines in theearnings of men and women was not statisti-cally significant.
consecutive year that men experi-enced a decline in earnings and thethird consecutive year for women.The female-to-male earnings ratio was.77 in 2005, not statistically differentfrom the 2004 ratio.
Per Capita Income
Real per capita income rose by 1.5percent for the overall population andby 2.1 percent for the non-HispanicWhite population between 2004 and2005. The apparent change in theper capita income of each of theother race groups and Hispanics wasnot statistically significant.24 The percapita income for the overall popula-tion in 2005 was $25,036; for non-Hispanic Whites, it was $28,946; forBlacks, $16,874; for Asians, $27,331;and for Hispanics, $14,483.
24 The per capita income of the Black alone-or-in-combination population increased by 2.2 per-cent between 2004 and 2005. The differencesbetween the increases in the per capita incomesof the overall population, the non-Hispanic White,and Black alone-or-in-combination populationswere not statistically significant.
POVERTY IN THE UNITED STATES25
Highlights
• The official poverty rate in 2005was 12.6 percent, not statisticallydifferent from 2004 (Table 4).
• In 2005, 37.0 million people werein poverty, not statistically differ-ent from 2004.
• Poverty rates remained statisticallyunchanged for Blacks (24.9 per-cent) and Hispanics (21.8 percent)between 2004 and 2005. Thepoverty rate decreased for non-Hispanic Whites (8.3 percent in2005, down from 8.7 percent in 2004).
U.S. Census Bureau Income, Poverty, and Health Insurance Coverage in the United States: 2005 13
25 OMB determined the official definition ofpoverty in Statistical Policy Directive 14. Usingthis definition, the Census Bureau calculateswho is in poverty, as described in Appendix B.
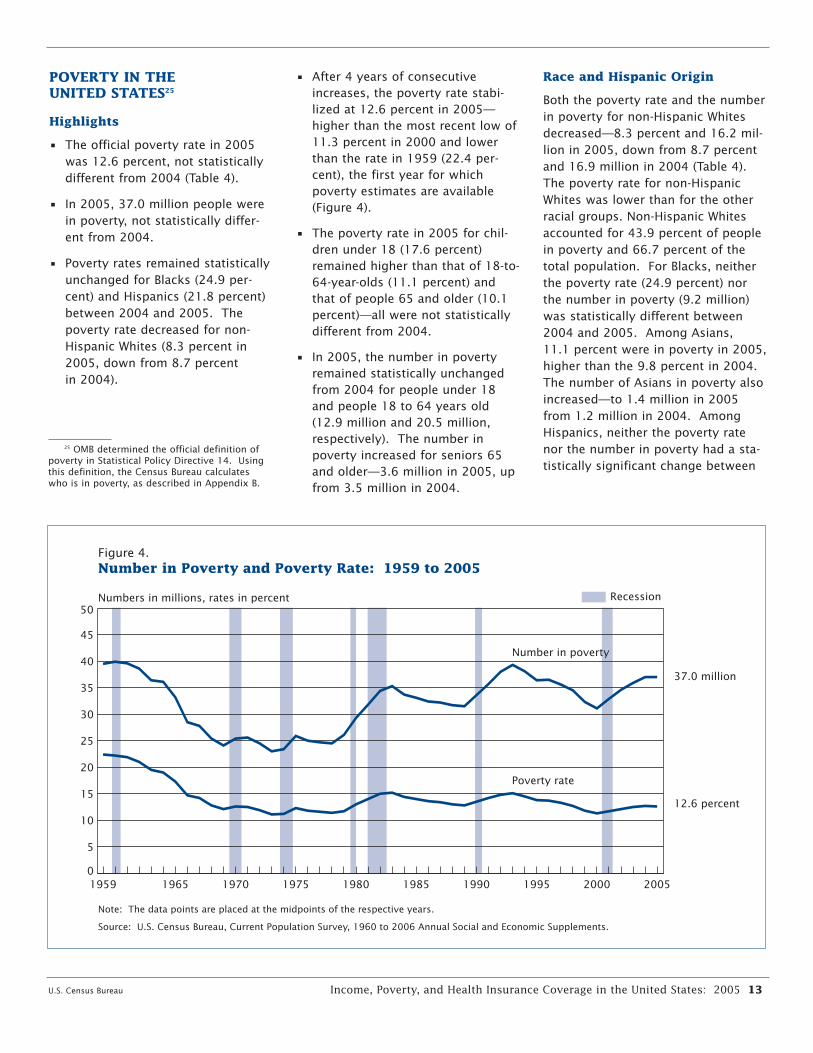
• After 4 years of consecutiveincreases, the poverty rate stabi-lized at 12.6 percent in 2005—higher than the most recent low of11.3 percent in 2000 and lowerthan the rate in 1959 (22.4 per-cent), the first year for whichpoverty estimates are available(Figure 4).
• The poverty rate in 2005 for chil-dren under 18 (17.6 percent)remained higher than that of 18-to-64-year-olds (11.1 percent) andthat of people 65 and older (10.1percent)—all were not statisticallydifferent from 2004.
• In 2005, the number in povertyremained statistically unchangedfrom 2004 for people under 18and people 18 to 64 years old(12.9 million and 20.5 million,respectively). The number inpoverty increased for seniors 65and older—3.6 million in 2005, upfrom 3.5 million in 2004.
Race and Hispanic Origin
Both the poverty rate and the numberin poverty for non-Hispanic Whitesdecreased—8.3 percent and 16.2 mil-lion in 2005, down from 8.7 percentand 16.9 million in 2004 (Table 4).The poverty rate for non-HispanicWhites was lower than for the otherracial groups. Non-Hispanic Whitesaccounted for 43.9 percent of peoplein poverty and 66.7 percent of thetotal population. For Blacks, neitherthe poverty rate (24.9 percent) northe number in poverty (9.2 million)was statistically different between2004 and 2005. Among Asians, 11.1 percent were in poverty in 2005,higher than the 9.8 percent in 2004.The number of Asians in poverty alsoincreased—to 1.4 million in 2005from 1.2 million in 2004. AmongHispanics, neither the poverty ratenor the number in poverty had a sta-tistically significant change between
Figure 4.Number in Poverty and Poverty Rate: 1959 to 2005
Note: The data points are placed at the midpoints of the respective years.
Source: U.S. Census Bureau, Current Population Survey, 1960 to 2006 Annual Social and Economic Supplements.
Numbers in millions, rates in percent
0
5
10
15
20
25
30
35
40
45
50
20052000 19951990198519801975197019651959
Recession
37.0 million
12.6 percent
Number in poverty
Poverty rate

14 Income, Poverty, and Health Insurance Coverage in the United States: 2005 U.S. Census Bureau
Table 4.People and Families in Poverty by Selected Characteristics: 2004 and 2005(Numbers in thousands, confidence intervals (C.I.) in thousands or percentage points as appropriate. People as of March of the following year)
Below poverty in 20041 Below poverty in 2005 Change in poverty (2005 less 2004)3
Characteristic 90- 90- 90- 90- 90- 90-percent Per- percent percent percent percent Per- percent
Number C.I.2 (±) centage C.I.2 (±) Number C.I.2 (±) Number C.I.2 (±) Number C.I.2 (±) centage C.I.2 (±)
PEOPLETotal . . . . . . . . . . . . . . . . . . . . 37,040 680 12.7 0.2 36,950 679 12.6 0.2 –90 713 –0.1 0.2
Family StatusIn families. . . . . . . . . . . . . . . . . . . . . . . . 26,544 587 11.0 0.2 26,068 583 10.8 0.2 –476 614 *–0.3 0.3
Householder . . . . . . . . . . . . . . . . . . . . 7,835 187 10.2 0.2 7,657 184 9.9 0.2 –177 212 *–0.3 0.3Related children under 18. . . . . . . . . 12,473 341 17.3 0.5 12,335 340 17.1 0.5 –138 357 –0.2 0.5
Related children under 6 . . . . . . . . 4,747 220 20.0 1.0 4,784 220 20.0 1.0 37 231 – 1.0In unrelated subfamilies . . . . . . . . . . . . 570 90 45.4 8.0 456 81 37.4 7.2 *–114 90 *–8.1 8.0
Reference person . . . . . . . . . . . . . . . 234 58 45.4 12.4 181 51 35.9 11.0 –53 57 –9.5 12.3Children under 18 . . . . . . . . . . . . . . . 315 59 46.6 9.9 270 54 39.7 9.0 –45 60 –6.9 9.9
Unrelated individual. . . . . . . . . . . . . . . . 9,926 217 20.4 0.5 10,425 224 21.1 0.5 *499 252 *0.6 0.5Male . . . . . . . . . . . . . . . . . . . . . . . . . . 4,316 131 18.2 0.6 4,315 131 17.9 0.6 –1 149 –0.4 0.7Female . . . . . . . . . . . . . . . . . . . . . . . . 5,611 153 22.5 0.7 6,111 161 24.1 0.7 *500 179 *1.6 0.8
Race4 and Hispanic OriginWhite . . . . . . . . . . . . . . . . . . . . . . . . . . . 25,327 575 10.8 0.2 24,872 570 10.6 0.2 –456 653 –0.3 0.3
White, not Hispanic . . . . . . . . . . . . . . 16,908 477 8.7 0.2 16,227 468 8.3 0.2 *–682 539 *–0.4 0.3Black. . . . . . . . . . . . . . . . . . . . . . . . . . . . 9,014 329 24.7 0.9 9,168 332 24.9 0.9 154 347 0.2 0.9Asian. . . . . . . . . . . . . . . . . . . . . . . . . . . . 1,201 127 9.8 1.0 1,402 137 11.1 1.1 *201 139 *1.3 1.1
Hispanic origin (any race). . . . . . . . . . . 9,122 319 21.9 0.8 9,368 324 21.8 0.8 246 269 –0.1 0.6
AgeUnder 18 years . . . . . . . . . . . . . . . . . . . 13,041 347 17.8 0.5 12,896 346 17.6 0.5 –145 364 –0.2 0.518 to 64 years . . . . . . . . . . . . . . . . . . . . 20,545 517 11.3 0.3 20,450 516 11.1 0.3 –95 542 –0.2 0.365 years and older . . . . . . . . . . . . . . . . 3,453 130 9.8 0.4 3,603 132 10.1 0.4 *150 137 0.3 0.4
NativityNative . . . . . . . . . . . . . . . . . . . . . . . . . . . 31,023 630 12.1 0.2 31,080 630 12.1 0.2 57 661 –0.1 0.3Foreign born. . . . . . . . . . . . . . . . . . . . . . 6,017 331 17.1 1.0 5,870 327 16.5 1.0 –147 345 –0.6 1.0
Naturalized citizen . . . . . . . . . . . . . . . 1,326 157 9.8 1.2 1,441 163 10.4 1.2 115 168 0.6 1.3Not a citizen . . . . . . . . . . . . . . . . . . . . 4,691 293 21.6 1.4 4,429 285 20.4 1.4 –262 303 –1.3 1.5
RegionNortheast . . . . . . . . . . . . . . . . . . . . . . . . 6,260 288 11.6 0.5 6,103 285 11.3 0.5 –156 301 –0.3 0.6Midwest . . . . . . . . . . . . . . . . . . . . . . . . . 7,545 313 11.7 0.5 7,419 311 11.4 0.5 –126 327 –0.2 0.5South . . . . . . . . . . . . . . . . . . . . . . . . . . . 14,817 443 14.1 0.4 14,854 444 14.0 0.4 38 465 –0.1 0.4West . . . . . . . . . . . . . . . . . . . . . . . . . . . . 8,419 340 12.5 0.5 8,573 343 12.6 0.5 154 358 – 0.5
ResidenceInside metropolitan statistical areas. . . (NA) (NA) (NA) (NA) 30,098 621 12.2 0.3 (X) (X) (X) (X)
Inside principal cities . . . . . . . . . . . . . (NA) (NA) (NA) (NA) 15,966 465 17.0 0.5 (X) (X) (X) (X)Outside principal cities . . . . . . . . . . . (NA) (NA) (NA) (NA) 14,132 438 9.3 0.3 (X) (X) (X) (X)
Outside metropolitan statistical5areas . . . . . . . . . . . . . . . . . . . . . . . . . . (NA) (NA) (NA) (NA) 6,852 379 14.5 0.8 (X) (X) (X) (X)
Work ExperienceAll workers (16 years and older) . . . . . 9,384 360 6.1 0.2 9,340 358 6.0 0.2 –45 377 –0.1 0.2
Worked full-time, year-round. . . . . . . 2,891 202 2.8 0.2 2,894 202 2.8 0.2 3 212 –0.1 0.2Not full-time, year-round . . . . . . . . . . 6,493 301 12.8 0.6 6,446 299 12.8 0.6 –47 315 – 0.6
Did not work at least one week . . . . . . 15,871 463 21.7 0.7 16,041 462 21.8 0.7 170 485 – 0.7
FAMILIESTotal . . . . . . . . . . . . . . . . . . . . 7,835 187 10.2 0.2 7,657 184 9.9 0.2 –177 212 *–0.3 0.3
Type of FamilyMarried-couple . . . . . . . . . . . . . . . . . . . . 3,216 111 5.5 0.2 2,944 105 5.1 0.2 *–271 123 *–0.5 0.2Female householder, no husbandpresent . . . . . . . . . . . . . . . . . . . . . . . . . 3,962 125 28.3 1.0 4,044 126 28.7 1.0 82 143 0.4 1.1
Male householder, no wife present . . . 657 48 13.4 1.0 669 48 13.0 1.0 12 55 –0.4 1.1
– Represents zero or rounds to zero.* Statistically different from zero at the 90-percent confidence level. (NA) Not available. (X) Not applicable.1 The 2004 data have been revised to reflect a correction to the weights in the 2005 ASEC.2 A 90-percent confidence interval is a measure of an estimate’s variability. The larger the confidence interval in relation to the size of the estimate, the less reliable the estimate. For
more information, see ‘‘Standard Errors and Their Use’’ at <www.census.gov/hhes/www/p60_231sa.pdf>.3 Details may not sum to totals because of rounding.4 Federal surveys now give respondents the option of reporting more than one race. Therefore, two basic ways of defining a race group are possible. A group such as Asian may be
defined as those who reported Asian and no other race (the race-alone or single-race concept) or as those who reported Asian regardless of whether they also reported another race(the race-alone-or-in-combination concept). This table shows data using the first approach (race alone). The use of the single-race population does not imply that it is the preferredmethod of presenting or analyzing data. The Census Bureau uses a variety of approaches. Information on people who reported more than one race, such as White and American Indianand Alaska Native or Asian and Black or African American, is available from Census 2000 through American FactFinder. About 2.6 percent of people reported more than one race inCensus 2000.
5 The ‘‘Outside metropolitan statistical areas’’ category includes both micropolitan statistical areas and territory outside of metropolitan and micropolitan statistical areas. For moreinformation, see ‘‘About Metropolitan and Micropolitan Statistical Areas’’ at <www.census.gov/population/www/estimates/aboutmetro.html>.
Source: U.S. Census Bureau, Current Population Survey, 2005 and 2006 Annual Social and Economic Supplements.

2004 and 2005, at 21.8 percent and9.4 million in 2005.26
Table 5 displays 3-year averages of thepoverty rate and the number inpoverty for 2003–2005 for racegroups and Hispanics. The 3-year-average poverty rate for AmericanIndians and Alaska Natives (25.3 per-cent) was not statistically differentfrom the rate for Blacks.27 It washigher than the rates for other groups.The 3-year-average poverty rate forNative Hawaiians and Other PacificIslanders (12.2 percent) was lowerthan the rate for Blacks, AmericanIndians and Alaska Natives, and
U.S. Census Bureau Income, Poverty, and Health Insurance Coverage in the United States: 2005 15
26 The number in poverty for Blacks was notstatistically different from that of Hispanics.
27 The rate for the American Indian andAlaska Native alone-or-in-combination popula-tion was statistically lower than that for theAmerican Indian and Alaska Native alone, Black,and Hispanic populations. It was higher thanthe rates for other groups.
Hispanics; higher than the rate for people 18 to 64 years old and thosenon-Hispanic Whites; and not statisti- 65 and older (Table 4). Children rep-cally different from the rate for Asians. resented 34.9 percent of the people
in poverty and 25.0 percent of theAge total population.
Between 2004 and 2005, both the The poverty rate and the number inpoverty rate and the number in poverty for related children under 6poverty for people 18 to 64 were not
living in families were 20.0 percentstatistically different at 11.1 percent
and 4.8 million, both not statisticallyand 20.5 million. The number of
different from 2004. Of related chil-people 65 and older in poverty
dren under 6 living in families withincreased to 3.6 million in 2005, upfemale householders with no husbandfrom 3.5 million in 2004, while thepresent, 52.9 percent were in poverty,poverty rate in that age groupover five times the rate of their coun-remained statistically unchanged atterparts in married-couple families10.1 percent in 2005 (Table 4 and(9.9 percent). For related childrenFigure 5). under 18 living in families with a
In 2005, for children under 18, the female householder with no husbandsurvey found no statistically signifi- present, 42.8 percent were in poverty,cant change in the poverty rate or the compared with 8.5 percent fornumber in poverty (17.6 percent and married-couple families. 12.9 million). The poverty rate forchildren was higher than the rates for
Table 5.Number in Poverty and Poverty Rates by Race and Hispanic Origin Using 3-Year Average: 2003to 2005(Numbers in thousands. People as of March of the following year)
Race1 and Hispanic origin
3-year average 2003–20052
Number Percentage
Estimate
90-percentconfidence
interval3 (±) Estimate
90-percentconfidence
interval3 (±)
All races . . . . . . . . . . . . . . . . . . . . . .
White . . . . . . . . . . . . . . . . . . . . . . . . . . . . . . . . .White, not Hispanic . . . . . . . . . . . . . . . . . . .
Black . . . . . . . . . . . . . . . . . . . . . . . . . . . . . . . . .
American Indian and Alaska Native . . . . . . .
Asian . . . . . . . . . . . . . . . . . . . . . . . . . . . . . . . . .
Native Hawaiian and Other Pacific Islander
Hispanic origin (any race) . . . . . . . . . . . . . . .
. . . . . . . . . . . . . . . . . .
. . . . . . . . . . . . . . . . . .
. . . . . . . . . . . . . . . . . .
. . . . . . . . . . . . . . . . . .
. . . . . . . . . . . . . . . . . .
. . . . . . . . . . . . . . . . . .
. . . . . . . . . . . . . . . . . .
. . . . . . . . . . . . . . . . . .
36,617
24,82416,346
8,988
573
1,335
79
9,180
494
399329
242
65
98
24
252
12.6
10.68.4
24.7
25.3
10.9
12.2
22.0
0.2
0.20.2
0.6
2.5
0.8
3.6
0.6
1 Federal surveys now give respondents the option of reporting more than one race. Therefore, two basic ways of defining a race group are possible. A group such asAsian may be defined as those who reported Asian and no other race (the race-alone or single-race concept) or as those who reported Asian regardless of whether theyalso reported another race (the race-alone-or-in-combination concept). This table shows data using the first approach (race alone). The use of the single-race populationdoes not imply that it is the preferred method of presenting or analyzing data. The Census Bureau uses a variety of approaches. Information on people who reported morethan one race, such as White and American Indian and Alaska Native or Asian and Black or African American, is available from Census 2000 through American FactFinder.About 2.6 percent of people reported more than one race in Census 2000.
2 The 2004 data have been revised to reflect a correction to the weights in the 2005 ASEC.3 A 90-percent confidence interval is a measure of an estimate’s variability. The larger the confidence interval in relation to the size of the estimate, the less
reliable the estimate. For more information, see ‘‘Standard Errors and Their Use’’ at <www.census.gov/hhes/www/p60_231sa.pdf>.Source: U.S. Census Bureau, Current Population Survey, 2004 to 2006 Annual Social and Economic Supplements.

Nativity
Of all people, 87.8 percent werenatives, 4.7 percent were foreign-born naturalized citizens, and 7.4percent were foreign-born nonciti-zens.28 The poverty rate and the num-ber in poverty for natives and the for-eign born were not statisticallydifferent from 2004 at 12.1 percentand 31.1 million for natives and 16.5 percent and 5.9 million for theforeign born in 2005 (Table 4).
Of the foreign-born population, 39.0percent were naturalized citizens; theremaining were noncitizens. Theirpoverty rates in 2005 were 10.4 per-cent for foreign-born naturalized citi-zens and 20.4 percent for those whohad not become citizens, both notstatistically different from 2004.
16 Income, Poverty, and Health Insurance Coverage in the United States: 2005 U.S. Census Bureau
28 Percentages do not sum to 100 because ofrounding.
Region
In 2005, the poverty rates for theNortheast (11.3 percent) and theMidwest (11.4 percent) were not statis-tically different from each other, butwere lower than the rates for theSouth (14.0 percent) and the West(12.6 percent) (Table 4). None of theregions showed any statistical changein either their poverty rate or the num-ber in poverty from 2004 to 2005.
Residence
In 2005, the poverty rate among peo-ple who lived in metropolitan statisti-cal areas but outside the principalcity—suburban areas—(9.3 percent)was lower than the poverty rateamong people living in principal citiesof metropolitan statistical areas (17.0percent) and lower than that of peo-ple living outside metropolitan statis-tical areas (14.5 percent).
Work Experience
People 16 and older who workedsome or all of 2005 had a lowerpoverty rate than those who did notwork at any time (6.0 percent com-pared with 21.8 percent) (Table 4).The poverty rate among full-time,year-round workers (2.8 percent) waslower than for those who workedpart-time or part-year (12.8 percent)in 2005. In addition, among people16 and older, those who did not workin 2005 represented 63.2 percent ofpeople in poverty, compared with32.2 percent of all people.
Families
In 2005, the poverty rate for familiesdecreased to 9.9 percent from 10.2 percent in 2004, while the num-ber of families in poverty remainedstatistically unchanged at 7.7 millionin 2005 (Table 4).
Figure 5.Poverty Rates by Age: 1959 to 2005
Note: The data points are placed at the midpoints of the respective years. Data for people 18 to 64 and 65 and older are not available from 1960 to 1965.
Source: U.S. Census Bureau, Current Population Survey, 1960 to 2006 Annual Social and Economic Supplements.
Percent
0
5
10
15
20
25
30
35
40
45
50
20052000 19951990198519801975197019651959
Recession
11.1 percent10.1 percent
17.6 percent
65 years and older
Under 18 years
18 to 64 years
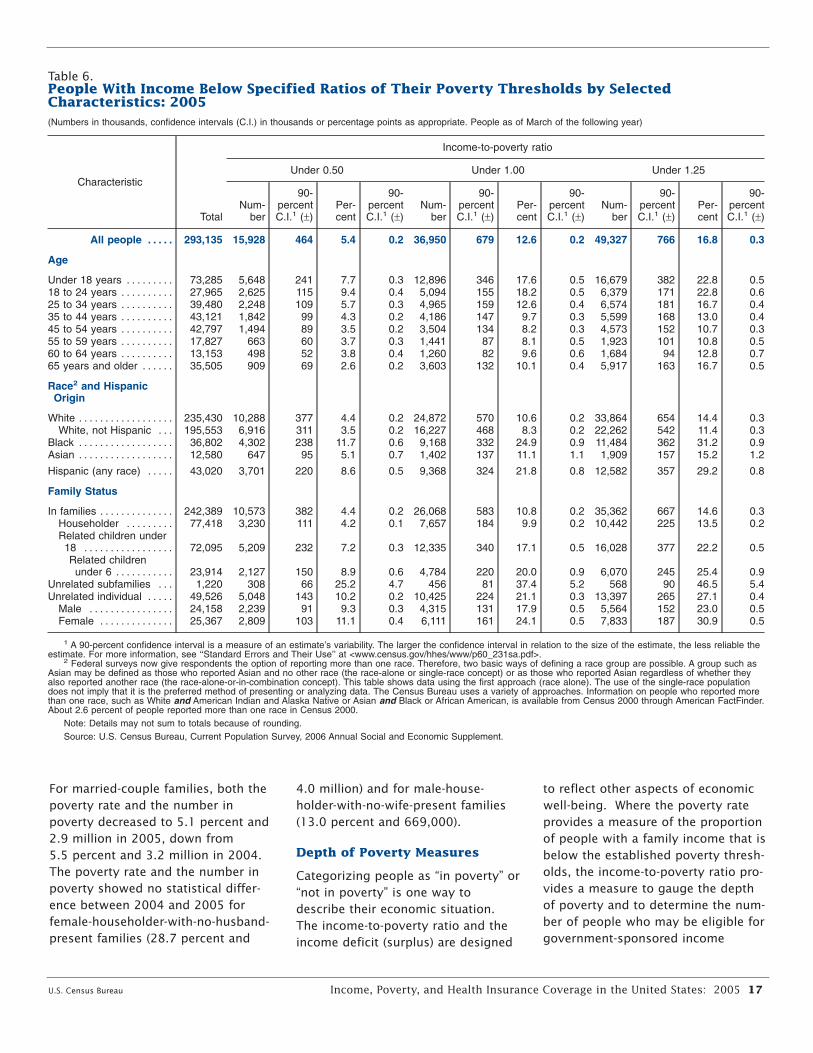
For married-couple families, both the 4.0 million) and for male-house- to reflect other aspects of economicpoverty rate and the number in holder-with-no-wife-present families well-being. Where the poverty ratepoverty decreased to 5.1 percent and (13.0 percent and 669,000). provides a measure of the proportion2.9 million in 2005, down from of people with a family income that is5.5 percent and 3.2 million in 2004. Depth of Poverty Measures below the established poverty thresh-The poverty rate and the number in olds, the income-to-poverty ratio pro-Categorizing people as “in poverty” orpoverty showed no statistical differ- vides a measure to gauge the depth“not in poverty” is one way toence between 2004 and 2005 for of poverty and to determine the num-describe their economic situation.female-householder-with-no-husband- ber of people who may be eligible forThe income-to-poverty ratio and thepresent families (28.7 percent and government-sponsored incomeincome deficit (surplus) are designed
U.S. Census Bureau Income, Poverty, and Health Insurance Coverage in the United States: 2005 17
Table 6.People With Income Below Specified Ratios of Their Poverty Thresholds by SelectedCharacteristics: 2005(Numbers in thousands, confidence intervals (C.I.) in thousands or percentage points as appropriate. People as of March of the following year)
Characteristic
Total
Income-to-poverty ratio
Under 0.50 Under 1.00 Under 1.25
Num-ber
90-percentC.I.1 (±)
Per-cent
90-percentC.I.1 (±)
Num-ber
90-percentC.I.1 (±)
Per-cent
90-percentC.I.1 (±)
Num-ber
90-percentC.I.1 (±)
Per-cent
90-percentC.I.1 (±)
All people . . . . .
Age
293,135 15,928 464 5.4 0.2 36,950 679 12.6 0.2 49,327 766 16.8 0.3
Under 18 years . . . . . . . . . 73,285 5,648 241 7.7 0.3 12,896 346 17.6 0.5 16,679 382 22.8 0.518 to 24 years . . . . . . . . . . 27,965 2,625 115 9.4 0.4 5,094 155 18.2 0.5 6,379 171 22.8 0.625 to 34 years . . . . . . . . . . 39,480 2,248 109 5.7 0.3 4,965 159 12.6 0.4 6,574 181 16.7 0.435 to 44 years . . . . . . . . . . 43,121 1,842 99 4.3 0.2 4,186 147 9.7 0.3 5,599 168 13.0 0.445 to 54 years . . . . . . . . . . 42,797 1,494 89 3.5 0.2 3,504 134 8.2 0.3 4,573 152 10.7 0.355 to 59 years . . . . . . . . . . 17,827 663 60 3.7 0.3 1,441 87 8.1 0.5 1,923 101 10.8 0.560 to 64 years . . . . . . . . . . 13,153 498 52 3.8 0.4 1,260 82 9.6 0.6 1,684 94 12.8 0.765 years and older . . . . . .
Race2 and HispanicOrigin
35,505 909 69 2.6 0.2 3,603 132 10.1 0.4 5,917 163 16.7 0.5
White . . . . . . . . . . . . . . . . . . 235,430 10,288 377 4.4 0.2 24,872 570 10.6 0.2 33,864 654 14.4 0.3White, not Hispanic . . . 195,553 6,916 311 3.5 0.2 16,227 468 8.3 0.2 22,262 542 11.4 0.3
Black . . . . . . . . . . . . . . . . . . 36,802 4,302 238 11.7 0.6 9,168 332 24.9 0.9 11,484 362 31.2 0.9Asian . . . . . . . . . . . . . . . . . . 12,580 647 95 5.1 0.7 1,402 137 11.1 1.1 1,909 157 15.2 1.2
Hispanic (any race) . . . . .
Family Status
43,020 3,701 220 8.6 0.5 9,368 324 21.8 0.8 12,582 357 29.2 0.8
In families . . . . . . . . . . . . . . 242,389 10,573 382 4.4 0.2 26,068 583 10.8 0.2 35,362 667 14.6 0.3Householder . . . . . . . . .Related children under
77,418 3,230 111 4.2 0.1 7,657 184 9.9 0.2 10,442 225 13.5 0.2
18 . . . . . . . . . . . . . . . . .Related children
72,095 5,209 232 7.2 0.3 12,335 340 17.1 0.5 16,028 377 22.2 0.5
under 6 . . . . . . . . . . . 23,914 2,127 150 8.9 0.6 4,784 220 20.0 0.9 6,070 245 25.4 0.9Unrelated subfamilies . . . 1,220 308 66 25.2 4.7 456 81 37.4 5.2 568 90 46.5 5.4Unrelated individual . . . . . 49,526 5,048 143 10.2 0.2 10,425 224 21.1 0.3 13,397 265 27.1 0.4
Male . . . . . . . . . . . . . . . . 24,158 2,239 91 9.3 0.3 4,315 131 17.9 0.5 5,564 152 23.0 0.5Female . . . . . . . . . . . . . . 25,367 2,809 103 11.1 0.4 6,111 161 24.1 0.5 7,833 187 30.9 0.5
1 A 90-percent confidence interval is a measure of an estimate’s variability. The larger the confidence interval in relation to the size of the estimate, the less reliable theestimate. For more information, see ‘‘Standard Errors and Their Use’’ at <www.census.gov/hhes/www/p60_231sa.pdf>.
2 Federal surveys now give respondents the option of reporting more than one race. Therefore, two basic ways of defining a race group are possible. A group such asAsian may be defined as those who reported Asian and no other race (the race-alone or single-race concept) or as those who reported Asian regardless of whether theyalso reported another race (the race-alone-or-in-combination concept). This table shows data using the first approach (race alone). The use of the single-race populationdoes not imply that it is the preferred method of presenting or analyzing data. The Census Bureau uses a variety of approaches. Information on people who reported morethan one race, such as White and American Indian and Alaska Native or Asian and Black or African American, is available from Census 2000 through American FactFinder.About 2.6 percent of people reported more than one race in Census 2000.
Note: Details may not sum to totals because of rounding.Source: U.S. Census Bureau, Current Population Survey, 2006 Annual Social and Economic Supplement.

assistance programs, such as not live with relatives) income is 100 percent of poverty (“Under 1.00,”Temporary Assistance for Needy below (above) its poverty threshold. also called “in poverty”), and thoseFamilies (TANF), Medicare, food These measures illustrate how the below 125 percent of poverty stamps, and Low Income Home low-income population varies in rela- (“Under 1.25”).Energy Assistance Program (LIHEAP). tion to the poverty thresholds.
In 2005, the percentage and numberThe income-to-poverty ratio isof people with income below one-halfreported as a percentage that com- Ratio of Income to Poverty of their poverty thresholds was 5.4pares a family’s income with itspercent and 15.9 million, respectively.poverty threshold, which is based on Table 6 presents the number and theThis group represented 43.1 percentfamily size and composition. The percentage of people within threeof the poverty population in 2005income deficit (surplus) tells how ranges of income-to-poverty ratios—(Table 6). The percentage of peoplemany dollars a family’s or an unre- those below 50 percent of povertywith income below 125 percent oflated individual’s (person who does (“Under 0.50”), those below
18 Income, Poverty, and Health Insurance Coverage in the United States: 2005 U.S. Census Bureau
Table 7.Income Deficit or Surplus of Families and Unrelated Individuals by Poverty Status: 2005(Numbers of families and unrelated individuals in thousands, deficits and surpluses and their confidence intervals (C.I.) in dollars)
Characteristic
Total
Size of deficit or surplus Average deficitor surplus
Deficit orsurplus per
capita
Under$500
$500to
$999
$1,000to
$1,999
$2,000to
$2,999
$3,000to
$3,999
$4,000to
$4,999
$5,000to
$5,999
$6,000to
$6,999
$7,000to
$7,999
$8,000or
moreEsti-mate
90-percentC.I.1 (±)
Esti-mate
90-percentC.I.1 (±)
Below PovertyThreshold, Deficit
All families . . . . . . . . . . . .Married-couple
families. . . . . . . . . . . .Families with a male
householder, nowife present . . . . . . .
Families with afemale householder,no husbandpresent. . . . . . . . . . . .
Unrelated individuals . . .Male . . . . . . . . . . . . . . .Female . . . . . . . . . . . . .
Above PovertyThreshold, Surplus
All families . . . . . . . . . . . .Married-couple
families. . . . . . . . . . . .Families with a male
householder, nowife present . . . . . . .
Families with afemale householder,no husbandpresent. . . . . . . . . . . .
Unrelated individuals . . .Male . . . . . . . . . . . . . . .Female . . . . . . . . . . . . .
7,657
2,944
669
4,044
10,4254,3156,111
69,761
55,244
4,465
10,051
39,10019,84319,257
318
142
32
144
853391461
342
180
28
134
515162353
321
156
32
133
536177358
335
188
16
130
579257322
574
279
48
247
1,161443717
710
396
53
262
1,476662813
513
205
66
241
1,393544849
715
370
56
290
1,316513803
527
238
54
235
907304604
705
413
57
235
1,229442787
509
204
46
259
544219325
833
411
110
312
1,455697758
526
211
53
262
515236279
771
439
76
257
1,189494695
466
143
35
288
403165238
869
532
97
241
985410575
385
125
21
239
462196266
787
482
75
230
1,084467618
3,519
1,240
282
1,996
3,6521,6392,013
63,693
51,834
3,897
7,962
29,27215,73913,533
8,125
7,632
7,359
8,610
5,3615,6055,189
63,959
70,824
46,160
34,135
29,49933,93324,931
112
184
349
150
619779
520
612
1,606
903
443775406
2,387
2,046
2,546
2,647
5,3615,6055,189
20,626
22,391
16,505
11,794
29,49933,93324,931
54
76
199
79
153255197
286
313
702
368
586999620
1 A 90-percent confidence interval is a measure of an estimate’s variability. The larger the confidence interval in relation to the size of the estimate,the less reliable the estimate. For more information, see ‘‘Standard Errors and Their Use’’ at <www.census.gov/hhes/www/p60_231sa.pdf>.
Note: Details may not sum to totals because of rounding.
Source: U.S. Census Bureau, Current Population Survey, 2006 Annual Social and Economic Supplement.

their threshold decreased to 16.8 per-cent in 2005, down from 17.1 percentin 2004, while the number with anincome-to-poverty ratio in this rangeremained statistically unchanged in2005 at 49.3 million.
The demographic makeup of the pop-ulation differs at varying degrees ofpoverty. In 2005 among all people,5.4 percent were below 50 percent oftheir threshold, 7.2 percent wereabove 50 percent and below 100 per-cent of their threshold, and 4.2 per-cent were between 100 and 125 per-cent of their thresholds. The65-and-older population was morehighly concentrated between 100 per-cent and 125 percent of their povertythresholds (6.5 percent) than below50 percent of their thresholds (2.6percent). Among people 65 andolder, 10.1 percent were below 100percent of poverty and 16.7 percentwere below 125 percent of poverty, a65.3 percent difference. The distribu-tion was different for all people—12.6 percent were below 100 percent
of poverty and 16.8 percent werebelow 125 percent of poverty, a 33.3 percent difference.29
Income Deficit
The income deficit for families inpoverty (the difference in dollarsbetween a family’s income and itspoverty threshold) averaged $8,125in 2005 (Table 7), not statistically dif-ferent in real terms from 2004. Theaverage income deficit was larger forfamilies with a female householderwith no husband present ($8,610)than for married-couple families($7,632) and families with a malehouseholder with no wife present($7,359).30
The income deficit per capita forfemale-householder families ($2,647)
U.S. Census Bureau Income, Poverty, and Health Insurance Coverage in the United States: 2005 19
29 The percentage of people 65 and olderwho were below 125 percent of their povertythresholds was not statistically different fromthe percentage of all people below 125 percentof their poverty threshold.
30 The average income deficit for married-couple families was not statistically differentfrom that of male-householder families.
was higher than for married-couplefamilies ($2,046). The income deficitper capita is computed by dividingthe average deficit by the averagenumber of people in that type of fam-ily. Because families with a femalehouseholder with no husband presentwere smaller, on average, thanmarried-couple families, the largerper capita deficit for female-house-holder families with no husband pres-ent reflects their smaller family sizeas well as their lower income.
For unrelated individuals in poverty,the average income deficit was$5,361 in 2005. The $5,189 deficitfor women was lower than the$5,605 deficit for men. Becauseunrelated individuals aged 65 andolder have lower poverty thresholdsand because there were more unre-lated women than men aged 65 andolder, the lower average deficit forwomen reflects differences in age aswell as income.

HEALTH INSURANCECOVERAGE IN THE UNITED STATES
Highlights
• The number of people with healthinsurance coverage increased from245.9 million in 2004 to 247.3 mil-lion in 2005.31
• In 2005, 46.6 million people werewithout health insurance coverage,up from 45.3 million people in2004 (Table 8).
• The percentage of people withouthealth insurance coverageincreased from 15.6 percent in2004 to 15.9 percent in 2005.
• The historical record is marked by a12-year period from 1987 to 1998when the uninsured rate (12.9 per-cent in 1987) either increased orwas not statistically different fromone year to the next (Figure 7).32
After peaking at 16.3 percent in1998, the rate fell for 2 years in arow to 14.2 percent in 2000. Therate then increased until2003–2004, where it remained at
20 Income, Poverty, and Health Insurance Coverage in the United States: 2005 U.S. Census Bureau
31 The 2004 data have been revised to reflect acorrection to the weights in the 2005 ASEC, and theestimates were revised based on improvements tothe algorithm that assigns coverage to dependents.For a brief description of how the Census Bureaucollects and reports on health insurance, see thetext box “What Is Health Insurance Coverage?” For adiscussion of the quality of ASEC health insurancecoverage estimates, see Appendix C.
32 The year 1987 is the first year for whichcomparable health insurance coverage statisticsare available.
What Is Health Insurance Coverage?
The Annual Social and Economic Supplement (ASEC) to the CurrentPopulation Survey (CPS) asks about health insurance coverage in the previ-ous calendar year. The questionnaire asks separate questions about themajor types of health insurance, and people who answer “no” to each ofthe coverage questions are then asked to verify that they were, in fact,not covered by any type of health insurance. For reporting purposes, theCensus Bureau broadly classifies health insurance coverage as private cov-erage or government coverage. Private health insurance is a plan providedthrough an employer or a union or purchased by an individual from a pri-vate company. Government health insurance includes the federal pro-grams Medicare, Medicaid, and military health care; the State Children’sHealth Insurance Program (SCHIP); and individual state health plans.*People were considered “insured” if they were covered by any type ofhealth insurance for part or all of the previous calendar year. They wereconsidered “uninsured” if they were not covered by any type of healthinsurance at any time in that year.
Research shows health insurance coverage is underreported in the CPSASEC for a variety of reasons. While annual retrospective questions appearto be less of a problem when collecting income data (possibly because theinterview period is close to when people pay their taxes), it is probablyless than ideal when asking about health insurance coverage. For exam-ple, some people may report their insurance coverage status at the timeof their interview rather than their coverage status during the previouscalendar year. Compared with other national surveys, the CPS ASEC’s esti-mate of the number of people without health insurance more closelyapproximates the number of people who were uninsured at a specificpoint in time during the year than the number of people uninsured for theentire year.
For more information on the quality of CPS ASEC health insurance esti-mates, see Appendix C, “Estimates of Health Insurance Coverage.” For acomparison between health insurance coverage rates from the major fed-eral surveys, see How Many People Lack Health Insurance and for HowLong? (Congressional Budget Office, May 2003) and People with HealthInsurance: A Comparison of Estimates from Two Surveys (Survey ofIncome and Program Participation Working Paper 243, June 2004).
* Types of insurance are not mutually exclusive and people may be covered by more thanone during the year.

15.6 percent before it increased to15.9 percent in 2005.33
U.S. Census Bureau Income, Poverty, and Health Insurance Coverage in the United States: 2005 21
33 The difference between the percentuninsured in 1998 and 1997 was not statisti-cally significant.
• The percentage of people coveredby employment-based healthinsurance decreased between 2004and 2005, from 59.8 percent to59.5 percent.
• While the number of people cov-ered by government health pro-grams increased between 2004and 2005, from 79.4 million to80.2 million, the percentage ofpeople covered by governmenthealth insurance remained at 27.3 percent. There was no statis-tical difference in the number orthe percentage of people coveredby Medicaid (38.1 million and 13.0 percent, respectively)between 2004 and 2005.
• The percentage and the number ofchildren (people under 18 yearsold) without health insuranceincreased between 2004 and 2005,from 10.8 percent to 11.2 percentand from 7.9 million to 8.3 million,respectively (Table 8). With anuninsured rate at 19.0 percent in2005, children in poverty weremore likely to be uninsured thanall children (Figure 8).
• The uninsured rate and the num-ber of uninsured remained statisti-cally unchanged from 2004 to2005 for non-Hispanic Whites (11.3 percent and 22.1 million) andfor Blacks (19.6 percent and 7.2 million) (Table 8).
• The number of uninsuredincreased for Hispanics (from 13.5 million in 2004 to 14.1 mil-lion in 2005); their uninsured ratewas not statistically different at32.7 percent in 2005.
Figure 6.Coverage by Type of Health Insurance: 20041 and 2005
* Statistically different at the 90-percent confidence level.1 The 2004 data have been revised to reflect a correction to the weights in the 2005 ASEC. The estimates also reflect improvements to the algorithm that assigns coverage to dependents.2 Military health care includes CHAMPUS (Comprehensive Health and Medical Plan for Uniformed Services)/Tricare and CHAMPVA (Civilian Health and Medical Program of the Department of Veterans Affairs), as well as care provided by the Department of Veterans Affairs and the military.
Note: The estimates by type of coverage are not mutually exclusive; people can be covered by more than one type of health insurance during the year.
Source: U.S. Census Bureau, Current Population Survey, 2005 and 2006 Annual Social and Economic Supplements.
Private insurance
Government insurance
No insurance
20042005(Percent)
Not covered
Militaryhealth care2
Medicaid
Medicare
Any governmentplan
Direct-purchase
Employment-based
Any privateplan
68.2
67.7*
59.8
59.5*
9.3
9.1*
27.3
27.3
13.613.7
13.0
13.0
3.7
3.8
15.6
15.9*

22 Income, Poverty, and Health Insurance Coverage in the United States: 2005 U.S. Census Bureau
Table 8.People With or Without Health Insurance Coverage by Selected Characteristics: 2004 and 2005(Numbers in thousands, confidence intervals (C.I.) in thousands or percentage points as appropriate. People as of March of the following year)
Characteristic
Uninsured 1Change (2005 less 2004)
20042 2005 Uninsured Insured
Number
90-percentC.I.3 (±)
Percent-age
90-percentC.I.3 (±) Number
90-percentC.I.3 (±)
Percent-age
90-percentC.I.3 (±) Number
90-percentC.I.3 (±)
Percent-age
90-percentC.I.3 (±) Number
90-percentC.I.3 (±)
PEOPLETotal . . . . . . . . . . . . . . . . .
Family Status
45,306 525 15.6 0.2 46,577 530 15.9 0.2 *1,272 624 *0.3 0.2 *1,397 636
In families . . . . . . . . . . . . . . . . . . . . 35,009 471 14.6 0.2 36,259 478 15.0 0.2 *1,160 561 *0.4 0.2 475 789Householder . . . . . . . . . . . . . . . . . 10,557 169 13.7 0.2 10,849 171 14.0 0.2 *292 194 *0.3 0.2 260 410Related children under 18 . . . . . . . 7,512 229 10.4 0.3 7,784 233 10.8 0.3 272 274 *0.4 0.4 –310 711
Related children under 6 . . . . . . . 2,207 125 9.3 0.5 2,499 133 10.4 0.5 *291 153 *1.2 0.6 –129 447In unrelated subfamilies . . . . . . . . . . 337 49 26.8 3.4 382 52 31.3 3.6 46 60 *4.5 4.1 –79 94Unrelated individual . . . . . . . . . . . . .
Race4 and Hispanic Origin
9,870 262 20.1 0.5 9,936 262 19.8 0.5 66 310 –0.3 0.6 *1,001 588
White . . . . . . . . . . . . . . . . . . . . . . . . 34,447 467 14.7 0.2 35,340 472 15.0 0.2 *893 556 *0.3 0.2 *894 803White, not Hispanic . . . . . . . . . . . . 21,807 381 11.2 0.2 22,144 383 11.3 0.2 338 452 0.1 0.2 208 846
Black . . . . . . . . . . . . . . . . . . . . . . . . 7,071 253 19.3 0.7 7,228 255 19.6 0.7 156 300 0.2 0.8 261 454Asian . . . . . . . . . . . . . . . . . . . . . . . . 2,016 137 16.5 1.1 2,257 144 17.9 1.1 *241 166 *1.4 1.3 117 272
Hispanic origin (any race) . . . . . . . . .
Age
13,504 307 32.3 0.7 14,122 313 32.7 0.7 *618 325 0.4 0.8 *710 326
Under 18 years . . . . . . . . . . . . . . . . 7,949 236 10.8 0.3 8,310 241 11.2 0.3 *361 282 *0.5 0.4 –167 71618 to 24 years . . . . . . . . . . . . . . . . . 8,590 245 30.7 0.7 8,566 244 30.6 0.7 –24 289 – 0.9 –19 42725 to 34 years . . . . . . . . . . . . . . . . . 10,023 264 25.5 0.6 10,412 268 26.4 0.6 *388 315 *0.9 0.7 –218 51435 to 44 years . . . . . . . . . . . . . . . . . 8,093 238 18.7 0.5 8,090 238 18.8 0.5 –3 281 0.1 0.6 –226 55845 to 64 years . . . . . . . . . . . . . . . . . 10,157 265 14.2 0.3 10,740 273 14.6 0.3 *584 318 0.4 0.4 *1,698 70265 years and older . . . . . . . . . . . . . .
Nativity
493 59 1.4 0.2 459 57 1.3 0.2 –33 69 –0.1 0.2 329 556
Native . . . . . . . . . . . . . . . . . . . . . . . 33,547 462 13.1 0.2 34,608 468 13.4 0.2 *1,062 550 *0.3 0.2 *1,162 738Foreign born . . . . . . . . . . . . . . . . . . 11,759 324 33.4 0.8 11,969 327 33.6 0.8 210 385 0.2 0.9 235 532
Naturalized citizen . . . . . . . . . . . . . 2,290 146 17.0 1.0 2,482 152 17.9 1.0 *192 176 0.9 1.2 184 377Not a citizen . . . . . . . . . . . . . . . . .
Region
9,469 292 43.6 1.0 9,487 293 43.6 1.0 18 346 –0.1 1.2 51 392
Northeast . . . . . . . . . . . . . . . . . . . . . 6,782 211 12.6 0.4 6,657 210 12.3 0.4 –126 249 –0.3 0.5 *251 241Midwest . . . . . . . . . . . . . . . . . . . . . . 7,757 225 12.0 0.3 7,777 225 11.9 0.3 19 266 – 0.4 229 267South . . . . . . . . . . . . . . . . . . . . . . . . 19,090 348 18.2 0.3 19,793 353 18.6 0.3 *703 415 *0.4 0.4 *575 418West . . . . . . . . . . . . . . . . . . . . . . . .
Residence
11,676 276 17.4 0.4 12,352 282 18.1 0.4 *675 330 *0.7 0.5 *342 323
Inside metropolitan statistical areas . . (NA) (NA) (NA) (NA) 39,181 494 15.9 0.2 (X) (X) (X) (X) (X) (X)Inside principal cities . . . . . . . . . . . (NA) (NA) (NA) (NA) 17,652 345 18.7 0.3 (X) (X) (X) (X) (X) (X)Outside principal cities . . . . . . . . . .
Outside metropolitan statistical(NA) (NA) (NA) (NA) 21,528 378 14.1 0.2 (X) (X) (X) (X) (X) (X)
5areas . . . . . . . . . . . . . . . . . . . . . .
Household Income
(NA) (NA) (NA) (NA) 7,397 278 15.6 0.5 (X) (X) (X) (X) (X) (X)
Less than $25,000 . . . . . . . . . . . . . . 15,130 321 24.3 0.5 14,561 315 24.4 0.5 *–569 376 0.2 0.6 *–2,173 625$25,000 to $49,999 . . . . . . . . . . . . . . 14,619 316 19.8 0.4 14,977 319 20.6 0.4 358 376 *0.8 0.5 *–1,479 687$50,000 to $74,999 . . . . . . . . . . . . . . 7,688 232 13.0 0.4 8,300 241 14.1 0.4 *612 280 *1.0 0.4 –617 651$75,000 or more . . . . . . . . . . . . . . . .
Work Experience
7,869 234 8.2 0.2 8,740 247 8.5 0.2 *870 285 *0.3 0.3 *5,665 794
Total, 18 to 64 years old . . . . 36,864 497 20.2 0.3 37,808 502 20.5 0.3 *944 591 0.3 0.3 *1,235 637Worked during year . . . . . . . . . . . . . 26,546 436 18.5 0.3 27,347 441 18.7 0.3 *802 519 0.3 0.3 *1,343 726
Worked full-time . . . . . . . . . . . . . . 20,511 390 17.3 0.3 21,473 398 17.7 0.3 *961 466 *0.5 0.4 *1,174 746Worked part-time . . . . . . . . . . . . . . 6,035 220 24.2 0.8 5,875 217 23.5 0.8 –160 259 –0.6 0.9 169 446
Did not work . . . . . . . . . . . . . . . . . . . 10,318 285 26.9 0.7 10,461 287 27.3 0.7 143 338 0.5 0.8 –108 527
– Represents zero or rounds to zero.* Statistically different from zero at the 90-percent confidence level. (NA) Not available. (X) Not applicable.1 Details may not sum to totals because of rounding.2 The 2004 data have been revised to reflect a correction to the weights in the 2005 ASEC. The estimates also reflect improvements to the algorithm that assigns coverage to dependents.3 A 90-percent confidence interval is a measure of an estimate’s variability. The larger the confidence interval in relation to the size of the estimate, the less reliable the estimate. For more
information, see ‘‘Standard Errors and Their Use’’ at <www.census.gov/hhes/www/p60_231sa.pdf>.4 Federal surveys now give respondents the option of reporting more than one race. Therefore, two basic ways of defining a race group are possible. A group such as Asian may be defined as
those who reported Asian and no other race (the race-alone or single-race concept) or as those who reported Asian regardless of whether they also reported another race (the race-alone-or-in-combination concept). This table shows data using the first approach (race alone). The use of the single-race population does not imply that it is the preferred method of presenting or analyzing data.The Census Bureau uses a variety of approaches. Information on people who reported more than one race, such as White and American Indian and Alaska Native or Asian and Black or AfricanAmerican, is available from Census 2000 through American FactFinder. About 2.6 percent of people reported more than one race in Census 2000.
5 The ‘‘Outside metropolitan statistical areas’’ category includes both micropolitan statistical areas and territory outside of metropolitan and micropolitan statistical areas. For more information, see‘‘About Metropolitan and Micropolitan Statistical Areas’’ at <www.census.gov/population/www/estimates/aboutmetro.html>.
Source: U.S. Census Bureau, Current Population Survey, 2005 and 2006 Annual Social and Economic Supplements.
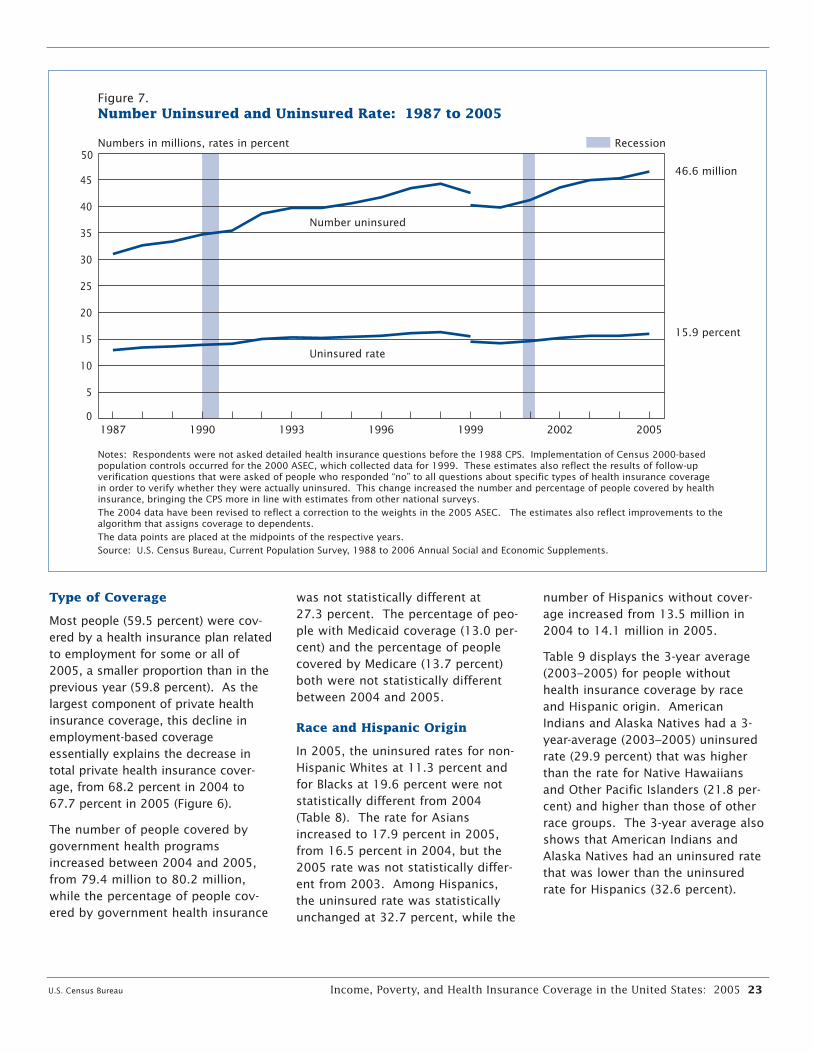
Type of Coverage was not statistically different at number of Hispanics without cover-27.3 percent. The percentage of peo- age increased from 13.5 million inMost people (59.5 percent) were cov-ple with Medicaid coverage (13.0 per- 2004 to 14.1 million in 2005.ered by a health insurance plan relatedcent) and the percentage of peopleto employment for some or all of Table 9 displays the 3-year averagecovered by Medicare (13.7 percent)2005, a smaller proportion than in the (2003–2005) for people withoutboth were not statistically differentprevious year (59.8 percent). As the health insurance coverage by racebetween 2004 and 2005. largest component of private health and Hispanic origin. American
insurance coverage, this decline in Indians and Alaska Natives had a 3-Race and Hispanic Originemployment-based coverage year-average (2003–2005) uninsuredessentially explains the decrease in In 2005, the uninsured rates for non- rate (29.9 percent) that was highertotal private health insurance cover- Hispanic Whites at 11.3 percent and than the rate for Native Hawaiiansage, from 68.2 percent in 2004 to for Blacks at 19.6 percent were not and Other Pacific Islanders (21.8 per-67.7 percent in 2005 (Figure 6). statistically different from 2004 cent) and higher than those of other
(Table 8). The rate for Asians race groups. The 3-year average alsoThe number of people covered by increased to 17.9 percent in 2005, shows that American Indians andgovernment health programs from 16.5 percent in 2004, but the Alaska Natives had an uninsured rateincreased between 2004 and 2005, 2005 rate was not statistically differ- that was lower than the uninsuredfrom 79.4 million to 80.2 million, ent from 2003. Among Hispanics, rate for Hispanics (32.6 percent).while the percentage of people cov- the uninsured rate was statisticallyered by government health insurance unchanged at 32.7 percent, while the
U.S. Census Bureau Income, Poverty, and Health Insurance Coverage in the United States: 2005 23
Figure 7.Number Uninsured and Uninsured Rate: 1987 to 2005
Notes: Respondents were not asked detailed health insurance questions before the 1988 CPS. Implementation of Census 2000-based population controls occurred for the 2000 ASEC, which collected data for 1999. These estimates also reflect the results of follow-up verification questions that were asked of people who responded “no” to all questions about specific types of health insurance coverage in order to verify whether they were actually uninsured. This change increased the number and percentage of people covered by health insurance, bringing the CPS more in line with estimates from other national surveys.The 2004 data have been revised to reflect a correction to the weights in the 2005 ASEC. The estimates also reflect improvements to the algorithm that assigns coverage to dependents.The data points are placed at the midpoints of the respective years.Source: U.S. Census Bureau, Current Population Survey, 1988 to 2006 Annual Social and Economic Supplements.
Numbers in millions, rates in percent
0
5
10
15
20
25
30
35
40
45
50
2005200219991996199319901987
46.6 million
15.9 percent
Number uninsured
Uninsured rate
Recession

Nativity a half times that of the native popula-tion in 2005. The uninsured rate for the native pop-
ulation increased between 2004 andEconomic Status
2005, from 13.1 percent to 13.4 per-cent, while the uninsured rate for the The likelihood of being covered byforeign-born population was not statis- health insurance rises with income.tically different at 33.6 percent in In 2005, in households with annual2005 (Table 8). Among the foreign incomes of less than $25,000, 75.6born, the number of uninsured natu- percent of people had health insur-ralized citizens increased, from 2.3 ance. Health insurance coveragemillion in 2004 to 2.5 million in 2005. rates increased with higher householdThe uninsured rate for naturalized citi- income levels to 91.5 percent forzens was not statistically different at those in households with incomes of17.9 percent. For noncitizens, the
$75,000 or more (Table 8). number who were uninsured and therate were statistically unchanged in The number of workers (people who2005 at 9.5 million and 43.6 percent, worked at some time during the year)respectively. The proportion of the with no health insurance increasedforeign-born population without health from 26.5 million to 27.3 million,insurance in 2005 was about two and while the percentage of workers who
were uninsured was not statisticallydifferent at 18.7 percent. Among 18-to-64-year-olds in 2005, full-timeworkers were more likely to be cov-ered by health insurance (82.3 per-cent) than part-time workers (76.5 percent) or nonworkers (72.7 percent).34 The number and thepercentage of full-time workers whowere uninsured increased from 20.5 million to 21.5 million and from17.3 percent to 17.7 percent, respec-tively. The number and the percent-age of part-time workers who wereuninsured remained statisticallyunchanged in 2005 at 5.9 million and23.5 percent, respectively.
24 Income, Poverty, and Health Insurance Coverage in the United States: 2005 U.S. Census Bureau
34 Workers are classified as part-time if theyworked fewer than 35 hours per week in themajority of the weeks they worked in 2005.
Table 9.People Without Health Insurance Coverage by Race and Hispanic Origin Using 3-Year Average:2003 to 2005(Numbers in thousands. People as of March of the following year)
Race1 and Hispanic origin
3-year average 2003–20052
Number Percentage
Estimate
90-percentconfidence
interval3 (±) Estimate
90-percentconfidence
interval3 (±)
All races . . . . . . . . . . . . . . . . . . . . . .
White . . . . . . . . . . . . . . . . . . . . . . . . . . . . . . . . .White, not Hispanic . . . . . . . . . . . . . . . . . . .
Black . . . . . . . . . . . . . . . . . . . . . . . . . . . . . . . . .
American Indian and Alaska Native . . . . . . .
Asian . . . . . . . . . . . . . . . . . . . . . . . . . . . . . . . . .
Native Hawaiian and Other Pacific Islander
Hispanic origin (any race) . . . . . . . . . . . . . . .
. . . . . . . . . . . . . . . . . .
. . . . . . . . . . . . . . . . . .
. . . . . . . . . . . . . . . . . .
. . . . . . . . . . . . . . . . . .
. . . . . . . . . . . . . . . . . .
. . . . . . . . . . . . . . . . . .
. . . . . . . . . . . . . . . . . .
. . . . . . . . . . . . . . . . . .
45,615
34,59021,844
7,126
681
2,167
139
13,621
359
320260
173
56
96
26
225
15.7
14.811.2
19.5
29.9
17.7
21.8
32.6
0.1
0.10.1
0.5
2.1
0.8
3.6
0.5
1 Federal surveys now give respondents the option of reporting more than one race. Therefore, two basic ways of defining a race group are possible. A group such asAsian may be defined as those who reported Asian and no other race (the race-alone or single-race concept) or as those who reported Asian regardless of whether theyalso reported another race (the race-alone-or-in-combination concept). This table shows data using the first approach (race alone). The use of the single-race populationdoes not imply that it is the preferred method of presenting or analyzing data. The Census Bureau uses a variety of approaches. Information on people who reported morethan one race, such as White and American Indian and Alaska Native or Asian and Black or African American, is available from Census 2000 through American FactFinder.About 2.6 percent of people reported more than one race in Census 2000.
2 The 2004 data have been revised to reflect a correction to the weights in the 2005 ASEC. The estimates also reflect improvements to the algorithm that assignscoverage to dependents.
3 A 90-percent confidence interval is a measure of an estimate’s variability. The larger the confidence interval in relation to the size of the estimate, the less reliable theestimate. For more information, see ‘‘Standard Errors and Their Use’’ at <www.census.gov/hhes/www/p60_231sa.pdf>.
Source: U.S. Census Bureau, Current Population Survey, 2004 to 2006 Annual Social and Economic Supplements.
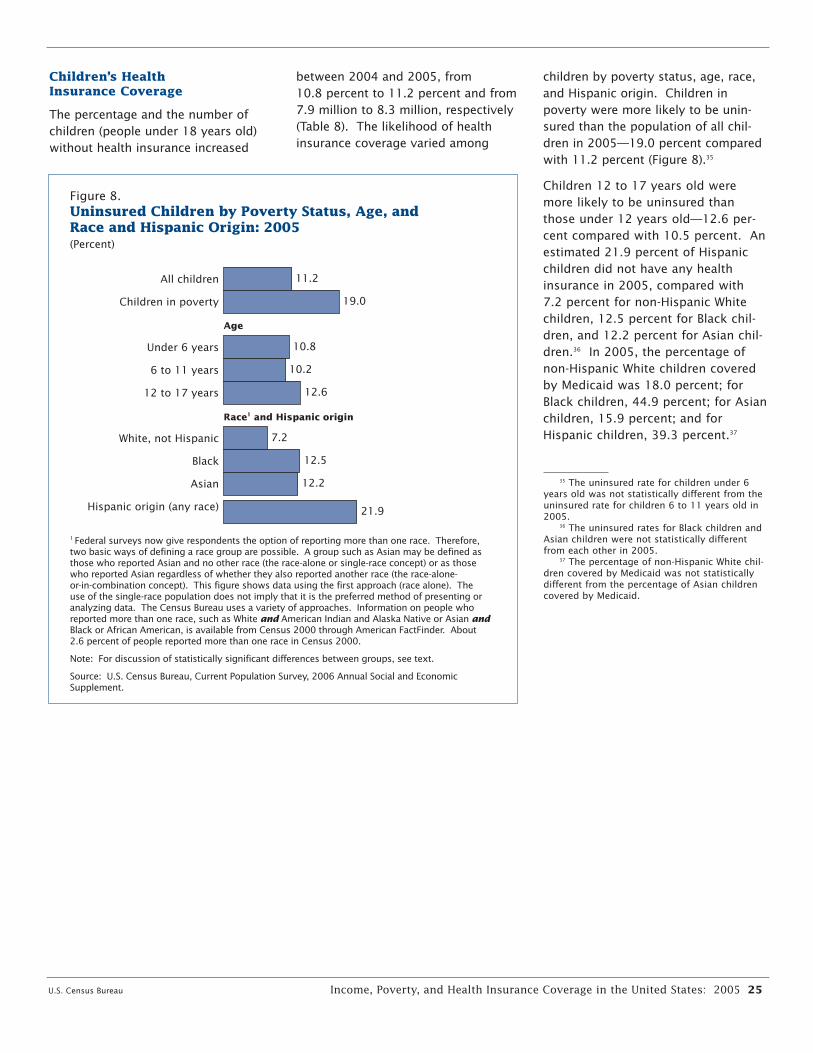
Children’s Health between 2004 and 2005, from Insurance Coverage 10.8 percent to 11.2 percent and from
7.9 million to 8.3 million, respectivelyThe percentage and the number of(Table 8). The likelihood of healthchildren (people under 18 years old)insurance coverage varied amongwithout health insurance increased
children by poverty status, age, race,and Hispanic origin. Children inpoverty were more likely to be unin-sured than the population of all chil-dren in 2005—19.0 percent comparedwith 11.2 percent (Figure 8).35
Children 12 to 17 years old weremore likely to be uninsured thanthose under 12 years old—12.6 per-cent compared with 10.5 percent. Anestimated 21.9 percent of Hispanicchildren did not have any healthinsurance in 2005, compared with 7.2 percent for non-Hispanic Whitechildren, 12.5 percent for Black chil-dren, and 12.2 percent for Asian chil-dren.36 In 2005, the percentage ofnon-Hispanic White children coveredby Medicaid was 18.0 percent; forBlack children, 44.9 percent; for Asianchildren, 15.9 percent; and forHispanic children, 39.3 percent.37
U.S. Census Bureau Income, Poverty, and Health Insurance Coverage in the United States: 2005 25
35 The uninsured rate for children under 6years old was not statistically different from theuninsured rate for children 6 to 11 years old in2005.
36 The uninsured rates for Black children andAsian children were not statistically differentfrom each other in 2005.
37 The percentage of non-Hispanic White chil-dren covered by Medicaid was not statisticallydifferent from the percentage of Asian childrencovered by Medicaid.
Figure 8.Uninsured Children by Poverty Status, Age, andRace and Hispanic Origin: 2005 (Percent)
11.2
19.0
10.8
10.2
12.6
7.2
12.5
12.2
21.9Hispanic origin (any race)
Asian
Black
White, not Hispanic
12 to 17 years
6 to 11 years
Under 6 years
Children in poverty
All children
Race1 and Hispanic origin
Age
1 Federal surveys now give respondents the option of reporting more than one race. Therefore,
two basic ways of defining a race group are possible. A group such as Asian may be defined asthose who reported Asian and no other race (the race-alone or single-race concept) or as thosewho reported Asian regardless of whether they also reported another race (the race-alone-or-in-combination concept). This figure shows data using the first approach (race alone). The use of the single-race population does not imply that it is the preferred method of presenting oranalyzing data. The Census Bureau uses a variety of approaches. Information on people whoreported more than one race, such as White and American Indian and Alaska Native or Asian andBlack or African American, is available from Census 2000 through American FactFinder. About 2.6 percent of people reported more than one race in Census 2000.
Note: For discussion of statistically significant differences between groups, see text.
Source: U.S. Census Bureau, Current Population Survey, 2006 Annual Social and EconomicSupplement.

Region
The uninsured rate in the Southincreased from 18.2 percent to 18.6 percent between 2004 and 2005.The West also experienced an increasein the percentage of uninsured, from17.4 percent in 2004 to 18.1 percentin 2005.38 The Midwest and theNortheast had the lowest uninsuredrates in 2005, at 11.9 percent and12.3 percent, respectively.39
26 Income, Poverty, and Health Insurance Coverage in the United States: 2005 U.S. Census Bureau
38 The uninsured rates for the South and theWest were not statistically different from eachother in 2005.
39 The uninsured rates for the Midwest andthe Northeast were not statistically differentfrom each other in 2005.
Residence (8.7 percent) had the lowest uninsuredrate. The rate for Minnesota was not
In 2005, the uninsured rate wasstatistically different from that of
higher among people living withinHawaii (9.5 percent) (Table 10).
principal cities (18.7 percent) thanamong people living in the suburbs Comparisons of 2-year moving aver-(14.1 percent). The percentage of the ages (2003–2004 and 2004–2005)uninsured that lived outside metro- show that the proportion of people
politan statistical areas was 15.6 per- without coverage fell in three states
cent in 2005. and rose in eight states (Figure 9).The uninsured rate decreased forIdaho, Iowa, and New York. Four ofState Level Datathe states that experienced increases
Comparing across states using 3-year- were in the South (Delaware, Florida,average uninsured rates for Georgia, South Carolina), three were2003–2005 shows that Texas in the West (Arizona, California, Utah),(24.6 percent) had the highest percent- and one was in the Northeastage of uninsured, while Minnesota (Vermont).
TX
NM
WA
NV
MI
IL
MO
MT
WY
ID-1.6
UT+2.0 CO
HI
NE
AK
KS
OK
WI
IA-1.3
LA
MEVT+1.1
IN
KY
TN
AL GA+1.2
OH
WV
NC
SC+1.7
NJ
MD
CT
RI
MA
DE +1.0
SD
VA
AR
CA+0.5
AZ+1.6
NY-0.8
DC
OR
PA
ND
MN
MS
FL+1.3
NH
IncreaseNot statistically differentDecrease
Percentage-point difference
Figure 9. Differences in 2-Year-Average Uninsured Rates by State: 2004–2005 Less 2003–20041
1 The 2004 data have been revised to reflect a correction to the weights in the 2005 ASEC. The estimates also reflect improvements to the algorithm that assigns coverage to dependents.
Source: U.S. Census Bureau, Current Population Survey, 2004 to 2006 Annual Social and Economic Supplements.

U.S. Census Bureau Income, Poverty, and Health Insurance Coverage in the United States: 2005 27
Table 10.Percentage of People Without Health Insurance Coverage by State Using 2- and 3-Year Averages:2003 to 2005(People as of March of the following year)
2-year average3-year average Change in percentage points
2003–20051 (2004–2005 average less2003–20041 2004–20051 2003–2004 average)2
State90-percent 90-percent 90-percent 90-percentconfidence confidence confidence confidence
Percentage interval3 (±) Percentage interval3 (±) Percentage interval3 (±) Percentage4 interval3 (±)
United States . . . . . . . . . . . . . . . . . 15.7 0.1 15.6 0.1 15.7 0.1 0.1 0.1
Alabama . . . . . . . . . . . . . . . . . . . . . . . . . . . . . 14.3 1.0 13.8 1.1 14.4 1.2 0.6 1.0Alaska . . . . . . . . . . . . . . . . . . . . . . . . . . . . . . 17.8 1.1 17.9 1.3 17.3 1.4 –0.6 1.1Arizona . . . . . . . . . . . . . . . . . . . . . . . . . . . . . . 18.1 1.0 17.1 1.2 18.7 1.2 *1.6 1.1Arkansas . . . . . . . . . . . . . . . . . . . . . . . . . . . . 17.2 1.1 16.9 1.3 17.1 1.3 0.2 1.1California . . . . . . . . . . . . . . . . . . . . . . . . . . . . 18.8 0.4 18.5 0.5 19.0 0.5 *0.5 0.5Colorado . . . . . . . . . . . . . . . . . . . . . . . . . . . . 16.9 1.0 16.9 1.2 16.8 1.3 –0.1 1.0Connecticut . . . . . . . . . . . . . . . . . . . . . . . . . . 11.0 0.9 10.8 1.0 11.3 1.1 0.4 0.8Delaware . . . . . . . . . . . . . . . . . . . . . . . . . . . . 12.7 1.0 12.5 1.1 13.5 1.2 *1.0 0.9District of Columbia . . . . . . . . . . . . . . . . . . . . 13.5 1.1 13.5 1.3 13.1 1.3 –0.4 1.1Florida . . . . . . . . . . . . . . . . . . . . . . . . . . . . . . 19.6 0.6 19.0 0.7 20.3 0.7 *1.3 0.6
Georgia . . . . . . . . . . . . . . . . . . . . . . . . . . . . . 17.5 0.8 16.9 1.0 18.1 0.9 *1.2 0.9Hawaii . . . . . . . . . . . . . . . . . . . . . . . . . . . . . . 9.5 0.8 9.7 0.9 9.2 0.9 –0.5 0.8Idaho . . . . . . . . . . . . . . . . . . . . . . . . . . . . . . . 16.5 1.1 17.1 1.3 15.5 1.2 *–1.6 1.1Illinois . . . . . . . . . . . . . . . . . . . . . . . . . . . . . . . 14.2 0.6 14.2 0.7 14.2 0.7 – 0.6Indiana . . . . . . . . . . . . . . . . . . . . . . . . . . . . . . 14.2 0.8 14.1 1.0 14.3 1.0 0.2 0.8Iowa . . . . . . . . . . . . . . . . . . . . . . . . . . . . . . . . 9.8 0.8 10.4 1.0 9.1 1.0 *–1.3 0.8Kansas . . . . . . . . . . . . . . . . . . . . . . . . . . . . . . 10.9 0.9 11.0 1.0 10.9 1.1 –0.1 0.9Kentucky . . . . . . . . . . . . . . . . . . . . . . . . . . . . 13.6 1.0 14.1 1.1 13.5 1.2 –0.6 1.0Louisiana . . . . . . . . . . . . . . . . . . . . . . . . . . . . 18.7 1.1 18.7 1.3 17.7 1.3 –0.9 1.2Maine . . . . . . . . . . . . . . . . . . . . . . . . . . . . . . . 10.4 0.9 10.2 1.0 10.5 1.1 0.2 0.9
Maryland . . . . . . . . . . . . . . . . . . . . . . . . . . . . 14.1 0.9 14.1 1.0 14.2 1.1 0.1 0.9Massachusetts . . . . . . . . . . . . . . . . . . . . . . . . 10.7 0.7 11.2 0.8 10.7 0.9 –0.5 0.7Michigan . . . . . . . . . . . . . . . . . . . . . . . . . . . . . 11.3 0.6 11.3 0.7 11.5 0.7 0.2 0.6Minnesota . . . . . . . . . . . . . . . . . . . . . . . . . . . 8.7 0.7 8.8 0.8 8.7 0.9 –0.2 0.7Mississippi . . . . . . . . . . . . . . . . . . . . . . . . . . . 17.3 1.1 17.3 1.3 17.1 1.3 –0.3 1.1Missouri . . . . . . . . . . . . . . . . . . . . . . . . . . . . . 11.9 0.8 11.8 0.9 12.4 1.0 0.5 0.8Montana . . . . . . . . . . . . . . . . . . . . . . . . . . . . . 18.7 1.1 19.3 1.4 18.4 1.4 –1.0 1.2Nebraska . . . . . . . . . . . . . . . . . . . . . . . . . . . . 11.4 0.9 11.2 1.0 11.4 1.1 0.2 0.9Nevada . . . . . . . . . . . . . . . . . . . . . . . . . . . . . 18.4 1.1 18.9 1.3 18.1 1.4 –0.8 1.1New Hampshire . . . . . . . . . . . . . . . . . . . . . . . 10.4 0.9 10.5 1.0 10.5 1.1 – 0.8
New Jersey . . . . . . . . . . . . . . . . . . . . . . . . . . 14.5 0.7 14.2 0.8 14.8 0.9 0.6 0.7New Mexico . . . . . . . . . . . . . . . . . . . . . . . . . . 21.1 1.3 21.4 1.5 20.6 1.5 –0.8 1.3New York . . . . . . . . . . . . . . . . . . . . . . . . . . . . 13.9 0.5 14.2 0.6 13.3 0.6 *–0.8 0.5North Carolina . . . . . . . . . . . . . . . . . . . . . . . . 16.2 0.8 16.3 0.9 15.6 0.9 –0.6 0.8North Dakota . . . . . . . . . . . . . . . . . . . . . . . . . 11.2 0.9 10.7 1.0 11.4 1.1 0.7 0.9Ohio . . . . . . . . . . . . . . . . . . . . . . . . . . . . . . . . 12.0 0.6 11.8 0.7 11.9 0.7 0.1 0.6Oklahoma . . . . . . . . . . . . . . . . . . . . . . . . . . . . 19.5 1.1 20.0 1.3 19.0 1.4 –1.0 1.1Oregon . . . . . . . . . . . . . . . . . . . . . . . . . . . . . . 16.7 1.1 17.0 1.2 16.4 1.3 –0.6 1.1Pennsylvania . . . . . . . . . . . . . . . . . . . . . . . . . 11.2 0.5 11.6 0.6 11.1 0.6 –0.5 0.5Rhode Island . . . . . . . . . . . . . . . . . . . . . . . . . 11.0 0.9 10.5 1.0 11.4 1.2 0.8 0.9
South Carolina . . . . . . . . . . . . . . . . . . . . . . . . 15.6 1.0 14.6 1.1 16.3 1.3 *1.7 1.0South Dakota . . . . . . . . . . . . . . . . . . . . . . . . . 12.1 0.9 12.0 1.0 12.1 1.1 0.1 0.9Tennessee . . . . . . . . . . . . . . . . . . . . . . . . . . . 13.7 0.9 13.5 1.0 14.0 1.0 0.5 0.9Texas . . . . . . . . . . . . . . . . . . . . . . . . . . . . . . . 24.6 0.6 24.7 0.7 24.5 0.7 –0.2 0.6Utah . . . . . . . . . . . . . . . . . . . . . . . . . . . . . . . . 14.5 0.9 13.5 1.1 15.5 1.2 *2.0 1.0Vermont . . . . . . . . . . . . . . . . . . . . . . . . . . . . . 10.7 0.9 10.3 1.0 11.4 1.2 *1.1 0.9Virginia . . . . . . . . . . . . . . . . . . . . . . . . . . . . . . 13.6 0.8 13.6 0.9 13.9 0.9 0.3 0.8Washington . . . . . . . . . . . . . . . . . . . . . . . . . . 14.1 0.9 14.3 1.0 13.4 1.0 –0.8 0.9West Virginia . . . . . . . . . . . . . . . . . . . . . . . . . 16.9 1.0 16.4 1.1 17.0 1.2 0.6 1.0Wisconsin . . . . . . . . . . . . . . . . . . . . . . . . . . . . 10.3 0.8 10.6 0.9 10.0 0.9 –0.6 0.8Wyoming . . . . . . . . . . . . . . . . . . . . . . . . . . . . 15.2 1.1 14.7 1.2 14.8 1.3 0.1 1.1
– Represents zero or rounds to zero.* Statistically different from zero at the 90-percent confidence level.1 The 2004 data have been revised to reflect a correction to the weights in the 2005 ASEC. The estimates also reflect improvements to the algorithm that assigns coverage to dependents.2 The data in this column are derived from estimates that include 2004 twice—the first in the 2003–2004 average and the second in the 2004–2005 average. Therefore, estimates in this column
are equivalent to measuring half of the percentage-point difference between 2003 and 2005.3 A 90-percent confidence interval is a measure of an estimate’s variability. The larger the confidence interval in relation to the size of the estimate, the less reliable the estimate. For more
information, see ‘‘Standard Errors and Their Use’’ at <www.census.gov/hhes/www/p60_231sa.pdf>.4 Details may not sum to totals because of rounding.
Source: U.S. Census Bureau, Current Population Survey, 2004 to 2006 Annual Social and Economic Supplements.

CPS DATA COLLECTION
The information in this report was col-lected in the 50 states and the Districtof Columbia and does not representresidents of Puerto Rico and U.S. islandareas.40 It is based on a sample ofabout 100,000 addresses. The esti-mates in this report are controlled tonational population estimates by age,race, sex, and Hispanic origin, and tostate population estimates by age.
28 Income, Poverty, and Health Insurance Coverage in the United States: 2005 U.S. Census Bureau
40 U.S. island areas include American Samoa,Guam, the Northern Mariana Islands, and theVirgin Islands of the United States.
The population controls used to pre-pare estimates for 1999 to 2004 werebased on the results from Census2000 and are updated annually usingadministrative records such as birthand death certificates.
The CPS is a household surveyprimarily used to collect employmentdata. The sample universe for thebasic CPS consists of the residentcivilian noninstitutionalized popula-tion of the United States. People ininstitutions, such as prisons, long-term care hospitals, and nursinghomes, are therefore not eligible to
be interviewed in the CPS. Studentsliving in dormitories are only includedin the estimates if information aboutthem is reported in an interview attheir parents’ homes. The sampleuniverse for the CPS ASEC is slightlylarger than the basic CPS since itincludes military personnel who livein a household with at least one othercivilian adult, regardless of whetherthey live off post or on post. Allother Armed Forces are excluded.For further documentation about theCPS ASEC, see <www.bls.census.gov/cps/ads/adsmain.htm>.
COMMENTS
The Census Bureau welcomes thecomments and advice of data andreport users. If you have suggestionsor comments, please write to:
Charles NelsonAssistant Division Chief for Income,
Poverty, and Health StatisticsHousing and Household Economic
Statistics DivisionU.S. Census BureauWashington, DC 20233-8500
or send e-mail to<[email protected]>.
Additional Data and Contacts
Detailed tables, historical tables, press releases and briefings, and unpub-lished data are available electronically on the Census Bureau's Income,Poverty, and Health Insurance Web sites. The Web sites may be accessedthrough the Census Bureau’s home page at <www.census.gov> or directly at<www.census.gov/hhes/www/income/income.html> for income data,<www.census.gov/hhes/www/poverty/poverty.html> for poverty data, and<www.census.gov/hhes/www/hlthins/hlthins.html> for health insurancedata. Microdata are available for downloading by clicking on “Data Tools”on the Census Bureau’s home page and then clicking the “DataFerrett” link.Technical methods have been applied to CPS microdata to avoid disclosingthe identities of individuals from whom data were collected.
For assistance with income, poverty, or health insurance data or questionsabout them, contact the Housing and Household Economic StatisticsDivision statistical information staff by telephone at 301-763-3242 orsearch your topic of interest using the Census Bureau’s “Question andAnswer Center” found at <http://ask.census.gov>.

U.S. Census Bureau Income, Poverty, and Health Insurance Coverage in the United States: 2005 29
APPENDIX A.ESTIMATES OF INCOME
How Income Is Measured
For each person in the sample 15years and over, the Annual Social andEconomic Supplement (ASEC) asksquestions on the amount of moneyincome received in the preceding cal-endar year from each of the followingsources:
1. Earnings 2. Unemployment compensation 3. Workers’ compensation 4. Social security 5. Supplemental security income 6. Public assistance 7. Veterans’ payments 8. Survivor benefits 9. Disability benefits 10. Pension or retirement income 11. Interest 12. Dividends 13. Rents, royalties, and estates and
trusts 14. Educational assistance 15. Alimony 16. Child support 17. Financial assistance from outside
of the household
18. Other income
It should be noted that although theincome statistics refer to receipts dur-ing the preceding calendar year, thedemographic characteristics, such asage, labor force status, and house-hold composition, are as of the sur-vey date. The income of the house-hold does not include amountsreceived by people who were mem-bers during all or part of the previousyear if these people no longer residedin the household at the time of inter-view. The Current Population Survey(CPS) collects income data for peoplewho are current residents but did not
reside in the household during the that for many different reasons thereprevious year. is a tendency in household surveys for
respondents to underreport theirData on income collected in the ASEC
income. Based on an analysis of by the U.S. Census Bureau cover
independently derived income esti-money income received (exclusive of
mates, the Census Bureau determinedcertain money receipts such as capital
that respondents report income earnedgains) before payments for personal
from wages or salaries much betterincome taxes, social security, union
than other sources of income, and thatdues, Medicare deductions, etc.
the reported wage and salary incomeTherefore, money income does not
is nearly equal to independent esti-reflect the fact that some families
mates of aggregate income.receive noncash benefits, such as foodstamps, health benefits, subsidized Cost of Living Adjustmenthousing, and goods produced and
In order to accurately assess changesconsumed on the farm. In addition,in income and earnings over time, anmoney income does not reflect theadjustment for changes in the cost offact that noncash benefits are alsoliving is required. The Census Bureaureceived by some nonfarm residents,uses the research series of thewhich often take the form of the useConsumer Price Index (CPI-U-RS), pro-of business transportation and facili-vided by the Bureau of Laborties, full or partial payments by busi-Statistics for 1967 through 2005, toness for retirement programs, medicaladjust for changes in the cost of liv-and educational expenses, etc. Dataing. The indexes used to make theusers should consider these elementsconstant dollar conversions arewhen comparing income levels.shown on page 30. Moreover, readers should be aware
Recessions
Peak month Year Trough month Year
November 1948 October 1949July 1953 May 1954August 1957 April 1958April 1960 February 1961December 1969 November 1970November 1973 March 1975January 1980 July 1980July 1981 November 1982July 1990 March 1991March 2001 November 2001
Source: National Bureau of Economic Research, Inc. 1050 Massachusetts AvenueCambridge, MA 02138

Annual Average Consumer Price Index Research SeriesUsing Current Methods (CPI-U-RS) All Items: 1947 to 2005
Year CPI-U-RS1 Year CPI-U-RS1
1947. . . . . . . . . . . . . . . . . . . . . . 38.3 1976 . . . . . . . . . . . . . . . . . . . . . 94.01948. . . . . . . . . . . . . . . . . . . . . . 41.4 1977 . . . . . . . . . . . . . . . . . . . . . 100.01949. . . . . . . . . . . . . . . . . . . . . . 40.9 1978 . . . . . . . . . . . . . . . . . . . . . 104.31950. . . . . . . . . . . . . . . . . . . . . . 41.4 1979 . . . . . . . . . . . . . . . . . . . . . 114.11951. . . . . . . . . . . . . . . . . . . . . . 44.7 1980 . . . . . . . . . . . . . . . . . . . . . 126.71952. . . . . . . . . . . . . . . . . . . . . . 45.6 1981 . . . . . . . . . . . . . . . . . . . . . 138.61953. . . . . . . . . . . . . . . . . . . . . . 45.9 1982 . . . . . . . . . . . . . . . . . . . . . 146.81954. . . . . . . . . . . . . . . . . . . . . . 46.3 1983 . . . . . . . . . . . . . . . . . . . . . 152.91955. . . . . . . . . . . . . . . . . . . . . . 46.1 1984 . . . . . . . . . . . . . . . . . . . . . 159.01956. . . . . . . . . . . . . . . . . . . . . . 46.8 1985 . . . . . . . . . . . . . . . . . . . . . 164.31957. . . . . . . . . . . . . . . . . . . . . . 48.3 1986 . . . . . . . . . . . . . . . . . . . . . 167.31958. . . . . . . . . . . . . . . . . . . . . . 49.7 1987 . . . . . . . . . . . . . . . . . . . . . 173.01959. . . . . . . . . . . . . . . . . . . . . . 50.0 1988 . . . . . . . . . . . . . . . . . . . . . 179.31960. . . . . . . . . . . . . . . . . . . . . . 50.9 1989 . . . . . . . . . . . . . . . . . . . . . 187.01961. . . . . . . . . . . . . . . . . . . . . . 51.4 1990 . . . . . . . . . . . . . . . . . . . . . 196.31962. . . . . . . . . . . . . . . . . . . . . . 51.9 1991 . . . . . . . . . . . . . . . . . . . . . 203.41963. . . . . . . . . . . . . . . . . . . . . . 52.6 1992 . . . . . . . . . . . . . . . . . . . . . 208.51964. . . . . . . . . . . . . . . . . . . . . . 53.3 1993 . . . . . . . . . . . . . . . . . . . . . 213.71965. . . . . . . . . . . . . . . . . . . . . . 54.2 1994 . . . . . . . . . . . . . . . . . . . . . 218.21966. . . . . . . . . . . . . . . . . . . . . . 55.7 1995 . . . . . . . . . . . . . . . . . . . . . 223.51967. . . . . . . . . . . . . . . . . . . . . . 57.4 1996 . . . . . . . . . . . . . . . . . . . . . 229.51968. . . . . . . . . . . . . . . . . . . . . . 59.7 1997 . . . . . . . . . . . . . . . . . . . . . 234.41969. . . . . . . . . . . . . . . . . . . . . . 62.3 1998 . . . . . . . . . . . . . . . . . . . . . 237.71970. . . . . . . . . . . . . . . . . . . . . . 65.3 1999 . . . . . . . . . . . . . . . . . . . . . 242.71971. . . . . . . . . . . . . . . . . . . . . . 68.2 2000 . . . . . . . . . . . . . . . . . . . . . 250.81972. . . . . . . . . . . . . . . . . . . . . . 70.3 2001 . . . . . . . . . . . . . . . . . . . . . 257.81973. . . . . . . . . . . . . . . . . . . . . . 74.7 2002 . . . . . . . . . . . . . . . . . . . . . 261.91974. . . . . . . . . . . . . . . . . . . . . . 82.1 2003 . . . . . . . . . . . . . . . . . . . . . 267.91975. . . . . . . . . . . . . . . . . . . . . . 88.9 2004 . . . . . . . . . . . . . . . . . . . . . 275.1
2005 . . . . . . . . . . . . . . . . . . . . . 284.3
1 The Census Bureau uses the Bureau of Labor Statistics’ experimental Consumer Price Index(CPI-U-RS) for 1977 through 2005. The Census Bureau derived the CPI-U-RS for years before 1977by applying the 1977 CPI-U-RS-to-CPI-U ratio to the 1947 to 1976 CPI-U.
Note: Data users can compute the percentage changes in prices between earlier years’ data and2005 data by dividing the annual average Consumer Price Index (CPI-U-RS) for 2005 by the annualaverage for the earlier year(s).
For more information on the CPI-U-RS, go to <www.bls.gov/cpi/cpirsdc.htm>.
30 Income, Poverty, and Health Insurance Coverage in the United States: 2005 U.S. Census Bureau

U.S. C
ensu
s Bureau
Inco
me, Po
verty, an
d H
ealth In
suran
ce Coverag
e in th
e Un
ited States: 2
00
5 3
1
Table A-1.Households by Total Money Income, Race, and Hispanic Origin of Householder: 1967 to 2005(Income in 2005 CPI-U-RS adjusted dollars. Households as of March of the following year)
Race and Hispanic originof householder and year
Number(thousands)
Percent distribution Median income(dollars)
Mean income(dollars)
TotalUnder
$5,000
$5,000to
$9,999
$10,000to
$14,999
$15,000to
$24,999
$25,000to
$34,999
$35,000to
$49,999
$50,000to
$74,999
$75,000to
$99,999$100,000and over Value
Standarderror Value
Standarderror
ALL RACES
2005. . . . . . . . . . . . . . . . . . . . . . . 114,384 100.0 3.3 5.0 6.4 12.4 11.4 14.9 18.4 11.1 17.2 46,326 155 63,344 23920041 . . . . . . . . . . . . . . . . . . . . . . 113,343 100.0 3.4 4.9 6.6 12.7 11.6 14.6 18.3 11.2 16.7 45,817 203 62,488 2362003. . . . . . . . . . . . . . . . . . . . . . . 112,000 100.0 3.2 5.0 6.8 12.3 11.5 14.7 18.0 11.4 17.0 45,970 200 62,683 2292002. . . . . . . . . . . . . . . . . . . . . . . 111,278 100.0 3.0 5.2 6.4 12.4 11.8 14.7 17.9 11.9 16.6 46,036 151 62,800 2362001. . . . . . . . . . . . . . . . . . . . . . . 109,297 100.0 2.9 5.1 6.3 12.2 11.7 15.0 18.1 11.9 16.9 46,569 142 64,191 25620002 . . . . . . . . . . . . . . . . . . . . . . 108,209 100.0 2.6 4.8 6.3 12.0 11.6 14.9 18.7 11.9 17.2 47,599 150 64,767 25519993 . . . . . . . . . . . . . . . . . . . . . . 106,434 100.0 2.5 4.9 6.2 12.4 11.2 15.1 18.7 11.9 17.0 47,671 223 64,119 3331998. . . . . . . . . . . . . . . . . . . . . . . 103,874 100.0 2.8 5.4 6.3 12.3 11.4 15.2 19.0 11.7 15.9 46,508 275 62,021 3351997. . . . . . . . . . . . . . . . . . . . . . . 102,528 100.0 2.8 5.7 6.6 12.9 11.4 15.5 18.7 11.5 14.9 44,883 207 60,271 3371996. . . . . . . . . . . . . . . . . . . . . . . 101,018 100.0 2.7 5.9 6.9 13.3 12.0 15.2 19.0 11.4 13.6 43,967 222 58,375 32719954 . . . . . . . . . . . . . . . . . . . . . . 99,627 100.0 2.7 5.9 6.8 13.5 12.0 15.8 18.9 11.2 13.2 43,346 251 57,163 31319945 . . . . . . . . . . . . . . . . . . . . . . 98,990 100.0 3.0 6.2 7.3 13.6 12.2 15.6 18.3 11.0 12.7 42,038 192 56,199 30219936 . . . . . . . . . . . . . . . . . . . . . . 97,107 100.0 3.2 6.5 7.3 13.3 12.6 15.7 18.6 10.5 12.3 41,562 194 55,115 29819927 . . . . . . . . . . . . . . . . . . . . . . 96,426 100.0 3.0 6.7 7.2 13.6 12.2 15.9 19.2 10.8 11.5 41,774 198 52,960 2221991. . . . . . . . . . . . . . . . . . . . . . . 95,669 100.0 2.8 6.6 7.1 13.0 12.6 16.1 19.4 10.7 11.6 42,108 203 53,005 2181990. . . . . . . . . . . . . . . . . . . . . . . 94,312 100.0 2.7 6.4 6.8 12.8 12.2 16.4 19.7 10.9 12.0 43,366 222 54,171 2291989. . . . . . . . . . . . . . . . . . . . . . . 93,347 100.0 2.6 6.1 6.8 13.0 11.8 16.1 19.7 11.4 12.6 43,946 242 55,522 2421988. . . . . . . . . . . . . . . . . . . . . . . 92,830 100.0 2.7 6.7 6.6 13.0 12.1 16.1 19.8 11.2 11.8 43,168 211 53,938 24119878 . . . . . . . . . . . . . . . . . . . . . . 91,124 100.0 2.8 6.7 6.9 13.0 12.2 16.0 19.9 11.1 11.4 42,827 204 53,261 2191986. . . . . . . . . . . . . . . . . . . . . . . 89,479 100.0 3.0 6.7 7.0 12.9 12.5 16.0 20.3 10.8 10.8 42,309 219 52,270 21219859 . . . . . . . . . . . . . . . . . . . . . . 88,458 100.0 2.9 6.8 7.5 13.3 13.0 16.4 19.9 10.5 9.7 40,868 221 50,295 1991984 . . . . . . . . . . . . . . . . . . . . . . 86,789 100.0 2.9 6.8 7.7 13.6 13.1 16.9 19.6 10.2 9.2 40,079 182 49,107 181198310 . . . . . . . . . . . . . . . . . . . . . 85,290 100.0 3.1 7.2 7.5 14.3 13.1 17.2 19.5 9.6 8.4 39,081 177 47,617 1771982. . . . . . . . . . . . . . . . . . . . . . . 83,918 100.0 3.1 7.2 7.8 14.1 13.2 17.6 19.5 9.6 8.0 39,064 176 47,078 1741981. . . . . . . . . . . . . . . . . . . . . . . 83,527 100.0 2.9 7.2 7.8 14.6 13.1 17.0 20.4 9.4 7.7 39,125 205 46,741 1701980. . . . . . . . . . . . . . . . . . . . . . . 82,368 100.0 2.6 7.2 7.7 14.0 13.0 17.6 20.6 9.7 7.7 39,739 204 47,263 173197911 . . . . . . . . . . . . . . . . . . . . . 80,776 100.0 2.6 7.0 7.2 13.4 12.9 17.2 21.5 9.9 8.3 41,015 194 48,722 1841978. . . . . . . . . . . . . . . . . . . . . . . 77,330 100.0 2.3 7.0 7.5 13.7 12.7 17.5 21.4 10.1 7.8 41,061 166 48,328 1851977. . . . . . . . . . . . . . . . . . . . . . . 76,030 100.0 2.5 7.6 8.0 14.2 13.4 18.0 20.9 8.9 6.5 38,585 145 45,772 139197612 . . . . . . . . . . . . . . . . . . . . . 74,142 100.0 2.6 7.7 7.5 14.8 13.3 18.4 21.0 8.9 6.0 38,368 142 45,131 139197513 . . . . . . . . . . . . . . . . . . . . . 72,867 100.0 2.7 7.7 8.1 14.6 13.6 19.0 20.5 8.5 5.5 37,736 154 44,065 138197413 14 . . . . . . . . . . . . . . . . . . . 71,163 100.0 2.5 7.3 7.7 14.0 13.8 18.8 21.1 8.5 6.2 38,774 149 45,343 1421973. . . . . . . . . . . . . . . . . . . . . . . 69,859 100.0 3.0 7.0 7.4 13.6 12.8 19.1 21.1 9.4 6.7 40,008 152 46,268 141197215 . . . . . . . . . . . . . . . . . . . . . 68,251 100.0 3.3 7.4 7.3 13.6 13.2 19.4 21.0 8.5 6.4 39,216 150 45,642 142197116 . . . . . . . . . . . . . . . . . . . . . 66,676 100.0 3.6 7.9 7.3 13.7 14.1 19.9 20.6 7.7 5.2 37,634 146 43,283 1381970. . . . . . . . . . . . . . . . . . . . . . . 64,778 100.0 3.8 7.9 6.9 13.4 14.0 20.5 20.7 7.6 5.2 38,026 139 43,542 1391969. . . . . . . . . . . . . . . . . . . . . . . 63,401 100.0 3.9 7.7 6.8 13.1 14.1 20.8 21.3 7.4 4.9 38,282 141 43,553 1371968. . . . . . . . . . . . . . . . . . . . . . . 62,214 100.0 4.1 7.8 7.0 13.9 14.8 21.6 20.2 6.4 4.1 36,873 133 41,716 133196717 . . . . . . . . . . . . . . . . . . . . . 60,813 100.0 4.9 8.2 7.4 14.0 15.7 21.8 18.3 5.7 4.1 35,379 129 39,569 129
See footnotes at end of table.

32
Inco
me, Po
verty, an
d H
ealth In
suran
ce Coverag
e in th
e Un
ited States: 2
00
5U
.S. Cen
sus Bu
reau
Table A-1.Households by Total Money Income, Race, and Hispanic Origin of Householder: 1967 to 2005—Con.(Income in 2005 CPI-U-RS adjusted dollars. Households as of March of the following year)
Race and Hispanic originof householder and year
Number(thousands)
Percent distribution Median income(dollars)
Mean income(dollars)
TotalUnder
$5,000
$5,000to
$9,999
$10,000to
$14,999
$15,000to
$24,999
$25,000to
$34,999
$35,000to
$49,999
$50,000to
$74,999
$75,000to
$99,999$100,000and over Value
Standarderror Value
Standarderror
WHITE ALONE18
2005. . . . . . . . . . . . . . . . . . . . . . . 93,588 100.0 2.6 4.1 6.1 12.0 11.4 14.9 18.9 11.6 18.3 48,554 212 65,962 27320041 . . . . . . . . . . . . . . . . . . . . . . 92,880 100.0 2.8 4.2 6.3 12.3 11.4 14.6 18.7 11.7 17.8 48,218 189 65,013 2682003. . . . . . . . . . . . . . . . . . . . . . . 91,962 100.0 2.6 4.3 6.4 11.9 11.4 14.8 18.4 11.9 18.1 48,424 190 65,357 2622002. . . . . . . . . . . . . . . . . . . . . . . 91,645 100.0 2.4 4.6 6.1 12.0 11.6 14.6 18.5 12.6 17.6 48,942 199 65,312 266
WHITE19
2001. . . . . . . . . . . . . . . . . . . . . . . 90,682 100.0 2.3 4.4 6.1 11.8 11.5 15.0 18.5 12.4 18.0 49,093 230 66,732 28720002 . . . . . . . . . . . . . . . . . . . . . . 90,030 100.0 2.2 4.2 6.1 11.6 11.4 14.9 19.1 12.4 18.2 49,782 220 67,169 28819993 . . . . . . . . . . . . . . . . . . . . . . 88,893 100.0 2.0 4.2 5.9 12.0 11.2 15.1 19.2 12.6 17.8 49,580 251 66,449 3761998. . . . . . . . . . . . . . . . . . . . . . . 87,212 100.0 2.2 4.5 6.0 11.8 11.3 15.3 19.6 12.3 16.9 48,933 245 64,834 3821997. . . . . . . . . . . . . . . . . . . . . . . 86,106 100.0 2.3 4.9 6.3 12.6 11.3 15.6 19.1 12.0 15.9 47,269 300 62,951 3831996. . . . . . . . . . . . . . . . . . . . . . . 85,059 100.0 2.1 5.1 6.5 12.9 11.9 15.3 19.7 12.0 14.5 46,034 238 60,693 35919954 . . . . . . . . . . . . . . . . . . . . . . 84,511 100.0 2.1 5.1 6.4 13.2 11.9 16.0 19.5 11.7 14.2 45,496 238 59,441 34519945 . . . . . . . . . . . . . . . . . . . . . . 83,737 100.0 2.4 5.2 6.9 13.2 12.1 16.0 18.9 11.6 13.7 44,336 249 58,676 34119936 . . . . . . . . . . . . . . . . . . . . . . 82,387 100.0 2.5 5.5 6.7 13.0 12.5 16.0 19.4 11.1 13.2 43,849 255 57,585 33319927 . . . . . . . . . . . . . . . . . . . . . . 81,795 100.0 2.3 5.6 6.8 13.2 12.2 16.2 19.9 11.5 12.4 43,919 213 55,352 2471991. . . . . . . . . . . . . . . . . . . . . . . 81,675 100.0 2.1 5.5 6.6 12.7 12.6 16.4 20.2 11.3 12.5 44,125 214 55,243 2401990. . . . . . . . . . . . . . . . . . . . . . . 80,968 100.0 2.1 5.4 6.3 12.5 12.2 16.8 20.3 11.6 12.8 45,232 207 56,356 2521989. . . . . . . . . . . . . . . . . . . . . . . 80,163 100.0 2.0 5.0 6.3 12.6 11.8 16.4 20.5 11.9 13.5 46,227 225 57,835 2681988. . . . . . . . . . . . . . . . . . . . . . . 79,734 100.0 2.2 5.5 6.1 12.5 12.0 16.5 20.7 11.8 12.7 45,635 270 56,238 26519878 . . . . . . . . . . . . . . . . . . . . . . 78,519 100.0 2.3 5.6 6.4 12.5 12.1 16.4 20.8 11.8 12.1 45,123 228 55,537 2401986. . . . . . . . . . . . . . . . . . . . . . . 77,284 100.0 2.4 5.8 6.5 12.5 12.4 16.3 21.0 11.5 11.6 44,480 216 54,447 23319859 . . . . . . . . . . . . . . . . . . . . . . 76,576 100.0 2.4 5.8 7.0 12.9 12.8 16.7 20.7 11.0 10.5 43,100 230 52,359 2201984 . . . . . . . . . . . . . . . . . . . . . . 75,328 100.0 2.4 5.8 7.1 13.1 13.0 17.3 20.6 10.8 9.9 42,282 213 51,133 198198310 . . . . . . . . . . . . . . . . . . . . . 74,170 100.0 2.6 6.1 7.0 13.8 13.1 17.8 20.4 10.2 9.1 40,972 184 49,607 1921982. . . . . . . . . . . . . . . . . . . . . . . 73,182 100.0 2.6 6.3 7.2 13.5 13.3 17.9 20.3 10.2 8.6 40,896 186 49,019 1921981. . . . . . . . . . . . . . . . . . . . . . . 72,845 100.0 2.4 6.2 7.2 14.0 13.1 17.4 21.3 9.9 8.4 41,338 191 48,700 1851980. . . . . . . . . . . . . . . . . . . . . . . 71,872 100.0 2.2 6.2 7.1 13.5 13.0 17.8 21.6 10.2 8.3 41,925 215 49,170 188197911 . . . . . . . . . . . . . . . . . . . . . 70,766 100.0 2.2 6.1 6.7 12.9 12.8 17.6 22.4 10.4 8.9 43,004 204 50,643 2021978. . . . . . . . . . . . . . . . . . . . . . . 68,028 100.0 2.0 6.1 7.0 13.2 12.6 17.7 22.4 10.6 8.4 42,686 188 50,119 2021977. . . . . . . . . . . . . . . . . . . . . . . 66,934 100.0 2.2 6.6 7.5 13.6 13.2 18.4 21.9 9.5 7.1 40,575 171 47,561 154197612 . . . . . . . . . . . . . . . . . . . . . 65,353 100.0 2.3 6.8 6.8 14.2 13.2 18.7 22.0 9.5 6.5 40,192 166 46,867 151197513 . . . . . . . . . . . . . . . . . . . . . 64,392 100.0 2.4 6.8 7.5 14.2 13.5 19.4 21.4 9.0 5.9 39,463 144 45,693 150197413 14 . . . . . . . . . . . . . . . . . . . 62,984 100.0 2.2 6.5 7.1 13.4 13.7 19.2 22.1 9.0 6.7 40,550 152 47,022 1521973. . . . . . . . . . . . . . . . . . . . . . . 61,965 100.0 2.6 6.4 6.8 13.0 12.5 19.4 22.0 10.1 7.2 41,929 160 48,057 152197215 . . . . . . . . . . . . . . . . . . . . . 60,618 100.0 2.9 6.7 6.6 12.9 13.0 19.9 21.9 9.1 6.9 41,141 158 47,417 154197116 . . . . . . . . . . . . . . . . . . . . . 59,463 100.0 3.3 7.2 6.8 13.1 13.9 20.5 21.6 8.2 5.6 39,364 150 44,850 1461970. . . . . . . . . . . . . . . . . . . . . . . 57,575 100.0 3.3 7.3 6.4 12.8 13.8 21.1 21.7 8.0 5.6 39,606 152 45,066 1481969. . . . . . . . . . . . . . . . . . . . . . . 56,248 100.0 3.4 7.1 6.3 12.3 13.8 21.5 22.4 7.9 5.3 39,953 146 45,169 1511968. . . . . . . . . . . . . . . . . . . . . . . 55,394 100.0 3.7 7.2 6.4 13.1 14.8 22.3 21.3 6.8 4.5 38,392 143 43,216 143196717 . . . . . . . . . . . . . . . . . . . . . 54,188 100.0 4.4 7.6 6.7 13.3 15.7 22.6 19.3 6.1 4.4 36,895 134 41,015 139
See footnotes at end of table.

U.S. C
ensu
s Bureau
Inco
me, Po
verty, an
d H
ealth In
suran
ce Coverag
e in th
e Un
ited States: 2
00
5 3
3
Table A-1.Households by Total Money Income, Race, and Hispanic Origin of Householder: 1967 to 2005—Con.(Income in 2005 CPI-U-RS adjusted dollars. Households as of March of the following year)
Race and Hispanic originof householder and year
Number(thousands)
Percent distribution Median income(dollars)
Mean income(dollars)
TotalUnder
$5,000
$5,000to
$9,999
$10,000to
$14,999
$15,000to
$24,999
$25,000to
$34,999
$35,000to
$49,999
$50,000to
$74,999
$75,000to
$99,999$100,000and over Value
Standarderror Value
Standarderror
WHITE ALONE, NOTHISPANIC18
2005. . . . . . . . . . . . . . . . . . . . . . . 82,003 100.0 2.5 3.9 5.9 11.3 10.9 14.6 19.1 12.1 19.7 50,784 172 68,603 30320041 . . . . . . . . . . . . . . . . . . . . . . 81,628 100.0 2.6 4.0 6.1 11.7 10.9 14.3 19.0 12.2 19.1 50,546 231 67,440 2932003. . . . . . . . . . . . . . . . . . . . . . . 81,148 100.0 2.4 4.1 6.2 11.3 10.9 14.5 18.7 12.4 19.4 50,702 245 67,798 2882002. . . . . . . . . . . . . . . . . . . . . . .
WHITE, NOT HISPANIC19
81,166 100.0 2.2 4.4 6.0 11.4 11.1 14.4 18.7 13.1 18.8 50,911 200 67,428 287
2001. . . . . . . . . . . . . . . . . . . . . . . 80,818 100.0 2.1 4.2 5.9 11.3 11.1 14.7 18.7 12.8 19.1 51,065 212 68,863 31220002 . . . . . . . . . . . . . . . . . . . . . . 80,527 100.0 2.1 4.0 6.0 11.0 11.1 14.6 19.2 12.8 19.3 51,717 207 69,213 31119993 . . . . . . . . . . . . . . . . . . . . . . 79,819 100.0 1.9 3.9 5.7 11.5 10.8 14.9 19.5 13.0 19.0 51,726 327 68,628 4061998. . . . . . . . . . . . . . . . . . . . . . . 78,577 100.0 2.0 4.1 5.7 11.3 10.9 15.1 20.0 12.8 18.0 50,759 292 66,910 4091997. . . . . . . . . . . . . . . . . . . . . . . 77,936 100.0 2.1 4.5 6.0 12.1 11.0 15.4 19.5 12.6 16.9 49,215 257 64,968 (NA)1996. . . . . . . . . . . . . . . . . . . . . . . 77,240 100.0 1.9 4.7 6.2 12.4 11.6 15.2 20.1 12.5 15.4 48,049 330 62,529 (NA)19954 . . . . . . . . . . . . . . . . . . . . . . 76,932 100.0 1.9 4.6 6.0 12.6 11.6 16.0 20.0 12.2 15.1 47,292 247 61,380 36819945 . . . . . . . . . . . . . . . . . . . . . . 77,004 100.0 2.3 4.8 6.6 12.8 11.9 16.0 19.3 12.0 14.3 45,767 242 60,171 35719936 . . . . . . . . . . . . . . . . . . . . . . 75,697 100.0 2.3 5.2 6.4 12.6 12.3 15.9 19.9 11.5 13.9 45,463 266 59,103 35319927 . . . . . . . . . . . . . . . . . . . . . . 75,107 100.0 2.1 5.2 6.5 12.8 12.0 16.1 20.3 11.9 13.0 45,393 281 56,758 2621991. . . . . . . . . . . . . . . . . . . . . . . 75,625 100.0 2.0 5.3 6.3 12.4 12.4 16.4 20.5 11.7 13.1 45,179 222 56,427 2521990. . . . . . . . . . . . . . . . . . . . . . . 75,035 100.0 1.9 5.2 6.0 12.2 12.0 16.8 20.6 11.9 13.3 46,266 216 57,599 2611989. . . . . . . . . . . . . . . . . . . . . . . 74,495 100.0 1.8 4.8 6.2 12.3 11.5 16.4 20.7 12.2 14.0 47,221 231 58,988 2891988. . . . . . . . . . . . . . . . . . . . . . . 74,067 100.0 2.0 5.3 5.9 12.2 11.8 16.5 20.9 12.2 13.2 46,893 263 57,383 27019878 . . . . . . . . . . . . . . . . . . . . . . 73,120 100.0 2.1 5.3 6.2 12.2 11.9 16.4 21.2 12.2 12.6 46,364 270 56,630 2631986. . . . . . . . . . . . . . . . . . . . . . . 72,067 100.0 2.3 5.5 6.3 12.1 12.2 16.3 21.4 11.8 12.1 45,491 235 55,535 25519859 . . . . . . . . . . . . . . . . . . . . . . 71,540 100.0 2.3 5.6 6.8 12.5 12.7 16.7 21.1 11.3 11.0 44,069 225 53,382 2421984 . . . . . . . . . . . . . . . . . . . . . . 70,586 100.0 2.2 5.5 6.9 12.8 13.0 17.3 20.8 11.1 10.3 43,160 240 52,014 232198310 . . . . . . . . . . . . . . . . . . . . . (NA) 100.0 2.4 5.9 6.7 13.6 12.9 17.8 20.7 10.4 9.4 (NA) (NA) (NA) (NA)1982. . . . . . . . . . . . . . . . . . . . . . . 69,214 100.0 2.5 6.1 7.0 13.3 13.2 18.0 20.6 10.4 8.9 41,582 209 49,733 2131981. . . . . . . . . . . . . . . . . . . . . . . 68,996 100.0 2.3 6.1 7.0 13.8 13.0 17.4 21.6 10.1 8.7 41,935 213 49,311 2051980. . . . . . . . . . . . . . . . . . . . . . . 68,106 100.0 2.1 6.0 7.0 13.2 12.8 17.9 21.9 10.5 8.6 42,667 108 49,814 224197911 . . . . . . . . . . . . . . . . . . . . . 67,203 100.0 2.1 6.0 6.6 12.7 12.6 17.5 22.7 10.6 9.2 43,609 242 51,229 2241978. . . . . . . . . . . . . . . . . . . . . . . 64,836 100.0 2.0 6.0 6.9 13.0 12.4 17.7 22.6 10.9 8.6 43,490 229 50,700 2181977. . . . . . . . . . . . . . . . . . . . . . . 63,721 100.0 2.2 6.5 7.3 13.4 13.0 18.4 22.3 9.7 7.3 41,380 233 48,160 227197612 . . . . . . . . . . . . . . . . . . . . . 62,365 100.0 2.2 6.7 6.7 14.0 13.1 18.7 22.2 9.7 6.7 41,012 239 47,484 212197513 . . . . . . . . . . . . . . . . . . . . . 61,533 100.0 2.3 6.7 7.3 13.9 13.3 19.4 21.7 9.3 6.1 39,760 211 46,243 224197413 14 . . . . . . . . . . . . . . . . . . . 60,164 100.0 2.2 6.4 7.0 13.1 13.5 19.2 22.4 9.2 6.9 40,896 201 47,545 2081973. . . . . . . . . . . . . . . . . . . . . . . 59,236 100.0 2.5 6.4 6.7 12.7 12.3 19.4 22.3 10.3 7.4 42,299 198 48,594 206197215 . . . . . . . . . . . . . . . . . . . . .
BLACK ALONE OR INCOMBINATION
58,005 100.0 2.9 6.7 6.5 12.6 12.8 19.8 22.3 9.3 7.1 41,727 198 47,967 214
2005. . . . . . . . . . . . . . . . . . . . . . . 14,399 100.0 6.8 10.3 8.9 16.1 12.5 15.0 15.2 7.4 7.9 30,954 295 42,727 46520041 . . . . . . . . . . . . . . . . . . . . . . 14,151 100.0 7.6 9.6 8.8 15.8 13.8 14.8 14.9 7.5 7.2 31,246 286 42,122 4472003. . . . . . . . . . . . . . . . . . . . . . . 13,969 100.0 6.6 9.9 9.6 15.3 13.4 14.7 15.3 7.5 7.8 31,506 396 42,784 4532002. . . . . . . . . . . . . . . . . . . . . . .
See footnotes at end of table.
13,778 100.0 6.4 10.0 8.9 15.6 13.8 15.5 14.0 7.7 8.1 31,672 417 43,784 510

34
Inco
me, Po
verty, an
d H
ealth In
suran
ce Coverag
e in th
e Un
ited States: 2
00
5U
.S. Cen
sus Bu
reau
Table A-1.Households by Total Money Income, Race, and Hispanic Origin of Householder: 1967 to 2005—Con.(Income in 2005 CPI-U-RS adjusted dollars. Households as of March of the following year)
Race and Hispanic originof householder and year
Number(thousands)
Percent distribution Median income(dollars)
Mean income(dollars)
TotalUnder
$5,000
$5,000to
$9,999
$10,000to
$14,999
$15,000to
$24,999
$25,000to
$34,999
$35,000to
$49,999
$50,000to
$74,999
$75,000to
$99,999$100,000and over Value
Standarderror Value
Standarderror
BLACK ALONE20
2005. . . . . . . . . . . . . . . . . . . . . . . 14,002 100.0 6.8 10.3 8.9 16.1 12.6 15.1 15.1 7.3 7.8 30,858 301 42,454 46120041 . . . . . . . . . . . . . . . . . . . . . . 13,809 100.0 7.6 9.7 8.9 15.9 13.8 14.7 14.8 7.4 7.2 31,101 323 41,992 4552003. . . . . . . . . . . . . . . . . . . . . . . 13,629 100.0 6.7 10.0 9.5 15.3 13.4 14.7 15.2 7.5 7.7 31,460 410 42,588 4562002. . . . . . . . . . . . . . . . . . . . . . . 13,465 100.0 6.5 10.1 9.0 15.6 13.8 15.5 14.0 7.7 8.0 31,509 424 43,433 502
BLACK19
2001. . . . . . . . . . . . . . . . . . . . . . . 13,315 100.0 6.2 9.9 8.2 15.5 13.5 15.5 15.5 8.1 7.6 32,499 383 43,282 45720002 . . . . . . . . . . . . . . . . . . . . . . 13,174 100.0 5.5 9.4 8.2 15.8 13.3 15.5 16.2 7.8 8.2 33,630 445 44,411 45019993 . . . . . . . . . . . . . . . . . . . . . . 12,838 100.0 5.4 10.3 8.7 15.3 12.8 15.1 15.6 7.5 9.3 32,694 609 45,055 6471998. . . . . . . . . . . . . . . . . . . . . . . 12,579 100.0 6.3 11.8 8.9 16.2 12.7 14.7 14.9 7.1 7.3 30,321 475 40,832 5451997. . . . . . . . . . . . . . . . . . . . . . . 12,474 100.0 5.9 11.8 9.1 16.1 13.3 15.1 15.4 7.2 6.0 30,383 523 39,980 5741996. . . . . . . . . . . . . . . . . . . . . . . 12,109 100.0 6.3 11.6 10.1 17.0 13.0 14.6 15.1 6.4 6.0 29,089 572 40,211 78519954 . . . . . . . . . . . . . . . . . . . . . . 11,577 100.0 6.2 12.3 9.6 16.4 13.5 14.8 14.7 7.0 5.3 28,485 486 38,670 66119945 . . . . . . . . . . . . . . . . . . . . . . 11,655 100.0 6.5 13.6 10.1 16.9 12.9 13.0 14.2 7.0 5.9 27,397 509 38,123 54719936 . . . . . . . . . . . . . . . . . . . . . . 11,281 100.0 7.6 13.8 11.4 16.2 13.6 13.7 12.6 5.9 5.1 25,986 514 36,225 60119927 . . . . . . . . . . . . . . . . . . . . . . 11,269 100.0 7.7 15.1 10.5 16.3 12.9 13.8 13.6 5.5 4.6 25,573 522 34,702 4701991. . . . . . . . . . . . . . . . . . . . . . . 11,083 100.0 7.4 14.7 10.9 15.2 13.0 14.2 14.2 6.0 4.3 26,287 552 35,004 4571990. . . . . . . . . . . . . . . . . . . . . . . 10,671 100.0 6.9 14.4 10.9 15.3 12.9 14.0 14.9 5.6 5.1 27,048 617 35,938 4851989. . . . . . . . . . . . . . . . . . . . . . . 10,486 100.0 6.7 14.2 10.1 16.2 12.9 14.2 14.1 6.7 5.0 27,492 559 36,480 4961988. . . . . . . . . . . . . . . . . . . . . . . 10,561 100.0 6.1 15.8 10.5 16.3 13.1 13.4 13.6 6.5 4.6 26,015 542 35,640 52019878 . . . . . . . . . . . . . . . . . . . . . . 10,192 100.0 6.9 15.5 10.8 16.2 13.3 14.0 13.3 5.5 4.6 25,755 496 34,775 4781986. . . . . . . . . . . . . . . . . . . . . . . 9,922 100.0 7.6 14.6 10.5 16.5 13.1 13.7 14.5 5.3 4.1 25,626 503 34,381 46719859 . . . . . . . . . . . . . . . . . . . . . . 9,797 100.0 6.3 15.0 11.0 17.1 14.3 13.8 13.3 6.0 3.1 25,642 498 33,457 4341984 . . . . . . . . . . . . . . . . . . . . . . 9,480 100.0 6.4 15.2 12.2 18.1 13.7 14.1 11.7 5.4 3.2 24,087 463 32,124 395198310 . . . . . . . . . . . . . . . . . . . . . 9,243 100.0 7.3 15.9 12.0 17.7 13.8 13.6 12.7 4.8 2.4 23,192 433 30,892 3791982. . . . . . . . . . . . . . . . . . . . . . . 8,916 100.0 7.2 15.5 12.0 18.6 12.7 15.1 12.8 4.1 2.0 23,178 372 30,496 3821981. . . . . . . . . . . . . . . . . . . . . . . 8,961 100.0 6.7 15.6 12.7 18.7 12.9 13.8 12.7 4.9 2.0 23,197 390 30,473 3691980. . . . . . . . . . . . . . . . . . . . . . . 8,847 100.0 6.0 15.5 12.1 18.6 13.0 15.3 12.6 4.7 2.3 24,153 456 31,347 386197911 . . . . . . . . . . . . . . . . . . . . . 8,586 100.0 5.5 14.7 11.9 18.1 14.1 14.2 14.0 5.1 2.4 25,248 461 32,397 3991978. . . . . . . . . . . . . . . . . . . . . . . 8,066 100.0 4.6 15.1 12.5 17.3 13.5 15.9 13.0 5.7 2.4 25,652 542 32,783 4281977. . . . . . . . . . . . . . . . . . . . . . . 7,977 100.0 4.7 15.6 12.3 19.5 15.1 14.1 12.7 4.3 1.8 23,944 321 30,679 273197612 . . . . . . . . . . . . . . . . . . . . . 7,776 100.0 4.9 15.1 12.7 19.8 13.4 15.6 13.0 4.0 1.6 23,899 296 30,535 272197513 . . . . . . . . . . . . . . . . . . . . . 7,489 100.0 5.5 15.4 13.4 18.0 14.7 15.6 12.4 3.5 1.4 23,691 349 29,572 262197413 14 . . . . . . . . . . . . . . . . . . . 7,263 100.0 5.3 14.6 12.5 19.7 15.2 15.5 12.2 3.7 1.4 24,115 291 29,992 2671973. . . . . . . . . . . . . . . . . . . . . . . 7,040 100.0 6.1 12.8 12.3 19.1 15.1 16.0 12.8 3.8 2.0 24,681 384 30,649 304197215 . . . . . . . . . . . . . . . . . . . . . 6,809 100.0 6.9 13.3 12.7 19.3 14.4 15.3 12.8 3.5 1.7 24,014 360 30,335 324197116 . . . . . . . . . . . . . . . . . . . . . 6,578 100.0 7.0 14.3 12.3 19.5 15.8 15.2 11.3 3.4 1.1 23,253 346 28,814 2961970. . . . . . . . . . . . . . . . . . . . . . . 6,180 100.0 7.8 13.6 11.7 18.9 16.0 15.5 11.9 3.4 1.3 24,107 331 29,436 3181969. . . . . . . . . . . . . . . . . . . . . . . 6,053 100.0 7.8 13.6 11.3 20.3 16.6 15.0 11.4 3.1 0.9 24,150 356 28,749 3061968. . . . . . . . . . . . . . . . . . . . . . . 5,870 100.0 7.9 13.8 12.1 21.7 15.2 15.2 10.5 2.7 0.9 22,639 329 27,573 290196717 . . . . . . . . . . . . . . . . . . . . . 5,728 100.0 9.4 14.3 13.5 20.6 16.3 13.7 8.7 2.0 1.4 21,422 357 25,741 287
See footnotes at end of table.

U.S. C
ensu
s Bureau
Inco
me, Po
verty, an
d H
ealth In
suran
ce Coverag
e in th
e Un
ited States: 2
00
5 3
5
Table A-1.Households by Total Money Income, Race, and Hispanic Origin of Householder: 1967 to 2005—Con.(Income in 2005 CPI-U-RS adjusted dollars. Households as of March of the following year)
Race and Hispanic originof householder and year
Number(thousands)
Percent distribution Median income(dollars)
Mean income(dollars)
TotalUnder
$5,000
$5,000to
$9,999
$10,000to
$14,999
$15,000to
$24,999
$25,000to
$34,999
$35,000to
$49,999
$50,000to
$74,999
$75,000to
$99,999$100,000and over Value
Standarderror Value
Standarderror
ASIAN ALONE OR INCOMBINATION
2005. . . . . . . . . . . . . . . . . . . . . . . 4,500 100.0 4.3 3.5 4.5 8.5 7.2 12.5 19.0 13.3 27.3 61,048 729 79,997 1,39620041 . . . . . . . . . . . . . . . . . . . . . . 4,346 100.0 3.7 3.7 3.9 8.9 8.5 12.9 19.6 12.6 26.0 59,370 1,197 78,677 1,4852003. . . . . . . . . . . . . . . . . . . . . . . 4,235 100.0 4.8 4.9 4.7 9.3 6.9 12.9 17.9 13.1 25.3 58,645 1,307 73,661 1,2672002. . . . . . . . . . . . . . . . . . . . . . .
ASIAN ALONE21
4,079 100.0 4.1 3.5 3.5 10.1 9.8 13.3 17.7 13.4 24.6 56,757 859 75,418 1,434
2005. . . . . . . . . . . . . . . . . . . . . . . 4,273 100.0 4.3 3.5 4.6 8.5 7.1 12.2 19.2 13.1 27.5 61,094 712 80,096 1,41320041 . . . . . . . . . . . . . . . . . . . . . . 4,123 100.0 3.7 3.7 4.0 8.9 8.5 12.7 19.5 12.6 26.4 59,427 1,263 79,076 1,5292003. . . . . . . . . . . . . . . . . . . . . . . 4,040 100.0 4.9 5.0 4.7 9.3 6.7 12.9 17.9 13.1 25.6 59,109 1,161 74,257 1,3152002. . . . . . . . . . . . . . . . . . . . . . .
ASIAN AND PACIFICISLANDER19
3,917 100.0 4.1 3.4 3.5 10.1 9.8 13.1 17.6 13.5 24.9 57,127 1,000 76,038 1,483
2001. . . . . . . . . . . . . . . . . . . . . . . 4,071 100.0 4.1 3.5 3.6 9.3 9.4 13.3 18.1 12.9 25.8 59,148 1,412 80,679 1,90520002 . . . . . . . . . . . . . . . . . . . . . . 3,963 100.0 3.5 2.9 4.1 8.0 9.1 13.2 18.0 14.6 26.6 63,205 1,078 82,521 1,71319993 . . . . . . . . . . . . . . . . . . . . . . 3,742 100.0 3.9 3.6 4.2 8.6 8.2 15.1 16.9 13.5 26.0 59,695 2,104 78,937 2,0011998. . . . . . . . . . . . . . . . . . . . . . . 3,308 100.0 4.2 3.7 4.3 9.5 9.0 14.4 18.0 14.2 22.9 55,780 1,552 72,012 2,0801997. . . . . . . . . . . . . . . . . . . . . . . 3,125 100.0 4.1 3.8 5.6 9.1 8.4 14.8 19.5 12.6 22.0 54,882 1,526 71,427 2,2141996. . . . . . . . . . . . . . . . . . . . . . . 2,998 100.0 3.7 4.9 4.6 9.8 9.2 15.2 17.4 14.2 20.9 53,609 1,921 70,049 2,51219954 . . . . . . . . . . . . . . . . . . . . . . 2,777 100.0 4.5 3.7 6.6 10.0 8.7 14.8 19.7 13.5 18.5 51,662 1,296 70,252 2,83419945 . . . . . . . . . . . . . . . . . . . . . . 2,040 100.0 4.3 4.1 5.4 10.2 9.0 14.7 18.8 14.6 19.0 52,745 1,999 68,485 2,44019936 . . . . . . . . . . . . . . . . . . . . . . 2,233 100.0 4.5 5.4 6.1 10.4 10.1 12.7 17.8 13.6 19.4 51,016 2,509 66,843 2,69119927 . . . . . . . . . . . . . . . . . . . . . . 2,262 100.0 4.1 3.9 5.5 12.0 8.7 13.9 20.7 13.0 18.2 51,544 1,488 63,882 1,7561991. . . . . . . . . . . . . . . . . . . . . . . 2,094 100.0 3.4 4.9 4.5 10.0 11.8 14.6 18.7 13.3 18.8 50,946 1,644 64,685 1,9071990. . . . . . . . . . . . . . . . . . . . . . . 1,958 100.0 3.8 3.2 5.0 9.8 8.3 13.6 23.1 13.1 20.0 55,687 1,650 67,218 1,9031989. . . . . . . . . . . . . . . . . . . . . . . 1,988 100.0 2.9 2.9 5.7 9.8 9.4 14.8 20.7 14.4 19.5 54,887 1,484 68,232 1,9861988. . . . . . . . . . . . . . . . . . . . . . . 1,913 100.0 3.0 4.2 4.6 12.3 9.3 15.6 19.8 12.2 19.0 51,163 2,103 63,965 1,91119878 . . . . . . . . . . . . . . . . . . . . . .
See footnotes at end of table.
(NA) 100.0 4.3 4.1 5.4 12.9 9.0 11.9 20.2 12.6 19.5 52,959 1,969 (NA) (NA)
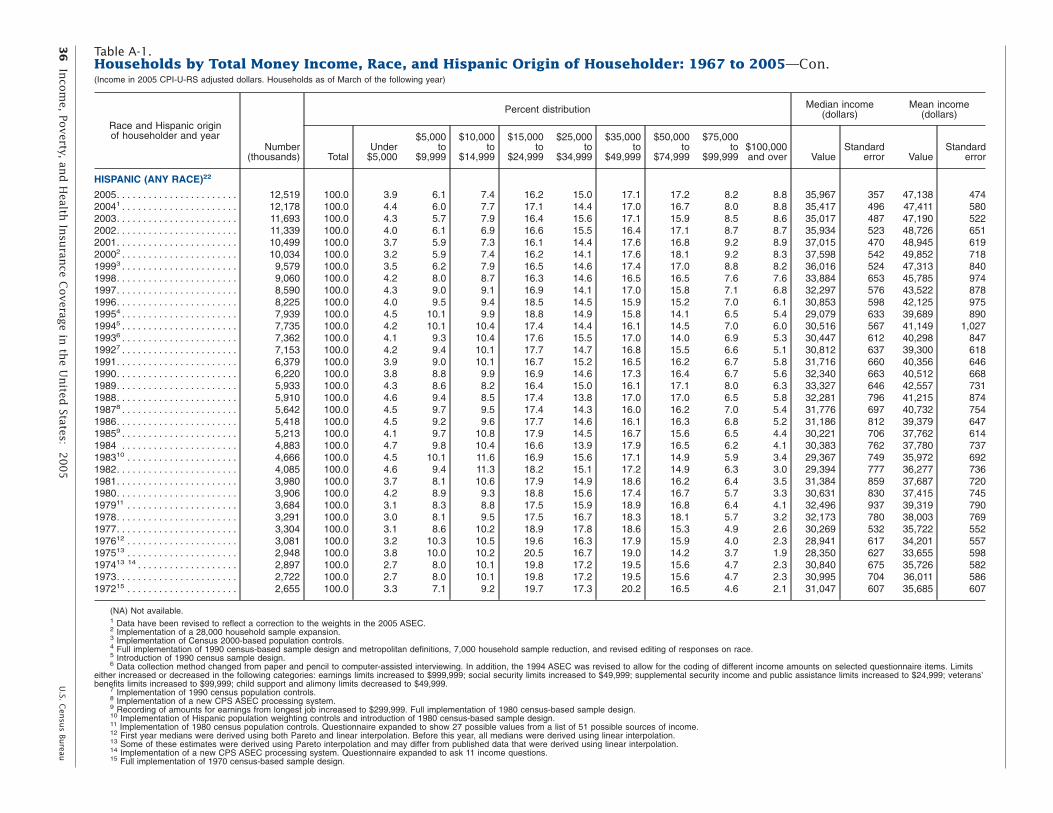
36
Inco
me, Po
verty, an
d H
ealth In
suran
ce Coverag
e in th
e Un
ited States: 2
00
5U
.S. Cen
sus Bu
reau
Table A-1.Households by Total Money Income, Race, and Hispanic Origin of Householder: 1967 to 2005—Con.(Income in 2005 CPI-U-RS adjusted dollars. Households as of March of the following year)
Median incomePercent distribution (dollars)Race and Hispanic originof householder and year $5,000 $10,000 $15,000 $25,000 $35,000 $50,000 $75,000
Number Under to to to to to to to $100,000 Standard(thousands) Total $5,000 $9,999 $14,999 $24,999 $34,999 $49,999 $74,999 $99,999 and over Value error
HISPANIC (ANY RACE)22
Mean income(dollars)
StandardValue error
2005. . . . . . . . . . . . . . . . . . . . . . . 12,519 100.0 3.9 6.1 7.4 16.2 15.0 17.1 17.2 8.2 8.8 35,967 357 47,138 47420041 . . . . . . . . . . . . . . . . . . . . . . 12,178 100.0 4.4 6.0 7.7 17.1 14.4 17.0 16.7 8.0 8.8 35,417 496 47,411 5802003. . . . . . . . . . . . . . . . . . . . . . . 11,693 100.0 4.3 5.7 7.9 16.4 15.6 17.1 15.9 8.5 8.6 35,017 487 47,190 5222002. . . . . . . . . . . . . . . . . . . . . . . 11,339 100.0 4.0 6.1 6.9 16.6 15.5 16.4 17.1 8.7 8.7 35,934 523 48,726 6512001. . . . . . . . . . . . . . . . . . . . . . . 10,499 100.0 3.7 5.9 7.3 16.1 14.4 17.6 16.8 9.2 8.9 37,015 470 48,945 61920002 . . . . . . . . . . . . . . . . . . . . . . 10,034 100.0 3.2 5.9 7.4 16.2 14.1 17.6 18.1 9.2 8.3 37,598 542 49,852 71819993 . . . . . . . . . . . . . . . . . . . . . . 9,579 100.0 3.5 6.2 7.9 16.5 14.6 17.4 17.0 8.8 8.2 36,016 524 47,313 8401998. . . . . . . . . . . . . . . . . . . . . . . 9,060 100.0 4.2 8.0 8.7 16.3 14.6 16.5 16.5 7.6 7.6 33,884 653 45,785 9741997. . . . . . . . . . . . . . . . . . . . . . . 8,590 100.0 4.3 9.0 9.1 16.9 14.1 17.0 15.8 7.1 6.8 32,297 576 43,522 8781996. . . . . . . . . . . . . . . . . . . . . . . 8,225 100.0 4.0 9.5 9.4 18.5 14.5 15.9 15.2 7.0 6.1 30,853 598 42,125 97519954 . . . . . . . . . . . . . . . . . . . . . . 7,939 100.0 4.5 10.1 9.9 18.8 14.9 15.8 14.1 6.5 5.4 29,079 633 39,689 89019945 . . . . . . . . . . . . . . . . . . . . . . 7,735 100.0 4.2 10.1 10.4 17.4 14.4 16.1 14.5 7.0 6.0 30,516 567 41,149 1,02719936 . . . . . . . . . . . . . . . . . . . . . . 7,362 100.0 4.1 9.3 10.4 17.6 15.5 17.0 14.0 6.9 5.3 30,447 612 40,298 84719927 . . . . . . . . . . . . . . . . . . . . . . 7,153 100.0 4.2 9.4 10.1 17.7 14.7 16.8 15.5 6.6 5.1 30,812 637 39,300 6181991. . . . . . . . . . . . . . . . . . . . . . . 6,379 100.0 3.9 9.0 10.1 16.7 15.2 16.5 16.2 6.7 5.8 31,716 660 40,356 6461990. . . . . . . . . . . . . . . . . . . . . . . 6,220 100.0 3.8 8.8 9.9 16.9 14.6 17.3 16.4 6.7 5.6 32,340 663 40,512 6681989. . . . . . . . . . . . . . . . . . . . . . . 5,933 100.0 4.3 8.6 8.2 16.4 15.0 16.1 17.1 8.0 6.3 33,327 646 42,557 7311988. . . . . . . . . . . . . . . . . . . . . . . 5,910 100.0 4.6 9.4 8.5 17.4 13.8 17.0 17.0 6.5 5.8 32,281 796 41,215 87419878 . . . . . . . . . . . . . . . . . . . . . . 5,642 100.0 4.5 9.7 9.5 17.4 14.3 16.0 16.2 7.0 5.4 31,776 697 40,732 7541986. . . . . . . . . . . . . . . . . . . . . . . 5,418 100.0 4.5 9.2 9.6 17.7 14.6 16.1 16.3 6.8 5.2 31,186 812 39,379 64719859 . . . . . . . . . . . . . . . . . . . . . . 5,213 100.0 4.1 9.7 10.8 17.9 14.5 16.7 15.6 6.5 4.4 30,221 706 37,762 6141984 . . . . . . . . . . . . . . . . . . . . . . 4,883 100.0 4.7 9.8 10.4 16.6 13.9 17.9 16.5 6.2 4.1 30,383 762 37,780 737198310 . . . . . . . . . . . . . . . . . . . . . 4,666 100.0 4.5 10.1 11.6 16.9 15.6 17.1 14.9 5.9 3.4 29,367 749 35,972 6921982. . . . . . . . . . . . . . . . . . . . . . . 4,085 100.0 4.6 9.4 11.3 18.2 15.1 17.2 14.9 6.3 3.0 29,394 777 36,277 7361981. . . . . . . . . . . . . . . . . . . . . . . 3,980 100.0 3.7 8.1 10.6 17.9 14.9 18.6 16.2 6.4 3.5 31,384 859 37,687 7201980. . . . . . . . . . . . . . . . . . . . . . . 3,906 100.0 4.2 8.9 9.3 18.8 15.6 17.4 16.7 5.7 3.3 30,631 830 37,415 745197911 . . . . . . . . . . . . . . . . . . . . . 3,684 100.0 3.1 8.3 8.8 17.5 15.9 18.9 16.8 6.4 4.1 32,496 937 39,319 7901978. . . . . . . . . . . . . . . . . . . . . . . 3,291 100.0 3.0 8.1 9.5 17.5 16.7 18.3 18.1 5.7 3.2 32,173 780 38,003 7691977. . . . . . . . . . . . . . . . . . . . . . . 3,304 100.0 3.1 8.6 10.2 18.9 17.8 18.6 15.3 4.9 2.6 30,269 532 35,722 552197612 . . . . . . . . . . . . . . . . . . . . . 3,081 100.0 3.2 10.3 10.5 19.6 16.3 17.9 15.9 4.0 2.3 28,941 617 34,201 557197513 . . . . . . . . . . . . . . . . . . . . . 2,948 100.0 3.8 10.0 10.2 20.5 16.7 19.0 14.2 3.7 1.9 28,350 627 33,655 598197413 14 . . . . . . . . . . . . . . . . . . . 2,897 100.0 2.7 8.0 10.1 19.8 17.2 19.5 15.6 4.7 2.3 30,840 675 35,726 5821973. . . . . . . . . . . . . . . . . . . . . . . 2,722 100.0 2.7 8.0 10.1 19.8 17.2 19.5 15.6 4.7 2.3 30,995 704 36,011 586197215 . . . . . . . . . . . . . . . . . . . . . 2,655 100.0 3.3 7.1 9.2 19.7 17.3 20.2 16.5 4.6 2.1 31,047 607
(NA) Not available.1 Data have been revised to reflect a correction to the weights in the 2005 ASEC.2 Implementation of a 28,000 household sample expansion.3 Implementation of Census 2000-based population controls.4 Full implementation of 1990 census-based sample design and metropolitan definitions, 7,000 household sample reduction, and revised editing of responses on race.5 Introduction of 1990 census sample design.6 Data collection method changed from paper and pencil to computer-assisted interviewing. In addition, the 1994 ASEC was revised to allow for the coding of different income amounts on selected questi
either increased or decreased in the following categories: earnings limits increased to $999,999; social security limits increased to $49,999; supplemental security income and public assistance limits increasebenefits limits increased to $99,999; child support and alimony limits decreased to $49,999.
7 Implementation of 1990 census population controls.8 Implementation of a new CPS ASEC processing system.9 Recording of amounts for earnings from longest job increased to $299,999. Full implementation of 1980 census-based sample design.10 Implementation of Hispanic population weighting controls and introduction of 1980 census-based sample design.11 Implementation of 1980 census population controls. Questionnaire expanded to show 27 possible values from a list of 51 possible sources of income.12 First year medians were derived using both Pareto and linear interpolation. Before this year, all medians were derived using linear interpolation.13 Some of these estimates were derived using Pareto interpolation and may differ from published data that were derived using linear interpolation.14 Implementation of a new CPS ASEC processing system. Questionnaire expanded to ask 11 income questions.15 Full implementation of 1970 census-based sample design.
35,685 607
onnaire items. Limitsd to $24,999; veterans’

U.S. C
ensu
s Bureau
Inco
me, Po
verty, an
d H
ealth In
suran
ce Coverag
e in th
e Un
ited States: 2
00
5 3
7
16 Introduction of 1970 census sample design and population controls.17 Implementation of a new CPS ASEC processing system.18 Beginning with the 2003 CPS, respondents were allowed to choose one or more races. White alone refers to people who reported White and did not report any other race category. The use of this single-race population
does not imply that it is the preferred method of presenting or analyzing the data. The Census Bureau uses a variety of approaches. Information on people who reported more than one race, such as White and American Indianand Alaska Native or Asian and Black or African American, is available from Census 2000 through American FactFinder. About 2.6 percent of people reported more than one race in Census 2000.
19 For the year 2001 and earlier, the CPS allowed respondents to report only one race group.20 Black alone refers to people who reported Black and did not report any other race category.21 Asian alone refers to people who reported Asian and did not report any other race category.22 Because Hispanics may be any race, data in this report for Hispanics overlap with data for racial groups. Being Hispanic was reported by 12.1 percent of White householders who reported only one race, 2.9 percent of Black
householders who reported only one race; 27.7 percent of Amerian Indian and Alaska Native householders who reported only one race; and 9.5 percent of Native Hawaiian and Other Pacific Islander householders who reportedonly one race. Data users should exercise caution when interpreting aggregate results for the Hispanic population and for race groups because these populations consist of many distinct groups that differ in socioeconomiccharacteristics, culture, and recency of immigration. Data were first collected for Hispanics in 1972.
Source: U.S. Census Bureau, Current Population Survey, 1968 through 2006 Annual Social and Economic Supplements.

38 Income, Poverty, and Health Insurance Coverage in the United States: 2005 U.S. Census Bureau
Table A-2.Real Median Earnings of Full-Time, Year-Round Workers by Sex and Female-to-Male EarningsRatio: 1960 to 2005(People 15 years and older beginning in March 1980, and people 14 years and older as of March of the following year for previous years. Before 1989 earnings are forcivilian workers only. Earnings in 2005 CPI-U-RS adjusted dollars)
Males Females
Median earnings Median earningsYear (dollars) (dollars) Female-
Number with Number with to-male-earnings Standard earnings Standard earnings
(thousands) Value error (thousands) Value error ratio
2005 . . . . . . . . . . . . . . . . . . . . . . . . . . . . . . . . . . . 61,500 41,386 90 43,351 31,858 81 0.77020041 . . . . . . . . . . . . . . . . . . . . . . . . . . . . . . . . . . 60,088 42,160 93 42,380 32,285 82 0.7662003 . . . . . . . . . . . . . . . . . . . . . . . . . . . . . . . . . . . 58,772 43,158 96 41,908 32,605 88 0.7552002 . . . . . . . . . . . . . . . . . . . . . . . . . . . . . . . . . . . 58,761 42,801 265 41,876 32,786 87 0.7662001 . . . . . . . . . . . . . . . . . . . . . . . . . . . . . . . . . . . 58,712 42,209 285 41,639 32,218 182 0.76320002 . . . . . . . . . . . . . . . . . . . . . . . . . . . . . . . . . . 59,602 42,228 114 41,719 31,130 116 0.737
19993 . . . . . . . . . . . . . . . . . . . . . . . . . . . . . . . . . . 58,299 42,629 159 40,871 30,827 132 0.7231998 . . . . . . . . . . . . . . . . . . . . . . . . . . . . . . . . . . . 56,951 42,274 159 38,785 30,932 141 0.7321997 . . . . . . . . . . . . . . . . . . . . . . . . . . . . . . . . . . . 54,909 40,843 389 37,683 30,289 188 0.7421996 . . . . . . . . . . . . . . . . . . . . . . . . . . . . . . . . . . . 53,787 39,819 142 36,430 29,371 206 0.73819954 . . . . . . . . . . . . . . . . . . . . . . . . . . . . . . . . . . 52,667 40,064 146 35,482 28,617 174 0.71419945 . . . . . . . . . . . . . . . . . . . . . . . . . . . . . . . . . . 51,580 40,201 162 34,155 28,932 143 0.72019936 . . . . . . . . . . . . . . . . . . . . . . . . . . . . . . . . . . 49,818 40,453 156 33,524 28,932 128 0.71519927 . . . . . . . . . . . . . . . . . . . . . . . . . . . . . . . . . . 48,551 41,175 155 33,241 29,146 139 0.7081991 . . . . . . . . . . . . . . . . . . . . . . . . . . . . . . . . . . . 47,888 41,123 309 32,436 28,728 137 0.6991990 . . . . . . . . . . . . . . . . . . . . . . . . . . . . . . . . . . . 49,171 40,086 300 31,682 28,708 184 0.716
1989 . . . . . . . . . . . . . . . . . . . . . . . . . . . . . . . . . . . 49,678 41,552 170 31,340 28,535 192 0.6871988 . . . . . . . . . . . . . . . . . . . . . . . . . . . . . . . . . . . 48,285 42,266 186 31,237 27,916 200 0.66019878 . . . . . . . . . . . . . . . . . . . . . . . . . . . . . . . . . . 47,013 42,638 177 29,912 27,791 130 0.6521986 . . . . . . . . . . . . . . . . . . . . . . . . . . . . . . . . . . . 45,912 42,919 184 28,420 27,584 144 0.64319859 . . . . . . . . . . . . . . . . . . . . . . . . . . . . . . . . . . 44,943 41,866 244 27,383 27,035 142 0.646198410. . . . . . . . . . . . . . . . . . . . . . . . . . . . . . . . . . 43,808 41,515 213 26,466 26,427 156 0.6371983 . . . . . . . . . . . . . . . . . . . . . . . . . . . . . . . . . . . 41,528 40,685 186 25,166 25,873 158 0.6361982 . . . . . . . . . . . . . . . . . . . . . . . . . . . . . . . . . . . 40,105 40,819 172 23,702 25,204 170 0.6171981 . . . . . . . . . . . . . . . . . . . . . . . . . . . . . . . . . . . 41,773 41,558 146 23,329 24,617 103 0.5921980 . . . . . . . . . . . . . . . . . . . . . . . . . . . . . . . . . . . 41,881 41,763 211 22,859 25,125 110 0.602
197911. . . . . . . . . . . . . . . . . . . . . . . . . . . . . . . . . . 42,437 42,393 167 22,082 25,293 130 0.5971978 . . . . . . . . . . . . . . . . . . . . . . . . . . . . . . . . . . . 41,036 42,877 147 20,914 25,486 142 0.5941977 . . . . . . . . . . . . . . . . . . . . . . . . . . . . . . . . . . . 39,263 41,582 196 19,238 24,501 111 0.589197612. . . . . . . . . . . . . . . . . . . . . . . . . . . . . . . . . . 38,184 40,694 160 18,073 24,495 121 0.602197513. . . . . . . . . . . . . . . . . . . . . . . . . . . . . . . . . . 37,267 40,800 160 17,452 23,998 122 0.588197413 14 . . . . . . . . . . . . . . . . . . . . . . . . . . . . . . . 37,916 41,080 177 16,945 24,136 118 0.5881973 . . . . . . . . . . . . . . . . . . . . . . . . . . . . . . . . . . . 39,581 42,573 (NA) 17,195 24,110 (NA) 0.566197215. . . . . . . . . . . . . . . . . . . . . . . . . . . . . . . . . . 38,184 41,258 (NA) 16,675 23,872 (NA) 0.579197116. . . . . . . . . . . . . . . . . . . . . . . . . . . . . . . . . . 36,819 39,181 (NA) 16,002 23,315 (NA) 0.5951970 . . . . . . . . . . . . . . . . . . . . . . . . . . . . . . . . . . . 36,132 39,036 (NA) 15,476 23,175 (NA) 0.594
1969 . . . . . . . . . . . . . . . . . . . . . . . . . . . . . . . . . . . 37,008 38,584 (NA) 15,374 22,712 (NA) 0.5891968 . . . . . . . . . . . . . . . . . . . . . . . . . . . . . . . . . . . 37,068 36,497 (NA) 15,013 21,225 (NA) 0.582196717. . . . . . . . . . . . . . . . . . . . . . . . . . . . . . . . . . 36,645 35,572 (NA) 14,846 20,555 (NA) 0.578196618. . . . . . . . . . . . . . . . . . . . . . . . . . . . . . . . . . (NA) 34,994 (NA) (NA) 20,141 (NA) 0.576196519. . . . . . . . . . . . . . . . . . . . . . . . . . . . . . . . . . (NA) 33,508 (NA) (NA) 20,079 (NA) 0.5991964 . . . . . . . . . . . . . . . . . . . . . . . . . . . . . . . . . . . (NA) 33,087 (NA) (NA) 19,570 (NA) 0.5911963 . . . . . . . . . . . . . . . . . . . . . . . . . . . . . . . . . . . (NA) 32,322 (NA) (NA) 19,052 (NA) 0.589196220. . . . . . . . . . . . . . . . . . . . . . . . . . . . . . . . . . (NA) 31,520 (NA) (NA) 18,690 (NA) 0.593196121. . . . . . . . . . . . . . . . . . . . . . . . . . . . . . . . . . (NA) 30,947 (NA) (NA) 18,336 (NA) 0.5921960 . . . . . . . . . . . . . . . . . . . . . . . . . . . . . . . . . . . (NA) 29,983 (NA) (NA) 18,192 (NA) 0.607
(NA) Not available.1 The 2004 data have been revised to reflect a correction to the weights in the 2005 ASEC.2 Implementation of a 28,000 household sample expansion.3 Implementation of Census 2000-based population controls.4 Full implementation of 1990 census-based sample design and metropolitan definitions, 7,000 household sample reduction, and revised editing of responses on race.5 Introduction of 1990 census sample design.6 Data collection method changed from paper and pencil to computer-assisted interviewing. In addition, the 1994 ASEC was revised to allow for the coding of different
income amounts on selected questionnaire items. Limits either increased or decreased in the following categories: earnings limits increased to $999,999; social securitylimits increased to $49,999; supplemental security income and public assistance limits increased to $24,999; veterans’ benefits limits increased to $99,999; child supportand alimony limits decreased to $49,999.
7 Implementation of 1990 census population controls.

U.S. Census Bureau Income, Poverty, and Health Insurance Coverage in the United States: 2005 39
8 Implementation of a new CPS ASEC processing system.9 Recording of amounts for earnings from longest job increased to $299,999. Full implementation of 1980 census-based sample design.10 Implementation of Hispanic population weighting controls and introduction of 1980 census-based sample design.11 Implementation of 1980 census population controls. Questionnaire expanded to allow the recording of up to 27 possible values from a list of 51 possible sources of
income.12 First year medians were derived using both Pareto and linear interpolation. Before this year, all medians were derived using linear interpolation.13 Some of these estimates were derived using Pareto interpolation and may differ from published data that were derived using linear interpolation.14 Implementation of a new CPS ASEC processing system. Questionnaire expanded to ask 11 income questions.15 Full implementation of 1970 census-based sample design.16 Introduction of 1970 census sample design and population controls.17 Implementation of a new CPS ASEC processing system.18 Questionnaire expanded to ask eight income questions.19 Implementation of new procedures to impute missing data only.20 Full implementation of 1960 census-based sample design and population controls.21 Introduction of 1960 census-based sample design. Implementation of first hotdeck procedure to impute missing income entries.Source: U.S. Census Bureau, Current Population Survey, 1961 through 2006 Annual Social and Economic Supplements.

40
Inco
me, Po
verty, an
d H
ealth In
suran
ce Coverag
e in th
e Un
ited States: 2
00
5U
.S. Cen
sus Bu
reau
Table A-3.Selected Measures of Household Income Dispersion: 1967 to 2005(Income in 2005 CPI-U-RS adjusted dollars. For further explanation of income inequality measures, see Current Population Reports, Series P60-204, ‘‘The Changing Shape of the Nation’s Income Distribution: 1947–1998’’)
Measures of incomedispersion 2005 20041 2003 2002 2001 20002 19993 1998 1997 1996 19954 19945 19936 19927 1991 1990 1989 1988 19878 1986
Household Income atSelected Percentiles
10th percentile upper limit . . 11,288 11,271 11,181 11,528 11,784 11,995 12,119 11,602 11,177 11,038 11,036 10,460 10,225 10,227 10,374 10,602 10,946 10,408 10,250 10,16520th percentile upper limit . . 19,178 19,104 19,085 19,448 19,817 20,314 20,073 19,275 18,678 18,294 18,317 17,493 17,251 17,181 17,599 18,104 18,390 18,047 17,748 17,41350th (median) . . . . . . . . . . . 46,326 45,817 45,970 46,036 46,569 47,599 47,671 46,508 44,883 43,967 43,346 42,038 41,562 41,774 42,108 43,366 43,946 43,168 42,827 42,30980th percentile upper limit . . 91,705 90,945 92,185 91,202 92,083 92,688 92,813 89,703 86,721 84,256 82,840 81,878 80,221 79,095 79,334 79,953 81,656 80,221 79,477 78,13990th percentile lower limit . . 126,090 124,908 125,436 123,872 125,308 126,960 126,252 121,159 118,453 114,030 111,556 110,597 108,746 105,743 106,065 107,319 109,393 106,236 104,852 102,55595th percentile lower limit . .
Household Income Ratiosof Selected Percentiles
166,000 162,408 163,555 162,831 165,969 164,617 166,340 158,116 153,490 148,084 143,740 143,089 139,209 135,019 134,742 137,223 139,489 135,792 132,993 131,030
90th/10th . . . . . . . . . . . . . . . 11.17 11.08 11.22 10.75 10.63 10.58 10.42 10.44 10.60 10.33 10.11 10.57 10.64 10.34 10.22 10.12 9.99 10.21 10.23 10.0995th/20th . . . . . . . . . . . . . . . 8.66 8.50 8.57 8.37 8.38 8.10 8.29 8.20 8.22 8.09 7.85 8.18 8.07 7.86 7.66 7.58 7.59 7.52 7.49 7.5295th/50th . . . . . . . . . . . . . . . 3.61 3.57 3.57 3.54 3.57 3.46 3.52 3.41 3.43 3.40 3.32 3.41 3.37 3.27 3.21 3.17 3.17 3.16 3.11 3.1080th/50th . . . . . . . . . . . . . . . 1.99 2.00 2.01 1.99 1.98 1.95 1.96 1.93 1.94 1.93 1.92 1.95 1.94 1.91 1.89 1.85 1.86 1.86 1.86 1.8580th/20th . . . . . . . . . . . . . . . 4.78 4.76 4.83 4.69 4.65 4.56 4.62 4.65 4.64 4.61 4.52 4.68 4.65 4.60 4.51 4.42 4.44 4.45 4.48 4.4920th/50th . . . . . . . . . . . . . . .
Mean Household Incomeof Quintiles
0.42 0.42 0.42 0.42 0.43 0.43 0.42 0.42 0.42 0.42 0.42 0.42 0.42 0.42 0.42 0.42 0.42 0.42 0.42 0.41
Lowest quintile. . . . . . . . . . . 10,655 10,587 10,608 10,845 11,178 11,514 11,614 11,031 10,721 10,648 10,616 10,050 9,790 9,894 10,101 10,378 10,633 10,250 10,077 9,813Second quintile . . . . . . . . . . 27,357 27,089 27,250 27,572 28,086 28,748 28,518 27,854 26,802 26,135 25,946 25,047 24,819 24,791 25,369 26,112 26,455 25,873 25,611 25,240Third quintile . . . . . . . . . . . . 46,301 45,896 46,256 46,462 47,011 47,874 47,735 46,607 45,091 43,959 43,384 42,196 41,603 41,766 42,139 43,131 43,976 43,273 42,818 42,236Fourth quintile . . . . . . . . . . . 72,825 72,368 73,218 73,085 73,709 74,423 74,293 72,081 69,840 68,036 66,691 65,661 64,654 64,115 64,236 65,030 66,518 65,413 64,721 63,629Highest quintile . . . . . . . . . .
Shares of HouseholdIncome of Quintiles
159,583 156,502 156,082 156,038 160,975 161,272 158,432 152,531 148,898 143,096 139,175 138,039 134,704 124,233 123,179 126,199 130,031 124,881 123,082 120,434
Lowest quintile. . . . . . . . . . . 3.4 3.4 3.4 3.5 3.5 3.6 3.6 3.6 3.6 3.6 3.7 3.6 3.6 3.8 3.8 3.8 3.8 3.8 3.8 3.8Second quintile . . . . . . . . . . 8.6 8.7 8.7 8.8 8.7 8.9 8.9 9.0 8.9 9.0 9.1 8.9 9.0 9.4 9.6 9.6 9.5 9.6 9.6 9.7Third quintile . . . . . . . . . . . . 14.6 14.7 14.8 14.8 14.6 14.8 14.9 15.0 15.0 15.1 15.2 15.0 15.1 15.8 15.9 15.9 15.8 16.0 16.1 16.2Fourth quintile . . . . . . . . . . . 23.0 23.2 23.4 23.3 23.0 23.0 23.2 23.2 23.2 23.3 23.3 23.4 23.5 24.2 24.2 24.0 24.0 24.2 24.3 24.3Highest quintile . . . . . . . . . .
Summary Measures
Gini index of income
50.4 50.1 49.8 49.7 50.1 49.8 49.4 49.2 49.4 49.0 48.7 49.1 48.9 46.9 46.5 46.6 46.8 46.3 46.2 46.1
inequality . . . . . . . . . . . . . .Mean logarithmic deviation
0.469 0.466 0.464 0.462 0.466 0.462 0.458 0.456 0.459 0.455 0.450 0.456 0.454 0.433 0.428 0.428 0.431 0.426 0.426 0.425
of income. . . . . . . . . . . . . . 0.545 0.543 0.530 0.514 0.515 0.490 0.476 0.488 0.484 0.464 0.452 0.471 0.467 0.416 0.411 0.402 0.406 0.401 0.414 0.416Theil . . . . . . . . . . . . . . . . . .Atkinson:
0.411 0.406 0.397 0.398 0.413 0.404 0.386 0.389 0.396 0.389 0.378 0.387 0.385 0.323 0.313 0.317 0.324 0.314 0.311 0.310
e=0.25 . . . . . . . . . . . . . . . 0.098 0.097 0.095 0.095 0.098 0.096 0.092 0.093 0.094 0.093 0.090 0.092 0.092 0.080 0.078 0.078 0.080 0.078 0.077 0.077e=0.50 . . . . . . . . . . . . . . . 0.192 0.190 0.187 0.186 0.189 0.185 0.180 0.181 0.183 0.179 0.175 0.180 0.178 0.160 0.156 0.156 0.158 0.155 0.155 0.155e=0.75 . . . . . . . . . . . . . . .
See footnotes at end of tab
0.289
le.
0.286 0.283 0.279 0.282 0.275 0.268 0.271 0.272 0.266 0.261 0.268 0.266 0.242 0.237 0.236 0.239 0.236 0.238 0.237
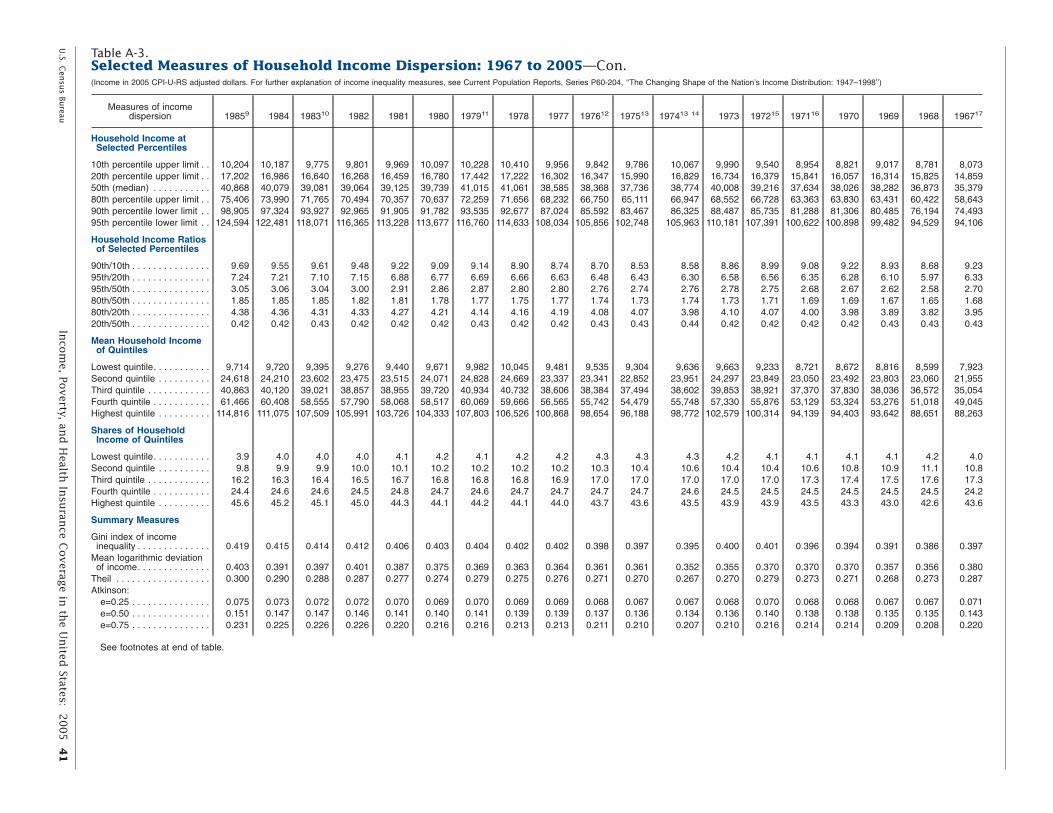
U.S. C
ensu
s Bureau
Inco
me, Po
verty, an
d H
ealth In
suran
ce Coverag
e in th
e Un
ited States: 2
00
5 4
1
Table A-3.Selected Measures of Household Income Dispersion: 1967 to 2005—Con.(Income in 2005 CPI-U-RS adjusted dollars. For further explanation of income inequality measures, see Current Population Reports, Series P60-204, ‘‘The Changing Shape of the Nation’s Income Distribution: 1947–1998’’)
Measures of incomedispersion 19859 1984 198310 1982 1981 1980 197911 1978 1977 197612 197513 197413 14 1973 197215 197116 1970 1969 1968 196717
Household Income atSelected Percentiles
10th percentile upper limit . . 10,204 10,187 9,775 9,801 9,969 10,097 10,228 10,410 9,956 9,842 9,786 10,067 9,990 9,540 8,954 8,821 9,017 8,781 8,07320th percentile upper limit . . 17,202 16,986 16,640 16,268 16,459 16,780 17,442 17,222 16,302 16,347 15,990 16,829 16,734 16,379 15,841 16,057 16,314 15,825 14,85950th (median) . . . . . . . . . . . 40,868 40,079 39,081 39,064 39,125 39,739 41,015 41,061 38,585 38,368 37,736 38,774 40,008 39,216 37,634 38,026 38,282 36,873 35,37980th percentile upper limit . . 75,406 73,990 71,765 70,494 70,357 70,637 72,259 71,656 68,232 66,750 65,111 66,947 68,552 66,728 63,363 63,830 63,431 60,422 58,64390th percentile lower limit . . 98,905 97,324 93,927 92,965 91,905 91,782 93,535 92,677 87,024 85,592 83,467 86,325 88,487 85,735 81,288 81,306 80,485 76,194 74,49395th percentile lower limit . .
Household Income Ratiosof Selected Percentiles
124,594 122,481 118,071 116,365 113,228 113,677 116,760 114,633 108,034 105,856 102,748 105,963 110,181 107,391 100,622 100,898 99,482 94,529 94,106
90th/10th . . . . . . . . . . . . . . . 9.69 9.55 9.61 9.48 9.22 9.09 9.14 8.90 8.74 8.70 8.53 8.58 8.86 8.99 9.08 9.22 8.93 8.68 9.2395th/20th . . . . . . . . . . . . . . . 7.24 7.21 7.10 7.15 6.88 6.77 6.69 6.66 6.63 6.48 6.43 6.30 6.58 6.56 6.35 6.28 6.10 5.97 6.3395th/50th . . . . . . . . . . . . . . . 3.05 3.06 3.04 3.00 2.91 2.86 2.87 2.80 2.80 2.76 2.74 2.76 2.78 2.75 2.68 2.67 2.62 2.58 2.7080th/50th . . . . . . . . . . . . . . . 1.85 1.85 1.85 1.82 1.81 1.78 1.77 1.75 1.77 1.74 1.73 1.74 1.73 1.71 1.69 1.69 1.67 1.65 1.6880th/20th . . . . . . . . . . . . . . . 4.38 4.36 4.31 4.33 4.27 4.21 4.14 4.16 4.19 4.08 4.07 3.98 4.10 4.07 4.00 3.98 3.89 3.82 3.9520th/50th . . . . . . . . . . . . . . .
Mean Household Incomeof Quintiles
0.42 0.42 0.43 0.42 0.42 0.42 0.43 0.42 0.42 0.43 0.43 0.44 0.42 0.42 0.42 0.42 0.43 0.43 0.43
Lowest quintile. . . . . . . . . . . 9,714 9,720 9,395 9,276 9,440 9,671 9,982 10,045 9,481 9,535 9,304 9,636 9,663 9,233 8,721 8,672 8,816 8,599 7,923Second quintile . . . . . . . . . . 24,618 24,210 23,602 23,475 23,515 24,071 24,828 24,669 23,337 23,341 22,852 23,951 24,297 23,849 23,050 23,492 23,803 23,060 21,955Third quintile . . . . . . . . . . . . 40,863 40,120 39,021 38,857 38,955 39,720 40,934 40,732 38,606 38,384 37,494 38,602 39,853 38,921 37,370 37,830 38,036 36,572 35,054Fourth quintile . . . . . . . . . . . 61,466 60,408 58,555 57,790 58,068 58,517 60,069 59,666 56,565 55,742 54,479 55,748 57,330 55,876 53,129 53,324 53,276 51,018 49,045Highest quintile . . . . . . . . . .
Shares of HouseholdIncome of Quintiles
114,816 111,075 107,509 105,991 103,726 104,333 107,803 106,526 100,868 98,654 96,188 98,772 102,579 100,314 94,139 94,403 93,642 88,651 88,263
Lowest quintile. . . . . . . . . . . 3.9 4.0 4.0 4.0 4.1 4.2 4.1 4.2 4.2 4.3 4.3 4.3 4.2 4.1 4.1 4.1 4.1 4.2 4.0Second quintile . . . . . . . . . . 9.8 9.9 9.9 10.0 10.1 10.2 10.2 10.2 10.2 10.3 10.4 10.6 10.4 10.4 10.6 10.8 10.9 11.1 10.8Third quintile . . . . . . . . . . . . 16.2 16.3 16.4 16.5 16.7 16.8 16.8 16.8 16.9 17.0 17.0 17.0 17.0 17.0 17.3 17.4 17.5 17.6 17.3Fourth quintile . . . . . . . . . . . 24.4 24.6 24.6 24.5 24.8 24.7 24.6 24.7 24.7 24.7 24.7 24.6 24.5 24.5 24.5 24.5 24.5 24.5 24.2Highest quintile . . . . . . . . . .
Summary Measures
Gini index of income
45.6 45.2 45.1 45.0 44.3 44.1 44.2 44.1 44.0 43.7 43.6 43.5 43.9 43.9 43.5 43.3 43.0 42.6 43.6
inequality . . . . . . . . . . . . . .Mean logarithmic deviation
0.419 0.415 0.414 0.412 0.406 0.403 0.404 0.402 0.402 0.398 0.397 0.395 0.400 0.401 0.396 0.394 0.391 0.386 0.397
of income. . . . . . . . . . . . . . 0.403 0.391 0.397 0.401 0.387 0.375 0.369 0.363 0.364 0.361 0.361 0.352 0.355 0.370 0.370 0.370 0.357 0.356 0.380Theil . . . . . . . . . . . . . . . . . .Atkinson:
0.300 0.290 0.288 0.287 0.277 0.274 0.279 0.275 0.276 0.271 0.270 0.267 0.270 0.279 0.273 0.271 0.268 0.273 0.287
e=0.25 . . . . . . . . . . . . . . . 0.075 0.073 0.072 0.072 0.070 0.069 0.070 0.069 0.069 0.068 0.067 0.067 0.068 0.070 0.068 0.068 0.067 0.067 0.071e=0.50 . . . . . . . . . . . . . . . 0.151 0.147 0.147 0.146 0.141 0.140 0.141 0.139 0.139 0.137 0.136 0.134 0.136 0.140 0.138 0.138 0.135 0.135 0.143e=0.75 . . . . . . . . . . . . . . .
See footnotes at end of tab
0.231
le.
0.225 0.226 0.226 0.220 0.216 0.216 0.213 0.213 0.211 0.210 0.207 0.210 0.216 0.214 0.214 0.209 0.208 0.220

42
Inco
me, Po
verty, an
d H
ealth In
suran
ce Coverag
e in th
e Un
ited States: 2
00
5U
.S. Cen
sus Bu
reau
Table A-3.Selected Measures of Household Income Dispersion: 1967 to 2005—Con.(Income in 2005 CPI-U-RS adjusted dollars. For further explanation of income inequality measures, see Current Population Reports, Series P60-204, ‘‘The Changing Shape of the Nation’s Income Distribution: 1947–1998’’)
Measures of incomedispersion 2005 20041 2003 2002 2001 20002 19993 1998 1997 1996 19954 19945 19936 19927 1991 1990 1989 1988 19878 1986
Standard Errors ofHousehold Income atSelected Percentiles
10th percentile upper limit . . 77 77 77 77 81 81 81 80 84 78 79 73 73 73 75 81 81 81 80 8120th percentile upper limit . . 107 107 106 111 110 116 111 117 110 111 103 101 103 103 107 111 114 113 114 11550th (median) . . . . . . . . . . . 155 203 200 151 142 150 223 275 207 222 251 192 194 198 203 222 242 211 204 21980th percentile upper limit . . 322 322 339 249 267 272 290 280 384 293 311 267 301 261 288 308 253 282 272 30490th percentile lower limit . . 537 508 537 488 475 550 530 459 490 528 483 489 380 349 381 411 660 432 380 46895th percentile lower limit . .
Standard Errors ofHousehold IncomeRatios of SelectedPercentiles
1,117 947 756 774 833 1,055 926 917 802 729 854 811 692 683 689 775 744 843 620 547
90th/10th . . . . . . . . . . . . . . . 0.090 0.088 0.091 0.083 0.083 0.085 0.083 0.082 0.091 0.087 0.084 0.087 0.085 0.081 0.082 0.087 0.095 0.089 0.088 0.09395th/20th . . . . . . . . . . . . . . . 0.076 0.688 0.062 0.062 0.063 0.070 0.065 0.069 0.065 0.063 0.064 0.066 0.063 0.062 0.061 0.063 0.062 0.066 0.060 0.05995th/50th . . . . . . . . . . . . . . . 0.028 0.025 0.021 0.022 0.023 0.026 0.024 0.024 0.022 0.022 0.023 0.024 0.022 0.021 0.021 0.022 0.021 0.023 0.020 0.01880th/50th . . . . . . . . . . . . . . . 0.010 0.011 0.011 0.009 0.010 0.009 0.010 0.010 0.011 0.011 0.010 0.010 0.011 0.010 0.011 0.010 0.009 0.010 0.010 0.01180th/20th . . . . . . . . . . . . . . . 0.031 0.316 0.032 0.030 0.029 0.029 0.029 0.032 0.034 0.032 0.031 0.031 0.033 0.032 0.032 0.032 0.031 0.032 0.033 0.03420th/50th . . . . . . . . . . . . . . .
Standard Errors of MeanHousehold Income ofQuintiles
0.003 0.003 0.003 0.003 0.003 0.003 0.003 0.003 0.003 0.003 0.003 0.003 0.003 0.003 0.003 0.003 0.003 0.003 0.003 0.003
Lowest quintile. . . . . . . . . . . 39 39 39 39 40 40 40 40 38 36 37 36 36 36 36 37 38 37 37 38Second quintile . . . . . . . . . . 35 34 35 35 36 36 36 37 36 35 35 34 35 35 35 36 37 36 37 36Third quintile . . . . . . . . . . . . 43 44 44 45 45 45 46 46 44 44 42 42 41 41 41 41 43 42 43 43Fourth quintile . . . . . . . . . . . 69 68 70 68 69 69 70 68 66 63 64 65 63 60 60 61 62 61 60 59Highest quintile . . . . . . . . . .
Standard Errors of Sharesof Household Income ofQuintiles
856 846 802 843 950 941 828 863 887 863 812 815 815 452 430 475 525 476 467 441
Lowest quintile. . . . . . . . . . . 0.02 0.02 0.02 0.02 0.02 0.03 0.03 0.03 0.03 0.03 0.03 0.03 0.03 0.03 0.03 0.03 0.03 0.03 0.03 0.03Second quintile . . . . . . . . . . 0.06 0.06 0.06 0.06 0.06 0.06 0.06 0.06 0.06 0.06 0.07 0.07 0.07 0.07 0.07 0.07 0.07 0.07 0.07 0.07Third quintile . . . . . . . . . . . . 0.10 0.10 0.10 0.10 0.10 0.10 0.10 0.11 0.11 0.11 0.11 0.11 0.11 0.12 0.12 0.12 0.12 0.12 0.12 0.12Fourth quintile . . . . . . . . . . . 0.15 0.16 0.16 0.16 0.16 0.16 0.16 0.16 0.17 0.17 0.17 0.17 0.17 0.18 0.18 0.18 0.18 0.18 0.19 0.19Highest quintile . . . . . . . . . .
Standard Errors ofSummary Measures
Gini index of income
0.34 0.34 0.34 0.34 0.35 0.34 0.35 0.35 0.35 0.35 0.35 0.36 0.36 0.35 0.34 0.35 0.35 0.35 0.35 0.35
inequality . . . . . . . . . . . . . .Mean logarithmic deviation
0.0028 0.0029 0.0028 0.0029 0.0030 0.0030 0.0041 0.0042 0.0043 0.0043 0.0043 0.0042 0.0042 0.0038 0.0038 0.0039 0.0040 0.0041 0.0038 0.0038
of income. . . . . . . . . . . . . . 0.0063 0.0063 0.0054 0.0052 0.0051 0.0049 0.0058 0.0069 0.0067 0.0064 0.0063 0.0061 0.0061 0.0055 0.0056 0.0053 0.0053 0.0055 0.0055 0.0057Theil . . . . . . . . . . . . . . . . . .Atkinson:
0.0001 0.0001 0.0001 0.0001 0.0002 0.0002 0.0001 0.0002 0.0002 0.0002 0.0002 0.0002 0.0002 0.0001 0.0001 0.0001 0.0001 0.0001 0.0001 0.0001
e=0.25 . . . . . . . . . . . . . . . 0.0013 0.0013 0.0012 0.0012 0.0014 0.0013 0.0013 0.0015 0.0016 0.0016 0.0015 0.0015 0.0015 0.0007 0.0007 0.0007 0.0008 0.0008 0.0007 0.0007e=0.50 . . . . . . . . . . . . . . . 0.0020 0.0020 0.0018 0.0020 0.0022 0.0021 0.0021 0.0023 0.0025 0.0024 0.0024 0.0023 0.0024 0.0013 0.0012 0.0013 0.0014 0.0014 0.0013 0.0012e=0.75 . . . . . . . . . . . . . . .
See footnotes at end of tab
0.0026
le.
0.0026 0.0024 0.0025 0.0027 0.0026 0.0027 0.0029 0.0030 0.0030 0.0029 0.0028 0.0029 0.0019 0.0018 0.0018 0.0019 0.0020 0.0018 0.0018

U.S. C
ensu
s Bureau
Inco
me, Po
verty, an
d H
ealth In
suran
ce Coverag
e in th
e Un
ited States: 2
00
5 4
3
Table A-3.Selected Measures of Household Income Dispersion: 1967 to 2005—Con.(Income in 2005 CPI-U-RS adjusted dollars. For further explanation of income inequality measures, see Current Population Reports, Series P60-204, ‘‘The Changing Shape of the Nation’s Income Distribution: 1947–1998’’)
Measures of incomedispersion 19859 1984 198310 1982 1981 1980 197911 1978 1977 197612 197513 197413 14 1973 197215 197116 1970 1969 1968 196717
Standard Errors ofHousehold Income atSelected Percentiles
10th percentile upper limit . . 78 77 78 78 117 115 114 114 106 106 102 107 106 105 103 107 109 107 10320th percentile upper limit . . 113 102 105 104 106 110 119 119 114 116 118 143 142 141 137 142 145 142 13850th (median) . . . . . . . . . . . 221 182 177 176 205 204 194 166 145 142 154 149 152 150 146 139 141 133 12980th percentile upper limit . . 248 263 238 262 209 247 208 266 200 231 276 189 220 261 308 165 176 197 23290th percentile lower limit . . 421 335 414 357 344 390 375 307 412 301 378 312 320 431 231 262 310 409 55095th percentile lower limit . .
Standard Errors ofHousehold IncomeRatios of SelectedPercentiles
1039 612 564 671 630 603 645 626 529 610 554 699 501 677 405 501 616 425 400
90th/10th . . . . . . . . . . . . . . . 0.085 0.079 0.088 0.084 0.114 0.110 0.108 0.102 0.102 0.099 0.097 0.096 0.100 0.109 0.107 0.115 0.113 0.115 0.13695th/20th . . . . . . . . . . . . . . . 0.077 0.056 0.056 0.062 0.059 0.057 0.059 0.059 0.056 0.059 0.059 0.068 0.063 0.070 0.060 0.064 0.066 0.060 0.06595th/50th . . . . . . . . . . . . . . . 0.028 0.020 0.019 0.021 0.020 0.019 0.020 0.020 0.018 0.020 0.019 0.022 0.018 0.021 0.016 0.017 0.020 0.016 0.01680th/50th . . . . . . . . . . . . . . . 0.010 0.010 0.010 0.010 0.009 0.010 0.009 0.010 0.009 0.010 0.010 0.009 0.010 0.010 0.011 0.008 0.008 0.009 0.01080th/20th . . . . . . . . . . . . . . . 0.032 0.030 0.031 0.032 0.030 0.031 0.031 0.033 0.032 0.032 0.035 0.036 0.037 0.038 0.040 0.037 0.036 0.036 0.04020th/50th . . . . . . . . . . . . . . .
Standard Errors of MeanHousehold Income ofQuintiles
0.003 0.003 0.003 0.003 0.003 0.003 0.003 0.003 0.003 0.004 0.004 0.004 0.004 0.004 0.004 0.004 0.004 0.004 0.004
Lowest quintile. . . . . . . . . . . 38 37 38 38 39 38 39 40 40 39 39 42 40 41 41 43 43 43 41Second quintile . . . . . . . . . . 35 35 34 34 33 35 36 37 36 36 36 38 41 40 38 40 41 40 40Third quintile . . . . . . . . . . . . 41 40 40 39 40 40 42 42 40 41 39 38 40 40 38 38 38 36 35Fourth quintile . . . . . . . . . . . 58 58 56 55 53 53 54 55 53 51 50 53 54 52 50 50 49 47 46Highest quintile . . . . . . . . . .
Standard Errors of Sharesof Household Income ofQuintiles
401 353 340 341 320 345 385 383 382 379 380 384 416 435 413 425 433 406 441
Lowest quintile. . . . . . . . . . . 0.03 0.03 0.03 0.03 0.03 0.03 0.03 0.04 0.04 0.04 0.04 0.04 0.04 0.04 0.04 0.04 0.04 0.04 0.04Second quintile . . . . . . . . . . 0.08 0.08 0.08 0.08 0.08 0.08 0.08 0.09 0.09 0.09 0.09 0.09 0.09 0.09 0.10 0.10 0.10 0.11 0.10Third quintile . . . . . . . . . . . . 0.13 0.13 0.13 0.13 0.13 0.14 0.14 0.14 0.14 0.15 0.15 0.15 0.15 0.15 0.16 0.16 0.16 0.17 0.17Fourth quintile . . . . . . . . . . . 0.19 0.19 0.19 0.20 0.20 0.20 0.20 0.21 0.21 0.21 0.21 0.21 0.22 0.22 0.22 0.23 0.23 0.23 0.23Highest quintile . . . . . . . . . .
Standard Errors ofSummary Measures
Gini index of income
0.35 0.35 0.36 0.36 0.35 0.35 0.36 0.37 0.37 0.37 0.37 0.38 0.39 0.39 0.39 0.40 0.40 0.40 0.41
inequality . . . . . . . . . . . . . .Mean logarithmic deviation
0.0037 0.0037 0.0037 0.0038 0.0038 0.0036 0.0038 0.0039 0.0039 0.0041 0.0056 0.0066 0.0040 0.0069 0.0063 0.0078 0.0066 0.0042 0.0044
of income. . . . . . . . . . . . . . 0.0056 0.0055 0.0056 0.0057 0.0056 0.0051 0.0050 0.0054 0.0054 0.0054 0.0059 0.0058 0.0057 0.0060 0.0061 0.0060 0.0058 0.0057 0.0060Theil . . . . . . . . . . . . . . . . . .Atkinson:
0.0001 0.0001 0.0001 0.0001 0.0001 0.0001 0.0001 0.0001 0.0001 0.0001 0.0001 0.0001 0.0001 0.0001 0.0001 0.0001 0.0001 0.0001 0.0001
e=0.25 . . . . . . . . . . . . . . . 0.0006 0.0006 0.0006 0.0006 0.0006 0.0006 0.0006 0.0006 0.0006 0.0006 0.0007 0.0006 0.0007 0.0007 0.0007 0.0007 0.0008 0.0007 0.0008e=0.50 . . . . . . . . . . . . . . . 0.0011 0.0011 0.0011 0.0011 0.0011 0.0010 0.0011 0.0011 0.0011 0.0011 0.0012 0.0011 0.0012 0.0013 0.0013 0.0013 0.0014 0.0012 0.0014e=0.75 . . . . . . . . . . . . . . . 0.0017 0.0016 0.0016 0.0017 0.0016 0.0016 0.0017 0.0016 0.0017 0.0017 0.0018 0.0017 0.0017 0.0018 0.0019 0.0019 0.0020 0.0018 0.0020
See footnotes on next page.

44
Inco
me, Po
verty, an
d H
ealth In
suran
ce Coverag
e in th
e Un
ited States: 2
00
5U
.S. Cen
sus Bu
reau
1 Data have been revised to reflect a correction to the weights in the 2005 ASEC.2 Implementation of a 28,000 household sample expansion.3 Implementation of Census 2000-based population controls.4 Full implementation of 1990 census-based sample design and metropolitan definitions, 7,000 household sample reduction, and revised editing of responses on race.5 Introduction of 1990 census sample design.6 Data collection method changed from paper and pencil to computer-assisted interviewing. In addition, the 1994 ASEC was revised to allow for the coding of different income amounts on selected questionnaire items. Limits either increased or
decreased in the following categories: earnings limits increased to $999,999; social security limits increased to $49,999; supplemental security income and public assistance limits increased to $24,999; veterans’ benefits limits increased to $99,999;child support and alimony limits decreased to $49,999.
7 Implementation of 1990 census population controls.8 Implementation of a new CPS ASEC processing system.9 Recording of amounts for earnings from longest job increased to $299,999. Full implementation of 1980 census-based sample design.10 Implementation of Hispanic population weighting controls and introduction of 1980 census-based sample design.11 Implementation of 1980 census population controls. Questionnaire expanded to allow the recording of up to 27 possible values from a list of 51 possible sources of income.12 First year medians were derived using both Pareto and linear interpolation. Before this year, all medians were derived using linear interpolation.13 Some of these estimates were derived using Pareto interpolation and may differ from published data that were derived using linear interpolation.14 Implementation of a new CPS ASEC processing system. Questionnaire expanded to ask 11 income questions.15 Full implementation of 1970 census-based sample design.16 Introduction of 1970 census sample design and population controls.17 Implementation of a new CPS ASEC processing system.
Source: U.S. Census Bureau, Current Population Survey, 1968 to 2006 Annual Social and Economic Supplements.

U.S. Census Bureau Income, Poverty, and Health Insurance Coverage in the United States: 2005 45
APPENDIX B. ESTIMATES OF POVERTY
How Poverty Is Calculated
Following the Office of Management and Budget’s (OMB) Statistical Policy Directive 14, the U.S. Census Bureau uses a set ofmoney income thresholds that vary by family size and composition to determine who is in poverty (see the matrix below).
Poverty Thresholds in 2005 by Size of Family and Number of Related Children Under 18 Years(Dollars)
Size of family unit
Related children under 18 years
None One Two Three Four Five Six SevenEight or
more
One person (unrelated individual):Under 65 years. . . . . . . . . . . . . . . . . . 10,16065 years and older. . . . . . . . . . . . . . . 9,367
Two people:Householder under 65 years . . . . . . 13,078 13,461Householder 65 years and older. . . 11,805 13,410
Three people . . . . . . . . . . . . . . . . . . . . . 15,277 15,720 15,735
Four people. . . . . . . . . . . . . . . . . . . . . . . 20,144 20,474 19,806 19,874
Five people . . . . . . . . . . . . . . . . . . . . . . 24,293 24,646 23,891 23,307 22,951
Six people . . . . . . . . . . . . . . . . . . . . . . . 27,941 28,052 27,474 26,920 26,096 25,608
Seven people . . . . . . . . . . . . . . . . . . . . 32,150 32,350 31,658 31,176 30,277 29,229 28,079
Eight people . . . . . . . . . . . . . . . . . . . . . . 35,957 36,274 35,621 35,049 34,237 33,207 32,135 31,862
Nine people or more . . . . . . . . . . . . . . 43,254 43,463 42,885 42,400 41,603 40,507 39,515 39,270 37,757
Source: U.S. Census Bureau.
If a family’s total income is less thanthat family’s threshold, then that familyand every individual in it is consideredin poverty. The official poverty thresh-olds do not vary geographically, butthey are updated annually for inflationusing the Consumer Price Index (CPI-U).The official poverty definition usesmoney income before taxes and doesnot include capital gains or noncashbenefits (such as public housing,Medicaid, and food stamps).
Example: Suppose Family A consistsof five people: two children, theirmother, their father, and their great-aunt. Family A’s poverty threshold in2005 was $23,891. Suppose also thateach member had the followingincome in 2005:
Mother $10,000Father 5,000Great-aunt 10,000First child 0Second child 0
Total: $25,000
Since their total family income,$25,000, was greater than their thresh-old ($23,891), the family would not beconsidered “in poverty” according tothe official poverty measure.
While the thresholds in some senserepresent families’ needs, they shouldbe interpreted as a statistical yardstickrather than as a complete descriptionof what people and families need tolive. Many of the government’s aidprograms use different dollar amountsas eligibility criteria.
Poverty rates and the number inpoverty are important ways of examin-ing people’s well-being. Other moredetailed measures of poverty are con-sidered in the section “Depth of PovertyMeasures,” and in the recent CensusBureau report Supplemental Measuresof Material Well-Being: Expenditures,Consumption, and Poverty (P23-201).
For a history of the official povertymeasure, see “The Development of theOrshansky Poverty Thresholds and
Their Subsequent History as the OfficialU.S. Poverty Measure” by Gordon M.Fisher, available at <www.census.gov/hhes/www/poverty/histofpovmeas.html>.
Weighted average thresholds: Somedata users want a summary of the 48thresholds to get a general sense ofthe “poverty line.” The averagethresholds shown below provide thatsummary, but they are not used tocompute poverty data. The averagesare based on the relative number offamilies by size and composition.
Weighted Average PovertyThresholds in 2005 by Size ofFamily(Dollars)
One person 9,973Two people 12,755Three people 15,577Four people 19,971Five people 23,613Six people 26,683Seven people 30,249Eight people 33,610Nine people or more 40,288
Source: U.S. Census Bureau.

46 Income, Poverty, and Health Insurance Coverage in the United States: 2005 U.S. Census Bureau
Table B-1.Poverty Status of People by Family Relationship, Race, and Hispanic Origin: 1959 to 2005(Numbers in thousands. People as of March of the following year)
Race, Hispanic origin,and year
All people People in families Unrelated individuals
Total
Below poverty All familiesFamilies with female
householder, nohusband present
Total
Below poverty
Number Percent Total
Below poverty
Total
Below poverty
Number PercentNumber Percent Number Percent
ALL RACES
2005. . . . . . . . . . . . . . . . 293,135 36,950 12.6 242,389 26,068 10.8 42,244 13,153 31.1 49,526 10,425 21.120041 . . . . . . . . . . . . . . . 290,617 37,040 12.7 240,754 26,544 11.0 42,053 12,832 30.5 48,609 9,926 20.4
2003. . . . . . . . . . . . . . . . 287,699 35,861 12.5 238,903 25,684 10.8 41,311 12,413 30.0 47,594 9,713 20.42002. . . . . . . . . . . . . . . . 285,317 34,570 12.1 236,921 24,534 10.4 40,529 11,657 28.8 47,156 9,618 20.42001. . . . . . . . . . . . . . . . 281,475 32,907 11.7 233,911 23,215 9.9 39,261 11,223 28.6 46,392 9,226 19.920002 . . . . . . . . . . . . . . . 278,944 31,581 11.3 231,909 22,347 9.6 38,375 10,926 28.5 45,624 8,653 19.019993 . . . . . . . . . . . . . . . 276,208 32,791 11.9 230,789 23,830 10.3 38,580 11,764 30.5 43,977 8,400 19.1
1998. . . . . . . . . . . . . . . . 271,059 34,476 12.7 227,229 25,370 11.2 39,000 12,907 33.1 42,539 8,478 19.91997. . . . . . . . . . . . . . . . 268,480 35,574 13.3 225,369 26,217 11.6 38,412 13,494 35.1 41,672 8,687 20.81996. . . . . . . . . . . . . . . . 266,218 36,529 13.7 223,955 27,376 12.2 38,584 13,796 35.8 40,727 8,452 20.81995. . . . . . . . . . . . . . . . 263,733 36,425 13.8 222,792 27,501 12.3 38,908 14,205 36.5 39,484 8,247 20.91994. . . . . . . . . . . . . . . . 261,616 38,059 14.5 221,430 28,985 13.1 37,253 14,380 38.6 38,538 8,287 21.5
1993. . . . . . . . . . . . . . . . 259,278 39,265 15.1 219,489 29,927 13.6 37,861 14,636 38.7 38,038 8,388 22.119924 . . . . . . . . . . . . . . . 256,549 38,014 14.8 217,936 28,961 13.3 36,446 14,205 39.0 36,842 8,075 21.919915 . . . . . . . . . . . . . . . 251,192 35,708 14.2 212,723 27,143 12.8 34,795 13,824 39.7 36,845 7,773 21.11990. . . . . . . . . . . . . . . . 248,644 33,585 13.5 210,967 25,232 12.0 33,795 12,578 37.2 36,056 7,446 20.71989. . . . . . . . . . . . . . . . 245,992 31,528 12.8 209,515 24,066 11.5 32,525 11,668 35.9 35,185 6,760 19.2
19886 . . . . . . . . . . . . . . . 243,530 31,745 13.0 208,056 24,048 11.6 32,164 11,972 37.2 34,340 7,070 20.619876 . . . . . . . . . . . . . . . 240,982 32,221 13.4 206,877 24,725 12.0 31,893 12,148 38.1 32,992 6,857 20.81986. . . . . . . . . . . . . . . . 238,554 32,370 13.6 205,459 24,754 12.0 31,152 11,944 38.3 31,679 6,846 21.61985 . . . . . . . . . . . . . . . 236,594 33,064 14.0 203,963 25,729 12.6 30,878 11,600 37.6 31,351 6,725 21.51984. . . . . . . . . . . . . . . . 233,816 33,700 14.4 202,288 26,458 13.1 30,844 11,831 38.4 30,268 6,609 21.8
1983. . . . . . . . . . . . . . . . 231,700 35,303 15.2 201,338 27,933 13.9 30,049 12,072 40.2 29,158 6,740 23.11982. . . . . . . . . . . . . . . . 229,412 34,398 15.0 200,385 27,349 13.6 28,834 11,701 40.6 27,908 6,458 23.11981. . . . . . . . . . . . . . . . 227,157 31,822 14.0 198,541 24,850 12.5 28,587 11,051 38.7 27,714 6,490 23.41980. . . . . . . . . . . . . . . . 225,027 29,272 13.0 196,963 22,601 11.5 27,565 10,120 36.7 27,133 6,227 22.91979. . . . . . . . . . . . . . . . 222,903 26,072 11.7 195,860 19,964 10.2 26,927 9,400 34.9 26,170 5,743 21.9
1978. . . . . . . . . . . . . . . . 215,656 24,497 11.4 191,071 19,062 10.0 26,032 9,269 35.6 24,585 5,435 22.11977. . . . . . . . . . . . . . . . 213,867 24,720 11.6 190,757 19,505 10.2 25,404 9,205 36.2 23,110 5,216 22.61976. . . . . . . . . . . . . . . . 212,303 24,975 11.8 190,844 19,632 10.3 24,204 9,029 37.3 21,459 5,344 24.91975. . . . . . . . . . . . . . . . 210,864 25,877 12.3 190,630 20,789 10.9 23,580 8,846 37.5 20,234 5,088 25.11974. . . . . . . . . . . . . . . . 209,362 23,370 11.2 190,436 18,817 9.9 23,165 8,462 36.5 18,926 4,553 24.1
1973. . . . . . . . . . . . . . . . 207,621 22,973 11.1 189,361 18,299 9.7 21,823 8,178 37.5 18,260 4,674 25.61972. . . . . . . . . . . . . . . . 206,004 24,460 11.9 189,193 19,577 10.3 21,264 8,114 38.2 16,811 4,883 29.01971. . . . . . . . . . . . . . . . 204,554 25,559 12.5 188,242 20,405 10.8 20,153 7,797 38.7 16,311 5,154 31.61970. . . . . . . . . . . . . . . . 202,183 25,420 12.6 186,692 20,330 10.9 19,673 7,503 38.1 15,491 5,090 32.91969. . . . . . . . . . . . . . . . 199,517 24,147 12.1 184,891 19,175 10.4 17,995 6,879 38.2 14,626 4,972 34.0
1968. . . . . . . . . . . . . . . . 197,628 25,389 12.8 183,825 20,695 11.3 18,048 6,990 38.7 13,803 4,694 34.01967. . . . . . . . . . . . . . . . 195,672 27,769 14.2 182,558 22,771 12.5 17,788 6,898 38.8 13,114 4,998 38.11966. . . . . . . . . . . . . . . . 193,388 28,510 14.7 181,117 23,809 13.1 17,240 6,861 39.8 12,271 4,701 38.31965. . . . . . . . . . . . . . . . 191,413 33,185 17.3 179,281 28,358 15.8 16,371 7,524 46.0 12,132 4,827 39.81964. . . . . . . . . . . . . . . . 189,710 36,055 19.0 177,653 30,912 17.4 (NA) 7,297 44.4 12,057 5,143 42.7
1963. . . . . . . . . . . . . . . . 187,258 36,436 19.5 176,076 31,498 17.9 (NA) 7,646 47.7 11,182 4,938 44.21962. . . . . . . . . . . . . . . . 184,276 38,625 21.0 173,263 33,623 19.4 (NA) 7,781 50.3 11,013 5,002 45.41961. . . . . . . . . . . . . . . . 181,277 39,628 21.9 170,131 34,509 20.3 (NA) 7,252 48.1 11,146 5,119 45.91960. . . . . . . . . . . . . . . . 179,503 39,851 22.2 168,615 34,925 20.7 (NA) 7,247 48.9 10,888 4,926 45.21959. . . . . . . . . . . . . . . . 176,557 39,490 22.4 165,858 34,562 20.8 (NA) 7,014 49.4 10,699 4,928 46.1
See footnotes at end of table.

U.S. Census Bureau Income, Poverty, and Health Insurance Coverage in the United States: 2005 47
Table B-1.Poverty Status of People by Family Relationship, Race, and Hispanic Origin: 1959 to 2005—Con.(Numbers in thousands. People as of March of the following year)
Race, Hispanic origin,and year
All people People in families Unrelated individuals
Total
Below poverty All familiesFamilies with female
householder, nohusband present
Total
Below poverty
Number Percent Total
Below poverty
Total
Below poverty
Number PercentNumber Percent Number Percent
WHITE ALONE7
2005. . . . . . . . . . . . . . . . 235,430 24,872 10.6 194,277 16,782 8.6 25,943 7,021 27.1 40,164 7,718 19.220041 . . . . . . . . . . . . . . . 233,741 25,327 10.8 193,024 17,445 9.0 26,139 6,892 26.4 39,712 7,416 18.72003. . . . . . . . . . . . . . . . 231,866 24,272 10.5 192,074 16,740 8.7 25,536 6,530 25.6 38,913 7,225 18.62002. . . . . . . . . . . . . . . . 230,376 23,466 10.2 190,823 16,043 8.4 24,903 5,992 24.1 38,575 7,105 18.4
WHITE8
2001. . . . . . . . . . . . . . . . 229,675 22,739 9.9 190,413 15,369 8.1 24,619 5,972 24.3 38,294 6,996 18.320002 . . . . . . . . . . . . . . . 227,846 21,645 9.5 188,966 14,692 7.8 24,166 5,609 23.2 37,699 6,454 17.119993 . . . . . . . . . . . . . . . 225,361 22,169 9.8 187,833 15,353 8.2 23,913 5,947 24.9 36,441 6,411 17.6
1998. . . . . . . . . . . . . . . . 222,837 23,454 10.5 186,184 16,549 8.9 24,211 6,674 27.6 35,563 6,386 18.01997. . . . . . . . . . . . . . . . 221,200 24,396 11.0 185,147 17,258 9.3 23,773 7,296 30.7 34,858 6,593 18.91996. . . . . . . . . . . . . . . . 219,656 24,650 11.2 184,119 17,621 9.6 23,744 7,073 29.8 34,247 6,463 18.91995. . . . . . . . . . . . . . . . 218,028 24,423 11.2 183,450 17,593 9.6 23,732 7,047 29.7 33,399 6,336 19.01994. . . . . . . . . . . . . . . . 216,460 25,379 11.7 182,546 18,474 10.1 22,713 7,228 31.8 32,569 6,292 19.3
1993. . . . . . . . . . . . . . . . 214,899 26,226 12.2 181,330 18,968 10.5 23,224 7,199 31.0 32,112 6,443 20.119924 . . . . . . . . . . . . . . . 213,060 25,259 11.9 180,409 18,294 10.1 22,453 6,907 30.8 31,170 6,147 19.719915 . . . . . . . . . . . . . . . 210,133 23,747 11.3 177,619 17,268 9.7 21,608 6,806 31.5 31,207 5,872 18.81990. . . . . . . . . . . . . . . . 208,611 22,326 10.7 176,504 15,916 9.0 20,845 6,210 29.8 30,833 5,739 18.61989. . . . . . . . . . . . . . . . 206,853 20,785 10.0 175,857 15,179 8.6 20,362 5,723 28.1 29,993 5,063 16.9
19886 . . . . . . . . . . . . . . . 205,235 20,715 10.1 175,111 15,001 8.6 20,396 5,950 29.2 29,315 5,314 18.119876 . . . . . . . . . . . . . . . 203,605 21,195 10.4 174,488 15,593 8.9 20,244 5,989 29.6 28,290 5,174 18.31986. . . . . . . . . . . . . . . . 202,282 22,183 11.0 174,024 16,393 9.4 20,163 6,171 30.6 27,143 5,198 19.21985 . . . . . . . . . . . . . . . 200,918 22,860 11.4 172,863 17,125 9.9 20,105 5,990 29.8 27,067 5,299 19.61984. . . . . . . . . . . . . . . . 198,941 22,955 11.5 171,839 17,299 10.1 19,727 5,866 29.7 26,094 5,181 19.9
1983. . . . . . . . . . . . . . . . 197,496 23,984 12.1 171,407 18,377 10.7 19,256 6,017 31.2 25,206 5,189 20.61982. . . . . . . . . . . . . . . . 195,919 23,517 12.0 170,748 18,015 10.6 18,374 5,686 30.9 24,300 5,041 20.71981. . . . . . . . . . . . . . . . 194,504 21,553 11.1 169,868 16,127 9.5 18,795 5,600 29.8 23,913 5,061 21.21980. . . . . . . . . . . . . . . . 192,912 19,699 10.2 168,756 14,587 8.6 17,642 4,940 28.0 23,370 4,760 20.41979. . . . . . . . . . . . . . . . 191,742 17,214 9.0 168,461 12,495 7.4 17,349 4,375 25.2 22,587 4,452 19.7
1978. . . . . . . . . . . . . . . . 186,450 16,259 8.7 165,193 12,050 7.3 16,877 4,371 25.9 21,257 4,209 19.81977. . . . . . . . . . . . . . . . 185,254 16,416 8.9 165,385 12,364 7.5 16,721 4,474 26.8 19,869 4,051 20.41976. . . . . . . . . . . . . . . . 184,165 16,713 9.1 165,571 12,500 7.5 15,941 4,463 28.0 18,594 4,213 22.71975. . . . . . . . . . . . . . . . 183,164 17,770 9.7 165,661 13,799 8.3 15,577 4,577 29.4 17,503 3,972 22.71974. . . . . . . . . . . . . . . . 182,376 15,736 8.6 166,081 12,181 7.3 15,433 4,278 27.7 16,295 3,555 21.8
1973. . . . . . . . . . . . . . . . 181,185 15,142 8.4 165,424 11,412 6.9 14,303 4,003 28.0 15,761 3,730 23.71972. . . . . . . . . . . . . . . . 180,125 16,203 9.0 165,630 12,268 7.4 13,739 3,770 27.4 14,495 3,935 27.11971. . . . . . . . . . . . . . . . 179,398 17,780 9.9 165,184 13,566 8.2 13,502 4,099 30.4 14,214 4,214 29.61970. . . . . . . . . . . . . . . . 177,376 17,484 9.9 163,875 13,323 8.1 13,226 3,761 28.4 13,500 4,161 30.81969. . . . . . . . . . . . . . . . 175,349 16,659 9.5 162,779 12,623 7.8 12,285 3,577 29.1 12,570 4,036 32.1
1968. . . . . . . . . . . . . . . . 173,732 17,395 10.0 161,777 13,546 8.4 12,190 3,551 29.1 11,955 3,849 32.21967. . . . . . . . . . . . . . . . 172,038 18,983 11.0 160,720 14,851 9.2 12,131 3,453 28.5 11,318 4,132 36.51966. . . . . . . . . . . . . . . . 170,247 19,290 11.3 159,561 15,430 9.7 12,261 3,646 29.7 10,686 3,860 36.11965. . . . . . . . . . . . . . . . 168,732 22,496 13.3 158,255 18,508 11.7 11,573 4,092 35.4 10,477 3,988 38.11964. . . . . . . . . . . . . . . . 167,313 24,957 14.9 156,898 20,716 13.2 (NA) 3,911 33.4 10,415 4,241 40.7
1963. . . . . . . . . . . . . . . . 165,309 25,238 15.3 155,584 21,149 13.6 (NA) 4,051 35.6 9,725 4,089 42.01962. . . . . . . . . . . . . . . . 162,842 26,672 16.4 153,348 22,613 14.7 (NA) 4,089 37.9 9,494 4,059 42.71961. . . . . . . . . . . . . . . . 160,306 27,890 17.4 150,717 23,747 15.8 (NA) 4,062 37.6 9,589 4,143 43.21960. . . . . . . . . . . . . . . . 158,863 28,309 17.8 149,458 24,262 16.2 (NA) 4,296 39.0 9,405 4,047 43.01959. . . . . . . . . . . . . . . . 156,956 28,484 18.1 147,802 24,443 16.5 (NA) 4,232 40.2 9,154 4,041 44.1
See footnotes at end of table.

48 Income, Poverty, and Health Insurance Coverage in the United States: 2005 U.S. Census Bureau
Table B-1.Poverty Status of People by Family Relationship, Race, and Hispanic Origin: 1959 to 2005—Con.(Numbers in thousands. People as of March of the following year)
Race, Hispanic origin,and year
All people People in families Unrelated individuals
Total
Below poverty All familiesFamilies with female
householder, nohusband present
Total
Below poverty
Number Percent Total
Below poverty
Total
Below poverty
Number PercentNumber Percent Number Percent
WHITE ALONE, NOTHISPANIC7
2005. . . . . . . . . . . . . . . . 195,553 16,227 8.3 159,204 9,604 6.0 18,899 4,278 22.6 35,626 6,393 17.920041 . . . . . . . . . . . . . . . 195,098 16,908 8.7 159,221 10,323 6.5 19,009 4,116 21.7 35,141 6,237 17.72003. . . . . . . . . . . . . . . . 194,595 15,902 8.2 159,215 9,658 6.1 18,792 3,959 21.1 34,683 6,015 17.32002. . . . . . . . . . . . . . . .
WHITE, NOTHISPANIC8
194,144 15,567 8.0 158,764 9,389 5.9 18,664 3,733 20.0 34,614 5,947 17.2
2001. . . . . . . . . . . . . . . . 194,538 15,271 7.8 159,178 9,122 5.7 18,365 3,661 19.9 34,603 5,882 17.020002 . . . . . . . . . . . . . . . 193,691 14,366 7.4 158,838 8,664 5.5 18,196 3,412 18.8 33,943 5,356 15.819993 . . . . . . . . . . . . . . . 192,565 14,735 7.7 158,550 9,013 5.7 17,892 3,545 19.8 33,189 5,412 16.31998. . . . . . . . . . . . . . . . 192,754 15,799 8.2 159,301 10,061 6.3 18,547 4,074 22.0 32,573 5,352 16.4
1997. . . . . . . . . . . . . . . . 191,859 16,491 8.6 158,796 10,401 6.5 18,474 4,604 24.9 32,049 5,632 17.61996. . . . . . . . . . . . . . . . 191,459 16,462 8.6 159,044 10,553 6.6 18,597 4,339 23.3 31,410 5,455 17.41995. . . . . . . . . . . . . . . . 190,951 16,267 8.5 159,402 10,599 6.6 18,340 4,183 22.8 30,586 5,303 17.31994. . . . . . . . . . . . . . . . 192,543 18,110 9.4 161,254 12,118 7.5 18,186 4,743 26.1 30,157 5,500 18.21993. . . . . . . . . . . . . . . . 190,843 18,882 9.9 160,062 12,756 8.0 18,508 4,724 25.5 29,681 5,570 18.8
19924 . . . . . . . . . . . . . . . 189,001 18,202 9.6 159,102 12,277 7.7 18,016 4,640 25.8 28,775 5,350 18.619915 . . . . . . . . . . . . . . . 189,116 17,741 9.4 158,850 11,998 7.6 17,609 4,710 26.7 29,215 5,261 18.01990. . . . . . . . . . . . . . . . 188,129 16,622 8.8 158,394 11,086 7.0 17,160 4,284 25.0 28,688 5,002 17.41989. . . . . . . . . . . . . . . . 186,979 15,599 8.3 158,127 10,723 6.8 16,827 3,922 23.3 28,055 4,466 15.919886 . . . . . . . . . . . . . . . 185,961 15,565 8.4 157,687 10,467 6.6 16,828 3,988 23.7 27,552 4,746 17.2
19876 . . . . . . . . . . . . . . . 184,936 16,029 8.7 157,785 11,051 7.0 16,787 4,075 24.3 26,439 4,613 17.41986. . . . . . . . . . . . . . . . 184,119 17,244 9.4 157,665 12,078 7.7 16,739 4,350 26.0 25,525 4,668 18.31985 . . . . . . . . . . . . . . . 183,455 17,839 9.7 157,106 12,706 8.1 16,749 4,136 24.7 25,544 4,789 18.71984. . . . . . . . . . . . . . . . 182,469 18,300 10.0 156,930 13,234 8.4 16,742 4,193 25.0 24,671 4,659 18.91983. . . . . . . . . . . . . . . . 181,393 19,538 10.8 156,719 14,437 9.2 16,369 4,448 27.2 23,894 4,746 19.9
1982. . . . . . . . . . . . . . . . 181,903 19,362 10.6 157,818 14,271 9.0 15,830 4,161 26.3 23,329 4,701 20.21981. . . . . . . . . . . . . . . . 180,909 17,987 9.9 157,330 12,903 8.2 16,323 4,222 25.9 22,950 4,769 20.81980. . . . . . . . . . . . . . . . 179,798 16,365 9.1 156,633 11,568 7.4 15,358 3,699 24.1 22,455 4,474 19.91979. . . . . . . . . . . . . . . . 178,814 14,419 8.1 156,567 10,009 6.4 15,410 3,371 21.9 21,638 4,179 19.31978. . . . . . . . . . . . . . . . 174,731 13,755 7.9 154,321 9,798 6.3 15,132 3,390 22.4 20,410 3,957 19.4
1977. . . . . . . . . . . . . . . . 173,563 13,802 8.0 154,449 9,977 6.5 14,888 3,429 23.0 19,114 3,825 20.01976. . . . . . . . . . . . . . . . 173,235 14,025 8.1 155,324 10,066 6.5 14,261 3,516 24.7 17,912 3,959 22.11975. . . . . . . . . . . . . . . . 172,417 14,883 8.6 155,539 11,137 7.2 13,809 3,570 25.9 16,879 3,746 22.21974. . . . . . . . . . . . . . . . 171,463 13,217 7.7 155,764 9,854 6.3 13,763 3,379 24.6 15,699 3,364 21.41973. . . . . . . . . . . . . . . . 170,488 12,864 7.5 155,330 9,262 6.0 12,731 3,185 25.0 15,158 3,602 23.8
See footnotes at end of table.

U.S. Census Bureau Income, Poverty, and Health Insurance Coverage in the United States: 2005 49
Table B-1.Poverty Status of People by Family Relationship, Race, and Hispanic Origin: 1959 to 2005—Con.(Numbers in thousands. People as of March of the following year)
Race, Hispanic origin,and year
All people People in families Unrelated individuals
Total
Below poverty All familiesFamilies with female
householder, nohusband present
Total
Below poverty
Number Percent Total
Below poverty
Total
Below poverty
Number PercentNumber Percent Number Percent
BLACK ALONE ORIN COMBINATION
2005. . . . . . . . . . . . . . . . 38,551 9,517 24.7 31,663 7,459 23.6 14,080 5,524 39.2 6,754 2,003 29.720041 . . . . . . . . . . . . . . . 38,037 9,411 24.7 31,468 7,495 23.8 13,830 5,484 39.7 6,418 1,840 28.72003. . . . . . . . . . . . . . . . 37,503 9,108 24.3 31,059 7,162 23.1 13,664 5,312 38.9 6,194 1,814 29.32002. . . . . . . . . . . . . . . .
BLACK ALONE9
37,207 8,884 23.9 31,008 6,985 22.5 13,551 5,145 38.0 6,034 1,851 30.7
2005. . . . . . . . . . . . . . . . 36,802 9,168 24.9 30,154 7,164 23.8 13,481 5,303 39.3 6,521 1,949 29.920041 . . . . . . . . . . . . . . . 36,426 9,014 24.7 30,065 7,153 23.8 13,244 5,247 39.6 6,217 1,792 28.82003. . . . . . . . . . . . . . . . 35,989 8,781 24.4 29,727 6,870 23.1 13,118 5,115 39.0 6,034 1,781 29.52002. . . . . . . . . . . . . . . .
BLACK8
35,678 8,602 24.1 29,671 6,761 22.8 13,030 4,980 38.2 5,858 1,800 30.7
2001. . . . . . . . . . . . . . . . 35,871 8,136 22.7 29,869 6,389 21.4 12,550 4,694 37.4 5,873 1,692 28.820002 . . . . . . . . . . . . . . . 35,425 7,982 22.5 29,378 6,221 21.2 12,383 4,774 38.6 5,885 1,702 28.919993 . . . . . . . . . . . . . . . 35,756 8,441 23.6 29,819 6,758 22.7 12,823 5,232 40.8 5,668 1,562 27.51998. . . . . . . . . . . . . . . . 34,877 9,091 26.1 29,333 7,259 24.7 13,156 5,629 42.8 5,390 1,752 32.5
1997. . . . . . . . . . . . . . . . 34,458 9,116 26.5 28,962 7,386 25.5 13,218 5,654 42.8 5,316 1,645 31.01996. . . . . . . . . . . . . . . . 34,110 9,694 28.4 28,933 7,993 27.6 13,193 6,123 46.4 4,989 1,606 32.21995. . . . . . . . . . . . . . . . 33,740 9,872 29.3 28,777 8,189 28.5 13,604 6,553 48.2 4,756 1,551 32.61994. . . . . . . . . . . . . . . . 33,353 10,196 30.6 28,499 8,447 29.6 12,926 6,489 50.2 4,649 1,617 34.81993. . . . . . . . . . . . . . . . 32,910 10,877 33.1 28,106 9,242 32.9 13,132 6,955 53.0 4,608 1,541 33.4
19924 . . . . . . . . . . . . . . . 32,411 10,827 33.4 27,790 9,134 32.9 12,591 6,799 54.0 4,410 1,569 35.619915 . . . . . . . . . . . . . . . 31,313 10,242 32.7 26,565 8,504 32.0 11,960 6,557 54.8 4,505 1,590 35.31990. . . . . . . . . . . . . . . . 30,806 9,837 31.9 26,296 8,160 31.0 11,866 6,005 50.6 4,244 1,491 35.11989. . . . . . . . . . . . . . . . 30,332 9,302 30.7 25,931 7,704 29.7 11,190 5,530 49.4 4,180 1,471 35.219886 . . . . . . . . . . . . . . . 29,849 9,356 31.3 25,484 7,650 30.0 10,794 5,601 51.9 4,095 1,509 36.8
19876. . . . . . . . . . . . . . . 29,362 9,520 32.4 25,128 7,848 31.2 10,701 5,789 54.1 3,977 1,471 37.01986. . . . . . . . . . . . . . . . 28,871 8,983 31.1 24,910 7,410 29.7 10,175 5,473 53.8 3,714 1,431 38.51985 . . . . . . . . . . . . . . . 28,485 8,926 31.3 24,620 7,504 30.5 10,041 5,342 53.2 3,641 1,264 34.71984. . . . . . . . . . . . . . . . 28,087 9,490 33.8 24,387 8,104 33.2 10,384 5,666 54.6 3,501 1,255 35.81983. . . . . . . . . . . . . . . . 27,678 9,882 35.7 24,138 8,376 34.7 10,059 5,736 57.0 3,287 1,338 40.7
1982. . . . . . . . . . . . . . . . 27,216 9,697 35.6 23,948 8,355 34.9 9,699 5,698 58.8 3,051 1,229 40.31981. . . . . . . . . . . . . . . . 26,834 9,173 34.2 23,423 7,780 33.2 9,214 5,222 56.7 3,277 1,296 39.61980. . . . . . . . . . . . . . . . 26,408 8,579 32.5 23,084 7,190 31.1 9,338 4,984 53.4 3,208 1,314 41.01979. . . . . . . . . . . . . . . . 25,944 8,050 31.0 22,666 6,800 30.0 9,065 4,816 53.1 3,127 1,168 37.31978. . . . . . . . . . . . . . . . 24,956 7,625 30.6 22,027 6,493 29.5 8,689 4,712 54.2 2,929 1,132 38.6
1977. . . . . . . . . . . . . . . . 24,710 7,726 31.3 21,850 6,667 30.5 8,315 4,595 55.3 2,860 1,059 37.01976. . . . . . . . . . . . . . . . 24,399 7,595 31.1 21,840 6,576 30.1 7,926 4,415 55.7 2,559 1,019 39.81975. . . . . . . . . . . . . . . . 24,089 7,545 31.3 21,687 6,533 30.1 7,679 4,168 54.3 2,402 1,011 42.11974. . . . . . . . . . . . . . . . 23,699 7,182 30.3 21,341 6,255 29.3 7,483 4,116 55.0 2,359 927 39.31973. . . . . . . . . . . . . . . . 23,512 7,388 31.4 21,328 6,560 30.8 7,188 4,064 56.5 2,183 828 37.9
1972. . . . . . . . . . . . . . . . 23,144 7,710 33.3 21,116 6,841 32.4 7,125 4,139 58.1 2,028 870 42.91971. . . . . . . . . . . . . . . . 22,784 7,396 32.5 20,900 6,530 31.2 6,398 3,587 56.1 1,884 866 46.01970. . . . . . . . . . . . . . . . 22,515 7,548 33.5 20,724 6,683 32.2 6,225 3,656 58.7 1,791 865 48.31969. . . . . . . . . . . . . . . . 22,011 7,095 32.2 20,192 6,245 30.9 5,537 3,225 58.2 1,819 850 46.71968. . . . . . . . . . . . . . . . 21,944 7,616 34.7 (NA) 6,839 33.7 (NA) 3,312 58.9 (NA) 777 46.3
1967. . . . . . . . . . . . . . . . 21,590 8,486 39.3 (NA) 7,677 38.4 (NA) 3,362 61.6 (NA) 809 49.31966. . . . . . . . . . . . . . . . 21,206 8,867 41.8 (NA) 8,090 40.9 (NA) 3,160 65.3 (NA) 777 54.41959. . . . . . . . . . . . . . . . 18,013 9,927 55.1 (NA) 9,112 54.9 (NA) 2,416 70.6 1,430 815 57.0
See footnotes at end of table.

50 Income, Poverty, and Health Insurance Coverage in the United States: 2005 U.S. Census Bureau
Table B-1.Poverty Status of People by Family Relationship, Race, and Hispanic Origin: 1959 to 2005—Con.(Numbers in thousands. People as of March of the following year)
Race, Hispanic origin,and year
All people People in families Unrelated individuals
Total
Below poverty All familiesFamilies with female
householder, nohusband present
Total
Below poverty
Number Percent Total
Below poverty
Total
Below poverty
Number PercentNumber Percent Number Percent
ASIAN ALONE ORIN COMBINATION
2005. . . . . . . . . . . . . . . . 13,731 1,501 10.9 11,931 1,039 8.7 1,223 220 18.0 1,771 457 25.820041 . . . . . . . . . . . . . . . 13,291 1,295 9.7 11,661 876 7.5 1,190 170 14.3 1,599 417 26.12003. . . . . . . . . . . . . . . . 12,891 1,527 11.8 11,266 1,116 9.9 1,184 294 24.8 1,590 402 25.32002. . . . . . . . . . . . . . . .
ASIAN ALONE10
12,487 1,243 10.0 10,742 816 7.6 1,146 175 15.3 1,708 417 24.4
2005. . . . . . . . . . . . . . . . 12,580 1,402 11.1 10,911 970 8.9 1,059 189 17.8 1,645 427 26.020041 . . . . . . . . . . . . . . . 12,231 1,201 9.8 10,734 812 7.6 1,024 135 13.2 1,472 388 26.32003. . . . . . . . . . . . . . . . 11,856 1,401 11.8 10,333 1,017 9.8 1,028 242 23.6 1,494 375 25.12002. . . . . . . . . . . . . . . .
ASIAN AND PACIFICISLANDER8
11,541 1,161 10.1 9,899 763 7.7 1,019 155 15.2 1,613 390 24.2
2001. . . . . . . . . . . . . . . . 12,465 1,275 10.2 10,745 873 8.1 1,333 198 14.8 1,682 393 23.420002 . . . . . . . . . . . . . . . 12,672 1,258 9.9 11,044 895 8.1 1,231 289 23.4 1,588 350 22.019993 . . . . . . . . . . . . . . . 11,955 1,285 10.7 10,507 1,010 9.6 1,201 275 22.9 1,415 270 19.11998. . . . . . . . . . . . . . . . 10,873 1,360 12.5 9,576 1,087 11.4 1,123 373 33.2 1,266 257 20.31997. . . . . . . . . . . . . . . . 10,482 1,468 14.0 9,312 1,116 12.0 932 313 33.6 1,134 327 28.9
1996. . . . . . . . . . . . . . . . 10,054 1,454 14.5 8,900 1,172 13.2 1,018 300 29.5 1,120 255 22.81995. . . . . . . . . . . . . . . . 9,644 1,411 14.6 8,582 1,112 13.0 919 266 28.9 1,013 260 25.61994. . . . . . . . . . . . . . . . 6,654 974 14.6 5,915 776 13.1 582 137 23.6 696 179 25.71993. . . . . . . . . . . . . . . . 7,434 1,134 15.3 6,609 898 13.6 725 126 17.4 791 228 28.819924 . . . . . . . . . . . . . . . 7,779 985 12.7 6,922 787 11.4 729 183 25.0 828 193 23.3
19915 . . . . . . . . . . . . . . . 7,192 996 13.8 6,367 773 12.1 721 177 24.6 785 209 26.61990. . . . . . . . . . . . . . . . 7,014 858 12.2 6,300 712 11.3 638 132 20.7 668 124 18.51989. . . . . . . . . . . . . . . . 6,673 939 14.1 5,917 779 13.2 614 212 34.6 712 144 20.219886 . . . . . . . . . . . . . . . 6,447 1,117 17.3 5,767 942 16.3 650 263 40.5 651 160 24.519876 . . . . . . . . . . . . . . . 6,322 1,021 16.1 5,785 875 15.1 584 187 32.0 516 138 26.8
See footnotes at end of table.

U.S. Census Bureau Income, Poverty, and Health Insurance Coverage in the United States: 2005 51
Table B-1.Poverty Status of People by Family Relationship, Race, and Hispanic Origin: 1959 to 2005—Con.(Numbers in thousands. People as of March of the following year)
Race, Hispanic origin,and year
All people People in families Unrelated individuals
Total
Below poverty All familiesFamilies with female
householder, nohusband present
Total
Below poverty
Number Percent Total
Below poverty
Total
Below poverty
Number PercentNumber Percent Number Percent
HISPANIC(ANY RACE)
2005. . . . . . . . . . . . . . . . 43,020 9,368 21.8 37,759 7,767 20.6 7,868 3,069 39.0 4,971 1,451 29.220041 . . . . . . . . . . . . . . . 41,690 9,122 21.9 36,438 7,705 21.1 7,825 3,072 39.3 4,971 1,293 26.0
2003. . . . . . . . . . . . . . . . 40,300 9,051 22.5 35,469 7,637 21.5 7,452 2,861 38.4 4,620 1,325 28.72002. . . . . . . . . . . . . . . . 39,216 8,555 21.8 34,598 7,184 20.8 7,013 2,554 36.4 4,364 1,255 28.82001. . . . . . . . . . . . . . . . 37,312 7,997 21.4 33,110 6,674 20.2 6,830 2,585 37.8 3,981 1,211 30.420002 . . . . . . . . . . . . . . . 35,955 7,747 21.5 31,700 6,430 20.3 6,469 2,444 37.8 3,978 1,163 29.219993 . . . . . . . . . . . . . . . 34,632 7,876 22.7 30,872 6,702 21.7 6,527 2,642 40.5 3,481 1,068 30.7
1998. . . . . . . . . . . . . . . . 31,515 8,070 25.6 28,055 6,814 24.3 6,074 2,837 46.7 3,218 1,097 34.11997. . . . . . . . . . . . . . . . 30,637 8,308 27.1 27,467 7,198 26.2 5,718 2,911 50.9 2,976 1,017 34.21996. . . . . . . . . . . . . . . . 29,614 8,697 29.4 26,340 7,515 28.5 5,641 3,020 53.5 2,985 1,066 35.71995. . . . . . . . . . . . . . . . 28,344 8,574 30.3 25,165 7,341 29.2 5,785 3,053 52.8 2,947 1,092 37.01994. . . . . . . . . . . . . . . . 27,442 8,416 30.7 24,390 7,357 30.2 5,328 2,920 54.8 2,798 926 33.1
1993. . . . . . . . . . . . . . . . 26,559 8,126 30.6 23,439 6,876 29.3 5,333 2,837 53.2 2,717 972 35.819924 . . . . . . . . . . . . . . . 25,646 7,592 29.6 22,695 6,455 28.4 4,806 2,474 51.5 2,577 881 34.219915 . . . . . . . . . . . . . . . 22,070 6,339 28.7 19,658 5,541 28.2 4,326 2,282 52.7 2,146 667 31.11990. . . . . . . . . . . . . . . . 21,405 6,006 28.1 18,912 5,091 26.9 3,993 2,115 53.0 2,254 774 34.31989. . . . . . . . . . . . . . . . 20,746 5,430 26.2 18,488 4,659 25.2 3,763 1,902 50.6 2,045 634 31.0
19886 . . . . . . . . . . . . . . . 20,064 5,357 26.7 18,102 4,700 26.0 3,734 2,052 55.0 1,864 597 32.019876 . . . . . . . . . . . . . . . 19,395 5,422 28.0 17,342 4,761 27.5 3,678 2,045 55.6 1,933 598 31.01986. . . . . . . . . . . . . . . . 18,758 5,117 27.3 16,880 4,469 26.5 3,631 1,921 52.9 1,685 553 32.81985 . . . . . . . . . . . . . . . 18,075 5,236 29.0 16,276 4,605 28.3 3,561 1,983 55.7 1,602 532 33.21984. . . . . . . . . . . . . . . . 16,916 4,806 28.4 15,293 4,192 27.4 3,139 1,764 56.2 1,481 545 36.8
1983. . . . . . . . . . . . . . . . 16,544 4,633 28.0 15,075 4,113 27.3 3,032 1,670 55.1 1,364 457 33.51982. . . . . . . . . . . . . . . . 14,385 4,301 29.9 13,242 3,865 29.2 2,664 1,601 60.1 1,018 358 35.11981. . . . . . . . . . . . . . . . 14,021 3,713 26.5 12,922 3,349 25.9 2,622 1,465 55.9 1,005 313 31.11980. . . . . . . . . . . . . . . . 13,600 3,491 25.7 12,547 3,143 25.1 2,421 1,319 54.5 970 312 32.21979. . . . . . . . . . . . . . . . 13,371 2,921 21.8 12,291 2,599 21.1 2,058 1,053 51.2 991 286 28.8
1978. . . . . . . . . . . . . . . . 12,079 2,607 21.6 11,193 2,343 20.9 1,817 1,024 56.4 886 264 29.81977. . . . . . . . . . . . . . . . 12,046 2,700 22.4 11,249 2,463 21.9 1,901 1,077 56.7 797 237 29.81976. . . . . . . . . . . . . . . . 11,269 2,783 24.7 10,552 2,516 23.8 1,766 1,000 56.6 716 266 37.21975. . . . . . . . . . . . . . . . 11,117 2,991 26.9 10,472 2,755 26.3 1,842 1,053 57.2 645 236 36.6
1974. . . . . . . . . . . . . . . . 11,201 2,575 23.0 10,584 2,374 22.4 1,723 915 53.1 617 201 32.61973. . . . . . . . . . . . . . . . 10,795 2,366 21.9 10,269 2,209 21.5 1,534 881 57.4 526 157 29.91972. . . . . . . . . . . . . . . . 10,588 2,414 22.8 10,099 2,252 22.3 1,370 733 53.5 488 162 33.2
(NA) Not available.
1 For 2004, figures are revised to reflect a correction to the weights in the 2005 ASEC.2 Consistent with 2001 data through implementation of Census 2000-based population controls and a 28,000 household sample expansion.3 For 1999, figures are based on Census 2000 population controls.4 For 1992, figures are based on 1990 census population controls.5 For 1991, figures are revised to correct for nine omitted weights from the original March 1992 CPS file.6 For 1988 and 1987, figures are based on new processing procedures and are also revised to reflect corrections to the files after publication of the 1988 advance
report Money Income and Poverty Status in the United States: 1988, P-60, No. 166.7 The 2003 CPS allowed respondents to choose more than one race. White alone refers to people who reported White and did not report any other race category. The
use of this single-race population does not imply that it is the preferred method of presenting or analyzing data. The Census Bureau uses a variety of approaches.Information on people who reported more than one race, such as White and American Indian and Alaska Native or Asian and Black or African American, is available fromCensus 2000 through American FactFinder. About 2.6 percent of people reported more than one race in Census 2000.
8 For 2001 and earlier years, the CPS allowed respondents to report only one race group. The reference race groups for 2001 and earlier poverty data are White,non-Hispanic White, Black, and Asian and Pacific Islander.
9 Black alone refers to people who reported Black and did not report any other race.10 Asian alone refers to people who reported Asian and did not report any other race.
Note: Prior to 1979, people in unrelated subfamilies were included in people in families. Beginning in 1979, people in unrelated subfamilies are included in all peoplebut are excluded from people in families.
Source: U.S. Census Bureau, Current Population Survey, 1960 to 2006 Annual Social and Economic Supplements.

52 Income, Poverty, and Health Insurance Coverage in the United States: 2005 U.S. Census Bureau
Table B-2.Poverty Status of People by Age, Race, and Hispanic Origin: 1959 to 2005(Numbers in thousands. People as of March of the following year)
Race, Hispanicorigin, and year
Under 18 years 18 to 64 years 65 years and older
All people Related children in families
Total
Below poverty
Total
Below poverty
Total
Below poverty
Total
Below poverty
Number Percent Number Percent Number Percent Number Percent
ALL RACES
2005. . . . . . . . . . . . . . . . 73,285 12,896 17.6 72,095 12,335 17.1 184,345 20,450 11.1 35,505 3,603 10.120041 . . . . . . . . . . . . . . . 73,241 13,041 17.8 72,133 12,473 17.3 182,166 20,545 11.3 35,209 3,453 9.8
2003. . . . . . . . . . . . . . . . 72,999 12,866 17.6 71,907 12,340 17.2 180,041 19,443 10.8 34,659 3,552 10.22002. . . . . . . . . . . . . . . . 72,696 12,133 16.7 71,619 11,646 16.3 178,388 18,861 10.6 34,234 3,576 10.42001. . . . . . . . . . . . . . . . 72,021 11,733 16.3 70,950 11,175 15.8 175,685 17,760 10.1 33,769 3,414 10.120002 . . . . . . . . . . . . . . . 71,741 11,587 16.2 70,538 11,005 15.6 173,638 16,671 9.6 33,566 3,323 9.919993 . . . . . . . . . . . . . . . 71,685 12,280 17.1 70,424 11,678 16.6 171,146 17,289 10.1 33,377 3,222 9.7
1998. . . . . . . . . . . . . . . . 71,338 13,467 18.9 70,253 12,845 18.3 167,327 17,623 10.5 32,394 3,386 10.51997. . . . . . . . . . . . . . . . 71,069 14,113 19.9 69,844 13,422 19.2 165,329 18,085 10.9 32,082 3,376 10.51996. . . . . . . . . . . . . . . . 70,650 14,463 20.5 69,411 13,764 19.8 163,691 18,638 11.4 31,877 3,428 10.81995. . . . . . . . . . . . . . . . 70,566 14,665 20.8 69,425 13,999 20.2 161,508 18,442 11.4 31,658 3,318 10.51994. . . . . . . . . . . . . . . . 70,020 15,289 21.8 68,819 14,610 21.2 160,329 19,107 11.9 31,267 3,663 11.7
1993. . . . . . . . . . . . . . . . 69,292 15,727 22.7 68,040 14,961 22.0 159,208 19,781 12.4 30,779 3,755 12.219924 . . . . . . . . . . . . . . . 68,440 15,294 22.3 67,256 14,521 21.6 157,680 18,793 11.9 30,430 3,928 12.919915 . . . . . . . . . . . . . . . 65,918 14,341 21.8 64,800 13,658 21.1 154,684 17,586 11.4 30,590 3,781 12.41990. . . . . . . . . . . . . . . . 65,049 13,431 20.6 63,908 12,715 19.9 153,502 16,496 10.7 30,093 3,658 12.21989. . . . . . . . . . . . . . . . 64,144 12,590 19.6 63,225 12,001 19.0 152,282 15,575 10.2 29,566 3,363 11.4
19886. . . . . . . . . . . . . . . 63,747 12,455 19.5 62,906 11,935 19.0 150,761 15,809 10.5 29,022 3,481 12.019876 . . . . . . . . . . . . . . . 63,294 12,843 20.3 62,423 12,275 19.7 149,201 15,815 10.6 28,487 3,563 12.51986. . . . . . . . . . . . . . . . 62,948 12,876 20.5 62,009 12,257 19.8 147,631 16,017 10.8 27,975 3,477 12.41985 . . . . . . . . . . . . . . . 62,876 13,010 20.7 62,019 12,483 20.1 146,396 16,598 11.3 27,322 3,456 12.61984. . . . . . . . . . . . . . . . 62,447 13,420 21.5 61,681 12,929 21.0 144,551 16,952 11.7 26,818 3,330 12.4
1983. . . . . . . . . . . . . . . . 62,334 13,911 22.3 61,578 13,427 21.8 143,052 17,767 12.4 26,313 3,625 13.81982. . . . . . . . . . . . . . . . 62,345 13,647 21.9 61,565 13,139 21.3 141,328 17,000 12.0 25,738 3,751 14.61981. . . . . . . . . . . . . . . . 62,449 12,505 20.0 61,756 12,068 19.5 139,477 15,464 11.1 25,231 3,853 15.31980. . . . . . . . . . . . . . . . 62,914 11,543 18.3 62,168 11,114 17.9 137,428 13,858 10.1 24,686 3,871 15.71979. . . . . . . . . . . . . . . . 63,375 10,377 16.4 62,646 9,993 16.0 135,333 12,014 8.9 24,194 3,682 15.2
1978. . . . . . . . . . . . . . . . 62,311 9,931 15.9 61,987 9,722 15.7 130,169 11,332 8.7 23,175 3,233 14.01977. . . . . . . . . . . . . . . . 63,137 10,288 16.2 62,823 10,028 16.0 128,262 11,316 8.8 22,468 3,177 14.11976. . . . . . . . . . . . . . . . 64,028 10,273 16.0 63,729 10,081 15.8 126,175 11,389 9.0 22,100 3,313 15.01975. . . . . . . . . . . . . . . . 65,079 11,104 17.1 64,750 10,882 16.8 124,122 11,456 9.2 21,662 3,317 15.31974. . . . . . . . . . . . . . . . 66,134 10,156 15.4 65,802 9,967 15.1 122,101 10,132 8.3 21,127 3,085 14.6
1973. . . . . . . . . . . . . . . . 66,959 9,642 14.4 66,626 9,453 14.2 120,060 9,977 8.3 20,602 3,354 16.31972. . . . . . . . . . . . . . . . 67,930 10,284 15.1 67,592 10,082 14.9 117,957 10,438 8.8 20,117 3,738 18.61971. . . . . . . . . . . . . . . . 68,816 10,551 15.3 68,474 10,344 15.1 115,911 10,735 9.3 19,827 4,273 21.61970. . . . . . . . . . . . . . . . 69,159 10,440 15.1 68,815 10,235 14.9 113,554 10,187 9.0 19,470 4,793 24.61969. . . . . . . . . . . . . . . . 69,090 9,691 14.0 68,746 9,501 13.8 111,528 9,669 8.7 18,899 4,787 25.3
1968. . . . . . . . . . . . . . . . 70,385 10,954 15.6 70,035 10,739 15.3 108,684 9,803 9.0 18,559 4,632 25.01967. . . . . . . . . . . . . . . . 70,408 11,656 16.6 70,058 11,427 16.3 107,024 10,725 10.0 18,240 5,388 29.51966. . . . . . . . . . . . . . . . 70,218 12,389 17.6 69,869 12,146 17.4 105,241 11,007 10.5 17,929 5,114 28.51965. . . . . . . . . . . . . . . . 69,986 14,676 21.0 69,638 14,388 20.7 (NA) (NA) (NA) (NA) (NA) (NA)1964. . . . . . . . . . . . . . . . 69,711 16,051 23.0 69,364 15,736 22.7 (NA) (NA) (NA) (NA) (NA) (NA)
1963. . . . . . . . . . . . . . . . 69,181 16,005 23.1 68,837 15,691 22.8 (NA) (NA) (NA) (NA) (NA) (NA)1962. . . . . . . . . . . . . . . . 67,722 16,963 25.0 67,385 16,630 24.7 (NA) (NA) (NA) (NA) (NA) (NA)1961. . . . . . . . . . . . . . . . 66,121 16,909 25.6 65,792 16,577 25.2 (NA) (NA) (NA) (NA) (NA) (NA)1960. . . . . . . . . . . . . . . . 65,601 17,634 26.9 65,275 17,288 26.5 (NA) (NA) (NA) (NA) (NA) (NA)1959. . . . . . . . . . . . . . . . 64,315 17,552 27.3 63,995 17,208 26.9 96,685 16,457 17.0 15,557 5,481 35.2
See footnotes at end of table.

U.S. Census Bureau Income, Poverty, and Health Insurance Coverage in the United States: 2005 53
Table B-2.Poverty Status of People by Age, Race, and Hispanic Origin: 1959 to 2005—Con.(Numbers in thousands. People as of March of the following year)
Race, Hispanicorigin, and year
Under 18 years 18 to 64 years 65 years and older
All people Related children in families
Total
Below poverty
Total
Below poverty
Total
Below poverty
Total
Below poverty
Number Percent Number Percent Number Percent Number Percent
WHITE ALONE7
2005. . . . . . . . . . . . . . . . 56,075 8,085 14.4 55,152 7,652 13.9 148,450 14,086 9.5 30,905 2,700 8.720041 . . . . . . . . . . . . . . . 56,053 8,308 14.8 55,212 7,876 14.3 146,974 14,486 9.9 30,714 2,534 8.32003. . . . . . . . . . . . . . . . 55,779 7,985 14.3 54,989 7,624 13.9 145,783 13,622 9.3 30,303 2,666 8.82002. . . . . . . . . . . . . . . . 55,703 7,549 13.6 54,900 7,203 13.1 144,694 13,178 9.1 29,980 2,739 9.1
WHITE8
2001. . . . . . . . . . . . . . . . 56,089 7,527 13.4 55,238 7,086 12.8 143,796 12,555 8.7 29,790 2,656 8.920002 . . . . . . . . . . . . . . . 55,980 7,307 13.1 55,021 6,834 12.4 142,164 11,754 8.3 29,703 2,584 8.719993 . . . . . . . . . . . . . . . 55,833 7,639 13.7 54,873 7,194 13.1 139,974 12,085 8.6 29,553 2,446 8.31998. . . . . . . . . . . . . . . . 56,016 8,443 15.1 55,126 7,935 14.4 138,061 12,456 9.0 28,759 2,555 8.9
1997. . . . . . . . . . . . . . . . 55,863 8,990 16.1 54,870 8,441 15.4 136,784 12,838 9.4 28,553 2,569 9.01996. . . . . . . . . . . . . . . . 55,606 9,044 16.3 54,599 8,488 15.5 135,586 12,940 9.5 28,464 2,667 9.41995. . . . . . . . . . . . . . . . 55,444 8,981 16.2 54,532 8,474 15.5 134,149 12,869 9.6 28,436 2,572 9.01994. . . . . . . . . . . . . . . . 55,186 9,346 16.9 54,221 8,826 16.3 133,289 13,187 9.9 27,985 2,846 10.21993. . . . . . . . . . . . . . . . 54,639 9,752 17.8 53,614 9,123 17.0 132,680 13,535 10.2 27,580 2,939 10.7
19924 . . . . . . . . . . . . . . . 54,110 9,399 17.4 53,110 8,752 16.5 131,694 12,871 9.8 27,256 2,989 11.019915 . . . . . . . . . . . . . . . 52,523 8,848 16.8 51,627 8,316 16.1 130,312 12,097 9.3 27,297 2,802 10.31990. . . . . . . . . . . . . . . . 51,929 8,232 15.9 51,028 7,696 15.1 129,784 11,387 8.8 26,898 2,707 10.11989. . . . . . . . . . . . . . . . 51,400 7,599 14.8 50,704 7,164 14.1 128,974 10,647 8.3 26,479 2,539 9.619886 . . . . . . . . . . . . . . . 51,203 7,435 14.5 50,590 7,095 14.0 128,031 10,687 8.3 26,001 2,593 10.0
19876 . . . . . . . . . . . . . . . 51,012 7,788 15.3 50,360 7,398 14.7 126,991 10,703 8.4 25,602 2,704 10.61986. . . . . . . . . . . . . . . . 51,111 8,209 16.1 50,356 7,714 15.3 125,998 11,285 9.0 25,173 2,689 10.71985 . . . . . . . . . . . . . . . 51,031 8,253 16.2 50,358 7,838 15.6 125,258 11,909 9.5 24,629 2,698 11.01984. . . . . . . . . . . . . . . . 50,814 8,472 16.7 50,192 8,086 16.1 123,922 11,904 9.6 24,206 2,579 10.71983. . . . . . . . . . . . . . . . 50,726 8,862 17.5 50,183 8,534 17.0 123,014 12,347 10.0 23,754 2,776 11.7
1982. . . . . . . . . . . . . . . . 50,920 8,678 17.0 50,305 8,282 16.5 121,766 11,971 9.8 23,234 2,870 12.41981. . . . . . . . . . . . . . . . 51,140 7,785 15.2 50,553 7,429 14.7 120,574 10,790 8.9 22,791 2,978 13.11980. . . . . . . . . . . . . . . . 51,653 7,181 13.9 51,002 6,817 13.4 118,935 9,478 8.0 22,325 3,042 13.61979. . . . . . . . . . . . . . . . 52,262 6,193 11.8 51,687 5,909 11.4 117,583 8,110 6.9 21,898 2,911 13.31978. . . . . . . . . . . . . . . . 51,669 5,831 11.3 51,409 5,674 11.0 113,832 7,897 6.9 20,950 2,530 12.1
1977. . . . . . . . . . . . . . . . 52,563 6,097 11.6 52,299 5,943 11.4 112,374 7,893 7.0 20,316 2,426 11.91976. . . . . . . . . . . . . . . . 53,428 6,189 11.6 53,167 6,034 11.3 110,717 7,890 7.1 20,020 2,633 13.21975. . . . . . . . . . . . . . . . 54,405 6,927 12.7 54,126 6,748 12.5 109,105 8,210 7.5 19,654 2,634 13.41974. . . . . . . . . . . . . . . . 55,590 6,223 11.2 55,320 6,079 11.0 107,579 7,053 6.6 19,206 2,460 12.81973. . . . . . . . . . . . . . . . (NA) (NA) (NA) 56,211 5,462 9.7 (NA) (NA) (NA) (NA) 2,698 14.4
1972. . . . . . . . . . . . . . . . (NA) (NA) (NA) 57,181 5,784 10.1 (NA) (NA) (NA) (NA) 3,072 16.81971. . . . . . . . . . . . . . . . (NA) (NA) (NA) 58,119 6,341 10.9 (NA) (NA) (NA) (NA) 3,605 19.91970. . . . . . . . . . . . . . . . (NA) (NA) (NA) 58,472 6,138 10.5 (NA) (NA) (NA) (NA) 4,011 22.61969. . . . . . . . . . . . . . . . (NA) (NA) (NA) 58,578 5,667 9.7 (NA) (NA) (NA) (NA) 4,052 23.31968. . . . . . . . . . . . . . . . (NA) (NA) (NA) (NA) 6,373 10.7 (NA) (NA) (NA) 17,062 3,939 23.1
1967. . . . . . . . . . . . . . . . (NA) (NA) (NA) (NA) 6,729 11.3 (NA) (NA) (NA) 16,791 4,646 27.71966. . . . . . . . . . . . . . . . (NA) (NA) (NA) (NA) 7,204 12.1 (NA) (NA) (NA) 16,514 4,357 26.41965. . . . . . . . . . . . . . . . (NA) (NA) (NA) (NA) 8,595 14.4 (NA) (NA) (NA) (NA) (NA) (NA)1960. . . . . . . . . . . . . . . . (NA) (NA) (NA) (NA) 11,229 20.0 (NA) (NA) (NA) (NA) (NA) (NA)1959. . . . . . . . . . . . . . . . (NA) (NA) (NA) (NA) 11,386 20.6 (NA) (NA) (NA) (NA) 4,744 33.1
See footnotes at end of table.

54 Income, Poverty, and Health Insurance Coverage in the United States: 2005 U.S. Census Bureau
Table B-2.Poverty Status of People by Age, Race, and Hispanic Origin: 1959 to 2005—Con.(Numbers in thousands. People as of March of the following year)
Race, Hispanicorigin, and year
Under 18 years 18 to 64 years 65 years and older
All people Related children in families
Total
Below poverty
Total
Below poverty
Total
Below poverty
Total
Below poverty
Number Percent Number Percent Number Percent Number Percent
WHITE ALONE, NOTHISPANIC7
2005. . . . . . . . . . . . . . . . 42,523 4,254 10.0 41,867 3,973 9.5 124,326 9,708 7.8 28,704 2,264 7.920041 . . . . . . . . . . . . . . . 42,978 4,519 10.5 42,363 4,190 9.9 123,481 10,236 8.3 28,639 2,153 7.52003. . . . . . . . . . . . . . . . 43,150 4,233 9.8 42,547 3,957 9.3 123,110 9,391 7.6 28,335 2,277 8.02002. . . . . . . . . . . . . . . . 43,614 4,090 9.4 43,017 3,848 8.9 122,511 9,157 7.5 28,018 2,321 8.3
WHITE, NOTHISPANIC8
2001. . . . . . . . . . . . . . . . 44,095 4,194 9.5 43,459 3,887 8.9 122,470 8,811 7.2 27,973 2,266 8.120002 . . . . . . . . . . . . . . . 44,244 4,018 9.1 43,554 3,715 8.5 121,499 8,130 6.7 27,948 2,218 7.919993 . . . . . . . . . . . . . . . 44,272 4,155 9.4 43,570 3,832 8.8 120,341 8,462 7.0 27,952 2,118 7.61998. . . . . . . . . . . . . . . . 45,355 4,822 10.6 44,670 4,458 10.0 120,282 8,760 7.3 27,118 2,217 8.2
1997. . . . . . . . . . . . . . . . 45,491 5,204 11.4 44,665 4,759 10.7 119,373 9,088 7.6 26,995 2,200 8.11996. . . . . . . . . . . . . . . . 45,605 5,072 11.1 44,844 4,656 10.4 118,822 9,074 7.6 27,033 2,316 8.61995. . . . . . . . . . . . . . . . 45,689 5,115 11.2 44,973 4,745 10.6 118,228 8,908 7.5 27,034 2,243 8.31994. . . . . . . . . . . . . . . . 46,668 5,823 12.5 45,874 5,404 11.8 119,192 9,732 8.2 26,684 2,556 9.61993. . . . . . . . . . . . . . . . 46,096 6,255 13.6 45,322 5,819 12.8 118,475 9,964 8.4 26,272 2,663 10.1
19924 . . . . . . . . . . . . . . . 45,590 6,017 13.2 44,833 5,558 12.4 117,386 9,461 8.1 26,025 2,724 10.519915 . . . . . . . . . . . . . . . 45,236 5,918 13.1 44,506 5,497 12.4 117,672 9,244 7.9 26,208 2,580 9.81990. . . . . . . . . . . . . . . . 44,797 5,532 12.3 44,045 5,106 11.6 117,477 8,619 7.3 25,854 2,471 9.61989. . . . . . . . . . . . . . . . 44,492 5,110 11.5 43,938 4,779 10.9 116,983 8,154 7.0 25,504 2,335 9.219886 . . . . . . . . . . . . . . . 44,438 4,888 11.0 43,910 4,594 10.5 116,479 8,293 7.1 25,044 2,384 9.5
19876 . . . . . . . . . . . . . . . 44,461 5,230 11.8 43,907 4,902 11.2 115,721 8,327 7.2 24,754 2,472 10.01986. . . . . . . . . . . . . . . . 44,664 5,789 13.0 44,041 5,388 12.2 115,157 8,963 7.8 24,298 2,492 10.31985 . . . . . . . . . . . . . . . 44,752 5,745 12.8 44,199 5,421 12.3 114,969 9,608 8.4 23,734 2,486 10.51984. . . . . . . . . . . . . . . . 44,886 6,156 13.7 44,349 5,828 13.1 114,180 9,734 8.5 23,402 2,410 10.31983. . . . . . . . . . . . . . . . 44,830 6,649 14.8 44,374 6,381 14.4 113,570 10,279 9.1 22,992 2,610 11.4
1982. . . . . . . . . . . . . . . . 45,531 6,566 14.4 45,001 6,229 13.8 113,717 10,082 8.9 22,655 2,714 12.01981. . . . . . . . . . . . . . . . 45,950 5,946 12.9 45,440 5,639 12.4 112,722 9,207 8.2 22,237 2,834 12.71980. . . . . . . . . . . . . . . . 46,578 5,510 11.8 45,989 5,174 11.3 111,460 7,990 7.2 21,760 2,865 13.21979. . . . . . . . . . . . . . . . 46,967 4,730 10.1 46,448 4,476 9.6 110,509 6,930 6.3 21,339 2,759 12.91978. . . . . . . . . . . . . . . . 46,819 4,506 9.6 46,606 4,383 9.4 107,481 6,837 6.4 20,431 2,412 11.8
1977. . . . . . . . . . . . . . . . 47,689 4,714 9.9 47,459 4,582 9.7 106,063 6,772 6.4 19,812 2,316 11.71976. . . . . . . . . . . . . . . . 48,824 4,799 9.8 48,601 4,664 9.6 104,846 6,720 6.4 19,565 2,506 12.81975. . . . . . . . . . . . . . . . 49,670 5,342 10.8 49,421 5,185 10.5 103,496 7,039 6.8 19,251 2,503 13.01974. . . . . . . . . . . . . . . . 50,759 4,820 9.5 50,520 4,697 9.3 101,894 6,051 5.9 18,810 2,346 12.5
See footnotes at end of table.

U.S. Census Bureau Income, Poverty, and Health Insurance Coverage in the United States: 2005 55
Table B-2.Poverty Status of People by Age, Race, and Hispanic Origin: 1959 to 2005—Con.(Numbers in thousands. People as of March of the following year)
Race, Hispanicorigin, and year
Under 18 years 18 to 64 years 65 years and older
All people Related children in families
Total
Below poverty
Total
Below poverty
Total
Below poverty
Total
Below poverty
Number Percent Number Percent Number Percent Number Percent
BLACK ALONE ORIN COMBINATION
2005. . . . . . . . . . . . . . . . 12,159 4,074 33.5 11,975 3,972 33.2 23,338 4,735 20.3 3,053 708 23.220041 . . . . . . . . . . . . . . . 12,190 4,059 33.3 12,012 3,962 33.0 22,842 4,638 20.3 3,005 714 23.82003. . . . . . . . . . . . . . . . 12,215 4,108 33.6 11,989 3,977 33.2 22,355 4,313 19.3 2,933 688 23.52002. . . . . . . . . . . . . . . .
BLACK ALONE9
12,114 3,817 31.5 11,931 3,733 31.3 22,170 4,376 19.7 2,922 691 23.6
2005. . . . . . . . . . . . . . . . 11,136 3,841 34.5 10,962 3,743 34.2 22,659 4,627 20.4 3,007 701 23.320041 . . . . . . . . . . . . . . . 11,244 3,788 33.7 11,080 3,702 33.4 22,226 4,521 20.3 2,956 705 23.82003. . . . . . . . . . . . . . . . 11,367 3,877 34.1 11,162 3,750 33.6 21,746 4,224 19.4 2,876 680 23.72002. . . . . . . . . . . . . . . .
BLACK8
11,275 3,645 32.3 11,111 3,570 32.1 21,547 4,277 19.9 2,856 680 23.8
2001. . . . . . . . . . . . . . . . 11,556 3,492 30.2 11,419 3,423 30.0 21,462 4,018 18.7 2,853 626 21.920002 . . . . . . . . . . . . . . . 11,480 3,581 31.2 11,296 3,495 30.9 21,160 3,794 17.9 2,785 607 21.819993 . . . . . . . . . . . . . . . 11,488 3,813 33.2 11,260 3,698 32.8 21,518 4,000 18.6 2,750 628 22.81998. . . . . . . . . . . . . . . . 11,317 4,151 36.7 11,176 4,073 36.4 20,837 4,222 20.3 2,723 718 26.4
1997. . . . . . . . . . . . . . . . 11,367 4,225 37.2 11,193 4,116 36.8 20,400 4,191 20.5 2,691 700 26.01996. . . . . . . . . . . . . . . . 11,338 4,519 39.9 11,155 4,411 39.5 20,155 4,515 22.4 2,616 661 25.31995. . . . . . . . . . . . . . . . 11,369 4,761 41.9 11,198 4,644 41.5 19,892 4,483 22.5 2,478 629 25.41994. . . . . . . . . . . . . . . . 11,211 4,906 43.8 11,044 4,787 43.3 19,585 4,590 23.4 2,557 700 27.41993. . . . . . . . . . . . . . . . 11,127 5,125 46.1 10,969 5,030 45.9 19,272 5,049 26.2 2,510 702 28.0
19924 . . . . . . . . . . . . . . . 10,956 5,106 46.6 10,823 5,015 46.3 18,952 4,884 25.8 2,504 838 33.519915 . . . . . . . . . . . . . . . 10,350 4,755 45.9 10,178 4,637 45.6 18,355 4,607 25.1 2,606 880 33.81990. . . . . . . . . . . . . . . . 10,162 4,550 44.8 9,980 4,412 44.2 18,097 4,427 24.5 2,547 860 33.81989. . . . . . . . . . . . . . . . 10,012 4,375 43.7 9,847 4,257 43.2 17,833 4,164 23.3 2,487 763 30.719886 . . . . . . . . . . . . . . . 9,865 4,296 43.5 9,681 4,148 42.8 17,548 4,275 24.4 2,436 785 32.2
19876 . . . . . . . . . . . . . . . 9,730 4,385 45.1 9,546 4,234 44.4 17,245 4,361 25.3 2,387 774 32.41986. . . . . . . . . . . . . . . . 9,629 4,148 43.1 9,467 4,037 42.7 16,911 4,113 24.3 2,331 722 31.01985 . . . . . . . . . . . . . . . 9,545 4,157 43.6 9,405 4,057 43.1 16,667 4,052 24.3 2,273 717 31.51984. . . . . . . . . . . . . . . . 9,480 4,413 46.6 9,356 4,320 46.2 16,369 4,368 26.7 2,238 710 31.71983. . . . . . . . . . . . . . . . 9,417 4,398 46.7 9,245 4,273 46.2 16,065 4,694 29.2 2,197 791 36.0
1982. . . . . . . . . . . . . . . . 9,400 4,472 47.6 9,269 4,388 47.3 15,692 4,415 28.1 2,124 811 38.21981. . . . . . . . . . . . . . . . 9,374 4,237 45.2 9,291 4,170 44.9 15,358 4,117 26.8 2,102 820 39.01980. . . . . . . . . . . . . . . . 9,368 3,961 42.3 9,287 3,906 42.1 14,987 3,835 25.6 2,054 783 38.11979. . . . . . . . . . . . . . . . 9,307 3,833 41.2 9,172 3,745 40.8 14,596 3,478 23.8 2,040 740 36.21978. . . . . . . . . . . . . . . . 9,229 3,830 41.5 9,168 3,781 41.2 13,774 3,133 22.7 1,954 662 33.9
1977. . . . . . . . . . . . . . . . 9,296 3,888 41.8 9,253 3,850 41.6 13,483 3,137 23.3 1,930 701 36.31976. . . . . . . . . . . . . . . . 9,322 3,787 40.6 9,291 3,758 40.4 13,224 3,163 23.9 1,852 644 34.81975. . . . . . . . . . . . . . . . 9,421 3,925 41.7 9,374 3,884 41.4 12,872 2,968 23.1 1,795 652 36.31974. . . . . . . . . . . . . . . . 9,439 3,755 39.8 9,384 3,713 39.6 12,539 2,836 22.6 1,721 591 34.31973. . . . . . . . . . . . . . . . (NA) (NA) (NA) 9,405 3,822 40.6 (NA) (NA) (NA) 1,672 620 37.1
1972. . . . . . . . . . . . . . . . (NA) (NA) (NA) 9,426 4,025 42.7 (NA) (NA) (NA) 1,603 640 39.91971. . . . . . . . . . . . . . . . (NA) (NA) (NA) 9,414 3,836 40.4 (NA) (NA) (NA) 1,584 623 39.31970. . . . . . . . . . . . . . . . (NA) (NA) (NA) 9,448 3,922 41.5 (NA) (NA) (NA) 1,422 683 48.01969. . . . . . . . . . . . . . . . (NA) (NA) (NA) 9,290 3,677 39.6 (NA) (NA) (NA) 1,373 689 50.21968. . . . . . . . . . . . . . . . (NA) (NA) (NA) (NA) 4,188 43.1 (NA) (NA) (NA) 1,374 655 47.7
1967. . . . . . . . . . . . . . . . (NA) (NA) (NA) (NA) 4,558 47.4 (NA) (NA) (NA) 1,341 715 53.31966. . . . . . . . . . . . . . . . (NA) (NA) (NA) (NA) 4,774 50.6 (NA) (NA) (NA) 1,311 722 55.11965. . . . . . . . . . . . . . . . (NA) (NA) (NA) (NA) 5,022 65.6 (NA) (NA) (NA) (NA) 711 62.5
See footnotes at end of table.

56 Income, Poverty, and Health Insurance Coverage in the United States: 2005 U.S. Census Bureau
Table B-2.Poverty Status of People by Age, Race, and Hispanic Origin: 1959 to 2005—Con.(Numbers in thousands. People as of March of the following year)
Race, Hispanicorigin, and year
Under 18 years 18 to 64 years 65 years and older
All people Related children in families
Total
Below poverty
Total
Below poverty
Total
Below poverty
Total
Below poverty
Number Percent Number Percent Number Percent Number Percent
ASIAN ALONE OR INCOMBINATION
2005. . . . . . . . . . . . . . . . 3,472 359 10.3 3,435 352 10.2 9,115 999 11.0 1,144 144 12.620041 . . . . . . . . . . . . . . . 3,406 329 9.7 3,367 311 9.2 8,780 819 9.3 1,104 147 13.32003. . . . . . . . . . . . . . . . 3,316 420 12.7 3,279 406 12.4 8,510 956 11.2 1,065 152 14.22002. . . . . . . . . . . . . . . . 3,199 353 11.0 3,159 338 10.7 8,292 804 9.7 995 86 8.7
ASIAN ALONE10
2005. . . . . . . . . . . . . . . . 2,871 317 11.1 2,842 312 11.0 8,591 941 11.0 1,118 143 12.820041 . . . . . . . . . . . . . . . 2,854 281 9.9 2,823 265 9.4 8,294 774 9.3 1,083 146 13.52003. . . . . . . . . . . . . . . . 2,759 344 12.5 2,726 331 12.1 8,044 907 11.3 1,052 151 14.32002. . . . . . . . . . . . . . . . 2,683 315 11.7 2,648 302 11.4 7,881 764 9.7 977 82 8.4
ASIAN AND PACIFICISLANDER8
2001. . . . . . . . . . . . . . . . 3,215 369 11.5 3,169 353 11.1 8,352 814 9.7 899 92 10.220002 . . . . . . . . . . . . . . . 3,294 420 12.7 3,256 407 12.5 8,500 756 8.9 878 82 9.319993 . . . . . . . . . . . . . . 3,212 381 11.9 3,178 367 11.5 7,879 807 10.2 864 96 11.11998. . . . . . . . . . . . . . . . 3,137 564 18.0 3,099 542 17.5 6,951 698 10.0 785 97 12.41997. . . . . . . . . . . . . . . . 3,096 628 20.3 3,061 608 19.9 6,680 753 11.3 705 87 12.3
1996. . . . . . . . . . . . . . . . 2,924 571 19.5 2,899 553 19.1 6,484 821 12.7 647 63 9.71995. . . . . . . . . . . . . . . . 2,900 564 19.5 2,858 532 18.6 6,123 757 12.4 622 89 14.31994. . . . . . . . . . . . . . . . 1,739 318 18.3 1,719 308 17.9 4,401 589 13.4 513 67 13.01993. . . . . . . . . . . . . . . . 2,061 375 18.2 2,029 358 17.6 4,871 680 14.0 503 79 15.619924 . . . . . . . . . . . . . . . 2,218 363 16.4 2,199 352 16.0 5,067 568 11.2 494 53 10.8
19915 . . . . . . . . . . . . . . . 2,056 360 17.5 2,036 348 17.1 4,582 565 12.3 555 70 12.71990. . . . . . . . . . . . . . . . 2,126 374 17.6 2,098 356 17.0 4,375 422 9.6 514 62 12.11989. . . . . . . . . . . . . . . . 1,983 392 19.8 1,945 368 18.9 4,225 512 12.1 465 34 7.419886 . . . . . . . . . . . . . . . 1,970 474 24.1 1,949 458 23.5 4,035 583 14.4 442 60 13.519876 . . . . . . . . . . . . . . . 1,937 455 23.5 1,908 432 22.7 4,010 510 12.7 375 56 15.0
See footnotes at end of table.

U.S. Census Bureau Income, Poverty, and Health Insurance Coverage in the United States: 2005 57
Table B-2.Poverty Status of People by Age, Race, and Hispanic Origin: 1959 to 2005—Con.(Numbers in thousands. People as of March of the following year)
Race, Hispanicorigin, and year
Under 18 years 18 to 64 years 65 years and older
All people Related children in families
Total
Below poverty
Total
Below poverty
Total
14,65414,173
13,73013,21012,76312,39912,188
11,15210,80210,51110,213
9,822
9,4629,0817,6487,4577,186
7,0036,7926,6466,4756,068
6,0665,5275,3695,2765,483
5,0125,0284,771(NA)(NA)(NA)
Below poverty
Total
14,36113,929
13,51912,97112,53912,11511,912
10,92110,62510,25510,0119,621
9,1888,8297,4737,3007,040
6,9086,6926,5116,3465,982
5,9775,4365,2915,2115,426
4,9725,0004,7364,8964,9394,910
Below poverty
Number
4,1434,098
4,0773,7823,5703,5223,693
3,8373,9724,2374,0804,075
3,8733,6373,0942,8652,603
2,6312,6702,5072,6062,376
2,3122,1811,9251,7491,535
1,3841,4221,443(NA)(NA)(NA)
Percent
28.328.9
29.728.628.028.430.3
34.436.840.340.041.5
40.940.040.438.436.2
37.639.337.740.339.2
38.139.535.933.228.0
27.628.330.2(NA)(NA)(NA)
Number
3,9773,985
3,9823,6533,4333,3423,561
3,6703,8654,0903,9383,956
3,6663,4402,9772,7502,496
2,5762,6062,4132,5122,317
2,2512,1171,8741,7181,505
1,3541,4021,4241,6191,4141,364
Percent
27.728.6
29.528.227.427.629.9
33.636.439.939.341.1
39.939.039.837.735.5
37.338.937.139.638.7
37.738.935.433.027.7
27.228.030.133.128.627.8
Number Percent Number Percent
HISPANIC(ANY RACE)
2005. . . . . . . . . . . . . . . .20041 . . . . . . . . . . . . . . .
2003 . . . . . . . . . . . . . . .2002 . . . . . . . . . . . . . . . .2001 . . . . . . . . . . . . . . . .20002 . . . . . . . . . . . . . . .19993 . . . . . . . . . . . . . .
1998 . . . . . . . . . . . . . . .1997 . . . . . . . . . . . . . . .1996 . . . . . . . . . . . . . . .1995 . . . . . . . . . . . . . . .1994 . . . . . . . . . . . . . . .
1993 . . . . . . . . . . . . . . .19924 . . . . . . . . . . . . . .19915 . . . . . . . . . . . . . . .1990 . . . . . . . . . . . . . . .1989 . . . . . . . . . . . . . . .
19886 . . . . . . . . . . . . . .19876 . . . . . . . . . . . . . .1986 . . . . . . . . . . . . . . .1985 . . . . . . . . . . . . . . .1984 . . . . . . . . . . . . . . .
1983 . . . . . . . . . . . . . . .1982 . . . . . . . . . . . . . . .1981 . . . . . . . . . . . . . . .1980 . . . . . . . . . . . . . . .1979 . . . . . . . . . . . . . . .
1978 . . . . . . . . . . . . . . .1977 . . . . . . . . . . . . . . .1976 . . . . . . . . . . . . . . .1975 . . . . . . . . . . . . . . .1974 . . . . . . . . . . . . . . .1973 . . . . . . . . . . . . . . .
26,05125,324
24,49023,95222,65321,73420,782
18,66818,21717,58716,67316,192
15,70815,26813,27912,85712,536
12,05611,71811,20610,68510,029
9,6978,2628,0847,7407,314
6,5276,5006,034(NA)(NA)(NA)
4,7654,620
4,5684,3344,0143,8443,843
3,8773,9514,0894,1534,018
3,9563,6683,0082,8962,616
2,5012,5092,4062,4112,254
2,1481,9631,6421,5631,232
1,0981,1641,212(NA)(NA)(NA)
18.318.2
18.718.117.717.718.5
20.821.723.324.924.8
25.224.022.722.520.9
20.721.421.522.622.5
22.523.820.320.216.8
16.817.920.1(NA)(NA)(NA)
2,3152,194
2,0802,0531,8961,8221,661
1,6961,6171,5161,4581,428
1,3901,2981,1431,0911,024
1,005885906915819
782596568582574
539518464
(NA)(NA)(NA)
460403
406439413381340
356384370342323
297287237245211
225243204219176
173159146179154
12511312813711795
19.918.4
19.521.421.820.920.5
21.023.824.423.522.6
21.422.120.822.520.6
22.427.522.523.921.5
22.126.625.730.826.8
23.221.927.732.628.924.9
(NA) Not available.1 For 2004, figures are revised to reflect a correction to the weights in the 2005 ASEC.2 Consistent with 2001 data through implementation of Census 2000-based population controls and a 28,000 household sample expansion.3 For 1999, figures are based on Census 2000 population controls.4 For 1992, figures are based on 1990 census population controls.5 For 1991, figures are revised to correct for nine omitted weights from the original March 1992 CPS file.6 For 1988 and 1987, figures are based on new processing procedures and are also revised to reflect corrections to the files after publication of the 1988 advance
report Money Income and Poverty Status in the United States: 1988, P-60, No. 166.7 The 2003 CPS allowed respondents to choose more than one race. White alone refers to people who reported White and did not report any other race category. The
use of this single-race population does not imply that it is the preferred method of presenting or analyzing data. The Census Bureau uses a variety of approaches.Information on people who reported more than one race, such as White and American Indian and Alaska Native or Asian and Black or African American, is available fromCensus 2000 through American FactFinder. About 2.6 percent of people reported more than one race in Census 2000.
8 For 2001 and earlier years, the CPS allowed respondents to report only one race group. The reference race groups for 2001 and earlier poverty data are White,non-Hispanic White, Black, and Asian and Pacific Islander.
9 Black alone refers to people who reported Black and did not report any other race.10 Asian alone refers to people who reported Asian and did not report any other race.
Note: Prior to 1979, people in unrelated subfamilies were included in people in families. Beginning in 1979, people in unrelated subfamilies are included in all peoplebut are excluded from people in families.
Source: U.S. Census Bureau, Current Population Survey, 1960 to 2006 Annual Social and Economic Supplements.

58 Income, Poverty, and Health Insurance Coverage in the United States: 2005 U.S. Census Bureau
Table B-3.Poverty Status of Families by Type of Family: 1959 to 2005(Numbers in thousands. Families as of March of the following year)
Race, Hispanic origin,and year
All families Married-couple families Male householder,no wife present
Female householder,no husband present
Total
Below poverty
Total
Below poverty
Total
Below poverty
Total
Below poverty
Number Percent Number Percent Number Percent Number Percent
ALL RACES
2005 . . . . . . . . . . . . . . . . . . . . . . 77,418 7,657 9.9 58,189 2,944 5.1 5,134 669 13.0 14,095 4,044 28.720041 . . . . . . . . . . . . . . . . . . . . . 76,866 7,835 10.2 57,983 3,216 5.5 4,901 657 13.4 13,981 3,962 28.3
2003 . . . . . . . . . . . . . . . . . . . . . 76,232 7,607 10.0 57,725 3,115 5.4 4,717 636 13.5 13,791 3,856 28.02002 . . . . . . . . . . . . . . . . . . . . . 75,616 7,229 9.6 57,327 3,052 5.3 4,663 564 12.1 13,626 3,613 26.52001 . . . . . . . . . . . . . . . . . . . . . 74,340 6,813 9.2 56,755 2,760 4.9 4,440 583 13.1 13,146 3,470 26.420002 . . . . . . . . . . . . . . . . . . . . . 73,778 6,400 8.7 56,598 2,637 4.7 4,277 485 11.3 12,903 3,278 25.419993 . . . . . . . . . . . . . . . . . . . . . 73,206 6,792 9.3 56,290 2,748 4.9 4,099 485 11.8 12,818 3,559 27.8
1998 . . . . . . . . . . . . . . . . . . . . . 71,551 7,186 10.0 54,778 2,879 5.3 3,977 476 12.0 12,796 3,831 29.91997 . . . . . . . . . . . . . . . . . . . . . 70,884 7,324 10.3 54,321 2,821 5.2 3,911 507 13.0 12,652 3,995 31.61996 . . . . . . . . . . . . . . . . . . . . . 70,241 7,708 11.0 53,604 3,010 5.6 3,847 531 13.8 12,790 4,167 32.61995 . . . . . . . . . . . . . . . . . . . . . 69,597 7,532 10.8 53,570 2,982 5.6 3,513 493 14.0 12,514 4,057 32.41994 . . . . . . . . . . . . . . . . . . . . . 69,313 8,053 11.6 53,865 3,272 6.1 3,228 549 17.0 12,220 4,232 34.6
1993 . . . . . . . . . . . . . . . . . . . . . 68,506 8,393 12.3 53,181 3,481 6.5 2,914 488 16.8 12,411 4,424 35.619924 . . . . . . . . . . . . . . . . . . . . . 68,216 8,144 11.9 53,090 3,385 6.4 3,065 484 15.8 12,061 4,275 35.419915 . . . . . . . . . . . . . . . . . . . . . 67,175 7,712 11.5 52,457 3,158 6.0 3,025 392 13.0 11,693 4,161 35.61990 . . . . . . . . . . . . . . . . . . . . . 66,322 7,098 10.7 52,147 2,981 5.7 2,907 349 12.0 11,268 3,768 33.41989 . . . . . . . . . . . . . . . . . . . . . 66,090 6,784 10.3 52,317 2,931 5.6 2,884 348 12.1 10,890 3,504 32.2
19886 . . . . . . . . . . . . . . . . . . . . . 65,837 6,874 10.4 52,100 2,897 5.6 2,847 336 11.8 10,890 3,642 33.419876 . . . . . . . . . . . . . . . . . . . . . 65,204 7,005 10.7 51,675 3,011 5.8 2,833 340 12.0 10,696 3,654 34.21986 . . . . . . . . . . . . . . . . . . . . . 64,491 7,023 10.9 51,537 3,123 6.1 2,510 287 11.4 10,445 3,613 34.61985 . . . . . . . . . . . . . . . . . . . . . 63,558 7,223 11.4 50,933 3,438 6.7 2,414 311 12.9 10,211 3,474 34.01984 . . . . . . . . . . . . . . . . . . . . . 62,706 7,277 11.6 50,350 3,488 6.9 2,228 292 13.1 10,129 3,498 34.5
1983 . . . . . . . . . . . . . . . . . . . . . 62,015 7,647 12.3 50,081 3,815 7.6 2,038 268 13.2 9,896 3,564 36.01982 . . . . . . . . . . . . . . . . . . . . . 61,393 7,512 12.2 49,908 3,789 7.6 2,016 290 14.4 9,469 3,434 36.31981 . . . . . . . . . . . . . . . . . . . . . 61,019 6,851 11.2 49,630 3,394 6.8 1,986 205 10.3 9,403 3,252 34.61980 . . . . . . . . . . . . . . . . . . . . . 60,309 6,217 10.3 49,294 3,032 6.2 1,933 213 11.0 9,082 2,972 32.71979 . . . . . . . . . . . . . . . . . . . . . 59,550 5,461 9.2 49,112 2,640 5.4 1,733 176 10.2 8,705 2,645 30.4
1978 . . . . . . . . . . . . . . . . . . . . . 57,804 5,280 9.1 47,692 2,474 5.2 1,654 152 9.2 8,458 2,654 31.41977 . . . . . . . . . . . . . . . . . . . . . 57,215 5,311 9.3 47,385 2,524 5.3 1,594 177 11.1 8,236 2,610 31.71976 . . . . . . . . . . . . . . . . . . . . . 56,710 5,311 9.4 47,497 2,606 5.5 1,500 162 10.8 7,713 2,543 33.01975 . . . . . . . . . . . . . . . . . . . . . 56,245 5,450 9.7 47,318 2,904 6.1 1,445 116 8.0 7,482 2,430 32.51974 . . . . . . . . . . . . . . . . . . . . . 55,698 4,922 8.8 47,069 2,474 5.3 1,399 125 8.9 7,230 2,324 32.1
1973 . . . . . . . . . . . . . . . . . . . . . 55,053 4,828 8.8 46,812 2,482 5.3 1,438 154 10.7 6,804 2,193 32.21972 . . . . . . . . . . . . . . . . . . . . . 54,373 5,075 9.3 46,314 (NA) (NA) 1,452 (NA) (NA) 6,607 2,158 32.71971 . . . . . . . . . . . . . . . . . . . . . 53,296 5,303 10.0 45,752 (NA) (NA) 1,353 (NA) (NA) 6,191 2,100 33.91970 . . . . . . . . . . . . . . . . . . . . . 52,227 5,260 10.1 44,739 (NA) (NA) 1,487 (NA) (NA) 6,001 1,952 32.51969 . . . . . . . . . . . . . . . . . . . . . 51,586 5,008 9.7 44,436 (NA) (NA) 1,559 (NA) (NA) 5,591 1,827 32.7
1968 . . . . . . . . . . . . . . . . . . . . . 50,511 5,047 10.0 43,842 (NA) (NA) 1,228 (NA) (NA) 5,441 1,755 32.31967 . . . . . . . . . . . . . . . . . . . . . 49,835 5,667 11.4 43,292 (NA) (NA) 1,210 (NA) (NA) 5,333 1,774 33.31966 . . . . . . . . . . . . . . . . . . . . . 48,921 5,784 11.8 42,553 (NA) (NA) 1,197 (NA) (NA) 5,171 1,721 33.11965 . . . . . . . . . . . . . . . . . . . . . 48,278 6,721 13.9 42,107 (NA) (NA) 1,179 (NA) (NA) 4,992 1,916 38.41964 . . . . . . . . . . . . . . . . . . . . . 47,836 7,160 15.0 41,648 (NA) (NA) 1,182 (NA) (NA) 5,006 1,822 36.4
1963 . . . . . . . . . . . . . . . . . . . . . 47,436 7,554 15.9 41,311 (NA) (NA) 1,243 (NA) (NA) 4,882 1,972 40.41962 . . . . . . . . . . . . . . . . . . . . . 46,998 8,077 17.2 40,923 (NA) (NA) 1,334 (NA) (NA) 4,741 2,034 42.91961 . . . . . . . . . . . . . . . . . . . . . 46,341 8,391 18.1 40,405 (NA) (NA) 1,293 (NA) (NA) 4,643 1,954 42.11960 . . . . . . . . . . . . . . . . . . . . . 45,435 8,243 18.1 39,624 (NA) (NA) 1,202 (NA) (NA) 4,609 1,955 42.41959 . . . . . . . . . . . . . . . . . . . . . 45,054 8,320 18.5 39,335 (NA) (NA) 1,226 (NA) (NA) 4,493 1,916 42.6
(NA) Not available.1 For 2004, figures are revised to reflect a correction to the weights in the 2005 ASEC.2 Consistent with 2001 data through implementation of Census 2000-based population controls and a 28,000 household sample expansion.3 For 1999, figures are based on Census 2000 population controls.4 For 1992, figures are based on 1990 census population controls.5 For 1991, figures are revised to correct for nine omitted weights from the original March 1992 CPS file.6 For 1988 and 1987, figures are based on new processing procedures and are also revised to reflect corrections to the files after publication of the 1988 advance
report Money Income and Poverty Status in the United States: 1988, P-60, No. 166.Note: Before 1979, unrelated subfamilies were included in all families. Beginning in 1979, unrelated subfamilies are excluded from all families.Source: U.S. Census Bureau, Current Population Survey, 1960 to 2006 Annual Social and Economic Supplements.

U.S. Census Bureau Income, Poverty, and Health Insurance Coverage in the United States: 2005 59
APPENDIX C. ESTIMATES OF HEALTH INSURANCE COVERAGE
Quality of Health InsuranceCoverage Estimates
National surveys and health insur-ance coverage. Health insurance cov-erage is likely to be underreported onthe Current Population Survey (CPS).While underreporting affects most, ifnot all, surveys, underreporting ofhealth insurance coverage on theAnnual Social and EconomicSupplement (ASEC) appears to be alarger problem than in other nationalsurveys that ask about insurance.Some reasons for the disparity mayinclude the fact that income, nothealth insurance, is the main focus ofthe ASEC questionnaire. In addition,the ASEC collects health insuranceinformation by asking in Februarythrough April about the previousyear’s coverage. Asking annual retro-spective questions appears to be lessof a problem when collecting incomedata (possibly because the interviewperiod is close to when people paytheir taxes), but it may be less thanideal when asking about health insur-ance coverage. Compared with othernational surveys, the CPS estimate ofthe number of people without healthinsurance more closely approximatesthe number of people who are unin-sured at a specific point in time
during the year than the number ofpeople uninsured for the entire year.For a comparison of health insurancecoverage rates from the major federalsurveys, see How Many People LackInsurance and For How Long?(Congressional Budget Office, May 2003).
Reporting of coverage through majorfederal health insurance programs.The CPS ASEC data underreportMedicare and Medicaid coverage com-pared with enrollment and participa-tion data from the Centers forMedicare and Medicaid Services(CMS).1 Because the CPS is largely alabor force survey, interviewersreceive less training on health insur-ance concepts than labor concepts.Additionally, many people may not beaware that a health insurance pro-gram covers them or their children ifthey have not used covered servicesrecently. CMS data, on the otherhand, represent the actual number ofpeople who have enrolled or partici-pated in these programs.
Changes in Medicaid coverage esti-mates from one year to the next
1 CMS is the federal agency primarily respon-sible for administering the Medicare andMedicaid programs at the national level.
should be viewed with caution.Because many people who are cov-ered by Medicaid do not report thatcoverage, the U.S. Census Bureauassigns coverage to those who aregenerally regarded as “categoricallyeligible” (those who received someother benefits, usually public assis-tance payments, that make them eli-gible for Medicaid). Since the numberof people receiving public assistancehas been dropping, the relationshipbetween Medicaid coverage and pub-lic assistance has changed, causingthe imputation process to introduce adownward bias in the most recentMedicaid estimates.
After consulting with health insuranceexperts, the Census Bureau modifiedthe definition of the population with-out health insurance in the supple-ment to the March 1998 CPS, whichcollected data about coverage in1997. Previously, people with nocoverage other than access to theIndian Health Service were counted aspart of the insured population.Subsequently, the Census Bureau hascounted these people as uninsured.The effect of this change on the over-all estimates of health insurance cov-erage was negligible.
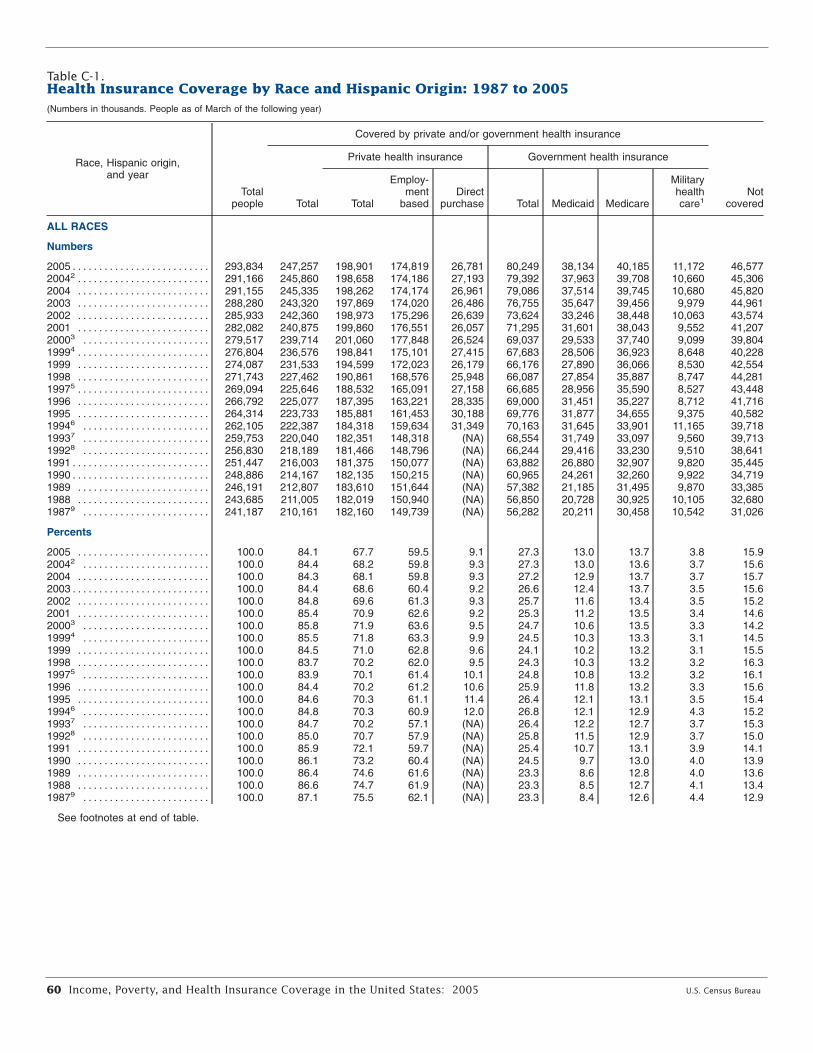
60 Income, Poverty, and Health Insurance Coverage in the United States: 2005 U.S. Census Bureau
Table C-1.Health Insurance Coverage by Race and Hispanic Origin: 1987 to 2005(Numbers in thousands. People as of March of the following year)
Race, Hispanic origin,and year
Totalpeople
Covered by private and/or government health insurance
NotcoveredTotal
Private health insurance Government health insurance
Total
Employ-ment
basedDirect
purchase Total Medicaid Medicare
Militaryhealth
1care
ALL RACES
Numbers
2005 . . . . . . . . . . . . . . . . . . . . . . . . . . 293,834 247,257 198,901 174,819 26,781 80,249 38,134 40,185 11,172 46,57720042 . . . . . . . . . . . . . . . . . . . . . . . . . 291,166 245,860 198,658 174,186 27,193 79,392 37,963 39,708 10,660 45,3062004 . . . . . . . . . . . . . . . . . . . . . . . . . 291,155 245,335 198,262 174,174 26,961 79,086 37,514 39,745 10,680 45,8202003 . . . . . . . . . . . . . . . . . . . . . . . . . 288,280 243,320 197,869 174,020 26,486 76,755 35,647 39,456 9,979 44,9612002 . . . . . . . . . . . . . . . . . . . . . . . . . 285,933 242,360 198,973 175,296 26,639 73,624 33,246 38,448 10,063 43,5742001 . . . . . . . . . . . . . . . . . . . . . . . . . 282,082 240,875 199,860 176,551 26,057 71,295 31,601 38,043 9,552 41,20720003 . . . . . . . . . . . . . . . . . . . . . . . . 279,517 239,714 201,060 177,848 26,524 69,037 29,533 37,740 9,099 39,80419994 . . . . . . . . . . . . . . . . . . . . . . . . . 276,804 236,576 198,841 175,101 27,415 67,683 28,506 36,923 8,648 40,2281999 . . . . . . . . . . . . . . . . . . . . . . . . . 274,087 231,533 194,599 172,023 26,179 66,176 27,890 36,066 8,530 42,5541998 . . . . . . . . . . . . . . . . . . . . . . . . . 271,743 227,462 190,861 168,576 25,948 66,087 27,854 35,887 8,747 44,28119975 . . . . . . . . . . . . . . . . . . . . . . . . . 269,094 225,646 188,532 165,091 27,158 66,685 28,956 35,590 8,527 43,4481996 . . . . . . . . . . . . . . . . . . . . . . . . . 266,792 225,077 187,395 163,221 28,335 69,000 31,451 35,227 8,712 41,7161995 . . . . . . . . . . . . . . . . . . . . . . . . . 264,314 223,733 185,881 161,453 30,188 69,776 31,877 34,655 9,375 40,58219946 . . . . . . . . . . . . . . . . . . . . . . . . 262,105 222,387 184,318 159,634 31,349 70,163 31,645 33,901 11,165 39,71819937 . . . . . . . . . . . . . . . . . . . . . . . . 259,753 220,040 182,351 148,318 (NA) 68,554 31,749 33,097 9,560 39,71319928 . . . . . . . . . . . . . . . . . . . . . . . . 256,830 218,189 181,466 148,796 (NA) 66,244 29,416 33,230 9,510 38,6411991 . . . . . . . . . . . . . . . . . . . . . . . . . . 251,447 216,003 181,375 150,077 (NA) 63,882 26,880 32,907 9,820 35,4451990 . . . . . . . . . . . . . . . . . . . . . . . . . . 248,886 214,167 182,135 150,215 (NA) 60,965 24,261 32,260 9,922 34,7191989 . . . . . . . . . . . . . . . . . . . . . . . . . 246,191 212,807 183,610 151,644 (NA) 57,382 21,185 31,495 9,870 33,3851988 . . . . . . . . . . . . . . . . . . . . . . . . . 243,685 211,005 182,019 150,940 (NA) 56,850 20,728 30,925 10,105 32,68019879 . . . . . . . . . . . . . . . . . . . . . . . . 241,187 210,161 182,160 149,739 (NA) 56,282 20,211 30,458 10,542 31,026
Percents
2005 . . . . . . . . . . . . . . . . . . . . . . . . . 100.0 84.1 67.7 59.5 9.1 27.3 13.0 13.7 3.8 15.920042 . . . . . . . . . . . . . . . . . . . . . . . . 100.0 84.4 68.2 59.8 9.3 27.3 13.0 13.6 3.7 15.62004 . . . . . . . . . . . . . . . . . . . . . . . . . 100.0 84.3 68.1 59.8 9.3 27.2 12.9 13.7 3.7 15.72003 . . . . . . . . . . . . . . . . . . . . . . . . . . 100.0 84.4 68.6 60.4 9.2 26.6 12.4 13.7 3.5 15.62002 . . . . . . . . . . . . . . . . . . . . . . . . . 100.0 84.8 69.6 61.3 9.3 25.7 11.6 13.4 3.5 15.22001 . . . . . . . . . . . . . . . . . . . . . . . . . 100.0 85.4 70.9 62.6 9.2 25.3 11.2 13.5 3.4 14.620003 . . . . . . . . . . . . . . . . . . . . . . . . 100.0 85.8 71.9 63.6 9.5 24.7 10.6 13.5 3.3 14.219994 . . . . . . . . . . . . . . . . . . . . . . . . 100.0 85.5 71.8 63.3 9.9 24.5 10.3 13.3 3.1 14.51999 . . . . . . . . . . . . . . . . . . . . . . . . . 100.0 84.5 71.0 62.8 9.6 24.1 10.2 13.2 3.1 15.51998 . . . . . . . . . . . . . . . . . . . . . . . . . 100.0 83.7 70.2 62.0 9.5 24.3 10.3 13.2 3.2 16.319975 . . . . . . . . . . . . . . . . . . . . . . . . 100.0 83.9 70.1 61.4 10.1 24.8 10.8 13.2 3.2 16.11996 . . . . . . . . . . . . . . . . . . . . . . . . . 100.0 84.4 70.2 61.2 10.6 25.9 11.8 13.2 3.3 15.61995 . . . . . . . . . . . . . . . . . . . . . . . . . 100.0 84.6 70.3 61.1 11.4 26.4 12.1 13.1 3.5 15.419946 . . . . . . . . . . . . . . . . . . . . . . . . 100.0 84.8 70.3 60.9 12.0 26.8 12.1 12.9 4.3 15.219937 . . . . . . . . . . . . . . . . . . . . . . . . 100.0 84.7 70.2 57.1 (NA) 26.4 12.2 12.7 3.7 15.319928 . . . . . . . . . . . . . . . . . . . . . . . . 100.0 85.0 70.7 57.9 (NA) 25.8 11.5 12.9 3.7 15.01991 . . . . . . . . . . . . . . . . . . . . . . . . . 100.0 85.9 72.1 59.7 (NA) 25.4 10.7 13.1 3.9 14.11990 . . . . . . . . . . . . . . . . . . . . . . . . . 100.0 86.1 73.2 60.4 (NA) 24.5 9.7 13.0 4.0 13.91989 . . . . . . . . . . . . . . . . . . . . . . . . . 100.0 86.4 74.6 61.6 (NA) 23.3 8.6 12.8 4.0 13.61988 . . . . . . . . . . . . . . . . . . . . . . . . . 100.0 86.6 74.7 61.9 (NA) 23.3 8.5 12.7 4.1 13.419879 . . . . . . . . . . . . . . . . . . . . . . . . 100.0 87.1 75.5 62.1 (NA) 23.3 8.4 12.6 4.4 12.9
See footnotes at end of table.

U.S. Census Bureau Income, Poverty, and Health Insurance Coverage in the United States: 2005 61
Table C-1.Health Insurance Coverage by Race and Hispanic Origin: 1987 to 2005—Con.(Numbers in thousands. People as of March of the following year)
Race, Hispanic origin,and year
Totalpeople
Covered by private and/or government health insurance
NotcoveredTotal
Private health insurance Government health insurance
Total
Employ-ment
basedDirect
purchase Total Medicaid Medicare
Militaryhealth
1care
WHITE ALONE10
Numbers
2005 . . . . . . . . . . . . . . . . . . . . . . . . . 235,903 200,563 165,616 144,669 23,237 62,164 25,989 34,327 9,024 35,34020042 . . . . . . . . . . . . . . . . . . . . . . . . 234,116 199,669 165,651 144,240 23,684 61,520 25,893 34,064 8,562 34,4472004 . . . . . . . . . . . . . . . . . . . . . . . . . 234,077 199,289 165,327 144,246 23,511 61,311 25,586 34,084 8,567 34,7882003 . . . . . . . . . . . . . . . . . . . . . . . . . . 232,254 198,270 165,852 144,780 23,253 59,495 23,959 33,765 8,105 33,9832002 . . . . . . . . . . . . . . . . . . . . . . . . .
Percents
230,809 198,103 167,151 146,210 23,511 57,072 22,171 33,135 8,065 32,706
2005 . . . . . . . . . . . . . . . . . . . . . . . . . 100.0 85.0 70.2 61.3 9.9 26.4 11.0 14.6 3.8 15.02004 2 . . . . . . . . . . . . . . . . . . . . . . . . 100.0 85.3 70.8 61.6 10.1 26.3 11.1 14.6 3.7 14.72004 . . . . . . . . . . . . . . . . . . . . . . . . . 100.0 85.1 70.6 61.6 10.0 26.2 10.9 14.6 3.7 14.92003 . . . . . . . . . . . . . . . . . . . . . . . . . 100.0 85.4 71.4 62.3 10.0 25.6 10.3 14.5 3.5 14.62002 . . . . . . . . . . . . . . . . . . . . . . . . .
WHITE11
Numbers
100.0 85.8 72.4 63.3 10.2 24.7 9.6 14.4 3.5 14.2
2001 . . . . . . . . . . . . . . . . . . . . . . . . . 230,071 198,878 169,180 148,371 23,110 56,200 21,535 33,006 7,788 31,19320003 . . . . . . . . . . . . . . . . . . . . . . . . 228,208 198,133 170,071 149,364 23,474 54,287 19,889 32,695 7,158 30,07519994 . . . . . . . . . . . . . . . . . . . . . . . . 225,794 195,929 168,730 147,583 24,213 53,175 18,977 32,144 6,902 29,8651999 . . . . . . . . . . . . . . . . . . . . . . . . . 224,806 192,943 166,191 145,878 23,315 52,139 18,676 31,416 6,848 31,8631998 . . . . . . . . . . . . . . . . . . . . . . . . . 223,294 189,706 163,690 143,705 23,201 51,690 18,247 31,174 7,140 33,58819975 . . . . . . . . . . . . . . . . . . . . . . . . 221,650 188,409 161,682 140,601 24,347 52,975 19,652 31,108 6,994 33,2411996 . . . . . . . . . . . . . . . . . . . . . . . . . 220,070 188,341 161,806 139,913 25,519 54,004 20,856 30,919 6,981 31,7291995 . . . . . . . . . . . . . . . . . . . . . . . . . 218,442 187,337 161,303 139,151 27,337 54,141 20,528 30,580 7,656 31,10519946 . . . . . . . . . . . . . . . . . . . . . . . . 216,751 186,447 160,414 137,966 28,287 54,288 20,464 29,978 8,845 30,30519937 . . . . . . . . . . . . . . . . . . . . . . . . 215,221 184,732 158,586 128,855 (NA) 53,222 20,642 29,297 7,689 30,48919928 . . . . . . . . . . . . . . . . . . . . . . . . 213,198 183,479 158,612 129,685 (NA) 51,195 18,659 29,341 7,556 29,7191991 . . . . . . . . . . . . . . . . . . . . . . . . . 210,257 183,130 159,628 131,646 (NA) 49,699 17,058 28,940 7,867 27,1271990 . . . . . . . . . . . . . . . . . . . . . . . . . 208,754 181,795 160,146 131,836 (NA) 47,589 15,078 28,530 8,022 26,9591989 . . . . . . . . . . . . . . . . . . . . . . . . . 206,983 181,126 161,363 132,882 (NA) 44,868 12,779 27,859 8,116 25,8571988 . . . . . . . . . . . . . . . . . . . . . . . . . 205,333 180,122 160,753 133,050 (NA) 44,477 12,504 27,293 8,305 25,21119879 . . . . . . . . . . . . . . . . . . . . . . . .
Percents
203,745 179,845 161,338 132,264 (NA) 44,028 12,163 27,044 8,482 23,900
2001 . . . . . . . . . . . . . . . . . . . . . . . . . 100.0 86.4 73.5 64.5 10.0 24.4 9.4 14.3 3.4 13.620003 . . . . . . . . . . . . . . . . . . . . . . . . 100.0 86.8 74.5 65.5 10.3 23.8 8.7 14.3 3.1 13.219994 . . . . . . . . . . . . . . . . . . . . . . . . 100.0 86.8 74.7 65.4 10.7 23.6 8.4 14.2 3.1 13.21999 . . . . . . . . . . . . . . . . . . . . . . . . . 100.0 85.8 73.9 64.9 10.4 23.2 8.3 14.0 3.0 14.21998 . . . . . . . . . . . . . . . . . . . . . . . . . 100.0 85.0 73.3 64.4 10.4 23.1 8.2 14.0 3.2 15.019975 . . . . . . . . . . . . . . . . . . . . . . . . 100.0 85.0 72.9 63.4 11.0 23.9 8.9 14.0 3.2 15.01996 . . . . . . . . . . . . . . . . . . . . . . . . . 100.0 85.6 73.5 63.6 11.6 24.5 9.5 14.0 3.2 14.41995 . . . . . . . . . . . . . . . . . . . . . . . . . 100.0 85.8 73.8 63.7 12.5 24.8 9.4 14.0 3.5 14.219946 . . . . . . . . . . . . . . . . . . . . . . . . 100.0 86.0 74.0 63.7 13.1 25.0 9.4 13.8 4.1 14.019937 . . . . . . . . . . . . . . . . . . . . . . . . 100.0 85.8 73.7 59.9 (NA) 24.7 9.6 13.6 3.6 14.219928 . . . . . . . . . . . . . . . . . . . . . . . . 100.0 86.1 74.4 60.8 (NA) 24.0 8.8 13.8 3.5 13.91991 . . . . . . . . . . . . . . . . . . . . . . . . . 100.0 87.1 75.9 62.6 (NA) 23.6 8.1 13.8 3.7 12.91990 . . . . . . . . . . . . . . . . . . . . . . . . . 100.0 87.1 76.7 63.2 (NA) 22.8 7.2 13.7 3.8 12.91989 . . . . . . . . . . . . . . . . . . . . . . . . . 100.0 87.5 78.0 64.2 (NA) 21.7 6.2 13.5 3.9 12.51988 . . . . . . . . . . . . . . . . . . . . . . . . . 100.0 87.7 78.3 64.8 (NA) 21.7 6.1 13.3 4.0 12.319879 . . . . . . . . . . . . . . . . . . . . . . . . 100.0 88.3 79.2 64.9 (NA) 21.6 6.0 13.3 4.2 11.7
See footnotes at end of table.

62 Income, Poverty, and Health Insurance Coverage in the United States: 2005 U.S. Census Bureau
Table C-1.Health Insurance Coverage by Race and Hispanic Origin: 1987 to 2005—Con.(Numbers in thousands. People as of March of the following year)
Race, Hispanic origin,and year
Totalpeople
Covered by private and/or government health insurance
NotcoveredTotal
Private health insurance Government health insurance
Total
Employ-ment
basedDirect
purchase Total Medicaid Medicare
Militaryhealth
1care
WHITE ALONE, NOT HISPANIC
Numbers
2005 . . . . . . . . . . . . . . . . . . . . . . . . . 195,893 173,748 147,974 128,539 21,523 51,215 17,418 31,718 8,279 22,14420042 . . . . . . . . . . . . . . . . . . . . . . . . 195,347 173,541 148,264 128,308 22,056 50,951 17,468 31,627 7,943 21,8072004 . . . . . . . . . . . . . . . . . . . . . . . . . 195,301 173,319 148,069 128,368 21,944 50,806 17,241 31,640 7,952 21,9832003 . . . . . . . . . . . . . . . . . . . . . . . . . 194,877 173,295 149,084 129,261 21,865 49,743 16,247 31,458 7,563 21,5822002 . . . . . . . . . . . . . . . . . . . . . . . . .
Percents
194,421 173,639 150,422 130,801 22,128 47,736 14,984 30,718 7,465 20,782
2005 . . . . . . . . . . . . . . . . . . . . . . . . . 100.0 88.7 75.5 65.6 11.0 26.1 8.9 16.2 4.2 11.320042 . . . . . . . . . . . . . . . . . . . . . . . . 100.0 88.8 75.9 65.7 11.3 26.1 8.9 16.2 4.1 11.22004 . . . . . . . . . . . . . . . . . . . . . . . . . 100.0 88.7 75.8 65.7 11.2 26.0 8.8 16.2 4.1 11.32003 . . . . . . . . . . . . . . . . . . . . . . . . . 100.0 88.9 76.5 66.3 11.2 25.5 8.3 16.1 3.9 11.12002 . . . . . . . . . . . . . . . . . . . . . . . . .
WHITE, NOT HISPANIC
Numbers
100.0 89.3 77.4 67.3 11.4 24.6 7.7 15.8 3.8 10.7
2001 . . . . . . . . . . . . . . . . . . . . . . . . . 194,822 175,412 152,821 133,295 21,796 47,661 15,035 30,811 7,144 19,40920003 . . . . . . . . . . . . . . . . . . . . . . . . 193,931 175,247 153,816 134,253 22,242 46,297 13,788 30,642 6,564 18,68319994 . . . . . . . . . . . . . . . . . . . . . . . . . 192,858 173,958 152,984 133,123 22,882 45,540 13,157 30,256 6,326 18,9011999 . . . . . . . . . . . . . . . . . . . . . . . . . 193,633 172,271 151,539 132,381 22,104 44,749 13,120 29,457 6,306 21,3631998 . . . . . . . . . . . . . . . . . . . . . . . . . 193,074 170,184 149,910 130,956 22,110 44,699 12,985 29,222 6,675 22,89019975 . . . . . . . . . . . . . . . . . . . . . . . . . 192,178 169,043 148,426 128,280 23,349 45,691 14,046 29,213 6,504 23,1351996 . . . . . . . . . . . . . . . . . . . . . . . . . 191,791 169,699 149,262 128,355 24,456 46,772 15,082 29,211 6,537 22,0921995 . . . . . . . . . . . . . . . . . . . . . . . . . 191,271 169,272 149,686 128,378 26,363 46,501 14,381 28,918 7,163 21,99919946 . . . . . . . . . . . . . . . . . . . . . . . . 192,771 170,541 150,181 128,633 27,205 47,475 15,052 28,467 8,318 22,23019937 . . . . . . . . . . . . . . . . . . . . . . . . 191,087 168,306 147,729 119,861 (NA) 46,158 14,980 27,795 7,243 22,78119928 . . . . . . . . . . . . . . . . . . . . . . . . 189,113 167,394 147,967 120,482 (NA) 44,649 13,390 27,853 7,104 21,7191991 . . . . . . . . . . . . . . . . . . . . . . . . . . 189,216 168,810 149,798 123,109 (NA) 44,228 12,750 27,695 7,402 20,4061990 . . . . . . . . . . . . . . . . . . . . . . . . . 188,240 168,015 150,306 123,261 (NA) 42,732 11,423 27,313 7,528 20,2241989 . . . . . . . . . . . . . . . . . . . . . . . . . 187,078 167,889 151,424 124,311 (NA) 40,624 9,759 26,738 7,567 19,1881988 . . . . . . . . . . . . . . . . . . . . . . . . . 186,047 167,048 151,009 124,622 (NA) 40,259 9,522 26,224 7,743 19,00019879 . . . . . . . . . . . . . . . . . . . . . . . .
Percents
185,044 166,922 151,817 124,068 (NA) 39,792 9,143 26,054 7,883 18,122
2001 . . . . . . . . . . . . . . . . . . . . . . . . . 100.0 90.0 78.4 68.4 11.2 24.5 7.7 15.8 3.7 10.020003 . . . . . . . . . . . . . . . . . . . . . . . . 100.0 90.4 79.3 69.2 11.5 23.9 7.1 15.8 3.4 9.619994 . . . . . . . . . . . . . . . . . . . . . . . . 100.0 90.2 79.3 69.0 11.9 23.6 6.8 15.7 3.3 9.81999 . . . . . . . . . . . . . . . . . . . . . . . . . 100.0 89.0 78.3 68.4 11.4 23.1 6.8 15.2 3.3 11.01998 . . . . . . . . . . . . . . . . . . . . . . . . . 100.0 88.1 77.6 67.8 11.5 23.2 6.7 15.1 3.5 11.919975 . . . . . . . . . . . . . . . . . . . . . . . . 100.0 88.0 77.2 66.8 12.1 23.8 7.3 15.2 3.4 12.01996 . . . . . . . . . . . . . . . . . . . . . . . . . 100.0 88.5 77.8 66.9 12.8 24.4 7.9 15.2 3.4 11.51995 . . . . . . . . . . . . . . . . . . . . . . . . . 100.0 88.5 78.3 67.1 13.8 24.3 7.5 15.1 3.7 11.519946 . . . . . . . . . . . . . . . . . . . . . . . . 100.0 88.5 77.9 66.7 14.1 24.6 7.8 14.8 4.3 11.519937 . . . . . . . . . . . . . . . . . . . . . . . . 100.0 88.1 77.3 62.7 (NA) 24.2 7.8 14.5 3.8 11.919928 . . . . . . . . . . . . . . . . . . . . . . . . 100.0 88.5 78.2 63.7 (NA) 23.6 7.1 14.7 3.8 11.51991 . . . . . . . . . . . . . . . . . . . . . . . . . 100.0 89.2 79.2 65.1 (NA) 23.4 6.7 14.6 3.9 10.81990 . . . . . . . . . . . . . . . . . . . . . . . . . 100.0 89.3 79.8 65.5 (NA) 22.7 6.1 14.5 4.0 10.71989 . . . . . . . . . . . . . . . . . . . . . . . . . 100.0 89.7 80.9 66.4 (NA) 21.7 5.2 14.3 4.0 10.31988 . . . . . . . . . . . . . . . . . . . . . . . . . 100.0 89.8 81.2 67.0 (NA) 21.6 5.1 14.1 4.2 10.219879 . . . . . . . . . . . . . . . . . . . . . . . . 100.0 90.2 82.0 67.0 (NA) 21.5 4.9 14.1 4.3 9.8
See footnotes at end of table.

U.S. Census Bureau Income, Poverty, and Health Insurance Coverage in the United States: 2005 63
Table C-1.Health Insurance Coverage by Race and Hispanic Origin: 1987 to 2005—Con.(Numbers in thousands. People as of March of the following year)
Race, Hispanic origin,and year
Totalpeople
Covered by private and/or government health insurance
NotcoveredTotal
Private health insurance Government health insurance
Total
Employ-ment
basedDirect
purchase Total Medicaid Medicare
Militaryhealth
1care
BLACK ALONE OR INCOMBINATION
Numbers
2005 . . . . . . . . . . . . . . . . . . . . . . . . . 38,729 31,251 20,644 18,868 1,983 13,867 9,731 4,191 1,439 7,47820042 . . . . . . . . . . . . . . . . . . . . . . . . 38,179 30,857 20,547 18,910 1,879 13,579 9,561 3,996 1,428 7,3232004 . . . . . . . . . . . . . . . . . . . . . . . . . 38,161 30,714 20,457 18,885 1,825 13,501 9,451 4,000 1,446 7,4472003 . . . . . . . . . . . . . . . . . . . . . . . . . 37,651 30,344 20,136 18,669 1,732 13,195 9,292 4,080 1,283 7,3072002 . . . . . . . . . . . . . . . . . . . . . . . . .
Percents
37,350 29,921 20,231 18,837 1,621 12,624 8,744 3,851 1,342 7,429
2005 . . . . . . . . . . . . . . . . . . . . . . . . . . 100.0 80.7 53.3 48.7 5.1 35.8 25.1 10.8 3.7 19.320042 . . . . . . . . . . . . . . . . . . . . . . . . 100.0 80.8 53.8 49.5 4.9 35.6 25.0 10.5 3.7 19.22004 . . . . . . . . . . . . . . . . . . . . . . . . . 100.0 80.5 53.6 49.5 4.8 35.4 24.8 10.5 3.8 19.52003 . . . . . . . . . . . . . . . . . . . . . . . . . 100.0 80.6 53.5 49.6 4.6 35.0 24.7 10.8 3.4 19.42002 . . . . . . . . . . . . . . . . . . . . . . . . .
BLACK ALONE12
Numbers
100.0 80.1 54.2 50.4 4.3 33.8 23.4 10.3 3.6 19.9
2005 . . . . . . . . . . . . . . . . . . . . . . . . . 36,965 29,738 19,677 18,003 1,892 13,171 9,156 4,115 1,358 7,22820042 . . . . . . . . . . . . . . . . . . . . . . . . 36,548 29,476 19,662 18,134 1,775 12,951 9,047 3,921 1,351 7,0712004 . . . . . . . . . . . . . . . . . . . . . . . . . 36,546 29,360 19,596 18,122 1,732 12,878 8,943 3,925 1,369 7,1862003 . . . . . . . . . . . . . . . . . . . . . . . . . 36,121 29,041 19,320 17,924 1,663 12,585 8,797 3,989 1,225 7,0802002 . . . . . . . . . . . . . . . . . . . . . . . . .
Percents
35,806 28,578 19,347 18,002 1,571 12,058 8,289 3,776 1,268 7,228
2005 . . . . . . . . . . . . . . . . . . . . . . . . . 100.0 80.4 53.2 48.7 5.1 35.6 24.8 11.1 3.7 19.620042 . . . . . . . . . . . . . . . . . . . . . . . . 100.0 80.7 53.8 49.6 4.9 35.4 24.8 10.7 3.7 19.32004 . . . . . . . . . . . . . . . . . . . . . . . . . 100.0 80.3 53.6 49.6 4.7 35.2 24.5 10.7 3.7 19.72003 . . . . . . . . . . . . . . . . . . . . . . . . . 100.0 80.4 53.5 49.6 4.6 34.8 24.4 11.0 3.4 19.62002 . . . . . . . . . . . . . . . . . . . . . . . . .
See footnotes at end of table.
100.0 79.8 54.0 50.3 4.4 33.7 23.1 10.5 3.5 20.2

64 Income, Poverty, and Health Insurance Coverage in the United States: 2005 U.S. Census Bureau
Table C-1.Health Insurance Coverage by Race and Hispanic Origin: 1987 to 2005—Con.(Numbers in thousands. People as of March of the following year)
Race, Hispanic origin,and year
Totalpeople
Covered by private and/or government health insurance
NotcoveredTotal
Private health insurance Government health insurance
Total
Employ-ment
basedDirect
purchase Total Medicaid Medicare
Militaryhealth
1care
BLACK11
Numbers
2001 . . . . . . . . . . . . . . . . . . . . . . . . . 36,023 29,190 20,363 18,975 1,696 11,616 7,994 3,783 1,192 6,83320003 . . . . . . . . . . . . . . . . . . . . . . . . 35,597 28,915 20,485 18,922 1,893 11,579 7,735 3,871 1,372 6,68319994 . . . . . . . . . . . . . . . . . . . . . . . . 35,893 28,775 20,442 18,854 2,065 11,361 7,652 3,615 1,216 7,1191999 . . . . . . . . . . . . . . . . . . . . . . . . . 35,509 27,973 19,805 18,363 1,912 11,165 7,495 3,588 1,198 7,5361998 . . . . . . . . . . . . . . . . . . . . . . . . . 35,070 27,274 18,663 17,132 1,782 11,524 7,903 3,703 1,111 7,79719975 . . . . . . . . . . . . . . . . . . . . . . . . 34,598 27,166 18,544 17,077 1,841 11,157 7,750 3,573 1,100 7,4321996 . . . . . . . . . . . . . . . . . . . . . . . . . 34,218 26,799 17,718 16,358 1,745 12,074 8,572 3,393 1,357 7,4191995 . . . . . . . . . . . . . . . . . . . . . . . . . 33,889 26,781 17,106 15,683 1,815 12,465 9,184 3,316 1,171 7,10819946 . . . . . . . . . . . . . . . . . . . . . . . . 33,531 26,928 17,147 15,607 2,147 12,693 9,007 3,167 1,683 6,60319937 . . . . . . . . . . . . . . . . . . . . . . . . 33,040 26,279 16,590 13,693 (NA) 12,588 9,283 3,072 1,331 6,76119928 . . . . . . . . . . . . . . . . . . . . . . . . 32,535 25,967 15,994 13,545 (NA) 12,464 9,122 3,154 1,459 6,5671991 . . . . . . . . . . . . . . . . . . . . . . . . . 31,439 24,932 15,466 13,297 (NA) 11,776 8,352 3,248 1,482 6,5071990 . . . . . . . . . . . . . . . . . . . . . . . . . 30,895 24,802 15,957 13,560 (NA) 11,150 7,809 3,106 1,402 6,0931989 . . . . . . . . . . . . . . . . . . . . . . . . . 30,392 24,550 16,520 14,187 (NA) 10,443 7,123 3,043 1,340 5,8431988 . . . . . . . . . . . . . . . . . . . . . . . . . 29,904 24,029 15,818 13,418 (NA) 10,415 7,049 3,064 1,385 5,87519879 . . . . . . . . . . . . . . . . . . . . . . . .
Percents
29,417 23,555 15,358 13,055 (NA) 10,380 7,046 2,918 1,497 5,862
2001 . . . . . . . . . . . . . . . . . . . . . . . . . . 100.0 81.0 56.5 52.7 4.7 32.2 22.2 10.5 3.3 19.020003 . . . . . . . . . . . . . . . . . . . . . . . . 100.0 81.2 57.5 53.2 5.3 32.5 21.7 10.9 3.9 18.819994 . . . . . . . . . . . . . . . . . . . . . . . . 100.0 80.2 57.0 52.5 5.8 31.7 21.3 10.1 3.4 19.81999 . . . . . . . . . . . . . . . . . . . . . . . . . 100.0 78.8 55.8 51.7 5.4 31.4 21.1 10.1 3.4 21.21998 . . . . . . . . . . . . . . . . . . . . . . . . . 100.0 77.8 53.2 48.9 5.1 32.9 22.5 10.6 3.2 22.219975 . . . . . . . . . . . . . . . . . . . . . . . . 100.0 78.5 53.6 49.4 5.3 32.2 22.4 10.3 3.2 21.51996 . . . . . . . . . . . . . . . . . . . . . . . . . 100.0 78.3 51.8 47.8 5.1 35.3 25.1 9.9 4.0 21.71995 . . . . . . . . . . . . . . . . . . . . . . . . . 100.0 79.0 50.5 46.3 5.4 36.8 27.1 9.8 3.5 21.019946 . . . . . . . . . . . . . . . . . . . . . . . . 100.0 80.3 51.1 46.5 6.4 37.9 26.9 9.4 5.0 19.719937 . . . . . . . . . . . . . . . . . . . . . . . . 100.0 79.5 50.2 41.4 (NA) 38.1 28.1 9.3 4.0 20.519928 . . . . . . . . . . . . . . . . . . . . . . . . 100.0 79.8 49.2 41.6 (NA) 38.3 28.0 9.7 4.5 20.21991 . . . . . . . . . . . . . . . . . . . . . . . . . 100.0 79.3 49.2 42.3 (NA) 37.5 26.6 10.3 4.7 20.71990 . . . . . . . . . . . . . . . . . . . . . . . . . 100.0 80.3 51.6 43.9 (NA) 36.1 25.3 10.1 4.5 19.71989 . . . . . . . . . . . . . . . . . . . . . . . . . 100.0 80.8 54.4 46.7 (NA) 34.4 23.4 10.0 4.4 19.21988 . . . . . . . . . . . . . . . . . . . . . . . . . 100.0 80.4 52.9 44.9 (NA) 34.8 23.6 10.2 4.6 19.619879 . . . . . . . . . . . . . . . . . . . . . . . .
ASIAN ALONE OR INCOMBINATION
Numbers
100.0 80.1 52.2 44.4 (NA) 35.3 24.0 9.9 5.1 19.9
2005 . . . . . . . . . . . . . . . . . . . . . . . . . 13,758 11,370 9,756 8,685 1,241 2,565 1,348 1,133 461 2,38820042 . . . . . . . . . . . . . . . . . . . . . . . . 13,307 11,148 9,468 8,294 1,329 2,602 1,393 1,110 438 2,1592004 . . . . . . . . . . . . . . . . . . . . . . . . . 13,373 11,157 9,486 8,305 1,324 2,597 1,377 1,127 433 2,2172003 . . . . . . . . . . . . . . . . . . . . . . . . . 12,905 10,504 8,826 7,829 1,159 2,478 1,385 1,096 355 2,4012002 . . . . . . . . . . . . . . . . . . . . . . . . .
Percents
12,504 10,256 8,639 7,576 1,194 2,341 1,322 1,008 347 2,248
2005 . . . . . . . . . . . . . . . . . . . . . . . . . 100.0 82.6 70.9 63.1 9.0 18.6 9.8 8.2 3.3 17.420042 . . . . . . . . . . . . . . . . . . . . . . . . 100.0 83.8 71.1 62.3 10.0 19.6 10.5 8.3 3.3 16.22004 . . . . . . . . . . . . . . . . . . . . . . . . . 100.0 83.4 70.9 62.1 9.9 19.4 10.3 8.4 3.2 16.62003 . . . . . . . . . . . . . . . . . . . . . . . . . 100.0 81.4 68.4 60.7 9.0 19.2 10.7 8.5 2.8 18.62002 . . . . . . . . . . . . . . . . . . . . . . . . . 100.0 82.0
See footnotes at end of table.
69.1 60.6 9.5 18.7 10.6 8.1 2.8 18.0

U.S. Census Bureau Income, Poverty, and Health Insurance Coverage in the United States: 2005 65
Table C-1.Health Insurance Coverage by Race and Hispanic Origin: 1987 to 2005—Con.(Numbers in thousands. People as of March of the following year)
Race, Hispanic origin,and year
Totalpeople
Covered by private and/or government health insurance
NotcoveredTotal
Private health insurance Government health insurance
Total
Employ-ment
basedDirect
purchase Total Medicaid Medicare
Militaryhealth
1care
ASIAN ALONE13
Numbers
2005 . . . . . . . . . . . . . . . . . . . . . . . . . 12,599 10,342 8,883 7,872 1,175 2,307 1,218 1,103 353 2,25720042 . . . . . . . . . . . . . . . . . . . . . . . . 12,241 10,225 8,678 7,593 1,237 2,400 1,282 1,081 366 2,0162004 . . . . . . . . . . . . . . . . . . . . . . . . . 12,311 10,241 8,704 7,612 1,231 2,396 1,267 1,098 360 2,0702003 . . . . . . . . . . . . . . . . . . . . . . . . . 11,869 9,641 8,143 7,210 1,095 2,244 1,229 1,067 295 2,2282002 . . . . . . . . . . . . . . . . . . . . . . . . .
Percents
11,558 9,426 7,939 6,932 1,137 2,132 1,202 988 270 2,132
2005 . . . . . . . . . . . . . . . . . . . . . . . . . 100.0 82.1 70.5 62.5 9.3 18.3 9.7 8.8 2.8 17.920042 . . . . . . . . . . . . . . . . . . . . . . . . 100.0 83.5 70.9 62.0 10.1 19.6 10.5 8.8 3.0 16.52004 . . . . . . . . . . . . . . . . . . . . . . . . . 100.0 83.2 70.7 61.8 10.0 19.5 10.3 8.9 2.9 16.82003 . . . . . . . . . . . . . . . . . . . . . . . . . 100.0 81.2 68.6 60.7 9.2 18.9 10.4 9.0 2.5 18.82002 . . . . . . . . . . . . . . . . . . . . . . . . .
ASIAN AND PACIFICISLANDER11
Numbers
100.0 81.6 68.7 60.0 9.8 18.4 10.4 8.5 2.3 18.4
2001 . . . . . . . . . . . . . . . . . . . . . . . . . 12,500 10,222 8,643 7,684 1,088 2,312 1,257 949 414 2,27820003 . . . . . . . . . . . . . . . . . . . . . . . . 12,693 10,405 8,916 8,104 994 2,249 1,288 886 443 2,28719994 . . . . . . . . . . . . . . . . . . . . . . . . 11,964 9,673 8,189 7,331 964 2,204 1,179 897 450 2,2921999 . . . . . . . . . . . . . . . . . . . . . . . . . 10,925 8,653 7,285 6,588 805 2,023 1,087 825 412 2,2721998 . . . . . . . . . . . . . . . . . . . . . . . . . 10,897 8,596 7,202 6,511 857 2,113 1,201 819 351 2,30119975 . . . . . . . . . . . . . . . . . . . . . . . . 10,492 8,320 7,100 6,290 848 1,877 1,093 700 334 2,1731996 . . . . . . . . . . . . . . . . . . . . . . . . . 10,071 7,946 6,718 5,888 962 1,768 1,071 667 275 2,1251995 . . . . . . . . . . . . . . . . . . . . . . . . . 9,653 7,671 6,347 5,576 963 2,075 1,272 586 424 1,98219946 . . . . . . . . . . . . . . . . . . . . . . . . 6,656 5,312 4,267 3,774 698 1,551 883 501 426 1,34419937 . . . . . . . . . . . . . . . . . . . . . . . . 7,444 5,927 5,026 3,970 (NA) 1,408 802 474 345 1,51719928 . . . . . . . . . . . . . . . . . . . . . . . . 7,782 6,230 5,202 4,207 (NA) 1,460 823 507 314 1,5521991 . . . . . . . . . . . . . . . . . . . . . . . . . 7,193 5,886 4,917 3,995 (NA) 1,451 727 560 347 1,3071990 . . . . . . . . . . . . . . . . . . . . . . . . . . 7,023 5,832 4,887 3,883 (NA) 1,410 771 463 364 1,1911989 . . . . . . . . . . . . . . . . . . . . . . . . . 6,679 5,532 4,615 3,661 (NA) 1,414 792 444 322 1,1471988 . . . . . . . . . . . . . . . . . . . . . . . . . 6,447 5,329 4,392 3,599 (NA) 1,353 763 401 322 1,11819879 . . . . . . . . . . . . . . . . . . . . . . . .
Percents
6,326 5,440 4,468 3,691 (NA) 1,394 702 357 475 886
2001 . . . . . . . . . . . . . . . . . . . . . . . . . 100.0 81.8 69.1 61.5 8.7 18.5 10.1 7.6 3.3 18.220003 . . . . . . . . . . . . . . . . . . . . . . . . . 100.0 82.0 70.2 63.8 7.8 17.7 10.1 7.0 3.5 18.019994 . . . . . . . . . . . . . . . . . . . . . . . . 100.0 80.8 68.4 61.3 8.1 18.4 9.9 7.5 3.8 19.21999 . . . . . . . . . . . . . . . . . . . . . . . . . 100.0 79.2 66.7 60.3 7.4 18.5 9.9 7.5 3.8 20.81998 . . . . . . . . . . . . . . . . . . . . . . . . . 100.0 78.9 66.1 59.8 7.9 19.4 11.0 7.5 3.2 21.119975 . . . . . . . . . . . . . . . . . . . . . . . . 100.0 79.3 67.7 60.0 8.1 17.9 10.4 6.7 3.2 20.71996 . . . . . . . . . . . . . . . . . . . . . . . . . 100.0 78.9 66.7 58.5 9.5 17.6 10.6 6.6 2.7 21.11995 . . . . . . . . . . . . . . . . . . . . . . . . . 100.0 79.5 65.8 57.8 10.0 21.5 13.2 6.1 4.4 20.519946 . . . . . . . . . . . . . . . . . . . . . . . . 100.0 79.8 64.1 56.7 10.5 23.3 13.3 7.5 6.4 20.219937 . . . . . . . . . . . . . . . . . . . . . . . . 100.0 79.6 67.5 53.3 (NA) 18.9 10.8 6.4 4.6 20.419928 . . . . . . . . . . . . . . . . . . . . . . . . 100.0 80.1 66.8 54.1 (NA) 18.8 10.6 6.5 4.0 19.91991 . . . . . . . . . . . . . . . . . . . . . . . . . 100.0 81.8 68.4 55.5 (NA) 20.2 10.1 7.8 4.8 18.21990 . . . . . . . . . . . . . . . . . . . . . . . . . 100.0 83.0 69.6 55.3 (NA) 20.1 11.0 6.6 5.2 17.01989 . . . . . . . . . . . . . . . . . . . . . . . . . 100.0 82.8 69.1 54.8 (NA) 21.2 11.9 6.6 4.8 17.21988 . . . . . . . . . . . . . . . . . . . . . . . . . 100.0 82.7 68.1 55.8 (NA) 21.0 11.8 6.2 5.0 17.319879 . . . . . . . . . . . . . . . . . . . . . . . . 100.0 86.0 70.6 58.3 (NA) 22.0 11.1 5.6 7.5 14.0
See footnotes at end of table.

66 Income, Poverty, and Health Insurance Coverage in the United States: 2005 U.S. Census Bureau
Table C-1.Health Insurance Coverage by Race and Hispanic Origin: 1987 to 2005—Con.(Numbers in thousands. People as of March of the following year)
Covered by private and/or government health insurance
Private health insurance Government health insuranceRace, Hispanic origin,and year Employ- Military
Total ment Direct health Not1people Total Total based purchase Total Medicaid Medicare care covered
HISPANIC (any race)
Numbers
2005 . . . . . . . . . . . . . . . . . . . . . . . . . 43,168 29,046 19,066 17,426 1,840 11,959 9,357 2,771 870 14,12220042 . . . . . . . . . . . . . . . . . . . . . . . . 41,840 28,336 18,864 17,289 1,766 11,528 9,204 2,614 697 13,5042004 . . . . . . . . . . . . . . . . . . . . . . . . . 41,839 28,160 18,714 17,208 1,698 11,462 9,123 2,618 694 13,6782003 . . . . . . . . . . . . . . . . . . . . . . . . . 40,425 27,188 18,183 16,788 1,551 10,716 8,505 2,462 639 13,2372002 . . . . . . . . . . . . . . . . . . . . . . . . . 39,384 26,627 18,108 16,714 1,469 10,280 7,946 2,535 724 12,7562001 . . . . . . . . . . . . . . . . . . . . . . . . . 37,438 25,021 17,322 15,965 1,390 9,227 7,074 2,295 704 12,41720003 . . . . . . . . . . . . . . . . . . . . . . . . 36,093 24,210 17,114 15,893 1,337 8,566 6,552 2,141 682 11,88319994 . . . . . . . . . . . . . . . . . . . . . . . . 34,773 23,311 16,634 15,275 1,398 8,168 6,253 1,979 626 11,4621999 . . . . . . . . . . . . . . . . . . . . . . . . . 32,804 21,853 15,424 14,214 1,264 7,875 5,946 2,047 589 10,9511998 . . . . . . . . . . . . . . . . . . . . . . . . . 31,689 20,493 14,377 13,310 1,133 7,401 5,585 2,026 503 11,19619975 . . . . . . . . . . . . . . . . . . . . . . . . 30,773 20,239 13,751 12,790 1,028 7,718 5,970 1,974 526 10,5341996 . . . . . . . . . . . . . . . . . . . . . . . . . 29,703 19,730 13,151 12,140 1,105 7,784 6,255 1,806 474 9,9741995 . . . . . . . . . . . . . . . . . . . . . . . . . 28,438 18,964 12,187 11,309 1,011 8,027 6,478 1,732 516 9,47419946 . . . . . . . . . . . . . . . . . . . . . . . . 27,521 18,244 11,743 10,729 1,208 7,829 6,226 1,677 630 9,27719937 . . . . . . . . . . . . . . . . . . . . . . . . 26,646 18,235 12,021 9,981 (NA) 7,873 6,328 1,613 530 8,41119928 . . . . . . . . . . . . . . . . . . . . . . . . 25,682 17,242 11,330 9,786 (NA) 7,099 5,703 1,578 523 8,4411991 . . . . . . . . . . . . . . . . . . . . . . . . . 22,096 15,128 10,336 8,972 (NA) 5,845 4,597 1,309 522 6,9681990 . . . . . . . . . . . . . . . . . . . . . . . . . 21,437 14,479 10,281 8,948 (NA) 5,169 3,912 1,269 519 6,9581989 . . . . . . . . . . . . . . . . . . . . . . . . . 20,779 13,846 10,348 8,914 (NA) 4,526 3,221 1,180 595 6,9321988 . . . . . . . . . . . . . . . . . . . . . . . . . 20,076 13,684 10,188 8,831 (NA) 4,414 3,125 1,114 594 6,39119879 . . . . . . . . . . . . . . . . . . . . . . . . 19,428 13,456 9,845 8,490 (NA) 4,482 3,214 1,029 631 5,972
Percents
2005 . . . . . . . . . . . . . . . . . . . . . . . . . 100.0 67.3 44.2 40.4 4.3 27.7 21.7 6.4 2.0 32.720042 . . . . . . . . . . . . . . . . . . . . . . . . 100.0 67.7 45.1 41.3 4.2 27.6 22.0 6.2 1.7 32.32004 . . . . . . . . . . . . . . . . . . . . . . . . . 100.0 67.3 44.7 41.1 4.1 27.4 21.8 6.3 1.7 32.72003 . . . . . . . . . . . . . . . . . . . . . . . . . 100.0 67.3 45.0 41.5 3.8 26.5 21.0 6.1 1.6 32.72002 . . . . . . . . . . . . . . . . . . . . . . . . . 100.0 67.6 46.0 42.4 3.7 26.1 20.2 6.4 1.8 32.42001 . . . . . . . . . . . . . . . . . . . . . . . . . . 100.0 66.8 46.3 42.6 3.7 24.6 18.9 6.1 1.9 33.220003 . . . . . . . . . . . . . . . . . . . . . . . . 100.0 67.1 47.4 44.0 3.7 23.7 18.2 5.9 1.9 32.919994 . . . . . . . . . . . . . . . . . . . . . . . . 100.0 67.0 47.8 43.9 4.0 23.5 18.0 5.7 1.8 33.01999 . . . . . . . . . . . . . . . . . . . . . . . . . . 100.0 66.6 47.0 43.3 3.9 24.0 18.1 6.2 1.8 33.41998 . . . . . . . . . . . . . . . . . . . . . . . . . 100.0 64.7 45.4 42.0 3.6 23.4 17.6 6.4 1.6 35.319975 . . . . . . . . . . . . . . . . . . . . . . . . 100.0 65.8 44.7 41.6 3.3 25.1 19.4 6.4 1.7 34.21996 . . . . . . . . . . . . . . . . . . . . . . . . . 100.0 66.4 44.3 40.9 3.7 26.2 21.1 6.1 1.6 33.61995 . . . . . . . . . . . . . . . . . . . . . . . . . . 100.0 66.7 42.9 39.8 3.6 28.2 22.8 6.1 1.8 33.319946 . . . . . . . . . . . . . . . . . . . . . . . . 100.0 66.3 42.7 39.0 4.4 28.4 22.6 6.1 2.3 33.719937 . . . . . . . . . . . . . . . . . . . . . . . . 100.0 68.4 45.1 37.5 (NA) 29.5 23.7 6.1 2.0 31.619928 . . . . . . . . . . . . . . . . . . . . . . . . 100.0 67.1 44.1 38.1 (NA) 27.6 22.2 6.1 2.0 32.91991 . . . . . . . . . . . . . . . . . . . . . . . . . 100.0 68.5 46.8 40.6 (NA) 26.5 20.8 5.9 2.4 31.51990 . . . . . . . . . . . . . . . . . . . . . . . . . 100.0 67.5 48.0 41.7 (NA) 24.1 18.2 5.9 2.4 32.51989 . . . . . . . . . . . . . . . . . . . . . . . . . 100.0 66.6 49.8 42.9 (NA) 21.8 15.5 5.7 2.9 33.41988 . . . . . . . . . . . . . . . . . . . . . . . . . 100.0 68.2 50.7 44.0 (NA) 22.0 15.6 5.5 3.0 31.819879 . . . . . . . . . . . . . . . . . . . . . . . . 100.0 69.3 50.7 43.7 (NA) 23.1 16.5 5.3 3.2 30.7
(NA) Not available. Respondents were not asked detailed health insurance questions about direct-purchase coverage before the 1995 CPS ASEC.1 Military health care includes CHAMPUS (Comprehensive Health and Medical Plan for Uniformed Services)/Tricare and CHAMPVA (Civilian Health and Medical
Program of the Department of Veterans Affairs), as well as care provided by the Health and Medical Program of the Department of Veterans Affairs and care provided bythe Department of Veterans Affairs and the military.
2 The 2004 data have been revised to reflect a correction to the weights in the 2005 ASEC. The estimates also reflect improvements to the algorithm that assignscoverage to dependents.
3 Implementation of a 28,000 household sample expansion.4 Estimates reflect the results of follow-up verification questions and implementation of Census 2000-based population controls.5 Beginning with the 1998 CPS ASEC, people with no coverage other than access to Indian Health Service are no longer considered covered by health insurance;
instead, they are considered to be uninsured. The effect of this change on the overall estimates of health insurance coverage is negligible; however, the decrease in thenumber of people covered by Medicaid may be partially due to this change.
6 Health insurance questions were redesigned. Increases in estimates of employment-based and military health care coverage may be partially due to questionnairechanges. Overall coverage estimates were not affected.
7 Data collection method changed from paper and pencil to computer-assisted interviewing.8 Implementation of 1990 census population controls.

U.S. Census Bureau Income, Poverty, and Health Insurance Coverage in the United States: 2005 67
9 Implementation of a new CPS ASEC processing system.10 The 2003 CPS asked respondents to choose one or more races. White alone refers to people who reported White and did not report any other race category. The
use of this single-race population does not imply that it is the preferred method of presenting or analyzing data. The Census Bureau uses a variety of approaches.Information on people who reported more than one race, such as White and American Indian and Alaska Native or Asian and Black or African American, is available fromCensus 2000 through American FactFinder. About 2.6 percent of people reported more than one race in Census 2000.
11 The 2001 CPS and earlier years asked respondents to report only one race. The reference groups for these years are White; White, not Hispanic; Black; and Asianand Pacific Islander.
12 Black alone refers to people who reported Black or African American and did not report any other race.13 Asian alone refers to people who reported Asian and did not report any other race.Source: U.S. Census Bureau, Current Population Survey, 1988 to 2006 Annual Social and Economic Supplements.

68 Income, Poverty, and Health Insurance Coverage in the United States: 2005 U.S. Census Bureau
Table C-2.Health Insurance Coverage by Age: 1987 to 2005(Numbers in thousands. People as of March of the following year)
Age and year
Totalpeople
Covered by private and/or government health insurance
NotcoveredTotal
Private health insurance Government health insurance
Total
Employ-ment
basedDirect
purchase Total Medicaid Medicare
Militaryhealth
1care
ALL AGES
Numbers
2005 . . . . . . . . . . . . . . . . . . . . . . . . . . 293,834 247,257 198,901 174,819 26,781 80,249 38,134 40,185 11,172 46,57720042 . . . . . . . . . . . . . . . . . . . . . . . . . 291,166 245,860 198,658 174,186 27,193 79,392 37,963 39,708 10,660 45,3062004 . . . . . . . . . . . . . . . . . . . . . . . . . . 291,155 245,335 198,262 174,174 26,961 79,086 37,514 39,745 10,680 45,8202003 . . . . . . . . . . . . . . . . . . . . . . . . . . 288,280 243,320 197,869 174,020 26,486 76,755 35,647 39,456 9,979 44,9612002 . . . . . . . . . . . . . . . . . . . . . . . . . . 285,933 242,360 198,973 175,296 26,639 73,624 33,246 38,448 10,063 43,5742001 . . . . . . . . . . . . . . . . . . . . . . . . . . 282,082 240,875 199,860 176,551 26,057 71,295 31,601 38,043 9,552 41,20720003 . . . . . . . . . . . . . . . . . . . . . . . . . 279,517 239,714 201,060 177,848 26,524 69,037 29,533 37,740 9,099 39,80419994 . . . . . . . . . . . . . . . . . . . . . . . . . 276,804 236,576 198,841 175,101 27,415 67,683 28,506 36,923 8,648 40,2281999 . . . . . . . . . . . . . . . . . . . . . . . . . . 274,087 231,533 194,599 172,023 26,179 66,176 27,890 36,066 8,530 42,5541998 . . . . . . . . . . . . . . . . . . . . . . . . . . 271,743 227,462 190,861 168,576 25,948 66,087 27,854 35,887 8,747 44,28119975 . . . . . . . . . . . . . . . . . . . . . . . . . 269,094 225,646 188,532 165,091 27,158 66,685 28,956 35,590 8,527 43,4481996 . . . . . . . . . . . . . . . . . . . . . . . . . . 266,792 225,077 187,395 163,221 28,335 69,000 31,451 35,227 8,712 41,7161995 . . . . . . . . . . . . . . . . . . . . . . . . . . 264,314 223,733 185,881 161,453 30,188 69,776 31,877 34,655 9,375 40,58219946 . . . . . . . . . . . . . . . . . . . . . . . . . 262,105 222,387 184,318 159,634 31,349 70,163 31,645 33,901 11,165 39,71819937 . . . . . . . . . . . . . . . . . . . . . . . . . 259,753 220,040 182,351 148,318 (NA) 68,554 31,749 33,097 9,560 39,71319928 . . . . . . . . . . . . . . . . . . . . . . . . . 256,830 218,189 181,466 148,796 (NA) 66,244 29,416 33,230 9,510 38,6411991 . . . . . . . . . . . . . . . . . . . . . . . . . . 251,447 216,003 181,375 150,077 (NA) 63,882 26,880 32,907 9,820 35,445’1990 . . . . . . . . . . . . . . . . . . . . . . . . . . 248,886 214,167 182,135 150,215 (NA) 60,965 24,261 32,260 9,922 34,7191989 . . . . . . . . . . . . . . . . . . . . . . . . . . 246,191 212,807 183,610 151,644 (NA) 57,382 21,185 31,495 9,870 33,3851988 . . . . . . . . . . . . . . . . . . . . . . . . . . 243,685 211,005 182,019 150,940 (NA) 56,850 20,728 30,925 10,105 32,68019879 . . . . . . . . . . . . . . . . . . . . . . . . . 241,187 210,161 182,160 149,739 (NA) 56,282 20,211 30,458 10,542 31,026
Percents
2005 . . . . . . . . . . . . . . . . . . . . . . . . . . 100.0 84.1 67.7 59.5 9.1 27.3 13.0 13.7 3.8 15.920042 . . . . . . . . . . . . . . . . . . . . . . . . . 100.0 84.4 68.2 59.8 9.3 27.3 13.0 13.6 3.7 15.62004 . . . . . . . . . . . . . . . . . . . . . . . . . . 100.0 84.3 68.1 59.8 9.3 27.2 12.9 13.7 3.7 15.72003 . . . . . . . . . . . . . . . . . . . . . . . . . . 100.0 84.4 68.6 60.4 9.2 26.6 12.4 13.7 3.5 15.62002 . . . . . . . . . . . . . . . . . . . . . . . . . . 100.0 84.8 69.6 61.3 9.3 25.7 11.6 13.4 3.5 15.22001 . . . . . . . . . . . . . . . . . . . . . . . . . . 100.0 85.4 70.9 62.6 9.2 25.3 11.2 13.5 3.4 14.620003 . . . . . . . . . . . . . . . . . . . . . . . . . 100.0 85.8 71.9 63.6 9.5 24.7 10.6 13.5 3.3 14.219994 . . . . . . . . . . . . . . . . . . . . . . . . . 100.0 85.5 71.8 63.3 9.9 24.5 10.3 13.3 3.1 14.51999 . . . . . . . . . . . . . . . . . . . . . . . . . . 100.0 84.5 71.0 62.8 9.6 24.1 10.2 13.2 3.1 15.51998 . . . . . . . . . . . . . . . . . . . . . . . . . . 100.0 83.7 70.2 62.0 9.5 24.3 10.3 13.2 3.2 16.319975 . . . . . . . . . . . . . . . . . . . . . . . . . 100.0 83.9 70.1 61.4 10.1 24.8 10.8 13.2 3.2 16.11996 . . . . . . . . . . . . . . . . . . . . . . . . . . 100.0 84.4 70.2 61.2 10.6 25.9 11.8 13.2 3.3 15.61995 . . . . . . . . . . . . . . . . . . . . . . . . . . 100.0 84.6 70.3 61.1 11.4 26.4 12.1 13.1 3.5 15.419946 . . . . . . . . . . . . . . . . . . . . . . . . . 100.0 84.8 70.3 60.9 12.0 26.8 12.1 12.9 4.3 15.219937 . . . . . . . . . . . . . . . . . . . . . . . . . 100.0 84.7 70.2 57.1 (NA) 26.4 12.2 12.7 3.7 15.319928 . . . . . . . . . . . . . . . . . . . . . . . . . 100.0 85.0 70.7 57.9 (NA) 25.8 11.5 12.9 3.7 15.01991 . . . . . . . . . . . . . . . . . . . . . . . . . . 100.0 85.9 72.1 59.7 (NA) 25.4 10.7 13.1 3.9 14.11990 . . . . . . . . . . . . . . . . . . . . . . . . . . 100.0 86.1 73.2 60.4 (NA) 24.5 9.7 13.0 4.0 13.91989 . . . . . . . . . . . . . . . . . . . . . . . . . . 100.0 86.4 74.6 61.6 (NA) 23.3 8.6 12.8 4.0 13.61988 . . . . . . . . . . . . . . . . . . . . . . . . . . 100.0 86.6 74.7 61.9 (NA) 23.3 8.5 12.7 4.1 13.419879 . . . . . . . . . . . . . . . . . . . . . . . . . 100.0 87.1 75.5 62.1 (NA) 23.3 8.4 12.6 4.4 12.9
See footnotes at end of table.

U.S. Census Bureau Income, Poverty, and Health Insurance Coverage in the United States: 2005 69
Table C-2.Health Insurance Coverage by Age: 1987 to 2005—Con.(Numbers in thousands. People as of March of the following year)
Age and year
Totalpeople
Covered by private and/or government health insurance
NotcoveredTotal
Private health insurance Government health insurance
Total
Employ-ment
basedDirect
purchase Total Medicaid Medicare
Militaryhealth
1care
UNDER 18 YEARS
Numbers
2005 . . . . . . . . . . . . . . . . . . . . . . . . . . 73,985 65,675 48,395 44,741 4,033 21,944 19,737 543 2,262 8,31020042 . . . . . . . . . . . . . . . . . . . . . . . . . 73,791 65,842 48,772 45,041 4,247 21,994 19,921 503 2,041 7,9492004 . . . . . . . . . . . . . . . . . . . . . . . . . . 73,821 65,553 48,462 44,892 4,166 21,922 19,847 500 2,045 8,2692003 . . . . . . . . . . . . . . . . . . . . . . . . . . 73,580 65,207 48,475 45,004 3,893 21,389 19,392 483 2,021 8,3732002 . . . . . . . . . . . . . . . . . . . . . . . . . . 73,312 64,781 49,473 46,182 3,864 19,662 17,526 524 2,148 8,5312001 . . . . . . . . . . . . . . . . . . . . . . . . . . 72,628 64,118 49,647 46,439 3,624 18,822 16,502 423 2,381 8,50920003 . . . . . . . . . . . . . . . . . . . . . . . . . 72,314 63,697 50,499 47,431 3,586 17,658 15,090 518 2,563 8,61719994 . . . . . . . . . . . . . . . . . . . . . . . . . 72,281 62,996 50,300 46,834 4,052 16,793 14,697 364 2,076 9,2851999 . . . . . . . . . . . . . . . . . . . . . . . . . . 72,325 62,302 49,822 46,594 3,868 16,579 14,479 355 2,080 10,0231998 . . . . . . . . . . . . . . . . . . . . . . . . . . 72,022 60,949 48,627 45,593 3,666 16,400 14,274 325 2,240 11,07319975 . . . . . . . . . . . . . . . . . . . . . . . . . 71,682 60,939 47,968 44,869 3,672 16,800 14,683 395 2,163 10,7431996 . . . . . . . . . . . . . . . . . . . . . . . . . . 71,224 60,670 47,219 44,054 3,865 17,749 15,502 484 2,291 10,5541995 . . . . . . . . . . . . . . . . . . . . . . . . . . 71,148 61,353 47,021 43,822 4,217 18,755 16,524 348 2,336 9,79519946 . . . . . . . . . . . . . . . . . . . . . . . . . 70,509 60,505 46,266 42,966 4,634 18,559 16,132 228 2,708 10,00319937 . . . . . . . . . . . . . . . . . . . . . . . . . 69,766 60,192 47,017 39,745 (NA) 18,696 16,693 48 2,307 9,57419928 . . . . . . . . . . . . . . . . . . . . . . . . . 68,720 60,005 47,183 40,382 (NA) 17,294 15,109 97 2,378 8,7161991 . . . . . . . . . . . . . . . . . . . . . . . . . . 66,173 57,794 46,114 39,683 (NA) 15,792 13,514 52 2,425 8,3791990 . . . . . . . . . . . . . . . . . . . . . . . . . . 65,290 56,786 46,436 39,981 (NA) 14,300 12,094 88 2,408 8,5041989 . . . . . . . . . . . . . . . . . . . . . . . . . . 64,343 55,795 47,376 40,610 (NA) 12,345 10,100 43 2,425 8,5481988 . . . . . . . . . . . . . . . . . . . . . . . . . . 63,902 55,552 46,944 40,750 (NA) 12,270 9,961 62 2,469 8,35019879 . . . . . . . . . . . . . . . . . . . . . . . . . 63,499 55,306 46,763 40,577 (NA) 12,071 9,681 53 2,567 8,193
Percents
2005 . . . . . . . . . . . . . . . . . . . . . . . . . . 100.0 88.8 65.4 60.5 5.5 29.7 26.7 0.7 3.1 11.220042 . . . . . . . . . . . . . . . . . . . . . . . . . 100.0 89.2 66.1 61.0 5.8 29.8 27.0 0.7 2.8 10.82004 . . . . . . . . . . . . . . . . . . . . . . . . . . 100.0 88.8 65.6 60.8 5.6 29.7 26.9 0.7 2.8 11.22003 . . . . . . . . . . . . . . . . . . . . . . . . . . 100.0 88.6 65.9 61.2 5.3 29.1 26.4 0.7 2.7 11.42002 . . . . . . . . . . . . . . . . . . . . . . . . . . 100.0 88.4 67.5 63.0 5.3 26.8 23.9 0.7 2.9 11.62001 . . . . . . . . . . . . . . . . . . . . . . . . . . 100.0 88.3 68.4 63.9 5.0 25.9 22.7 0.6 3.3 11.720003 . . . . . . . . . . . . . . . . . . . . . . . . . 100.0 88.1 69.8 65.6 5.0 24.4 20.9 0.7 3.5 11.919994 . . . . . . . . . . . . . . . . . . . . . . . . . 100.0 87.2 69.6 64.8 5.6 23.2 20.3 0.5 2.9 12.81999 . . . . . . . . . . . . . . . . . . . . . . . . . . 100.0 86.1 68.9 64.4 5.3 22.9 20.0 0.5 2.9 13.91998 . . . . . . . . . . . . . . . . . . . . . . . . . . 100.0 84.6 67.5 63.3 5.1 22.8 19.8 0.5 3.1 15.419975 . . . . . . . . . . . . . . . . . . . . . . . . . 100.0 85.0 66.9 62.6 5.1 23.4 20.5 0.6 3.0 15.01996 . . . . . . . . . . . . . . . . . . . . . . . . . . 100.0 85.2 66.3 61.9 5.4 24.9 21.8 0.7 3.2 14.81995 . . . . . . . . . . . . . . . . . . . . . . . . . . 100.0 86.2 66.1 61.6 5.9 26.4 23.2 0.5 3.3 13.819946 . . . . . . . . . . . . . . . . . . . . . . . . . 100.0 85.8 65.6 60.9 6.6 26.3 22.9 0.3 3.8 14.219937 . . . . . . . . . . . . . . . . . . . . . . . . . 100.0 86.3 67.4 57.0 (NA) 26.8 23.9 0.1 3.3 13.719928 . . . . . . . . . . . . . . . . . . . . . . . . . 100.0 87.3 68.7 58.8 (NA) 25.2 22.0 0.1 3.5 12.71991 . . . . . . . . . . . . . . . . . . . . . . . . . . 100.0 87.3 69.7 60.0 (NA) 23.9 20.4 0.1 3.7 12.71990 . . . . . . . . . . . . . . . . . . . . . . . . . . 100.0 87.0 71.1 61.2 (NA) 21.9 18.5 0.1 3.7 13.01989 . . . . . . . . . . . . . . . . . . . . . . . . . . 100.0 86.7 73.6 63.1 (NA) 19.2 15.7 0.1 3.8 13.31988 . . . . . . . . . . . . . . . . . . . . . . . . . . 100.0 86.9 73.5 63.8 (NA) 19.2 15.6 0.1 3.9 13.119879 . . . . . . . . . . . . . . . . . . . . . . . . . 100.0 87.1 73.6 63.9 (NA) 19.0 15.2 0.1 4.0 12.9
See footnotes at end of table.

70 Income, Poverty, and Health Insurance Coverage in the United States: 2005 U.S. Census Bureau
Table C-2.Health Insurance Coverage by Age: 1987 to 2005—Con.(Numbers in thousands. People as of March of the following year)
Age and year
Totalpeople
Covered by private and/or government health insurance
NotcoveredTotal
Private health insurance Government health insurance
Total
Employ-ment
basedDirect
purchase Total Medicaid Medicare
Militaryhealth
1care
18 TO 24 YEARS
Numbers
2005 . . . . . . . . . . . . . . . . . . . . . . . . . . 27,965 19,399 16,349 13,180 1,553 4,202 3,292 186 872 8,56620042 . . . . . . . . . . . . . . . . . . . . . . . . . 28,008 19,418 16,388 13,007 1,565 4,107 3,293 208 799 8,5902004 . . . . . . . . . . . . . . . . . . . . . . . . . . 27,972 19,200 16,229 12,966 1,495 4,022 3,196 212 804 8,7722003 . . . . . . . . . . . . . . . . . . . . . . . . . . 27,824 19,410 16,526 13,434 1,596 3,929 3,016 176 902 8,4142002 . . . . . . . . . . . . . . . . . . . . . . . . . . 27,438 19,310 16,562 13,429 1,566 3,738 2,909 183 779 8,1282001 . . . . . . . . . . . . . . . . . . . . . . . . . . 27,312 19,640 17,012 13,766 1,634 3,642 2,831 180 742 7,67320003 . . . . . . . . . . . . . . . . . . . . . . . . . 26,815 19,409 17,086 14,151 1,533 3,361 2,508 207 805 7,40619994 . . . . . . . . . . . . . . . . . . . . . . . . . 26,326 18,990 16,542 13,558 1,564 3,485 2,684 152 787 7,3361999 . . . . . . . . . . . . . . . . . . . . . . . . . . 26,532 18,844 16,438 13,535 1,469 3,450 2,643 152 798 7,6881998 . . . . . . . . . . . . . . . . . . . . . . . . . . 25,967 18,191 15,872 13,108 1,514 3,347 2,538 149 795 7,77619975 . . . . . . . . . . . . . . . . . . . . . . . . . 25,201 17,619 15,256 12,638 1,558 3,283 2,555 155 692 7,5821996 . . . . . . . . . . . . . . . . . . . . . . . . . . 24,987 17,770 15,066 12,423 1,528 3,750 2,909 156 829 7,2171995 . . . . . . . . . . . . . . . . . . . . . . . . . . 24,843 17,847 14,961 12,492 1,688 4,018 3,003 129 1,034 6,99719946 . . . . . . . . . . . . . . . . . . . . . . . . . 25,158 18,446 15,528 12,895 1,854 4,246 3,179 89 1,179 6,71219937 . . . . . . . . . . . . . . . . . . . . . . . . . 25,475 18,645 15,668 11,133 (NA) 4,087 2,976 148 1,115 6,83019928 . . . . . . . . . . . . . . . . . . . . . . . . . 25,717 18,146 15,155 10,981 (NA) 3,826 2,875 178 964 7,5701991 . . . . . . . . . . . . . . . . . . . . . . . . . . 24,436 17,851 15,168 11,474 (NA) 3,405 2,477 163 940 6,5851990 . . . . . . . . . . . . . . . . . . . . . . . . . . 24,901 18,408 15,913 11,999 (NA) 3,270 2,204 161 1,094 6,4931989 . . . . . . . . . . . . . . . . . . . . . . . . . . 25,311 18,954 16,638 12,929 (NA) 3,114 2,057 167 1,031 6,3571988 . . . . . . . . . . . . . . . . . . . . . . . . . . 25,628 19,354 16,965 13,098 (NA) 3,082 2,033 170 1,007 6,27419879 . . . . . . . . . . . . . . . . . . . . . . . . . 26,053 19,945 17,434 13,429 (NA) 3,280 1,968 196 1,273 6,108
Percents
2005 . . . . . . . . . . . . . . . . . . . . . . . . . . 100.0 69.4 58.5 47.1 5.6 15.0 11.8 0.7 3.1 30.620042 . . . . . . . . . . . . . . . . . . . . . . . . . 100.0 69.3 58.5 46.4 5.6 14.7 11.8 0.7 2.9 30.72004 . . . . . . . . . . . . . . . . . . . . . . . . . . 100.0 68.6 58.0 46.4 5.3 14.4 11.4 0.8 2.9 31.42003 . . . . . . . . . . . . . . . . . . . . . . . . . . 100.0 69.8 59.4 48.3 5.7 14.1 10.8 0.6 3.2 30.22002 . . . . . . . . . . . . . . . . . . . . . . . . . . 100.0 70.4 60.4 48.9 5.7 13.6 10.6 0.7 2.8 29.62001 . . . . . . . . . . . . . . . . . . . . . . . . . . 100.0 71.9 62.3 50.4 6.0 13.3 10.4 0.7 2.7 28.120003 . . . . . . . . . . . . . . . . . . . . . . . . . 100.0 72.4 63.7 52.8 5.7 12.5 9.4 0.8 3.0 27.619994 . . . . . . . . . . . . . . . . . . . . . . . . . 100.0 72.1 62.8 51.5 5.9 13.2 10.2 0.6 3.0 27.91999 . . . . . . . . . . . . . . . . . . . . . . . . . . 100.0 71.0 62.0 51.0 5.5 13.0 10.0 0.6 3.0 29.01998 . . . . . . . . . . . . . . . . . . . . . . . . . . 100.0 70.1 61.1 50.5 5.8 12.9 9.8 0.6 3.1 29.919975 . . . . . . . . . . . . . . . . . . . . . . . . . 100.0 69.9 60.5 50.1 6.2 13.0 10.1 0.6 2.7 30.11996 . . . . . . . . . . . . . . . . . . . . . . . . . . 100.0 71.1 60.3 49.7 6.1 15.0 11.6 0.6 3.3 28.91995 . . . . . . . . . . . . . . . . . . . . . . . . . . 100.0 71.8 60.2 50.3 6.8 16.2 12.1 0.5 4.2 28.219946 . . . . . . . . . . . . . . . . . . . . . . . . . 100.0 73.3 61.7 51.3 7.4 16.9 12.6 0.4 4.7 26.719937 . . . . . . . . . . . . . . . . . . . . . . . . . 100.0 73.2 61.5 43.7 (NA) 16.0 11.7 0.6 4.4 26.819928 . . . . . . . . . . . . . . . . . . . . . . . . . 100.0 70.6 58.9 42.7 (NA) 14.9 11.2 0.7 3.7 29.41991 . . . . . . . . . . . . . . . . . . . . . . . . . . 100.0 73.1 62.1 47.0 (NA) 13.9 10.1 0.7 3.8 26.91990 . . . . . . . . . . . . . . . . . . . . . . . . . . 100.0 73.9 63.9 48.2 (NA) 13.1 8.9 0.6 4.4 26.11989 . . . . . . . . . . . . . . . . . . . . . . . . . . 100.0 74.9 65.7 51.1 (NA) 12.3 8.1 0.7 4.1 25.11988 . . . . . . . . . . . . . . . . . . . . . . . . . . 100.0 75.5 66.2 51.1 (NA) 12.0 7.9 0.7 3.9 24.519879 . . . . . . . . . . . . . . . . . . . . . . . . . 100.0 76.6 66.9 51.5 (NA) 12.6 7.6 0.8 4.9 23.4
See footnotes at end of table.

U.S. Census Bureau Income, Poverty, and Health Insurance Coverage in the United States: 2005 71
Table C-2.Health Insurance Coverage by Age: 1987 to 2005—Con.(Numbers in thousands. People as of March of the following year)
Age and year
Totalpeople
Covered by private and/or government health insurance
NotcoveredTotal
Private health insurance Government health insurance
Total
Employ-ment
basedDirect
purchase Total Medicaid Medicare
Militaryhealth
1care
25 TO 34 YEARS
Numbers
2005 . . . . . . . . . . . . . . . . . . . . . . . . . . 39,480 29,069 25,489 23,683 2,234 4,753 3,451 541 1,058 10,41220042 . . . . . . . . . . . . . . . . . . . . . . . . . 39,310 29,287 25,902 24,113 2,309 4,646 3,474 479 989 10,0232004 . . . . . . . . . . . . . . . . . . . . . . . . . . 39,307 29,130 25,765 24,027 2,266 4,578 3,408 482 982 10,1772003 . . . . . . . . . . . . . . . . . . . . . . . . . . 39,201 28,856 25,606 23,946 2,058 4,210 3,073 538 898 10,3452002 . . . . . . . . . . . . . . . . . . . . . . . . . . 39,243 29,474 26,492 24,800 2,098 3,944 2,801 455 922 9,7692001 . . . . . . . . . . . . . . . . . . . . . . . . . . 38,670 29,619 26,905 25,306 2,072 3,653 2,587 489 817 9,05120003 . . . . . . . . . . . . . . . . . . . . . . . . . 38,865 30,358 27,755 26,211 2,033 3,551 2,480 403 922 8,50719994 . . . . . . . . . . . . . . . . . . . . . . . . . 39,031 30,309 27,730 26,153 2,114 3,578 2,458 332 974 8,7231999 . . . . . . . . . . . . . . . . . . . . . . . . . . 37,786 29,031 26,567 25,150 1,939 3,429 2,344 323 940 8,7551998 . . . . . . . . . . . . . . . . . . . . . . . . . . 38,474 29,347 26,726 25,096 2,049 3,616 2,476 423 991 9,12719975 . . . . . . . . . . . . . . . . . . . . . . . . . 39,354 30,192 27,138 25,496 2,157 3,956 2,842 365 1,011 9,1631996 . . . . . . . . . . . . . . . . . . . . . . . . . . 40,256 31,283 27,915 26,205 2,325 4,508 3,264 433 1,086 8,9741995 . . . . . . . . . . . . . . . . . . . . . . . . . . 40,919 31,561 27,938 26,020 2,601 4,722 3,496 364 1,146 9,35719946 . . . . . . . . . . . . . . . . . . . . . . . . . 41,388 32,274 28,386 26,417 2,874 5,261 3,748 359 1,435 9,11519937 . . . . . . . . . . . . . . . . . . . . . . . . . 41,946 32,869 28,629’ 25,432 (NA) 5,345 4,002 515 1,176 9,07619928 . . . . . . . . . . . . . . . . . . . . . . . . . 42,356 33,389 28,994 26,164 (NA) 5,277 3,774 576 1,283 8,9671991 . . . . . . . . . . . . . . . . . . . . . . . . . . 42,496 33,940 29,808 27,103 (NA) 5,031 3,542 495 1,327 8,5551990 . . . . . . . . . . . . . . . . . . . . . . . . . . 42,905 34,581 30,875 27,920 (NA) 4,634 3,185 471 1,296 8,3241989 . . . . . . . . . . . . . . . . . . . . . . . . . . 43,240 35,326 31,912 28,867 (NA) 4,217 2,692 363 1,396 7,9141988 . . . . . . . . . . . . . . . . . . . . . . . . . . 43,239 35,319 31,996 29,140 (NA) 4,195 2,699 342 1,374 7,92019879 . . . . . . . . . . . . . . . . . . . . . . . . . 42,953 35,645 32,296 29,198 (NA) 4,247 2,702 405 1,423 7,308
Percents
2005 . . . . . . . . . . . . . . . . . . . . . . . . . . 100.0 73.6 64.6 60.0 5.7 12.0 8.7 1.4 2.7 26.420042 . . . . . . . . . . . . . . . . . . . . . . . . . 100.0 74.5 65.9 61.3 5.9 11.8 8.8 1.2 2.5 25.52004 . . . . . . . . . . . . . . . . . . . . . . . . . . 100.0 74.1 65.5 61.1 5.8 11.6 8.7 1.2 2.5 25.92003 . . . . . . . . . . . . . . . . . . . . . . . . . . 100.0 73.6 65.3 61.1 5.2 10.7 7.8 1.4 2.3 26.42002 . . . . . . . . . . . . . . . . . . . . . . . . . . 100.0 75.1 67.5 63.2 5.3 10.1 7.1 1.2 2.3 24.92001 . . . . . . . . . . . . . . . . . . . . . . . . . . 100.0 76.6 69.6 65.4 5.4 9.4 6.7 1.3 2.1 23.420003 . . . . . . . . . . . . . . . . . . . . . . . . . 100.0 78.1 71.4 67.4 5.2 9.1 6.4 1.0 2.4 21.919994 . . . . . . . . . . . . . . . . . . . . . . . . . 100.0 77.7 71.0 67.0 5.4 9.2 6.3 0.8 2.5 22.31999 . . . . . . . . . . . . . . . . . . . . . . . . . . 100.0 76.8 70.3 66.6 5.1 9.1 6.2 0.9 2.5 23.21998 . . . . . . . . . . . . . . . . . . . . . . . . . . 100.0 76.3 69.5 65.2 5.3 9.4 6.4 1.1 2.6 23.719975 . . . . . . . . . . . . . . . . . . . . . . . . . 100.0 76.7 69.0 64.8 5.5 10.1 7.2 0.9 2.6 23.31996 . . . . . . . . . . . . . . . . . . . . . . . . . . 100.0 77.7 69.3 65.1 5.8 11.2 8.1 1.1 2.7 22.31995 . . . . . . . . . . . . . . . . . . . . . . . . . . 100.0 77.1 68.3 63.6 6.4 11.5 8.5 0.9 2.8 22.919946 . . . . . . . . . . . . . . . . . . . . . . . . . 100.0 78.0 68.6 63.8 6.9 12.7 9.1 0.9 3.5 22.019937 . . . . . . . . . . . . . . . . . . . . . . . . . 100.0 78.4 68.3 60.6 (NA) 12.7 9.5 1.2 2.8 21.619928 . . . . . . . . . . . . . . . . . . . . . . . . . 100.0 78.8 68.5 61.8 (NA) 12.5 8.9 1.4 3.0 21.21991 . . . . . . . . . . . . . . . . . . . . . . . . . . 100.0 79.9 70.1 63.8 (NA) 11.8 8.3 1.2 3.1 20.11990 . . . . . . . . . . . . . . . . . . . . . . . . . . 100.0 80.6 72.0 65.1 (NA) 10.8 7.4 1.1 3.0 19.41989 . . . . . . . . . . . . . . . . . . . . . . . . . . 100.0 81.7 73.8 66.8 (NA) 9.8 6.2 0.8 3.2 18.31988 . . . . . . . . . . . . . . . . . . . . . . . . . . 100.0 81.7 74.0 67.4 (NA) 9.7 6.2 0.8 3.2 18.319879 . . . . . . . . . . . . . . . . . . . . . . . . . 100.0 83.0 75.2 68.0 (NA) 9.9 6.3 0.9 3.3 17.0
See footnotes at end of table.

72 Income, Poverty, and Health Insurance Coverage in the United States: 2005 U.S. Census Bureau
Table C-2.Health Insurance Coverage by Age: 1987 to 2005—Con.(Numbers in thousands. People as of March of the following year)
Age and year
Totalpeople
Covered by private and/or government health insurance
NotcoveredTotal
Private health insurance Government health insurance
Total
Employ-ment
basedDirect
purchase Total Medicaid Medicare
Militaryhealth
1care
35 TO 44 YEARS
Numbers
2005 . . . . . . . . . . . . . . . . . . . . . . . . . . 43,121 35,031 31,703 29,554 2,799 4,628 3,087 885 1,099 8,09020042 . . . . . . . . . . . . . . . . . . . . . . . . . 43,351 35,257 31,871 29,777 2,799 4,721 3,194 902 1,122 8,0932004 . . . . . . . . . . . . . . . . . . . . . . . . . . 43,350 35,240 31,883 29,824 2,773 4,680 3,135 900 1,129 8,1102003 . . . . . . . . . . . . . . . . . . . . . . . . . . 43,573 35,688 32,533 30,386 2,793 4,420 2,860 940 1,111 7,8852002 . . . . . . . . . . . . . . . . . . . . . . . . . . 44,074 36,292 33,240 31,180 2,817 4,240 2,728 881 1,121 7,7812001 . . . . . . . . . . . . . . . . . . . . . . . . . . 44,284 37,153 34,315 32,386 2,649 4,003 2,532 860 1,066 7,13120003 . . . . . . . . . . . . . . . . . . . . . . . . . 44,566 37,669 35,033 33,004 2,723 3,920 2,390 780 1,206 6,89819994 . . . . . . . . . . . . . . . . . . . . . . . . . 44,474 37,748 34,908 32,620 3,151 4,028 2,390 825 1,257 6,7261999 . . . . . . . . . . . . . . . . . . . . . . . . . . 44,805 37,428 34,624 32,423 3,057 3,988 2,340 856 1,256 7,3771998 . . . . . . . . . . . . . . . . . . . . . . . . . . 44,744 37,036 34,134 32,019 2,937 4,190 2,579 749 1,232 7,70819975 . . . . . . . . . . . . . . . . . . . . . . . . . 44,462 36,763 33,673 31,560 2,897 4,257 2,700 878 1,161 7,6991996 . . . . . . . . . . . . . . . . . . . . . . . . . . 43,960 36,809 33,448 31,231 3,074 4,657 3,109 767 1,173 7,1521995 . . . . . . . . . . . . . . . . . . . . . . . . . . 43,078 35,946 32,813 30,552 3,250 4,399 2,863 775 1,210 7,13219946 . . . . . . . . . . . . . . . . . . . . . . . . . 42,334 35,555 32,271 29,894 3,714 4,628 2,918 711 1,415 6,78019937 . . . . . . . . . . . . . . . . . . . . . . . . . 41,528 34,537 31,441 28,115 (NA) 4,189 2,619 647 1,276 6,99119928 . . . . . . . . . . . . . . . . . . . . . . . . . 40,747 34,332 31,261 28,252 (NA) 3,990 2,310 718 1,324 6,4151991 . . . . . . . . . . . . . . . . . . . . . . . . . . 39,578 33,902 31,118 28,339 (NA) 3,710 2,036 559 1,414 5,6761990 . . . . . . . . . . . . . . . . . . . . . . . . . . 38,665 33,534 31,046 28,136 (NA) 3,542 1,894 578 1,368 5,1311989 . . . . . . . . . . . . . . . . . . . . . . . . . . 37,195 32,541 30,329 27,641 (NA) 3,156 1,598 514 1,300 4,6541988 . . . . . . . . . . . . . . . . . . . . . . . . . . 35,873 31,294 29,168 26,651 (NA) 3,126 1,506 463 1,397 4,57919879 . . . . . . . . . . . . . . . . . . . . . . . . . 34,692 30,557 28,353 25,868 (NA) 3,186 1,590 447 1,373 4,135
Percents
2005 . . . . . . . . . . . . . . . . . . . . . . . . . . 100.0 81.2 73.5 68.5 6.5 10.7 7.2 2.1 2.5 18.820042 . . . . . . . . . . . . . . . . . . . . . . . . . 100.0 81.3 73.5 68.7 6.5 10.9 7.4 2.1 2.6 18.72004 . . . . . . . . . . . . . . . . . . . . . . . . . . 100.0 81.3 73.5 68.8 6.4 10.8 7.2 2.1 2.6 18.72003 . . . . . . . . . . . . . . . . . . . . . . . . . . 100.0 81.9 74.7 69.7 6.4 10.1 6.6 2.2 2.6 18.12002 . . . . . . . . . . . . . . . . . . . . . . . . . . 100.0 82.3 75.4 70.7 6.4 9.6 6.2 2.0 2.5 17.72001 . . . . . . . . . . . . . . . . . . . . . . . . . . 100.0 83.9 77.5 73.1 6.0 9.0 5.7 1.9 2.4 16.120003 . . . . . . . . . . . . . . . . . . . . . . . . . 100.0 84.5 78.6 74.1 6.1 8.8 5.4 1.8 2.7 15.519994 . . . . . . . . . . . . . . . . . . . . . . . . . 100.0 84.9 78.5 73.3 7.1 9.1 5.4 1.9 2.8 15.11999 . . . . . . . . . . . . . . . . . . . . . . . . . . 100.0 83.5 77.3 72.4 6.8 8.9 5.2 1.9 2.8 16.51998 . . . . . . . . . . . . . . . . . . . . . . . . . . 100.0 82.8 76.3 71.6 6.6 9.4 5.8 1.7 2.8 17.219975 . . . . . . . . . . . . . . . . . . . . . . . . . 100.0 82.7 75.7 71.0 6.5 9.6 6.1 2.0 2.6 17.31996 . . . . . . . . . . . . . . . . . . . . . . . . . . 100.0 83.7 76.1 71.0 7.0 10.6 7.1 1.7 2.7 16.31995 . . . . . . . . . . . . . . . . . . . . . . . . . . 100.0 83.4 76.2 70.9 7.5 10.2 6.6 1.8 2.8 16.619946 . . . . . . . . . . . . . . . . . . . . . . . . . 100.0 84.0 76.2 70.6 8.8 10.9 6.9 1.7 3.3 16.019937 . . . . . . . . . . . . . . . . . . . . . . . . . 100.0 83.2 75.7 67.7 (NA) 10.1 6.3 1.6 3.1 16.819928 . . . . . . . . . . . . . . . . . . . . . . . . . 100.0 84.3 76.7 69.3 (NA) 9.8 5.7 1.8 3.2 15.71991 . . . . . . . . . . . . . . . . . . . . . . . . . . 100.0 85.7 78.6 71.6 (NA) 9.4 5.1 1.4 3.6 14.31990 . . . . . . . . . . . . . . . . . . . . . . . . . . 100.0 86.7 80.3 72.8 (NA) 9.2 4.9 1.5 3.5 13.31989 . . . . . . . . . . . . . . . . . . . . . . . . . . 100.0 87.5 81.5 74.3 (NA) 8.5 4.3 1.4 3.5 12.51988 . . . . . . . . . . . . . . . . . . . . . . . . . . 100.0 87.2 81.3 74.3 (NA) 8.7 4.2 1.3 3.9 12.819879 . . . . . . . . . . . . . . . . . . . . . . . . . 100.0 88.1 81.7 74.6 (NA) 9.2 4.6 1.3 4.0 11.9
See footnotes at end of table.
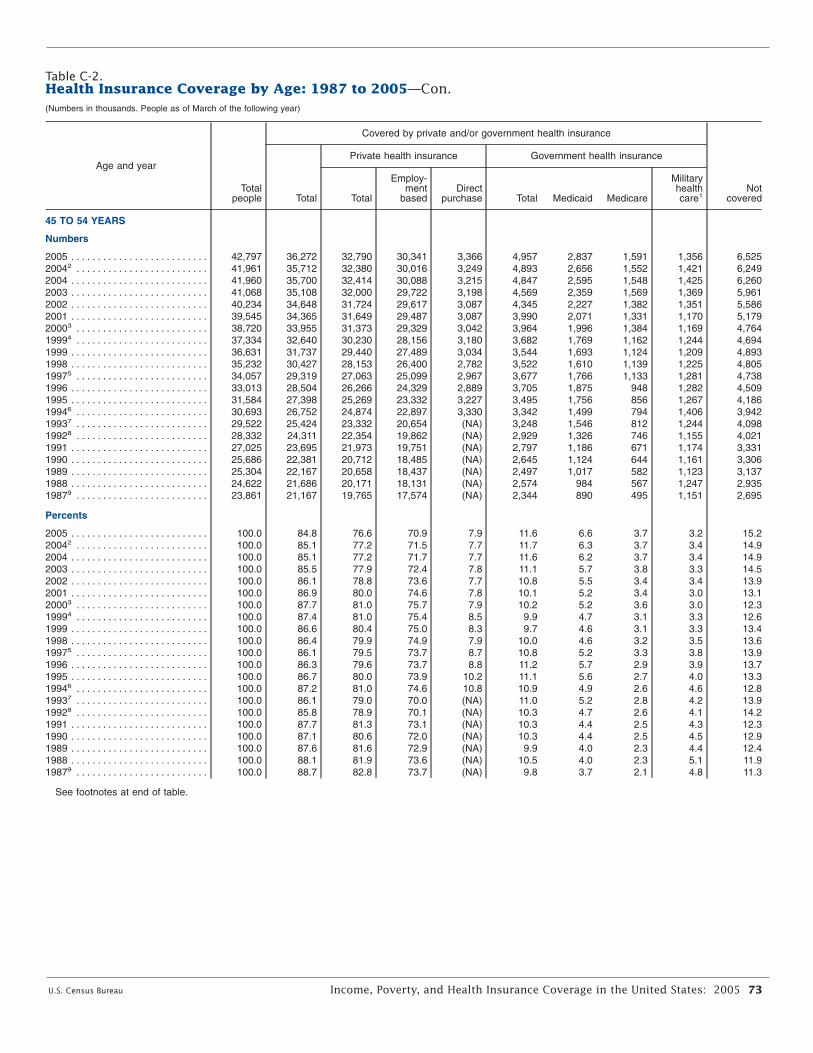
U.S. Census Bureau Income, Poverty, and Health Insurance Coverage in the United States: 2005 73
Table C-2.Health Insurance Coverage by Age: 1987 to 2005—Con.(Numbers in thousands. People as of March of the following year)
Age and year
Totalpeople
Covered by private and/or government health insurance
NotcoveredTotal
Private health insurance Government health insurance
Total
Employ-ment
basedDirect
purchase Total Medicaid Medicare
Militaryhealth
1care
45 TO 54 YEARS
Numbers
2005 . . . . . . . . . . . . . . . . . . . . . . . . . . 42,797 36,272 32,790 30,341 3,366 4,957 2,837 1,591 1,356 6,52520042 . . . . . . . . . . . . . . . . . . . . . . . . . 41,961 35,712 32,380 30,016 3,249 4,893 2,656 1,552 1,421 6,2492004 . . . . . . . . . . . . . . . . . . . . . . . . . . 41,960 35,700 32,414 30,088 3,215 4,847 2,595 1,548 1,425 6,2602003 . . . . . . . . . . . . . . . . . . . . . . . . . . 41,068 35,108 32,000 29,722 3,198 4,569 2,359 1,569 1,369 5,9612002 . . . . . . . . . . . . . . . . . . . . . . . . . . 40,234 34,648 31,724 29,617 3,087 4,345 2,227 1,382 1,351 5,5862001 . . . . . . . . . . . . . . . . . . . . . . . . . . 39,545 34,365 31,649 29,487 3,087 3,990 2,071 1,331 1,170 5,17920003 . . . . . . . . . . . . . . . . . . . . . . . . . 38,720 33,955 31,373 29,329 3,042 3,964 1,996 1,384 1,169 4,76419994 . . . . . . . . . . . . . . . . . . . . . . . . . 37,334 32,640 30,230 28,156 3,180 3,682 1,769 1,162 1,244 4,6941999 . . . . . . . . . . . . . . . . . . . . . . . . . . 36,631 31,737 29,440 27,489 3,034 3,544 1,693 1,124 1,209 4,8931998 . . . . . . . . . . . . . . . . . . . . . . . . . . 35,232 30,427 28,153 26,400 2,782 3,522 1,610 1,139 1,225 4,80519975 . . . . . . . . . . . . . . . . . . . . . . . . . 34,057 29,319 27,063 25,099 2,967 3,677 1,766 1,133 1,281 4,7381996 . . . . . . . . . . . . . . . . . . . . . . . . . . 33,013 28,504 26,266 24,329 2,889 3,705 1,875 948 1,282 4,5091995 . . . . . . . . . . . . . . . . . . . . . . . . . . 31,584 27,398 25,269 23,332 3,227 3,495 1,756 856 1,267 4,18619946 . . . . . . . . . . . . . . . . . . . . . . . . . 30,693 26,752 24,874 22,897 3,330 3,342 1,499 794 1,406 3,94219937 . . . . . . . . . . . . . . . . . . . . . . . . . 29,522 25,424 23,332 20,654 (NA) 3,248 1,546 812 1,244 4,09819928 . . . . . . . . . . . . . . . . . . . . . . . . . 28,332 24,311 22,354 19,862 (NA) 2,929 1,326 746 1,155 4,0211991 . . . . . . . . . . . . . . . . . . . . . . . . . . 27,025 23,695 21,973 19,751 (NA) 2,797 1,186 671 1,174 3,3311990 . . . . . . . . . . . . . . . . . . . . . . . . . . 25,686 22,381 20,712 18,485 (NA) 2,645 1,124 644 1,161 3,3061989 . . . . . . . . . . . . . . . . . . . . . . . . . . 25,304 22,167 20,658 18,437 (NA) 2,497 1,017 582 1,123 3,1371988 . . . . . . . . . . . . . . . . . . . . . . . . . . 24,622 21,686 20,171 18,131 (NA) 2,574 984 567 1,247 2,93519879 . . . . . . . . . . . . . . . . . . . . . . . . . 23,861 21,167 19,765 17,574 (NA) 2,344 890 495 1,151 2,695
Percents
2005 . . . . . . . . . . . . . . . . . . . . . . . . . . 100.0 84.8 76.6 70.9 7.9 11.6 6.6 3.7 3.2 15.220042 . . . . . . . . . . . . . . . . . . . . . . . . . 100.0 85.1 77.2 71.5 7.7 11.7 6.3 3.7 3.4 14.92004 . . . . . . . . . . . . . . . . . . . . . . . . . . 100.0 85.1 77.2 71.7 7.7 11.6 6.2 3.7 3.4 14.92003 . . . . . . . . . . . . . . . . . . . . . . . . . . 100.0 85.5 77.9 72.4 7.8 11.1 5.7 3.8 3.3 14.52002 . . . . . . . . . . . . . . . . . . . . . . . . . . 100.0 86.1 78.8 73.6 7.7 10.8 5.5 3.4 3.4 13.92001 . . . . . . . . . . . . . . . . . . . . . . . . . . 100.0 86.9 80.0 74.6 7.8 10.1 5.2 3.4 3.0 13.120003 . . . . . . . . . . . . . . . . . . . . . . . . . 100.0 87.7 81.0 75.7 7.9 10.2 5.2 3.6 3.0 12.319994 . . . . . . . . . . . . . . . . . . . . . . . . . 100.0 87.4 81.0 75.4 8.5 9.9 4.7 3.1 3.3 12.61999 . . . . . . . . . . . . . . . . . . . . . . . . . . 100.0 86.6 80.4 75.0 8.3 9.7 4.6 3.1 3.3 13.41998 . . . . . . . . . . . . . . . . . . . . . . . . . . 100.0 86.4 79.9 74.9 7.9 10.0 4.6 3.2 3.5 13.619975 . . . . . . . . . . . . . . . . . . . . . . . . . 100.0 86.1 79.5 73.7 8.7 10.8 5.2 3.3 3.8 13.91996 . . . . . . . . . . . . . . . . . . . . . . . . . . 100.0 86.3 79.6 73.7 8.8 11.2 5.7 2.9 3.9 13.71995 . . . . . . . . . . . . . . . . . . . . . . . . . . 100.0 86.7 80.0 73.9 10.2 11.1 5.6 2.7 4.0 13.319946 . . . . . . . . . . . . . . . . . . . . . . . . . 100.0 87.2 81.0 74.6 10.8 10.9 4.9 2.6 4.6 12.819937 . . . . . . . . . . . . . . . . . . . . . . . . . 100.0 86.1 79.0 70.0 (NA) 11.0 5.2 2.8 4.2 13.919928 . . . . . . . . . . . . . . . . . . . . . . . . . 100.0 85.8 78.9 70.1 (NA) 10.3 4.7 2.6 4.1 14.21991 . . . . . . . . . . . . . . . . . . . . . . . . . . 100.0 87.7 81.3 73.1 (NA) 10.3 4.4 2.5 4.3 12.31990 . . . . . . . . . . . . . . . . . . . . . . . . . . 100.0 87.1 80.6 72.0 (NA) 10.3 4.4 2.5 4.5 12.91989 . . . . . . . . . . . . . . . . . . . . . . . . . . 100.0 87.6 81.6 72.9 (NA) 9.9 4.0 2.3 4.4 12.41988 . . . . . . . . . . . . . . . . . . . . . . . . . . 100.0 88.1 81.9 73.6 (NA) 10.5 4.0 2.3 5.1 11.919879 . . . . . . . . . . . . . . . . . . . . . . . . . 100.0 88.7 82.8 73.7 (NA) 9.8 3.7 2.1 4.8 11.3
See footnotes at end of table.

74 Income, Poverty, and Health Insurance Coverage in the United States: 2005 U.S. Census Bureau
Table C-2.Health Insurance Coverage by Age: 1987 to 2005—Con.(Numbers in thousands. People as of March of the following year)
Age and year
Totalpeople
Covered by private and/or government health insurance
NotcoveredTotal
Private health insurance Government health insurance
Total
Employ-ment
basedDirect
purchase Total Medicaid Medicare
Militaryhealth
1care
55 TO 64 YEARS
Numbers
2005 . . . . . . . . . . . . . . . . . . . . . . . . . . 30,981 26,766 23,096 20,654 3,146 5,903 2,334 2,711 1,914 4,21520042 . . . . . . . . . . . . . . . . . . . . . . . . . 29,536 25,628 22,202 19,843 3,109 5,475 2,092 2,644 1,783 3,9082004 . . . . . . . . . . . . . . . . . . . . . . . . . . 29,532 25,596 22,174 19,872 3,066 5,442 2,036 2,651 1,785 3,9362003 . . . . . . . . . . . . . . . . . . . . . . . . . . 28,375 24,679 21,569 19,324 2,987 4,893 1,757 2,494 1,471 3,6962002 . . . . . . . . . . . . . . . . . . . . . . . . . . 27,399 23,879 20,797 18,505 3,071 4,882 1,773 2,392 1,482 3,5212001 . . . . . . . . . . . . . . . . . . . . . . . . . . 25,874 22,482 19,581 17,521 2,761 4,567 1,807 2,301 1,220 3,39220003 . . . . . . . . . . . . . . . . . . . . . . . . . 24,672 21,312 18,614 16,444 2,936 4,185 1,731 2,159 1,024 3,36019994 . . . . . . . . . . . . . . . . . . . . . . . . . 23,981 20,785 18,335 16,195 2,932 4,033 1,551 2,084 1,053 3,1961999 . . . . . . . . . . . . . . . . . . . . . . . . . . 23,387 19,992 17,654 15,662 2,763 3,874 1,474 2,024 1,014 3,3951998 . . . . . . . . . . . . . . . . . . . . . . . . . . 22,909 19,475 17,179 15,210 2,688 3,844 1,415 2,016 1,077 3,43419975 . . . . . . . . . . . . . . . . . . . . . . . . . 22,255 19,065 16,748 14,466 3,052 3,771 1,509 1,794 1,095 3,1901996 . . . . . . . . . . . . . . . . . . . . . . . . . . 21,475 18,501 16,258 14,031 3,087 3,916 1,577 1,822 1,052 2,9741995 . . . . . . . . . . . . . . . . . . . . . . . . . . 21,084 18,270 16,124 14,098 3,056 3,790 1,415 1,660 1,231 2,81419946 . . . . . . . . . . . . . . . . . . . . . . . . . 20,755 17,878 15,735 13,496 3,202 3,836 1,295 1,545 1,471 2,87719937 . . . . . . . . . . . . . . . . . . . . . . . . . 20,737 17,957 15,938 13,291 (NA) 3,499 1,204 1,536 1,234 2,78119928 . . . . . . . . . . . . . . . . . . . . . . . . . 20,528 17,925 15,876 13,212 (NA) 3,540 1,152 1,624 1,242 2,6031991 . . . . . . . . . . . . . . . . . . . . . . . . . . 21,150 18,520 16,479 13,613 (NA) 3,681 1,234 1,589 1,362 2,6301990 . . . . . . . . . . . . . . . . . . . . . . . . . . 21,345 18,660 16,586 13,691 (NA) 3,675 1,178 1,523 1,444 2,6851989 . . . . . . . . . . . . . . . . . . . . . . . . . . 21,232 18,765 16,693 13,711 (NA) 3,715 1,144 1,575 1,490 2,4671988 . . . . . . . . . . . . . . . . . . . . . . . . . . 21,399 19,052 16,934 13,999 (NA) 3,772 1,094 1,597 1,532 2,34719879 . . . . . . . . . . . . . . . . . . . . . . . . . 21,641 19,361 17,423 14,262 (NA) 3,726 993 1,528 1,643 2,281
Percents
2005 . . . . . . . . . . . . . . . . . . . . . . . . . . 100.0 86.4 74.5 66.7 10.2 19.1 7.5 8.7 6.2 13.620042 . . . . . . . . . . . . . . . . . . . . . . . . . 100.0 86.8 75.2 67.2 10.5 18.5 7.1 9.0 6.0 13.22004 . . . . . . . . . . . . . . . . . . . . . . . . . . 100.0 86.7 75.1 67.3 10.4 18.4 6.9 9.0 6.0 13.32003 . . . . . . . . . . . . . . . . . . . . . . . . . . 100.0 87.0 76.0 68.1 10.5 17.2 6.2 8.8 5.2 13.02002 . . . . . . . . . . . . . . . . . . . . . . . . . . 100.0 87.2 75.9 67.5 11.2 17.8 6.5 8.7 5.4 12.82001 . . . . . . . . . . . . . . . . . . . . . . . . . . 100.0 86.9 75.7 67.7 10.7 17.7 7.0 8.9 4.7 13.120003 . . . . . . . . . . . . . . . . . . . . . . . . . 100.0 86.4 75.4 66.7 11.9 17.0 7.0 8.8 4.2 13.619994 . . . . . . . . . . . . . . . . . . . . . . . . . 100.0 86.7 76.5 67.5 12.2 16.8 6.5 8.7 4.4 13.31999 . . . . . . . . . . . . . . . . . . . . . . . . . . 100.0 85.5 75.5 67.0 11.8 16.6 6.3 8.7 4.3 14.51998 . . . . . . . . . . . . . . . . . . . . . . . . . . 100.0 85.0 75.0 66.4 11.7 16.8 6.2 8.8 4.7 15.019975 . . . . . . . . . . . . . . . . . . . . . . . . . 100.0 85.7 75.3 65.0 13.7 16.9 6.8 8.1 4.9 14.31996 . . . . . . . . . . . . . . . . . . . . . . . . . . 100.0 86.2 75.7 65.3 14.4 18.2 7.3 8.5 4.9 13.81995 . . . . . . . . . . . . . . . . . . . . . . . . . . 100.0 86.7 76.5 66.9 14.5 18.0 6.7 7.9 5.8 13.319946 . . . . . . . . . . . . . . . . . . . . . . . . . 100.0 86.1 75.8 65.0 15.4 18.5 6.2 7.4 7.1 13.919937 . . . . . . . . . . . . . . . . . . . . . . . . . 100.0 86.6 76.9 64.1 (NA) 16.9 5.8 7.4 6.0 13.419928 . . . . . . . . . . . . . . . . . . . . . . . . . 100.0 87.3 77.3 64.4 (NA) 17.2 5.6 7.9 6.1 12.71991 . . . . . . . . . . . . . . . . . . . . . . . . . . 100.0 87.6 77.9 64.4 (NA) 17.4 5.8 7.5 6.4 12.41990 . . . . . . . . . . . . . . . . . . . . . . . . . . 100.0 87.4 77.7 64.1 (NA) 17.2 5.5 7.1 6.8 12.61989 . . . . . . . . . . . . . . . . . . . . . . . . . . 100.0 88.4 78.6 64.6 (NA) 17.5 5.4 7.4 7.0 11.61988 . . . . . . . . . . . . . . . . . . . . . . . . . . 100.0 89.0 79.1 65.4 (NA) 17.6 5.1 7.5 7.2 11.019879 . . . . . . . . . . . . . . . . . . . . . . . . . 100.0 89.5 80.5 65.9 (NA) 17.2 4.6 7.1 7.6 10.5
See footnotes at end of table.

U.S. Census Bureau Income, Poverty, and Health Insurance Coverage in the United States: 2005 75
Table C-2.Health Insurance Coverage by Age: 1987 to 2005—Con.(Numbers in thousands. People as of March of the following year)
Covered by private and/or government health insurance
Private health insurance Government health insuranceAge and year
Employ- MilitaryTotal ment Direct health Not
1people Total Total based purchase Total Medicaid Medicare care covered
65 YEARS AND OVER
Numbers
2005 . . . . . . . . . . . . . . . . . . . . . . . . . . 35,505 35,046 21,078 12,666 9,650 33,862 3,397 33,727 2,611 45920042 . . . . . . . . . . . . . . . . . . . . . . . . . 35,209 34,717 21,143 12,388 9,913 33,557 3,335 33,420 2,504 4932004 . . . . . . . . . . . . . . . . . . . . . . . . . . 35,213 34,916 21,336 12,505 9,979 33,595 3,297 33,452 2,509 2972003 . . . . . . . . . . . . . . . . . . . . . . . . . . 34,659 34,373 21,159 12,204 9,962 33,345 3,190 33,257 2,206 2862002 . . . . . . . . . . . . . . . . . . . . . . . . . . 34,234 33,976 20,685 11,583 10,135 32,813 3,283 32,631 2,259 2582001 . . . . . . . . . . . . . . . . . . . . . . . . . . 33,769 33,498 20,751 11,645 10,229 32,618 3,270 32,458 2,156 27220003 . . . . . . . . . . . . . . . . . . . . . . . . . 33,566 33,314 20,702 11,278 10,671 32,398 3,339 32,289 1,410 25119994 . . . . . . . . . . . . . . . . . . . . . . . . . 33,377 33,109 20,796 11,584 10,422 32,083 2,956 32,004 1,257 2681999 . . . . . . . . . . . . . . . . . . . . . . . . . . 32,621 32,199 20,054 11,169 10,049 31,312 2,917 31,231 1,232 4221998 . . . . . . . . . . . . . . . . . . . . . . . . . . 32,394 32,036 20,171 11,150 10,312 31,167 2,962 31,085 1,186 35819975 . . . . . . . . . . . . . . . . . . . . . . . . . 32,082 31,749 20,687 10,963 10,853 30,942 2,901 30,870 1,125 3331996 . . . . . . . . . . . . . . . . . . . . . . . . . . 31,877 31,541 21,224 10,948 11,567 30,714 3,215 30,616 998 3361995 . . . . . . . . . . . . . . . . . . . . . . . . . . 31,658 31,358 21,754 11,137 12,148 30,597 2,820 30,521 1,152 30019946 . . . . . . . . . . . . . . . . . . . . . . . . . 31,267 30,977 21,259 11,071 11,742 30,291 2,875 30,176 1,550 29019937 . . . . . . . . . . . . . . . . . . . . . . . . . 30,779 30,416 20,324 9,947 (NA) 29,490 2,709 29,390 1,208 36319928 . . . . . . . . . . . . . . . . . . . . . . . . . 30,430 30,082 20,643 9,944 (NA) 29,387 2,869 29,290 1,163 3491991 . . . . . . . . . . . . . . . . . . . . . . . . . . 30,590 30,301 20,715 10,114 (NA) 29,465 2,891 29,377 1,178 2891990 . . . . . . . . . . . . . . . . . . . . . . . . . . 30,093 29,816 20,566 10,002 (NA) 28,898 2,582 28,795 1,151 2761989 . . . . . . . . . . . . . . . . . . . . . . . . . . 29,566 29,258 20,003 9,448 (NA) 28,337 2,576 28,251 1,105 3081988 . . . . . . . . . . . . . . . . . . . . . . . . . . 29,022 28,747 19,841 9,171 (NA) 27,831 2,451 27,724 1,079 27519879 . . . . . . . . . . . . . . . . . . . . . . . . . 28,487 28,181 20,127 8,830 (NA) 27,428 2,387 27,333 1,113 306
Percents
2005 . . . . . . . . . . . . . . . . . . . . . . . . . . 100.0 98.7 59.4 35.7 27.2 95.4 9.6 95.0 7.4 1.320042 . . . . . . . . . . . . . . . . . . . . . . . . . 100.0 98.6 60.0 35.2 28.2 95.3 9.5 94.9 7.1 1.42004 . . . . . . . . . . . . . . . . . . . . . . . . . . 100.0 99.2 60.6 35.5 28.3 95.4 9.4 95.0 7.1 0.82003 . . . . . . . . . . . . . . . . . . . . . . . . . . 100.0 99.2 61.0 35.2 28.7 96.2 9.2 96.0 6.4 0.82002 . . . . . . . . . . . . . . . . . . . . . . . . . . 100.0 99.2 60.4 33.8 29.6 95.8 9.6 95.3 6.6 0.82001 . . . . . . . . . . . . . . . . . . . . . . . . . . 100.0 99.2 61.5 34.5 30.3 96.6 9.7 96.1 6.4 0.820003 . . . . . . . . . . . . . . . . . . . . . . . . . 100.0 99.3 61.7 33.6 31.8 96.5 9.9 96.2 4.2 0.719994 . . . . . . . . . . . . . . . . . . . . . . . . . 100.0 99.2 62.3 34.7 31.2 96.1 8.9 95.9 3.8 0.81999 . . . . . . . . . . . . . . . . . . . . . . . . . . 100.0 98.7 61.5 34.2 30.8 96.0 8.9 95.7 3.8 1.31998 . . . . . . . . . . . . . . . . . . . . . . . . . . 100.0 98.9 62.3 34.4 31.8 96.2 9.1 96.0 3.7 1.119975 . . . . . . . . . . . . . . . . . . . . . . . . . 100.0 99.0 64.5 34.2 33.8 96.4 9.0 96.2 3.5 1.01996 . . . . . . . . . . . . . . . . . . . . . . . . . . 100.0 98.9 66.6 34.3 36.3 96.4 10.1 96.0 3.1 1.11995 . . . . . . . . . . . . . . . . . . . . . . . . . . 100.0 99.1 68.7 35.2 38.4 96.6 8.9 96.4 3.6 0.919946 . . . . . . . . . . . . . . . . . . . . . . . . . 100.0 99.1 68.0 35.4 37.6 96.9 9.2 96.5 5.0 0.919937 . . . . . . . . . . . . . . . . . . . . . . . . . 100.0 98.8 66.0 32.3 (NA) 95.8 8.8 95.5 3.9 1.219928 . . . . . . . . . . . . . . . . . . . . . . . . . 100.0 98.9 67.8 32.7 (NA) 96.6 9.4 96.3 3.8 1.11991 . . . . . . . . . . . . . . . . . . . . . . . . . . 100.0 99.1 67.7 33.1 (NA) 96.3 9.5 96.0 3.9 0.91990 . . . . . . . . . . . . . . . . . . . . . . . . . . 100.0 99.1 68.3 33.2 (NA) 96.0 8.6 95.7 3.8 0.91989 . . . . . . . . . . . . . . . . . . . . . . . . . . 100.0 99.0 67.7 32.0 (NA) 95.8 8.7 95.6 3.7 1.01988 . . . . . . . . . . . . . . . . . . . . . . . . . . 100.0 99.1 68.4 31.6 (NA) 95.9 8.4 95.5 3.7 0.919879 . . . . . . . . . . . . . . . . . . . . . . . . . 100.0 98.9 70.7 31.0 (NA) 96.3 8.4 95.9 3.9 1.1
(NA) Not available. Respondents were not asked detailed health insurance questions about direct-purchase coverage before the 1995 CPS ASEC.
1 Military health care includes CHAMPUS (Comprehensive Health and Medical Plan for Uniformed Services)/Tricare and CHAMPVA (Civilian Health and Medical Program of theDepartment of Veterans Affairs), as well as care provided by the Health and Medical Program of the Department of Veterans Affairs and care provided by the Department of VeteransAffairs and the military.
2 The 2004 data have been revised to reflect a correction to the weights in the 2005 ASEC. The estimates also reflect improvements to the algorithm that assigns coverage todependents.
3 Implementation of a 28,000 household sample expansion.4 Estimates reflect the results of follow-up verification questions and implementation of Census 2000-based population controls.5 Beginning with the 1998 CPS ASEC, people with no coverage other than access to Indian Health Service are no longer considered covered by health insurance; instead, they are
considered to be uninsured. The effect of this change on the overall estimates of health insurance coverage is negligible; however, the decrease in the number of people covered byMedicaid may be partially due to this change.
6 Health insurance questions were redesigned. Increases in estimates of employment-based and military health care coverage may be partially due to questionnaire changes.Overall coverage estimates were not affected.
7 Data collection method changed from paper and pencil to computer-assisted interviewing.8 Implementation of 1990 census population controls.9 Implementation of a new CPS ASEC processing system.
Source: U.S. Census Bureau, Current Population Survey, 1988 to 2006 Annual Social and Economic Supplements.

76 Income, Poverty, and Health Insurance Coverage in the United States: 2005 U.S. Census Bureau
APPENDIX D.COMPARISON OF STATE ESTIMATES
Figure D-1Three-Year Average Percentage of People Without Health Insurance Coverage by State: 2003 to 2005
0 5 10 15 20 25 30
Percent
Source: U.S. Census Bureau, Current Population Survey, 2004 to 2006 Annual Social and Economic Supplements.
90-percent confidence interval
Midpoint
TexasNew Mexico
FloridaOklahomaCaliforniaLouisianaMontanaNevadaArizonaAlaska
GeorgiaMississippi
ArkansasColorado
West VirginiaOregon
IdahoNorth CarolinaUnited StatesSouth Carolina
WyomingNew Jersey
UtahAlabama
IllinoisIndiana
MarylandWashington
New YorkTennesseeKentucky
VirginiaDistrict of Columbia
DelawareSouth Dakota
OhioMissouri
NebraskaMichigan
North DakotaPennsylvaniaConnecticut
Rhode IslandKansas
MassachusettsVermont
MaineNew Hampshire
WisconsinIowa
HawaiiMinnesota