Implementation of bioenergy in India
18
Implementation of bioenergy in India IEA Bioenergy: 10 2021 Country Reports This report was prepared from the 2021 IEA World Energy Balances and Renewables Information, combined with data and information provided by the IEA Bioenergy Executive Committee and Task members 1 . Reference is also made to FAOstat as well as data from national statistics. All individual country reports were reviewed by the national delegates to the IEA Bioenergy Executive Committee, who have approved the content. General background on the approach and definitions can be found in the central introductory report for all country reports. Edited by: Luc Pelkmans, Technical Coordinator IEA Bioenergy Contributions from related ministries at the Government of India HIGHLIGHTS • Renewables make up 22% of total energy supply in India in 2019. The renewable energy share in final energy consumption is 31% 2 . Around 85% of renewable energy is from biomass. • India is a large country, but also has a high population density, which is mainly concentrated in big cities. Current energy use per capita is very low; however, India is a fast-growing economy, also leading to a strong growth in energy needs. • The traditional use of biomass for residential heating – which is the dominant type of bioenergy in India - is going down slightly (and mostly replaced by oil and gas). Modern use of biomass for power production is growing. • Biofuels in transport so far have a very modest role, representing less than 1% of transport fuels. The focus is on bioethanol, which represented 3% (by energy) of gasoline consumption in 2019. • India has important opportunities to further deploy bioenergy, particularly through the replacement of coal by solid biomass in existing assets, the replacement of traditional bioenergy by more modern (and less polluting) forms of bioenergy or the increase of transport biofuels based on domestically available agricultural residues. There are many opportunities for (renewable) energy from MSW as part of the development of waste management systems. 1 While data for 2020 are starting to become available at national level, it was decided to consider trends up to 2019 for good comparability and benchmarking between the different IEA Bioenergy member countries. Care should also be taken when using 2020 data for analysing trends as these data are distorted by the COVID19 Pandemic. 2 The difference between the share of renewables in supply and consumption relates to unused heat from power plants (which is counted in energy supply, but not in final consumption).
Transcript of Implementation of bioenergy in India

Implementation of bioenergy
in India
IEA Bioenergy: 10 2021
Country Reports
This report was prepared from the 2021 IEA World Energy Balances and Renewables Information,
combined with data and information provided by the IEA Bioenergy Executive Committee and Task
members1. Reference is also made to FAOstat as well as data from national statistics. All individual
country reports were reviewed by the national delegates to the IEA Bioenergy Executive Committee,
who have approved the content. General background on the approach and definitions can be found
in the central introductory report for all country reports.
Edited by: Luc Pelkmans, Technical Coordinator IEA Bioenergy
Contributions from related ministries at the Government of India
HIGHLIGHTS
• Renewables make up 22% of total energy supply in India in 2019. The renewable energy share in final energy consumption is 31%2. Around 85% of renewable energy is from biomass.
• India is a large country, but also has a high population density, which is mainly concentrated in big cities. Current energy use per capita is very low; however, India is a fast-growing economy, also leading to a strong growth in energy needs.
• The traditional use of biomass for residential heating – which is the dominant type of bioenergy in India - is going down slightly (and mostly replaced by oil and gas). Modern use of biomass for power production is growing.
• Biofuels in transport so far have a very modest role, representing less than 1% of transport fuels. The focus is on bioethanol, which represented 3% (by energy) of gasoline consumption in 2019.
• India has important opportunities to further deploy bioenergy, particularly through the replacement of coal by solid biomass in existing assets, the replacement of traditional bioenergy by more modern (and less polluting) forms of bioenergy or the increase of transport biofuels based on domestically available agricultural residues. There are many opportunities for (renewable) energy from MSW as part of the development of waste management systems.
1 While data for 2020 are starting to become available at national level, it was decided to consider trends up to 2019 for good comparability and benchmarking between the different IEA Bioenergy member countries. Care should also be taken when using 2020 data for analysing trends as these data are distorted by the COVID19 Pandemic. 2 The difference between the share of renewables in supply and consumption relates to unused heat from power plants (which is counted in energy supply, but not in final consumption).

2
COUNTRY PROFILE
Population and land use
India is a large country in South Asia, with a total land area of 2,97 million km². It is the second most
populated country in the world (after China) with over 1.3 billion inhabitants. Its population density
is very high with 460 persons per km².
More than half of the land area is
agricultural land, most of it being arable
land. About a quarter of the land area is
forest land (of which 19% protected).
Figure 1: Land use in India (2018 figures - Source: FAOstat)
Final energy consumption
India is a developing economy. Overall final energy consumption in India (also including non-energy
use of oil, natural gas, and coal in industry) comes down to 0.46 tonnes of oil equivalent (toe) per
capita, which is about 6 times below the average of IEA Bioenergy member countries.
Table 1: Distribution of the final consumption of energy carriers by sector in India (2019 figures - Source: IEA (2021) World Energy Balances and Renewables Information)
Final consumption energy carriers
Toe/capita (2019)
% of total Median* (toe/capita)
Industry (energy use) 0.18 39% 0.67
Industry (non-energy use) 0.04 8% 0.21
Transport 0.08 17% 0.69
Residential 0.12 25% 0.57
Commercial & public services
0.02 4% 0.34
Other 0.04 8%
Total 0.46 2.34
* Median of the 25 member countries of IEA Bioenergy3
3 Comparative figures of the different IEA Bioenergy member countries are discussed in the central Countries’ Report.
3
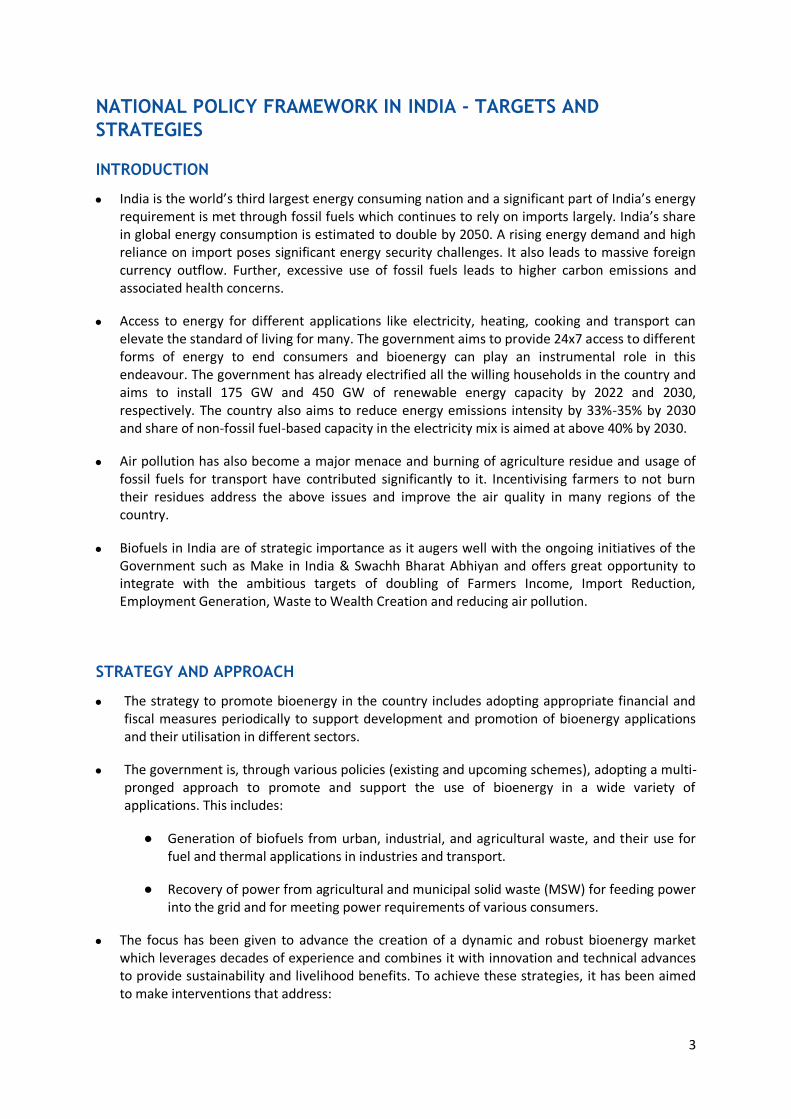
NATIONAL POLICY FRAMEWORK IN INDIA - TARGETS AND
STRATEGIES
INTRODUCTION
• India is the world’s third largest energy consuming nation and a significant part of India’s energy requirement is met through fossil fuels which continues to rely on imports largely. India’s share in global energy consumption is estimated to double by 2050. A rising energy demand and high reliance on import poses significant energy security challenges. It also leads to massive foreign currency outflow. Further, excessive use of fossil fuels leads to higher carbon emissions and associated health concerns.
• Access to energy for different applications like electricity, heating, cooking and transport can elevate the standard of living for many. The government aims to provide 24x7 access to different forms of energy to end consumers and bioenergy can play an instrumental role in this endeavour. The government has already electrified all the willing households in the country and aims to install 175 GW and 450 GW of renewable energy capacity by 2022 and 2030, respectively. The country also aims to reduce energy emissions intensity by 33%-35% by 2030 and share of non-fossil fuel-based capacity in the electricity mix is aimed at above 40% by 2030.
• Air pollution has also become a major menace and burning of agriculture residue and usage of fossil fuels for transport have contributed significantly to it. Incentivising farmers to not burn their residues address the above issues and improve the air quality in many regions of the country.
• Biofuels in India are of strategic importance as it augers well with the ongoing initiatives of the Government such as Make in India & Swachh Bharat Abhiyan and offers great opportunity to integrate with the ambitious targets of doubling of Farmers Income, Import Reduction, Employment Generation, Waste to Wealth Creation and reducing air pollution.
STRATEGY AND APPROACH
• The strategy to promote bioenergy in the country includes adopting appropriate financial and fiscal measures periodically to support development and promotion of bioenergy applications and their utilisation in different sectors.
• The government is, through various policies (existing and upcoming schemes), adopting a multi-pronged approach to promote and support the use of bioenergy in a wide variety of applications. This includes:
● Generation of biofuels from urban, industrial, and agricultural waste, and their use for fuel and thermal applications in industries and transport.
● Recovery of power from agricultural and municipal solid waste (MSW) for feeding power into the grid and for meeting power requirements of various consumers.
• The focus has been given to advance the creation of a dynamic and robust bioenergy market which leverages decades of experience and combines it with innovation and technical advances to provide sustainability and livelihood benefits. To achieve these strategies, it has been aimed to make interventions that address:

4
● Availability of feedstock and end-to-end supply chain management ● Support for new and novel applications. ● Availability of capital at scale ● Support for R&D and innovation for enhancing efficiency, and maximising use and
co-benefits
POLICIES TO PROMOTE BIOENERGY IN INDIA
According to India's Second National Communication to the United Nations Framework Convention on Climate Change (UNFCCC), approximately 20 percent of its anthropogenic methane emissions—81.9 MMT CO2e come from agriculture (manure management), coal mines, municipal solid waste, and natural gas and oil systems. To help meet its potential to reduce GHG emissions, India is investing heavily in a national strategy to increase bioenergy production and. The bioenergy strategy includes many policy initiatives, as well as capacity building and public-private partnerships. In addition to promoting bioenergy development, the benefits of this strategy include supporting sustainable development goals, improving sanitation, and increasing generation of renewable energy. Policies to promote Bioenergy in India have been briefly described as below:
• The Electricity Act of 2003 helps State Electricity Regulatory Commissions promote co-generation and generation of electricity from non-conventional sources. These provisions include mandatory Renewable Purchase Obligation (RPO), open access to the grid for renewable sources of power, preferential tariffs by state regulators, targets for renewable energy, and decontrolled captive generation. The enactment of the Electricity Act marked a paradigm shift within the power sector with an emphasis on renewable power including bioenergy.
• Amended National Tariff Policy-2016 has mandated that Distribution Licensee(s) shall compulsorily procure 100% power produced from all the Waste-to-Energy plants in the State, in the ratio of their procurement of power from all sources including their own, at the tariff determined by the Appropriate Commission under Section 62 of the Electricity Act of 2003.
• The Government of India in November 2017 introduced Policy on Biomass utilisation for power generation through co-firing in coal based power plants and further in September 2018, technical specification for agro-residue based biomass pellets (non-torrefied/ torrefied) for co- firing in coal based thermal power plants was defined.
• The Government of India in September 2019 has declared that power generated from cofiring of biomass in the thermal power plants is Renewable energy and is eligible for meeting non-solar Renewable Purchase obligation (RPO).
• The Government of India in July 2021 has directed appropriate Commissions to consider (a) exemption of all applicable charges (except wheeling and the transmission charges) under interstate Open Access sale of power from Municipal Solid Waste to Power plants and (b) relaxation of DSM for municipal Solid Waste to Power plants similar to the relaxation given to the Solar and Wind power plants.
• The Government of India amended the Central Motor Vehicles Rules, 1989 in June 2015 and included the provisions for usage of biogas, in the form of bio-CNG, in motor vehicles produced from waste.
5
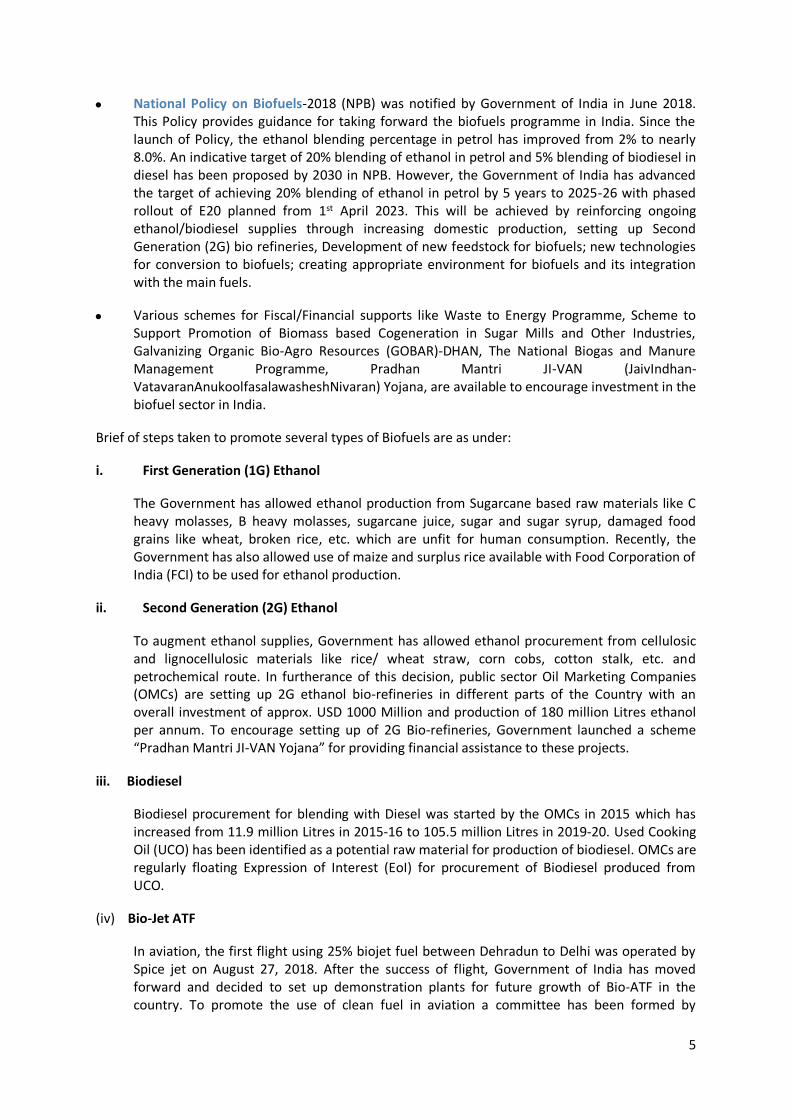
• National Policy on Biofuels-2018 (NPB) was notified by Government of India in June 2018. This Policy provides guidance for taking forward the biofuels programme in India. Since the launch of Policy, the ethanol blending percentage in petrol has improved from 2% to nearly 8.0%. An indicative target of 20% blending of ethanol in petrol and 5% blending of biodiesel in diesel has been proposed by 2030 in NPB. However, the Government of India has advanced the target of achieving 20% blending of ethanol in petrol by 5 years to 2025-26 with phased rollout of E20 planned from 1st April 2023. This will be achieved by reinforcing ongoing ethanol/biodiesel supplies through increasing domestic production, setting up Second Generation (2G) bio refineries, Development of new feedstock for biofuels; new technologies for conversion to biofuels; creating appropriate environment for biofuels and its integration with the main fuels.
• Various schemes for Fiscal/Financial supports like Waste to Energy Programme, Scheme to Support Promotion of Biomass based Cogeneration in Sugar Mills and Other Industries, Galvanizing Organic Bio-Agro Resources (GOBAR)-DHAN, The National Biogas and Manure Management Programme, Pradhan Mantri JI-VAN (JaivIndhan- VatavaranAnukoolfasalawasheshNivaran) Yojana, are available to encourage investment in the biofuel sector in India.
Brief of steps taken to promote several types of Biofuels are as under:
i. First Generation (1G) Ethanol
The Government has allowed ethanol production from Sugarcane based raw materials like C heavy molasses, B heavy molasses, sugarcane juice, sugar and sugar syrup, damaged food grains like wheat, broken rice, etc. which are unfit for human consumption. Recently, the Government has also allowed use of maize and surplus rice available with Food Corporation of India (FCI) to be used for ethanol production.
ii. Second Generation (2G) Ethanol
To augment ethanol supplies, Government has allowed ethanol procurement from cellulosic and lignocellulosic materials like rice/ wheat straw, corn cobs, cotton stalk, etc. and petrochemical route. In furtherance of this decision, public sector Oil Marketing Companies (OMCs) are setting up 2G ethanol bio-refineries in different parts of the Country with an overall investment of approx. USD 1000 Million and production of 180 million Litres ethanol per annum. To encourage setting up of 2G Bio-refineries, Government launched a scheme “Pradhan Mantri JI-VAN Yojana” for providing financial assistance to these projects.
iii. Biodiesel
Biodiesel procurement for blending with Diesel was started by the OMCs in 2015 which has increased from 11.9 million Litres in 2015-16 to 105.5 million Litres in 2019-20. Used Cooking Oil (UCO) has been identified as a potential raw material for production of biodiesel. OMCs are regularly floating Expression of Interest (EoI) for procurement of Biodiesel produced from UCO.
(iv) Bio-Jet ATF
In aviation, the first flight using 25% biojet fuel between Dehradun to Delhi was operated by Spice jet on August 27, 2018. After the success of flight, Government of India has moved forward and decided to set up demonstration plants for future growth of Bio-ATF in the country. To promote the use of clean fuel in aviation a committee has been formed by

6
Government of India which would look into all the aspects of the Bio-ATF program in the country.
(v) Compressed Biogas (CBG)
Government has launched ‘Sustainable Alternative Towards Affordable Transportation (SATAT) initiative under which Public Sector Oil Marketing Companies invite Expression of interest (EOI) to procure CBG from potential entrepreneurs.
Further, India is promoting Research, Development & Demonstration (RD&D) to generate scalable leads and scaling up of the existing technologies for cost-effective production of Biofuels, development of decentralized renewable energy options for rural areas including Waste to Energy, to strengthen international collaboration in Advanced Biofuels and Waste to Energy research.
Table 2: renewable energy and climate targets in India.
Sector Share of renewables in gross
final consumption per sector
Carbon footprint reduction target compared to
base year 2005
Overall target Reduce emission intensity 33%- 35% by 2030*
Reduce the economy’s carbon intensity by less
than 45% by 2030**
Carbon neutrality by 2070**
Electricity 50% by 2030**
Transport 20% blending of ethanol in
petrol and 5% blending of
biodiesel by 2030
* Under the 2015 Paris climate agreement ** Announced at COP26 in November 2021
A description of renewable energy and climate policies and measures in India is available at the IEA’s
Policies and Measures Database: https://www.iea.org/policies?country=India
Specific policies related to renewable electricity, renewable heat and transport biofuels will be
highlighted in the chapters about the role of bioenergy in different sectors.

7
THE CONTRIBUTION OF BIOENERGY IN NATIONAL ENERGY SUPPLY
TOTAL ENERGY SUPPLY
The total energy supply (TES) of India in 2019 amounted to 39.0 exajoule (EJ) with fossil fuels (coal,
oil, gas) contributing more than 75%. Coal (17.5 EJ) is the dominant fuel, representing 45% of total
energy supply. Oil products (9.9 EJ) represents another 25% and natural gas around 6% (2.3 EJ).
Renewable energy sources represent 22% of total energy supply (8.8 EJ), with 88% of it being
bioenergy.
Figure 2: Total energy supply4and the contribution of different energy sources in India, with distribution in 2019 (Source: IEA (2021) World Energy Balances and Renewables Information)
Total energy supply in India has doubled in the past two decades and continues to grow. The amount
of bioenergy is fairly stable at 7-8 EJ, while other types of renewable energy are still at relatively low
level (together 0.5 EJ). In fact, most growth in the past decades has been in fossil fuels (coal, oil, and
gas). Coal has grown at an average pace of 6% per year in the past decades (from 6 EJ in 2000 to 17
EJ in 2019); oil has grown at average pace of 5% per year (from 4.7 EJ in 2000 to 10 EJ in 2019);
4 Total energy supply refers to the use of resources. In terms of the role in the energy system this distribution overestimates the role of resources producing electricity with a high share of unused waste heat (like nuclear plants).

8
natural gas is at much lower level but has also grown at an average pace of 4% per year (from 0.97 EJ
in 2000 to 2.2 EJ in 2019).
As shown in figure 3, solid biofuels represent the major part (99%) of bioenergy in India. Figure 3
shows that most of that amount is used for residential applications, often in inefficient and high
emission operations (“traditional bioenergy”). The amount of solid biomass used for residential
applications increased up to 2011 to more than 6 EJ; there has been a steady decrease afterwards to
5 EJ in 2019. This decrease is partly compensated by an increase in bio-power production from solid
biomass which doubled since 2010.
Figure 3: Development of total energy supply from bioenergy in India 2000 – 2019 (Source: IEA (2021) World Energy Balances and Renewables Information)
Table 3 displays the 2019 total bioenergy supply values on a per capita basis. Compared to the other
24 member countries of IEA Bioenergy (expressed per capita), India ranks rather low for all types of
bioenergy, so has quite some growth potential.
Table 3: Total energy supply per capita in 2019 for different bioenergy carriers
Supply per capita Median IEA
Bioenergy members
Bioenergy 5.7 GJ/cap 10.6
Solid biofuels 5.6 GJ/cap 7.0
Renewable MSW 0.01 GJ/cap 0.8
Biogas 0.01 GJ/cap 0.7
Liquid biofuels 0.03 GJ/cap 1.5
Source: IEA (2021) World Energy Balances and Renewables Information

9
Table 4 indicates the amounts of the different bioenergy carriers compared to some relevant
reference points, namely the amount of forest in the country (for solid biomass), the amount of
generated MSW (for renewable MSW used for energy), the amount of natural gas consumed in the
country (for biogas) and the amount of fossil oil products consumed (for liquid biofuels).
Table 4: Comparison of the supply of different bioenergy carriers in 2019 to specific reference points
Compared to reference points Median*
Bioenergy 19.8 % of total energy supply 7.2 %
Solid biofuels 132.5 GJ/ha_forest compared to the domestic hectares of
forest land (excl. protected)
21.3 GJ/ha_forest
Renewable MSW 0.08 GJ/ton_MSW compared to the total generated MSW
in the country
1.4 GJ/ton_MSW
Biogas 0.009 GJ/GJ_NG compared to natural gas supply 0.023 GJ/GJ_NG
Liquid biofuels 0.005 GJ/GJ_oil compared to oil products supply 0.028 GJ/GJ_oil
Source: energy data from IEA (2021) World Energy Balances and Renewables Information; forest figures from FAOStat; waste figures from World Bank * Median of the 25 member countries of IEA Bioenergy5
Specific comments in relation to the reference points:
• The use of solid biofuels compared to the domestic forest area seems quite high (~7 tons_dry
mass of wood per hectare6). However, most solid biofuels are not sourced from forests, with
important use of dried cow dung, some straw/stubbles and woody biomass harvested from
other land types or post-consumer wood waste.
• Energy production from (the renewable share of) MSW has not substantially developed yet,
however steps are being taken in this regard.
• Liquid biofuels are still at low level, so these also have high growth potential. The same goes for
biogas, however steps are being taken for liquid biofuels and biogas.
5 Comparative figures of the different IEA Bioenergy member countries are discussed in the central Countries’ Report. 6 Counted with a typical calorific value of wood (dry mass) of 19 GJ/ton_dry mass

10
ROLE OF BIOENERGY IN DIFFERENT SECTORS
OVERVIEW
The overall 2019 share of renewables in final energy consumption among electricity, transportation
and heat sectors is 31%, with bioenergy making up 26% of the energy share (Table 5). Mind that
these figures are higher than the shares in total energy supply (where unused waste heat, e.g. in
fossil power production, is also included).
Table 5: Role of bioenergy and renewable energy in electricity, transport energy and fuel/heat consumption in 2019
Sector Share of bioenergy Share of
renewable
energy
Overall consumption
Electricity7 2.9% 20.7%
(10.5% hydro)
1637 TWh (5894 PJ)
Transport energy (final
consumption)
1.0% 1.3% 4396 PJ
Overall fuel and heat
consumption8
Direct biomass: 43.7% 44.0% 14629 PJ
TOTAL FINAL ENERGY
CONSUMPTION
26% 31.0% 24838 PJ
Source: IEA (2021) World Energy Balances and Renewables Information
The following paragraphs will consider the evolutions in the different sectors.
ELECTRICITY
Power production in India has seen important growth in the past decades, with coal being the
dominating factor in this growth, representing more than 70% of power production. In the past 10
years coal power almost doubled from around 650 TWh to 1200 TWh. The role of natural gas peaked
at 13% of power generation around 2009, but came down to 4% in recent years. The share of
nuclear energy was relatively stable around 3% of power in the past decade.
Hydropower is the dominant source of renewable electricity with 10% of total electricity production.
In the past 10 years there was also a consistent growth of wind energy (now at 4%) and solar energy
(now at 3%). The role of bio-electricity is relatively modest around 3% but has also grown in the past
decade.
7Renewable electricity production compared to final consumption. Potential renewable shares of imported electricity are not included. 8This includes final consumption of fuels and heat in industry, the residential sector, commercial and public services and agriculture/forestry. Transport fuels are excluded. Energy used for transformation and for own use of energy producing industries is also excluded. Electric heating (direct or through heat pumps) is not included in these figures as this is not separately reported.

11
Figure 4: Evolution of the electricity mix in India2000 – 2019 (Source: IEA (2021) World Energy Balances and Renewables Information)
Policy framework
The main relevant policy instruments behind these evolutions are:
• Electricity Act of 2003
• Amended National Tariff Policy-2016
• Policy on Biomass utilisation for power generation through co-firing in coal based power plants (November, 2017)
• Declaration of power generated from cofiring of biomass in the thermal power plants is Renewable energy and is eligible for meeting non-solar Renewable Purchase obligation (RPO) (September 2019)
• Directions to appropriate Commissions to consider (a) exemption of all applicable charges (except wheeling and the transmission charges) under interstate Open Access sale of power from Municipal Solid Waste to Power plants and (b) relaxation of DSM for municipal Solid Waste to Power plants similar to the relaxation given to the Solar and Wind power plants. (July 2021)
• Waste to Energy Programme for converting municipal solid waste, industrial and agricultural

12
waste into energy in the form of Biogas, BioCNG, Power.
• Biomass based Cogeneration Programme (launched in May 2018) for promoting cogeneration for optimum use of country’s biomass resources through cogeneration technology in sugar mills and other industries (rice, paper mills, etc).
• Availability of Concessional custom duty for import of machinery and components for required for initial setting up of projects for generation of Power and BioCNG from non-conventional materials namely agricultural, forestry, agro-industrial, industrial, municipal and urban waste, bio waste or poultry litter.
HEAT/FUEL
Figure 5 shows the role of different fuels/energy carriers for providing heat in different sectors
(industry, residential sector, commercial and public services and other). Fuel use by energy
producing industries for transformation and for own use is excluded. Mind that electric heating
(direct or through heat pumps) is not included in these figures as this is not separately reported in
the IEA database.
Figure 5: Evolution of fuel and heat consumption in India 2000 – 2019 (Source: IEA (2021) World Energy Balances and Renewables Information)

13
The provision of heat is mixed between (mostly traditional) biomass and fossil fuels (coal & oil).
While the use of biomass is slightly going down, coal and oil are steadily increasing.
Biomass represents 78% of fuel consumption in residential applications, while only 20% of fuel
consumption in industry, where fossil fuels are dominant.
Policy framework
The main relevant policy instruments behind these evolutions are:
• The Waste to Energy Programme has focused on converting municipal solid waste, industrial and agricultural waste into energy in the form of Bioethanol, Biogas, BioCNG, Power.
• The National Biogas and Manure Management Programme, first implemented in 1981 by the Ministry of New and Renewable Energy (MNRE), has promoted the use of biogas produced from cattle manure and other organic waste. This program helped establish small-scale biogas plants that families in rural areas can use to obtain cooking fuel and organic fertilizer.
TRANSPORT
Figure 6 shows an overview of the energy used in transport in India, split up by different
fuels/energy carriers.
In the past decades transport fuel consumption grew at an average pace of 6% per year. Diesel is the
dominant fuel, representing 60% of transport fuel consumption; gasoline represents 30% and other
oil-based fuels (mainly jet fuel) 5%. There is also a substantial use of natural gas in transport at 3% of
overall transport fuel consumption and its share is slightly growing.
The uptake of biofuels – mostly bioethanol - has been relatively low; it started to accelerate in
recent years, and currently represents around 1% of transport energy use in India, with the main
focus on bioethanol. In 2019 bioethanol represented 3% by energy of gasoline consumption.
Electricity represents a share of 1.6% of total transport energy use. This is mostly in rail – there is no
reporting of electricity use in road vehicles.

14
Figure 6: Evolution of transport fuels in India2000 – 2019 (Source: IEA (2021) World Energy Balances and Renewables Information)
Policy framework
The main relevant policy instruments behind these evolutions are:
• Mass emission standard for flex-fuel (E85) or (E100) and Ethanol (ED95) vehicles has been published to facilitate manufacturing of vehicles with such fuels.
• Mass emission standards for flex-fuel Methanol M15 or M100 and Methanol MD95 vehicles has been framed and published to facilitate type approval and manufacturing of vehicles with such fuels.
• Mass emission standards for Ethanol-20 (E20), Biodiesel (B100), Bio CNG, LNG, M85 and Di-Methyl Ether (DME or D100) have been published.
• Hydrogen CNG(HCNG), which is a blend of 18% of Hydrogen with CNG has been considered as automotive fuel.
• Rules for Retro-fitment of hybrid electric system or electric kit to vehicles and their compliance standards have been issued.
• Government of India amended the Central Motor Vehicles Rules, 1989 in June 2015 and included the provisions for usage of biogas, in the form of bio-CNG, in motor vehicles produced

15
from waste.
• The supply of Bharat Stage-VI (BS-VI) (equivalent to Euro-VI) autofuels has started throughout the country w.e.f. 1st April, 2020.
• National Policy on Biofuels-2018: The Policy expands the scope of raw material for 1G ethanol production by allowing use of new feedstocks. Policy indicates the financial assistance schemes for advanced biofuel projects and also encourages setting up of supply chain mechanisms for biodiesel production from non-edible oilseeds, Used Cooking Oil, short gestation crops.
• Under the Ethanol Blended Petrol (EBP) program, oil marketing companies (OMCs) can sell petrol blended up to 10% ethanol (E10) depending upon its availability. In order to augment the supply of ethanol for EBP, the Government decided to administer ethanol prices. This combined with a slew of other measures, such as easing restrictions on the movement of ethanol between states; allowing more sources of feedstocks for production of ethanol including sugar, sugar cane, sugar syrup, damaged food grain, surplus stock of rice available with FCI, maize etc.
• The Government of India has notified the “Pradhan Mantri JI-VAN (JaivIndhan-Vatavaran Anukoolfasalawashesh Nivaran) Yojana” which will provide financial assistance of approximate $300 million US for the period from 2018-19 to 2023-24 for supporting commercial projects as well as demonstration projects for Advanced Biofuel projects.
• To facilitate the production of Biodiesel from Used Cooking Oil (UCO), the Oil Marketing Companies are regularly floating Expressions of Interest (EOI) for procurement of Biodiesel from Used Cooking Oil across 200 locations.
• Under Sustainable Alternative Towards Affordable Transportation (SATAT) initiative, public sector oil and gas marketing companies have invited EOI to procure Compressed Bio Gas (CBG) from potential entrepreneurs for the establishment of 5,000 CBG plants across the country with an estimated production of 15 MMT CBG per annum by 2023-24.

16
RESEARCH FOCUS RELATED TO BIOENERGY
Currently, India is promoting Research, Development & Demonstration (RD&D) by supporting dedicated Bioenergy Centres, Capacity Building in terms of Human Resource and Infrastructure support in the areas of Synthetic Biology, Algal Biofuels, Enzyme Development, Biohydrogen, CO2 Capturing and Utilization and Biovalorization for development of 2nd and next-generation Biofuels and value-added products in a cost-effective manner, brief of which are as under:
i. Research on advanced biofuels-2G ethanol, algal biofuel, bio-hydrogen, bio-butanol, drop-in-fuels, bio-aviation, and marine fuels, carbon capture & utilization.
ii. Indian Institute of Petroleum (IIP) has developed indigenous technology for production of bio-jet fuel from non-edible oil (Jatropha).
iii. Promoting technologies for converting Waste into energy or value-added products.
iv. Quality feedstock for biofuel and to create repositories / well-characterized germplasm bank.
v. Development of integrated technologies for ‘Bioeconomy’ through the bio-refinery concept.
vi. To develop technologies for renewable chemicals and biopolymers/ materials to replace fossil-based products.
vii. To promote innovation and RD&D in second generation biofuels including various schemes to support innovation and Demonstration to start ups, industry, and international collaboration (both bilateral & multilateral projects).
viii. Hydrogen production through various renewable pathways.

17
RECENT MAJOR BIOENERGY DEVELOPMENTS
i. The Government of India has advanced the target of achieving 20% blending of ethanol in petrol by 5 years to 2025-26.
ii. The Government of India has allowed of maize and surplus rice available with Food Corporation of India (FCI) to be used for ethanol production.
iii. India is committed in developing and demonstrating technologies for bio-based renewable fuels, chemicals, and materials to replace the petrochemical products contributing to greenhouse gases emissions reductions.
iv. Under Mission Innovation 2.0, India and the US are co-leading the Mission Innovation Collaborative platform initiative on “Innovation for Sustainable Aviation Fuel” (ISAF).
v. Galvanizing Organic Bio-Agro Resources (GOBAR)-DHAN, announced on February 1, 2018, is an effort to improve sanitation in Indian villages by processing livestock manure and solid agricultural waste to produce biogas.
vi. In India's quest to promote Hydrogen as a clean fuel for the mobility sector, Hydrogen-
blended HCNG is emerging as an excellent interim technology for achieving emissions
reduction and import substitution. One compact reformer plant and trial run of 50 buses
has been started on 20th October 2020.
vii. Bio manures produced from CBG plants has now been included as Fermented Organic
Manure and Fermented Liquid Organic Manure under Fertilizer category for retail sale in
the country.
18
LINKS TO SOURCES OF INFORMATION
DBT-Bioenergy: https://dbtindia.gov.in/schemes-programmes/research-development/energy-
environment-and-bio-resource-based-applications-1
BIRAC: https://www.birac.nic.in
CEIIC: https://ceiic.socialalpha.org
Mission Innovation India Unit: http://mission-innovation-india.net
Clean Energy transitions: Accelerating Innovation beyond 2020: http://mission-innovation-
india.net/reports/ - developed under DBT IEA joint collaboration for Mission Innovation
https://www.ppac.gov.in/ for data on fossil fuels production, consumption, Import & Export
https://www.mnre.gov.in/ for data on R&D projects.
https://www.siamindia.com/ for data on automotive industry.
https://www.iocl.com/ for data on R&D projects.
https://mopng.gov.in/en for data on R&D projects.
The IEA Bioenergy Technology Collaboration Programme (TCP) is organised under the auspices of the International Energy Agency (IEA) but is functionally
and legally autonomous. Views, findings and publications of the IEA Bioenergy TCP do not necessarily represent the views or policies of the IEA Secretariat
or its individual member countries.