Bioenergy Thematic Study -...
62
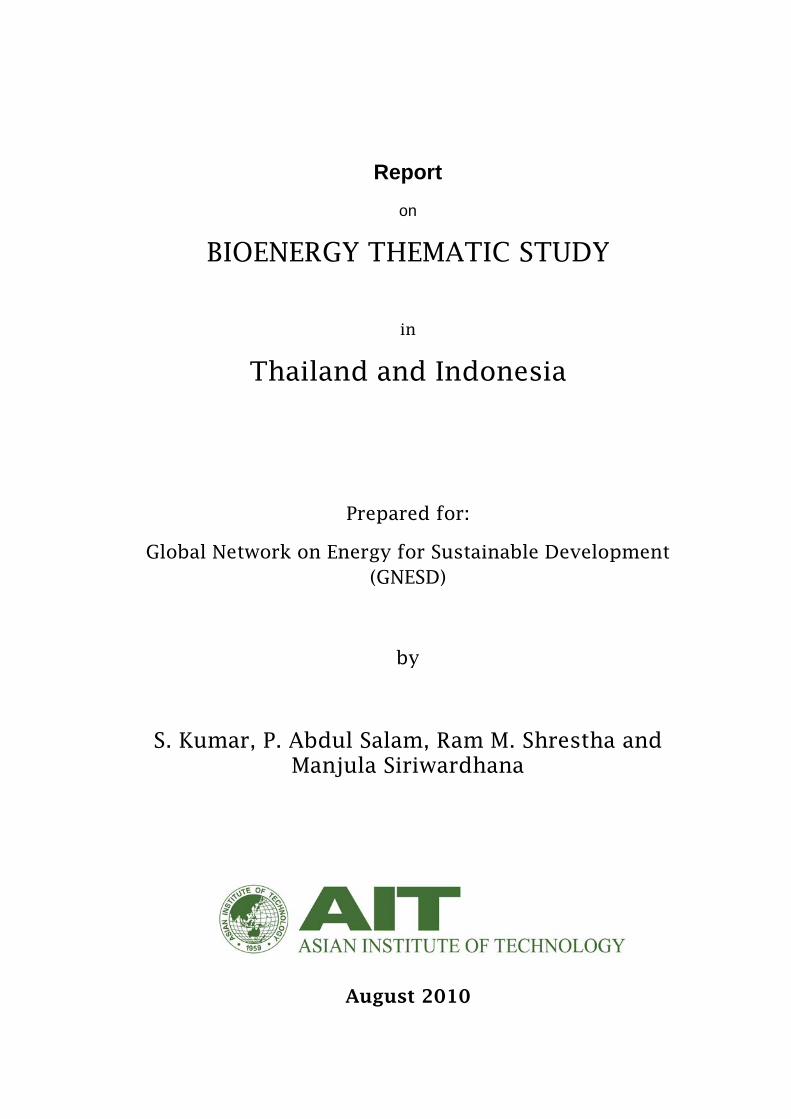
Report on BIOENERGY THEMATIC STUDY in Thailand and Indonesia Prepared for: Global Network on Energy for Sustainable Development (GNESD) by S. Kumar, P. Abdul Salam, Ram M. Shrestha and Manjula Siriwardhana August 2010
Transcript of Bioenergy Thematic Study -...
Report on
BIOENERGY THEMATIC STUDY
in
Thailand and Indonesia
Prepared for:
Global Network on Energy for Sustainable Development (GNESD)
by
S. Kumar, P. Abdul Salam, Ram M. Shrestha and Manjula Siriwardhana
August 2010
i
BIOENERGY THEMATIC STUDY
Table of Content
Contents Page
1. Introduction 1
2. Status and potential of bioenergy 3
2.1 Status and potential of bioenergy in Thailand 3 2.2 Status and potential of bioenergy in Indonesia 8
3. Review of the current bioenergy programs/policies in Thailand and
Indonesia 14 3.1 Programs and policy instruments for bioenergy development promotion in
Thailand 14 3.2 Environmental and social aspects of biofuel development plans in
Thailand 27 3.3 Programs and policy instruments for bioenergy development promotion in
Indonesia 28 3.4 Environmental and social aspects of biofuel development plans in
Indonesia 34
4. Case studies 37
5. Conclusions 50
References 52
ii
List of Tables
Table No. Title Page 1 Agricultural residues in Thailand, 2007 4 2 Status of biomass power generation capacity of SPPs and VSPPs (Oct 2007) 5 3 Potential of ethanol and biodiesel production by type of crops in Thailand 7 4 Potential of biogas production from different industries 7 5 Biogas based electricity generation capacity in Thailand 8 6 Renewable energy potential in Indonesia 9 7 Ethanol production in Indonesia, 2005 12 8 Thailand’s target of renewable and alternative energy use in 2011 15 9 Adder to the normal tariff for SPPs and VSPPs and “Extra Adder”
approved by the Thai Cabinet on 24th March, 2009 18 10 Power Purchase Program from SPPs in Thailand 20 11 Summary status of SPP and VSPP projects in Thailand in 2008 20 12 Estimation of demand in crude palm oil for biodiesel industries in Thailand 27 13 Target of contribution to Indonesia energy mix by 2025 28 14 Biofuel mandatory targets in Indonesia 30 15 Targeted share of biofuel in the total primary energy mix in Indonesia 30 16 Biofuel utilization and potential market in Indonesia in 2015 31 17 Plan of Energy Self Sufficient Villages program in Indonesia 32 18 Project description of rice husk fired power plant at Pichit Province, Thailand 37 19 Price of rice husk delivered to the Plant at Pichit Province, Thailand 39 20 Project description of landfill gas power plant at Kamphangsaen, Thailand 41 21 Project description of palm oil residue power plant at Riau, Indonesia 44 22 Project description of rice husk power plant at Lampung, Indonesia 45 23 Overall products from the biodiesel plant at Sumbawa, Indonesia 47

iii
List of Figures
Figure No. Title Page 1 Biofuel consumption in Indonesia 2006-2008 12 2 Power generation targets from renewable energy in Thailand 2002-2011 15 3 Estimated contribution of renewable energy in Thailand in 2011 and 2022 16 4 Sales of gasohol and unleaded gasoline 95 in Thailand 24 5 Contributions of different tax reductions for gasohol 95 (Thailand) 25 6 Demand for biodiesel (B 100) in Thailand 26 7 The target of national primary energy mix in Indonesia in 2025 28 8 Variation of the prices of biodiesel and petroleum diesel during 2006- 2008 33 9 Prices of crude palm oil and crude petroleum oil, June 2005 to December 2008 35 10 Plant location of rice husk fired power plant at Pichit Province, Thailand 38 11 Plant location of palm oil residue power plant at Riau, Indonesia 44 12 Plant location of jatropha biodiesel plant at Sumbawa, Indonesia 47 13 Importance of the plant location of jatropha biodiesel plant at Sumbawa,
Indonesia 48 14 Existing plantation areas for the jatropha based biodiesel plant at Sumbawa,
Indonesia 48 15 Schematic diagram of community involvement in a jatropha based biodiesel plant
at Sumbawa, Indonesia 49
iv
Abbreviations
AIT - Asian Institute of Technology BOI - Board of Investment CDM - Clean Development Mechanism CJO - Crude Jatropha Oil CPO - Crude Palm Oil DEDE - Department of Alternate Energy Development and Efficiency, Thailand DGEEU - Directorate General of Electricity and Energy Utilization, Indonesia EFB - Empty Fruit Bunch EGAT - Electricity Generating Authority of Thailand ENCON - Energy Conservation and Promotion Fund, Thailand ESSV - Energy Self Sufficient Village, Indonesia FAO - Food and Agriculture Organization GHG - Greenhouse gas GNESD - Global Network on Energy for Sustainable Development GWh - Giga Watt hours IPP - Independent Power Producer LPG - Liquified Petroleum Gas MEA - Metropolitan Electricity Authority, Thailand MOU - Memorandum of Understanding MSW - Municipal Solid Waste MTBE - Methyl Tertiary-Butyl Ether MW - Mega Watt NG - Natural gas NGV - Natural gas vehicle PDP - Power Development Plan PLN - State Electricity Company, Indonesia (Perusahaan Listrik Negara) RE - Renewable energy RID - Royal Irrigation Department, Thailand RPS - Renewable Portfolio Standard SME - Small and medium enterprises SPP - Small Power Producer Toe - Ton of oil equivalent TPES - Total primary energy supply ULG - Unleaded gasoline VSPP - Very Small Power Producer
v
Executive summary
Biomass is currently the fourth largest source of the energy worldwide and is expected to play a key role in mitigation of greenhouse gas emission and enhancing sustainability of energy supply in future. The main barrier to use biomass as fuel include its high investment cost, low conversion efficiency, difficulties in transportation, price of biomass residues, and seasonal dependency for the production of biomass. Moreover, moisture content is another major issue for biomass utilization. Biomass utilization needs pre-treatment and technologies. Besides, technologies know-how and its transfer to the operators need to be considered. Moreover, policies/measures, raw material supply, demand side management and users’ awareness need to be taken into account. Therefore, large scale biomass exploitation faces a number of barriers. This study shows that the potential of bioenergy utilization is high in Thailand and Indonesia in all three main forms: biomass power, biogas, and biofuels (i.e., ethanol and biodiesel). Moreover, these countries have developed policies/ measures to support bioenergy development and utilization. Thailand has planned to substitute fossil fuel by using 20.3% of renewable energy in its total energy supply in 2022, and the share of bioenergy is expected to be about 13.6% of total primary energy supply. Indonesia plans to use 17% new renewable energy in 2025 and bioenergy would contribute atleast 5% of total energy supply. Roadmaps for bioenergy use have been developed for these two countries. The report also brings out the salient features regarding the policies to promote bioenergy use in the two countries. Four case studies of biomass based energy use are presented.
1
BIOENERGY THEMATIC STUDY
in
Thailand and Indonesia
1. Introduction
Biomass is currently the fourth largest source of the energy worldwide and is expected to play a key role in mitigating greenhouse gas emissions and enhancing sustainability of energy supply in the future. Biomass fuels in developing countries are mostly used in the residential sector mainly for cooking purposes. In terms of economic growth and improvement in quality of life, the shift from biomass cooking stove to LPG and electricity are important. However, in terms of energy security, biomass energy is an important source not to be ignored. Bioenergy derived from sustainable agricultural practices provides an opportunity for developing countries to utilize their resources and attract the necessary investment to accelerate their sustainable development process. Some of the potential benefits include: environmental benefits from the reduction of greenhouse gases (GHG) and the recuperation of soil productivity and degraded land; economic benefits from the increased activity resulting from improving access to and quality of energy services, and international benefits derived from the development of sustainable bioenergy trade. The main barrier to the use of biomass as fuel in commercial or industries or for power generation are its high investment cost, low conversion efficiency, difficulties in transportation, seasonal dependency, and moisture content. To mitigate the above barriers, countries need to consider not only technologies development of biomass utilization by increasing conversion efficiency, but on technologies know-how and transfer to the operators. Moreover, policy/measures, raw material supply, demand side management and users’ awareness, and financial support are to be well thought-out. This thematic study developed by the GNESD Network and coordinated by CENBIO/CentroClima, has the main objective to carry out an initial assessment of the potentials of bioenergy for all types of bioenergy i.e. liquid, solid, and gas. This report focuses on Thailand and Indonesia - two major economies in South East Asia. Being two major agriculture based countries, Thailand and Indonesia are advantaged with a plentiful supply of agriculture residues and other forms of biomass resources and favorable
2
environment for plantation. Biomass is already an important source of energy in both countries. Chapter 2 of this report reviews the literature on biomass resources potential and availability and identifies the current bioenergy programs in the two countries. Chapter 3 presents an overall review of the policies in the two countries on bioenergy utilization for all three types of bioenergy. The contribution of bioenergy projects towards rural development and poverty alleviation through agro-industrial development, job creations and development of SMEs has been studied and the implication for structure of agriculture, food security and the government budget by bioenergy subsidies analyzed in Chapter 3 of the report. This diversity holds the potential of a win-win-win development path for the environment, social and economic development, and energy security. Social and environmental benefits and the key issues and barriers for the sustainability of biomass utilization have been discussed. The case studies for all three types of bioenergy projects illustrate the nature and characteristics of biomass potential and supply, role of policies, and the application of the various forms of bio energy.

3
2. Status and Potential of Bioenergy 2.1 Status and potential of bioenergy in Thailand
This section describes the status and potential of bioenergy – solid biomass, liquid biofuels and biogas in Thailand. In 2008 Thailand’s total commercial primary energy consumption was 101,953 thousand tons of crude oil equivalence (ktoe) (DEDE, 2008a). During the 1970’s approximately 90% of Thailand’s commercial primary energy consumption (including non-energy use) was imported, mostly petroleum products. The discovery of natural gas in the Gulf of the Thailand and lignite in the Northern part of the country reduced Thailand’s import dependence to about 60%. The country’s dependence on imported energy has remained at 55-62% since the mid 1980’s while about 70% of electricity is generated from natural gas since 2001 (Amranand, 2008). The domestic demand for commercial primary energy has been growing at an annual compound growth rate of 7.6% during the period 1985-2007 resulting in import dependence remaining at 60% (Amranand, 2008). Thailand’s Ministry of Energy estimates that the potential of power generation in Thailand from biomass, municipal solid wastes (MSW) and biogas is 3,700 MW by 2011 (Amranand, 2008). Apart from bagasse, paddy husk and woodchips, other sources with good potential are municipal wastes, biogas from pig farms and other types of agro-industry, corn cob, wastes from palm oil factories, and micro hydro. This means that there is a potential to generate another 1,700 MW of power from renewable energy excluding wind and solar energy (Amranand, 2008). Thai Ministry of Energy, in its 15 year renewable energy plan for 2008-2022, targets to increase its supply from alternative energy sources to 20.4%. In the plan, biomass shares 84% of total electricity generation from renewable sources and 91% of thermal energy applications from total thermal energy from renewable sources. Biofuels, which are mainly derived from biomass, represents 29% of total renewable energy demand. Therefore, bioenergy is targeted to play a major role in Thai government’s renewable energy development plan (DEDE, 2008b). 2.1.1. Solid Bioenergy Biomass has been the traditional energy source in Thailand. The various types of biomass available are mostly in the form of non plantation resources: (i) agricultural residues, (ii) residues from wood and furniture industry, (iii) animal manure, (iii) municipal solid wastes and landfill gas, and, (iv) waste water (Garivait et.al, 2006). The estimated agricultural residues available in Thailand are more than 65 Million tons per year as shown in Table 1. The major residues are from sugar cane, paddy and oil palm; they contribute to more than 95% of all agricultural residues. The main problems associated with the use of agricultural residues are its high cost for collection and transportation. The

4
agriculture residues used in 2007 was around 5 Million tons (DEDE, 2007), indicating that less than 10% of the available residues are currently used.
Table 1: Agricultural residues in Thailand, 2007
Product Residue Residue available for energy (Mt) 2005 2010
Sugarcane Bagasse 15.90 17.15 Top & trash 18.94 20.42
Paddy Husk 5.46 5.67 Straw (top) 7.26 7.54
Oil palm
Empty bunches 1.06 1.37 Fiber 0.59 0.76 Shell 0.12 0.16 Frond 10.50 13.53 Male bunches 0.94 1.21
Coconut
Husk 0.45 0.45 Shell 0.18 0.18 Empty bunches 0.07 0.07 Frond 0.31 0.31
Cassava Stalk 0.57 0.52 Maize Corn cob 1.17 1.31 Groundnut Shell 0.05 0.05 Cotton Stalk 0.24 0.24
Soybean Stalk, leaves, shell 0.73 0.73
Sorghum Leaves & stem 0.25 0.28 Total 64.80 71.95
Source: Sajjakulnukit et.al, 2005
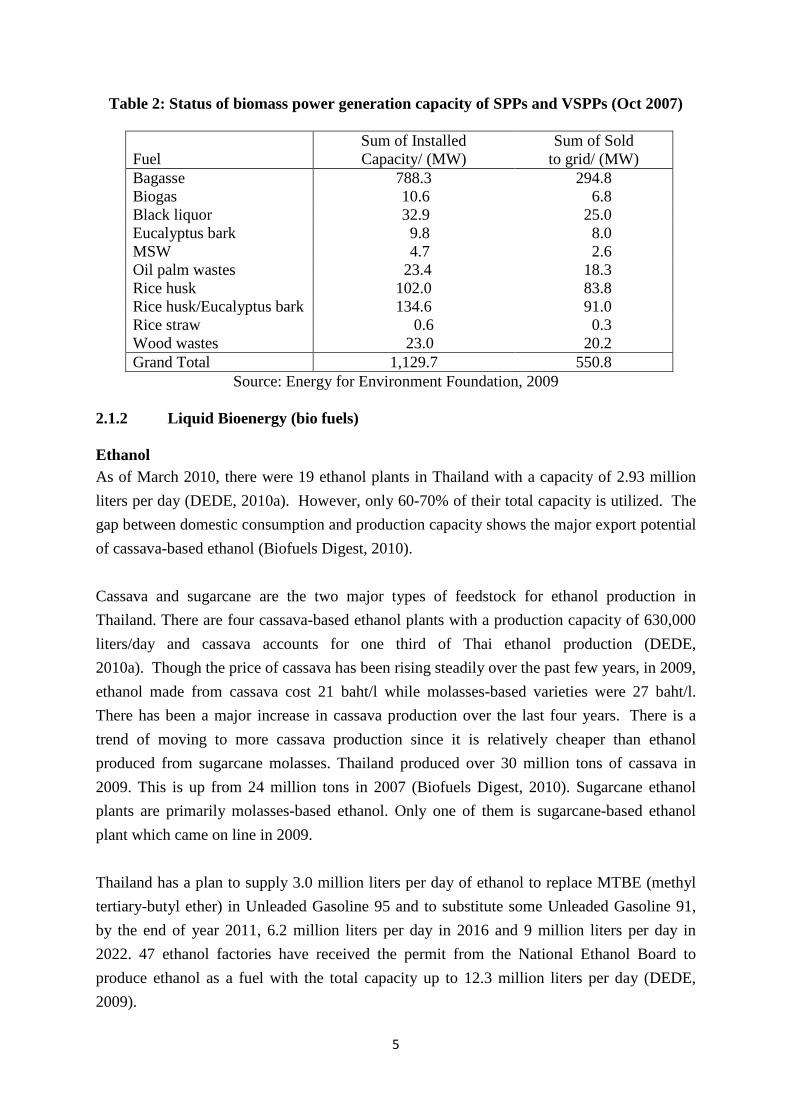
The main agricultural residues from paddy (rice husk, rice straw), sugarcane (bagasse, leave, etc) are used for electricity generation of SPPs (Small Power Producers) and VSPPs (Very Small Power Producers). The number of biomass-based power generation plants increased from 35 plants in 2006 with total capacity of about 574 MW to 54 plants with total capacity of 1,129.75 MW in 2007 (Table 2). These plants use only 5% of the residue potential. However most of these biomass power plants are large rice factories, paper mills and palm oil factories.
5
Table 2: Status of biomass power generation capacity of SPPs and VSPPs (Oct 2007)
Fuel Sum of Installed Capacity/ (MW)
Sum of Sold to grid/ (MW)
Bagasse 788.3 294.8 Biogas 10.6 6.8 Black liquor 32.9 25.0 Eucalyptus bark 9.8 8.0 MSW 4.7 2.6 Oil palm wastes 23.4 18.3 Rice husk 102.0 83.8 Rice husk/Eucalyptus bark 134.6 91.0 Rice straw 0.6 0.3 Wood wastes 23.0 20.2 Grand Total 1,129.7 550.8
Source: Energy for Environment Foundation, 2009 2.1.2 Liquid Bioenergy (bio fuels) Ethanol As of March 2010, there were 19 ethanol plants in Thailand with a capacity of 2.93 million liters per day (DEDE, 2010a). However, only 60-70% of their total capacity is utilized. The gap between domestic consumption and production capacity shows the major export potential of cassava-based ethanol (Biofuels Digest, 2010). Cassava and sugarcane are the two major types of feedstock for ethanol production in Thailand. There are four cassava-based ethanol plants with a production capacity of 630,000 liters/day and cassava accounts for one third of Thai ethanol production (DEDE, 2010a). Though the price of cassava has been rising steadily over the past few years, in 2009, ethanol made from cassava cost 21 baht/l while molasses-based varieties were 27 baht/l. There has been a major increase in cassava production over the last four years. There is a trend of moving to more cassava production since it is relatively cheaper than ethanol produced from sugarcane molasses. Thailand produced over 30 million tons of cassava in 2009. This is up from 24 million tons in 2007 (Biofuels Digest, 2010). Sugarcane ethanol plants are primarily molasses-based ethanol. Only one of them is sugarcane-based ethanol plant which came on line in 2009. Thailand has a plan to supply 3.0 million liters per day of ethanol to replace MTBE (methyl tertiary-butyl ether) in Unleaded Gasoline 95 and to substitute some Unleaded Gasoline 91, by the end of year 2011, 6.2 million liters per day in 2016 and 9 million liters per day in 2022. 47 ethanol factories have received the permit from the National Ethanol Board to produce ethanol as a fuel with the total capacity up to 12.3 million liters per day (DEDE, 2009).
6
The Ministry of Energy has measures to promote gasohol E20 by using price promotion option; retail price of gasohol E20 is lower than gasohol 95 (E10) by 2.0 Baht per liter and lower than gasoline 95 by 6.0 Baht per liter. Moreover, the Thai government has a plan to supply E85 within 10 years to reduce import of petroleum products worth 447,377 million Baht and it can also reduce GHG emissions by 27.8 million tCO2 per year. It can increase income of the farmers. Biodiesel As of March 2010, there were 14 biodiesel production plants with the total capacity of (B100) 5.9 million liters/ day (DEDE, 2010b). Crude palm oil and palm stearin are the two major feedstock used in Thailand for producing biodiesel. Out of 14 plants, there are two large scale plants, which use used cooking oil as the feedstock (DEDE, 2010b). Biodiesel production increased significantly from 68 million liters in 2007 to 448 million liters in 2008 and 610 liters in 2009 due to a compulsory B2 production policy. It is anticipated that production will grow by an additional 10 percent in 2010 and 42 percent in 2011, as B3 production mandate comes into effect in mid 2010 and will be replaced by B5 production mandates in 2011 (GAIN, 2010). Thailand had a plan to supply approximately 8.5 million liters per day of biodiesel to substitute 10% of diesel demand in 2012. In 2005, the total cultivated area of palm oil was about 3,680 km2 (DEDE, 2005). This plan has been revised to 3 million liters per day of biodiesel in 2011, 3.64 million liters per day supply in 2016 and 4.5 million liters per day supply in 2022. The main reasons of the new revised plan are: (i) palm tree needs to grow in suitable soil and climate conditions to produce high percentage of oil, and (ii) palm seeds will be produced after 4 years of its cultivation. It costs approximately 70,000 million Baht to promote 6,400 km2 of land for palm production (DEDE, 2005). Table 3 shows that the estimated biodiesel production from palm oil is 1.54 million liters per year. Therefore, other types of vegetable oil such as Jatropha or the synthesis biodiesel by using lignocellulosic material should be considered as the second generation of biodiesel production and for long term supply of biodiesel. The Ministry of Energy has plans to promote biodiesel manufacture on a community scale for self sufficiency economy for the local use. 72 communities participate in this program, and the capacity of each plant is minimum 100 liters per day.
7
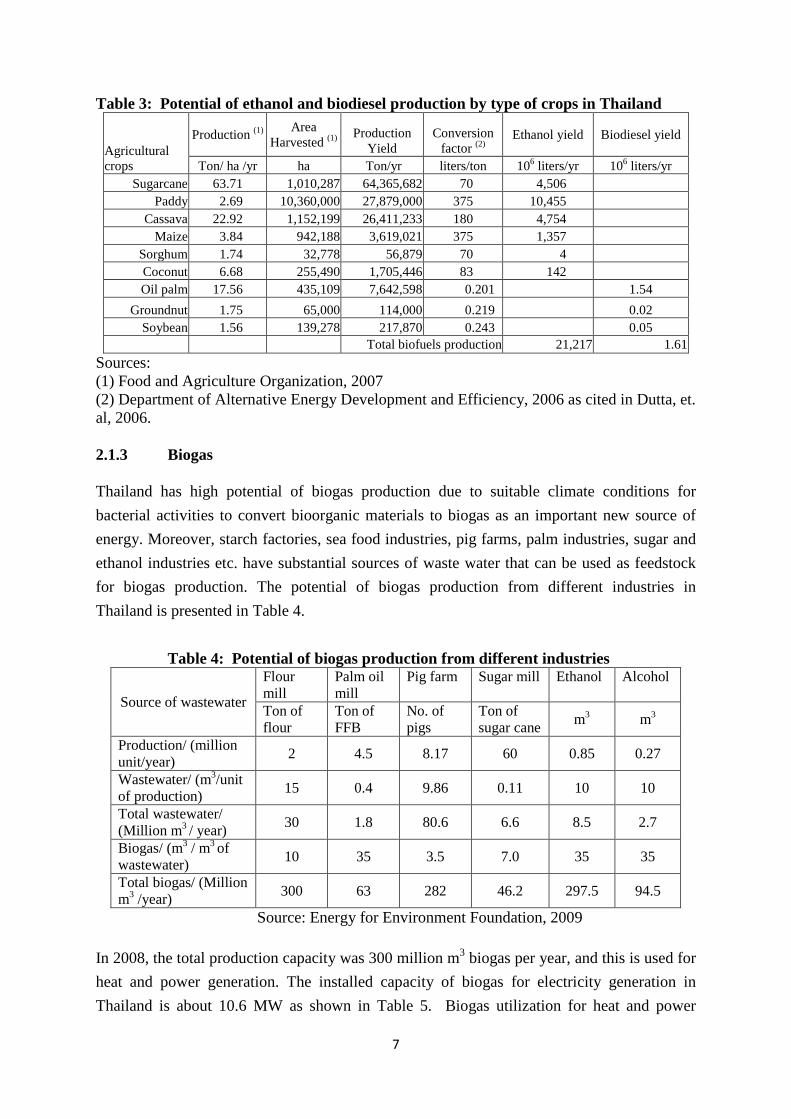
Table 3: Potential of ethanol and biodiesel production by type of crops in Thailand
Agricultural crops
Production (1) Area Harvested (1)
Production Yield
Conversion factor (2)
Ethanol yield Biodiesel yield
Ton/ ha /yr ha Ton/yr liters/ton 106 liters/yr 106 liters/yr Sugarcane 63.71 1,010,287 64,365,682 70 4,506
Paddy 2.69 10,360,000 27,879,000 375 10,455 Cassava 22.92 1,152,199 26,411,233 180 4,754
Maize 3.84 942,188 3,619,021 375 1,357 Sorghum 1.74 32,778 56,879 70 4 Coconut 6.68 255,490 1,705,446 83 142 Oil palm 17.56 435,109 7,642,598 0.201 1.54
Groundnut 1.75 65,000 114,000 0.219 0.02 Soybean 1.56 139,278 217,870 0.243 0.05
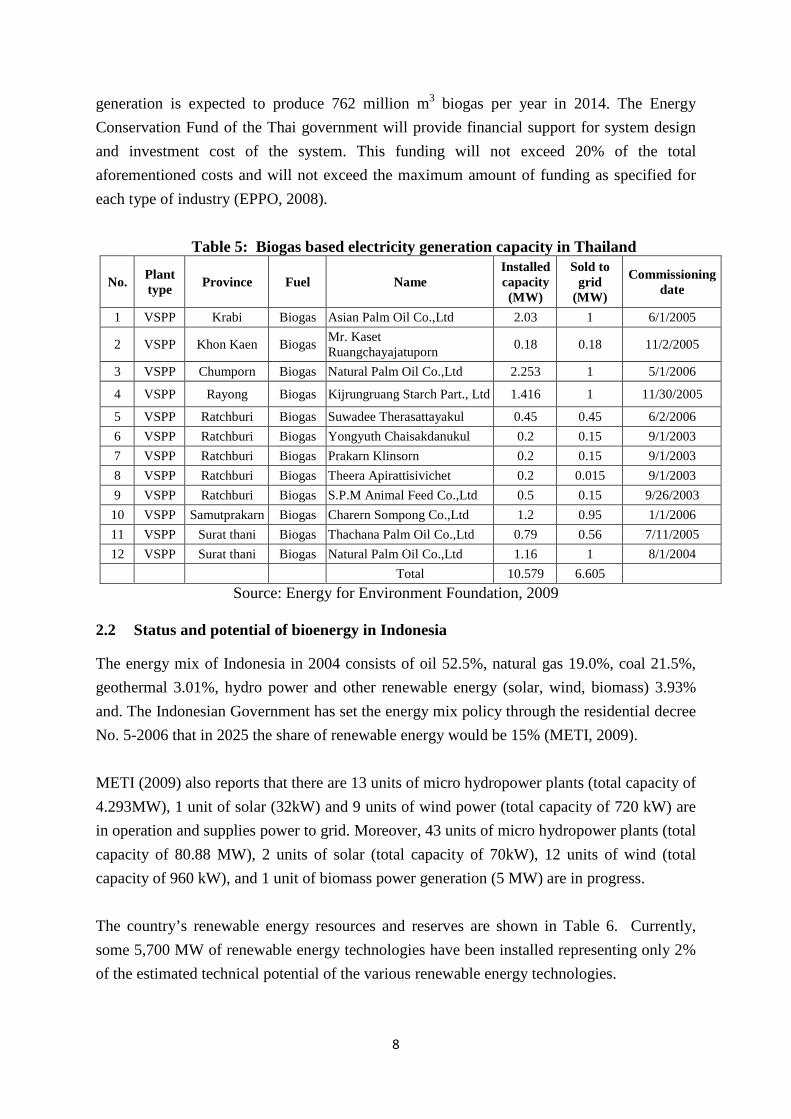
Total biofuels production 21,217 1.61 Sources: (1) Food and Agriculture Organization, 2007 (2) Department of Alternative Energy Development and Efficiency, 2006 as cited in Dutta, et. al, 2006. 2.1.3 Biogas Thailand has high potential of biogas production due to suitable climate conditions for bacterial activities to convert bioorganic materials to biogas as an important new source of energy. Moreover, starch factories, sea food industries, pig farms, palm industries, sugar and ethanol industries etc. have substantial sources of waste water that can be used as feedstock for biogas production. The potential of biogas production from different industries in Thailand is presented in Table 4.
Table 4: Potential of biogas production from different industries
Source of wastewater
Flour mill
Palm oil mill
Pig farm Sugar mill Ethanol Alcohol
Ton of flour
Ton of FFB
No. of pigs
Ton of sugar cane m3 m3
Production/ (million unit/year) 2 4.5 8.17 60 0.85 0.27
Wastewater/ (m3/unit of production) 15 0.4 9.86 0.11 10 10
Total wastewater/ (Million m3 / year) 30 1.8 80.6 6.6 8.5 2.7
Biogas/ (m3 / m3 of wastewater) 10 35 3.5 7.0 35 35
Total biogas/ (Million m3 /year) 300 63 282 46.2 297.5 94.5
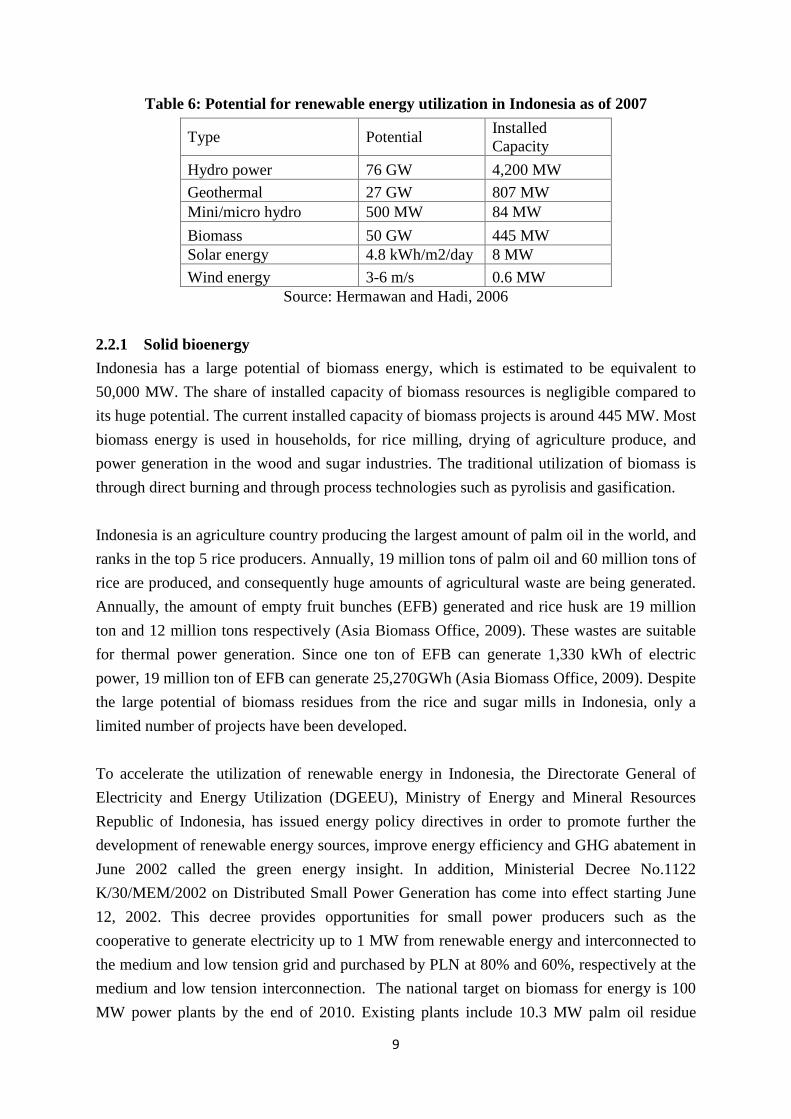
Source: Energy for Environment Foundation, 2009 In 2008, the total production capacity was 300 million m3 biogas per year, and this is used for heat and power generation. The installed capacity of biogas for electricity generation in Thailand is about 10.6 MW as shown in Table 5. Biogas utilization for heat and power
8
generation is expected to produce 762 million m3 biogas per year in 2014. The Energy Conservation Fund of the Thai government will provide financial support for system design and investment cost of the system. This funding will not exceed 20% of the total aforementioned costs and will not exceed the maximum amount of funding as specified for each type of industry (EPPO, 2008).
Table 5: Biogas based electricity generation capacity in Thailand
No. Plant type Province Fuel Name
Installed capacity (MW)
Sold to grid
(MW)
Commissioning date
1 VSPP Krabi Biogas Asian Palm Oil Co.,Ltd 2.03 1 6/1/2005
2 VSPP Khon Kaen Biogas Mr. Kaset Ruangchayajatuporn 0.18 0.18 11/2/2005
3 VSPP Chumporn Biogas Natural Palm Oil Co.,Ltd 2.253 1 5/1/2006
4 VSPP Rayong Biogas Kijrungruang Starch Part., Ltd 1.416 1 11/30/2005
5 VSPP Ratchburi Biogas Suwadee Therasattayakul 0.45 0.45 6/2/2006 6 VSPP Ratchburi Biogas Yongyuth Chaisakdanukul 0.2 0.15 9/1/2003 7 VSPP Ratchburi Biogas Prakarn Klinsorn 0.2 0.15 9/1/2003 8 VSPP Ratchburi Biogas Theera Apirattisivichet 0.2 0.015 9/1/2003 9 VSPP Ratchburi Biogas S.P.M Animal Feed Co.,Ltd 0.5 0.15 9/26/2003 10 VSPP Samutprakarn Biogas Charern Sompong Co.,Ltd 1.2 0.95 1/1/2006 11 VSPP Surat thani Biogas Thachana Palm Oil Co.,Ltd 0.79 0.56 7/11/2005 12 VSPP Surat thani Biogas Natural Palm Oil Co.,Ltd 1.16 1 8/1/2004 Total 10.579 6.605
Source: Energy for Environment Foundation, 2009
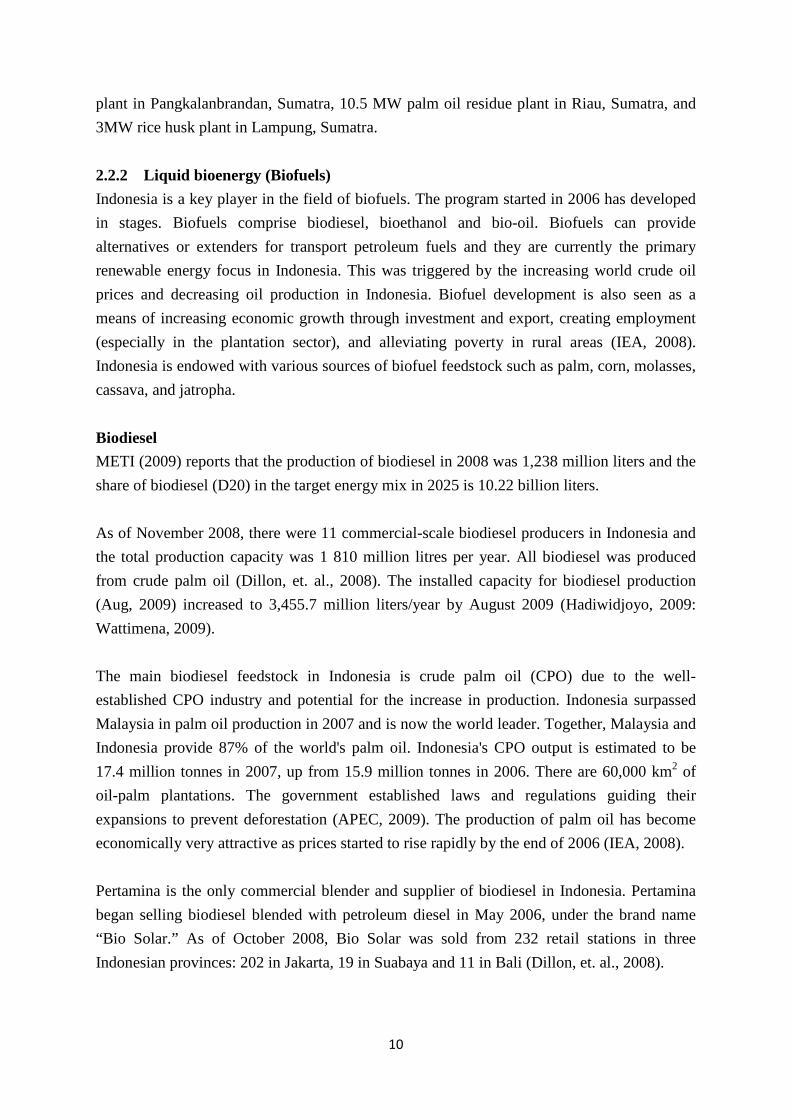
2.2 Status and potential of bioenergy in Indonesia The energy mix of Indonesia in 2004 consists of oil 52.5%, natural gas 19.0%, coal 21.5%, geothermal 3.01%, hydro power and other renewable energy (solar, wind, biomass) 3.93% and. The Indonesian Government has set the energy mix policy through the residential decree No. 5-2006 that in 2025 the share of renewable energy would be 15% (METI, 2009).
METI (2009) also reports that there are 13 units of micro hydropower plants (total capacity of 4.293MW), 1 unit of solar (32kW) and 9 units of wind power (total capacity of 720 kW) are in operation and supplies power to grid. Moreover, 43 units of micro hydropower plants (total capacity of 80.88 MW), 2 units of solar (total capacity of 70kW), 12 units of wind (total capacity of 960 kW), and 1 unit of biomass power generation (5 MW) are in progress. The country’s renewable energy resources and reserves are shown in Table 6. Currently, some 5,700 MW of renewable energy technologies have been installed representing only 2% of the estimated technical potential of the various renewable energy technologies.
9
Table 6: Potential for renewable energy utilization in Indonesia as of 2007
Type Potential Installed Capacity
Hydro power 76 GW 4,200 MW Geothermal 27 GW 807 MW Mini/micro hydro 500 MW 84 MW Biomass 50 GW 445 MW Solar energy 4.8 kWh/m2/day 8 MW Wind energy 3-6 m/s 0.6 MW
Source: Hermawan and Hadi, 2006 2.2.1 Solid bioenergy Indonesia has a large potential of biomass energy, which is estimated to be equivalent to 50,000 MW. The share of installed capacity of biomass resources is negligible compared to its huge potential. The current installed capacity of biomass projects is around 445 MW. Most biomass energy is used in households, for rice milling, drying of agriculture produce, and power generation in the wood and sugar industries. The traditional utilization of biomass is through direct burning and through process technologies such as pyrolisis and gasification. Indonesia is an agriculture country producing the largest amount of palm oil in the world, and ranks in the top 5 rice producers. Annually, 19 million tons of palm oil and 60 million tons of rice are produced, and consequently huge amounts of agricultural waste are being generated. Annually, the amount of empty fruit bunches (EFB) generated and rice husk are 19 million ton and 12 million tons respectively (Asia Biomass Office, 2009). These wastes are suitable for thermal power generation. Since one ton of EFB can generate 1,330 kWh of electric power, 19 million ton of EFB can generate 25,270GWh (Asia Biomass Office, 2009). Despite the large potential of biomass residues from the rice and sugar mills in Indonesia, only a limited number of projects have been developed. To accelerate the utilization of renewable energy in Indonesia, the Directorate General of Electricity and Energy Utilization (DGEEU), Ministry of Energy and Mineral Resources Republic of Indonesia, has issued energy policy directives in order to promote further the development of renewable energy sources, improve energy efficiency and GHG abatement in June 2002 called the green energy insight. In addition, Ministerial Decree No.1122 K/30/MEM/2002 on Distributed Small Power Generation has come into effect starting June 12, 2002. This decree provides opportunities for small power producers such as the cooperative to generate electricity up to 1 MW from renewable energy and interconnected to the medium and low tension grid and purchased by PLN at 80% and 60%, respectively at the medium and low tension interconnection. The national target on biomass for energy is 100 MW power plants by the end of 2010. Existing plants include 10.3 MW palm oil residue
10
plant in Pangkalanbrandan, Sumatra, 10.5 MW palm oil residue plant in Riau, Sumatra, and 3MW rice husk plant in Lampung, Sumatra. 2.2.2 Liquid bioenergy (Biofuels) Indonesia is a key player in the field of biofuels. The program started in 2006 has developed in stages. Biofuels comprise biodiesel, bioethanol and bio-oil. Biofuels can provide alternatives or extenders for transport petroleum fuels and they are currently the primary renewable energy focus in Indonesia. This was triggered by the increasing world crude oil prices and decreasing oil production in Indonesia. Biofuel development is also seen as a means of increasing economic growth through investment and export, creating employment (especially in the plantation sector), and alleviating poverty in rural areas (IEA, 2008). Indonesia is endowed with various sources of biofuel feedstock such as palm, corn, molasses, cassava, and jatropha. Biodiesel METI (2009) reports that the production of biodiesel in 2008 was 1,238 million liters and the share of biodiesel (D20) in the target energy mix in 2025 is 10.22 billion liters. As of November 2008, there were 11 commercial-scale biodiesel producers in Indonesia and the total production capacity was 1 810 million litres per year. All biodiesel was produced from crude palm oil (Dillon, et. al., 2008). The installed capacity for biodiesel production (Aug, 2009) increased to 3,455.7 million liters/year by August 2009 (Hadiwidjoyo, 2009: Wattimena, 2009). The main biodiesel feedstock in Indonesia is crude palm oil (CPO) due to the well- established CPO industry and potential for the increase in production. Indonesia surpassed Malaysia in palm oil production in 2007 and is now the world leader. Together, Malaysia and Indonesia provide 87% of the world's palm oil. Indonesia's CPO output is estimated to be 17.4 million tonnes in 2007, up from 15.9 million tonnes in 2006. There are 60,000 km2 of oil-palm plantations. The government established laws and regulations guiding their expansions to prevent deforestation (APEC, 2009). The production of palm oil has become economically very attractive as prices started to rise rapidly by the end of 2006 (IEA, 2008). Pertamina is the only commercial blender and supplier of biodiesel in Indonesia. Pertamina began selling biodiesel blended with petroleum diesel in May 2006, under the brand name “Bio Solar.” As of October 2008, Bio Solar was sold from 232 retail stations in three Indonesian provinces: 202 in Jakarta, 19 in Suabaya and 11 in Bali (Dillon, et. al., 2008).

11
The existing capacity of biodiesel production was only 0.01% of the estimated potential from palm oil (Food and Agricultural Organization, 2007). Therefore, there will be sufficient availability of biodiesel feedstock from palm oil industries. However, the estimated potential depends on the land use. At present, the forest areas are cleared in Indonesia to cultivate palm oil; the cultivation of palm oil has expanded significantly by the growth of palm oil industries. Therefore, the second generation of bioethanol and biodiesel production from lignocellulosic material should be considered. Other potential biodiesel feedstocks in Indonesia include coconut oil and Jatropha. Jatropha curcus is considered a high-potential biodiesel feedstock because it can grow in a variety of climates and soils with relatively little chemical inputs or water. Indonesia has a large area of degraded former-forested land, some of which might be suitable for conversion to jatropha plantations. As of June 2008, there were approximately 1500 km2 of jatropha plantations in Indonesia. Based on planned new plantation developments in provinces across Indonesia, the government predicts that this will expand to over 15,000 km2 by 2010 (Dillon, et. al., 2008). It is reported that the Indonesian Jatropha has a high yield at 4 kg of seed per plant per year or over 10 metric tons per hectare (Praptiningsih et. al. 2009). However, there are concerns that jatropha is not feasible for large-scale production. Indonesia is also looking into technologies based on cellulose derived from crop residues or biomass (baggase, rice straw etc) (APEC, 2009). Ethanol METI (2009) reports that the production of ethanol in 2008, was 144 million liters and the share of ethanol (E15) in the target energy mix in 2025 is 6.28 billion liters. Currently, ethanol in Indonesia is mainly produced from sugarcane molasses and cassava. Indonesia has about 22,258 km2dedicated to sugarcane production, and several companies want to expand their plantations. Though Indonesia is not self sufficient in sugar production, it is among the top 10 sugarcane producers in the world with production of about 30 million tonnes per year. Cassava is relatively new to be used as a feedstock in Indonesia and there were 522 km2planted with cassava in 2007 and it is expected to increase to 7,820 km2. The current ethanol production is only 7% of the estimated potential from cassava. The estimated bioethanol production potential is only 3 million liters (Food and Agriculture Organization, 2007). Therefore, at this rate, it is not sufficient to supply 15% ethanol blended in 2025 which will require 6.28 million liters. The installed capacity of bioethanol production (August 2009) is 270.5 million liters/year and the production in 2008 was 144.5 million liters. Table 7 shows the installed capacities of 9 major bioethanol plants in 2005 and their feedstock type. Due to abundant biomass resources, such as palm fruit shells, rice husk, sugarcane bagasse, and
12
other crop and forest residues, Indonesia is also interested in cellulosic ethanol production and actively supports R&D in the area (APEC, 2009).
Table 7: Ethanol production in Indonesia, 2005 Name of company Location Production capacity/
(Million liters/yr) Feedstock
PT Aneka Kimia Nusantara Mojokerto 5.0 Molasses PT Basis Indah Sulawesi 1.6 Molasses PT Bukitmanikam Subur Persada Lampung 51.3 Molasses PT Indo Acidama Chemical Surakarta 42.0 Molasses PT Madu Baru Yogyakarta 6.7 Molasses PT Molindo Raya Industrial Malang 10.0 Molasses PT Perkebunan Nusantara XI Bondowoso 6.0 Molasses PT Rhodia Manyar Gresik 11.0 Molasses B2TP, BPPT Lampung 0.03 Cassava
Source: Panaka and Yudiarto, 2007
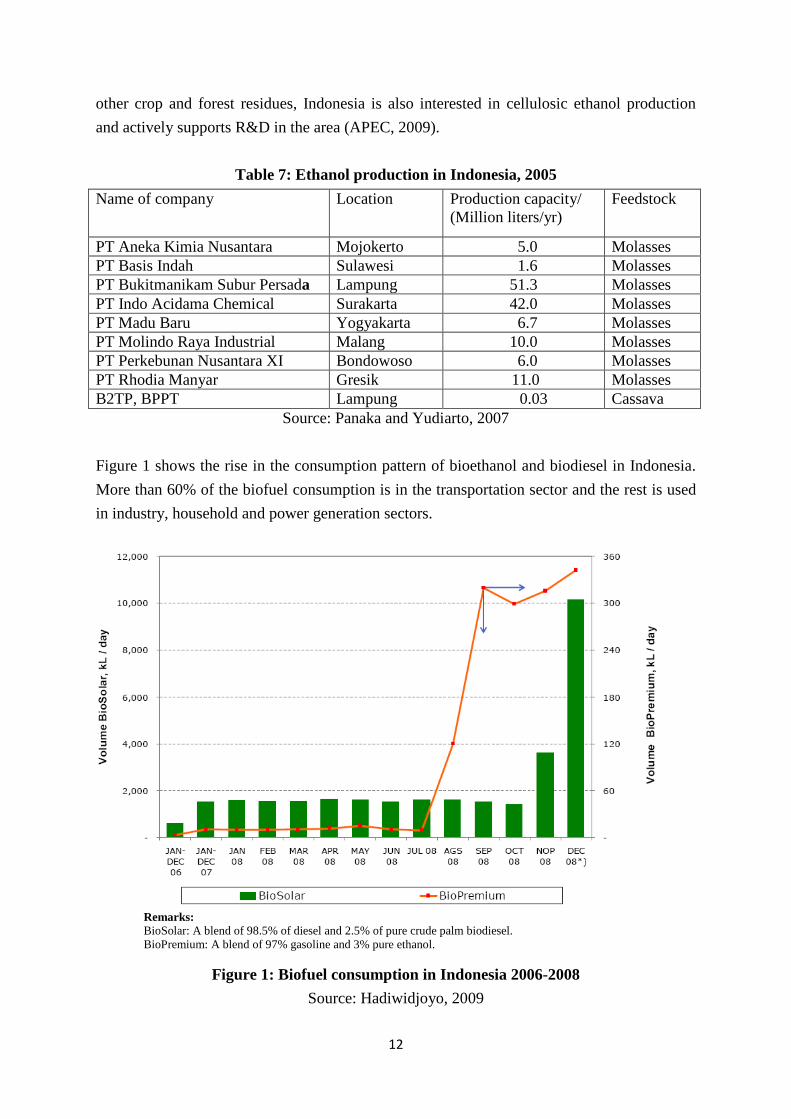
Figure 1 shows the rise in the consumption pattern of bioethanol and biodiesel in Indonesia. More than 60% of the biofuel consumption is in the transportation sector and the rest is used in industry, household and power generation sectors.
Remarks: BioSolar: A blend of 98.5% of diesel and 2.5% of pure crude palm biodiesel. BioPremium: A blend of 97% gasoline and 3% pure ethanol.
Figure 1: Biofuel consumption in Indonesia 2006-2008 Source: Hadiwidjoyo, 2009
13
2.2.3 Biogas According to Ishizuka (1995), implementation of biogas programs have been carried out by the government of Indonesia to promote the use of biogas technology, such as installing demonstration plant and training the public to operate the digester. The increase in the number of installed biogas digester has been insignificant. Since this was initiated, some 25 years ago, approximately 6,000 biogas plants have been built by the government, NGOs and others in Indonesia. However, large-scale dissemination of this technology has been limited (SenterNovem, 2009). The major reason for less popularity was the high capital cost to install the digester. Moreover, kerosene was also relatively inexpensive due to government subsidies. Therefore, biogas plants have usually been fully subsidized, without any contribution from the profiting families and communities, often leading to a poor sense of ownership and poor maintenance (SenterNovem, 2009). Research in biogas technology are carried out by research centers and universities in Indonesia. The raw materials used for biogas production are agricultural wastes, ranging from animal manures to a diverse selection of crop residues such Cassava solid waste, water hyacinth, and animal manure (Ishizuka et.al, 1995).
In 2008, Netherland Development Organization (SNV) conducted a study on the feasibility of a national program on domestic biogas in Indonesia. Its conclusions were positive. The technical potential for biogas was assessed to be a minimum of one million units, while no significant technical, financial or social limitations were found. The country has a history in domestic biogas, with about 6,000 units constructed. Before the year 2000, mostly fixed dome digesters were used, but in more recent years the plastic bag digester has become more popular. The technical life of a plastic bag digester is rather short – on average two years under normal field conditions (SNV, 2010). A Dutch NGO (Hivos) started to implement the Indonesia Domestic Biogas Program from May 2009 onwards with technical assistance by Netherland Development Organization (SNV). By the end of December 2009, 50 plants had been installed through partner organizations in Bandung, Garut, Pasuruan, Malang and Solo and the Program aims to install 8,000 biogas plants, including 2,000 units outside of Java by the end of 2012 (SNV, 2010).
14
3. Review of Current Bioenergy Programs/ Policies in Thailand and Indonesia
3.1 Programs and policy instrument for bio-energy development promotion in Thailand Excessive financial burden due to dependence on energy importation, high oil price, growing pressure from local and international parties concerning environment and the issue of national energy security will lead to more and more support from the government to accelerate the use of renewable energy sources. Biomass and solar energy are specified as the two renewable energy sources that receive high priority for support by the government. However, considering the relatively high cost of investment and imported components of solar systems, providing support to widen applications of solar energy, especially PV, could be limited. In case of a major food-producing and agricultural country such as Thailand, biomass, among others, is considered a renewable energy source with the highest potential and is expected to play a considerable role in the country’s future energy balance, especially in power production and industrial boilers.
Renewable energy development is promoted by several policy instruments such as establishment of mechanisms to compensate for the avoided external costs of biomass power generation, for example through a so-called environmental “adder” on top of the normal buy-back rate, access to power grid under clear and fair terms and conditions, development of a market for biomass waste resources. The Thai government has also established a fund to provide developers assistance to cover the differential between production and market price of biomass power.
3.1.1 Target setting Thai Government has declared the objective to increase the renewable energy utilization from a level of 0.5% in 2002, to 8% of total primary energy mix, (approximately 6,600 ktoe), by the year 2011. In reaching this target for renewable energy, biomass-based energy is expected to provide a share in excess of 60%, reflecting the fact that Thailand is a country highly dependent on the agricultural sector and hence has access to large amount of agricultural waste material (Nunt-Jaruwong, 2010). In order to achieve the 8% goal, the government is encouraging the power generating sector to produce some 1,900 MW from renewable sources. Independent Power Producers (IPPs) are required to adhere to the Renewable Portfolio Standard (RPS), which has been introduced to accelerate renewable energy utilization (Nunt-Jaruwong, 2010). Table 8 shows the contribution of different renewable energy resources for achieving the target by 2011.
15
Table 8: Thailand’s target of renewable and alternative energy use in 2011
Fuel Type Electricity Heat Alternative Fuel Total MW ktoe ktoe M liters/day ktoe ktoe
Target in 2011 3,246 1,033 3,851 21.31 1 6,426 1 11,311 Solar 45 4 5 9 Wind 115 13 13 Hydropower 156 18 18 Biomass 2,800 940 3,660 4,600 MSW 100 45 45 Biogas 30 14 186 200 Ethanol 3 820 820 Biodiesel 4 1,258 1,258 NGV 508(mmscfd) 4,348 4,348 Existing in 2006 2,061 1,789 0.5 Share (%) 6.63% 2 23.22% 3 13.5% 4
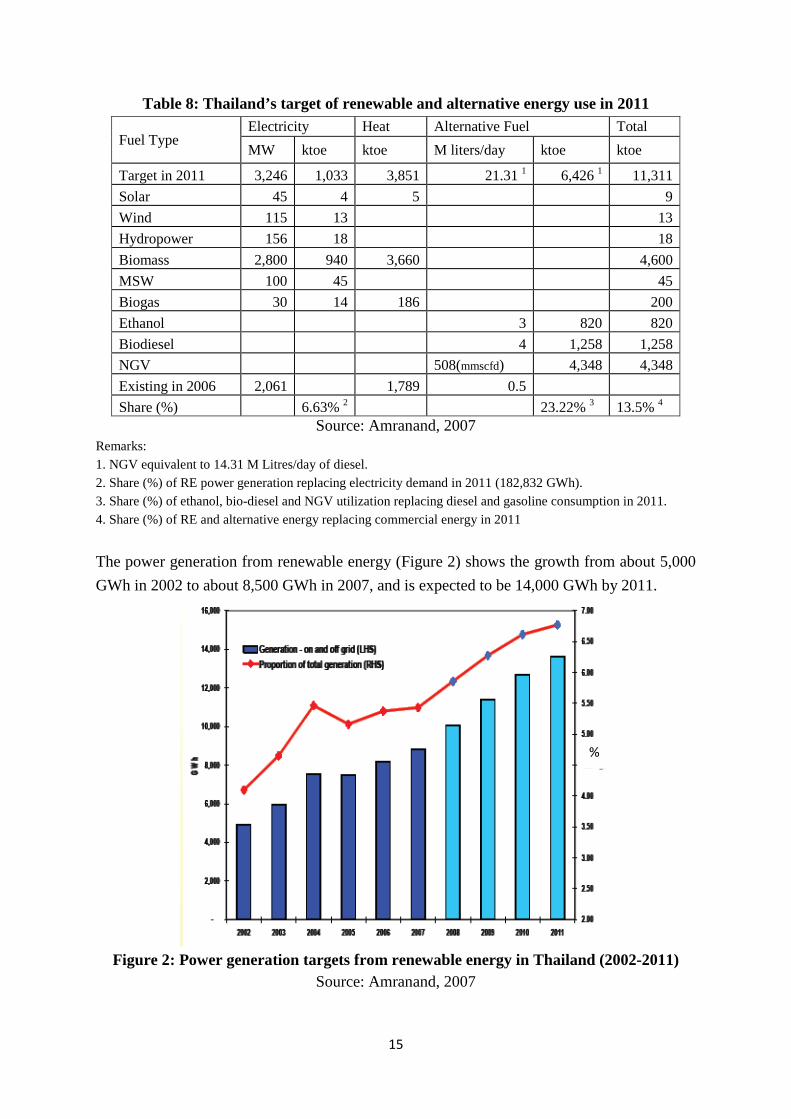
Source: Amranand, 2007 Remarks: 1. NGV equivalent to 14.31 M Litres/day of diesel. 2. Share (%) of RE power generation replacing electricity demand in 2011 (182,832 GWh). 3. Share (%) of ethanol, bio-diesel and NGV utilization replacing diesel and gasoline consumption in 2011. 4. Share (%) of RE and alternative energy replacing commercial energy in 2011 The power generation from renewable energy (Figure 2) shows the growth from about 5,000 GWh in 2002 to about 8,500 GWh in 2007, and is expected to be 14,000 GWh by 2011.
Figure 2: Power generation targets from renewable energy in Thailand (2002-2011)
Source: Amranand, 2007
%
16
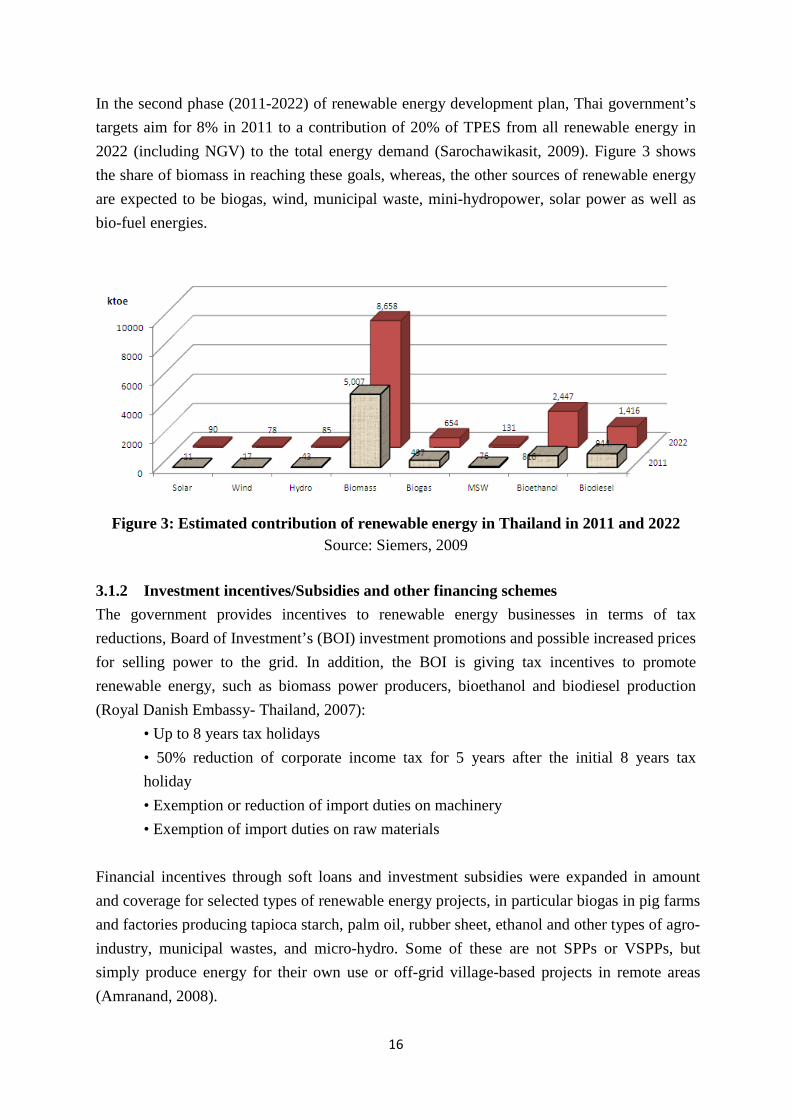
In the second phase (2011-2022) of renewable energy development plan, Thai government’s targets aim for 8% in 2011 to a contribution of 20% of TPES from all renewable energy in 2022 (including NGV) to the total energy demand (Sarochawikasit, 2009). Figure 3 shows the share of biomass in reaching these goals, whereas, the other sources of renewable energy are expected to be biogas, wind, municipal waste, mini-hydropower, solar power as well as bio-fuel energies.
Figure 3: Estimated contribution of renewable energy in Thailand in 2011 and 2022
Source: Siemers, 2009 3.1.2 Investment incentives/Subsidies and other financing schemes The government provides incentives to renewable energy businesses in terms of tax reductions, Board of Investment’s (BOI) investment promotions and possible increased prices for selling power to the grid. In addition, the BOI is giving tax incentives to promote renewable energy, such as biomass power producers, bioethanol and biodiesel production (Royal Danish Embassy- Thailand, 2007):
• Up to 8 years tax holidays • 50% reduction of corporate income tax for 5 years after the initial 8 years tax holiday • Exemption or reduction of import duties on machinery • Exemption of import duties on raw materials
Financial incentives through soft loans and investment subsidies were expanded in amount and coverage for selected types of renewable energy projects, in particular biogas in pig farms and factories producing tapioca starch, palm oil, rubber sheet, ethanol and other types of agro-industry, municipal wastes, and micro-hydro. Some of these are not SPPs or VSPPs, but simply produce energy for their own use or off-grid village-based projects in remote areas (Amranand, 2008).
17
Approval of policy allowing the trading of carbon credit through CDM was made in early 2007. This has given an enormous boost to a number of marginal projects, particularly biogas and municipal wastes projects (Amranand, 2008). 3.1.3 Pricing The structure of the power system is that of a single buyer with the Electricity Generating Authority of Thailand (EGAT) currently owning about half of the power generation capacity, the transmission system, and acting as the single buyer. EGAT sells bulk power to two distribution utilities: the Metropolitan Electricity Authority (MEA) responsible for the sale of electricity to consumers in Bangkok and surrounding areas; and the Provincial Electricity Authority (PEA) responsible for electricity sale in the remaining parts of the country. Private power producers sell electricity to the electric utilities under power purchase agreements or users located nearby (Amranand, 2008). In Thailand, the price for purchasing electricity under the SPP was based on avoided cost (the wholesale price that distribution utilities pay to EGAT for bulk electricity purchases) of electricity. For those signing contracts to supply a firm capacity, the purchase price is based on the long-run avoided cost of the utility. The government in 2001 introduced the Very Small Power Producer Program (VSPP) allowing SPP with sale into the grid of less than 1 MW to come under a more lenient set of requirements and less complicated power purchase arrangement of “net metering”. The purchase price is simply the bulk tariff excluding the cross subsidy element between the electric utilities. VSPPs can also sell to any one of the three electric utilities, depending on which transmission system is connected to the facility. In addition, the government also launched a program to encourage the renewable energy SPPs by providing an additional tariff for a period of 5 years from the Energy Conservation Fund. The “adder” was determined through a competitive bidding system which resulted in approval of 14 projects with average “adder” of 0.18 baht per kWh (US¢ 0.56), representing approximately 5% increase from the normal tariff (Amranand, 2008) Given the renewable energy potential remaining to be tapped, rising oil prices and global warming crisis, the government quickly issued a number of sweeping changes to the policy to promote energy efficiency and renewable energy as follows:
(a) The VSPP program was amended to include cogeneration facilities and sale from a facility of up to 10 MW while sale of 10-90 MW would come under the SPP program.
18
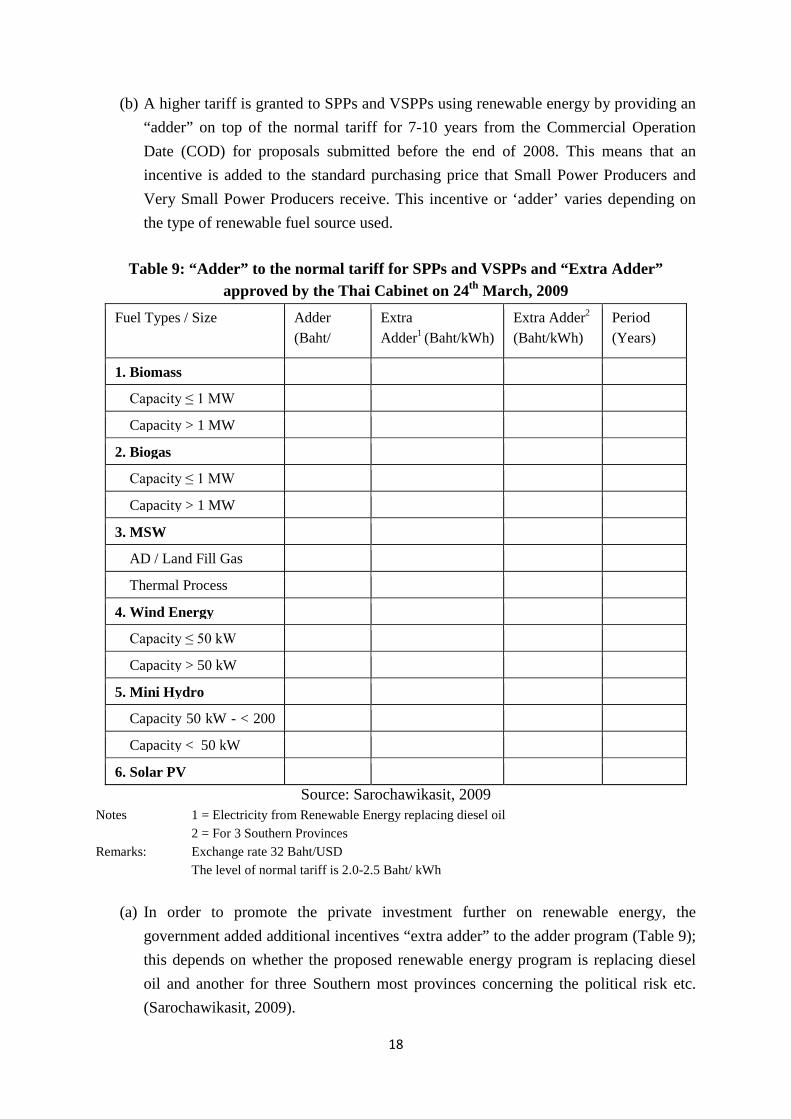
(b) A higher tariff is granted to SPPs and VSPPs using renewable energy by providing an “adder” on top of the normal tariff for 7-10 years from the Commercial Operation Date (COD) for proposals submitted before the end of 2008. This means that an incentive is added to the standard purchasing price that Small Power Producers and Very Small Power Producers receive. This incentive or ‘adder’ varies depending on the type of renewable fuel source used.
Table 9: “Adder” to the normal tariff for SPPs and VSPPs and “Extra Adder”
approved by the Thai Cabinet on 24th March, 2009 Fuel Types / Size Adder
(Baht/ k h)
Extra Adder1 (Baht/kWh)
Extra Adder2 (Baht/kWh)
Period (Years)
1. Biomass
Capacity ≤ 1 MW
Capacity > 1 MW
2. Biogas
Capacity ≤ 1 MW
Capacity > 1 MW
3. MSW
AD / Land Fill Gas
Thermal Process
4. Wind Energy
Capacity ≤ 50 kW
Capacity > 50 kW
5. Mini Hydro
Capacity 50 kW - < 200
Capacity < 50 kW
6. Solar PV Source: Sarochawikasit, 2009
Notes 1 = Electricity from Renewable Energy replacing diesel oil 2 = For 3 Southern Provinces Remarks: Exchange rate 32 Baht/USD The level of normal tariff is 2.0-2.5 Baht/ kWh
(a) In order to promote the private investment further on renewable energy, the government added additional incentives “extra adder” to the adder program (Table 9); this depends on whether the proposed renewable energy program is replacing diesel oil and another for three Southern most provinces concerning the political risk etc. (Sarochawikasit, 2009).
19
3.1.4 Public-Private Partnership (PPP) and long-term Power Purchase Agreements Involvement of the public sector instills confidence of the private sector to invest in renewable energy projects. PPP is proven successful in large-scale and complex renewable energy projects involving cogeneration. Thai energy policy as well as public energy utilities encourage the purchase of power generated from renewable energy, such as agricultural residue, industrial wastes, biogas, garbage, wind and solar energy, in a suitable proportion and with appropriate purchasing prices by speeding up the announcement on the increase of purchasing capacity from Very Small Power Producers (VSPPs) and the establishment of purchasing price 'adders' from the prices specified in the Regulations (National Energy Policy Council (NEPC), 2006). Before 1991 there was no private power producer supplying electricity into the grid. In 1992 the Government announced the policy of state enterprise privatization and encouraging more private sectors participation in power development in the forms of Independent Power Producer (IPP). And the National Energy Policy Council (NEPC) had drawn up the regulations for the purchase of electricity from Small Power Producer (SPP). The characteristic of qualifying facilities were (Srisovanna, 2004):
• Using non – conventional energy • Using the following fuels - waste or residual from agriculture, garbage, dendro
thermal sources • Co generation using any type of fuel - the process involving the continuous use of
energy Topping cycle or Bottoming Cycle, steam production > 10% of total energy production, and efficiency > 45%
Each facility is allowed to sell excess power to the Electricity Generating Authority of Thailand (EGAT) at a price determined from EGAT’s avoided cost. Qualifications of SPPs included criteria on the use of steam and efficiency of the cogeneration system. The size of each facility was kept small by restricting sale to the grid from each facility at 60 MW. This was subsequently increased to 90 MW (Amranand, 2008). A large number of small renewable energy projects were implemented in many parts of Thailand, mainly using agriculture wastes as fuels particularly bagasse from sugar mills, paddy husk from rice mills, and woodchips from paper factories (Amranand, 2008). The program was so successful that sugar mills stopped disposing of unwanted bagasse by burning, and the price of rice husk increase from 200 bahts per ton (US$5 per ton) in 2001 to 1,000 baht per ton (US$25 per ton) in 2006 (Ngaemngam and Tezuka, 2006). Table 10 shows the limitation of the maximum allowable agreement capacity by the government organizations. The best projects were
20
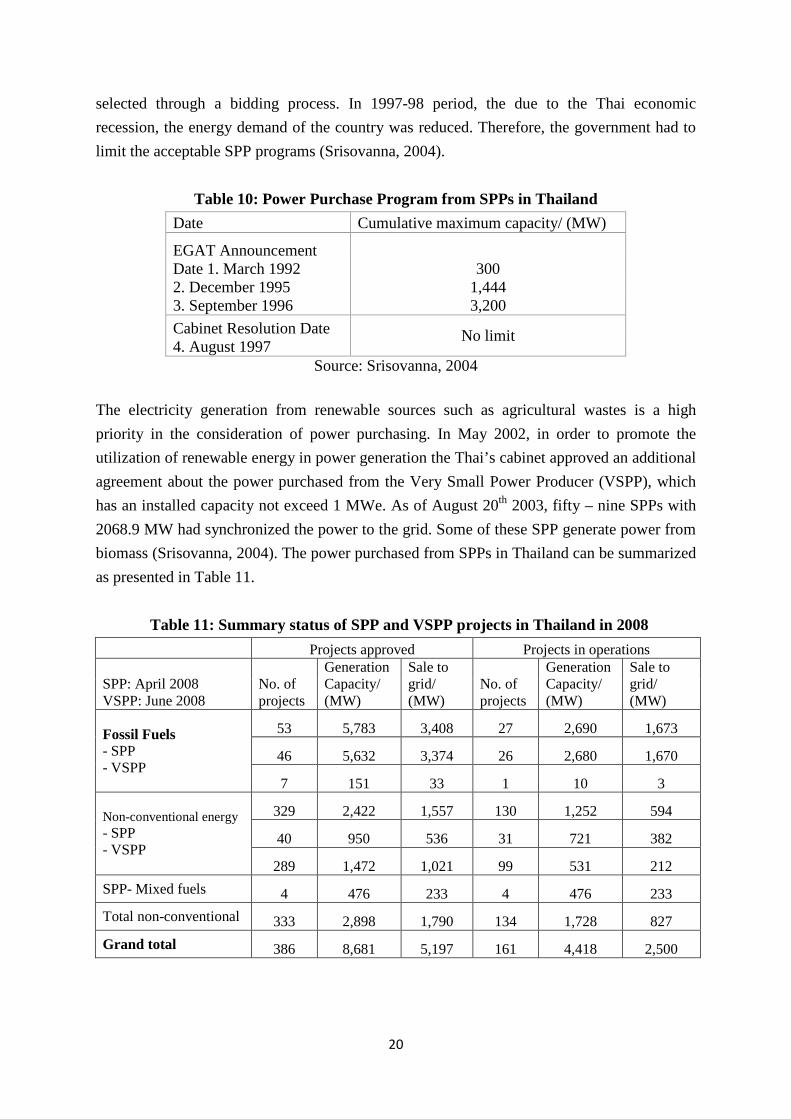
selected through a bidding process. In 1997-98 period, the due to the Thai economic recession, the energy demand of the country was reduced. Therefore, the government had to limit the acceptable SPP programs (Srisovanna, 2004).
Table 10: Power Purchase Program from SPPs in Thailand Date Cumulative maximum capacity/ (MW)
EGAT Announcement Date 1. March 1992 2. December 1995 3. September 1996
300
1,444 3,200
Cabinet Resolution Date 4. August 1997
No limit
Source: Srisovanna, 2004 The electricity generation from renewable sources such as agricultural wastes is a high priority in the consideration of power purchasing. In May 2002, in order to promote the utilization of renewable energy in power generation the Thai’s cabinet approved an additional agreement about the power purchased from the Very Small Power Producer (VSPP), which has an installed capacity not exceed 1 MWe. As of August 20th 2003, fifty – nine SPPs with 2068.9 MW had synchronized the power to the grid. Some of these SPP generate power from biomass (Srisovanna, 2004). The power purchased from SPPs in Thailand can be summarized as presented in Table 11.
Table 11: Summary status of SPP and VSPP projects in Thailand in 2008 Projects approved Projects in operations
SPP: April 2008 VSPP: June 2008
No. of projects
Generation Capacity/ (MW)
Sale to grid/ (MW)
No. of projects
Generation Capacity/ (MW)
Sale to grid/ (MW)
Fossil Fuels - SPP - VSPP
53 5,783 3,408 27 2,690 1,673
46 5,632 3,374 26 2,680 1,670
7 151 33 1 10 3
Non-conventional energy - SPP - VSPP
329 2,422 1,557 130 1,252 594
40 950 536 31 721 382
289 1,472 1,021 99 531 212 SPP- Mixed fuels 4 476 233 4 476 233 Total non-conventional 333 2,898 1,790 134 1,728 827 Grand total 386 8,681 5,197 161 4,418 2,500
21
By the end of 2006, the total generating capacity from one hundred SPP and VSPP projects was around 4,160 MW (Amranand, 2008). By April 2008, total number of SPP projects was 61, supplying 2,286 MW of electricity to the grid, but since most of these facilities also sell electricity to users nearby, total generating capacity is around 3,877 MW. Among these, 26 are cogeneration projects using fossil fuel- mainly natural gas with total sale of 1,670 MW. The capacity of VSPP projects increased to 615 MW and supplied from 35 non-conventional energy projects and projects using mixtures of fossil fuels and non-conventional energy – mostly bagasse, paddy husks and woodchips. There are also 100 VSPP projects supplying 215 MW of power to the power system with total installed capacity of 540 MW (Table 11). Again, most of these projects are bagasse, paddy husk and other biomass (Amranand, 2008). 3.1.5 Market creation, education, training and awareness programs Education, training and awareness programs are indirect measures that help promote positive attitude towards renewable energy among the general public. The current trend is to share information and to increase public awareness of the positive attributes of renewable energy. The Thai energy policy supports to disseminate information about alternative fuels to the general public so that they would recognize and have confidence in the use of such fuels as NGV, gasohol and biodiesel, and carry out public relations work to create knowledge and understanding of the necessity to promote and develop other fuel options, e.g. coal, etc. (NEPC, 2006) 3.1.6 Renewable Portfolio Standards In order to support renewable energy development and utilization, Ministry of Energy has established and drafted the Renewable Portfolio Standard (RPS) for power plants. Under this standard, power producers including IPPs that wish to sell power to the Electricity Generating Authority of Thailand must produce 5% of their installed energy generating capacity from renewable sources (Nunt-Jaruwong, 2010). Consequently, new EGAT plants essentially need to produce 5% of their electricity generation from renewable energy sources. However, power plants can either buy RPS credit from other Small Power Producers (SPP) or pay a fine of 1.3 times the cost of producing electricity from renewable energy, if they do not want to invest in renewable energy production (Royal Danish Embassy- Thailand, 2007). The framework for the RPS is in accordance to the Power Development Plan (PDP) of Thailand. From 2007-2021, the EGAT needs to implement the RPS policy under two criteria in each year; either EGAT is required to add renewable capacities into the generation portfolio based on the percentage of the new fossil-fuelled capacity additions (that is 5% of new fossil fueled power addition) or a percentage of the forecasted annual peak demands. The renewable capacity is restricted to biomass, municipal solid waste, small hydro, wind, and photovoltaic generation technologies. The EGAT may supply renewable capacity either
22
from its own facilities or purchasing from other power producers (Wiraphorn and Nuchprayoon, 2008). According to the PDP 2004, the Electricity Generating Authority of Thailand (EGAT) planned to construct 4 new power plants with the total capacity of 2,800 MW during 2008 - 2010. Therefore, according to the RPS, small hydropower, biomass, wind, solar, etc. was expected to supply at least 140 MW. There are more than 4,000 existing irrigation dams, which are owned by the Royal Irrigation Department (RID) and EGAT has signed MOU with RID and has initiated to construct small hydro power plants in the existing reservoirs. Therefore, on one hand, the hydropower development at the irrigation dams was considered to increase the efficiency of utilization of the water and, on the other hand, to meet the requirement of RPS. Six existing and under construction dams of RID were studied and proposed by EGAT to develop the small hydropower projects with the total installed capacity of 78.7 MW, namely Chao Phraya (2 x 6 MW), Naresuan (8 MW), Mae Klong (2 x 6 MW), Pasak Jolasid (6.7 MW), Khun Dan Prakarnchon (10 MW) and Khwae Noi (2 x 15 MW). It is the new approach to develop the hydropower projects at the irrigation dams and it is also the first time to develop hydropower for RPS in Thailand. The Cabinet Members approved the renewable energy development projects on October 30, 2007 comprising six small hydropower projects with the total installed capacity of 78.7 MW, the solar power of 1 MW and the wind power of 2 MW. Most of them are under construction, only some projects are in bid evaluation periods (Pienpucta and Pongtepupathum, 2009). For the remaining renewable power (58.3 MW) such as garbage power, biomass power, etc., EGAT will buy the energy from the Small Power Producers (SPP) instead of constructing the power plants by itself (Pienpucta and Pongtepupathum, 2009). 3.1.7 Biogas promotion programs In Thailand, biogas generated from animal manure, especially that of pigs and cows, as fuel for power generation and cooking. Development has also been undertaken on power generation from landfill biogas. The major financial resource is the Energy Conservation Promotion Fund (ENCON Fund) of the government. Several biogas projects have been supported by the ENCON Fund, such as the biogas from animal manure for power generation in livestock farms, R&D on the feasibility of biogas generation from wastewater treatment systems in factories. 3.1.8 Bio oil development and promotion programs (a) Ethanol In 2003, oil companies began to market E10 premium gasoline (gasohol blended from 10% ethanol and 90% gasoline with octane number of 95 RON). This was due to the rise in the world oil price together with the provision of excise tax incentive which made E10 1.50 baht
23
per litre (5-6%) cheaper than premium gasoline, investment promotion incentives provided to manufactures of ethanol, and heavy promotion by the government. E10 sale initially rose rapidly to reach 17.4% of premium gasoline sale in December 2005. The government implemented a number of policy changes at the end of 2006. The first and most important was the pricing policy whereby the oil fund levy for normal gasoline was gradually increased to a level substantially higher than the levy on gasohol (which also helped to speed up debt payment of the fund), The lower ex-factory price together with the lower level of oil fund contribution for E10 effectively increased the differential between the normal gasoline and E10 prices from 1.50 baht per litre to 4.00 baht per litre in November 2007 (Amranand, 2008). Concerns over petroleum prices had forced the Government to commercialize the new E85 gasohol (a mixture of 85 percent ethanol and 15 percent premium gasoline) in the fourth quarter of 2008, three years ahead of the original plan. Retail prices for E85, as announced by the government was to be 30-40 percent cheaper than premium gasoline. In addition, the Government provided higher tax incentives to automobile manufacturers who invest in compatible E85 vehicles. The excise tax on E85 vehicles will be charged at lower rates than that for E20 vehicles (currently 25 %) and regular vehicles (30- 50 %) (GAIN, 2008). As of December 2009, prices for gasohol and E20 were cheaper than premium gasoline by 3-3.5 baht/liter (10 US cents/liter) and 6 baht/liter (20 US cents/liter) respectively. Although gasohol now captures only a quarter of total gasoline consumption, it is anticipated to dominate the gasoline market by 2012 when more E20 and E85 vehicles are available in the market. The government has also approved several supportive measures; (a) a policy for government agencies and state enterprises to give priority to gasohol for their vehicle fleets, (b) promotion and support to enhance preparedness of the automobile and oil refining industries to accommodate the production and use of fuel ethanol, by provision of tax privileges, for instance, (c) potential SME practitioners and farmer organizations or entities are encouraged to establish ethanol producing plants so that the production of ethanol from agricultural products could be widely distributed across the country. Such measures as provision of financial assistance, in the form of concessional loan or soft loan, and provision of technical assistance from the government agencies will also be introduced.
However, an intensive education campaign was launched to provide information and assurance for motorists. Oil companies were asked to provide guarantees; and automobile companies were asked to provide assurance and warranty to customers, and narrow down the

24
list of cars and motorcycles which are not capable of using gasohol. The government also provided additional price incentive for the refineries, and sought cooperation from oil companies to market E10 regular gasoline as regular gasoline accounted for over 60% of gasoline sale. A higher marketing margin was allowed for gasohol to encourage service stations to sell gasohol rather than the normal unleaded gasoline. Later in 2007 the government also announced a reduction in excise tax in new cars capable of using E20 (which is a blend of 20% ethanol and 80% gasoline) for new cars produced from January 2008. At the same time additional pricing incentive was provided for E20 and cooperation from oil companies were sought for sale of E20 from January 2008 onwards (Amranand, 2008).
. Figure 4: Sales of gasohol and unleaded gasoline 95 in Thailand, million liters/day
Source: Amranand, 2008
Figure 4 shows the responses due to these policy changes. The sale of E10 rose from 3.5 million litres per day in 2006 to reach 7.0 million litres per day in December 2007. During the first 7 months of 2008 the average sale of E10 averaged 7.8 million litres per day (24% consisting of regular E10). The sale of E20 which began in January 2008 reached 92,000 litres per day in July 2008. The sale of premium gasoline dropped from 6.1 million litres per day in 2005 to 0.54 million litres per day in July 2008 with two major oil companies having ceased the sale of premium gasoline completely. The structure of the retail prices of conventional gasoline and gasohol is the sum of the ex-refinery price, excise tax, municipal tax, Oil Fund tax, Energy Conservation Promotion Fund tax, VAT, and marketing margin. The retail price of gasohol is set lower than that of conventional gasoline by the exemption of tax for fuel ethanol production and the reduction of tax for ethanol blended in gasoline, including the reduction of excise and municipal tax and of tax collected for the Oil Fund and Energy Conservation Promotion Fund. The retail price difference was initially set at 0.013 $/l in 2004, but has later increased to 0.025 and

25
0.038 $/l (November 2006). Figure 5 shows the contributions of different tax reductions for gasohol 95 compared with ULG 95 during January 2004-October 2006 (Amatayakul and Berndes, 2007).
Figure 5: Contributions of different tax reductions for gasohol 95 compared with ULG
95 during January 2004-October 2006 (Thailand) Source: Amatayakul and Berndes, 2007
(b) Biodiesel Similar to the promotion and support to ethanol and gasohol, ester can be mixed with diesel, and the excise tax and the contribution to the Oil Fund are exempted for the portion of ester produced from plant oil and mixed with diesel. In terms of a long-term measure, the government will continue, through use of the ENCON Fund, to support research and development to improve biodiesel efficiency as well as research on other oil plants to diversify sources of production; moreover, the standards for engine adjustment will be established to enable automobiles to run on biodiesel. In 2007 the government also issued a policy to require all diesel fuel to be B2 in 2008 allowing a period of about one year for all related parties to make adjustments. Clearer and stricter standards were issued for B100, B2 and B5 and they were actually enforced which provided sufficient assurance to automobile companies to provide warranty. The automobile manufactures eventually agreed that all diesel vehicles in Thailand could run on B5. Mandating B5 as the normal grade for diesel would require 2.5 million litres per day of B100, and there is clearly insufficient amount of raw palm oil or other feedstock. The government, therefore, provided soft loans for the expansion of oil palm plantation and yields with preliminary target of mandating B5 by 2011. B2 became mandatory on 1 February 2008 with B5 being an alternative grade for motorists with a slightly lower retail price. Since diesel users are much more price sensitive than

26
gasoline users, as shown in Figure 6,the sale of B5 rose from 0.12 million litres per day in 2006 to 9.8 million litres per day in July 2008. With B2 becoming compulsory in February 2008, total demand for B100 reaches 1.16 million litres per day during the first 7 months of 2008. The only constraint to B5 is now the availability of raw materials. With the gradual increase in production of palm oil expected in the next few years, the target for making B5 mandatory by 2011 should be accomplished (Amranand, 2008).
Figure 6: Demand for biodiesel (B 100) in Thailand (Million liters/day)
Source: Amranand, 2008
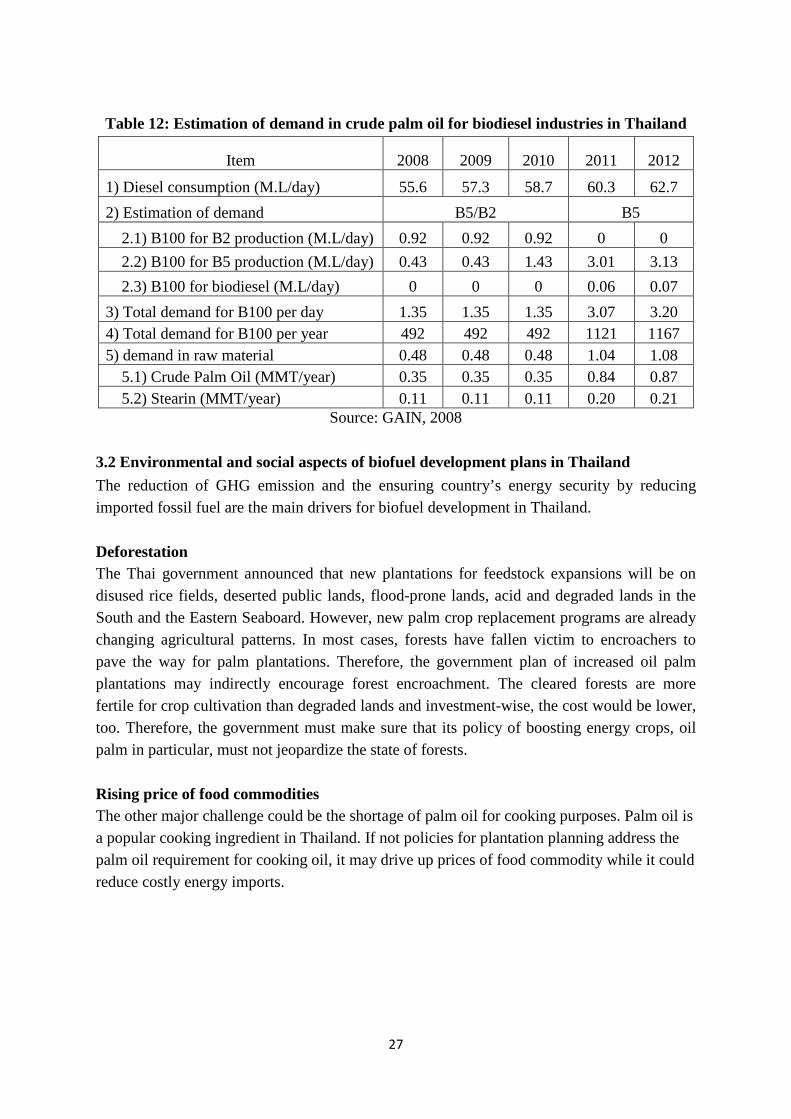
The requirement has made a noticeable impact on demand for domestic palm oil, the only raw material for B100 biodiesel production at the moment. It is estimated that demand for crude palm oil and stearin (palm oil by-product) will be 492 million liters per year by 2010, as compared to only 31 million liters in 2006. Realizing that Thailand needs to increase palm oil production to meet the demand, the Joint Working Group from the Ministry of Agriculture and Cooperatives and the Ministry of Energy called “Committee on Biofuel Development and Promotion” has plans to expand palm growing area by 4,000 km2. Additionally, the committee will seek to increase fresh palm productivity from 19 tons/hectare to 22 tons/hectare, and to increase the crushing rate of crude palm oil from 17 percent to 18.5 percent by 2012. To achieve the plan, the government will provide low interest loans to participating oil palm farmers. In addition, the government plans to push compulsory biodiesel production up from B2 to B5 across the country by 2011. Based on estimated diesel demand of 22,860 million liters in 2012 (Table 12), mandatory B5 production could lead to demand of 1.08 million tons of crude palm oil and stearin for biodiesel production. However, increasing palm plantings to meet demand has been challenging.
27
Table 12: Estimation of demand in crude palm oil for biodiesel industries in Thailand
Item 2008 2009 2010 2011 2012
1) Diesel consumption (M.L/day) 55.6 57.3 58.7 60.3 62.7 2) Estimation of demand B5/B2 B5 2.1) B100 for B2 production (M.L/day) 0.92 0.92 0.92 0 0 2.2) B100 for B5 production (M.L/day) 0.43 0.43 1.43 3.01 3.13 2.3) B100 for biodiesel (M.L/day) 0 0 0 0.06 0.07 3) Total demand for B100 per day 1.35 1.35 1.35 3.07 3.20 4) Total demand for B100 per year 492 492 492 1121 1167 5) demand in raw material 0.48 0.48 0.48 1.04 1.08 5.1) Crude Palm Oil (MMT/year) 0.35 0.35 0.35 0.84 0.87 5.2) Stearin (MMT/year) 0.11 0.11 0.11 0.20 0.21
Source: GAIN, 2008
3.2 Environmental and social aspects of biofuel development plans in Thailand The reduction of GHG emission and the ensuring country’s energy security by reducing imported fossil fuel are the main drivers for biofuel development in Thailand. Deforestation The Thai government announced that new plantations for feedstock expansions will be on disused rice fields, deserted public lands, flood-prone lands, acid and degraded lands in the South and the Eastern Seaboard. However, new palm crop replacement programs are already changing agricultural patterns. In most cases, forests have fallen victim to encroachers to pave the way for palm plantations. Therefore, the government plan of increased oil palm plantations may indirectly encourage forest encroachment. The cleared forests are more fertile for crop cultivation than degraded lands and investment-wise, the cost would be lower, too. Therefore, the government must make sure that its policy of boosting energy crops, oil palm in particular, must not jeopardize the state of forests. Rising price of food commodities The other major challenge could be the shortage of palm oil for cooking purposes. Palm oil is a popular cooking ingredient in Thailand. If not policies for plantation planning address the palm oil requirement for cooking oil, it may drive up prices of food commodity while it could reduce costly energy imports.

28
3.3 Programs and policy instrument for bio-energy development promotion in Indonesia Indonesia is endowed with variety of energy resources, both fossil and renewable. Renewable energy such as biomass has advantage in term of clean and environmentally sustainable. But utilization of biomass for electricity generation is still very small because of non-economic energy prices (Savacool, 2010). 3.3.1 Target setting The government of Indonesia, by its Energy Blue Print in 2006, has set targets for achieving the share of new and renewable energy upto 17% by the year 2025. Figure 7 shows the targeted fuel mix in the total primary energy mix of the country.
Figure 7: The target of national primary energy mix in Indonesia in 2025 Source: Tjakrawan, 2009
At the same time, the government also plans to reduce the share of oil in national primary energy mix to less than 20%, and to increase the share of gas, coal and renewable sources as shown in Table 13.
Table 13: Target of contribution to Indonesia energy mix by 2025 No. Energy Contribution to energy mix/ (%)
2004 Targeted 2025 1 Oil 52.5 ≤ 20 2 Gas 19.0 ≥ 30 3 Coal 21.5 ≥ 33 4 Biofuel 0 ≥ 5 5 Geothermal 3.0 ≥ 5 6 Other renewable energy
(biomass, solar, wind, nuclear, hydro)
3.9 ≥ 5
7 Coal liquefaction 0 ≥ 2 Source: Wirawan and Tambunan , 2006
29
The objectives of the present energy policy are, by 2025 (IEA, 2008): ■ To significantly reduce the use of oil to below 20% of total primary energy mix; ■ To increase the use of:
● coal to more than 33%, and liquefied coal to more than 2% ● natural gas to more than 30% ● geothermal to more than 5% ● biofuel to more than 5%, and ● other renewable energy (RE) to more than 5%;
■ To reduce energy elasticity to below 1 and ■ To improve energy infrastructure.
The main programs envisaged to achieve these targets are all supply-side, namely (Tjakrawan, 2009):
■ increasing oil production by optimization of existing fields, enhanced oil recovery, and offering new acreages; ■ development of 10 000 MW of coal fired power plants by 2009; and ■ development of bio-energy and opening 60,000 km2 of new plantation area for sugarcane, cassava, palm and jatropha
3.3.2 Bio oil development and promotion programs 3.3.2.1 Biofuel development plan In order to guarantee the security of domestic energy supply and to support the sustainable development, in 2006 the Government has issued series of regulations, such as Government Regulation No. 5 year 2006 about National Energy Policy and President Instruction No.1 year 2006 about Accelerating the Provision and Utilization of biofuel which was then followed up by the efforts to accelerate poverty reduction and reduce unemployment through Presidential Decree No. 10 year 2006 about establishment of National Team (TIMNAS) of biofuel (BBN) (Wattimena, 2009)
Even though Indonesia is net energy exporter, it still imports 40% of diesel requirements. The government had set up goals of reaching 2% biofuels in the energy mix by 2010 (5.29 billion liters), growing to 3% by 2015 (9.84 billion liters) and in the recent Energy Blueprint, biofuels are explicitly mentioned as a RE source that is expected to contribute 5% (22.26 billion liters) of the national energy supply by year 2025. Biodiesel development has made large progress (IEA, 2008).
30
Ethanol production in Indonesia was about 140 million liters in 2007, and the economy plans to reach 3,770 million liters in 2010. Biodiesel production in 2007 was about 1,550 million liters and it is estimated to reach 5,570 million liters in 2010.
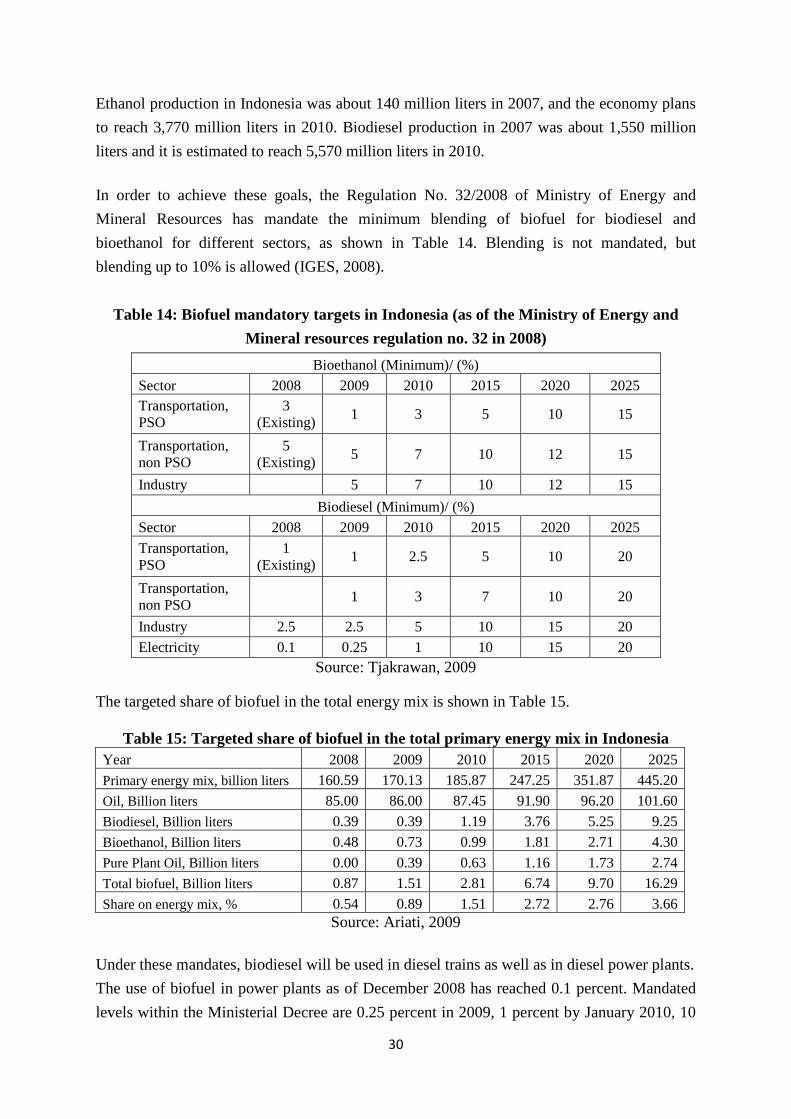
In order to achieve these goals, the Regulation No. 32/2008 of Ministry of Energy and Mineral Resources has mandate the minimum blending of biofuel for biodiesel and bioethanol for different sectors, as shown in Table 14. Blending is not mandated, but blending up to 10% is allowed (IGES, 2008).
Table 14: Biofuel mandatory targets in Indonesia (as of the Ministry of Energy and
Mineral resources regulation no. 32 in 2008) Bioethanol (Minimum)/ (%)
Sector 2008 2009 2010 2015 2020 2025 Transportation, PSO
3 (Existing) 1 3 5 10 15
Transportation, non PSO
5 (Existing) 5 7 10 12 15
Industry 5 7 10 12 15 Biodiesel (Minimum)/ (%)
Sector 2008 2009 2010 2015 2020 2025 Transportation, PSO
1 (Existing) 1 2.5 5 10 20
Transportation, non PSO 1 3 7 10 20
Industry 2.5 2.5 5 10 15 20 Electricity 0.1 0.25 1 10 15 20
Source: Tjakrawan, 2009
The targeted share of biofuel in the total energy mix is shown in Table 15.
Table 15: Targeted share of biofuel in the total primary energy mix in Indonesia Year 2008 2009 2010 2015 2020 2025 Primary energy mix, billion liters 160.59 170.13 185.87 247.25 351.87 445.20 Oil, Billion liters 85.00 86.00 87.45 91.90 96.20 101.60 Biodiesel, Billion liters 0.39 0.39 1.19 3.76 5.25 9.25 Bioethanol, Billion liters 0.48 0.73 0.99 1.81 2.71 4.30 Pure Plant Oil, Billion liters 0.00 0.39 0.63 1.16 1.73 2.74 Total biofuel, Billion liters 0.87 1.51 2.81 6.74 9.70 16.29 Share on energy mix, % 0.54 0.89 1.51 2.72 2.76 3.66
Source: Ariati, 2009 Under these mandates, biodiesel will be used in diesel trains as well as in diesel power plants. The use of biofuel in power plants as of December 2008 has reached 0.1 percent. Mandated levels within the Ministerial Decree are 0.25 percent in 2009, 1 percent by January 2010, 10
31
percent by January 2015, 15 percent by January 2020 and 20 percent by January 2025 (GAIN, 2009). Biofuel use in industry has already started in November 2008 (Hadiwidjoyo , 2009). Altogether, biofuel is expected to reach a domestic market share as shown in Table 16.
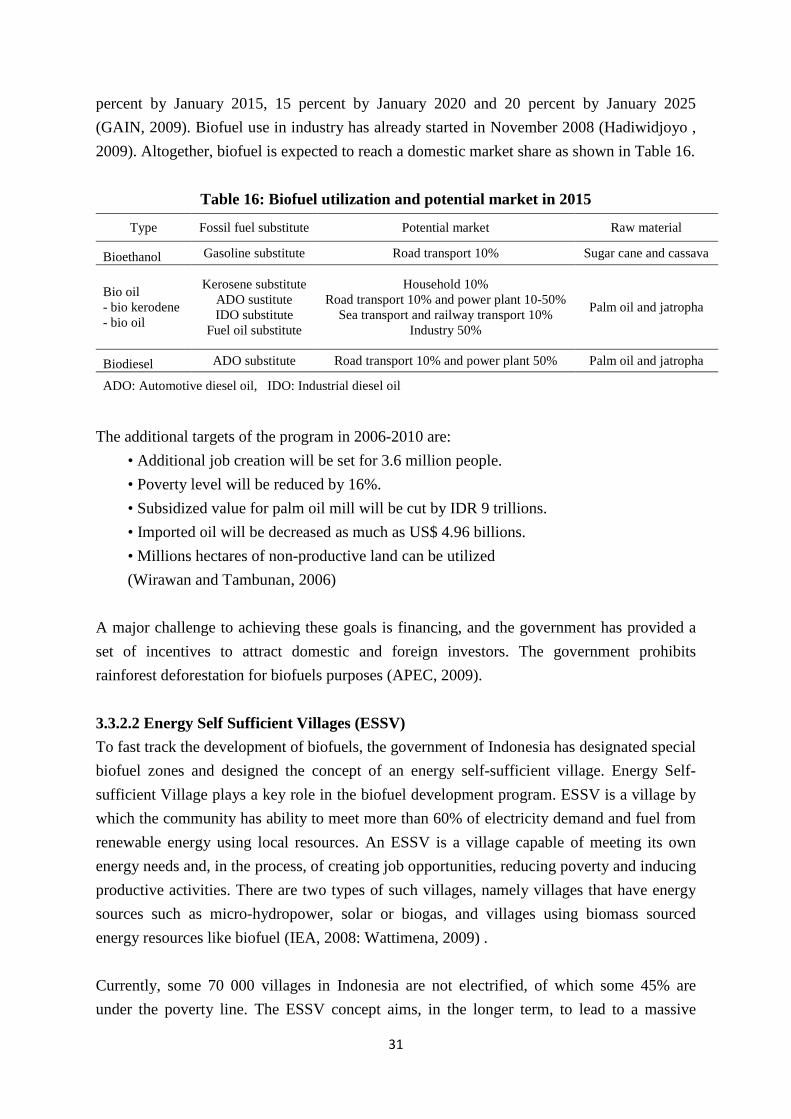
Table 16: Biofuel utilization and potential market in 2015
Type Fossil fuel substitute Potential market Raw material
Bioethanol Gasoline substitute Road transport 10% Sugar cane and cassava
Bio oil - bio kerodene - bio oil
Kerosene substitute ADO sustitute IDO substitute
Fuel oil substitute
Household 10% Road transport 10% and power plant 10-50%
Sea transport and railway transport 10% Industry 50%
Palm oil and jatropha
Biodiesel ADO substitute Road transport 10% and power plant 50% Palm oil and jatropha
ADO: Automotive diesel oil, IDO: Industrial diesel oil
The additional targets of the program in 2006-2010 are: • Additional job creation will be set for 3.6 million people. • Poverty level will be reduced by 16%. • Subsidized value for palm oil mill will be cut by IDR 9 trillions. • Imported oil will be decreased as much as US$ 4.96 billions. • Millions hectares of non-productive land can be utilized (Wirawan and Tambunan, 2006)
A major challenge to achieving these goals is financing, and the government has provided a set of incentives to attract domestic and foreign investors. The government prohibits rainforest deforestation for biofuels purposes (APEC, 2009). 3.3.2.2 Energy Self Sufficient Villages (ESSV) To fast track the development of biofuels, the government of Indonesia has designated special biofuel zones and designed the concept of an energy self-sufficient village. Energy Self-sufficient Village plays a key role in the biofuel development program. ESSV is a village by which the community has ability to meet more than 60% of electricity demand and fuel from renewable energy using local resources. An ESSV is a village capable of meeting its own energy needs and, in the process, of creating job opportunities, reducing poverty and inducing productive activities. There are two types of such villages, namely villages that have energy sources such as micro-hydropower, solar or biogas, and villages using biomass sourced energy resources like biofuel (IEA, 2008: Wattimena, 2009) . Currently, some 70 000 villages in Indonesia are not electrified, of which some 45% are under the poverty line. The ESSV concept aims, in the longer term, to lead to a massive
32
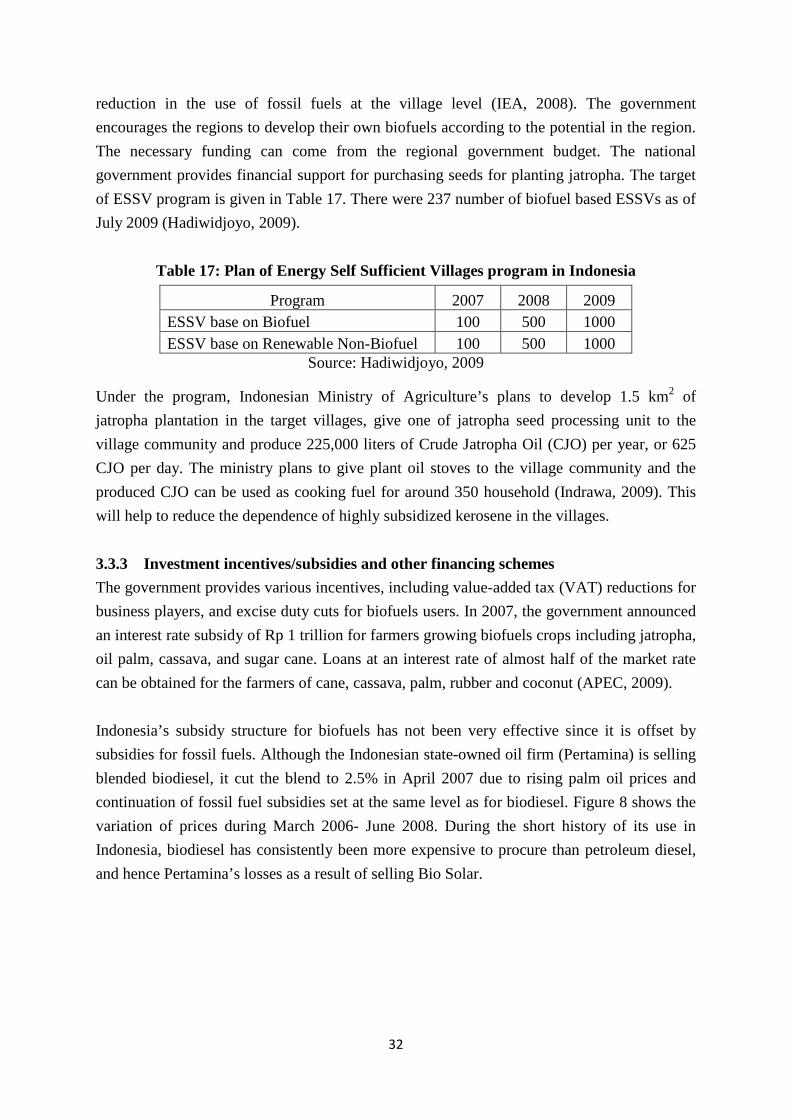
reduction in the use of fossil fuels at the village level (IEA, 2008). The government encourages the regions to develop their own biofuels according to the potential in the region. The necessary funding can come from the regional government budget. The national government provides financial support for purchasing seeds for planting jatropha. The target of ESSV program is given in Table 17. There were 237 number of biofuel based ESSVs as of July 2009 (Hadiwidjoyo, 2009).
Table 17: Plan of Energy Self Sufficient Villages program in Indonesia
Program 2007 2008 2009 ESSV base on Biofuel 100 500 1000 ESSV base on Renewable Non-Biofuel 100 500 1000
Source: Hadiwidjoyo, 2009 Under the program, Indonesian Ministry of Agriculture’s plans to develop 1.5 km2 of jatropha plantation in the target villages, give one of jatropha seed processing unit to the village community and produce 225,000 liters of Crude Jatropha Oil (CJO) per year, or 625 CJO per day. The ministry plans to give plant oil stoves to the village community and the produced CJO can be used as cooking fuel for around 350 household (Indrawa, 2009). This will help to reduce the dependence of highly subsidized kerosene in the villages. 3.3.3 Investment incentives/subsidies and other financing schemes The government provides various incentives, including value-added tax (VAT) reductions for business players, and excise duty cuts for biofuels users. In 2007, the government announced an interest rate subsidy of Rp 1 trillion for farmers growing biofuels crops including jatropha, oil palm, cassava, and sugar cane. Loans at an interest rate of almost half of the market rate can be obtained for the farmers of cane, cassava, palm, rubber and coconut (APEC, 2009). Indonesia’s subsidy structure for biofuels has not been very effective since it is offset by subsidies for fossil fuels. Although the Indonesian state-owned oil firm (Pertamina) is selling blended biodiesel, it cut the blend to 2.5% in April 2007 due to rising palm oil prices and continuation of fossil fuel subsidies set at the same level as for biodiesel. Figure 8 shows the variation of prices during March 2006- June 2008. During the short history of its use in Indonesia, biodiesel has consistently been more expensive to procure than petroleum diesel, and hence Pertamina’s losses as a result of selling Bio Solar.

33
Figure 8: Variation of the prices of biodiesel and petroleum diesel during 2006- 2008
Source: Dillon et. al., 2008
3.3.4 Public-Private Partnership and long-term Power Purchase Agreements The Ministerial Decree on Small Distributed Power Generation Using Renewable Energy was launched in 2002 (Ministerial Decree: No. 1122 K/30/MEM/2002) with the objective of promoting RE small-scale power plants by allowing enterprises to sell their power production or surplus power to the local utility’s power grid (if already accessible). The maximum allowable capacity of the power plant is up to 1 MW and the electricity price is 60% of the utility’s production cost if it is connected to the low voltage grid and 80% of the utility’s production cost if it is connected to medium voltage grid. The Ministerial Regulation on Medium Scale Power Generation using Renewable Energy (Ministerial Regulation: No. 002/2006) has a similar objective for renewable energy medium-scale power plants. The maximum allowable capacity of each power plant is 1-10 MW and the electricity price provisions are as for small-scale plant. A purchase contract for 10 years or longer can be negotiated (IEA, 2008). Since the Ministerial Decree on Small Distributed Power Generation Using Renewable Energy was launched in 2002, some renewable energy power plants (mainly micro hydro/mini hydro constructed by small-scale enterprises) have been interconnected to the state owned PT PLN grid.
34
3.4 Environmental and social aspects of biofuel development plans in Indonesia 3.4.1 Rural self sufficiency, poverty alleviation and reduce unemployment Indonesia sees biofuels as one of the key instruments to accelerating economic growth, alleviating poverty, and creating employment opportunities while also, under the Kyoto Protocol, mitigating greenhouse gas emissions. Legowo, et. al. (2007) notes that Energy Self Sufficient Village is a program not only to fulfill the village’s needs on energy, but also to create job and to alleviate poverty through optimizing local community capabilities. Biofuel development plan also targets to create for 3.5 million new employments and to increase the income for on-farm and off-farm workers in biofuel sector up to the Regional Minimum Payment. The Department of Energy and Mineral Resources estimates that as of June 2008, the biofuel industry was employing 1,040 people in processing and distribution (Legowo, 2008). Furthermore, approximately one million jobs had been created in the plantation sector (including 348,000 jobs in growing feedstocks for local community biofuel use). However, this number appears to be an over-estimate, given limited biofuel production to-date. In addition, new employment could be created if new areas are brought under cultivation of feedstock. However, if crops are diverted from other uses (such as cassava from food or industrial starch production, or sugarcane from sugar production), then few new jobs would be created in the farming sector but jobs could be lost in industries disadvantaged by diversion of its inputs to biofuels. The original government Action Plans for cassava and jatropha biofuel production envisaged huge employment benefits: 1.1 million new jobs in jatropha production and processing by 2009; and over 66 000 new farm labourer jobs in cassava by 2010, with more jobs in processing. These are unlikely to be realized in the foreseeable future, as there is currently no commercial production of biodiesel from jatropha in Indonesia and only two plants producing ethanol from cassava (Dillon, et. al., 2008). 3.4.2 Upward pressure on food prices Biofuel production to date in Indonesia has diverted a minimum amount of food commodities to fuel domestically, due to low production levels. However, the government’s biofuel mandates will result in escalating amounts of palm oil, sugar and cassava being diverted to biofuel production. All these crops are important staple foods in Indonesia. The government predicts that cultivation of oil-palm, sugarcane and cassava will increase in order to supply biofuel production. If crop production does not increase in line with demand by biofuels,
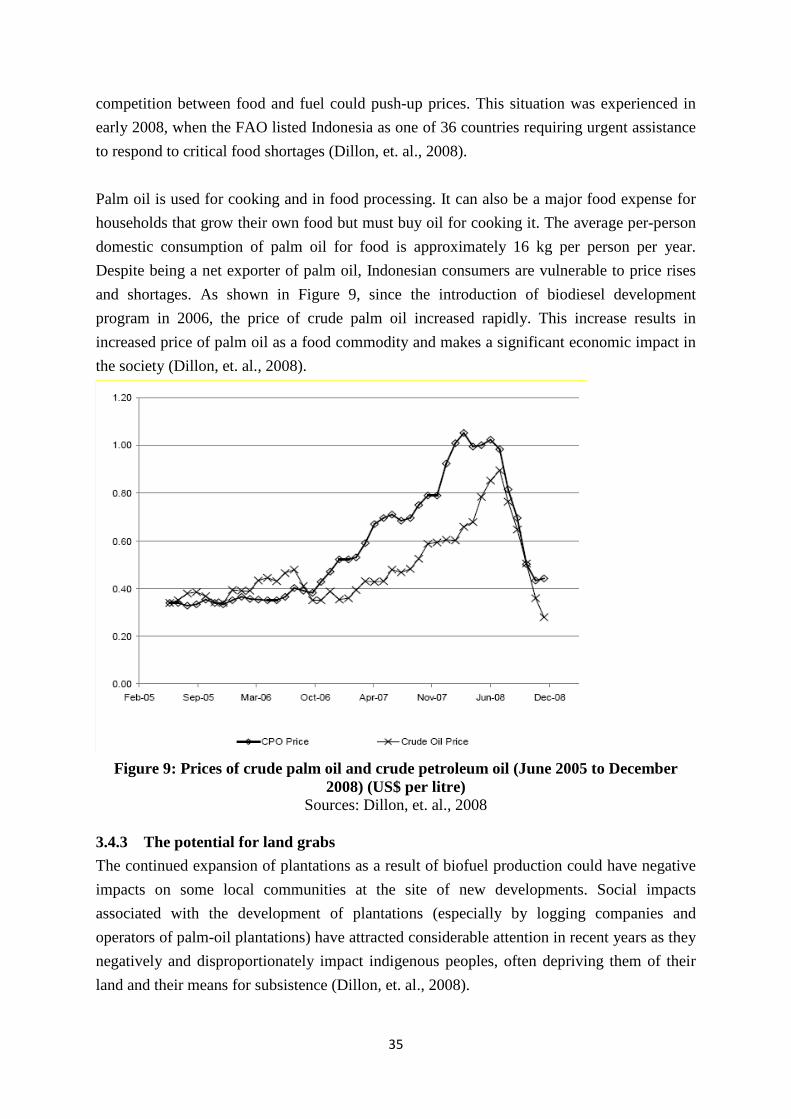
35
competition between food and fuel could push-up prices. This situation was experienced in early 2008, when the FAO listed Indonesia as one of 36 countries requiring urgent assistance to respond to critical food shortages (Dillon, et. al., 2008). Palm oil is used for cooking and in food processing. It can also be a major food expense for households that grow their own food but must buy oil for cooking it. The average per-person domestic consumption of palm oil for food is approximately 16 kg per person per year. Despite being a net exporter of palm oil, Indonesian consumers are vulnerable to price rises and shortages. As shown in Figure 9, since the introduction of biodiesel development program in 2006, the price of crude palm oil increased rapidly. This increase results in increased price of palm oil as a food commodity and makes a significant economic impact in the society (Dillon, et. al., 2008).
Figure 9: Prices of crude palm oil and crude petroleum oil (June 2005 to December
2008) (US$ per litre) Sources: Dillon, et. al., 2008
3.4.3 The potential for land grabs The continued expansion of plantations as a result of biofuel production could have negative impacts on some local communities at the site of new developments. Social impacts associated with the development of plantations (especially by logging companies and operators of palm-oil plantations) have attracted considerable attention in recent years as they negatively and disproportionately impact indigenous peoples, often depriving them of their land and their means for subsistence (Dillon, et. al., 2008).
36
Indonesian government encourages investments in energy crop plantations, mostly jatropha. The new Investment Law of April 2007 allows foreign investors to acquire land for an initial period of 60 years, offers tax incentives and the option of creating "special biofuel production zones”. Sweden, United States, Japan, Malaysia, and India have also sent their representatives to assess feasibility (Vel, 2010). The government hopes that Jatropha curcus will be suitable for cultivation on marginal land that is unsuitable for food production. Sumba is one of the areas that has been selected to expand jatropha cultivation. Sumba is full of marginal lands, but they are not empty. They are sparsely populated, but the local population considers them part of their ancestral lands. At the same time, the increase use of land for biofuel crops will result in increased land clearing and increased agricultural intensity such as greater use of water, chemical fertilizers and pesticides (Dillon, et. al., 2008). 3.4.4 Biofuels and deforestation The land under oil-palm cultivation in Indonesia has expanded ten-fold since 1985, covering more than 68,000 km2 by June 2008. It is expected to reach 0.1 million km2 by 2010 (Dillon, et. al., 2008). The use of biofuels can lead to lower emissions of harmful pollutants and greenhouse gases when compared with petroleum fuels. However, once the full lifecycle impacts are taken into account, the benefits become marginal for many types of biofuels. If native grassland or forest is cleared due to produce feedstock for biofuel production, the net environmental impacts are likely to be negative. There is evidence that forests in Indonesia have been, and continue to be, converted to palm oil plantations, and that some of the oil may be used in biodiesel production or to supply global shortages of vegetable oil arising in part from biodiesel production in other countries. It is difficult to estimate the incremental impact of biofuel production on deforestation. There are many non-biofuel factors involved such as the market price for timber (legal and illegal), land clearance for non-biofuel crops, and population pressures. A total of 0.22 million km2 of forest was allocated for conversion to oil-palm plantations up to 2007 but only 0.02 million km2 were actually planted with oil-palm. The remainder had been logged and abandoned (Dillon, et. al., 2008).
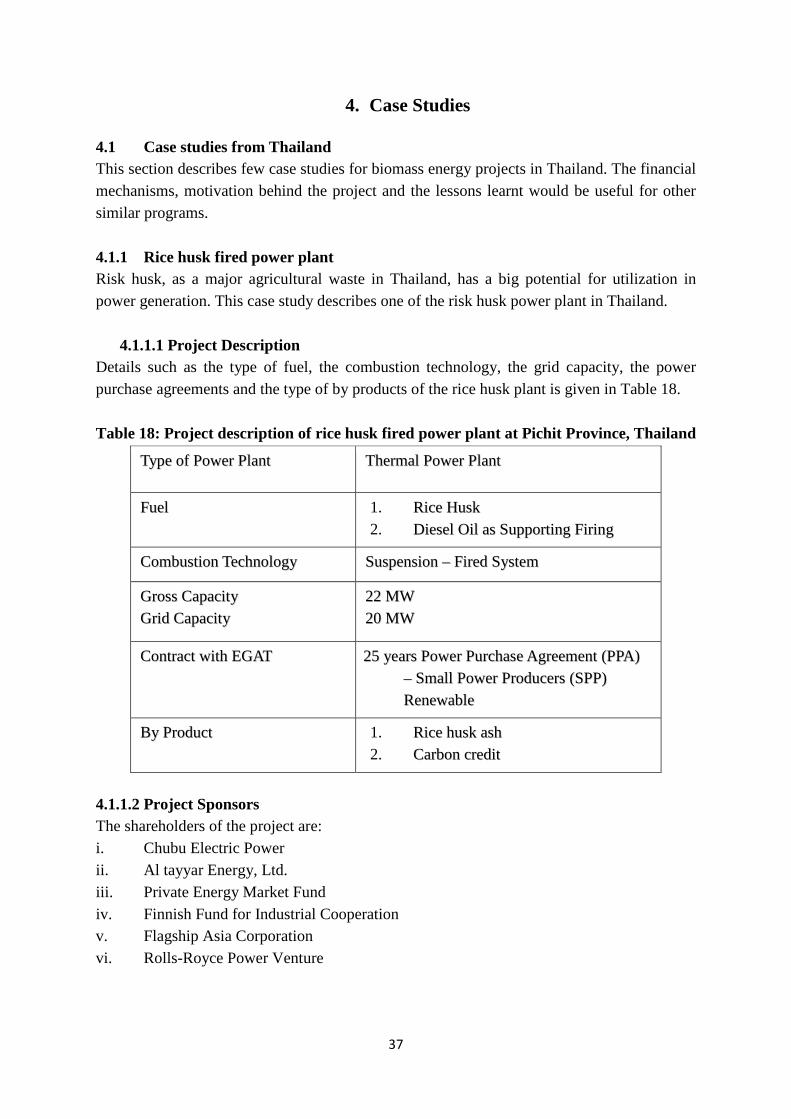
37
4. Case Studies
4.1 Case studies from Thailand This section describes few case studies for biomass energy projects in Thailand. The financial mechanisms, motivation behind the project and the lessons learnt would be useful for other similar programs. 4.1.1 Rice husk fired power plant Risk husk, as a major agricultural waste in Thailand, has a big potential for utilization in power generation. This case study describes one of the risk husk power plant in Thailand.
4.1.1.1 Project Description Details such as the type of fuel, the combustion technology, the grid capacity, the power purchase agreements and the type of by products of the rice husk plant is given in Table 18. Table 18: Project description of rice husk fired power plant at Pichit Province, Thailand
TTyyppee ooff PPoowweerr PPllaanntt TThheerrmmaall PPoowweerr PPllaanntt
FFuueell 1. RRiiccee HHuusskk 2. DDiieesseell OOiill aass SSuuppppoorrttiinngg FFiirriinngg
CCoommbbuussttiioonn TTeecchhnnoollooggyy SSuussppeennssiioonn –– FFiirreedd SSyysstteemm
GGrroossss CCaappaacciittyy GGrriidd CCaappaacciittyy
2222 MMWW 2200 MMWW
CCoonnttrraacctt wwiitthh EEGGAATT 2255 yyeeaarrss PPoowweerr PPuurrcchhaassee AAggrreeeemmeenntt ((PPPPAA)) –– SSmmaallll PPoowweerr PPrroodduucceerrss ((SSPPPP)) RReenneewwaabbllee
BByy PPrroodduucctt 1. RRiiccee hhuusskk aasshh 2. CCaarrbboonn ccrreeddiitt
4.1.1.2 Project Sponsors The shareholders of the project are: i. Chubu Electric Power ii. Al tayyar Energy, Ltd. iii. Private Energy Market Fund iv. Finnish Fund for Industrial Cooperation v. Flagship Asia Corporation vi. Rolls-Royce Power Venture
38
4.1.1.3 Plant Location The plant is located in the Pichit Province which is in the Northern part of Thailand, about 4 hours drive from Bangkok. The address of the plant is: Village Moo 2, Horkai Sub-District, Bang Mun Nak District, Pichit Province, Thailand. 4.1.1.4 Key Aspects
• Site Selection: As shown in the map below, the plant is located in a strategic location where rice husk supply is available continuously. The rice is harvested twice a year.
Figure 10: Plant location of rice husk fired power plant at Pichit Province, Thailand
• Technology Selection: The technology, i.e. burning rice husk in suspension, is from USA. The technology is more expensive but reliable compared to the other technologies available.
• Financial Aspects: Apart from revenue from the sale of electricity, additional revenues are generated from sales of rice husk as and carbon credit. This is the first project in Thailand to be issued with the Certified Emission Reduction (CER).
Major Rice Crop Second Rice Crop
39
Uninterrupted fuel supply and price of the fuel is the major concern of the plant owners. As shown in the Table 19, the price of the rice husk increased from 410 Baht/ton in 2002 to 850 Baht/ton in the third quarter of 2009.
Table 19: Price of rice husk delivered to the plant at Pichit Province, Thailand
(Baht/ton) Year Price (Baht/ton)
2002 (Feasibility Study) 410 2006 720-800 2007 770-800 2008 800-980 2009 –1st quarter 850 2009 –2nd quarter 850-900 2009 –3rd quarter 800-850
• CDM Aspects:
Baseline Methodology used: ACM 0006 – Consolidated baseline for grid–connected electricity generation from biomass residues Total Emission Reduction is equal to 70,772 tCO2e per year ( i.e. Baseline Emission = 73,746 tCO2e, Project Emission = 2,974 tCO2e, Estimated Leakage = 0) Crediting period: 2006-2012
4.1.1.5 Key aspects of Biomass for Power generation in Thailand As of December 2008, the total installed capacity of biomass fired power plant in Thailand is 2,255 MW. Out of the total 885 MW, 39% is installed under the Small Power Producers (SPP) scheme and the balance 1,370 MW (61%) is installed under the Very Small Power Producers (VSPP) scheme. A total of 151 biomass fired power plants were installed by the end of 2008.
Fuel Popularity:
• 91% of total biomass generation (both SPP&VSPP) is from 3 main biomass fuels i.e. bagasse 40%, rice husk 20%, woods plus black liquor 10%, mix of bagasse, rice husk and woods is equal to 21%
• Empty Fruit Bunch (EFB) from palm is coming along with 4% share and the others are not more than 1%.
• Bagasse, rice husk, EFB and palm residue are easier and cheaper to collect from millers.
• Other biomass fuels must be collected from the fields making higher collecting cost depending on distance and catchment area
40
Generating Purposes: • 67% of the electricity generated from bagasse is mainly used for own consumption
and the balance 33% is exported to the grid. • 41% of the electricity generated from bagasse fuel mix (i.e. bagasse mixed with rice
husk and other biomass) is used for own consumption and the balance, 59% is exported to the grid.
• In all other cases, more than 80% of the electricity generated is exported to the grid and the balance used in the plant.
Issue on Biomass Energy in Thailand:
• Power purchase from feedstock owner may secure for that particular project, but may jeopardize other existing users if such feedstock has been sold to and used by others; supply remains the same, but more demand.
• To avoid price pressure and shortage, control mechanism of power purchase from biomass is needed to manage availability of each feedstock.
• A joint committee to review feedstock availability before power purchase from biomass is important.
Challenges:
• Site selection is key consideration for feedstock availability, public acceptance and grid connecting.
• Multiple feedstock availability in the area is favorable. • Current economic situation with credit crunch and risk of fuel supply causes difficulty
to get loan (from banks) and high price of fuel. • Encouraging power plants with less than 1 MW brings up the question of technology
and price, considering economy of scale. Opportunities:
• The biomass availability is high, especially in the upper north, upper north-east, and southern regions of Thailand.
• Apart from the ADDER, biomass is supported by the 15 year Alternative Energy Development Plan.
• There appears to be more investment opportunities for new technologies such as bio-oil.
• A number of financing packages available
4.1.2 Biogas based power generation from landfill gas Biogas based power generation from landfill gases has been initiated in Thailand since 1996. This section describes the development and promotion of one of the landfill power plant in Thailand.
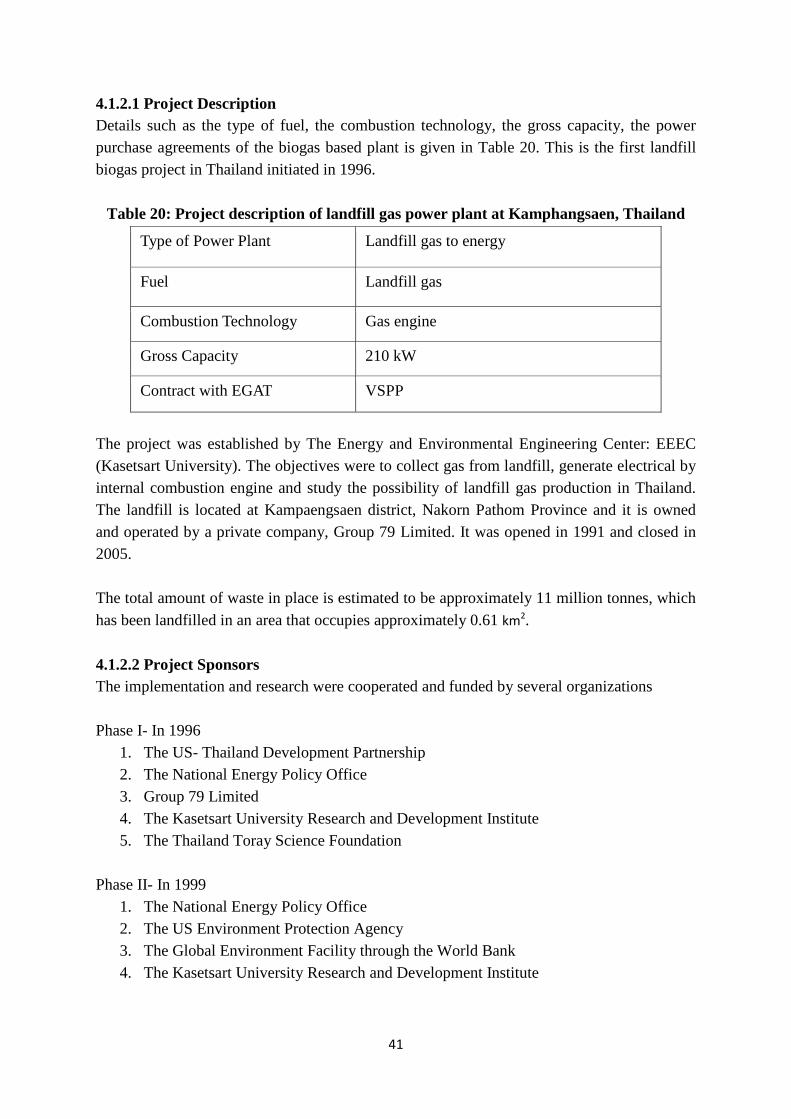
41
4.1.2.1 Project Description Details such as the type of fuel, the combustion technology, the gross capacity, the power purchase agreements of the biogas based plant is given in Table 20. This is the first landfill biogas project in Thailand initiated in 1996.
Table 20: Project description of landfill gas power plant at Kamphangsaen, Thailand
Type of Power Plant Landfill gas to energy
Fuel Landfill gas
Combustion Technology Gas engine
Gross Capacity 210 kW
Contract with EGAT VSPP
The project was established by The Energy and Environmental Engineering Center: EEEC (Kasetsart University). The objectives were to collect gas from landfill, generate electrical by internal combustion engine and study the possibility of landfill gas production in Thailand. The landfill is located at Kampaengsaen district, Nakorn Pathom Province and it is owned and operated by a private company, Group 79 Limited. It was opened in 1991 and closed in 2005. The total amount of waste in place is estimated to be approximately 11 million tonnes, which has been landfilled in an area that occupies approximately 0.61 km2.
4.1.2.2 Project Sponsors The implementation and research were cooperated and funded by several organizations Phase I- In 1996
1. The US- Thailand Development Partnership 2. The National Energy Policy Office 3. Group 79 Limited 4. The Kasetsart University Research and Development Institute 5. The Thailand Toray Science Foundation
Phase II- In 1999
1. The National Energy Policy Office 2. The US Environment Protection Agency 3. The Global Environment Facility through the World Bank 4. The Kasetsart University Research and Development Institute
42
Phase III- In 2007 1. Group 79 Co., Ltd. 2. Min Sen Machinery Co., Ltd.
4.1.2.3 Plant Location Kamphangsaen Landfill is located in Nakhonprathom Province, Thailand approximately 80 kilometers northwest of Bangkok. 4.1.2.4 Key aspects and project time line 1995- His Majesty the King of Thailand initiated a fund for waste management Phase I The project expected a gas flow rate of 600 m3/hr of landfill gas and the project aimed to generated 870 kW of electricity, which would be supplied to the university grid. It was estimated that there was 1.3 million tons of waste in the site. 1996- the Energy and Environmental Engineering Center, Faculty of Engineering, Kasetsart
University successfully tested a gas engine modified from a gasoline engine using landfill gas (LFG) from a portion of landfill.
1997- A pilot project was established in 1997 and a LFG collection system consisted of 39 vertical extraction wells was constructed in a relatively shallow portion of the landfill. The project also incorporated a LFG pipeline and a power plant that includes two of 435 kW Waukesha engine-generator sets. It is planned that the electricity will be used to supply the University campus grid.
After the construction of the vertical extraction wells, it was found that the leachate level was approximately 1-2 meters below the ground surface during the rainy season, therefore the slotted portions of the vertical extraction wells were below leachate level. It was further observed that the LFG quantity and quality dropped sharply as time progressed. It was found that the gas flow rate is approximately 180 m3/hr, which is not efficient to run the engine.
Phase II 1999- The original collection system was subsequently abandoned and a new area of the
landfill, which was about 18 meters in height, was selected for recovery of LFG. Based on this finding, an alternate collection system design was developed and two
horizontal LFG collectors (90 m long) were installed in January 1999. The new horizontal collectors included provision for gravity drainage of leachate from within the landfill.

43
Based on the successful performance of these new collectors, five additional collectors (100m long) were installed in January 2000. The horizontal collectors were installed at 30 and 40 meter spacing. Gas collection rate was around 300 m3/hr and CH4 approximately 50%.
Phase III 2007-to date
The VSPP was established with cooperation between Min Sen Machinery Co., Ltd., Group 79 Co., Ltd. and The Energy and Environmental Engineering Center (EEEC), Kasetsart University. Min Sen Machinery Co., Ltd supports in gas engine, interconnecting to grid line and repair gas collection systems. Group 79 Co., Ltd supports for land-use and site preparation. The EEEC is responsible in landfill gas collection and research. Nowadays, this plant generates 210 kW and feed into grid. The EEEC is researching in gas quality improvement and gas decreasing rate that may provide useful information to new investors.
4.1.2.5 Opportunities and lessons learned
• The key success of the project was due to the consistent assistance and the
cooperation from the government institutes for its implementation and research stages.
• The project served as a pilot program of power generation from landfill gas for Thailand and for other countries in South East Asia.
• After the success of this project, 5 other LFG power generations projects have been initiated in commercial scale. Two are already in operation and 3 more are in the construction stage.
• Some projects have also obtained funds by selling CERs. • LFG power generation projects are promoted by government policies through their
VSPP program and the government has introduced an additional charge of feed in tariff system for biogas power generation projects, which would make the projects more feasible. The LFG projects have now attracted the private sector investments, both local and foreign.
4.2 Case studies from Indonesia This section describes two case studies for biomass energy projects in Indonesia. The financial mechanisms, motivation behind the project and the lessons learnt would be useful for other such programs.
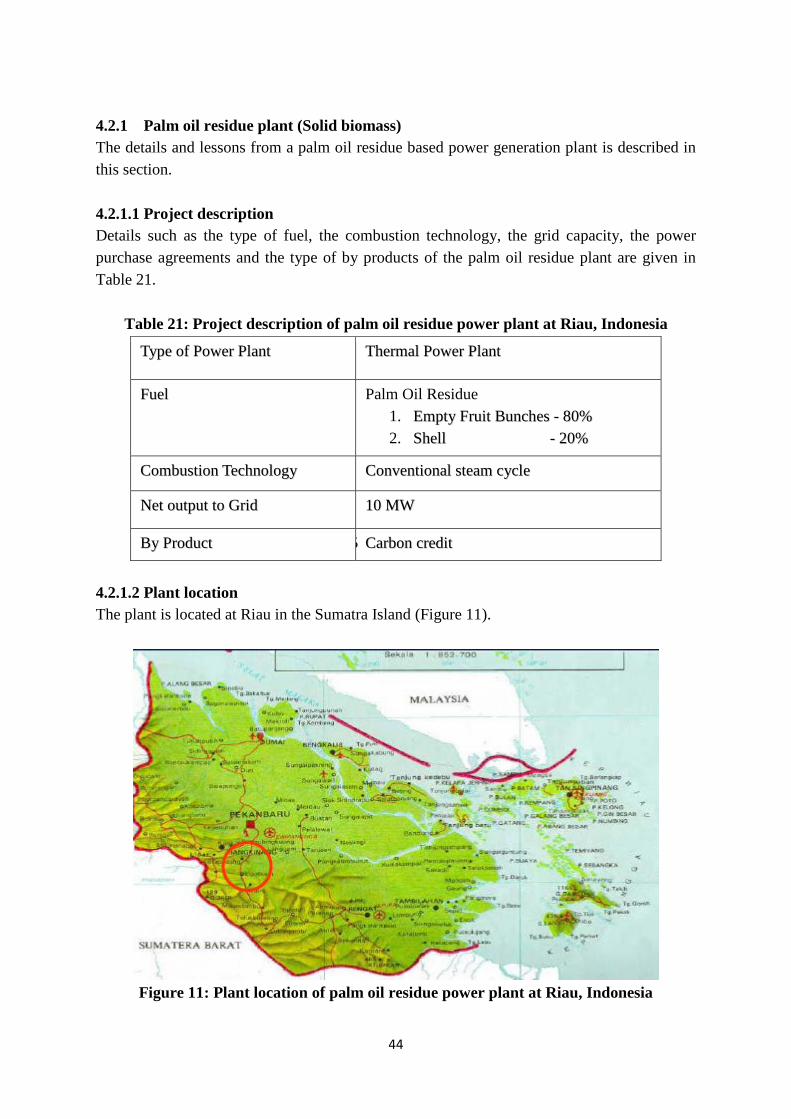
44
4.2.1 Palm oil residue plant (Solid biomass) The details and lessons from a palm oil residue based power generation plant is described in this section.
4.2.1.1 Project description Details such as the type of fuel, the combustion technology, the grid capacity, the power purchase agreements and the type of by products of the palm oil residue plant are given in Table 21.
Table 21: Project description of palm oil residue power plant at Riau, Indonesia
TTyyppee ooff PPoowweerr PPllaanntt TThheerrmmaall PPoowweerr PPllaanntt
FFuueell Palm Oil Residue 1. EEmmppttyy FFrruuiitt BBuunncchheess -- 8800%% 2. SShheellll -- 2200%%
CCoommbbuussttiioonn TTeecchhnnoollooggyy CCoonnvveennttiioonnaall sstteeaamm ccyyccllee
NNeett oouuttppuutt ttoo GGrriidd 1100 MMWW
BByy PPrroodduucctt 5 CCaarrbboonn ccrreeddiitt
4.2.1.2 Plant location The plant is located at Riau in the Sumatra Island (Figure 11).
Figure 11: Plant location of palm oil residue power plant at Riau, Indonesia
45
4.2.1.3 Fuel Availability Palm oil residues sourced from 6 mills and 100% of the required fuel can be supplied within 60 km 4.2.1.4 Other advantages Other than the power generation capacity from a waste source, there are other advantages of such projects, as listed below.
• Reduce dumping of 200,000 tonnes of EFB’s annually and hence ill reduce methane and nitrous oxide release from decomposition and inefficient burning of the dumped wastes.
• 70,000 tCO2/ year displaced from fossil fuels, preventing emissions of methane and nitrous oxide.
• Approximately 180 direct and indirect jobs created in the long term and stimulating the local economy, and
• Additional revenue for mill owners
4.2.2 Rice Husk Power Plant Rice husk is another major solid waste residue which can be used for power generation in Indonesia. One of the project’s details is described below. 4.2.2.1 Project description Table 22 gives the details of the rice husk based power generation plant in Indonesia.
Table 22: Project description of rice husk power plant at Lampung, Indonesia
TTyyppee ooff PPoowweerr PPllaanntt TThheerrmmaall PPoowweerr PPllaanntt
FFuueell Ungrounded Rice Husk
CCoommbbuussttiioonn TTeecchhnnoollooggyy CCoonnvveennttiioonnaall sstteeaamm ccyyccllee •Overfed Stoker fired water tube boiler.
•Continuous ash discharge from grate
NNeett oouuttppuutt ttoo GGrriidd 33 MMWW
BByy PPrroodduucctt CCaarrbboonn ccrreeddiitt
4.2.2.2 Plant location The plant is located at Lampung in Sumatra Island, Indonesia
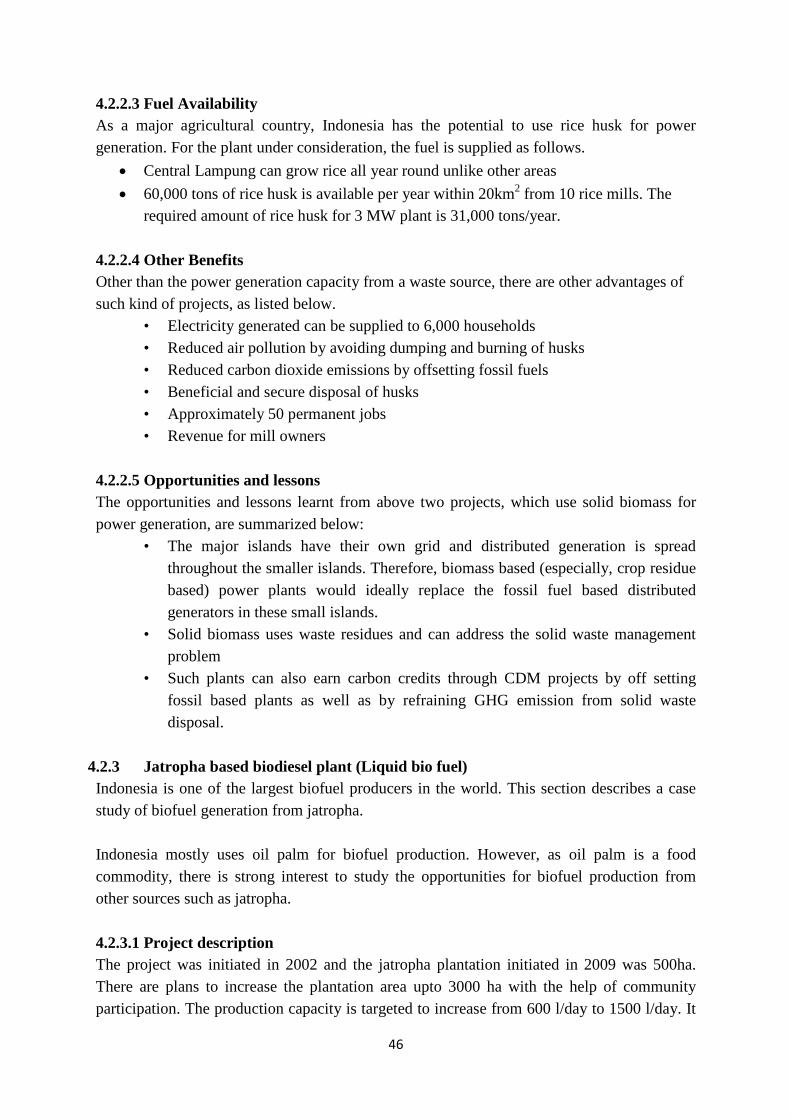
46
4.2.2.3 Fuel Availability As a major agricultural country, Indonesia has the potential to use rice husk for power generation. For the plant under consideration, the fuel is supplied as follows.
• Central Lampung can grow rice all year round unlike other areas • 60,000 tons of rice husk is available per year within 20km2 from 10 rice mills. The
required amount of rice husk for 3 MW plant is 31,000 tons/year. 4.2.2.4 Other Benefits Other than the power generation capacity from a waste source, there are other advantages of such kind of projects, as listed below.
• Electricity generated can be supplied to 6,000 households • Reduced air pollution by avoiding dumping and burning of husks • Reduced carbon dioxide emissions by offsetting fossil fuels • Beneficial and secure disposal of husks • Approximately 50 permanent jobs • Revenue for mill owners
4.2.2.5 Opportunities and lessons The opportunities and lessons learnt from above two projects, which use solid biomass for power generation, are summarized below:
• The major islands have their own grid and distributed generation is spread throughout the smaller islands. Therefore, biomass based (especially, crop residue based) power plants would ideally replace the fossil fuel based distributed generators in these small islands.
• Solid biomass uses waste residues and can address the solid waste management problem
• Such plants can also earn carbon credits through CDM projects by off setting fossil based plants as well as by refraining GHG emission from solid waste disposal.
4.2.3 Jatropha based biodiesel plant (Liquid bio fuel) Indonesia is one of the largest biofuel producers in the world. This section describes a case study of biofuel generation from jatropha. Indonesia mostly uses oil palm for biofuel production. However, as oil palm is a food commodity, there is strong interest to study the opportunities for biofuel production from other sources such as jatropha. 4.2.3.1 Project description The project was initiated in 2002 and the jatropha plantation initiated in 2009 was 500ha. There are plans to increase the plantation area upto 3000 ha with the help of community participation. The production capacity is targeted to increase from 600 l/day to 1500 l/day. It
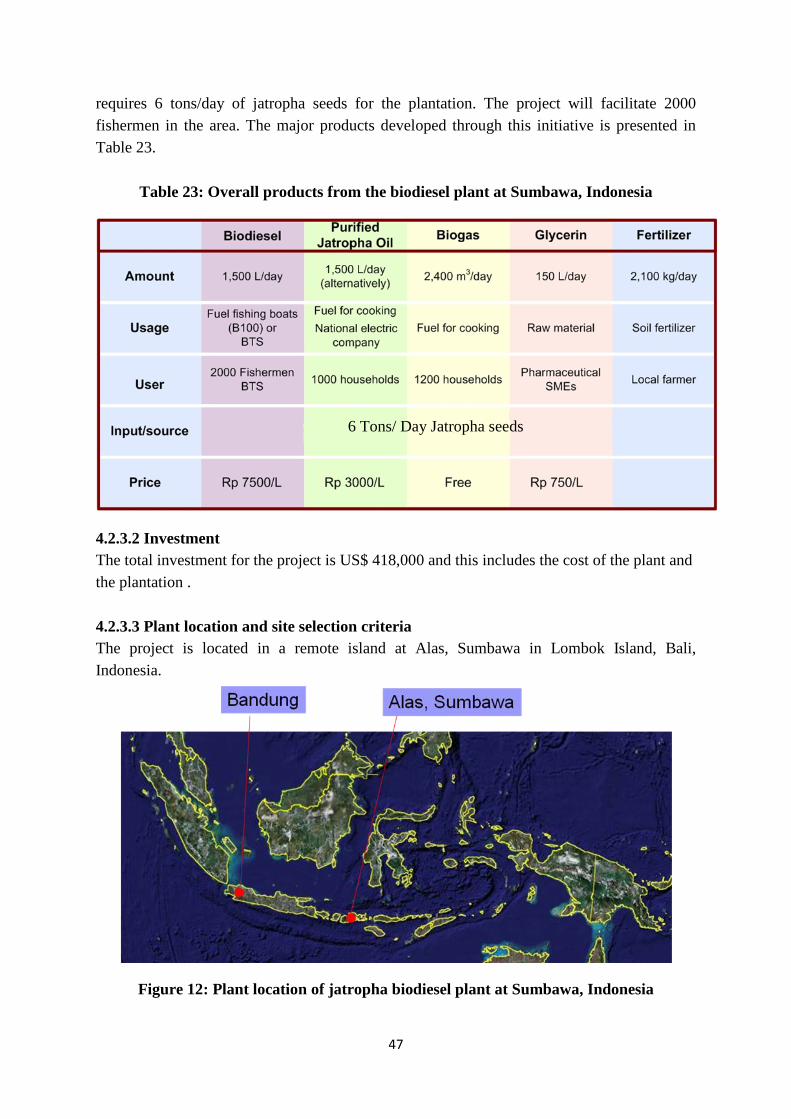
47
requires 6 tons/day of jatropha seeds for the plantation. The project will facilitate 2000 fishermen in the area. The major products developed through this initiative is presented in Table 23.
Table 23: Overall products from the biodiesel plant at Sumbawa, Indonesia
4.2.3.2 Investment The total investment for the project is US$ 418,000 and this includes the cost of the plant and the plantation .
4.2.3.3 Plant location and site selection criteria The project is located in a remote island at Alas, Sumbawa in Lombok Island, Bali, Indonesia.
Figure 12: Plant location of jatropha biodiesel plant at Sumbawa, Indonesia
6 Tons/ Day Jatropha seeds

48
4.2.3.4 Importance of the project at the selected place The official petro-diesel retail price at the location for industry is Rp 8,000/L (US$
0.9) and for transportation, it is Rp 5,500/L (US$ 0.6) Petro-diesel availability is a problem, and there is uncertainty in supply Due to remote location, real retail price could increase to Rp 20,000/L (US$ 2.2)
Figure 13: Importance of the plant location of jatropha biodiesel plant at Sumbawa, Indonesia
4.2.3.5 Fuel Availability- Existing and potential plantation area
10 Ha existing Jatropha plantation- privately owned Potential of 3,000 Ha marginal land to be planted
Figure 14: Existing plantation areas for the jatropha based biodiesel plant at Sumbawa, Indonesia
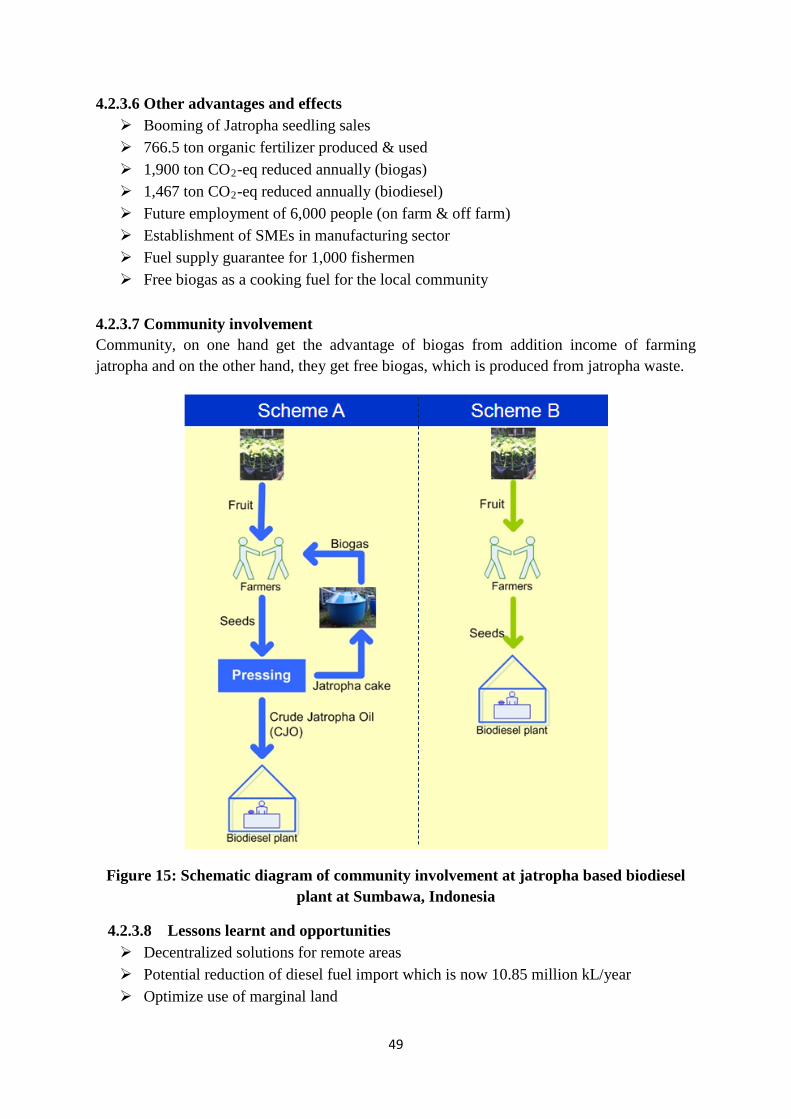
49
4.2.3.6 Other advantages and effects Booming of Jatropha seedling sales 766.5 ton organic fertilizer produced & used 1,900 ton CO2-eq reduced annually (biogas) 1,467 ton CO2-eq reduced annually (biodiesel) Future employment of 6,000 people (on farm & off farm) Establishment of SMEs in manufacturing sector Fuel supply guarantee for 1,000 fishermen Free biogas as a cooking fuel for the local community
4.2.3.7 Community involvement Community, on one hand get the advantage of biogas from addition income of farming jatropha and on the other hand, they get free biogas, which is produced from jatropha waste.
Figure 15: Schematic diagram of community involvement at jatropha based biodiesel plant at Sumbawa, Indonesia
4.2.3.8 Lessons learnt and opportunities Decentralized solutions for remote areas Potential reduction of diesel fuel import which is now 10.85 million kL/year Optimize use of marginal land
50
5. Conclusions
This study shows the high potential of bioenergy applications in the countries - Thailand and Indonesia – selected for the study. The details are discussed in chapter 2 for all the three main forms of bio energy considered: biomass residues, biogas, and biofuel. Both countries have developed renewable energy (bioenergy) policy/ measures to support bioenergy promotion, and have developed roadmaps as described in chapter 3. Case studies of bio energy projects in the two countries shows the potential, application, issues and opportunities for scaling up the current use of bio energy resources. Even though Thailand relies heavily on imported energy, the energy security of the country has been maintained through a diversity of types and sources of energy. Fossil energy still plays a major role, especially petroleum products and natural gas. Taking advantage of the massive agricultural base, Thailand has alternative energy such as biomass, crop residues, municipal solid waste, etc. Thailand is committed to explore the range of cost-effective alternative energy sources. Earlier, biomass, which has been mostly used as fuel in rural households and industries, is now playing a greater role as fuel in power generation and as an energy source for bio-liquid fuel production for vehicles. Most of the renewable energy types have proved to be environmentally friendly. Therefore, promotion of renewable energy technology research and development is considered to be of great importance and will continue to be supported by the government. The key factors successful -
e
infrastructure for the renewable energy expansion, r -research, development, demonstration, dissemination and public relation activities. There is a vast potential to implement biomass power generation and cogeneration projects in Indonesia using agro-industrial residues, which still remains untapped. Developing biofuel is an important alternative for Indonesia due to the abundance availability of raw material. For much of Indonesia, with its isolated islands and regions, provision of basic energy needs by renewable energy is an appropriate option. Biomass is one of renewable energy that is potential to substitute petroleum-based fuel. The government has issued policies to increase the utilization including mandatory and incentives to promote biomass energy projects. However, the implementation is still facing challenges

51
such as its high production cost compared with the conventional and inefficient pricing policies. Clear price signals may also encourage the private sector participation in investing on bio-energy projects. The government needs to provide innovative financial mechanism to support biomass energy projects and the government needs to take actions for minimizing huge social and environmental impacts. Indonesia could introduce RPS standards so that it will increase the share of renewable in the power generation sector.
52
References
Amatayakul, W., Berndes, G., 2007, Fuel ethanol program in Thailand: energy, agricultural, and environmental trade-offs and prospects for CO2 abatement, Energy for Sustainable Development, Volume XI No. 3, September 2007.
Amranand, P., 2007, Renewable energy policy in Thailand, Keynote address- Entech Pollutec Asia 2007 and Renewable Energy Asia 2007, 6 June 2007, BITEC Bangkok.
Amranand, P., 2008, Alternative Energy, Cogeneration and Distributed Generation : Crucial Strategy for Sustainability of Thailand's Energy Sector, Energy Policy and Planning Office, Ministry of Energy, Thailand, Available at http://www.eppo.go.th/doc/Piya-RE-in-Thailand.pdf, Retrieved on 05 February 2010.
Ariati, R., 2009, National energy policy and biomass development program in Indonesia, 6th Asia Biomass Seminar, Nikko Hotel, Jakarta, March 16-20, 2009.
Asia Biomass Office, 2009, Power Generation Potential by EFB and Rice Husk in Indonesia, Available at http://www.asiabiomass.jp/english/topics/0907_05.html.
Asia Pacific Economic Corporation (APEC), 2009, Indonesia biofuel activities, APEC Biofuels, Available at http://www.biofuels.apec.org/me_indonesia.html.
Biofuels Digest, 2010, Thailamd biofuels: feedstocks and market opportunities, 17 May 2010, Available at: http://www.biofuelsdigest.com/bdigest/2010/05/17/thailand-biofuels-feedstocks-and-market-opportunities/, Retrieved on 28 July 2010.
Center of Energy and Mineral Resources, Hand book of Energy and Economic Statistic of Indonesia 2007, Center of Energy and Mineral Resources, Jakarta.
Department of Alternative Energy Development and Efficiency (DEDE), 2005. Palm biodiesel development strategies. Ministry of Energy, Thailand.
Department of Alternative Energy Development and Efficiency (DEDE), 2007. Annual Report of Electricity Power in Thailand 2007. Ministry of Energy, Thailand.
Department of Alternative Energy Development and Efficiency (DEDE), 2008a, Thai Energy Situation-2008, Ministry of Energy, Thailand.
Department of Alternative Energy Development and Efficiency (DEDE), 2008b, Alternative Energy Development Plan 2008-2022, Ministry of Energy, Thailand, Available it: http://www.dede.go.th/dede/index.php?id=996.
53
Department of Alternative Energy Development and Efficiency (DEDE), 2009. Ethanol factories in Thailand, Available at http://www.dede.go.th.
Department of Alternative Energy Development and Efficiency (DEDE), 2010a, Latest Information of E85 and Balance of Cassava & Molasses for Food and Ethanol, Available at: http://www.dede.go.th/dede/fileadmin/upload/pictures_eng/pdffile/e85-17-june.pdf, Retrieved on 28 July 2010.
Department of Alternative Energy Development and Efficiency (DEDE), 2010b, List of B100 Biodiesel Plants in June 2010, Available at: http://www.dede.go.th/dede/fileadmin/upload/pictures_eng/pdffile/Bio_Plants_june_10.pdf, Retrieved on 28 July 2010.
Dillon, H. S., Laan, T., Dillon, H. S., 2008, Biofuels at what cost? Government support for ethanol and biodiesel in Indonesia, The Global Subsidies Initiative of the International Institute for Sustainable Development, Switzerland.
Dutta, A., Shrestha, R. M., Kumar, 2006. ProBIOS: Promotion of Biofuels for Sustainable Development in Thailand. Asian Institute of Technology (AIT), Thailand.
Energy Policy and Planning Office (EPPO), 2008. Thai biogas promotion programme. Available at http://www.thaibiogas.net/en/home.
Energy for Environment Foundation, 2009. Biogas based electricity generation capacity in
Thailand. Available at http://www.efe.or.th/home.php?ds=content&mid=cMS7s93gtBdrFxPI&docmenu=Yst
uBk4NUpWmdGLO. Energy for Environment Foundation, 2009. Potential of Biogas production from different
industries in Thailand. Available at http://www.efe.or.th/home.php?ds=content&mid=cMS7s93gtBdrFxPI&docmenu=fzB
k3mhUyRZ8t4Jv. Energy for Environment Foundation, 2009. Status of biomass power generation capacity of
SPPs and VSPPs (Oct 2007). Available at http://www.efe.or.th/home.php?ds=content&mid=hGtTu8zx7jWvD4by&docmenu=3h
P7p6a8KInbwvG5.
Food and Agriculture Organization, 2007. FAO Statistics data by country. Available at http://faostat.fao.org/.
Global Agriculture Information Network (GAIN), 2008, Thailand biofuels- annual 2008, Global Agriculture Information Network, USDA Foreign Agricultural Service.

54
Global Agriculture Information Network (GAIN), 2009, Indonesia biofuels- annual 2009, Global Agriculture Information Network, USDA Foreign Agricultural Service.
Global Agriculture Information Network (GAIN), 2010, Thailand biofuels- annual 2010, Global Agriculture Information Network, USDA Foreign Agricultural Service.
Garivait S., Chaiyo U., Patumsawad S. and Deakhuntod J., 2006. Physical and Chemical Properties of Thai Biomass Fuels from Agricultural Residues. The 2nd Joint International Conference on “Sustainable Energy and Environment (SEE 2006)”1-23 November 2006, Bangkok, Thailand.
Hadiwidjoyo, S., 2009, Indonesia’s biofuels policies and programs, Biomass-Asia Workshop, Japan, 18 November 2009, Available at http://www.biomass-asia-workshop.jp/biomassws/06workshop/presentation/09_saryono.pdf.
Hermawan, Hadi, S. P., 2006, Existing sustainable (Renewable) energy system in Indonesia, The 2nd Joint International Conference on “Sustainable Energy and Environment (SEE 2006)”, Bangkok, Thailand, 1-23 November 2006, Available at http://www.jgsee.kmutt.ac.th/see1/cd/file/F-045.pdf.
Indrawa, C., 2009, Biofuel based energy self sufficient village, 6th Asia Biomass Seminar, Nikko Hotel, Jakarta, March 16-20, 2009
Institute for Global Environmental Strategies (IGES), 2008, Second IGES White Paper Climate Change Policies in the Asia-Pacific: Re-uniting Climate Change and Sustainable Development, Chapter 5: Prospects and Challenges of Biofuels in Asia: Policy Implications, IGES, Hayama, Japan.
International Energy Agency (IEA), 2008, Energy policy review of Indonesia, International Energy Agency, Paris, France.
Ishizuka K, Shigeru Hisajima, Darryl R.J. Macer, 1995. Utilization of Agricultural Wastes for Biogas Production in Indonesia Traditional Technology for Environmental Conservation and Sustainable Development in the Asian-Pacific Region pp. 134-138 Proceedings of the UNESCO - University of Tsukuba International Seminar on Traditional Technology for Environmental Conservation and Sustainable Development in the Asian-Pacific Region, held in Tsukuba Science City, Japan, 11-14 December, 1995.
Legowo, E. H., Kussuryani, Y., Reksowardojo, I. K., 2007, Biofuel development in Indonesia, USDA Global Conference on Agricultural Biofuels: Research and Economic, Minnesota, August 20th - 22th, 2007.

55
Masyarakat Energi Terbarukan Indonesia (METI), 2009. Indonesia renewable energy policy 2006-2025. Accessed from http://www.meti.or.id/
National Energy Policy Council (NEPC), 2006, Thailand's Energy Policy and Development Plan, Available at http://www.eppo.go.th/admin/cab/gov-policy/pol_56-energy-policy-E.html, Retrieved on 03 February 2010
Netherlands Development Organisation (SNV), 2010, Domestic biogas newsletter, Issue 2, January 2010, http://www.michaelyon-online.com/images/pdf/20100127snvdomestic-biogas-newsletter-issue-2january-2010.pdf, Retrieved on 29 July 2010.
Ngaemngam, S., Tezuka, T., 2006, Effect of Energy Policy on Biomass-based Power Generation in Thailand, The 2nd Joint International Conference on Sustainable Energy and Environment (SEE 2006, 21-23 November 2006, Bangkok, Thailand, Available at: http://www.jgsee.kmutt.ac.th/see1/cd/file/F-022.pdf , Retrieved on 28 July 2010.
Nunt-Jaruwong, S., Thailand Renewable Energy Policy - The Potential for Electricity from Dendro-power (Summary), Available at http://www.nri.org/projects/biomass/conference_papers/thailand_renewable_energy_policy_summary.pdf, Retrieved on 03 February 2010.
Panaka, P., Yudiarto, M. A., 2007, New Development of Ethanol Industry in Indonesia, Asian Science & Technology, Jakarta, March 7 2007.
Pienpucta, N., Pongtepupathum, W., 2009, Small hydropower development at existing irrigation dams for clean and renewable energy in Thailand, RIO 9 - World Climate & Energy Event, 17-19 March 2009, Rio de Janeiro, Brazil, Available at: http://www.rio9.com/programme/Book_of_Proceedings/40_SH_Pongtepupathum.pdf , retrieved on 29 July 2010.
Praptiningsih G. Adinurani, Anggi Nindita, Roy Hendroko, 2009. Challenges of Biofuel Industry in Indonesia. Workshop on Renewable Energy & Sustainable Development in Indonesia, Past Experience –Future Challenges, 19-20 January 2009.
Royal Danish Embassy- Thailand, 2007, Sector overview- Energy in Thailand, April 2007; Available at http://www.ambbangkok.um.dk/NR/rdonlyres/2295E8D4-C11C-4012-8898-8636D0BBEBAD/0/SectorOverviewEnergyinThailand26april2007.pdf , Retrieved on 03 February 2010.
Sovacool, B. K., 2010, A comparative analysis of renewable electricity support mechanisms for Southeast Asia, Energy (2010), doi:10.1016/j.energy.2009.12.030 in press.
56
Sajjakulnukit, B., Yingyuada, R., Maneekhao, V., Pongnarintasut, V., Bhattacharya, S.C., Salam P.A. (2005), Assessment of sustainable energy potential of non-plantation biomass resources in Thailand, Biomass and Bioenergy, 29 (2005), 214-224.
Sarochawikasit, R., 2009, Alternative Energy Development Plan (2008 – 2022), medium -
and long – term investment plan and the role of the private sector, Presented to Climate Financing: Clean Technology Fund (CTF) and the Role of the Private Sector Workshop, 15 July 2009, Available at http://siteresources.worldbank.org/INTTHAILAND/Resources/333200-1089943634036/475256-1232532308749/5753865-1248058855014/dr.rangsan-dede.ppt, Retrieved on 03 February 2010.
SenterNovem, 2009, Bilateral energy coorporation Indonesia Netherland- biogas, Available at: http://www.senternovem.nl/becin/projects/biogas.asp, Retrieved on 29 July 2010.
Siemers, W., 2009, Sustainable Utilization of Biomass Resources for Power and Biofuels in Thailand, ORBIT 2009 CHINA, Beijing, 19 -21 Nov 2009.
Srisovanna, P., 2004, Thailand’s biomass energy, Electricity Supply Industry in Transition: Issues and Prospect for Asia, 14-16 January 200, Available at http://www.cogen3.net/doc/countryinfo/thailand/ThailandBiomassEnergy_report.pdf, Retrieved on 3 February 2010.
Tjakrawan, P., 2009, Experience in biofuel industry development, 6th Asia Biomass Seminar, Nikko Hotel, Jakarta, March 16-20, 2009.
Wiraphorn, N., Nuchprayoon, S., 2008, Financial impact of renewable Portfolio Standard policy on electricity generation cost, Section 3: Industrial cleaner technology in practices- International Symposium on Environmental Management : Hazardous-Environmental Management Toward Sustainability, Royal Hill Resort & Spa Nakorn Nayok, Thailand, 22-23 September 2008.
Wattimena, B., 2009, Prospect of Bio Fuels Development in Indonesia and It It’s Implication on Sustainable Development, 6th Asia Biomass Seminar, Nikko Hotel, Jakarta, March 16-20, 2009.
Wirawan, S. S., Tambunan, A. H., 2006, The Current Status and Prospects of Biodiesel Development in Indonesia : a review, the Third Asia Biomass Workshop, Tsukuba, Japan, November 16, 2006.