Impax third quarter 2017 earnings call presentation
22
Third Quarter 2017 Results and Business Update November 9, 2017
-
Upload
impax-labs -
Category
Investor Relations
-
view
2.840 -
download
0
Transcript of Impax third quarter 2017 earnings call presentation
1
Third Quarter 2017 Results and Business Update November 9, 2017
2
Impax Cautionary Statement Regarding Forward Looking Statements "Safe Harbor" statement under the Private Securities Litigation Reform Act of 1995: To the extent any statements made in this presentation contain information that is not historical; these statements are forward-looking in nature and express the beliefs and expectations of management. Such statements are based on current expectations and involve a number of known and unknown risks and uncertainties that could cause the Company’s future results, performance, or achievements to differ significantly from the results, performance, or achievements expressed or implied by such forward-looking statements. Such risks and uncertainties include, but are not limited to, fluctuations in the Company’s operating results and financial condition, the volatility of the market price of the Company’s common stock, the Company’s ability to successfully develop and commercialize pharmaceutical products in a timely manner, the impact of competition, the effect of any manufacturing or quality control problems, the Company’s ability to manage its growth, risks related to acquisitions of or investments in technologies, products or businesses, the risks related to the sale or closure of the Company’s Taiwan manufacturing facility, effects from fluctuations in currency exchange rates between the U.S. dollar and the Taiwan dollar, risks relating to goodwill and intangibles, the reduction or loss of business with any significant customer, the substantial portion of the Company’s total revenues derived from sales of a limited number of products, the impact of consolidation of the Company’s customer base, the Company’s ability to sustain profitability and positive cash flows, the impact of any valuation allowance on the Company’s deferred tax assets, the restrictions imposed by the Company’s credit facility and indenture, the Company’s level of indebtedness and liabilities and the potential impact on cash flow available for operations, the availability of additional funds in the future, any delays or unanticipated expenses in connection with the operation of the Company’s manufacturing facilities, the effect of foreign economic, political, legal and other risks on the Company’s operations abroad, the uncertainty of patent litigation and other legal proceedings, the increased government scrutiny on the Company’s agreements to settle patent litigations, product development risks and the difficulty of predicting FDA filings and approvals, consumer acceptance and demand for new pharmaceutical products, the impact of market perceptions of the Company and the safety and quality of the Company’s products, the Company’s determinations to discontinue the manufacture and distribution of certain products, the Company’s ability to achieve returns on its investments in research and development activities, changes to FDA approval requirements, the Company’s ability to successfully conduct clinical trials, the Company’s reliance on third parties to conduct clinical trials and testing, the Company’s lack of a license partner for commercialization of Numient® (IPX066) outside of the United States, impact of illegal distribution and sale by third parties of counterfeits or stolen products, the availability of raw materials and impact of interruptions in the Company’s supply chain, the Company’s policies regarding returns, rebates, allowances and chargebacks, the use of controlled substances in the Company’s products, the effect of current economic conditions on the Company’s industry, business, results of operations and financial condition, disruptions or failures in the Company’s information technology systems and network infrastructure caused by third party breaches or other events, the Company’s reliance on alliance and collaboration agreements, the Company’s reliance on licenses to proprietary technologies, the Company’s dependence on certain employees, the Company’s ability to comply with legal and regulatory requirements governing the healthcare industry, the regulatory environment, the effect of certain provisions in the Company’s government contracts, the Company’s ability to protect its intellectual property, exposure to product liability claims, changes in tax regulations, uncertainties involved in the preparation of the Company’s financial statements, the Company’s ability to maintain an effective system of internal control over financial reporting, the effect of terrorist attacks on the Company’s business, the location of the Company’s manufacturing and research and development facilities near earthquake fault lines, expansion of social media platforms and other risks described in the Company’s periodic reports filed with the Securities and Exchange Commission. Forward-looking statements speak only as to the date on which they are made, and the Company undertakes no obligation to update publicly or revise any forward-looking statement, regardless of whether new information becomes available, future developments occur or otherwise. Trademarks referenced herein are the property of their respective owners. ©2017 Impax Laboratories, Inc. All Rights Reserved.
3
Paul Bisaro President & CEO
4
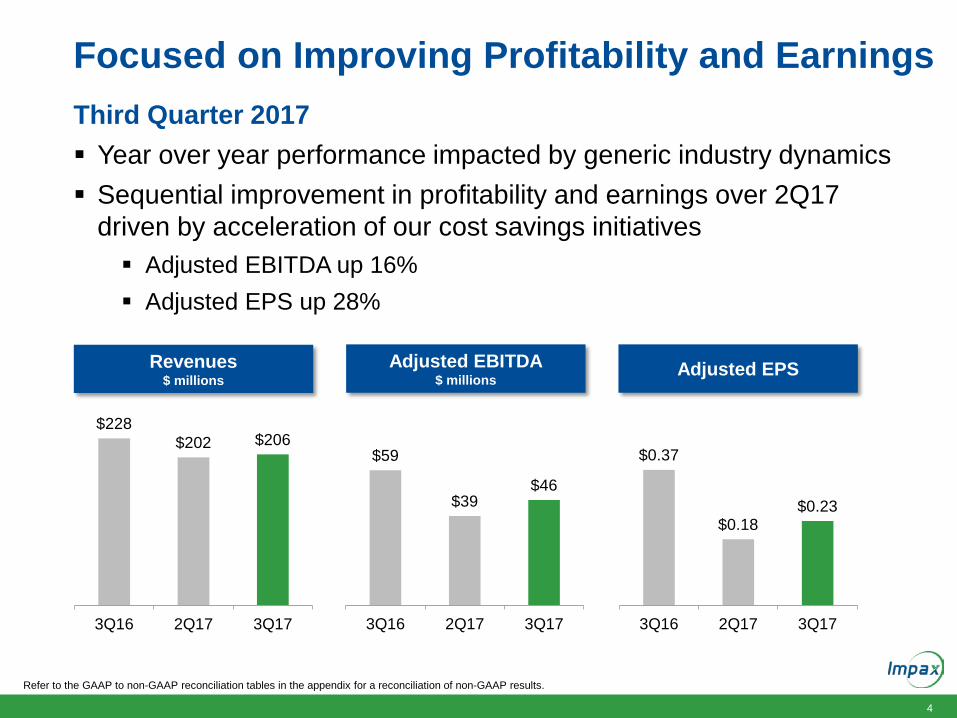
Focused on Improving Profitability and Earnings
$228 $202 $206
3Q16 2Q17 3Q17
$59
$39 $46
3Q16 2Q17 3Q17
$0.37
$0.18 $0.23
3Q16 2Q17 3Q17
Revenues $ millions
Adjusted EBITDA $ millions
Adjusted EPS
Refer to the GAAP to non-GAAP reconciliation tables in the appendix for a reconciliation of non-GAAP results.
Third Quarter 2017 Year over year performance impacted by generic industry dynamics Sequential improvement in profitability and earnings over 2Q17
driven by acceleration of our cost savings initiatives Adjusted EBITDA up 16% Adjusted EPS up 28%
5
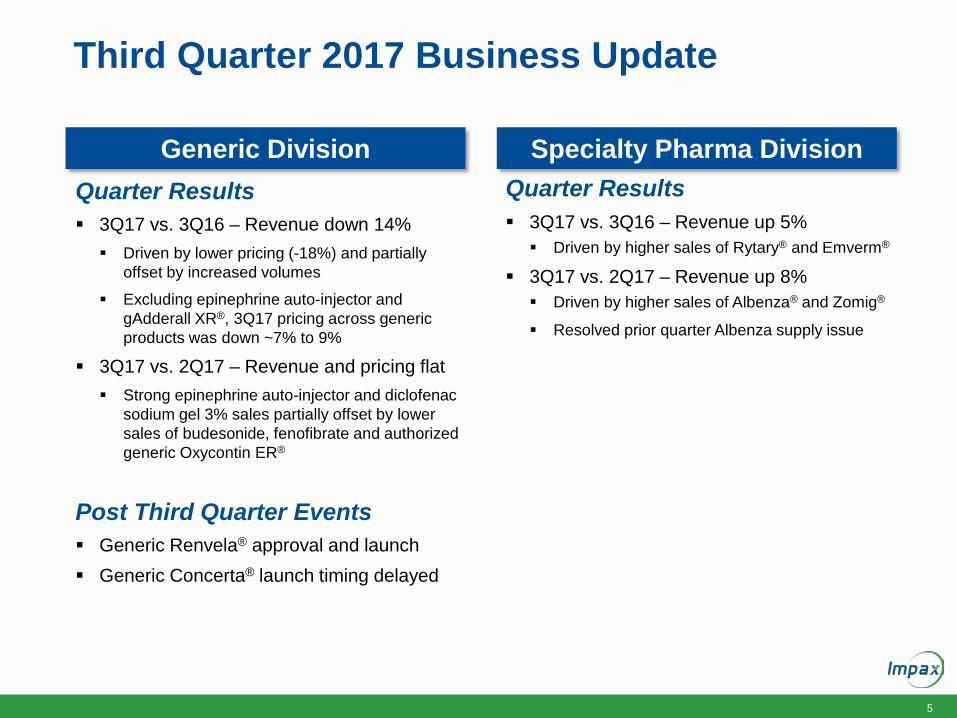
Third Quarter 2017 Business Update
Quarter Results 3Q17 vs. 3Q16 – Revenue down 14% Driven by lower pricing (-18%) and partially
offset by increased volumes
Excluding epinephrine auto-injector and gAdderall XR®, 3Q17 pricing across generic products was down ~7% to 9%
3Q17 vs. 2Q17 – Revenue and pricing flat Strong epinephrine auto-injector and diclofenac
sodium gel 3% sales partially offset by lower sales of budesonide, fenofibrate and authorized generic Oxycontin ER®
Post Third Quarter Events Generic Renvela® approval and launch Generic Concerta® launch timing delayed
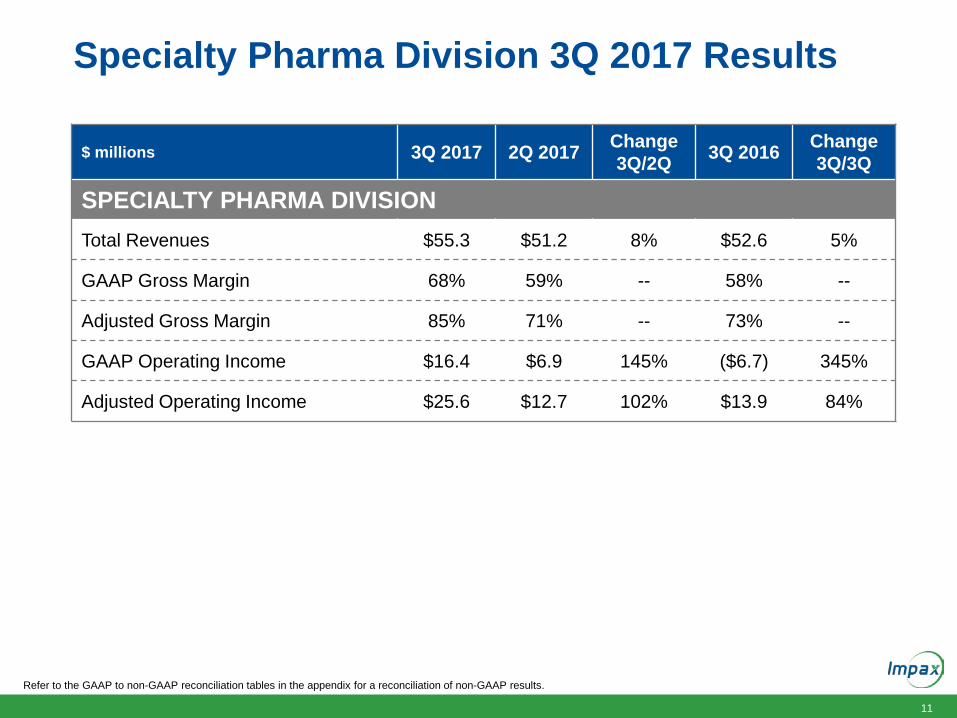
Quarter Results 3Q17 vs. 3Q16 – Revenue up 5% Driven by higher sales of Rytary® and Emverm®
3Q17 vs. 2Q17 – Revenue up 8% Driven by higher sales of Albenza® and Zomig®
Resolved prior quarter Albenza supply issue
Generic Division Specialty Pharma Division
6
0
10
20
30
40
50
60
70
80
0.5 h 1 h 1.5 h 2 hProp
ortio
n of
Sub
ject
s Ac
hiev
ing
Def
ined
R
educ
tion
in O
ff Ti
me
Reduction in Off Time from Baseline
IPX203IR CD-LD
0
10
20
30
40
50
60
7-point 13-point
Prop
ortio
n of
Sub
ject
s Ac
hiev
ing
Spec
ified
Impr
ovem
ent o
n M
DS
-U
PDR
S Pa
rt III
Pre
dose
on
Day
15
IPX203
IR CD-LD
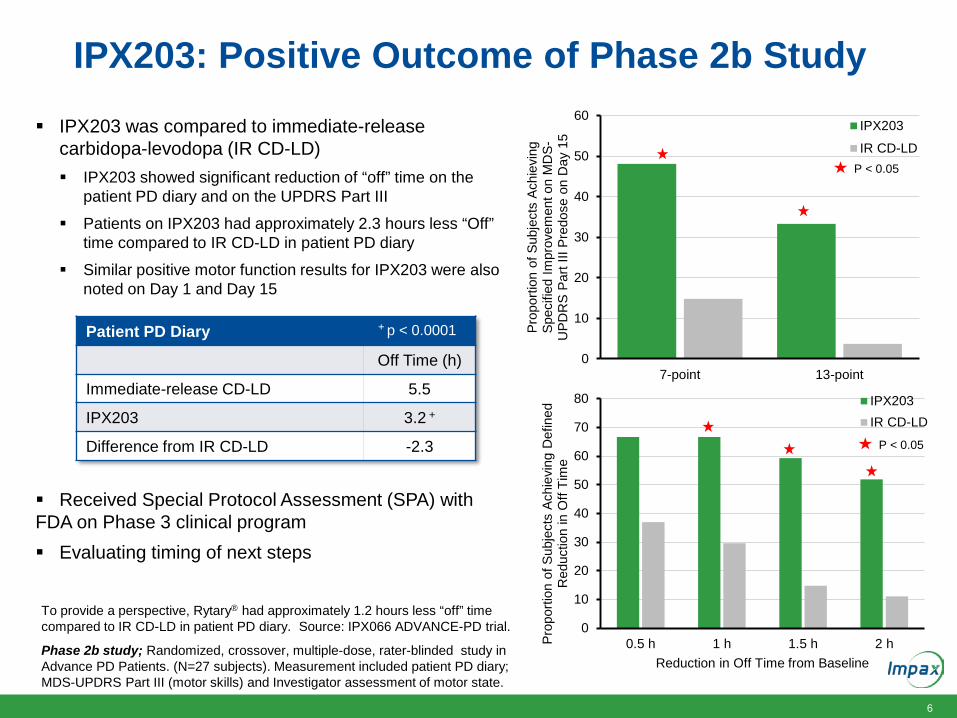
IPX203: Positive Outcome of Phase 2b Study IPX203 was compared to immediate-release
carbidopa-levodopa (IR CD-LD) IPX203 showed significant reduction of “off” time on the
patient PD diary and on the UPDRS Part III
Patients on IPX203 had approximately 2.3 hours less “Off” time compared to IR CD-LD in patient PD diary
Similar positive motor function results for IPX203 were also noted on Day 1 and Day 15
Received Special Protocol Assessment (SPA) with FDA on Phase 3 clinical program Evaluating timing of next steps
Patient PD Diary
Off Time (h)
Immediate-release CD-LD 5.5
IPX203 3.2 +
Difference from IR CD-LD -2.3
+ p < 0.0001
P < 0.05
P < 0.05
To provide a perspective, Rytary® had approximately 1.2 hours less “off” time compared to IR CD-LD in patient PD diary. Source: IPX066 ADVANCE-PD trial.
Phase 2b study; Randomized, crossover, multiple-dose, rater-blinded study in Advance PD Patients. (N=27 subjects). Measurement included patient PD diary; MDS-UPDRS Part III (motor skills) and Investigator assessment of motor state.
7
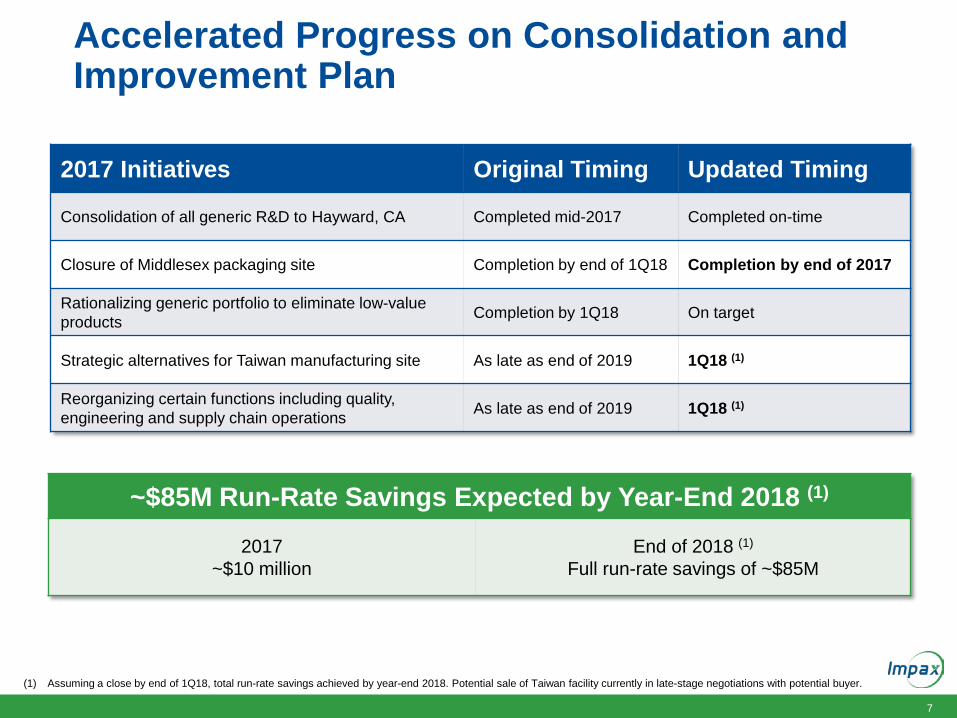
2017 Initiatives Original Timing Updated Timing
Consolidation of all generic R&D to Hayward, CA Completed mid-2017 Completed on-time
Closure of Middlesex packaging site Completion by end of 1Q18 Completion by end of 2017
Rationalizing generic portfolio to eliminate low-value products Completion by 1Q18 On target
Strategic alternatives for Taiwan manufacturing site As late as end of 2019 1Q18 (1)
Reorganizing certain functions including quality, engineering and supply chain operations As late as end of 2019 1Q18 (1)
Accelerated Progress on Consolidation and Improvement Plan
~$85M Run-Rate Savings Expected by Year-End 2018 (1)
2017 ~$10 million
End of 2018 (1)
Full run-rate savings of ~$85M
(1) Assuming a close by end of 1Q18, total run-rate savings achieved by year-end 2018. Potential sale of Taiwan facility currently in late-stage negotiations with potential buyer.
8
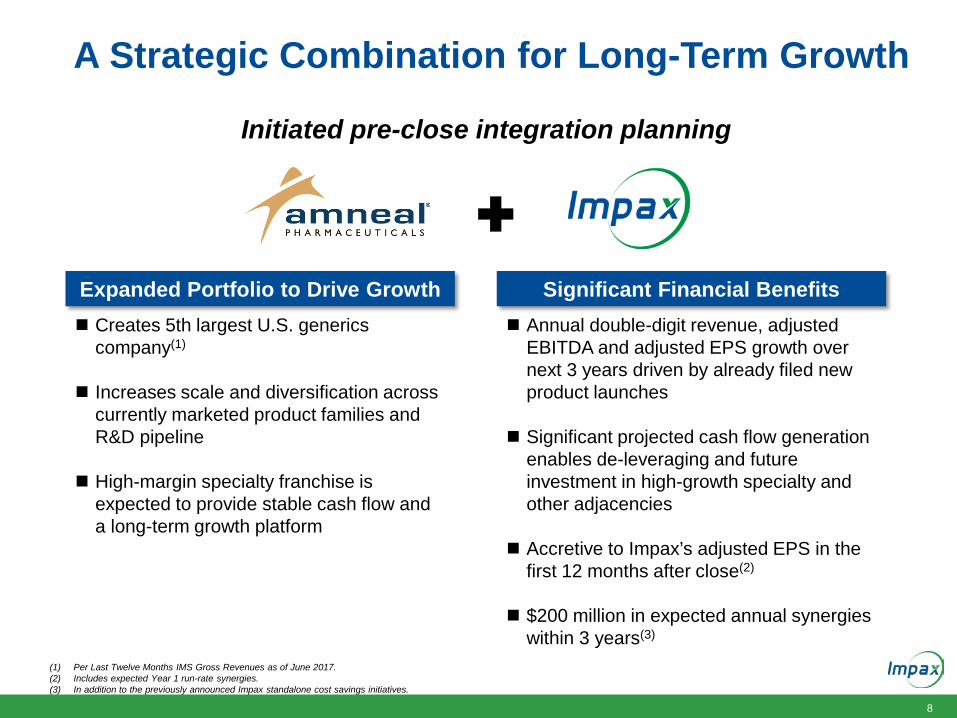
A Strategic Combination for Long-Term Growth
(1) Per Last Twelve Months IMS Gross Revenues as of June 2017. (2) Includes expected Year 1 run-rate synergies. (3) In addition to the previously announced Impax standalone cost savings initiatives.
Expanded Portfolio to Drive Growth Creates 5th largest U.S. generics
company(1) Increases scale and diversification across
currently marketed product families and R&D pipeline
High-margin specialty franchise is
expected to provide stable cash flow and a long-term growth platform
Significant Financial Benefits Annual double-digit revenue, adjusted
EBITDA and adjusted EPS growth over next 3 years driven by already filed new product launches
Significant projected cash flow generation
enables de-leveraging and future investment in high-growth specialty and other adjacencies
Accretive to Impax’s adjusted EPS in the first 12 months after close(2)
$200 million in expected annual synergies
within 3 years(3)
Initiated pre-close integration planning
9
Bryan Reasons Chief Financial Officer

10
Generic Division 3Q 2017 Results
Refer to the GAAP to non-GAAP reconciliation tables in the appendix for a reconciliation of non-GAAP results.
$ millions 3Q 2017 2Q 2017 Change 3Q/2Q 3Q 2016 Change
3Q/3Q
GENERIC DIVISION Total Revenues $151.1 $150.9 0% $175.3 (14%)
GAAP Gross Margin (2%) 28% -- (112%) --
Adjusted Gross Margin 35% 43% -- 44% --
GAAP (Loss) Operating Income ($21.5) $12.6 (271%) ($233.3) 91%
Adjusted Operating Income $34.8 $39.5 (12%) $56.0 (38%)
11
Specialty Pharma Division 3Q 2017 Results
Refer to the GAAP to non-GAAP reconciliation tables in the appendix for a reconciliation of non-GAAP results.
$ millions 3Q 2017 2Q 2017 Change 3Q/2Q 3Q 2016 Change
3Q/3Q
SPECIALTY PHARMA DIVISION Total Revenues $55.3 $51.2 8% $52.6 5%
GAAP Gross Margin 68% 59% -- 58% --
Adjusted Gross Margin 85% 71% -- 73% --
GAAP Operating Income $16.4 $6.9 145% ($6.7) 345%
Adjusted Operating Income $25.6 $12.7 102% $13.9 84%
12
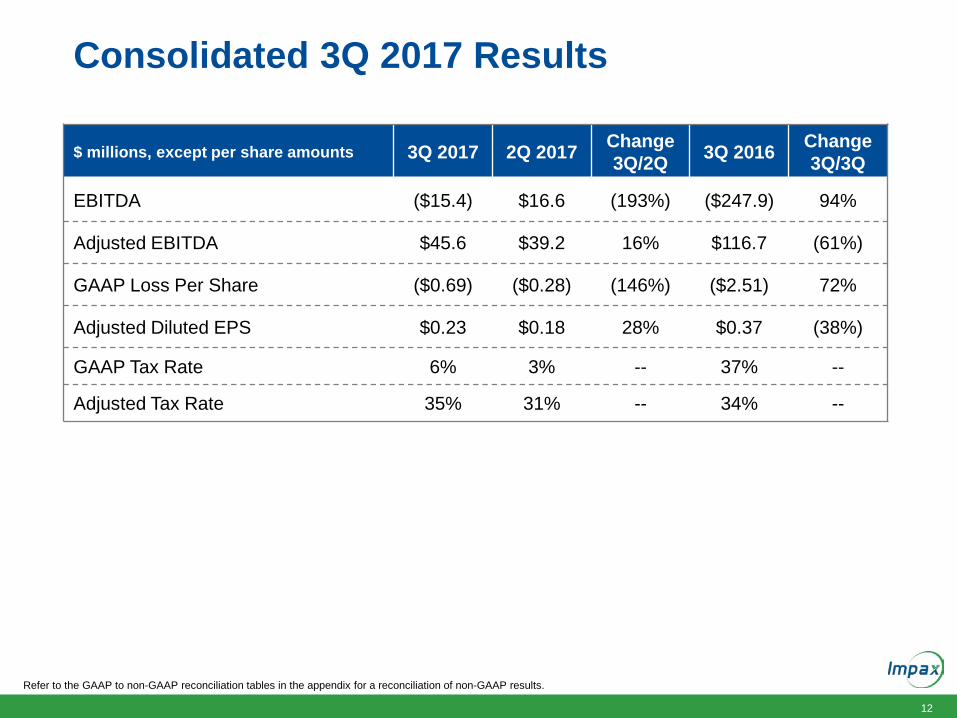
Consolidated 3Q 2017 Results
Refer to the GAAP to non-GAAP reconciliation tables in the appendix for a reconciliation of non-GAAP results.
$ millions, except per share amounts 3Q 2017 2Q 2017 Change 3Q/2Q 3Q 2016 Change
3Q/3Q
EBITDA ($15.4) $16.6 (193%) ($247.9) 94%
Adjusted EBITDA $45.6 $39.2 16% $116.7 (61%)
GAAP Loss Per Share ($0.69) ($0.28) (146%) ($2.51) 72%
Adjusted Diluted EPS $0.23 $0.18 28% $0.37 (38%)
GAAP Tax Rate 6% 3% -- 37% --
Adjusted Tax Rate 35% 31% -- 34% --

13
Paul Bisaro President & CEO

14
Updated 4Q17 Guidance Assumptions
Factors Adversely Impacting 4Q • Delay in launch of generic Concerta® and generic Welchol®
• Late approval of generic Renvela® and launch into a more competitive market
• Inability of partner to supply generic Aggrenox® impacting royalty income
• In addition, lower sequential revenues of epinephrine auto-injector due to seasonality
Factors Positively Impacting 4Q • Acceleration of cost improvement program (CIP) • Reduction in R&D spending due to generic site consolidation
Expect 2018 to benefit from delayed and new generic launch revenue and accelerated contribution from CIP

15
Updated 2017 Financial Guidance
* Excludes new cost savings initiatives as outlined on slide 7. The Company’s full year 2017 estimates are based on management’s current expectations, including with respect to prescription trends, pricing levels, inventory levels, and the anticipated timing of future product launches and events. These statements are forward-looking, and actual results could differ materially depending on market conditions and the factors set forth under our “Safe Harbor” statement above.
Previous Guidance August 9*
Updated Guidance November 9
Adjusted Gross Margin as a % of Revenues ~ 47% to 49% ~ 47%
Adjusted R&D & Patent Litigation Expense ~ $93M to $97M ~ $84M to $88M
Adjusted Selling, General & Administrative Expense ~ $190M to $195M No Change
Adjusted Interest Expense ~ $28M No Change
Adjusted EPS ~ $0.55 to $0.70 ~ $0.60 to $0.65
Tax Rate ~ 33% to 34% ~33%
Capital Expenditures ~ $25M to $30M No Change
16
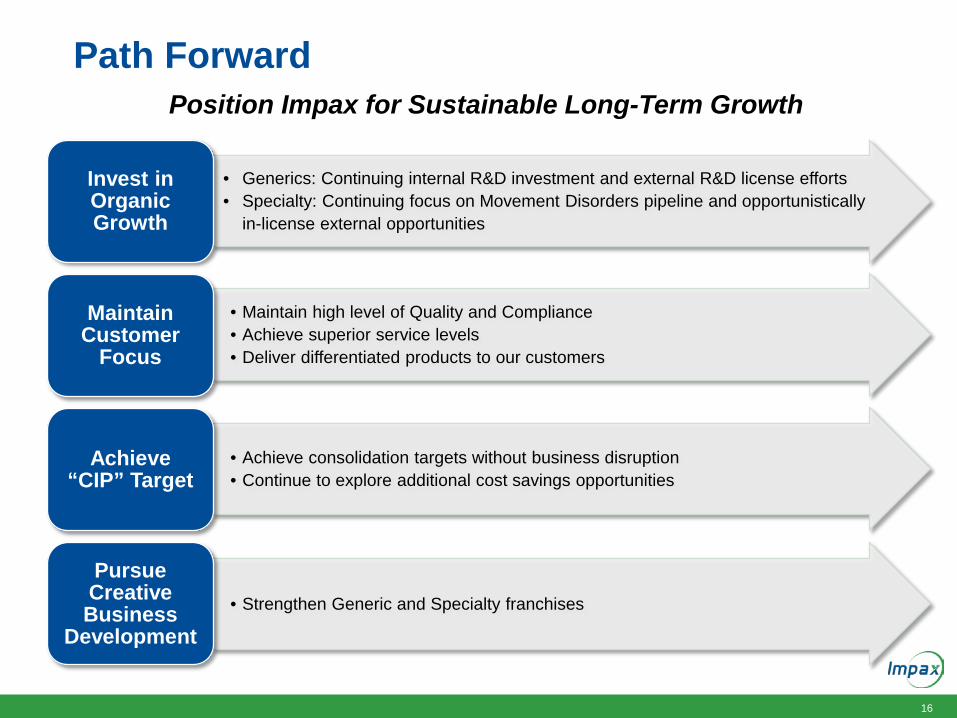
Path Forward
• Generics: Continuing internal R&D investment and external R&D license efforts • Specialty: Continuing focus on Movement Disorders pipeline and opportunistically
in-license external opportunities
Invest in Organic Growth
• Maintain high level of Quality and Compliance • Achieve superior service levels • Deliver differentiated products to our customers
Maintain Customer
Focus
• Achieve consolidation targets without business disruption • Continue to explore additional cost savings opportunities
Achieve “CIP” Target
• Strengthen Generic and Specialty franchises
Pursue Creative Business
Development
Position Impax for Sustainable Long-Term Growth
17 17
Third Quarter 2017 Results and Business Update
Q&A Session November 9, 2017
18
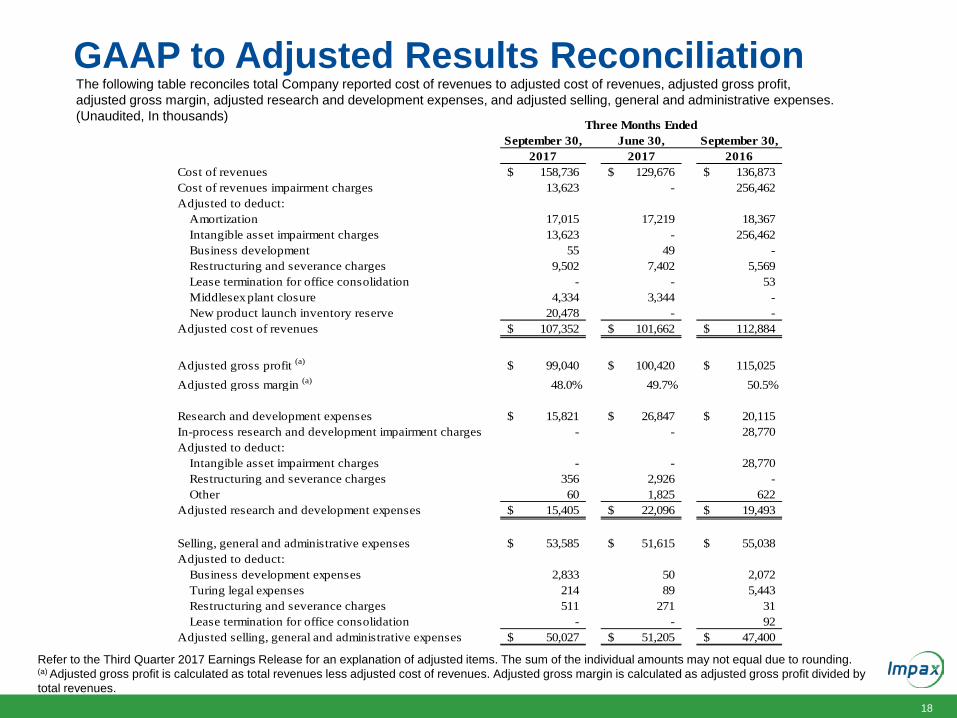
GAAP to Adjusted Results Reconciliation The following table reconciles total Company reported cost of revenues to adjusted cost of revenues, adjusted gross profit, adjusted gross margin, adjusted research and development expenses, and adjusted selling, general and administrative expenses. (Unaudited, In thousands)
Refer to the Third Quarter 2017 Earnings Release for an explanation of adjusted items. The sum of the individual amounts may not equal due to rounding. (a) Adjusted gross profit is calculated as total revenues less adjusted cost of revenues. Adjusted gross margin is calculated as adjusted gross profit divided by total revenues.
September 30, June 30, September 30,2017 2017 2016
Cost of revenues 158,736$ 129,676$ 136,873$ Cost of revenues impairment charges 13,623 - 256,462 Adjusted to deduct:
Amortization 17,015 17,219 18,367 Intangible asset impairment charges 13,623 - 256,462 Business development 55 49 - Restructuring and severance charges 9,502 7,402 5,569 Lease termination for office consolidation - - 53 Middlesex plant closure 4,334 3,344 - New product launch inventory reserve 20,478 - -
Adjusted cost of revenues 107,352$ 101,662$ 112,884$
Adjusted gross profit (a) 99,040$ 100,420$ 115,025$ Adjusted gross margin (a) 48.0% 49.7% 50.5%
Research and development expenses 15,821$ 26,847$ 20,115$ In-process research and development impairment charges - - 28,770 Adjusted to deduct:
Intangible asset impairment charges - - 28,770 Restructuring and severance charges 356 2,926 - Other 60 1,825 622
Adjusted research and development expenses 15,405$ 22,096$ 19,493$
Selling, general and administrative expenses 53,585$ 51,615$ 55,038$ Adjusted to deduct:
Business development expenses 2,833 50 2,072 Turing legal expenses 214 89 5,443 Restructuring and severance charges 511 271 31 Lease termination for office consolidation - - 92
Adjusted selling, general and administrative expenses 50,027$ 51,205$ 47,400$
Three Months Ended
19
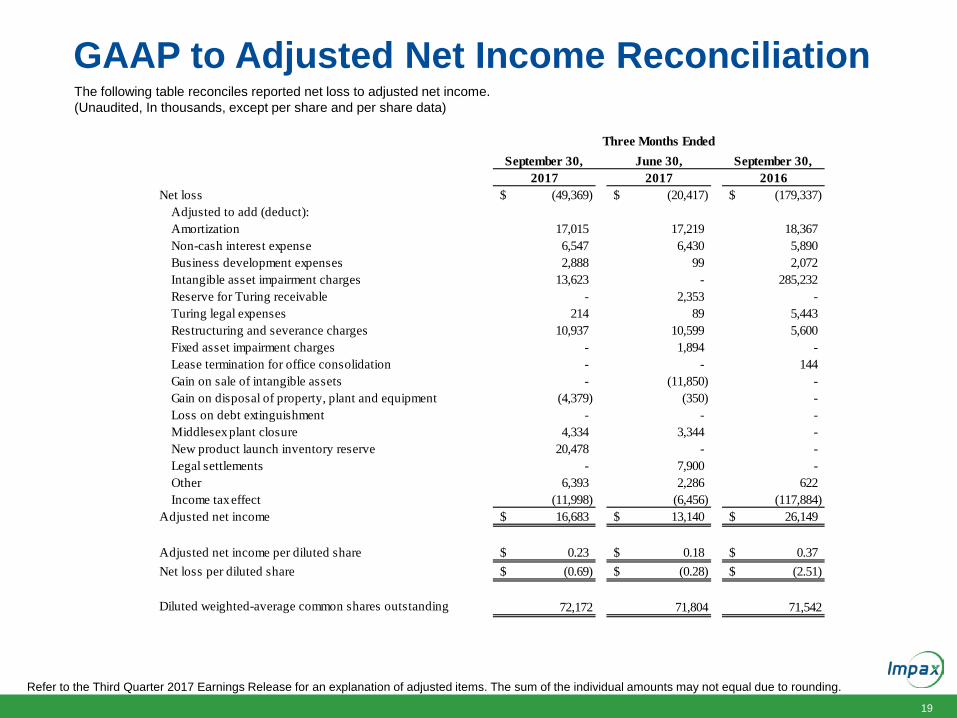
GAAP to Adjusted Net Income Reconciliation The following table reconciles reported net loss to adjusted net income. (Unaudited, In thousands, except per share and per share data)
Refer to the Third Quarter 2017 Earnings Release for an explanation of adjusted items. The sum of the individual amounts may not equal due to rounding.
September 30, June 30, September 30,2017 2017 2016
Net loss (49,369)$ (20,417)$ (179,337)$ Adjusted to add (deduct):Amortization 17,015 17,219 18,367 Non-cash interest expense 6,547 6,430 5,890 Business development expenses 2,888 99 2,072 Intangible asset impairment charges 13,623 - 285,232
Reserve for Turing receivable - 2,353 - Turing legal expenses 214 89 5,443 Restructuring and severance charges 10,937 10,599 5,600 Fixed asset impairment charges - 1,894 - Lease termination for office consolidation - - 144 Gain on sale of intangible assets - (11,850) - Gain on disposal of property, plant and equipment (4,379) (350) - Loss on debt extinguishment - - - Middlesex plant closure 4,334 3,344 - New product launch inventory reserve 20,478 - - Legal settlements - 7,900 - Other 6,393 2,286 622 Income tax effect (11,998) (6,456) (117,884)
Adjusted net income 16,683$ 13,140$ 26,149$
Adjusted net income per diluted share 0.23$ 0.18$ 0.37$ Net loss per diluted share (0.69)$ (0.28)$ (2.51)$
Diluted weighted-average common shares outstanding 72,172 71,804 71,542
Three Months Ended
20
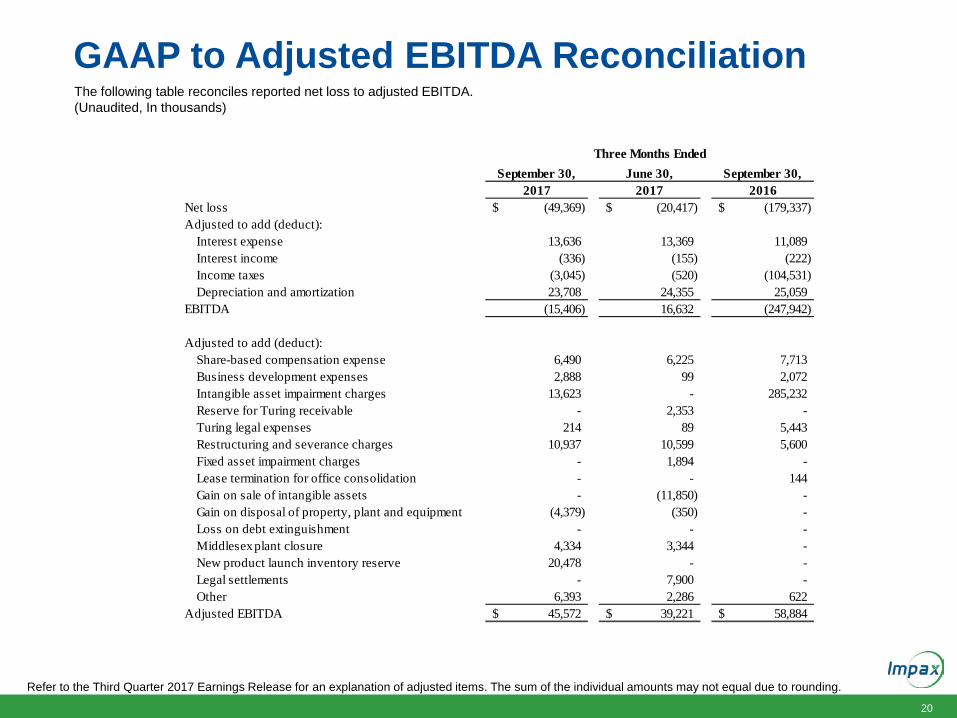
GAAP to Adjusted EBITDA Reconciliation
Refer to the Third Quarter 2017 Earnings Release for an explanation of adjusted items. The sum of the individual amounts may not equal due to rounding.
The following table reconciles reported net loss to adjusted EBITDA. (Unaudited, In thousands)
September 30, June 30, September 30,2017 2017 2016
Net loss (49,369)$ (20,417)$ (179,337)$ Adjusted to add (deduct):
Interest expense 13,636 13,369 11,089 Interest income (336) (155) (222) Income taxes (3,045) (520) (104,531) Depreciation and amortization 23,708 24,355 25,059
EBITDA (15,406) 16,632 (247,942)
Adjusted to add (deduct):Share-based compensation expense 6,490 6,225 7,713 Business development expenses 2,888 99 2,072 Intangible asset impairment charges 13,623 - 285,232
Reserve for Turing receivable - 2,353 - Turing legal expenses 214 89 5,443 Restructuring and severance charges 10,937 10,599 5,600 Fixed asset impairment charges - 1,894 - Lease termination for office consolidation - - 144 Gain on sale of intangible assets - (11,850) - Gain on disposal of property, plant and equipment (4,379) (350) - Loss on debt extinguishment - - - Middlesex plant closure 4,334 3,344 - New product launch inventory reserve 20,478 - - Legal settlements - 7,900 - Other 6,393 2,286 622
Adjusted EBITDA 45,572$ 39,221$ 58,884$
Three Months Ended
21
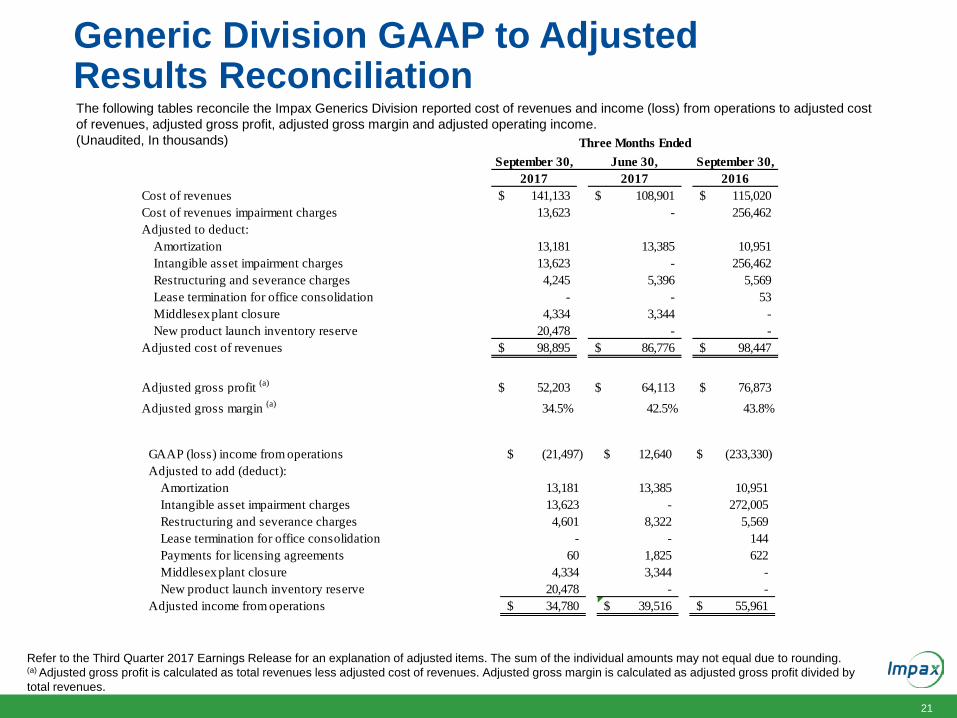
Generic Division GAAP to Adjusted Results Reconciliation The following tables reconcile the Impax Generics Division reported cost of revenues and income (loss) from operations to adjusted cost of revenues, adjusted gross profit, adjusted gross margin and adjusted operating income. (Unaudited, In thousands)
Refer to the Third Quarter 2017 Earnings Release for an explanation of adjusted items. The sum of the individual amounts may not equal due to rounding. (a) Adjusted gross profit is calculated as total revenues less adjusted cost of revenues. Adjusted gross margin is calculated as adjusted gross profit divided by total revenues.
September 30, June 30, September 30,2017 2017 2016
Cost of revenues 141,133$ 108,901$ 115,020$ Cost of revenues impairment charges 13,623 - 256,462 Adjusted to deduct:
Amortization 13,181 13,385 10,951 Intangible asset impairment charges 13,623 - 256,462 Restructuring and severance charges 4,245 5,396 5,569 Lease termination for office consolidation - - 53 Middlesex plant closure 4,334 3,344 - New product launch inventory reserve 20,478 - -
Adjusted cost of revenues 98,895$ 86,776$ 98,447$
Adjusted gross profit (a) 52,203$ 64,113$ 76,873$ Adjusted gross margin (a) 34.5% 42.5% 43.8%
Three Months Ended
GAAP (loss) income from operations (21,497)$ 12,640$ (233,330)$ Adjusted to add (deduct):
Amortization 13,181 13,385 10,951 Intangible asset impairment charges 13,623 - 272,005 Restructuring and severance charges 4,601 8,322 5,569 Lease termination for office consolidation - - 144 Payments for licensing agreements 60 1,825 622 Middlesex plant closure 4,334 3,344 - New product launch inventory reserve 20,478 - -
Adjusted income from operations 34,780$ 39,516$ 55,961$
22
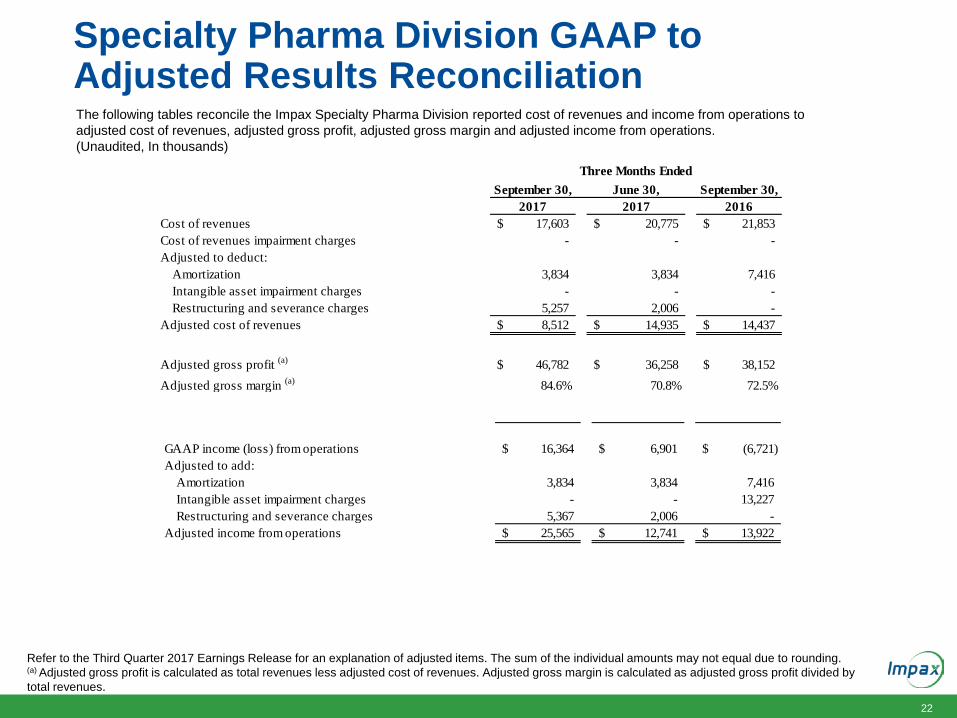
Specialty Pharma Division GAAP to Adjusted Results Reconciliation The following tables reconcile the Impax Specialty Pharma Division reported cost of revenues and income from operations to adjusted cost of revenues, adjusted gross profit, adjusted gross margin and adjusted income from operations. (Unaudited, In thousands)
Refer to the Third Quarter 2017 Earnings Release for an explanation of adjusted items. The sum of the individual amounts may not equal due to rounding. (a) Adjusted gross profit is calculated as total revenues less adjusted cost of revenues. Adjusted gross margin is calculated as adjusted gross profit divided by total revenues.
September 30, June 30, September 30,2017 2017 2016
Cost of revenues 17,603$ 20,775$ 21,853$ Cost of revenues impairment charges - - - Adjusted to deduct:
Amortization 3,834 3,834 7,416 Intangible asset impairment charges - - - Restructuring and severance charges 5,257 2,006 -
Adjusted cost of revenues 8,512$ 14,935$ 14,437$
Adjusted gross profit (a) 46,782$ 36,258$ 38,152$ Adjusted gross margin (a) 84.6% 70.8% 72.5%
Three Months Ended
GAAP income (loss) from operations 16,364$ 6,901$ (6,721)$ Adjusted to add:
Amortization 3,834 3,834 7,416 Intangible asset impairment charges - - 13,227 Restructuring and severance charges 5,367 2,006 -
Adjusted income from operations 25,565$ 12,741$ 13,922$