2020 Earnings Fourth Quarter
40
February 24, 2021 2020 Earnings – Fourth Quarter
Transcript of 2020 Earnings Fourth Quarter

February 24, 2021
2020 Earnings – Fourth Quarter

Safe Harbor Provision
2
This presentation contains forward-looking statements within the meaning of Section 27A of the Securities Act of 1933 and Section 21E of the Securities Exchange Act of
1934 (Exchange Act), including, without limitation, statements concerning our expectations relating to the integration of Bayer Animal Health, expected synergies and
cost savings, product launches and revenue from such products, reduction of debt and leverage, independent company stand-up costs and timing, including transition to
standalone ERP system, cost savings and expenses relating to restructuring actions, the impact of the COVID-19 pandemic on our business, our 2021 full year and first
quarter guidance and long-term expectations, our industry and our operations, performance and financial condition, and including in particular, statements relating to our
business, growth strategies, distribution strategies, product development efforts and future expenses. Forward-looking statements are based on our current expectations
and assumptions regarding our business, the economy and other future conditions. Because forward-looking statements relate to the future, by their nature, they are
subject to inherent uncertainties, risks and changes in circumstances that are difficult to predict.
As a result, our actual results may differ materially from those contemplated by the forward-looking statements. Important factors that could cause actual results to differ
materially from those in the forward-looking statements include regional, national, or global political, economic, business, competitive, market, and regulatory conditions,
including but not limited to the following: heightened competition, including from generics; the impact of disruptive innovations and advances in veterinary medical
practices, animal health technologies and alternatives to animal-derived protein; changes in regulatory restrictions on the use of antibiotics in farm animals; our ability to
implement our business strategies or achieve targeted cost efficiencies and gross margin improvements; consolidation of our customers and distributors; an outbreak of
infectious disease carried by farm animals; the impact on our operations, the supply chain, customer demand, and our liquidity as a result of the COVID-19 global health
pandemic; the success of our research and development (R&D) and licensing efforts; misuse, off-label or counterfeiting use of our products; unanticipated safety, quality
or efficacy concerns associated with our products; the impact of weather conditions and the availability of natural resources; use of alternative distribution channels and
the impact of increased or decreased sales to our channel distributors resulting fluctuation in our revenues; manufacturing problems and capacity imbalances;
challenges to our intellectual property rights or our alleged violation of rights of others; risks related to our presence in foreign markets; breaches of our information
technology systems; our ability to successfully integrate the businesses we acquire, including the animal health business of Bayer AG (Bayer Animal Health); effect of
our substantial indebtedness on our business; and the effect on our business resulting from our separation from Eli Lilly and Company (Lilly).
For additional information about the factors that could cause actual results to differ materially from forward-looking statements, please see the company’s latest Form 10-
K and subsequent Form 10-Qs filed with the Securities and Exchange Commission.
The company undertakes no duty to update forward-looking statements

Entering 2021 with Momentum
Q4 2020 Revenue Above Expectations
Driven by strong fundamentals
in U.S. Pet Health, U.S. Farm
Animal, and China swine
Q4 2020 Adjusted EPS(1) at High-End of Guidance
Adjusted gross margin(1)
benefitting from positive mix,
partially offset by largely one-
time and discretionary
operating expense investments
Adjusted EBITDA(1) above the
high-end of guidance
Positioned for Sustainable Long-Term Value Creation
Raised 2021 revenue,
adjusted EBITDA(1), and adjusted
EPS(1) guidance reflecting
intact fundamentals and focus
on execution
Updated outlook in line with our
long-term growth algorithm
3(1) Non-GAAP financial measure. See Appendix to this presentation for more information, including GAAP to non-GAAP reconciliations
Fourth Quarter 2020
4
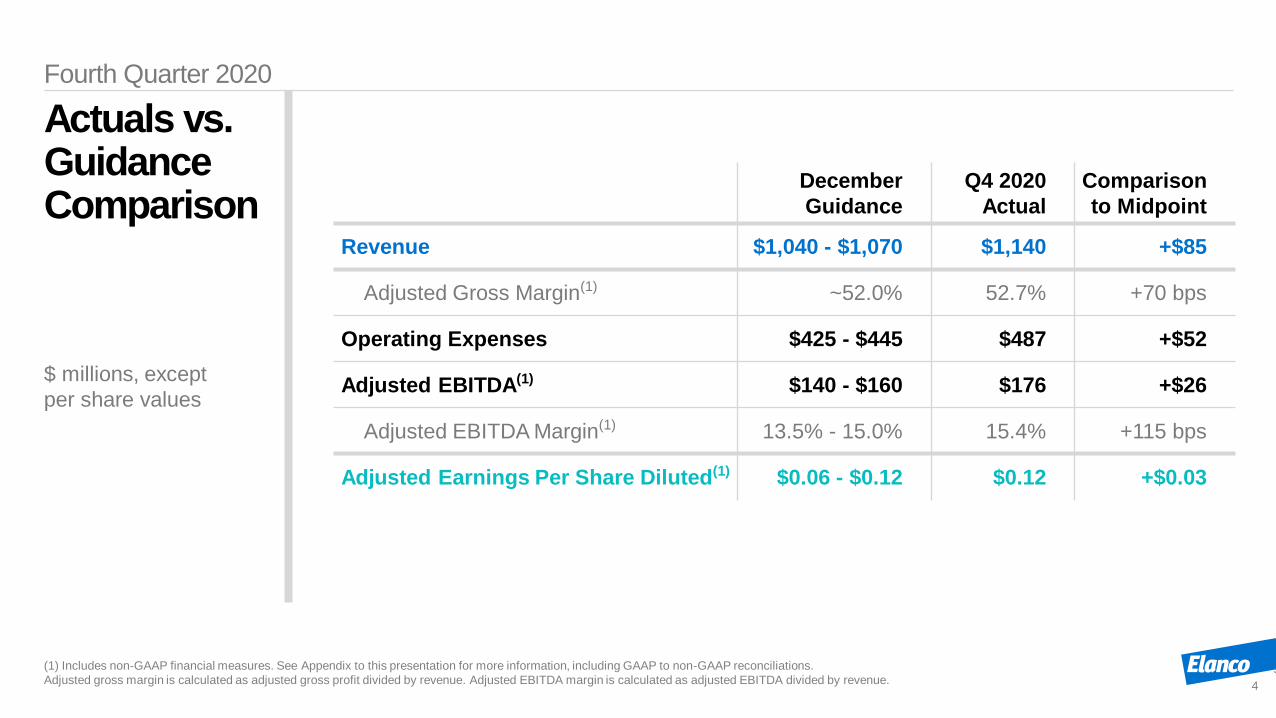
Actuals vs. Guidance Comparison
December
Guidance
Q4 2020
Actual
Comparison
to Midpoint
Revenue $1,040 - $1,070 $1,140 +$85
Adjusted Gross Margin(1) ~52.0% 52.7% +70 bps
Operating Expenses $425 - $445 $487 +$52
Adjusted EBITDA(1) $140 - $160 $176 +$26
Adjusted EBITDA Margin(1) 13.5% - 15.0% 15.4% +115 bps
Adjusted Earnings Per Share Diluted(1) $0.06 - $0.12 $0.12 +$0.03
$ millions, except
per share values
(1) Includes non-GAAP financial measures. See Appendix to this presentation for more information, including GAAP to non-GAAP reconciliations.
Adjusted gross margin is calculated as adjusted gross profit divided by revenue. Adjusted EBITDA margin is calculated as adjusted EBITDA divided by revenue.

Executing Our Strengthened and Expanded IPP Strategy
Dependable Revenue Growth from Innovation
Launched Credelio Plus (Japan),
Increxxa (EU); Q1 launches on track
Increxxa approved in the U.S.,
Credelio Plus received positive
opinion from EMA
On track for $80 to $100 million in
innovation contributions in 2021Unlocking Value
Manufacturing productivity improvements
driving GM outperformance in Q4
Independent ERP system build, completion
of Lilly TSAs on track for end of Q1’21
Rapid progress toward accelerated $300
million synergy target
Expanded Portfolio, Capabilities, Access
Credelio achieved blockbuster status
Expanded geographic presence for
recent innovations like Galliprant
Leveraging leadership in Pet Health
retail to grow our franchise
Cross-functional collaboration
supporting new launches
5
Customer Veterinarian
Farmer
Pet Owner

6
2021 New Product Launches
Product Species Description Geography Launch Quarter Update
Cattle Novel in Feed Technology with Environmental Claim Q1 2021U.S.: On track
CA: Approved
Cattle
SwineInjectable Tulathromycin Antibiotic in BRD(1)/SRD(2) Q1 2021
EU: Launched in Jan.
U.S.: Approved
PoultryNatural IL-10 Antibody with a Novel MoA(3);
Suitable for RWA(4) Q2 2021Heat-stable formulation
achieved. On track
PoultryAnticoccidial Portfolio Expansion;
Suitable for RWA
Q1 2021On track
Q2 2021
Dog Oral Monthly Flea/Tick/Heartworm Q1 2021
JP: Launched
EU: Positive opinion
AU: On track
Cat Oral Monthly Flea/Tick Q2/Q3 2021FDA technical section
complete. On track
Cat Oral Solution for Weight Loss Management in CKD(1) Q1 2021 On track
(1) Bovine Respiratory Disease, (2) Swine Respiratory Disease, (3) Mode of Action, (4) Raised Without Antibiotics, (5) Intent to Announce Two RWA
Products in Q1 2021, (6) Chronic Kidney Disease Note: Elanco analysis based on Vetnosis, AnimalPharm, and other public and proprietary data sources
(5)

Fourth Quarter 2020
7
FinancialPerformance Highlights
2020 2019
Reported Revenue $1,139.7 $787.0
Net Income (Loss) $(322.8) $(9.5)
Earnings Per Share $(0.66) $(0.03)
Adjusted(1) Net Income $56.7 $87.8
Earnings Per Share Diluted $0.12 $0.23
EBITDA $175.9 $146.3
EBITDA Margin 15.4% 18.6%
$ millions, except
per share values
(1) Non-GAAP financial measure. See Appendix to this presentation for more information, including GAAP to non-GAAP reconciliations
Fourth Quarter 2020
8
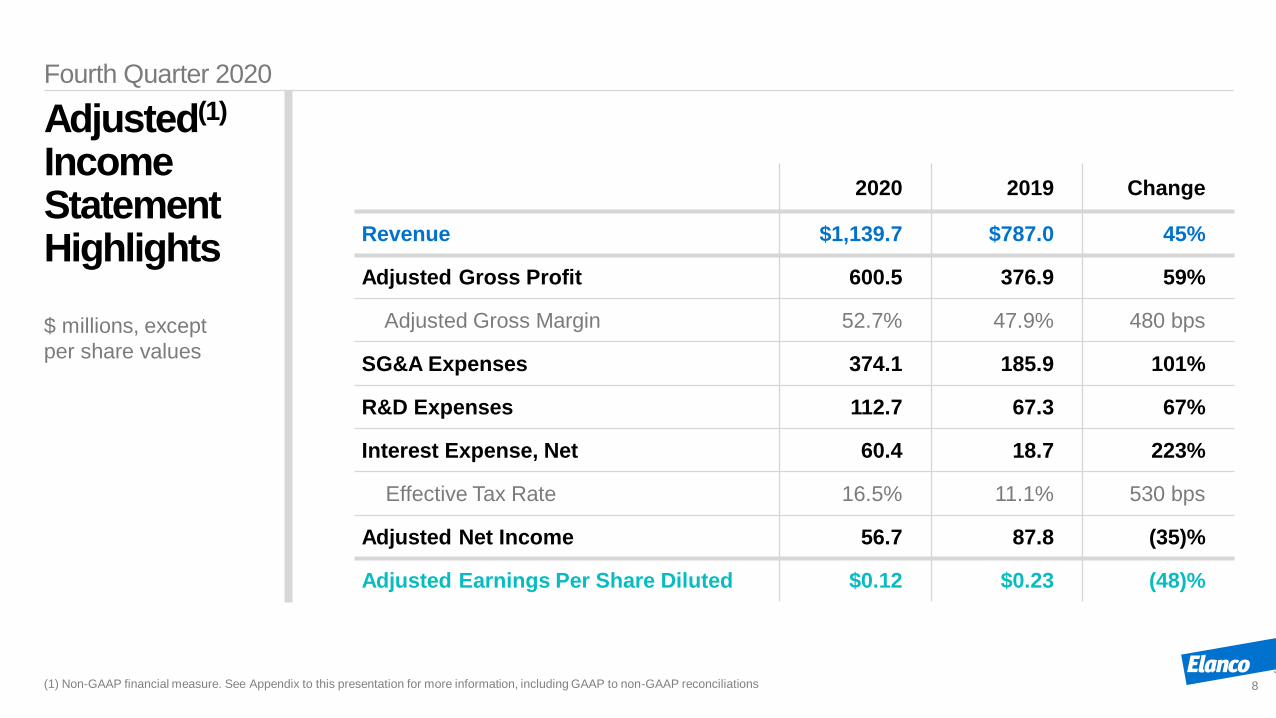
Adjusted(1)
Income StatementHighlights
2020 2019 Change
Revenue $1,139.7 $787.0 45%
Adjusted Gross Profit 600.5 376.9 59%
Adjusted Gross Margin 52.7% 47.9% 480 bps
SG&A Expenses 374.1 185.9 101%
R&D Expenses 112.7 67.3 67%
Interest Expense, Net 60.4 18.7 223%
Effective Tax Rate 16.5% 11.1% 530 bps
Adjusted Net Income 56.7 87.8 (35)%
Adjusted Earnings Per Share Diluted $0.12 $0.23 (48)%
$ millions, except
per share values
(1) Non-GAAP financial measure. See Appendix to this presentation for more information, including GAAP to non-GAAP reconciliations

Drivers of Q4 2020 Revenue vs. Guidance
Q4 2020Guidance
$1,040-$1,070
$1,140
U.S. Pet Health
U.S. Farm Animal
Q4 2020 Revenue
China Swine
FX Other
($ millions)
9
Drivers
U.S. Pet Health retail strength with market share gains
U.S. Farm Animal sequential improvement fromCOVID-19 headwinds
China swine benefit fromhigh prices and industrialherd rebuilding
Reversal of forecasted FX headwinds into tailwinds
Combined other tailwinds including temporary competitor stock outs
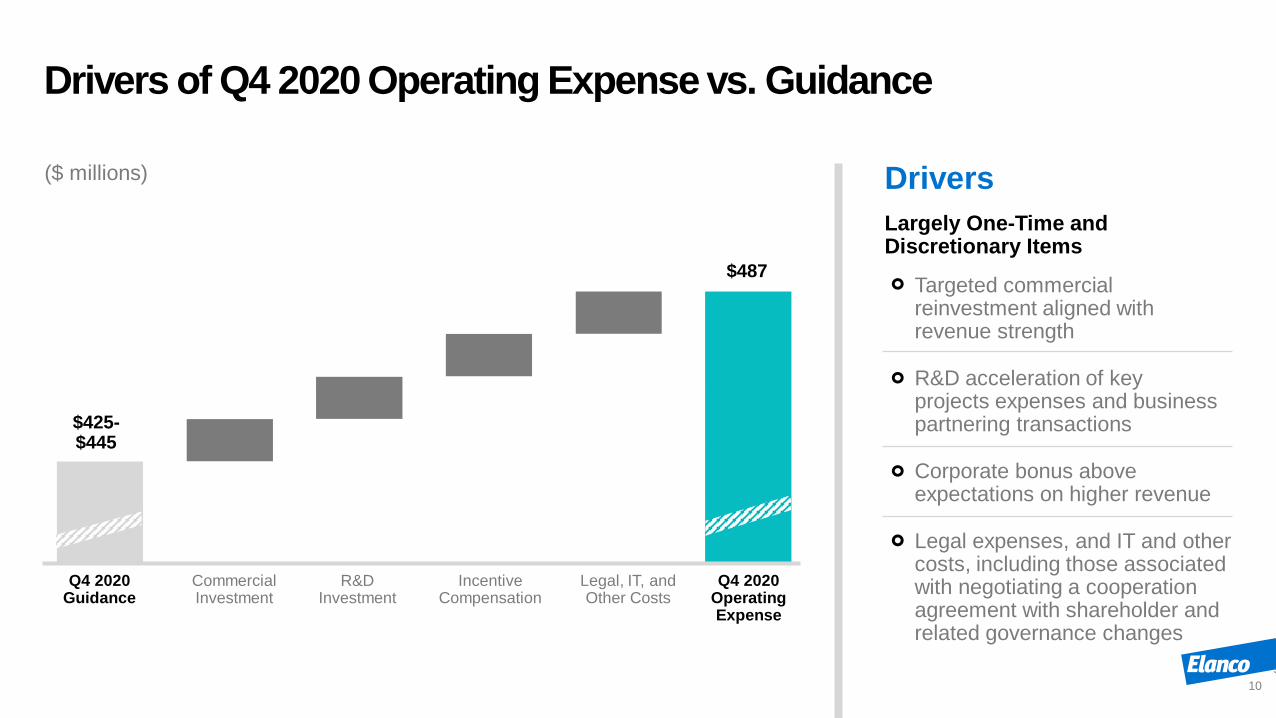
Drivers of Q4 2020 Operating Expense vs. Guidance
Q4 2020 Guidance
Commercial Investment
R&D Investment
Q4 2020 Operating Expense
Incentive Compensation
Legal, IT, and Other Costs
$425-$445
$487
($ millions)
10
Drivers
Largely One-Time and Discretionary Items
Targeted commercial reinvestment aligned with revenue strength
R&D acceleration of key projects expenses and business partnering transactions
Corporate bonus above expectations on higher revenue
Legal expenses, and IT and other costs, including those associated with negotiating a cooperation agreement with shareholder and related governance changes

Fourth Quarter 2020
11
Revenue Summary by Category
Note: Reported revenue in millions. Numbers may not add due to rounding. Percentages exclude the impact of foreign currency. CER = Constant Exchange Rate
For presentation of results including impact of foreign currency, see slide 12.
LegacyElanco
Elanco CERYOY Change
LegacyBayer
Total Total CERYOY Change
Disease Prevention $178.8 4% $200.3 $379.1 122%
Therapeutics 93.3 (5%) 25.4 118.7 22%
Pet Health $272.1 1% $225.7 $497.8 86%
Future Protein & Health 187.8 (10%) 27.5 215.3 3%
Ruminants & Swine 275.7 (8%) 121.7 397.4 33%
Farm Animal $463.5 (9%) $149.2 $612.7 21%
Contract Manufacturing 7.8 (29%) 21.4 29.2 160%
Global Total $743.4 (6%) $396.3 $1,139.7 45%

Fourth Quarter 2020
12
Impact of Price, Rate, and Volume on Revenue
Note: Reported revenue in millions. Numbers may not add due to rounding. (1) Revenue from the Bayer Animal Health acquisition is reflected in volume. As is typical with
acquisitions, we will continue to report the addition of the Bayer business in volume through the third quarter of 2021. (2) CER = Constant Exchange Rate
Revenue Price FX Rate Volume(1) Total CER Growth(2)
Disease Prevention $379.1 14% 0% 108% 122% 122%
Therapeutics 118.7 2% 2% 20% 24% 22%
Pet Health $497.8 10% 0% 76% 86% 86%
Future Protein & Health 215.3 3% (1)% 0% 2% 3%
Ruminants & Swine 397.4 5% 0% 28% 33% 33%
Farm Animal $612.7 4% 0% 17% 21% 21%
Contract Manufacturing 29.2 6% (2)% 154% 158% 160%
Total Elanco $1,139.7 6% 0% 39% 45% 45%

Fourth Quarter 2020
13
Revenue by Geography
U.S. International Global
RevenueCER
ChangeRevenue
CER
ChangeRevenue
CER
Change
Pet Health $304.8 75% $193.0 110% $497.8 86%
Farm Animal $185.1 6% $427.6 29% $612.7 21%
Contract Manufacturing 16.2 82% 13.0 462% 29.2 160%
Total Elanco $506.1 41% $633.6 49% $1,139.7 45%
% of Total Elanco 44% 56% 100%
Note: Reported revenue in millions. Numbers may not add due to rounding. Growth rates excluding the impact for foreign exchange rates. CER = Constant Exchange Rate
2020 revenue figures are inclusive of revenue from animal health products acquired from Bayer as of August 1, 2020.

Diverse and Balanced Geographic Footprint
Pet Health$2.14
Cattle$0.94
Poultry$0.63
Swine$0.51
Aqua$0.12
Contract Manufacturing$0.10
By Species$ billions
By Major Country
14
Combined Company Revenue Breakdowns
Full Year 2020
Total$4.44
Transition to New Reporting Structure with Q1 2021 Results
United States 44%
China 5%
Brazil 3%
United Kingdom 3%
Australia 3%
Japan 3%
Italy 3%
France 2%
Canada 2%
Mexico 2%
Other International 30%
Note: These breakdowns are materially correct based on the historical records of Bayer and Elanco; however, due to certain data limitations, including foreign exchange rates, these numbers may have some
non-material differences to actuals. These breakdowns represent a good faith summary to provide better financial context to investors about the historical performance of the Elanco and Bayer businesses on a
combined basis in 2020

Key Balance Sheet and Cash Flow Metrics
15
Debt(1) Balances as of Year-End 2020$ millions
$6,225$495 $5,730
Note: Net debt is a non-GAAP measure calculated as gross debt less cash and cash equivalents on our balance sheet.
Gross debt is the sum of current portion of long-term debt and long-term debt, and excludes unamortized debt issuance costs
Days sales outstanding continued to improve sequentially,
at 66 days vs. the peak of
103 in the first quarter of 2020
Continued expectation of $500 million in gross debt
paydown in 2021
Unchanged target net leverage of being
under 3x by the end of 2023

Raising full year guidance and
providing guidance for the first quarter
2021 Guidance
16

2021
17
Full Year Guidance
December Guide January Update February Update
Total Revenue $4,520 – $4,600 $4,550 – $4,630
Adjusted Gross Margin(1) 55.5% – 56.5% 56.0% – 57.0%
Operating Expenses $1,730 – $1,760 $1,730 – $1,750
Adjusted EBITDA(1) $940 – $1,000 $955 – $1,005 $980 – $1,040
Adjusted EBITDA Margin(1) 21% – 22% 21% – 22% 21% – 22%
Depreciation Approx. $175 Unchanged
Interest Expense, Net of Capitalized Interest $236 – $244 Unchanged
Tax Rate 21% – 22% Unchanged
Reported Earnings per Share ($0.28) – ($0.14) ($0.37) – ($0.25) ($0.30) – ($0.20)
Adjusted Earnings per Share(1) $0.83 – $0.95 $0.86 – $0.96 $0.90 – $1.00
Weighted Average Diluted Share Count Approx. 494.5 million Unchanged
Capital Expenditures $145 – $165 Unchanged
Net Cash Impact from Bayer, Stand-Up, Integration, and Restructuring Approx. $250 Unchanged
Cash Taxes(2) $30 – $35 $25 – $30
$ millions, except
per share values
(1) Non-GAAP financial measure. See Appendix to this presentation for more information, including GAAP to non-GAAP reconciliations
(2) Net of an expected U.S. federal income tax refund of $16 million and U.S. state income tax refund of $3 million

2021 Revenue Growth Includes ~3% to 4% Underlying Growth
$(45)$160
2021 Guidance
Channel BayerRetail
Stock-In
FX Discont’dOps(1)
Innovation Portfolio
$4,441
2020 Combined Company
Strategic Exits
2020 Combined Company One-Time Adjusted
COVIDElanco
Recovery
COVIDBayer
Headwind
$4,495-$4,500
~3%-4% Growth
$4,550-$4,630
~1% Growth ~1% to 2% Decline
$80-$100
$50-$85
$(20)-$(25)$(35) $35-$40 $(40)-$(50)
$(55)-$(60)
(1) Includes the impact from exiting certain low margin distribution agreements across both legacy Elanco and Bayer portfolios
18
($ millions)
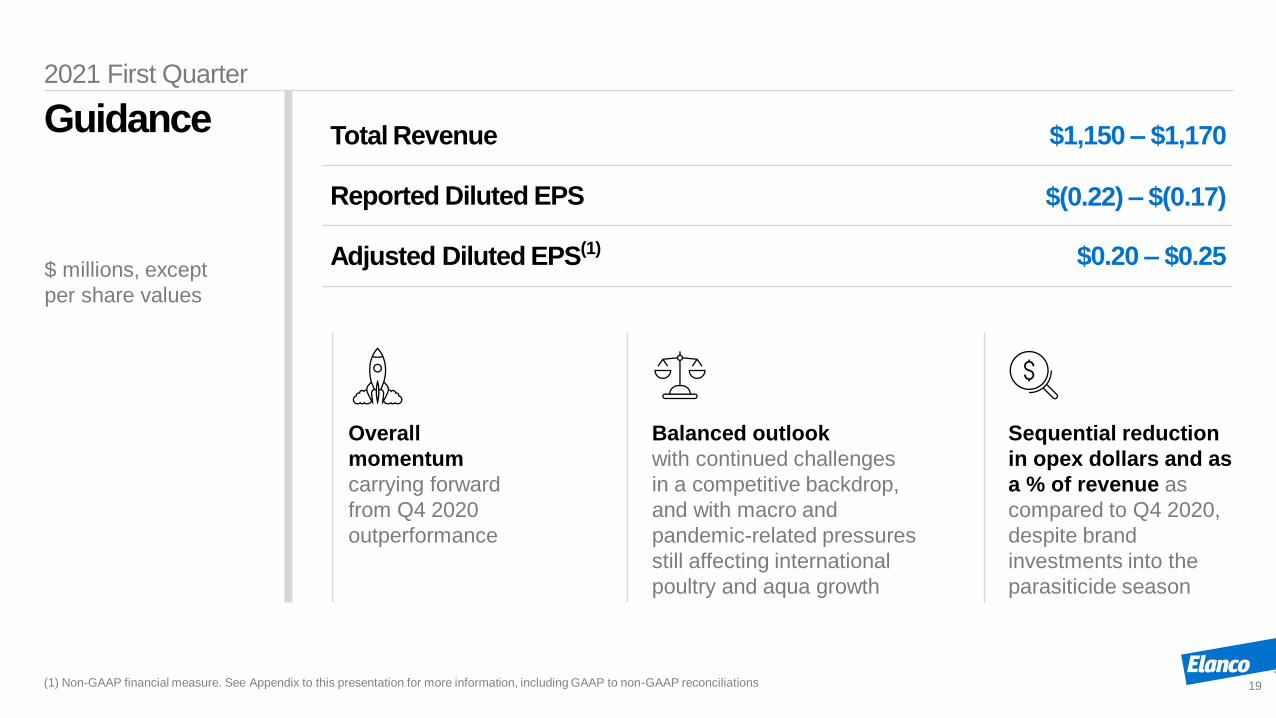
2021 First Quarter
19
Guidance
Overall
momentum
carrying forward
from Q4 2020
outperformance
Balanced outlook
with continued challenges
in a competitive backdrop,
and with macro and
pandemic-related pressures
still affecting international
poultry and aqua growth
Sequential reduction
in opex dollars and as
a % of revenue as
compared to Q4 2020,
despite brand
investments into the
parasiticide season
$ millions, except
per share values
(1) Non-GAAP financial measure. See Appendix to this presentation for more information, including GAAP to non-GAAP reconciliations
Total Revenue $1,150 – $1,170
Reported Diluted EPS $(0.22) – $(0.17)
Adjusted Diluted EPS(1) $0.20 – $0.25

Reference slides, full year data, and GAAP
reported to non-GAAP adjusted reconciliations
Appendix
20
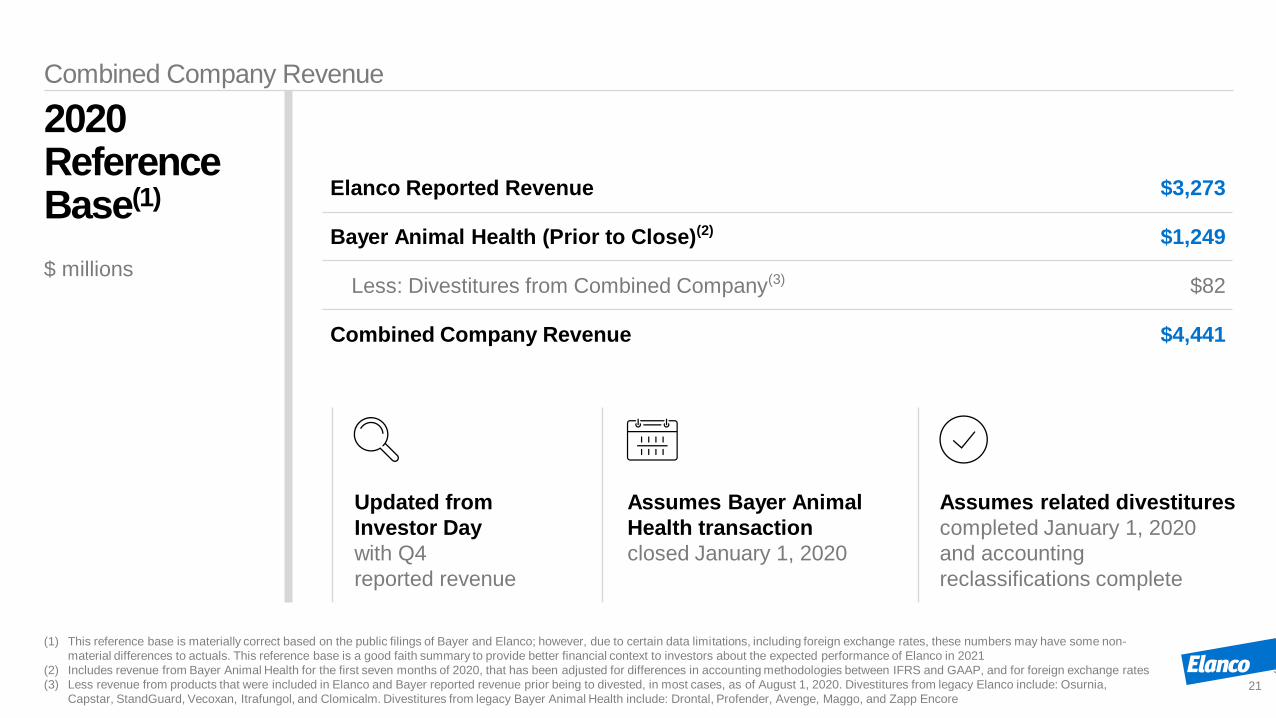
Combined Company Revenue
21
2020 ReferenceBase(1) Elanco Reported Revenue $3,273
Bayer Animal Health (Prior to Close)(2) $1,249
Less: Divestitures from Combined Company(3) $82
Combined Company Revenue $4,441
$ millions
Updated from
Investor Day
with Q4
reported revenue
Assumes Bayer Animal
Health transaction
closed January 1, 2020
Assumes related divestitures
completed January 1, 2020
and accounting
reclassifications complete
(1) This reference base is materially correct based on the public filings of Bayer and Elanco; however, due to certain data limitations, including foreign exchange rates, these numbers may have some non-
material differences to actuals. This reference base is a good faith summary to provide better financial context to investors about the expected performance of Elanco in 2021
(2) Includes revenue from Bayer Animal Health for the first seven months of 2020, that has been adjusted for differences in accounting methodologies between IFRS and GAAP, and for foreign exchange rates
(3) Less revenue from products that were included in Elanco and Bayer reported revenue prior being to divested, in most cases, as of August 1, 2020. Divestitures from legacy Elanco include: Osurnia,
Capstar, StandGuard, Vecoxan, Itrafungol, and Clomicalm. Divestitures from legacy Bayer Animal Health include: Drontal, Profender, Avenge, Maggo, and Zapp Encore
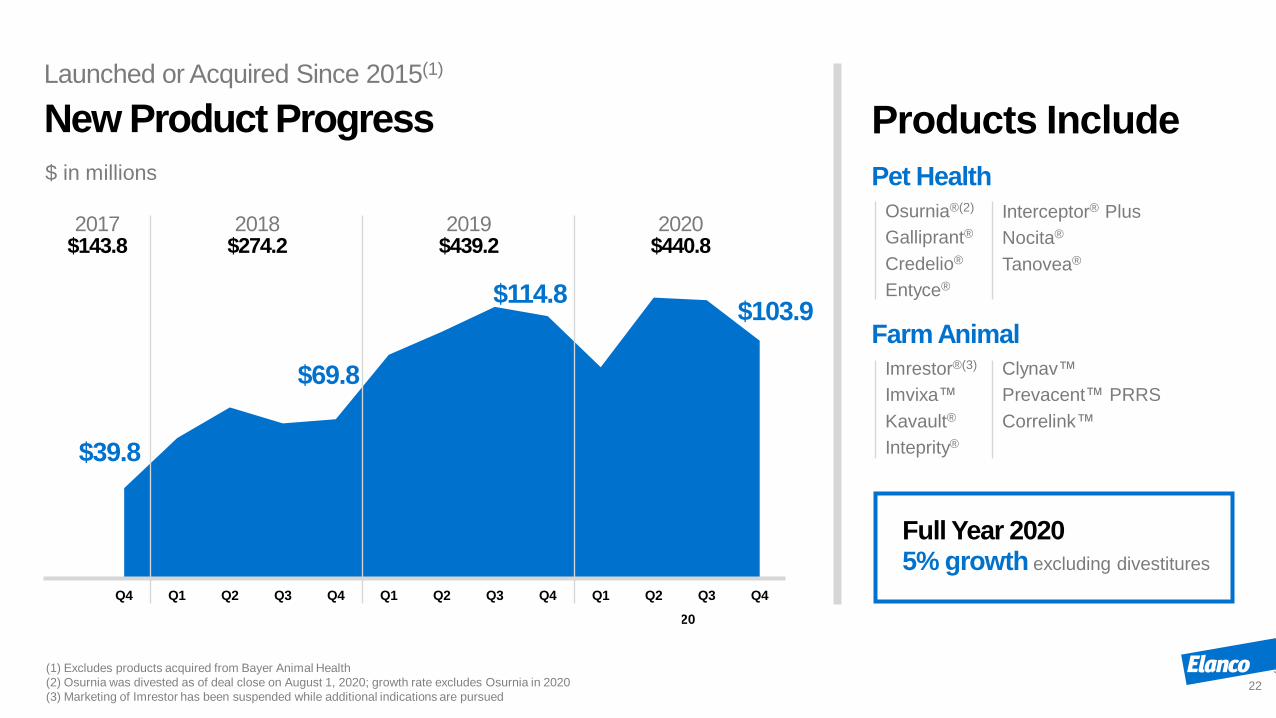
Launched or Acquired Since 2015(1)
22
New Product Progress
FOOD ANIMAL
Products Include$ in millions
(1) Excludes products acquired from Bayer Animal Health
(2) Osurnia was divested as of deal close on August 1, 2020; growth rate excludes Osurnia in 2020
(3) Marketing of Imrestor has been suspended while additional indications are pursued
Osurnia®(2)
Galliprant®
Credelio®
Entyce®
Imrestor®(3)
Imvixa™
Kavault®
Inteprity®
Pet Health
Farm Animal
Interceptor® Plus
Nocita®
Tanovea®
Clynav™
Prevacent™ PRRS
Correlink™
Q4 Q1 Q2 Q3 Q4 Q1 Q2 Q3 Q4 Q1 Q2 Q3 Q4
2017 2018 2019 2020
$69.8
$39.8
$103.9$114.8
2017$143.8
2018$274.2
2019$439.2
2020$440.8
Full Year 20205% growth excluding divestitures

Full Year 2020
23
FinancialPerformance Highlights
2020 2019
Reported Revenue $3,273.3 $3,071.0
Net Income (Loss) $(560.1) $67.9
Earnings Per Share $(1.27) $0.18
Adjusted(1) Net Income $206.7 $394.0
Earnings Per Share Diluted $0.47 $1.06
EBITDA $528.5 $662.8
EBITDA Margin 16.1% 21.6%
$ millions, except
per share values
(1) Non-GAAP financial measure. See Appendix to this presentation for more information, including GAAP to non-GAAP reconciliations

Full Year 2020
24
Adjusted(1)
Income StatementHighlights
2020 2019 Change
Revenue $3,273.3 $3,071.0 7%
Adjusted Gross Profit 1,702.7 1,601.5 6%
Adjusted Gross Margin 52.0% 52.1% (10) bps
SG&A Expenses 996.6 760.2 31%
R&D Expenses 327.0 270.1 21%
Interest Expense, Net 146.9 78.9 86%
Effective Tax Rate on Adjusted Income 14.6% 16.7% (210) bps
Adjusted Net Income 206.7 394.0 (48)%
Adjusted Earnings Per Share Diluted $0.47 $1.06 (56)%
$ millions, except
per share values
(1) Includes non-GAAP financial measures. See Appendix to this presentation for more information, including GAAP to non-GAAP reconciliations

Full Year 2020
25
Revenue Summary by Category
Note: Reported revenue in millions. Number may not add due to rounding. Percentages exclude the impact of foreign currency. CER = Constant Exchange Rate
For presentation of results including impact of foreign currency, see slide 26
LegacyElanco
Elanco CERYOY Change
LegacyBayer
Total Total CERYOY Change
Disease Prevention $692.7 (12)% $300.0 $992.7 26%
Therapeutics 326.9 (6)% 38.9 365.8 5%
Pet Health $1,019.6 (10)% $338.9 $1,358.5 20%
Future Protein & Health 690.7 (5)% 43.4 734.1 1%
Ruminants & Swine 917.8 (16)% 182.7 1,100.5 0%
Farm Animal $1,608.5 (12)% $226.1 $1,834.6 0%
Contract Manufacturing 53.3 (31)% 26.9 80.2 3%
Global Total $2,681.4 (12)% $591.9 $3,273.3 8%
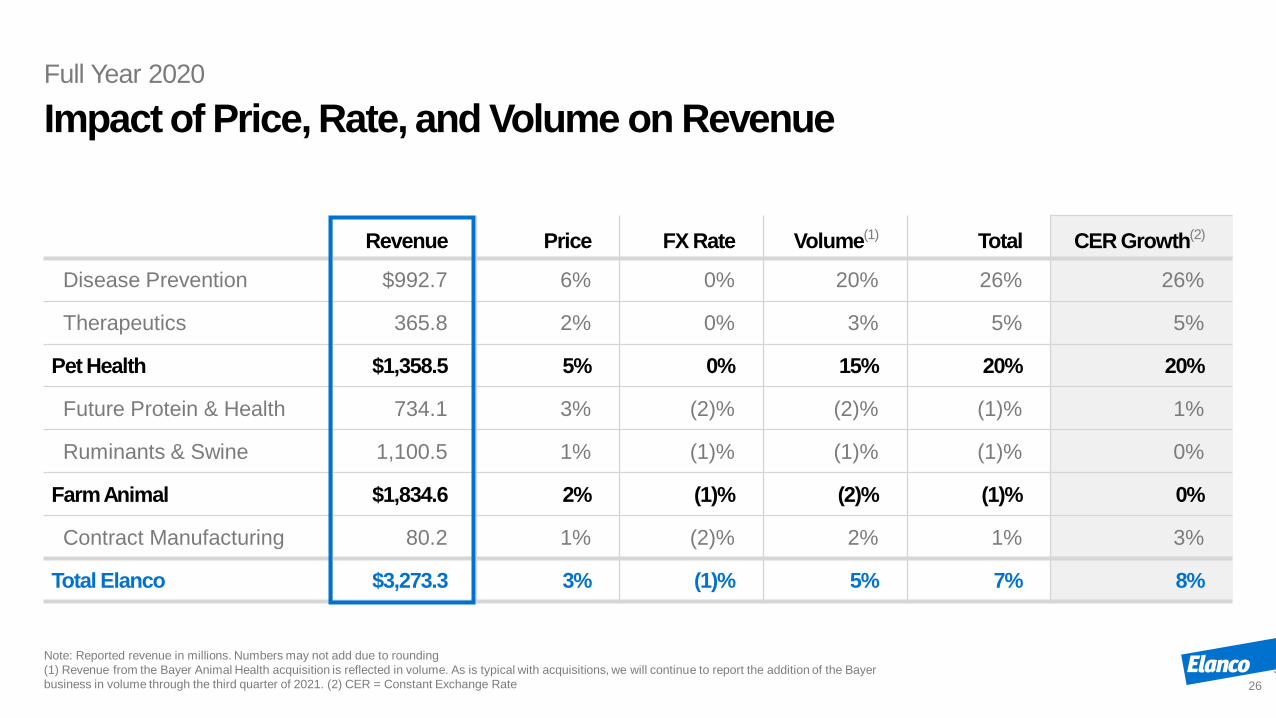
Full Year 2020
26
Impact of Price, Rate, and Volume on Revenue
Note: Reported revenue in millions. Numbers may not add due to rounding
(1) Revenue from the Bayer Animal Health acquisition is reflected in volume. As is typical with acquisitions, we will continue to report the addition of the Bayer
business in volume through the third quarter of 2021. (2) CER = Constant Exchange Rate
Revenue Price FX Rate Volume(1) Total CER Growth(2)
Disease Prevention $992.7 6% 0% 20% 26% 26%
Therapeutics 365.8 2% 0% 3% 5% 5%
Pet Health $1,358.5 5% 0% 15% 20% 20%
Future Protein & Health 734.1 3% (2)% (2)% (1)% 1%
Ruminants & Swine 1,100.5 1% (1)% (1)% (1)% 0%
Farm Animal $1,834.6 2% (1)% (2)% (1)% 0%
Contract Manufacturing 80.2 1% (2)% 2% 1% 3%
Total Elanco $3,273.3 3% (1)% 5% 7% 8%

Full Year 2020
27
Revenue by Geography
U.S. International Global
RevenueCER
ChangeRevenue
CER
ChangeRevenue
CER
Change
Pet Health $873.7 11% $484.8 42% $1,358.5 20%
Farm Animal 559.1 (18)% 1,275.5 10% 1,834.6 0%
Contract Manufacturing 42.8 (25)% 37.4 74% 80.2 3%
Total Elanco $1,475.6 (3)% $1,797.7 18% $3,273.3 8%
% of Total Elanco 45% 55% 100%
Note: Reported revenue in millions. Numbers may not add due to rounding. Growth rates excluding the impact for foreign exchange rates. CER = Constant Exchange Rate
2020 revenue figures are inclusive of revenue from animal health products acquired from Bayer as of August 1, 2020

Note: Revenue in reported dollars in millions. Numbers may not add due to rounding
Pet Health Disease Prevention
Revenue by Quarter
28
$201 $214
$189 $201
$186
$223 $208
$171
$140
$176
$297
$379
$197 $179
Q1 Q2 Q3 Q4
2018 2019 2020
$100
Bayer
$200Bayer
Ela
nco
Ela
nco
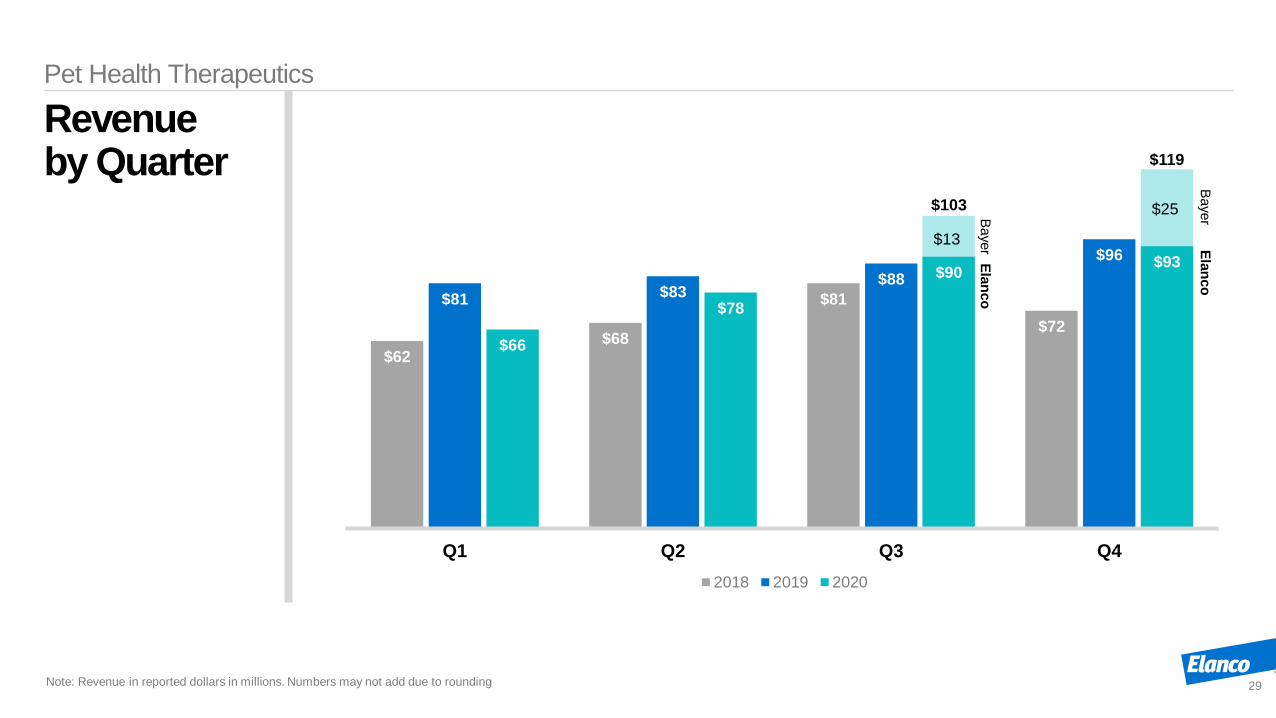
Pet Health Therapeutics
Revenue by Quarter
29
$62 $68
$81
$72
$81 $83 $88
$96
$66
$78
$103
$119
$90 $93
Q1 Q2 Q3 Q4
2018 2019 2020
$13
$25
Bayer
Note: Revenue in reported dollars in millions. Numbers may not add due to rounding
Bayer
Ela
nco
Ela
nco

Farm Animal Future Protein & Health
Revenue by Quarter
30
Elanco
$167 $173
$163
$209
$167 $176
$192
$211
$180
$158
$181
$215
$165
$188
Q1 Q2 Q3 Q4
2018 2019 2020
$16
$28
Bayer
Note: Revenue in reported dollars in millions. Numbers may not add due to rounding
Bayer
Ela
nco
Ela
nco
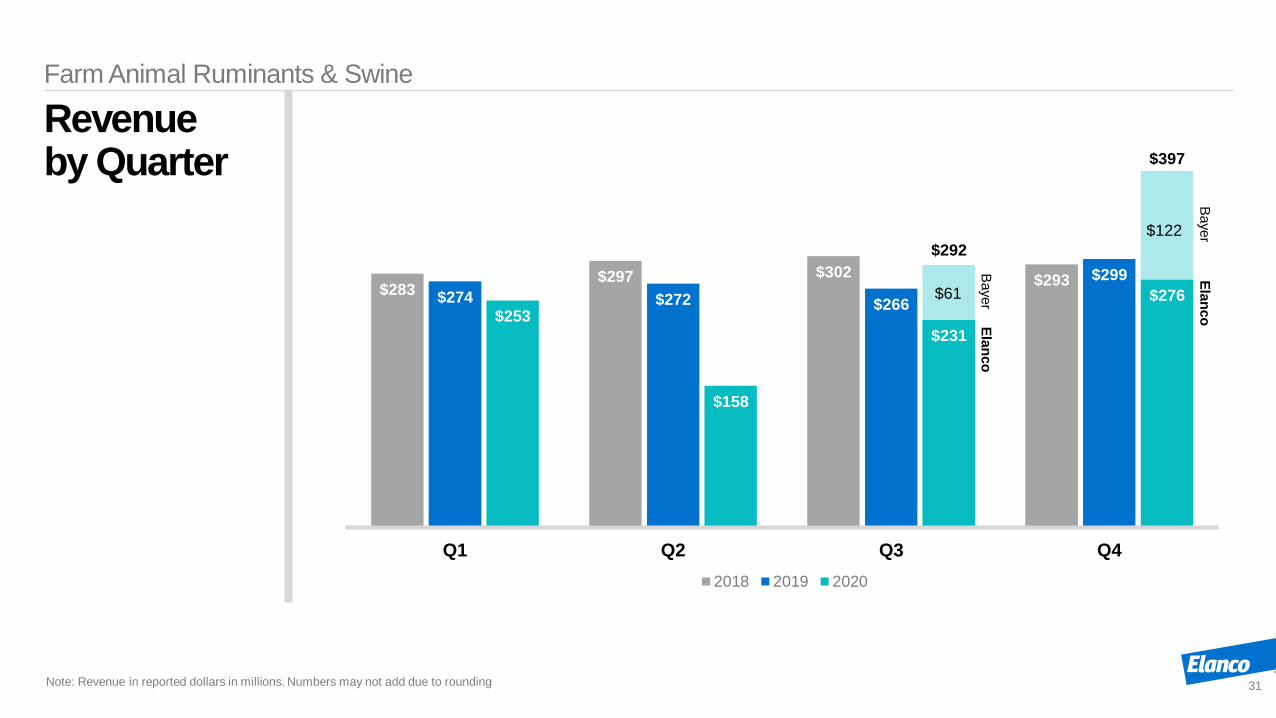
Farm Animal Ruminants & Swine
Revenue by Quarter
31
$283 $297 $302
$293 $274 $272 $266
$299
$253
$158
$292
$397
$231
$276
Q1 Q2 Q3 Q4
2018 2019 2020
$61
$122
Bayer
Note: Revenue in reported dollars in millions. Numbers may not add due to rounding
Bayer
Ela
nco
Ela
nco

Fourth Quarter 2020
Adjusted EBITDA Reconciliation
2020 2019
Reported Net Loss $(322.8) $(9.5)
Net Interest Expense $60.4 $18.7
Income Tax Expense $4.7 $5.2
Depreciation and Amortization $222.2 $83.3
EBITDA $(35.5) $97.7
Non-GAAP Adjustments
Cost of Sales $57.0 -
Asset Impairment, Restructuring, and Other Special Charges $167.3 $51.6
Accelerated Depreciation(1) $(10.8) $(3.0)
Other Expense (Income), Net $(2.0) -
Adjusted EBITDA $175.9 $146.3
Adjusted EBITDA Margin 15.4% 18.6%
32
$ millions
(1) Represents depreciation of certain assets that was accelerated during the periods presented. This amount must be added back to arrive at adjusted EBITDA because it is included
in asset impairment, restructuring, and other special charges but it has already been excluded from EBITDA in the “depreciation and amortization" row above

Full Year 2020
Adjusted EBITDA Reconciliation
2020 2019
Reported Net Income (Loss) $(560.1) $67.9
Net Interest Expense $149.8 $78.9
Income Tax Expense (Benefit) $(111.9) $10.3
Depreciation and Amortization $516.9 $314.4
EBITDA $(5.3) $471.5
Non-GAAP Adjustments
Cost of Sales $96.0 $0.8
Asset Impairment, Restructuring, and Other Special Charges $623.7 $185.5
Accelerated Depreciation(1) $(17.4) $(3.0)
Other Expense (Income), Net $(168.5) $8.0
Adjusted EBITDA $528.5 $662.8
Adjusted EBITDA Margin 16.1% 21.6%
33
(1) Represents depreciation of certain assets that was accelerated during the periods presented. This amount must be added back to arrive at adjusted EBITDA because it is included
in asset impairment, restructuring, and other special charges but it has already been excluded from EBITDA in the “depreciation and amortization" row above
$ millions

Fourth Quarter 2020
Reconciliation of GAAP Reported to Non-GAAP Adjusted Income Statement Items
$ millions
34See slide 35 for details of adjustments to certain GAAP reported measures
2020 2019
GAAP Reported
Adjusted Items
Non-GAAP
GAAP Reported
Adjusted Items
Non-GAAP
Cost of Sales(1) $596.2 $57.0 $539.2 $410.1 – $410.1
Amortization of Intangible Assets $163.7 $163.7 – $51.4 $51.4 –
Asset Impairment, Restructuring and Other Special Charges(2)(3) $167.3 $167.3 – $51.6 $51.6 –
Other Expense (Income), Net(4) $(16.6) $(2.0) $(14.6) $6.3 – $6.3
Income (Loss) Before Taxes $(318.1) $386.0 $67.9 $(4.3) $103.0 $98.7
Provision for Taxes(5)(6) $4.7 $(6.5) $11.2 $5.2 $(5.7) $10.9
Net Income (Loss) $(322.8) $379.5 $56.7 $(9.5) $97.3 $87.8
Earnings (Loss) per Share Diluted $(0.66) $0.78 $0.12 $(0.03) $0.26 $0.23
Adjusted Weighted Average Shares
Outstanding Diluted(7) 486.2 488.2 488.2 373.0 374.8 374.8

Fourth Quarter 2020
Details of Adjustments to Certain GAAP Reported Measures
35
For the three months ended December 31, 2020 and 2019:
1) 2020 excludes amortization of inventory fair value adjustments recorded from the acquisition of Bayer Animal Health ($57.0 million).
2) 2020 excludes charges associated with integration efforts and external costs related to the acquisition of businesses, including the
acquisition of the animal health business of Bayer, and charges primarily related to independent stand-up costs and other related
activities ($105.4 million), severance ($23.9 million), asset impairments ($14.0 million), facility exit costs and asset write-downs ($12.4
million), a one-time expense associated with our agreement to build a new corporate headquarters ($9.4 million), registration fees for
Elanco common shares sold by Bayer AG during the quarter ($1.2 million), and a payment for acquired IPR&D from a collaboration
arrangement ($1.0 million).
3) 2019 excludes charges associated with integration efforts and external costs related to the acquisition of businesses and charges
primarily related to independent stand-up costs and other related activities ($44.5 million) and facility exit costs and asset impairments
($8.0 million), partially offset by a favorable adjustment from reversals for severance programs ($0.9 million).
4) 2020 excludes gains recorded in relation to the divestiture of several products required as a result of the acquisition of the animal health
business of Bayer ($0.2 million) and the impact of a decrease in the fair value of the Prevtec contingent consideration ($1.8 million).
5) 2020 represents the income tax expense associated with the adjusted items, partially offset by the impact of the valuation al lowance
recorded against our U.S. deferred tax assets during the period ($74.9 million).
6) 2019 represents the income tax expense associated with the adjusted items.
7) During the three months ended December 31, 2020, we reported a GAAP net loss and thus potential dilutive common shares were not
assumed to have been issued since their effect is anti-dilutive. During the same period, we reported non-GAAP net income. As a result,
potential dilutive common shares would not have an anti-dilutive effect, and diluted weighted average shares outstanding for purposes of
calculating adjusted EPS include 2.0 million of common stock equivalents.

Full Year 2020
Reconciliation of GAAP Reported to Non-GAAP Adjusted Income Statement Items
$ millions
36See slide 37 for details of adjustments to certain GAAP reported measures
2020 2019
GAAP Reported
Adjusted Items
Non-GAAP
GAAP Reported
Adjusted Items
Non-GAAP
Cost of Sales(1)(2) $1,666.6 $96.0 $1,570.6 $1,470.3 $0.8 $1,469.5
Amortization of Intangible Assets $359.9 $359.9 – $200.4 $200.4 –
Asset Impairment, Restructuring and Other Special Charges(3)(4) $623.7 $623.7 – $185.5 $185.5 –
Interest Expense, Net of Capitalized Interest(5) $149.8 $2.9 $146.9 $78.9 – $78.9
Other Expense (Income), Net (6)(7) $(178.3) $(168.5) $(9.8) $27.4 $8.0 $19.4
Income (Loss) Before Taxes $(672.0) $914.0 $242.0 $78.2 $394.7 $472.9
Provision for Taxes(8)(9) $(111.9) $(147.2) $35.3 $10.3 $(68.6) $78.9
Net Income (Loss) $(560.1) $766.8 $206.7 $67.9 $326.1 $394.0
Earnings (Loss) per Share Diluted $(1.27) $1.74 $0.47 $0.18 $0.88 $1.06
Adjusted Weighted Average Shares
Outstanding Diluted(10) 441.4 442.6 442.6 370.3 370.3 370.3

Full Year 2020
Details of Adjustments to Certain GAAP Reported Measures
37
For the year ended December 31, 2020 and 2019:
1) 2020 excludes amortization of inventory fair value adjustments recorded
from the acquisition of Bayer Animal Health ($90.2 million), charges
associated with the write-off of marketing inventory recorded from the
acquisition of Bayer Animal Health ($1.5 million), and a one-time
payment to settle outstanding obligations to a contract manufacturing
organization in connection with a divestiture ($4.3 million).
2) 2019 excludes amortization of inventory fair value adjustments recorded
from the acquisitions of Aratana and Prevtec ($0.6 million) and inventory
adjustments for the suspension of commercial activities of Imrestor®
($0.2 million).
3) 2020 excludes charges associated with integration efforts and external
costs related to the acquisition of businesses, including the acquisition
of the animal health business of Bayer, and charges primarily related to
independent stand-up costs and other related activities ($423.9 million),
severance ($155.8 million), asset impairments ($17.5 million), facility
exit costs and asset write-downs ($16.6 million), a one-time payment
associated with our agreement to build a new corporate headquarters
($9.4 million), the settlement of a legal matter ($3.2 million), registration
fees for Elanco common shares sold by Bayer AG during the quarter
($1.2 million), and a payment for acquired IPR&D from a collaboration
arrangement ($1.0 million), partially offset by adjustments to write-
downs of assets held for sale ($0.4 million), a favorable adjustment from
reversals for severance programs that are no longer active ($0.8
million), and the gain on the sale of our R&D facility in Prince Edward
Island, Canada ($3.8 million).
4) 2019 excludes charges associated with integration efforts and external
costs related to the acquisition of businesses and charges primarily
related to independent stand-up costs and other related activities
($144.7 million), facility exit costs and asset impairments ($32.6 million),
and severance ($19.5 million), partially offset by favorable adjustments
from reversals for severance programs ($11.3 million).
5) 2020 excludes the debt extinguishment losses recorded in connection
with the repayments of our existing term loan facilities ($2.9 million).
6) 2020 excludes the gains recorded in relation to the divestiture of several
products as required as a result of the acquisition of the animal health
business of Bayer ($156.7 million), a hedging gain related to the closing
of the acquisition of the animal health business of Bayer ($6.0 million),
the gain on our sale of land and buildings in New South Wales, Australia
($45.6 million) and the impact of a decrease in the fair value of the
Prevtec contingent consideration ($3.9 million), partially offset by
financing commitment and advisory fees associated with the Bayer
Animal Health acquisition ($36.3 million) and a loss recorded in relation
to the divestiture of products ($7.3 million).
7) 2019 excludes expenses resulting from an increase in the Aratana
contingent consideration ($7.5 million) and the write-off of marketing
authorizations as a result of the acquisition of Prevtec ($0.5 million).
8) 2020 represents the income tax expense associated with the adjusted
items, partially offset by the impact of the valuation allowance recorded
against our U.S. deferred tax assets during the period ($74.9 million).
9) 2019 represents the income tax expense associated with the adjusted
items.
10) During the year ended December 31, 2020, we reported a GAAP net
loss and thus potential dilutive common shares were not assumed to
have been issued since their effect is anti-dilutive. During the same
period, we reported non-GAAP net income. As a result, potential dilutive
common shares would not have an anti-dilutive effect, and diluted
weighted average shares outstanding for purposes of calculating
adjusted EPS include 1.2 million of common stock equivalents.

Full Year 2021
Reported Earnings per Share $(0.30) – $(0.20)
Cost of Sales $0.12
Amortization of Intangible Assets $1.19
Asset Impairment, Restructuring, and Other Special Charges $0.37 – $0.44
Subtotal $1.68 – $1.74
Tax Impact of Adjustments $(0.55) – $(0.48)
Total Adjustments to Earnings per Share $1.20
Adjusted Earnings per Share(1) $0.90 – $1.00
38
Note: Numbers may not add due to rounding
(1) Adjusted EPS is calculated as the sum of reported EPS and total adjustments to EPS
EPS Guidance Reconciliation February Update

Full Year 2021
$ millions
Reported Net Income (Loss) $(150) – $(100)
Net Interest Expense $236 – $244
Income Tax Expense $(130) – $(110)
Depreciation and Amortization Approx. $760
EBITDA $720 – $790
Non-GAAP Adjustments
Cost of Sales Approx. $55
Asset Impairment, Restructuring, and Other Special Charges $190 – $210
Adjusted EBITDA $980 – $1,040
Adjusted EBITDA Margin 21% – 22%
39Note: Numbers may not add due to rounding
EBITDA Guidance Reconciliation February Update
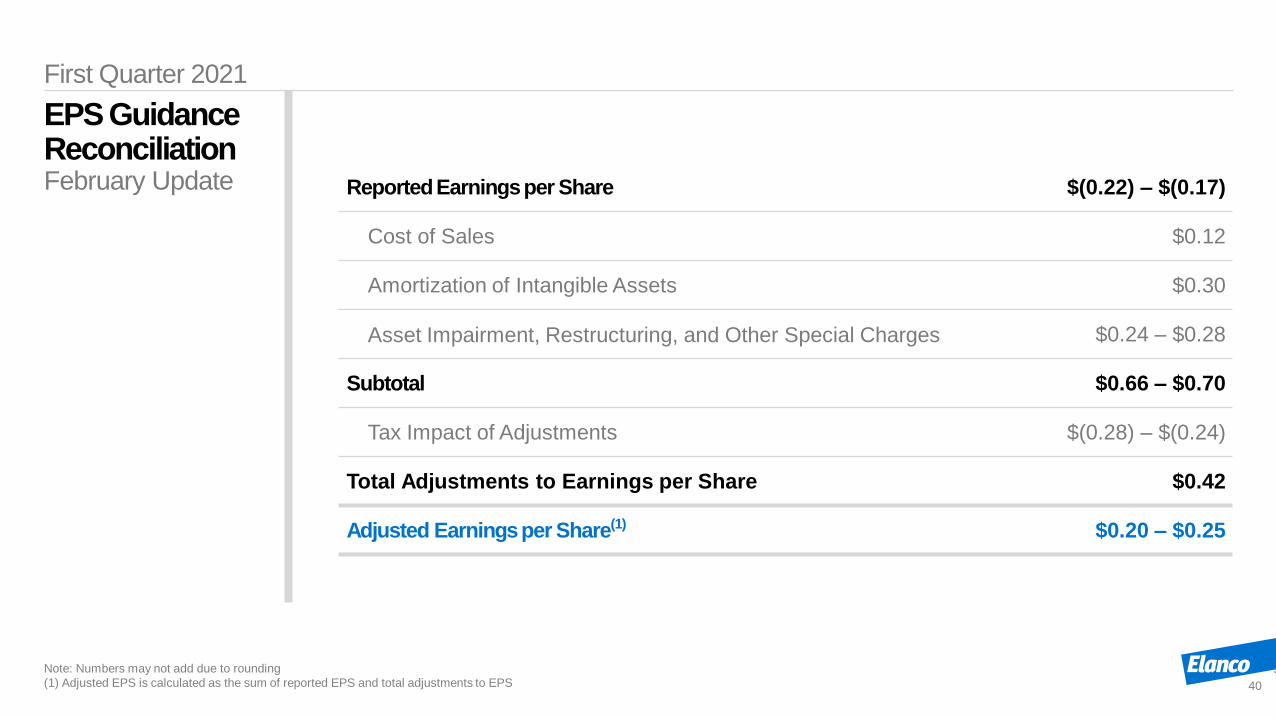
First Quarter 2021
Reported Earnings per Share $(0.22) – $(0.17)
Cost of Sales $0.12
Amortization of Intangible Assets $0.30
Asset Impairment, Restructuring, and Other Special Charges $0.24 – $0.28
Subtotal $0.66 – $0.70
Tax Impact of Adjustments $(0.28) – $(0.24)
Total Adjustments to Earnings per Share $0.42
Adjusted Earnings per Share(1) $0.20 – $0.25
40
Note: Numbers may not add due to rounding
(1) Adjusted EPS is calculated as the sum of reported EPS and total adjustments to EPS
EPS Guidance Reconciliation February Update