THIRD QUARTER EARNINGS PRESENTATION
45
THIRD QUARTER EARNINGS PRESENTATION October 27, 2021 George R. Aylward President and Chief Executive Officer Michael A. Angerthal Executive Vice President and Chief Financial Officer
Transcript of THIRD QUARTER EARNINGS PRESENTATION
THIRD QUARTER EARNINGS
PRESENTATION
October 27, 2021
George R. Aylward
President and Chief Executive Officer
Michael A. Angerthal
Executive Vice President and Chief Financial Officer

This presentation contains statements that are, or may be considered to be, forward-looking statements. All statements that are not historical facts,
including statements about our beliefs or expectations, are “forward-looking statements” within the meaning of the Private Securities Litigation Reform
Act of 1995, as amended. These statements may be identified by such forward-looking terminology as “expect,” “estimate,” "intent," "plan," “intend,”
“believe,” “anticipate,” “may,” “will,” “should,” “could,” “continue,” “project,” “opportunity,” “predict,” “would,” “potential,” “future,” “forecast,” “guarantee,”
“assume,” “likely,” “target” or similar statements or variations of such terms.
Our forward-looking statements are based on a series of expectations, assumptions and projections about the company and the markets in which we
operate, are not guarantees of future results or performance, and involve substantial risks and uncertainty, including assumptions and projections
concerning our assets under management, net asset inflows and outflows, operating cash flows, business plans and ability to borrow, for all future
periods. All of our forward-looking statements are as of the date of this presentation only. The company can give no assurance that such expectations
or forward-looking statements will prove to be correct. Actual results may differ materially.
Our business and our forward- looking statements involve substantial known and unknown risks and uncertainties, including those discussed under
"Risk Factors" and "Management’s Discussion and Analysis of Financial Condition and Results of Operations" in our 2020 Annual Report on Form 10-
K, as supplemented by our periodic filings with the Securities and Exchange Commission (the "SEC"), as well as the following risks and uncertainties
resulting from: (i) any reduction in our assets under management; (ii) general domestic and global economic, political and pandemic conditions; (iii)
inability to achieve the expected benefits of our strategic transactions; (iv) the on-going effects of the COVID-19 pandemic and associated global
economic disruption; (v) withdrawal, renegotiation or termination of investment advisory agreements; (vi) damage to our reputation; (vii) inability to
satisfy financial covenants and payments related to our indebtedness; (viii) inability to attract and retain key personnel; ( ix) challenges from the
competition we face in our business; (x) adverse developments related to unaffiliated subadvisers; (xi) negative changes in key distribution
relationships; (xii) interruptions in or failure to provide critical technological service by us or third parties; (xiii) risk of loss on our investments; (xiv) lack
of sufficient capital on satisfactory terms; (xv) adverse regulatory and legal developments; (xvi) failure to comply with investment guidelines or other
contractual requirements; (xvii) adverse civil litigation and government investigations or proceedings; (xviii) unfavorable changes in tax laws or
limitations; (xix) volatility associated with our common stock; (xx) inability to make quarterly common stock dividends; (xxi) certain corporate
governance provisions in our charter and bylaws; (xxii) losses or costs not covered by insurance; (xxiii) impairment of goodwill or intangible assets; and
other risks and uncertainties. Any occurrence of, or any material adverse change in, one or more risk factors or risks and uncertainties referred to
above, in our 2020 Annual Report on Form 10-K and our other periodic reports filed with the SEC could materially and adversely affect our operations,
financial results, cash flows, prospects and liquidity.
Certain other factors that may impact our continuing operations, prospects, financial results and liquidity, or that may cause actual results to differ from
such forward-looking statements, are discussed or included in the company’s periodic reports filed with the SEC and are available on our website at
www.virtus.com under “Investor Relations.” You are urged to carefully consider all such factors.
The company does not undertake or plan to update or revise any such forward-looking statements to reflect actual results, changes in plans,
assumptions, estimates or projections, or other circumstances occurring after the date of this presentation, even if such results, changes or
circumstances make it clear that any forward-looking information will not be realized. If there are any future public statements or disclosures by us that
modify or impact any of the forward-looking statements contained in or accompanying this presentation, such statements or disclosures will be deemed
to modify or supersede such statements in this presentation.
IMPORTANT DISCLOSURES
2

AGENDA
3
■ Overview of Quarter
■ Results
■ Q & A Session
OVERVIEW OF QUARTER

THIRD QUARTER 2021
See the financial supplement for U.S. GAAP to Non-GAAP (“as adjusted”) reconciliations and related notes
Assets and Flows
■ Assets under management (AUM) of $177.3 billion, down 1% sequentially due to market performance and modest net
outflows
■ Sales of $7.6 billion compared with $9.6 billion in the prior quarter primarily due to lower sales of domestic equity
strategies
■ Net flows of ($0.6) billion due to open-end fund net outflows, including a $0.7 billion model rebalance, partially offset
by positive net flows in retail separate accounts, ETFs, and institutional
Non-GAAP Financial Results
■ Operating income, as adjusted, of $110.1 million, up 7% sequentially
■ Operating margin, as adjusted, of 50.6%, up 170 bps sequentially
■ Highest level of earnings per diluted share, as adjusted, of $9.71, up 7% sequentially
Capital Activities
■ Repurchased 64,494 shares for $20.0 million
■ Increased quarterly common dividend by 83% to $1.50 per share
■ Refinanced credit agreement with new $275.0 million term loan and $175.0 million revolving credit facility; lowered
borrowing rate and extended maturity
OVERVIEW
5

RESULTS

$ in billions1 Consists of strategies with substantial holdings in at least two of the following: equity, fixed income, and alternatives2 Consists of real estate securities, infrastructure, mid-stream energy, long/short and options strategies
■ AUM of $177.3 billion declined 1% due to:
– ($0.5) billion of market performance
– ($0.6) billion of net flows
■ Retail separate account assets grew 2% to
$41.5 billion
– Represents 23% of total AUM
– 14 consecutive quarters of organic growth
– 8% annualized organic growth in quarter; 21%
over trailing twelve months
■ Assets diversified across product types:
– Open-end funds: 41%
– Institutional: 26%
– Retail separate accounts: 23%
ASSETS UNDER MANAGEMENTLOWER DUE TO MARKET AND FLOWS
7
AUM by Asset Class
Equity
62.5% 65.3% 62.9% 63.7% 63.6%
Fixed Income
24.3% 21.9% 20.8% 19.8% 19.9%
Multi-Asset1
9.5% 9.2% 13.3% 13.2% 13.3%
Alternatives2
3.7% 3.6% 3.0% 3.3% 3.2%
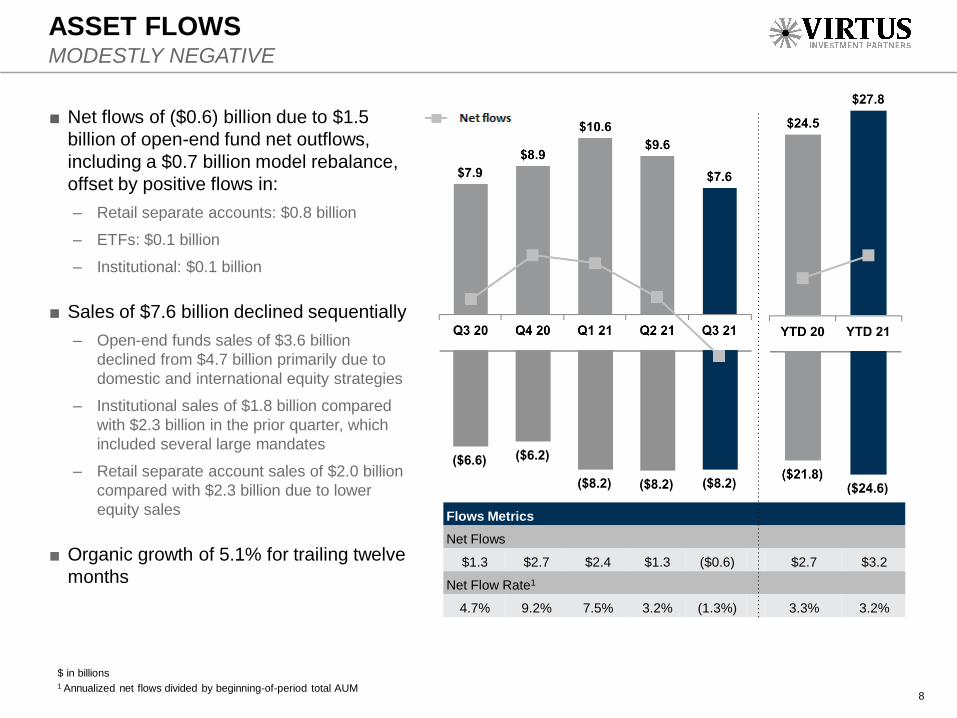
$ in billions1 Annualized net flows divided by beginning-of-period total AUM
■ Net flows of ($0.6) billion due to $1.5
billion of open-end fund net outflows,
including a $0.7 billion model rebalance,
offset by positive flows in:
– Retail separate accounts: $0.8 billion
– ETFs: $0.1 billion
– Institutional: $0.1 billion
■ Sales of $7.6 billion declined sequentially
– Open-end funds sales of $3.6 billion
declined from $4.7 billion primarily due to
domestic and international equity strategies
– Institutional sales of $1.8 billion compared
with $2.3 billion in the prior quarter, which
included several large mandates
– Retail separate account sales of $2.0 billion
compared with $2.3 billion due to lower
equity sales
■ Organic growth of 5.1% for trailing twelve
months
ASSET FLOWSMODESTLY NEGATIVE
Flows Metrics
Net Flows
$1.3 $2.7 $2.4 $1.3 ($0.6) $2.7 $3.2
Net Flow Rate1
4.7% 9.2% 7.5% 3.2% (1.3%) 3.3% 3.2%
8

$ in millions, except AUM, which is in billions1 Represents investment management fees, as adjusted, divided by average assets. Investment management fees, as adjusted, exclude those of consolidated investment products
and are reduced by revenue-related adjustments on specific agreements to reflect the portion passed-through to third-party client intermediaries
See the financial supplement for U.S. GAAP to Non-GAAP (“as adjusted”) reconciliations and related notes
■ Investment management fees, as
adjusted, increased sequentially by $6.8
million, or 4%, due to higher average
AUM, which increased 4%
– Performance-related fees of $0.6 million
compared with $0.8 million in the prior quarter
■ Average fee rate on total assets of 42.0
bps decreased sequentially from 42.5
– Reflected higher retail separate accounts and
institutional AUM compared with prior quarter
■ Excluding performance fees, average fee
rate of 41.9 bps compared with 42.3 bps in
prior quarter
INVESTMENT MANAGEMENT FEES, AS ADJUSTEDHIGHER AVERAGE ASSETS
Metrics
Revenues, as adjusted
$137.6 $153.5 $187.3 $210.3 $217.7 $382.8 $615.3
Fee Rate1 – BPS
43.1 44.9 43.1 42.5 42.0 42.9 42.5
Average AUM
$112.9 $121.1 $154.3 $172.9 $179.6 $105.7 $168.9
9

$ in millions
See the financial supplement for U.S. GAAP to Non-GAAP (“as adjusted”) reconciliations and related notes
■ Employment expenses, as adjusted, of
$86.5 million were flat compared with
prior quarter
– Higher variable profit-based incentive
compensation offset by lower sales-based
incentive compensation
■ Ratio as a percentage of revenues, as
adjusted, of 39.7% declined 140 bps
sequentially primarily due to market-
driven revenue growth
EMPLOYMENT EXPENSES, AS ADJUSTEDREFLECTS VARIABLE COMPENSATION
% of Revenues, as adjusted
48.0% 47.8% 48.3% 41.1% 39.7% 50.2% 42.8%
10

% of Revenues, as adjusted
11.9% 11.1% 9.5% 9.5% 9.3% 13.8% 9.4%
$ in millions
See the financial supplement for U.S. GAAP to Non-GAAP (“as adjusted”) reconciliations and related notes
■ Other operating expenses, as adjusted,
of $20.2 million increased $0.3 million,
or 1%, sequentially due to:
– Growth of the business
– Modest increase in travel and related
expenses
■ Other operating expenses, as adjusted,
as a percentage of revenues, as
adjusted, were 9.3%, down 20 bps
sequentially and 260 bps from the prior
year period
OTHER OPERATING EXPENSES, AS ADJUSTEDINCREASE FROM BUSINESS GROWTH
11

Metrics
Net Income, as adjusted
$35.9 $41.4 $54.6 $72.7 $77.5 $88.0 $204.8
Operating Margin, as adjusted
39.3% 40.3% 41.6% 48.9% 50.6% 35.2% 47.3%
Operating Income, As Adjusted
$ in millions, except per share data
See the financial supplement for U.S. GAAP to Non-GAAP (“as adjusted”) reconciliations and related notes
■ Operating margin, as adjusted, of 50.6%
increased 170 bps from the prior quarter
and from 39.3% in the prior-year period
■ Diluted EPS, as adjusted, of $9.71
increased sequentially by $0.64, or 7%,
due to:
– 4% growth in average AUM
– Higher operating margin
■ Diluted EPS, as adjusted, up 116% over
prior year quarter
NON-GAAP RESULTSHIGHEST LEVEL OF EPS, AS ADJUSTED
Diluted earnings per share, as adjusted
12
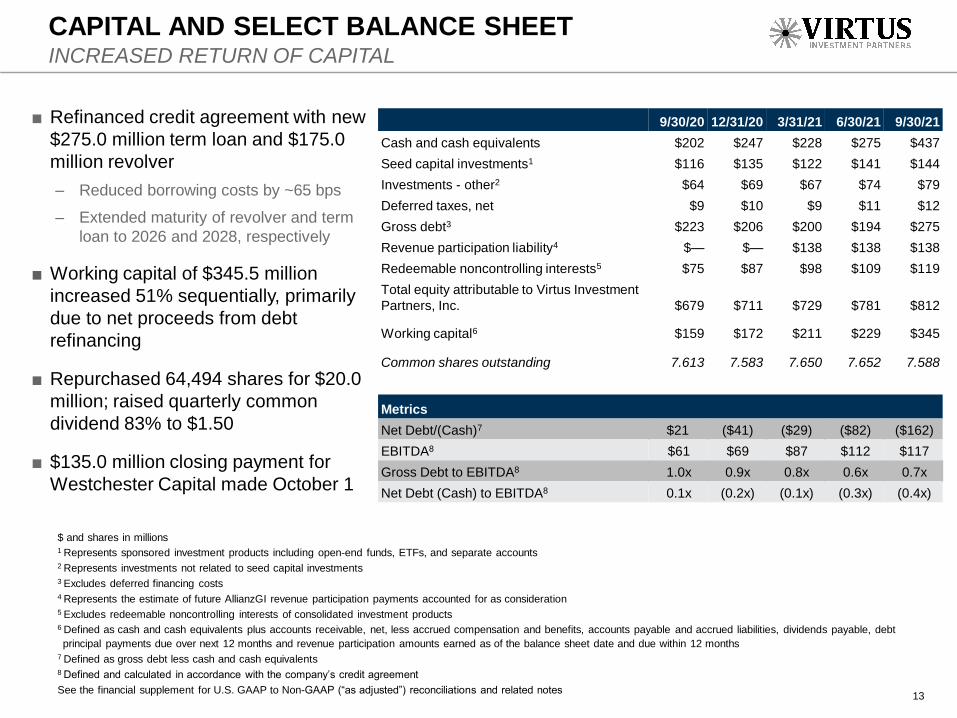
$ and shares in millions1 Represents sponsored investment products including open-end funds, ETFs, and separate accounts2 Represents investments not related to seed capital investments3 Excludes deferred financing costs 4 Represents the estimate of future AllianzGI revenue participation payments accounted for as consideration5 Excludes redeemable noncontrolling interests of consolidated investment products6 Defined as cash and cash equivalents plus accounts receivable, net, less accrued compensation and benefits, accounts payable and accrued liabilities, dividends payable, debt
principal payments due over next 12 months and revenue participation amounts earned as of the balance sheet date and due within 12 months 7 Defined as gross debt less cash and cash equivalents8 Defined and calculated in accordance with the company’s credit agreement
See the financial supplement for U.S. GAAP to Non-GAAP (“as adjusted”) reconciliations and related notes
■ Refinanced credit agreement with new
$275.0 million term loan and $175.0
million revolver
– Reduced borrowing costs by ~65 bps
– Extended maturity of revolver and term
loan to 2026 and 2028, respectively
■ Working capital of $345.5 million
increased 51% sequentially, primarily
due to net proceeds from debt
refinancing
■ Repurchased 64,494 shares for $20.0
million; raised quarterly common
dividend 83% to $1.50
■ $135.0 million closing payment for
Westchester Capital made October 1
CAPITAL AND SELECT BALANCE SHEET INCREASED RETURN OF CAPITAL
Select Balance Sheet Items:
13
9/30/20 12/31/20 3/31/21 6/30/21 9/30/21
Cash and cash equivalents $202 $247 $228 $275 $437
Seed capital investments1 $116 $135 $122 $141 $144
Investments - other2 $64 $69 $67 $74 $79
Deferred taxes, net $9 $10 $9 $11 $12
Gross debt3 $223 $206 $200 $194 $275
Revenue participation liability4 $— $— $138 $138 $138
Redeemable noncontrolling interests5 $75 $87 $98 $109 $119
Total equity attributable to Virtus Investment
Partners, Inc. $679 $711 $729 $781 $812
Working capital6 $159 $172 $211 $229 $345
Common shares outstanding 7.613 7.583 7.650 7.652 7.588
Metrics
Net Debt/(Cash)7 $21 ($41) ($29) ($82) ($162)
EBITDA8 $61 $69 $87 $112 $117
Gross Debt to EBITDA8 1.0x 0.9x 0.8x 0.6x 0.7x
Net Debt (Cash) to EBITDA8 0.1x (0.2x) (0.1x) (0.3x) (0.4x)
FINANCIAL SUPPLEMENT

$ in thousands1 The non-GAAP financial information included in this presentation differs from financial information determined in accordance with U.S. GAAP as a result of the reclassification of
certain income statement items as well as the exclusion of certain expenses and other items that are not reflective of the earnings generated from providing investment management
and related services. Non-GAAP financial information has material limitations and should not be viewed in isolation or as a substitute for U.S. GAAP measures. See the information
beginning on page 36 for reconciliations to the most directly comparable U.S. GAAP measures and other important disclosures.
NON-GAAP INFORMATIONINCOME STATEMENT 1 (UNAUDITED)
15
Q3:20 Q4:20 Q1:21 Q2:21 Q3:21 YTD:20 YTD:21
Revenues, As Adjusted
Investment management fees, as adjusted $122,359 $136,824 $163,935 $183,230 $190,029 $339,180 $537,194
Administration and shareholder service fees, as adjusted 15,180 16,472 22,621 25,926 26,482 43,212 75,029
Other income and fees, as adjusted 94 245 720 1,174 1,159 425 3,053
Total revenues, as adjusted $137,633 $153,541 $187,276 $210,330 $217,670 $382,817 $615,276
Operating Expenses, As Adjusted
Employment expenses, as adjusted $66,112 $73,462 $90,412 $86,521 $86,471 $191,993 $263,404
Other operating expenses, as adjusted 16,343 17,061 17,800 19,894 20,173 52,664 57,867
Depreciation and other amortization, as adjusted 1,106 1,100 1,098 981 915 3,560 2,994
Total operating expenses, as adjusted $83,561 $91,623 $109,310 $107,396 $107,559 $248,217 $324,265
Operating Income (Loss), As Adjusted $54,072 $61,918 $77,966 $102,934 $110,111 $134,600 $291,011

$ and shares in thousands1 The non-GAAP financial information included in this presentation differs from financial information determined in accordance with U.S. GAAP as a result of the reclassification of
certain income statement items as well as the exclusion of certain expenses and other items that are not reflective of the earnings generated from providing investment management
and related services. Non-GAAP financial information has material limitations and should not be viewed in isolation or as a substitute for U.S. GAAP measures. See the information
beginning on page 36 for reconciliations to the most directly comparable U.S. GAAP measures and other important disclosures.
NON-GAAP INFORMATIONINCOME STATEMENT 1 (CONTINUED) (UNAUDITED)
16
Q3:20 Q4:20 Q1:21 Q2:21 Q3:21 YTD:20 YTD:21
Other Income (Expense), As Adjusted
Realized and unrealized gain (loss) on investments, net, as adjusted ($205) $147 ($73) $476 $24 ($740) $427
Other income, net, as adjusted 999 1,070 1,771 826 1,001 806 3,598
Total other income (expense), as adjusted $794 $1,217 $1,698 $1,302 $1,025 $66 $4,025
Interest Income (Expense), As Adjusted
Interest expense, as adjusted ($2,877) ($2,692) ($2,314) ($2,256) ($2,168) ($9,906) ($6,738)
Interest and dividend income, as adjusted 778 1,134 1,046 1,085 1,013 5,299 3,144
Total interest income (expense), net, as adjusted ($2,099) ($1,558) ($1,268) ($1,171) ($1,155) ($4,607) ($3,594)
Pre-Tax Income (Loss), As Adjusted $52,767 $61,577 $78,396 $103,065 $109,981 $130,059 $291,442
Income tax expense (benefit), as adjusted 14,414 16,804 20,942 27,394 29,113 36,237 77,449
Net Income (Loss), As Adjusted $38,353 $44,773 $57,454 $75,671 $80,868 $93,822 $213,993
Noncontrolling interests, as adjusted (2,432) (3,411) (2,834) (3,010) (3,355) (5,870) (9,199)
Net Income (Loss) Attributable to Virtus Investment Partners, Inc., As Adjusted $35,921 $41,362 $54,620 $72,661 $77,513 $87,952 $204,794
Weighted average shares outstanding - diluted, as adjusted 7,997 8,026 8,052 8,007 7,984 7,958 8,028
Earnings (Loss) Per Share - Diluted, As Adjusted $4.49 $5.15 $6.78 $9.07 $9.71 $11.05 $25.51

17
$ in thousands1 The non-GAAP financial information included in this presentation differs from financial information determined in accordance with U.S. GAAP as a result of presenting balance sheet
accounts before the consolidation of investment products
NON-GAAP INFORMATIONBALANCE SHEET 1 (UNAUDITED)
9/30/2020 12/31/2020 3/31/2021 6/30/2021 9/30/2021
Assets:
Cash and cash equivalents $202,212 $246,511 $228,260 $275,439 $437,242
Investments – seed capital 115,586 135,418 121,690 140,679 144,476
Investments – other 64,267 69,032 66,909 73,723 78,643
Investments – long term 22,805 24,955 26,747 27,327 27,490
Accounts receivable, net 78,175 85,975 117,658 121,591 128,229
Furniture, equipment, and leasehold improvements, net 15,287 14,488 13,489 12,896 12,429
Intangible assets, net 287,793 280,264 391,187 380,824 370,433
Goodwill 290,366 290,366 315,366 315,366 315,366
Deferred taxes, net 8,862 9,538 9,161 11,054 12,214
Other assets 39,807 36,288 33,909 48,039 41,291
Total Assets $1,125,160 $1,192,835 $1,324,376 $1,406,938 $1,567,813

$ in thousands1 The non-GAAP financial information included in this presentation differs from financial information determined in accordance with U.S. GAAP as a result of presenting balance sheet
accounts before the consolidation of investment products2 Defined as gross debt less deferred financing costs3 Represents the estimate of future AllianzGI related revenue participation payments accounted for as consideration4 Defined as cash and cash equivalents plus accounts receivable, net, less accrued compensation and benefits, accounts payable and accrued liabilities, dividends payable, required
debt principal payments due over next 12 months and actual AllianzGI revenue participation amounts earned as of the balance sheet date and due within 12 months
NON-GAAP INFORMATIONBALANCE SHEET 1 (CONTINUED) (UNAUDITED)
18
9/30/2020 12/31/2020 3/31/2021 6/30/2021 9/30/2021
Liabilities and Equity
Liabilities:
Accrued compensation and benefits $87,256 $122,514 $62,335 $96,509 $139,106
Accounts payable and accrued liabilities 21,633 25,357 55,153 45,755 41,716
Dividends payable 8,742 9,013 8,593 8,565 14,298
Other liabilities 35,833 36,119 37,442 38,386 37,105
Debt 2 218,014 201,212 195,726 190,224 266,739
Revenue participation liability 3 — — 137,664 137,664 137,664
Total Liabilities $371,478 $394,215 $496,913 $517,103 $636,628
Redeemable noncontrolling interests $74,626 $87,451 $98,059 $108,939 $118,861
Equity:
Equity attributable to Virtus Investment Partners, Inc. $679,056 $711,169 $729,404 $780,896 $812,324
Total Liabilities and Equity $1,125,160 $1,192,835 $1,324,376 $1,406,938 $1,567,813
Working Capital 4 $159,103 $171,950 $211,101 $229,201 $345,490
$ in thousands1 CIP represents to Consolidated Investment Products, revenues and expenses generated by operating activities of open-end funds, exchange traded funds, and collateralized loan
obligations (“CLOs”) that are consolidated in the financial statements
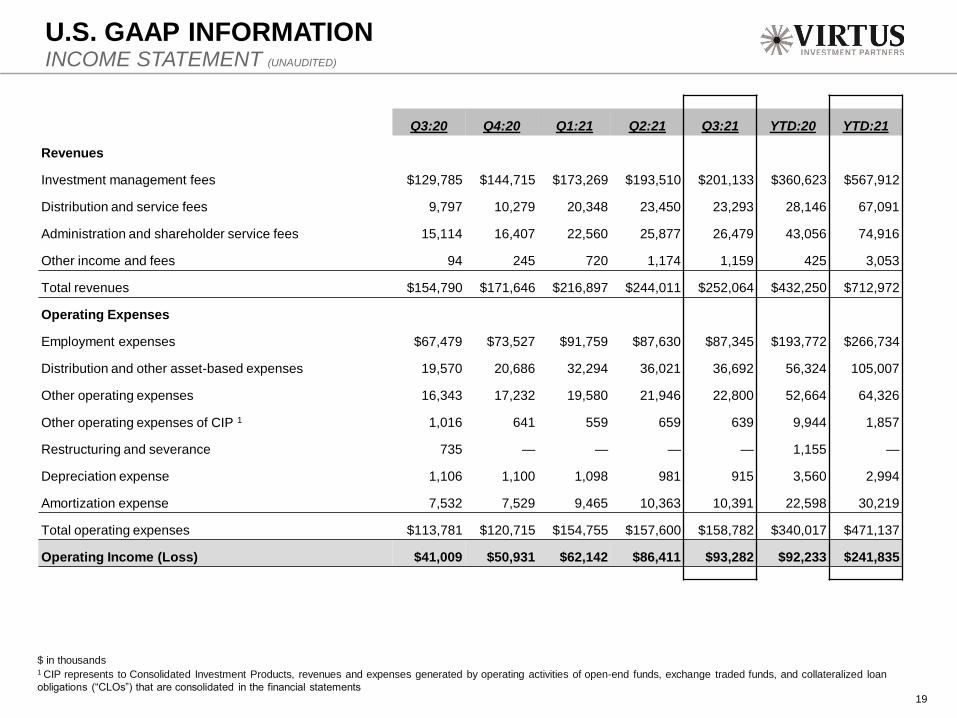
U.S. GAAP INFORMATIONINCOME STATEMENT (UNAUDITED)
19
Q3:20 Q4:20 Q1:21 Q2:21 Q3:21 YTD:20 YTD:21
Revenues
Investment management fees $129,785 $144,715 $173,269 $193,510 $201,133 $360,623 $567,912
Distribution and service fees 9,797 10,279 20,348 23,450 23,293 28,146 67,091
Administration and shareholder service fees 15,114 16,407 22,560 25,877 26,479 43,056 74,916
Other income and fees 94 245 720 1,174 1,159 425 3,053
Total revenues $154,790 $171,646 $216,897 $244,011 $252,064 $432,250 $712,972
Operating Expenses
Employment expenses $67,479 $73,527 $91,759 $87,630 $87,345 $193,772 $266,734
Distribution and other asset-based expenses 19,570 20,686 32,294 36,021 36,692 56,324 105,007
Other operating expenses 16,343 17,232 19,580 21,946 22,800 52,664 64,326
Other operating expenses of CIP 1 1,016 641 559 659 639 9,944 1,857
Restructuring and severance 735 — — — — 1,155 —
Depreciation expense 1,106 1,100 1,098 981 915 3,560 2,994
Amortization expense 7,532 7,529 9,465 10,363 10,391 22,598 30,219
Total operating expenses $113,781 $120,715 $154,755 $157,600 $158,782 $340,017 $471,137
Operating Income (Loss) $41,009 $50,931 $62,142 $86,411 $93,282 $92,233 $241,835

$ and shares in thousands1 CIP represents to Consolidated Investment Products, revenues and expenses generated by operating activities of open-end funds, exchange traded funds, and collateralized loan
obligations (“CLOs”) that are consolidated in the financial statements
U.S. GAAP INFORMATIONINCOME STATEMENT (CONTINUED) (UNAUDITED)
20
Q3:20 Q4:20 Q1:21 Q2:21 Q3:21 YTD:20 YTD:21
Other Income (Expense)
Realized and unrealized gain (loss) on investments, net $2,498 $5,071 $891 $2,494 ($504) $2,068 $2,881
Realized and unrealized gain (loss) of CIP 1, net 2,680 10,768 (4,687) 2,747 (2,801) (12,733) (4,741)
Other income (expense), net 999 1,070 1,771 826 1,001 806 3,598
Total other income (expense), net $6,177 $16,909 ($2,025) $6,067 ($2,304) ($9,859) $1,738
Interest Income (Expense)
Interest expense ($2,877) ($2,692) ($2,314) ($2,256) ($2,348) ($9,202) ($6,918)
Interest and dividend income 137 236 136 166 269 1,131 571
Interest and dividend income of CIP 1 26,088 25,697 23,876 22,562 22,877 83,951 69,315
Interest expense of CIP 1 (17,622) (15,179) (14,448) (14,452) (13,442) (70,258) (42,342)
Total interest income (expense), net $5,726 $8,062 $7,250 $6,020 $7,356 $5,622 $20,626
Income (Loss) Before Income Taxes $52,912 $75,902 $67,367 $98,498 $98,334 $87,996 $264,199
Income tax expense (benefit) 11,978 14,088 15,153 22,401 25,823 29,847 63,377
Net Income (Loss) $40,934 $61,814 $52,214 $76,097 $72,511 $58,149 $200,822
Noncontrolling interests (11,286) (18,499) (15,626) (13,130) (13,775) (21,507) (42,531)
Net Income (Loss) Attributable to Virtus Investment Partners, Inc. $29,648 $43,315 $36,588 $62,967 $58,736 $36,642 $158,291
Weighted average shares outstanding - diluted 7,997 8,026 8,052 8,007 7,984 7,958 8,028
Earnings (Loss) Per Share - Diluted $3.71 $5.40 $4.54 $7.86 $7.36 $4.60 $19.72
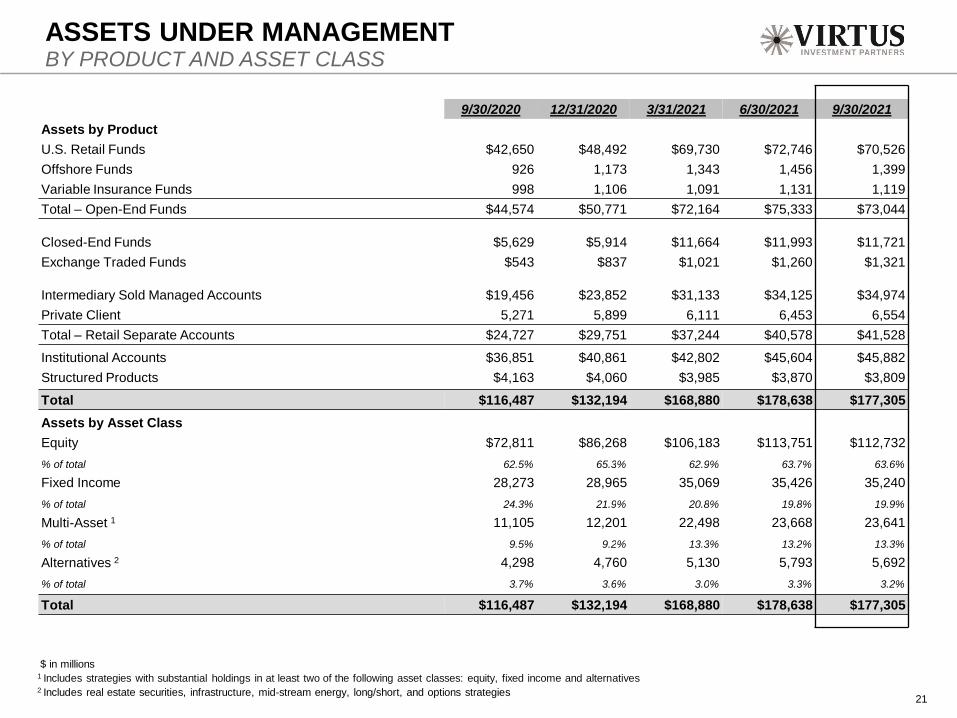
$ in millions1 Includes strategies with substantial holdings in at least two of the following asset classes: equity, fixed income and alternatives2 Includes real estate securities, infrastructure, mid-stream energy, long/short, and options strategies
ASSETS UNDER MANAGEMENTBY PRODUCT AND ASSET CLASS
21
9/30/2020 12/31/2020 3/31/2021 6/30/2021 9/30/2021
Assets by Product
U.S. Retail Funds $42,650 $48,492 $69,730 $72,746 $70,526
Offshore Funds 926 1,173 1,343 1,456 1,399
Variable Insurance Funds 998 1,106 1,091 1,131 1,119
Total – Open-End Funds $44,574 $50,771 $72,164 $75,333 $73,044
Closed-End Funds $5,629 $5,914 $11,664 $11,993 $11,721
Exchange Traded Funds $543 $837 $1,021 $1,260 $1,321
Intermediary Sold Managed Accounts $19,456 $23,852 $31,133 $34,125 $34,974
Private Client 5,271 5,899 6,111 6,453 6,554
Total – Retail Separate Accounts $24,727 $29,751 $37,244 $40,578 $41,528
Institutional Accounts $36,851 $40,861 $42,802 $45,604 $45,882
Structured Products $4,163 $4,060 $3,985 $3,870 $3,809
Total $116,487 $132,194 $168,880 $178,638 $177,305
Assets by Asset Class
Equity $72,811 $86,268 $106,183 $113,751 $112,732
% of total 62.5% 65.3% 62.9% 63.7% 63.6%
Fixed Income 28,273 28,965 35,069 35,426 35,240
% of total 24.3% 21.9% 20.8% 19.8% 19.9%
Multi-Asset 1 11,105 12,201 22,498 23,668 23,641
% of total 9.5% 9.2% 13.3% 13.2% 13.3%
Alternatives 2 4,298 4,760 5,130 5,793 5,692
% of total 3.7% 3.6% 3.0% 3.3% 3.2%
Total $116,487 $132,194 $168,880 $178,638 $177,305
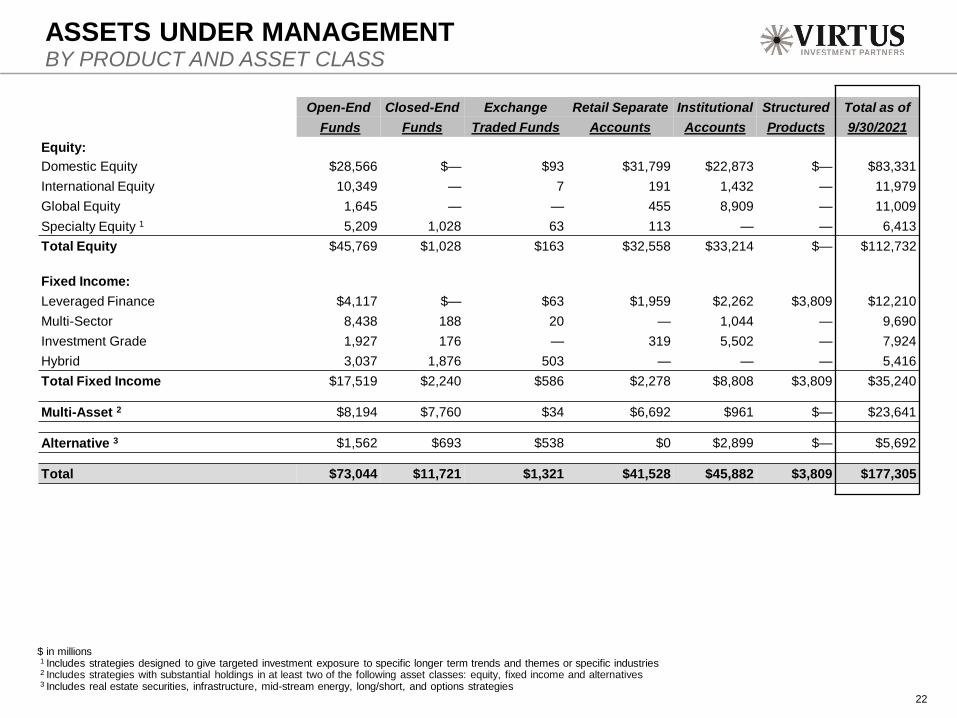
$ in millions1 Includes strategies designed to give targeted investment exposure to specific longer term trends and themes or specific industries2 Includes strategies with substantial holdings in at least two of the following asset classes: equity, fixed income and alternatives3 Includes real estate securities, infrastructure, mid-stream energy, long/short, and options strategies
ASSETS UNDER MANAGEMENTBY PRODUCT AND ASSET CLASS
22
Open-End Closed-End Exchange Retail Separate Institutional Structured Total as of
Funds Funds Traded Funds Accounts Accounts Products 9/30/2021
Equity:
Domestic Equity $28,566 $— $93 $31,799 $22,873 $— $83,331
International Equity 10,349 — 7 191 1,432 — 11,979
Global Equity 1,645 — — 455 8,909 — 11,009
Specialty Equity 1 5,209 1,028 63 113 — — 6,413
Total Equity $45,769 $1,028 $163 $32,558 $33,214 $— $112,732
Fixed Income:
Leveraged Finance $4,117 $— $63 $1,959 $2,262 $3,809 $12,210
Multi-Sector 8,438 188 20 — 1,044 — 9,690
Investment Grade 1,927 176 — 319 5,502 — 7,924
Hybrid 3,037 1,876 503 — — — 5,416
Total Fixed Income $17,519 $2,240 $586 $2,278 $8,808 $3,809 $35,240
Multi-Asset 2 $8,194 $7,760 $34 $6,692 $961 $— $23,641
Alternative 3 $1,562 $693 $538 $0 $2,899 $— $5,692
Total $73,044 $11,721 $1,321 $41,528 $45,882 $3,809 $177,305

$ in millions1 Represents open-end and closed-end fund distributions net of reinvestments, the net change in assets from cash management strategies, and the impact on net flows from non-
sales related activities such as asset acquisitions/(dispositions), seed capital investments/(withdrawals), structured products reset transactions, and the use of leverage2 Annualized flows divided by beginning of period AUM
ASSET FLOWSTOTAL
23
9/30/2020 12/31/2020 3/31/2021 6/30/2021 9/30/2021 YTD:20 YTD:21
Total
Beginning balance $108,461 $116,487 $132,194 $168,880 $178,638 $108,904 $132,194
Inflows 7,874 8,941 10,611 9,550 7,623 24,487 27,784
Outflows (6,603) (6,249) (8,178) (8,214) (8,195) (21,826) (24,587)
Net Flows 1,271 2,692 2,433 1,336 (572) 2,661 3,197
Market performance 7,122 13,431 4,690 8,782 (453) 5,793 13,019
Other 1 (367) (416) 29,563 (360) (308) (871) 28,895
Ending Balance - Total $116,487 $132,194 $168,880 $178,638 $177,305 $116,487 $177,305
Inflow Rate 2 28.9 % 30.5 % 32.6 % 22.7 % 16.9 % 30.0 % 28.1 %
Outflow Rate 2 (24.2)% (21.3)% (25.1)% (19.5)% (18.2)% (26.8)% (24.9)%
Net Flow Rate 2 4.7 % 9.2 % 7.5 % 3.2 % (1.3)% 3.3 % 3.2 %

$ in millions1 Represents open-end and closed-end fund distributions net of reinvestments, the net change in assets from cash management strategies, and the impact on net flows from non-
sales related activities such as asset acquisitions/(dispositions), seed capital investments/(withdrawals), structured products reset transactions, and the use of leverage2 Represents assets under management of Undertakings for Collective Investments in Transferable Securities (“UCITS”)
ASSET FLOWSBY PRODUCT
24
9/30/2020 12/31/2020 3/31/2021 6/30/2021 9/30/2021 YTD:20 YTD:21
U.S. Retail Funds
Beginning balance $39,520 $42,650 $48,492 $69,730 $72,746 $42,412 $48,492
Inflows 3,553 4,049 5,652 4,591 3,555 12,062 13,798
Outflows (3,189) (3,408) (5,157) (4,864) (4,964) (12,927) (14,985)
Net Flows 364 641 495 (273) (1,409) (865) (1,187)
Market performance 2,856 5,456 1,074 3,345 (735) 1,310 3,684
Other 1 (90) (255) 19,669 (56) (76) (207) 19,537
Ending Balance $42,650 $48,492 $69,730 $72,746 $70,526 $42,650 $70,526
Offshore Funds 2
Beginning balance $686 $926 $1,173 $1,343 $1,456 $463 $1,173
Inflows 435 226 191 139 66 678 396
Outflows (277) (90) (61) (83) (105) (337) (249)
Net Flows 158 136 130 56 (39) 341 147
Market performance 63 111 41 57 (18) 100 80
Other 1 19 — (1) — — 22 (1)
Ending Balance $926 $1,173 $1,343 $1,456 $1,399 $926 $1,399
$ in millions1 Represents open-end and closed-end fund distributions net of reinvestments, the net change in assets from cash management strategies, and the impact on net flows from non-
sales related activities such as asset acquisitions/(dispositions), seed capital investments/(withdrawals), structured products reset transactions, and the use of leverage
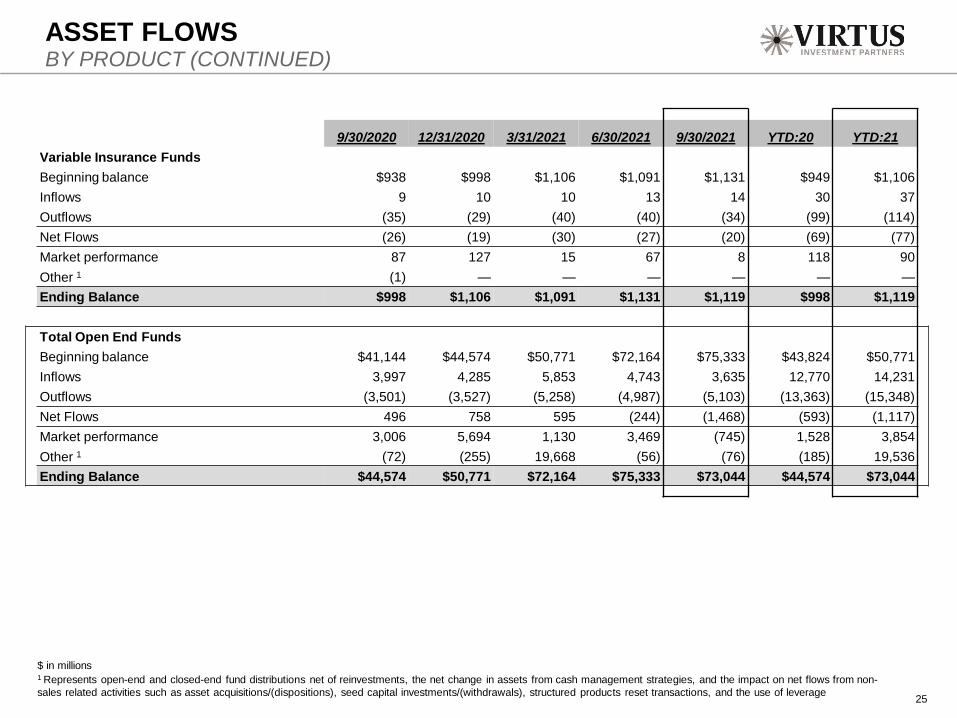
ASSET FLOWSBY PRODUCT (CONTINUED)
25
9/30/2020 12/31/2020 3/31/2021 6/30/2021 9/30/2021 YTD:20 YTD:21
Variable Insurance Funds
Beginning balance $938 $998 $1,106 $1,091 $1,131 $949 $1,106
Inflows 9 10 10 13 14 30 37
Outflows (35) (29) (40) (40) (34) (99) (114)
Net Flows (26) (19) (30) (27) (20) (69) (77)
Market performance 87 127 15 67 8 118 90
Other 1 (1) — — — — — —
Ending Balance $998 $1,106 $1,091 $1,131 $1,119 $998 $1,119
Total Open End Funds
Beginning balance $41,144 $44,574 $50,771 $72,164 $75,333 $43,824 $50,771
Inflows 3,997 4,285 5,853 4,743 3,635 12,770 14,231
Outflows (3,501) (3,527) (5,258) (4,987) (5,103) (13,363) (15,348)
Net Flows 496 758 595 (244) (1,468) (593) (1,117)
Market performance 3,006 5,694 1,130 3,469 (745) 1,528 3,854
Other 1 (72) (255) 19,668 (56) (76) (185) 19,536
Ending Balance $44,574 $50,771 $72,164 $75,333 $73,044 $44,574 $73,044

$ in millions1 Represents open-end and closed-end fund distributions net of reinvestments, the net change in assets from cash management strategies, and the impact on net flows from non-
sales related activities such as asset acquisitions/(dispositions), seed capital investments/(withdrawals), structured products reset transactions, and the use of leverage
ASSET FLOWSBY PRODUCT (CONTINUED)
26
9/30/2020 12/31/2020 3/31/2021 6/30/2021 9/30/2021 YTD:20 YTD:21
Closed-End Funds
Beginning balance $5,639 $5,629 $5,914 $11,664 $11,993 $6,748 $5,914
Inflows 15 5 — — 3 20 3
Outflows — — — — — — —
Net Flows 15 5 — — 3 20 3
Market performance 54 364 105 514 (114) (751) 505
Other 1 (79) (84) 5,645 (185) (161) (388) 5,299
Ending Balance $5,629 $5,914 $11,664 $11,993 $11,721 $5,629 $11,721
Exchange Traded Funds
Beginning balance $541 $543 $837 $1,021 $1,260 $1,156 $837
Inflows 60 218 175 232 174 220 581
Outflows (35) (40) (77) (92) (65) (408) (234)
Net Flows 25 178 98 140 109 (188) 347
Market performance (12) 126 98 104 (30) (380) 172
Other 1 (11) (10) (12) (5) (18) (45) (35)
Ending Balance $543 $837 $1,021 $1,260 $1,321 $543 $1,321
$ in millions1 Represents open-end and closed-end fund distributions net of reinvestments, the net change in assets from cash management strategies, and the impact on net flows from non-
sales related activities such as asset acquisitions/(dispositions), seed capital investments/(withdrawals), structured products reset transactions, and the use of leverage
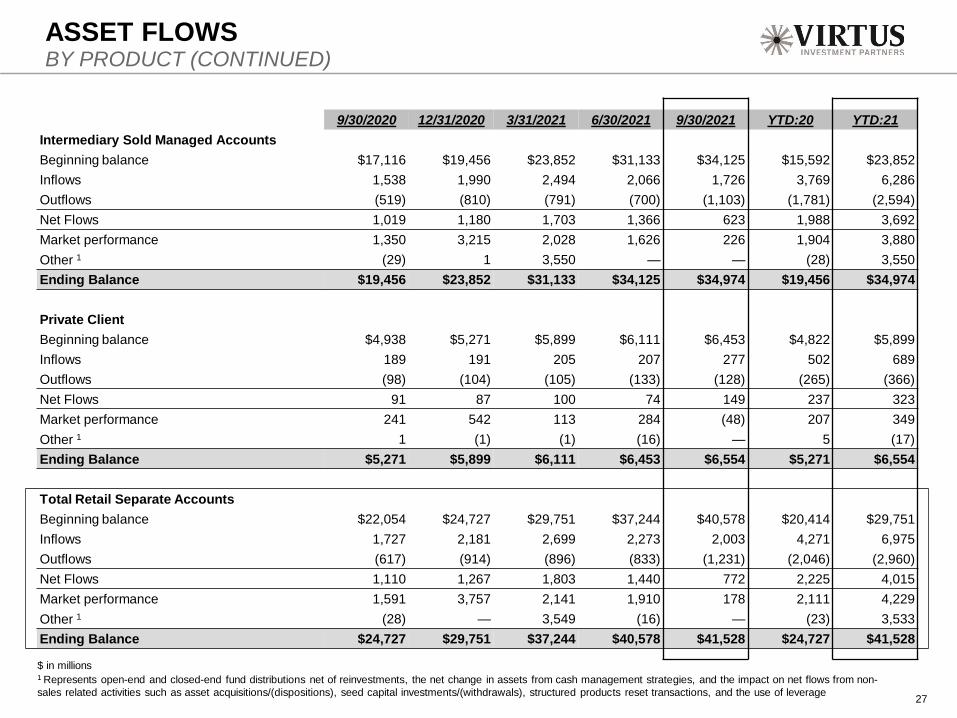
ASSET FLOWSBY PRODUCT (CONTINUED)
27
9/30/2020 12/31/2020 3/31/2021 6/30/2021 9/30/2021 YTD:20 YTD:21
Intermediary Sold Managed Accounts
Beginning balance $17,116 $19,456 $23,852 $31,133 $34,125 $15,592 $23,852
Inflows 1,538 1,990 2,494 2,066 1,726 3,769 6,286
Outflows (519) (810) (791) (700) (1,103) (1,781) (2,594)
Net Flows 1,019 1,180 1,703 1,366 623 1,988 3,692
Market performance 1,350 3,215 2,028 1,626 226 1,904 3,880
Other 1 (29) 1 3,550 — — (28) 3,550
Ending Balance $19,456 $23,852 $31,133 $34,125 $34,974 $19,456 $34,974
Private Client
Beginning balance $4,938 $5,271 $5,899 $6,111 $6,453 $4,822 $5,899
Inflows 189 191 205 207 277 502 689
Outflows (98) (104) (105) (133) (128) (265) (366)
Net Flows 91 87 100 74 149 237 323
Market performance 241 542 113 284 (48) 207 349
Other 1 1 (1) (1) (16) — 5 (17)
Ending Balance $5,271 $5,899 $6,111 $6,453 $6,554 $5,271 $6,554
Total Retail Separate Accounts
Beginning balance $22,054 $24,727 $29,751 $37,244 $40,578 $20,414 $29,751
Inflows 1,727 2,181 2,699 2,273 2,003 4,271 6,975
Outflows (617) (914) (896) (833) (1,231) (2,046) (2,960)
Net Flows 1,110 1,267 1,803 1,440 772 2,225 4,015
Market performance 1,591 3,757 2,141 1,910 178 2,111 4,229
Other 1 (28) — 3,549 (16) — (23) 3,533
Ending Balance $24,727 $29,751 $37,244 $40,578 $41,528 $24,727 $41,528

$ in millions1 Represents open-end and closed-end fund distributions net of reinvestments, the net change in assets from cash management strategies, and the impact on net flows from non-
sales related activities such as asset acquisitions/(dispositions), seed capital investments/(withdrawals), structured products reset transactions, and the use of leverage
ASSET FLOWSBY PRODUCT (CONTINUED)
28
9/30/2020 12/31/2020 3/31/2021 6/30/2021 9/30/2021 YTD:20 YTD:21
Institutional Accounts
Beginning balance $34,819 $36,851 $40,861 $42,802 $45,604 $32,859 $40,861
Inflows 2,075 2,252 1,884 2,302 1,808 6,715 5,994
Outflows (2,381) (1,687) (1,868) (2,184) (1,727) (5,825) (5,779)
Net Flows (306) 565 16 118 81 890 215
Market performance 2,473 3,481 1,181 2,752 222 3,203 4,155
Other 1 (135) (36) 744 (68) (25) (101) 651
Ending Balance $36,851 $40,861 $42,802 $45,604 $45,882 $36,851 $45,882
Structured Products
Beginning balance $4,264 $4,163 $4,060 $3,985 $3,870 $3,903 $4,060
Inflows — — — — — 491 —
Outflows (69) (81) (79) (118) (69) (184) (266)
Net Flows (69) (81) (79) (118) (69) 307 (266)
Market performance 10 9 35 33 36 82 104
Other 1 (42) (31) (31) (30) (28) (129) (89)
Ending Balance $4,163 $4,060 $3,985 $3,870 $3,809 $4,163 $3,809
$ in millions1 Represents open-end and closed-end fund distributions net of reinvestments, the net change in assets from cash management strategies, and the impact on net flows from non-
sales related activities such as asset acquisitions/(dispositions), seed capital investments/(withdrawals), structured products reset transactions and the use of leverage
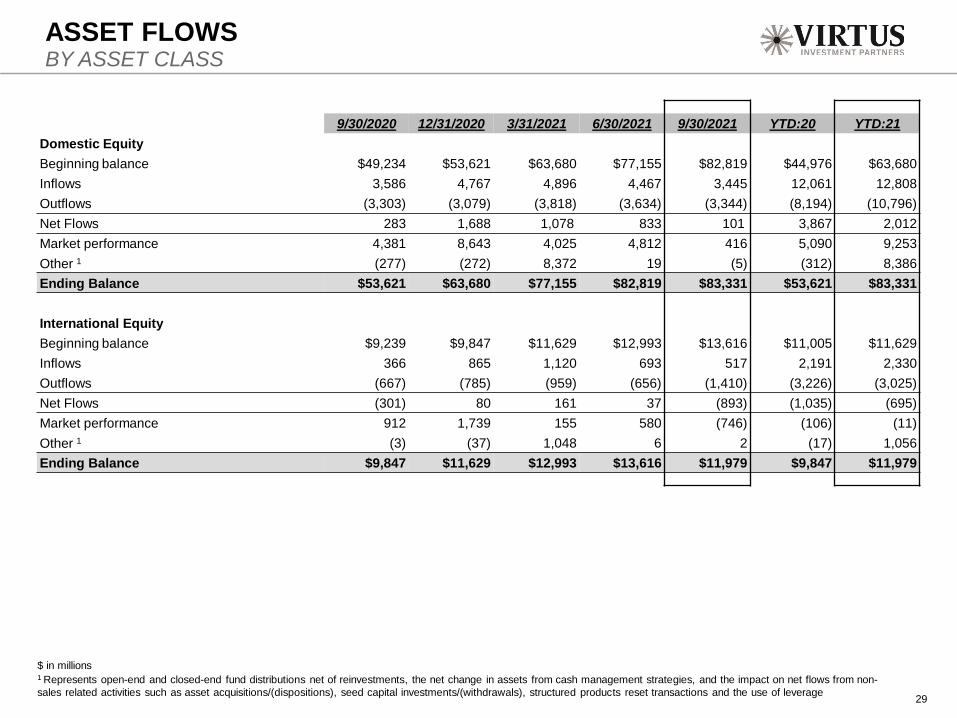
ASSET FLOWSBY ASSET CLASS
29
9/30/2020 12/31/2020 3/31/2021 6/30/2021 9/30/2021 YTD:20 YTD:21
Domestic Equity
Beginning balance $49,234 $53,621 $63,680 $77,155 $82,819 $44,976 $63,680
Inflows 3,586 4,767 4,896 4,467 3,445 12,061 12,808
Outflows (3,303) (3,079) (3,818) (3,634) (3,344) (8,194) (10,796)
Net Flows 283 1,688 1,078 833 101 3,867 2,012
Market performance 4,381 8,643 4,025 4,812 416 5,090 9,253
Other 1 (277) (272) 8,372 19 (5) (312) 8,386
Ending Balance $53,621 $63,680 $77,155 $82,819 $83,331 $53,621 $83,331
International Equity
Beginning balance $9,239 $9,847 $11,629 $12,993 $13,616 $11,005 $11,629
Inflows 366 865 1,120 693 517 2,191 2,330
Outflows (667) (785) (959) (656) (1,410) (3,226) (3,025)
Net Flows (301) 80 161 37 (893) (1,035) (695)
Market performance 912 1,739 155 580 (746) (106) (11)
Other 1 (3) (37) 1,048 6 2 (17) 1,056
Ending Balance $9,847 $11,629 $12,993 $13,616 $11,979 $9,847 $11,979

$ in millions1 Includes strategies designed to give targeted investment exposure to specific longer term trends and themes or specific industries2 Represents open-end and closed-end fund distributions net of reinvestments, the net change in assets from cash management strategies, and the impact on net flows from non-
sales related activities such as asset acquisitions/(dispositions), seed capital investments/(withdrawals), structured products reset transactions and the use of leverage
ASSET FLOWSBY ASSET CLASS (CONTINUED)
30
9/30/2020 12/31/2020 3/31/2021 6/30/2021 9/30/2021 YTD:20 YTD:21
Global Equity
Beginning balance $7,022 $8,299 $9,512 $9,681 $10,623 $6,422 $9,512
Inflows 1,134 731 501 669 732 1,909 1,902
Outflows (627) (232) (617) (404) (308) (1,268) (1,329)
Net Flows 507 499 (116) 265 424 641 573
Market performance 769 712 198 675 (39) 1,233 834
Other 2 1 2 87 2 1 3 90
Ending Balance $8,299 $9,512 $9,681 $10,623 $11,009 $8,299 $11,009
Specialty Equity 1
Beginning balance $710 $1,044 $1,447 $6,354 $6,693 $208 $1,447
Inflows 317 369 639 394 234 819 1,267
Outflows (113) (180) (512) (525) (464) (264) (1,501)
Net Flows 204 189 127 (131) (230) 555 (234)
Market performance 140 241 (161) 488 (40) 289 287
Other 2 (10) (27) 4,941 (18) (10) (8) 4,913
Ending Balance $1,044 $1,447 $6,354 $6,693 $6,413 $1,044 $6,413
Total Equity
Beginning balance $66,205 $72,811 $86,268 $106,183 $113,751 $62,611 $86,268
Inflows 5,403 6,732 7,156 6,223 4,928 16,980 18,307
Outflows (4,710) (4,276) (5,906) (5,219) (5,526) (12,952) (16,651)
Net Flows 693 2,456 1,250 1,004 (598) 4,028 1,656
Market performance 6,202 11,335 4,217 6,555 (409) 6,506 10,363
Other 2 (289) (334) 14,448 9 (12) (334) 14,445
Ending Balance $72,811 $86,268 $106,183 $113,751 $112,732 $72,811 $112,732
$ in millions1 Represents open-end and closed-end fund distributions net of reinvestments, the net change in assets from cash management strategies, and the impact on net flows from non-
sales related activities such as asset acquisitions/(dispositions), seed capital investments/(withdrawals), structured products reset transactions, and the use of leverage
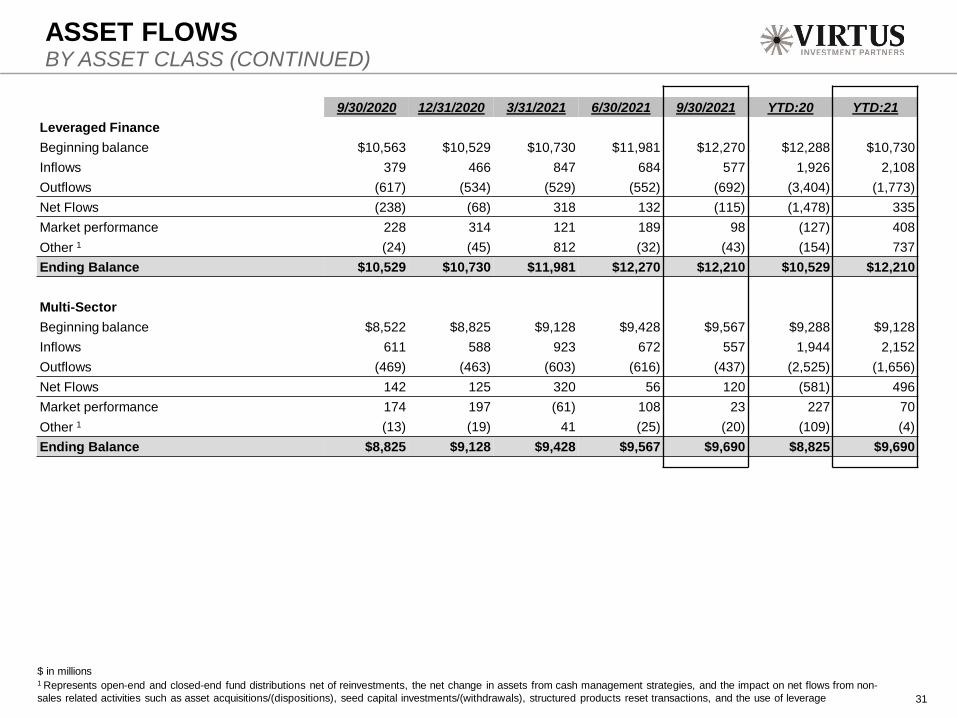
ASSET FLOWSBY ASSET CLASS (CONTINUED)
31
9/30/2020 12/31/2020 3/31/2021 6/30/2021 9/30/2021 YTD:20 YTD:21
Leveraged Finance
Beginning balance $10,563 $10,529 $10,730 $11,981 $12,270 $12,288 $10,730
Inflows 379 466 847 684 577 1,926 2,108
Outflows (617) (534) (529) (552) (692) (3,404) (1,773)
Net Flows (238) (68) 318 132 (115) (1,478) 335
Market performance 228 314 121 189 98 (127) 408
Other 1 (24) (45) 812 (32) (43) (154) 737
Ending Balance $10,529 $10,730 $11,981 $12,270 $12,210 $10,529 $12,210
Multi-Sector
Beginning balance $8,522 $8,825 $9,128 $9,428 $9,567 $9,288 $9,128
Inflows 611 588 923 672 557 1,944 2,152
Outflows (469) (463) (603) (616) (437) (2,525) (1,656)
Net Flows 142 125 320 56 120 (581) 496
Market performance 174 197 (61) 108 23 227 70
Other 1 (13) (19) 41 (25) (20) (109) (4)
Ending Balance $8,825 $9,128 $9,428 $9,567 $9,690 $8,825 $9,690
$ in millions1 Represents open-end and closed-end fund distributions net of reinvestments, the net change in assets from cash management strategies, and the impact on net flows from non-
sales related activities such as asset acquisitions/(dispositions), seed capital investments/(withdrawals), structured products reset transactions, and the use of leverage
ASSET FLOWSBY ASSET CLASS (CONTINUED)
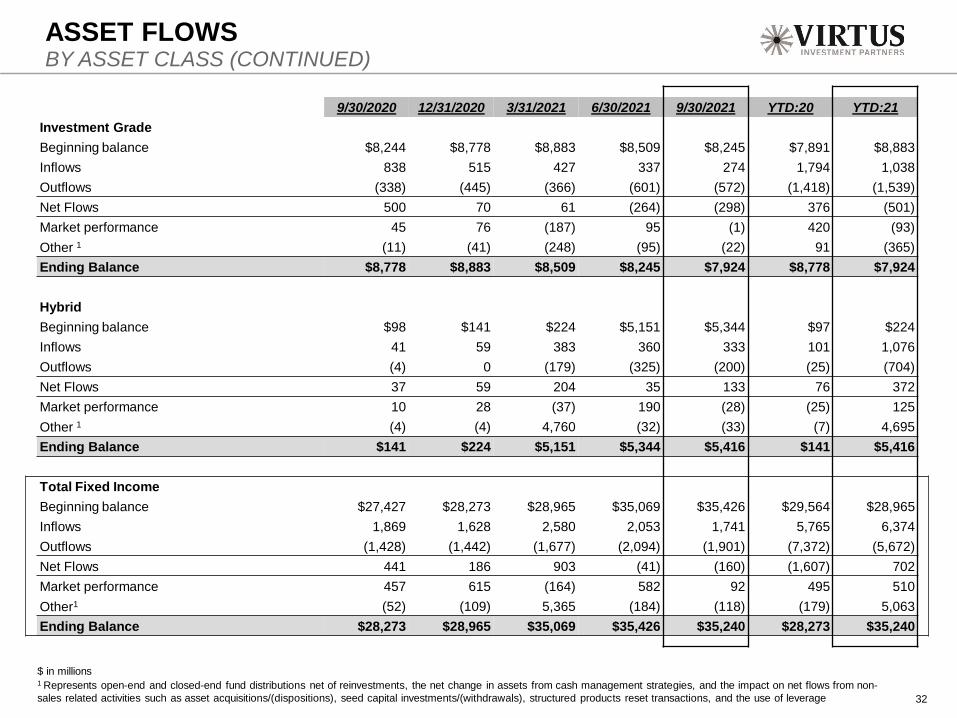
32
9/30/2020 12/31/2020 3/31/2021 6/30/2021 9/30/2021 YTD:20 YTD:21
Investment Grade
Beginning balance $8,244 $8,778 $8,883 $8,509 $8,245 $7,891 $8,883
Inflows 838 515 427 337 274 1,794 1,038
Outflows (338) (445) (366) (601) (572) (1,418) (1,539)
Net Flows 500 70 61 (264) (298) 376 (501)
Market performance 45 76 (187) 95 (1) 420 (93)
Other 1 (11) (41) (248) (95) (22) 91 (365)
Ending Balance $8,778 $8,883 $8,509 $8,245 $7,924 $8,778 $7,924
Hybrid
Beginning balance $98 $141 $224 $5,151 $5,344 $97 $224
Inflows 41 59 383 360 333 101 1,076
Outflows (4) 0 (179) (325) (200) (25) (704)
Net Flows 37 59 204 35 133 76 372
Market performance 10 28 (37) 190 (28) (25) 125
Other 1 (4) (4) 4,760 (32) (33) (7) 4,695
Ending Balance $141 $224 $5,151 $5,344 $5,416 $141 $5,416
Total Fixed Income
Beginning balance $27,427 $28,273 $28,965 $35,069 $35,426 $29,564 $28,965
Inflows 1,869 1,628 2,580 2,053 1,741 5,765 6,374
Outflows (1,428) (1,442) (1,677) (2,094) (1,901) (7,372) (5,672)
Net Flows 441 186 903 (41) (160) (1,607) 702
Market performance 457 615 (164) 582 92 495 510
Other1 (52) (109) 5,365 (184) (118) (179) 5,063
Ending Balance $28,273 $28,965 $35,069 $35,426 $35,240 $28,273 $35,240
$ in millions1 Includes strategies with substantial holdings in at least two of the following asset classes: equity, fixed income and alternatives2 Represents open-end and closed-end fund distributions net of reinvestments, the net change in assets from cash management strategies, and the impact on net flows from non-
sales related activities such as asset acquisitions/(dispositions), seed capital investments/(withdrawals), structured products reset transactions, and the use of leverage3 Consists of real estate securities, mid-stream energy securities, master limited partnerships, options strategies long/short equity, and other
ASSET FLOWSBY ASSET CLASS (CONTINUED)
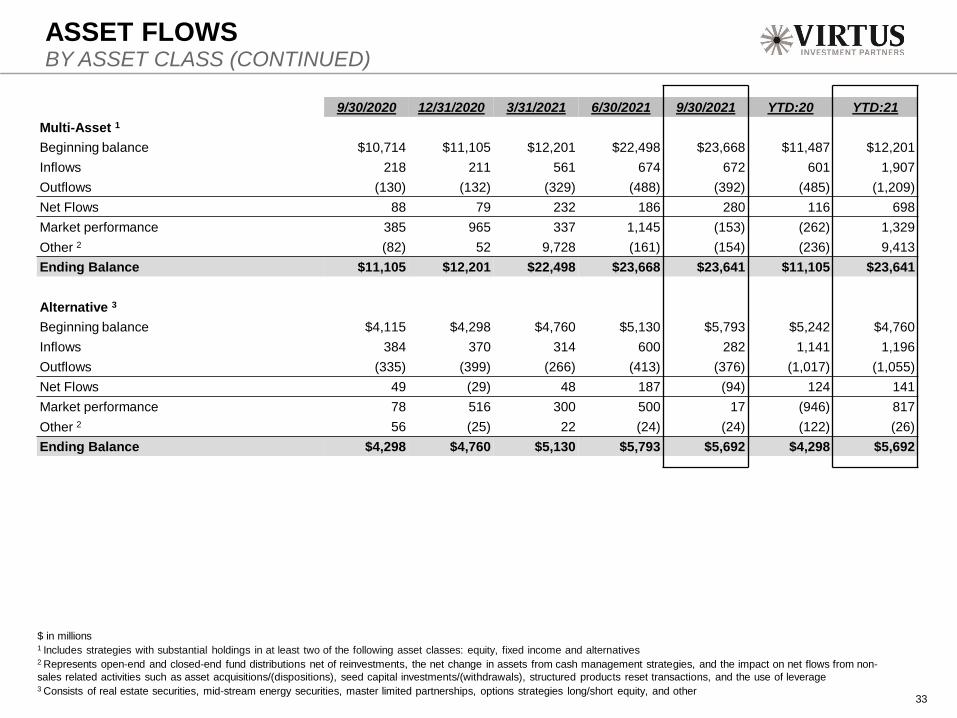
33
9/30/2020 12/31/2020 3/31/2021 6/30/2021 9/30/2021 YTD:20 YTD:21
Multi-Asset 1
Beginning balance $10,714 $11,105 $12,201 $22,498 $23,668 $11,487 $12,201
Inflows 218 211 561 674 672 601 1,907
Outflows (130) (132) (329) (488) (392) (485) (1,209)
Net Flows 88 79 232 186 280 116 698
Market performance 385 965 337 1,145 (153) (262) 1,329
Other 2 (82) 52 9,728 (161) (154) (236) 9,413
Ending Balance $11,105 $12,201 $22,498 $23,668 $23,641 $11,105 $23,641
Alternative 3
Beginning balance $4,115 $4,298 $4,760 $5,130 $5,793 $5,242 $4,760
Inflows 384 370 314 600 282 1,141 1,196
Outflows (335) (399) (266) (413) (376) (1,017) (1,055)
Net Flows 49 (29) 48 187 (94) 124 141
Market performance 78 516 300 500 17 (946) 817
Other 2 56 (25) 22 (24) (24) (122) (26)
Ending Balance $4,298 $4,760 $5,130 $5,793 $5,692 $4,298 $5,692

$ in millions1 Averages are calculated as follows: Funds – average daily or weekly balances; Retail Separate Accounts – prior quarter ending balance; Institutional Accounts – average of month-
end balances in quarter
INVESTMENT MANAGEMENT FEESAVERAGE ASSETS 1 BY PRODUCT
34
Q3:20 Q4:20 Q1:21 Q2:21 Q3:21 YTD:20 YTD:21
U.S. Retail Funds $41,773 $45,675 $63,872 $71,599 $72,476 $39,712 $69,316
Offshore Funds 842 1,049 1,265 1,411 1,453 $625 $1,376
Variable Insurance Funds 988 1,058 1,110 1,116 1,144 $921 $1,124
Total – Open-End Funds $43,603 $47,782 $66,247 $74,126 $75,073 $41,258 $71,816
Closed-End Funds $5,742 $5,847 $9,340 $11,936 $12,091 $5,944 $11,122
Exchange Traded Funds $549 $683 $890 $1,159 $1,295 $689 $1,114
Intermediary Sold Managed Accounts $17,116 $19,457 $26,219 $31,134 $34,125 $15,373 $30,493
Private Client 4,938 5,270 5,899 6,110 6,453 $4,670 $6,154
Total – Retail Separate Accounts $22,054 $24,727 $32,118 $37,244 $40,578 $20,043 $36,647
Institutional Accounts $36,771 $37,989 $41,764 $44,538 $46,739 $33,508 $44,347
Structured Products $4,171 $4,068 $3,985 $3,875 $3,803 $4,209 $3,888
Total $112,890 $121,096 $154,344 $172,878 $179,579 $105,651 $168,934

INVESTMENT MANAGEMENT FEESAVERAGE MANAGEMENT FEES EARNED 1 BY PRODUCT (IN BASIS POINTS)
35
Q3:20 Q4:20 Q1:21 Q2:21 Q3:21 YTD:20 YTD:21
Total Open-End Funds 57.9 59.1 54.2 52.2 52.2 57.2 52.9
Revenue related adjustments (7.5) (7.3) (6.2) (5.8) (5.9) (7.7) (6.0)
Total Open-End Funds, Net 50.4 51.8 48.0 46.4 46.3 49.5 46.9
Closed-End Funds, Net 62.1 62.2 56.2 55.1 56.2 62.2 55.8
Exchange Traded Funds 13.7 9.1 11.9 17.8 13.7 17.3 14.7
Revenue related adjustments (7.2) (5.8) (5.2) (3.8) (3.3) (9.8) (4.0)
Exchange Traded Funds, Net 6.5 3.3 6.7 14.0 10.4 7.5 10.7
Total Retail Separate Accounts 47.6 48.9 47.4 45.7 45.6 49.7 46.2
Revenue related adjustments (1.9) (1.8) (1.7) (1.5) (1.6) (2.0) (1.6)
Total Retail Separate Accounts, Net 45.7 47.1 45.7 44.2 44.0 47.7 44.6
Institutional Accounts 2, Net 31.5 34.6 31.5 32.2 31.0 30.6 31.6
Structured Products, Net 34.2 31.1 38.8 40.0 35.1 31.6 38.0
Total Assets 3 46.6 48.4 46.2 45.4 44.9 46.4 45.5
Revenue related adjustments (3.5) (3.5) (3.1) (2.9) (2.9) (3.5) (3.0)
Total Assets, Net 43.1 44.9 43.1 42.5 42.0 42.9 42.5
1 Represents investment management fees, as adjusted divided by average assets. Investment management fees, as adjusted exclude the impact of consolidated investment
products and are reduced by revenue related adjustments that are based on specific agreements and reflect the portion of investment management fees passed-through to third-
party client intermediaries for services to investors in sponsored investment products2 Includes incentive fees earned during the three months ended September 30, 2020, December 31, 2020, March 31, 2021, June 30, 2021, and September 30, 2021 that increased
the fee rate by 2.1 basis points, 3.9 basis points, 0.6 basis points, 0.7 basis points and 0.5 basis points, respectively 3 Includes incentive fees earned during the three months ended September 30, 2020, December 31, 2020, March 31, 2021, June 30, 2021, and September 30, 2021 that increased
the fee rate by 0.7, 1.2, 0.2, 0.2 basis points and 0.1 basis points, respectively

$ and share counts in thousands, except per share data; See notes to reconciliation starting on page 43
RECONCILIATION: U.S. GAAP TO NON-GAAPQ3 2021 (UNAUDITED)
36
Reclassification Other adjustments
U.S. GAAP Basis
Consolidated investment products
Revenue related
Amortization of intangible
assets
Seed capital and CLO
investments
Acquisition and
integration OtherNon-GAAP
Basis
Revenues
Investment management fees 201,133 2,292 (13,396) — — — — 190,029
Distribution and service fees 23,293 3 (23,296) — — — — —
Administration and shareholder service fees 26,479 3 — — — — — 26,482
Other income and fees 1,159 — — — — — — 1,159
Total revenues 252,064 2,298 (36,692) — — — — 217,670
Operating Expenses
Employment expenses 87,345 — — — — (429) (445) 86,471
Distribution and other asset-based expenses 36,692 — (36,692) — — — — —
Other operating expenses 22,800 — — — — (1,842) (785) 20,173
Operating expenses of CIP 639 (639) — — — — — —
Depreciation expense 915 — — — — — — 915
Amortization expense 10,391 — — (10,391) — — — —
Total operating expenses 158,782 (639) (36,692) (10,391) — (2,271) (1,230) 107,559
Operating Income (Loss) 93,282 2,937 — 10,391 — 2,271 1,230 110,111
Other Income (Expense)
Realized and unrealized gain (loss) on investments, net (504) 2,638 — — (2,110) — — 24
Realized and unrealized gain (loss) of CIP, net (2,801) 2,801 — — — — — —
Other income (expense), net 1,001 — — — — — — 1,001
Total other income (expense), net (2,304) 5,439 — — (2,110) — — 1,025
Interest Income (Expense)
Interest expense (2,348) — — — — — 180 (2,168)
Interest and dividend income 269 744 — — — — — 1,013
Interest and dividend income of CIP 22,877 (22,877) — — — — — —
Interest expense of CIP (13,442) 13,442 — — — — — —
Total interest income (expense), net 7,356 (8,691) — — — — 180 (1,155)
Income (Loss) Before Income Taxes 98,334 (315) — 10,391 (2,110) 2,271 1,410 109,981
Income tax expense (benefit) 25,823 — — 2,751 (779) 601 717 29,113
Net Income (Loss) 72,511 (315) — 7,640 (1,331) 1,670 693 80,868
Noncontrolling interests (13,775) 315 — (736) — — 10,841 (3,355)
Net Income (Loss) Attributable to Virtus Investment Partners, Inc. 58,736 — — 6,904 (1,331) 1,670 11,534 77,513
Earnings (Loss) Per Share - Diluted 7.36 9.71
Weighted Average Shares Outstanding - Diluted 7,984 7,984

RECONCILIATION: U.S. GAAP TO NON-GAAPQ2 2021(UNAUDITED)
37
Reclassification Other adjustments
U.S. GAAP Basis
Consolidated investment products
Revenue related
Amortization of intangible
assets
Seed capital and CLO
investments
Acquisition and
integration OtherNon-GAAP
Basis
Revenues
Investment management fees 193,510 2,290 (12,570) — — — — 183,230
Distribution and service fees 23,450 1 (23,451) — — — — —
Administration and shareholder service fees 25,877 49 — — — — — 25,926
Other income and fees 1,174 — — — — — — 1,174
Total revenues 244,011 2,340 (36,021) — — — — 210,330
Operating Expenses
Employment expenses 87,630 — — — — (615) (494) 86,521
Distribution and other asset-based expenses 36,021 — (36,021) — — — — —
Other operating expenses 21,946 — — — — (2,052) — 19,894
Operating expenses of CIP 659 (659) — — — — — —
Depreciation expense 981 — — — — — — 981
Amortization expense 10,363 — — (10,363) — — — —
Total operating expenses 157,600 (659) (36,021) (10,363) — (2,667) (494) 107,396
Operating Income (Loss) 86,411 2,999 — 10,363 — 2,667 494 102,934
Other Income (Expense)
Realized and unrealized gain (loss) on investments, net 2,494 5,707 — — (7,725) — — 476
Realized and unrealized gain (loss) of CIP, net 2,747 (2,747) — — — — — —
Other income (expense), net 826 — — — — — — 826
Total other income (expense), net 6,067 2,960 — — (7,725) — — 1,302
Interest Income (Expense)
Interest expense (2,256) — — — — — — (2,256)
Interest and dividend income 166 919 — — — — — 1,085
Interest and dividend income of CIP 22,562 (22,562) — — — — — —
Interest expense of CIP (14,452) 14,452 — — — — — —
Total interest income (expense), net 6,020 (7,191) — — — — — (1,171)
Income (Loss) Before Income Taxes 98,498 (1,232) — 10,363 (7,725) 2,667 494 103,065
Income tax expense (benefit) 22,401 — — 2,754 (521) 709 2,051 27,394
Net Income (Loss) 76,097 (1,232) — 7,609 (7,204) 1,958 (1,557) 75,671
Noncontrolling interests (13,130) 1,232 — (736) — — 9,624 (3,010)
Net Income (Loss) Attributable to Virtus Investment Partners, Inc. 62,967 — — 6,873 (7,204) 1,958 8,067 72,661
Earnings (Loss) Per Share - Diluted 7.86 9.07
Weighted Average Shares Outstanding - Diluted 8,007 8,007
$ and share counts in thousands, except per share data; See notes to reconciliation starting on page 43

$ and share counts in thousands, except per share data; See notes to reconciliation starting on page 43
RECONCILIATION: U.S. GAAP TO NON-GAAPQ1 2021 (UNAUDITED)
38
Reclassification Other adjustments
U.S. GAAP Basis
Consolidated investment products
Revenue related
Amortization of intangible
assets
Seed capital and CLO
investments
Acquisition and
integration OtherNon-GAAP
Basis
Revenues
Investment management fees 173,269 2,609 (11,943) — — — — 163,935
Distribution and service fees 20,348 3 (20,351) — — — — —
Administration and shareholder service fees 22,560 61 — — — — — 22,621
Other income and fees 720 — — — — — — 720
Total revenues 216,897 2,673 (32,294) — — — — 187,276
Operating Expenses
Employment expenses 91,759 — — — — (867) (480) 90,412
Distribution and other asset-based expenses 32,294 — (32,294) — — — — —
Other operating expenses 19,580 — — — — (1,780) — 17,800
Operating expenses of CIP 559 (559) — — — — — —
Depreciation expense 1,098 — — — — — — 1,098
Amortization expense 9,465 — — (9,465) — — — —
Total operating expenses 154,755 (559) (32,294) (9,465) — (2,647) (480) 109,310
Operating Income (Loss) 62,142 3,232 — 9,465 — 2,647 480 77,966
Other Income (Expense)
Realized and unrealized gain (loss) on investments, net 891 569 — — (1,533) — — (73)
Realized and unrealized gain (loss) of CIP, net (4,687) 4,687 — — — — — —
Other income (expense), net 1,771 — — — — — — 1,771
Total other income (expense), net (2,025) 5,256 — — (1,533) — — 1,698
Interest Income (Expense)
Interest expense (2,314) — — — — — — (2,314)
Interest and dividend income 136 910 — — — — — 1,046
Interest and dividend income of CIP 23,876 (23,876) — — — — — —
Interest expense of CIP (14,448) 14,448 — — — — — —
Total interest income (expense), net 7,250 (8,518) — — — — — (1,268)
Income (Loss) Before Income Taxes 67,367 (30) — 9,465 (1,533) 2,647 480 78,396
Income tax expense (benefit) 15,153 — — 2,528 (377) 707 2,931 20,942
Net Income (Loss) 52,214 (30) — 6,937 (1,156) 1,940 (2,451) 57,454
Noncontrolling interests (15,626) 30 — (736) — — 13,498 (2,834)
Net Income (Loss) Attributable to Virtus Investment Partners, Inc. 36,588 — — 6,201 (1,156) 1,940 11,047 54,620
Earnings (Loss) Per Share - Diluted 4.54 6.78
Weighted Average Shares Outstanding - Diluted 8,052 8,052

RECONCILIATION: U.S. GAAP TO NON-GAAPQ4 2020 (UNAUDITED)
39
Reclassification Other adjustments
U.S. GAAP Basis
Consolidated investment products Revenue related
Amortization of intangible
assets
Seed capital and CLO
investmentsAcquisition
and integration OtherNon-GAAP
Basis
Revenues
Investment management fees 144,715 2,512 (10,403) — — — — 136,824
Distribution and service fees 10,279 4 (10,283) — — — — —
Administration and shareholder service fees 16,407 65 — — — — — 16,472
Other income and fees 245 — — — — — — 245
Total revenues 171,646 2,581 (20,686) — — — — 153,541
Operating Expenses
Employment expenses 73,527 — — — — 515 (580) 73,462
Distribution and other asset-based expenses 20,686 — (20,686) — — — — —
Other operating expenses 17,232 — — — — (171) — 17,061
Operating expenses of CIP 641 (641) — — — — — —
Depreciation expense 1,100 — — — — — — 1,100
Amortization expense 7,529 — — (7,529) — — — —
Total operating expenses 120,715 (641) (20,686) (7,529) — 344 (580) 91,623
Operating Income (Loss) 50,931 3,222 — 7,529 — (344) 580 61,918
Other Income (Expense)
Realized and unrealized gain (loss) on investments, net 5,071 13,874 — — (18,798) — — 147
Realized and unrealized gain (loss) of CIP, net 10,768 (10,768) — — — — — —
Other income (expense), net 1,070 — — — — — — 1,070
Total other income (expense), net 16,909 3,106 — — (18,798) — — 1,217
Interest Income (Expense)
Interest expense (2,692) — — — — — — (2,692)
Interest and dividend income 236 898 — — — — — 1,134
Interest and dividend income of CIP 25,697 (25,697) — — — — — —
Interest expense of CIP (15,179) 15,179 — — — — — —
Total interest income (expense), net 8,062 (9,620) — — — — — (1,558)
Income (Loss) Before Income Taxes 75,902 (3,292) — 7,529 (18,798) (344) 580 61,577
Income tax expense (benefit) 14,088 — — 2,055 49 (94) 706 16,804
Net Income (Loss) 61,814 (3,292) — 5,474 (18,847) (250) (126) 44,773
Noncontrolling interests (18,499) 3,292 — (735) — — 12,531 (3,411)
Net Income (Loss) Attributable to Virtus Investment Partners, Inc. 43,315 — — 4,739 (18,847) (250) 12,405 41,362
Earnings (Loss) Per Share - Diluted 5.40 5.15
Weighted Average Shares Outstanding - Diluted 8,026 8,026
$ and share counts in thousands, except per share data; See notes to reconciliation starting on page 43

RECONCILIATION: U.S. GAAP TO NON-GAAPQ3 2020 (UNAUDITED)
40
Reclassification Other adjustments
U.S. GAAP Basis
Consolidated investment products
Revenue related
Restructuring and Severance
Amortization of intangible
assets
Seed capital and CLO
investments
Acquisition and
integration OtherNon-GAAP
Basis
Revenues
Investment management fees 129,785 2,344 (9,770) — — — — — 122,359
Distribution and service fees 9,797 3 (9,800) — — — — — —
Administration and shareholder service fees 15,114 66 — — — — — — 15,180
Other income and fees 94 — — — — — — — 94
Total revenues 154,790 2,413 (19,570) — — — — — 137,633
Operating Expenses
Employment expenses 67,479 — — — — — (999) (368) 66,112
Distribution and other asset-based expenses 19,570 — (19,570) — — — — — —
Other operating expenses 16,343 — — — — — — — 16,343
Operating expenses of CIP 1,016 (1,016) — — — — — — —
Restructuring and severance 735 — — (735) — — — — —
Depreciation expense 1,106 — — — — — — — 1,106
Amortization expense 7,532 — — — (7,532) — — — —
Total operating expenses 113,781 (1,016) (19,570) (735) (7,532) — (999) (368) 83,561
Operating Income (Loss) 41,009 3,429 — 735 7,532 — 999 368 54,072
Other Income (Expense)
Realized and unrealized gain (loss) on investments, net 2,498 6,170 — — — (8,873) — — (205)
Realized and unrealized gain (loss) of CIP, net 2,680 (2,680) — — — — — — —
Other income (expense), net 999 — — — — — — — 999
Total other income (expense), net 6,177 3,490 — — — (8,873) — — 794
Interest Income (Expense)
Interest expense (2,877) — — — — — — — (2,877)
Interest and dividend income 137 641 — — — — — — 778
Interest and dividend income of CIP 26,088 (26,088) — — — — — — —
Interest expense of CIP (17,622) 17,622 — — — — — — —
Total interest income (expense), net 5,726 (7,825) — — — — — — (2,099)
Income (Loss) Before Income Taxes 52,912 (906) — 735 7,532 (8,873) 999 368 52,767
Income tax expense (benefit) 11,978 — — 201 2,057 (963) 273 868 14,414
Net Income (Loss) 40,934 (906) — 534 5,475 (7,910) 726 (500) 38,353
Noncontrolling interests (11,286) 906 — — (736) — — 8,684 (2,432)
Net Income (Loss) Attributable to Virtus Investment Partners, Inc. 29,648 — — 534 4,739 (7,910) 726 8,184 35,921
Earnings (Loss) Per Share - Diluted 3.71 4.49
Weighted Average Shares Outstanding - Diluted 7,997 7,997
$ and share counts in thousands, except per share data; See notes to reconciliation starting on page 43
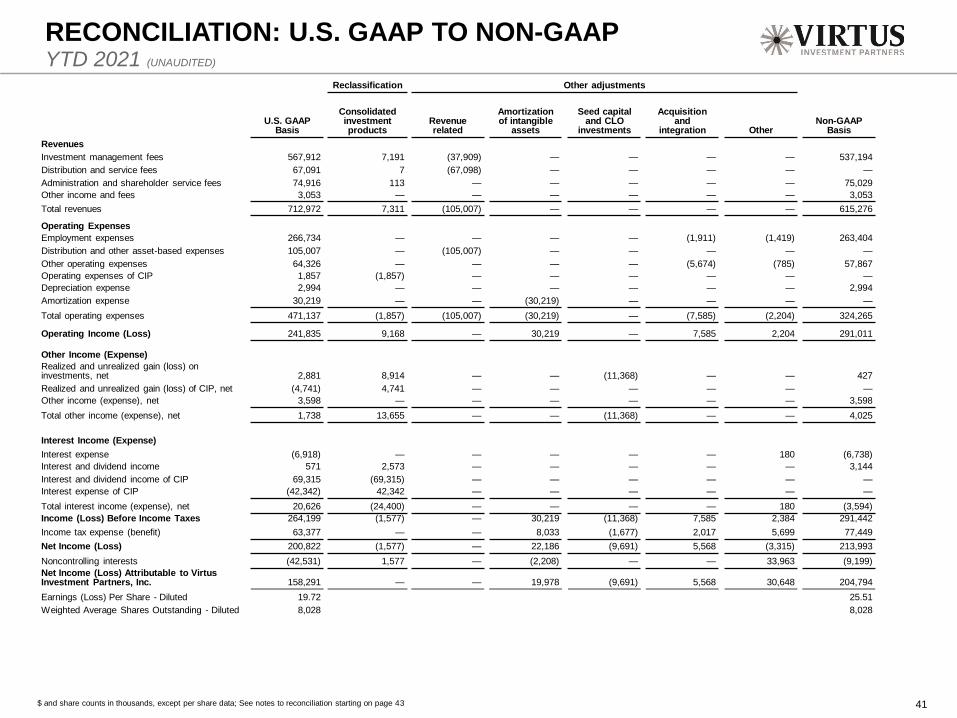
Reclassification Other adjustments
U.S. GAAP Basis
Consolidated investment products
Revenue related
Amortization of intangible
assets
Seed capital and CLO
investments
Acquisition and
integration OtherNon-GAAP
Basis
Revenues
Investment management fees 567,912 7,191 (37,909) — — — — 537,194
Distribution and service fees 67,091 7 (67,098) — — — — —
Administration and shareholder service fees 74,916 113 — — — — — 75,029
Other income and fees 3,053 — — — — — — 3,053
Total revenues 712,972 7,311 (105,007) — — — — 615,276
Operating Expenses
Employment expenses 266,734 — — — — (1,911) (1,419) 263,404
Distribution and other asset-based expenses 105,007 — (105,007) — — — — —
Other operating expenses 64,326 — — — — (5,674) (785) 57,867
Operating expenses of CIP 1,857 (1,857) — — — — — —
Depreciation expense 2,994 — — — — — — 2,994
Amortization expense 30,219 — — (30,219) — — — —
Total operating expenses 471,137 (1,857) (105,007) (30,219) — (7,585) (2,204) 324,265
Operating Income (Loss) 241,835 9,168 — 30,219 — 7,585 2,204 291,011
Other Income (Expense)
Realized and unrealized gain (loss) on investments, net 2,881 8,914 — — (11,368) — — 427
Realized and unrealized gain (loss) of CIP, net (4,741) 4,741 — — — — — —
Other income (expense), net 3,598 — — — — — — 3,598
Total other income (expense), net 1,738 13,655 — — (11,368) — — 4,025
Interest Income (Expense)
Interest expense (6,918) — — — — — 180 (6,738)
Interest and dividend income 571 2,573 — — — — — 3,144
Interest and dividend income of CIP 69,315 (69,315) — — — — — —
Interest expense of CIP (42,342) 42,342 — — — — — —
Total interest income (expense), net 20,626 (24,400) — — — — 180 (3,594)
Income (Loss) Before Income Taxes 264,199 (1,577) — 30,219 (11,368) 7,585 2,384 291,442
Income tax expense (benefit) 63,377 — — 8,033 (1,677) 2,017 5,699 77,449
Net Income (Loss) 200,822 (1,577) — 22,186 (9,691) 5,568 (3,315) 213,993
Noncontrolling interests (42,531) 1,577 — (2,208) — — 33,963 (9,199)
Net Income (Loss) Attributable to Virtus Investment Partners, Inc. 158,291 — — 19,978 (9,691) 5,568 30,648 204,794
Earnings (Loss) Per Share - Diluted 19.72 25.51
Weighted Average Shares Outstanding - Diluted 8,028 8,028
RECONCILIATION: U.S. GAAP TO NON-GAAPYTD 2021 (UNAUDITED)
41$ and share counts in thousands, except per share data; See notes to reconciliation starting on page 43

Reclassification Other adjustments
U.S. GAAP Basis
Consolidated investment products
Revenue related
Restructuring and Severance
Amortization of intangible
assets
Seed capital and CLO
investments
Acquisition and
integration OtherNon-GAAP
Basis
Revenues
Investment management fees 360,623 6,727 (28,170) — — — — — 339,180
Distribution and service fees 28,146 8 (28,154) — — — — — —
Administration and shareholder service fees 43,056 156 — — — — — — 43,212
Other income and fees 425 — — — — — — — 425
Total revenues 432,250 6,891 (56,324) — — — — — 382,817
Operating Expenses
Employment expenses 193,772 — — — — — (1,170) (609) 191,993
Distribution and other asset-based expenses 56,324 — (56,324) — — — — — —
Other operating expenses 52,664 — — — — — — — 52,664
Operating expenses of CIP 9,944 (9,944) — — — — — — —
Restructuring and severance 1,155 — — (1,155) — — — — —
Depreciation expense 3,560 — — — — — — — 3,560
Amortization expense 22,598 — — — (22,598) — — — —
Total operating expenses 340,017 (9,944) (56,324) (1,155) (22,598) — (1,170) (609) 248,217
Operating Income (Loss) 92,233 16,835 — 1,155 22,598 — 1,170 609 134,600
Other Income (Expense)
Realized and unrealized gain (loss) on investments, net 2,068 (19,047) — — — 16,239 — — (740)
Realized and unrealized gain (loss) of CIP, net (12,733) 12,733 — — — — — — —
Other income (expense), net 806 — — — — — — — 806
Total other income (expense), net (9,859) (6,314) — — — 16,239 — — 66
Interest Income (Expense)
Interest expense (9,202) — — — — — — (704) (9,906)
Interest and dividend income 1,131 4,168 — — — — — — 5,299
Interest and dividend income of CIP 83,951 (83,951) — — — — — — —
Interest expense of CIP (70,258) 70,258 — — — — — — —
Total interest income (expense), net 5,622 (9,525) — — — — — (704) (4,607)
Income (Loss) Before Income Taxes 87,996 996 — 1,155 22,598 16,239 1,170 (95) 130,059
Income tax expense (benefit) 29,847 — — 316 6,308 349 307 (890) 36,237
Net Income (Loss) 58,149 996 — 839 16,290 15,890 863 795 93,822
Noncontrolling interests (21,507) (996) — — (2,219) — — 18,852 (5,870)
Net Income (Loss) Attributable to Virtus Investment Partners, Inc. 36,642 — — 839 14,071 15,890 863 19,647 87,952
Earnings (Loss) Per Share - Diluted 4.60 11.05
Weighted Average Shares Outstanding - Diluted 7,958 7,958
RECONCILIATION: U.S. GAAP TO NON-GAAPYTD 2020 (UNAUDITED)
42$ and share counts in thousands, except per share data; See notes to reconciliation starting on page 43

Non-GAAP financial information differs from financial information determined in accordance with U.S. GAAP as a result of the reclassification of certain income statement items, as well
as the exclusion of certain expenses and other items that are not reflective of the earnings generated from providing investment management and related services. Non-GAAP
financial information has material limitations and should not be viewed in isolation or as a substitute for U.S. GAAP measures.
Reclassifications:
1. Consolidated investment products - Revenues and expenses generated by operating activities of mutual funds and CLOs that are consolidated in the financial statements.
Management believes that excluding these operating activities to reflect net revenues and expenses of the company prior to the consolidation of these products is consistent
with the approach of reflecting its operating results from managing third-party client assets.
Revenue related adjustments:
2. Investment management fees/Distribution and service fees - Each of these revenue line items is reduced to exclude fees passed-through to third-party client intermediaries
who own the retail client relationship and are responsible for distributing the product and servicing the client. The amount of fees fluctuate each period, based on a
predetermined percentage of the value of assets under management, and vary based on the type of investment product. The specific adjustments are as follows:
Investment management fees - Based on specific agreements, the portion of investment management fees passed-through to third-party intermediaries for
services to investors in sponsored investment products.
Distribution and service fees - Based on distinct arrangements, fees collected by the Company then passed-through to third-party client intermediaries for services
to investors in sponsored investment products. Adjustment represents all of the Company's distribution and service fees which are recorded as a separate line item on the
condensed consolidated statements of operations.
Management believes that making these adjustments aids in comparing the company's operating results with other asset management firms that do not utilize third-party
client intermediaries.
Other adjustments:
3. Distribution and other asset-based expenses - Primarily payments to third-party client intermediaries for providing services to investors in sponsored investment products.
Management believes that making this adjustment aids in comparing the company’s operating results with other asset management firms that do not utilize third-party client
intermediaries.
4. Amortization of intangible assets - Non-cash amortization expense or impairment expense, if any, attributable to acquisition-related intangible assets, including any portion
that is allocated to noncontrolling interests. Management believes that making this adjustment aids in comparing the company’s operating results with other asset
management firms that have not engaged in acquisitions.
5. Restructuring and severance - Certain expenses associated with restructuring the business, including lease abandonment-related expenses and severance costs associated
with staff reductions, that are not reflective of the ongoing earnings generation of the business. Management believes that making this adjustment aids in comparing the
company's operating results with prior periods.
6. Acquisition and integration expenses - Expenses that are directly related to acquisition and integration activities. Acquisition expenses include transaction closing costs,
certain professional fees, and financing fees. Integration expenses include costs incurred that are directly attributable to combining businesses, including compensation,
restructuring and severance charges, professional fees, consulting fees, and other expenses. Management believes that making these adjustments aids in comparing the
company’s operating results with other asset management firms that have not engaged in acquisitions.
7. Other - Certain expenses that are not reflective of the ongoing earnings generation of the business. Employment expenses and noncontrolling interests are adjusted for fair
value measurements of affiliate minority interests. Other operating expenses are adjusted for non-capitalized debt issuance costs. Interest expense is adjusted to remove
gains on early extinguishment of debt and the write-off of previously capitalized costs associated with the modification of debt. Income tax expense (benefit) items are
adjusted, for uncertain tax positions, changes in tax law, valuation allowances, and other unusual or infrequent items not related to current operating results to reflect a
normalized effective rate. Preferred dividends are adjusted as preferred shares were mandatorily converted into common shares on February 1, 2020 and the non-GAAP
weighted average shares are adjusted to reflect the conversion. Management believes that making these adjustments aids in comparing the company’s operating results
with prior periods.
8. Seed capital and CLO investments (gains) losses - Gains and losses (realized and unrealized) of seed capital and CLO investments. Gains and losses (realized and
unrealized) generated by investments in seed capital and CLO investments can vary significantly from period to period and do not reflect the Company’s operating results
from providing investment management and related services. Management believes that making this adjustment aids in comparing the Company’s operating results with prior
periods and with other asset management firms that do not have meaningful seed capital and CLO investments
FOOTNOTES
43

4444
Components of Acquisition and Integration Expenses and Other for the respective periods are shown in
the table below:
$ in thousands
FOOTNOTES (UNAUDITED)
Q3 2020 Q4 2020 Q1 2021 Q2 2021 Q3 2021 YTD:20 YTD:21
Acquisition and Integration Expenses
Employment expenses $999 $(515) $867 $615 $429 $1,170 $1,911
Other operating expenses — 171 1,780 2,052 1,842 — 5,674
Total Acquisition and Integration Operating Expenses $999 $(344) $2,647 $2,667 $2,271 $1,170 $7,585
Q3 2020 Q4 2020 Q1 2021 Q2 2021 Q3 2021 YTD:20 YTD:21
Other
Non-capitalized debt issuance costs $— $— $— $— $785 $— $785
Employment expense fair value adjustments 368 580 480 494 445 609 1,419
(Gain) / loss on extinguishment or modification of debt — — — — 180 (704) 180
Tax impact of adjustments (101) (158) (128) (131) (373) 34 (632)
Other discrete tax adjustments (767) (548) (2,803) (1,920) (344) 856 (5,067)
Affiliate minority interest fair value adjustments 8,684 12,531 13,498 9,624 10,841 18,852 33,963
Total Other $8,184 $12,405 $11,047 $8,067 $11,534 $19,647 $30,648