Illustrative Water Accounting Reports for Australian … Illustrative Water Accounting Reports for...
212
Illustrative Water Accounting Reports for Australian Water Accounting Standard 1
Transcript of Illustrative Water Accounting Reports for Australian … Illustrative Water Accounting Reports for...
Illustrative Water Accounting Reports for Australian Water Accounting Standard 1
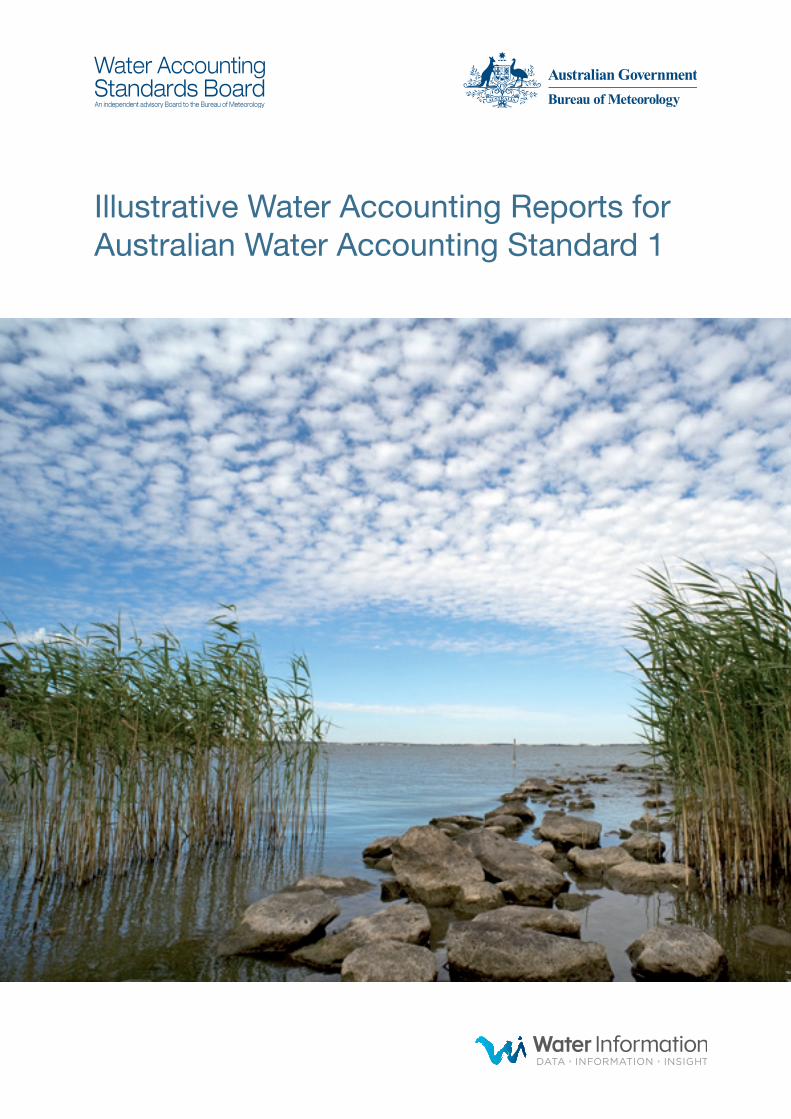
Illustrative Water Accounting Reports for Australian Water Accounting Standard 1: Preparation and Presentation of General Purpose Water Accounting Reports
ISBN 978-0-642-70631-7
With the exception of logos, this report is licensed under the Creative Commons Australia Attribution 3.0 Licence.
The terms and conditions of the licence are at: http://creativecommons.org/licenses/by/3.0/au/
Commonwealth of Australia (Bureau of Meteorology) 2012
First published by the Water Accounting Standards Board in 2010.
Illustrative Water Accounting Reports for Australian Water Accounting Standard 1: Preparation and Presentation of General Purpose Water Accounting Reports (AWAS 1) and associated illustrative water accounting reports were approved by the Water Accounting Standards Board on 29 May 2012.
Water Accounting Standards Board members:
• Michael RL Smith (Chairman)• W Peter Day• Denis W Flett• Jayne M Godfrey
Cover image: Lake Burrumbeet near Ballarat, Victoria. Photograph: Alison Pouliot.
iIllustrative Water Accounting Reports for Australian Water Accounting Standard 1
Introduction The enclosed group of water accounting reports are illustrations of general purpose water accounting reports (GPWAR) prepared in accordance with Australian Water Accounting Standard 1: Preparation and Presentation of General Purpose Water Accounting Reports (AWAS 1).
The illustrative water accounting reports included in this publication are demonstrations of different types of water accounting reports under varied physical and administrative situations for fictitious water report entities. They are intended to illustrate the application of AWAS 1 in these varied situations. While the reports are intended to provide a useful base from which practitioners can obtain an understanding of the concepts in AWAS 1, they should not be used as templates or comprehensive checklists of the presentation and disclosure requirements of AWAS 1.
To gain an understanding of the information described in the reports, the illustrative water accounting reports need to be read in full. There is significant information in the note disclosures that is not necessarily cross-referenced from the water accounting statements, such as information about water used in the pursuit of environmental benefits and the future prospects of the water report entity.
The reports contained in this document will require continual updating as new and amended Australian Water Accounting Standards are issued by the Water Accounting Standards Board. The illustrative water accounting reports in this publication do not include changes arising from new or amending AWAS issued after May 2012.
The illustrative water accounting reportsThe enclosed water accounting reports are for four fictitious water report entities that represent four different types of water entities:
1. a water supply system;
2. a major user of water;
3. an urban utility supply system; and
4. an environmental water rights holder.
Accordingly, the water accounting reports demonstrate different types of water assets, water liabilities and note disclosures.
ii Illustrative Water Accounting Reports for Australian Water Accounting Standard 1
The Wallaroo Water System
The Wallaroo Water System (Wallaroo) water accounting report illustrates the application of AWAS 1 to a regulated river system.
The Wallaroo water accounting report was prepared by the government regulator – the Department of Water and the Visual Arts (DWVA) – although the day-to-day operational management responsibility for the regulated Wallaroo Water System was delegated to Testcorp, a government-owned water resource management body. Therefore, the report preparer and the organisation with management responsibilities for the water report entity are different.
Under different governance arrangements, the report might have been prepared by Testcorp and included information provided by DWVA, or alternatively prepared by Testcorp to reflect only the part of the system managed by Testcorp.
Energetico
The Energetico water accounting report illustrates the application of AWAS 1 by a hydropower organisation (i.e. a major user of water). It is equally relevant for other organisations that are major users of water.
Terra Firma
The Terra Firma water accounting report illustrates the application of AWAS 1 for an urban utility supply system for which Terra Firma Corporation has management responsibility. It is equally relevant to rural utilities.
Minton Environmental Water Holdings
The Minton Environmental Water Holdings water accounting report illustrates the application of AWAS 1 by an environmental water rights holder with management responsibilities for water entitlements to provide defined environmental benefits. It is equally relevant for other water report entities without physical water assets and only water rights and obligations.
iiiIllustrative Water Accounting Reports for Australian Water Accounting Standard 1
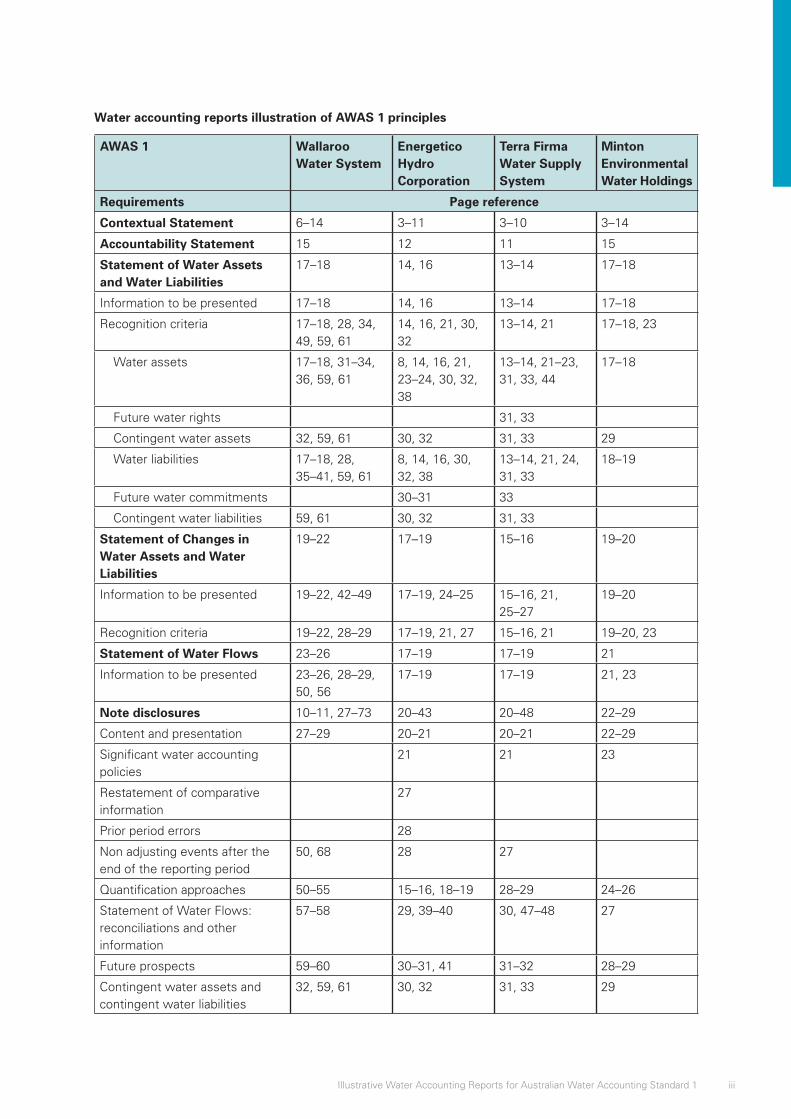
Water accounting reports illustration of AWAS 1 principles
AWAS 1 Wallaroo Water System
Energetico Hydro Corporation
Terra Firma Water Supply System
Minton Environmental Water Holdings
Requirements Page reference
Contextual Statement 6–14 3–11 3–10 3–14
Accountability Statement 15 12 11 15
Statement of Water Assets and Water Liabilities
17–18 14, 16 13–14 17–18
Information to be presented 17–18 14, 16 13–14 17–18
Recognition criteria 17–18, 28, 34, 49, 59, 61
14, 16, 21, 30, 32
13–14, 21 17–18, 23
Water assets 17–18, 31–34, 36, 59, 61
8, 14, 16, 21, 23–24, 30, 32, 38
13–14, 21–23, 31, 33, 44
17–18
Future water rights 31, 33
Contingent water assets 32, 59, 61 30, 32 31, 33 29
Water liabilities 17–18, 28, 35–41, 59, 61
8, 14, 16, 30, 32, 38
13–14, 21, 24, 31, 33
18–19
Future water commitments 30–31 33
Contingent water liabilities 59, 61 30, 32 31, 33
Statement of Changes in Water Assets and Water Liabilities
19–22 17–19 15–16 19–20
Information to be presented 19–22, 42–49 17–19, 24–25 15–16, 21, 25–27
19–20
Recognition criteria 19–22, 28–29 17–19, 21, 27 15–16, 21 19–20, 23
Statement of Water Flows 23–26 17–19 17–19 21
Information to be presented 23–26, 28–29, 50, 56
17–19 17–19 21, 23
Note disclosures 10–11, 27–73 20–43 20–48 22–29
Content and presentation 27–29 20–21 20–21 22–29
Significant water accounting policies
21 21 23
Restatement of comparative information
27
Prior period errors 28
Non adjusting events after the end of the reporting period
50, 68 28 27
Quantification approaches 50–55 15–16, 18–19 28–29 24–26
Statement of Water Flows: reconciliations and other information
57–58 29, 39–40 30, 47–48 27
Future prospects 59–60 30–31, 41 31–32 28–29
Contingent water assets and contingent water liabilities
32, 59, 61 30, 32 31, 33 29
iv Illustrative Water Accounting Reports for Australian Water Accounting Standard 1
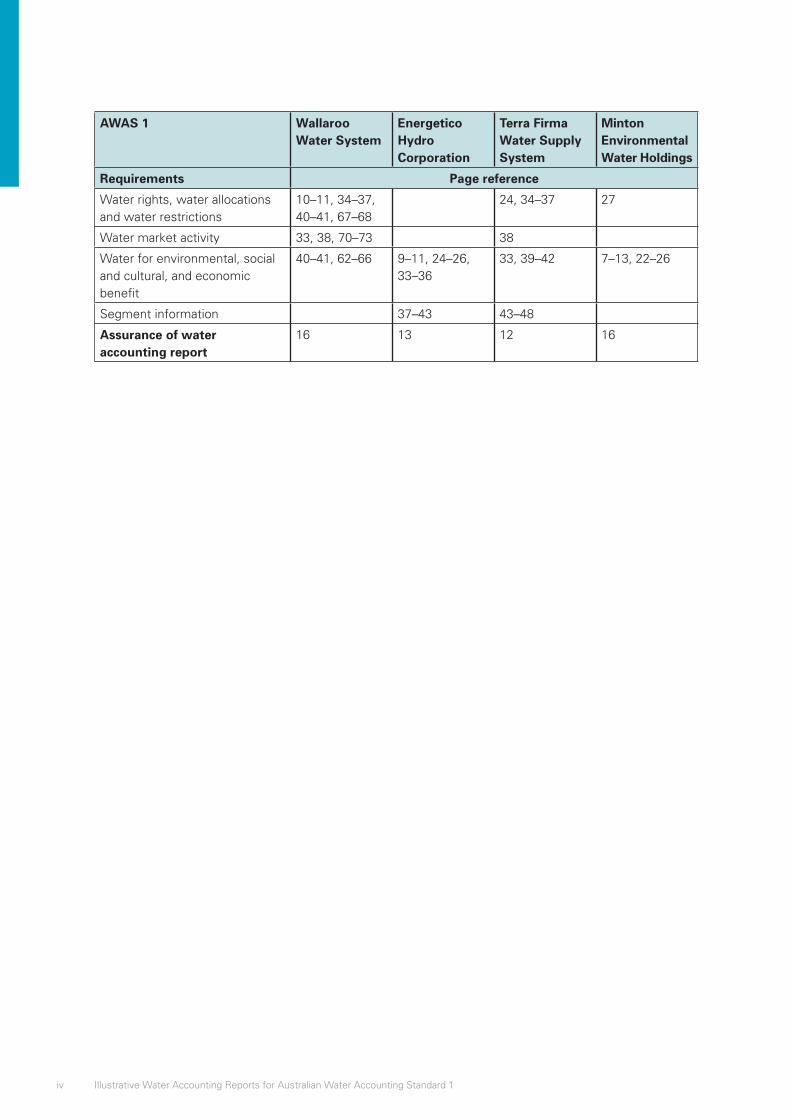
AWAS 1 Wallaroo Water System
Energetico Hydro Corporation
Terra Firma Water Supply System
Minton Environmental Water Holdings
Requirements Page reference
Water rights, water allocations and water restrictions
10–11, 34–37, 40–41, 67–68
24, 34–37 27
Water market activity 33, 38, 70–73 38
Water for environmental, social and cultural, and economic benefit
40–41, 62–66 9–11, 24–26, 33–36
33, 39–42 7–13, 22–26
Segment information 37–43 43–48
Assurance of water accounting report
16 13 12 16
Illustrative Water Accounting Report
Wallaroo Water SystemGeneral Purpose Water Accounting Report
30 June 2X11
Prepared by the Department of Water and the Visual Arts
An illustration of an Australian general purpose water accounting report for a fictitious water report entity

1Wallaroo Water System
Contents Page
Glossary ........................................................................................................................................................2Wallaroo at a glance ....................................................................................................................................4Contextual Statement .................................................................................................................................6
Physical information ................................................................................................................................7Administrative information ......................................................................................................................9Climatic overview of the reporting period .............................................................................................13
Accountability Statement .........................................................................................................................15Assurance Report ......................................................................................................................................16Water Accounting Statements .................................................................................................................17
Statement of Water Assets and Water Liabilities .................................................................................17Statement of Changes in Water Assets and Water Liabilities ..............................................................19Statement of Water Flows ....................................................................................................................23
Notes ..........................................................................................................................................................27Note 1: Significant water accounting policies .......................................................................................28Note 2: Information supporting the water accounting statements .......................................................30Note 3: Quantification approaches ........................................................................................................50Note 4: Reconciliations .........................................................................................................................57Note 5: Future prospects, contingent water assets and contingent water liabilities ............................59Note 6: Water for environmental, social and cultural, and economic benefit .......................................62Note 7: Water rights, water allocations and water restrictions .............................................................67Note 8: Water market activity ...............................................................................................................70
2 Illustrative Water Accounting Reports for Australian Water Accounting Standard 1
GlossaryThe terms listed below are not defined in AWAS 1 but are used in this general purpose water accounting report. They are not inconsistent with AWAS 1.
• Allocation – short version of ‘water allocation’. The specific volume of water allocated to water access entitlements in a given season or given accounting period, defined according to rules established in the relevant water plan.1
• Allocation announcement – obligating event that creates a legal right to access a water allocation and a corresponding obligation to deliver the water.
• Allocation trade – assignment of water allocation from one authorised water user to another, or between water accounts held by the same water user, with or without a change in location.2
• Entitlement – short version of ‘water access entitlement’. A perpetual or ongoing entitlement to exclusive access to a share of water from a specified consumptive pool as defined in the relevant water plan.3
• Entitlement trade – transfer of an entitlement from one legal entity to another with or without a change in location.4
• Environmental/social/cultural benefit – part of ‘environmental and other public benefit outcomes’. Environmental and other public benefit outcomes are defined as part of the water planning process specified in water plans and may include a number of aspects:
– environmental outcomes: maintaining ecosystem function (e.g. through periodic inundation of floodplain wetlands);
– biodiversity;
– water quality;
– river health targets; and
– other public benefits – mitigating pollution, public health (e.g. limiting noxious algal blooms), Indigenous and cultural values, recreation, fisheries, tourism, navigation and amenity values.5
• High/general/low security entitlement – frequency with which water allocated under a water access entitlement is able to be supplied in full.6
• Regulated storage – water storage on a regulated system.
• Regulated system – river system where the flow of the river is regulated through the operation of large dams or weirs.7
• Unregulated storage – water storage on an unregulated system.
1 National Water Initiative2 Australian Water Markets Report 2008–2009, National Water Commission3 National Water Initiative4 Australian Water Markets Report 2008–2009, National Water Commission5 National Water Initiative6 ibid.7 Australian Water Resources 2005, National Water Commission
3Wallaroo Water System
• Unregulated system – river system where flows are not regulated by the operation of structures such as major dams or weirs.8
• Water system – a system that is hydrologically-connected and described at the level desired for management purposes (e.g. sub-catchment, catchment, basin or drainage division and/or groundwater management unit, sub-aquifer, aquifer, groundwater basin).9
8 ibid.9 National Water Initiative
4 Illustrative Water Accounting Reports for Australian Water Accounting Standard 1
Wallaroo at a glance
Wallaroo Water System Management
• Report preparer: Department of Water and the Visual Arts
• Testcorp under licence from the Department of Water and the Visual Arts.
Wallaroo Water System
• Wallaroo River
• Smith Creek
• Lake Humphries
• Cherant and Nirvana Weirs
• Pierre Jour Reservoir
• Vanderbelt groundwater management area.
Head Office
• Testcorp 24 Banks StreetNorth Helgaville MINTON 0432
Responsibilities of Testcorp
• To manage the resources of the Wallaroo Water System in line with the Wallaroo Resources Management Plan
• To ensure the procedures in the Wallaroo Resources Operation Plan are adhered to
• To ensure minimum agreed levels are maintained
• To meet the obligations of the Longford irrigation capacity share arrangement
• Communicating with stakeholders and community groups to actively engage them in the process of water management.
Catchment
12 000 km²
5Wallaroo Water System
Corporate structure
The Testcorp Board of Directors consists of three senior executives of Testcorp and four independent directors. The Chairman of the Board is Annette Dimmett.
The Board is responsible for governance of Testcorp and ensuring it meets its obligations under the Water Resource Management Plan and the Wallaroo Resource Operations Plan.
The Board is responsible for the following objectives:
• guiding the organisation on governing issues;
• setting broad policies and objectives; and
• ensuring adequate financial and water resources.
The primary management tool for water resources within the Wallaroo water system is the Wallaroo Resource Management Plan. This sets out the rights and obligations pertaining to water in the river system, and is managed by Testcorp. The plan states the terms of the capacity sharing agreement between Testcorp and the Longford Irrigation Cooperative.
The second water management tool that Testcorp is party to is the Wallaroo Resource Operations Plan (2X08). This sets out procedures for water sharing, rules for trading, and details of entitlements and allocations.
The full documents above are available for download at the following address: www.wallarooresources.com.au
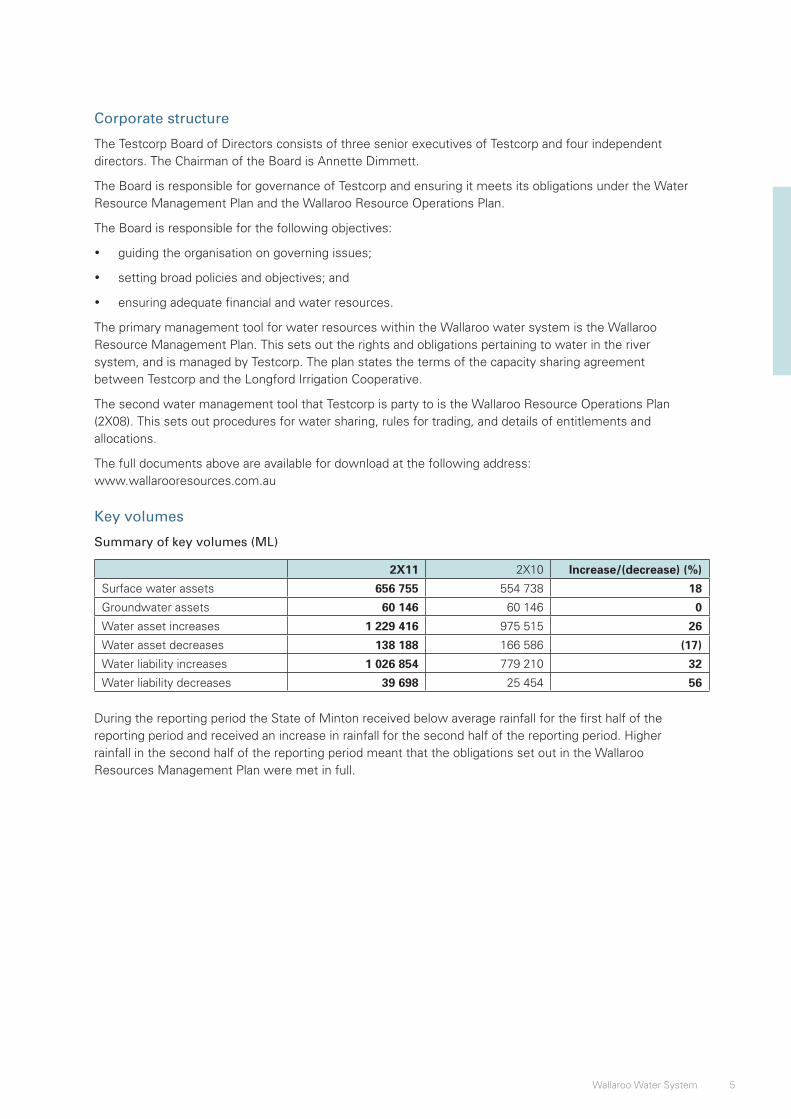
Key volumes
Summary of key volumes (ML)
2X11 2X10 Increase/(decrease) (%)
Surface water assets 656 755 554 738 18
Groundwater assets 60 146 60 146 0
Water asset increases 1 229 416 975 515 26
Water asset decreases 138 188 166 586 (17)
Water liability increases 1 026 854 779 210 32
Water liability decreases 39 698 25 454 56
During the reporting period the State of Minton received below average rainfall for the first half of the reporting period and received an increase in rainfall for the second half of the reporting period. Higher rainfall in the second half of the reporting period meant that the obligations set out in the Wallaroo Resources Management Plan were met in full.

6 Illustrative Water Accounting Reports for Australian Water Accounting Standard 1
Contextual Statement
AWAS 1 paragraphs 56–61
Basis for Conclusions paragraphs B42–B44
Water Accounting Conceptual Framework SWAC 1
The Contextual Statement provides users of general purpose water accounting reports with information that helps them understand the physical and administrative aspects of the water report entity. This includes information about the water assets and water liabilities, geographical and climatic conditions of the area as well as the management structure of the water report entity.
The description of the water report entity provides the users with contextual information on the physical boundaries of the water report entity. It details the features that are included and those that are excluded from the water report entity.
To comply with the requirements in AWAS 1, the following information should be included:
• a description of the water report entity;
• administrative information of the water report entity including details of any management structures, and any agreements the water report entity is party to that impact on the management and operation of the water assets and water liabilities of the water report entity;
• a description of the water resources of the water report entity;
• an overview of the reporting period which includes information on the climatic conditions, before and during the reporting period, that impact on the water report entity; and
• information on any externally-imposed requirements the water report entity or its management are required to comply with, such as those contained in water resource management instruments.
7Wallaroo Water System
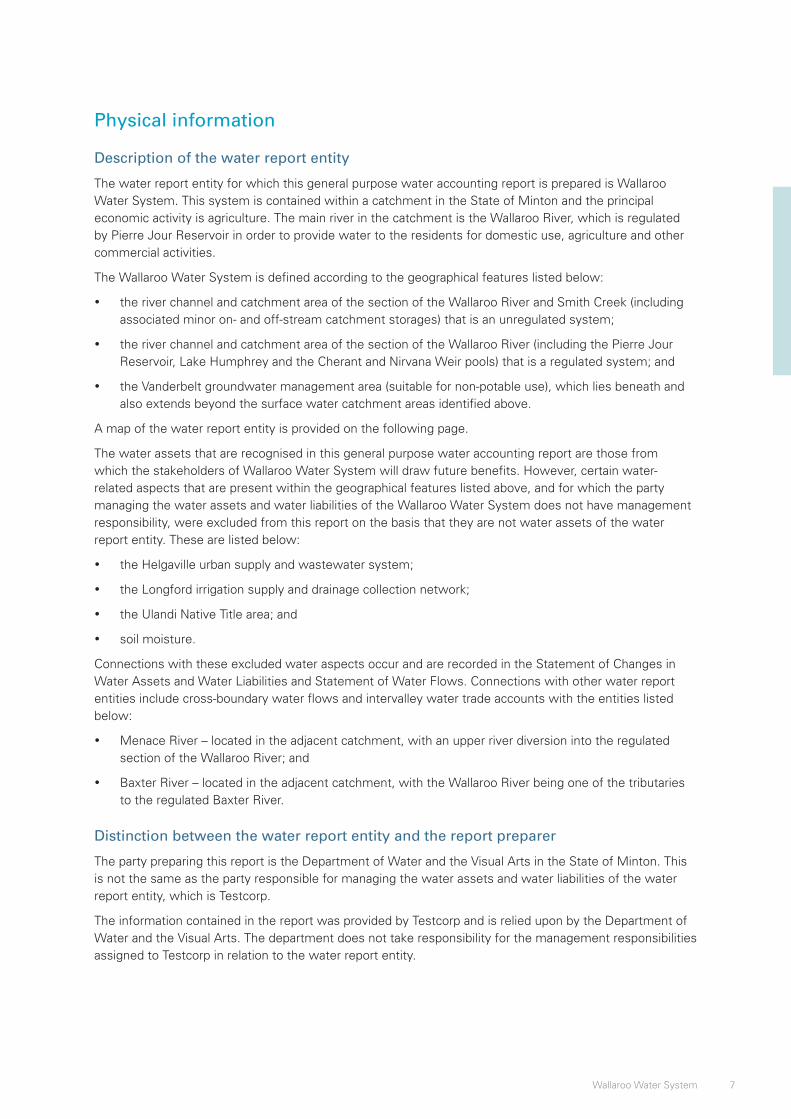
Physical information
Description of the water report entity
The water report entity for which this general purpose water accounting report is prepared is Wallaroo Water System. This system is contained within a catchment in the State of Minton and the principal economic activity is agriculture. The main river in the catchment is the Wallaroo River, which is regulated by Pierre Jour Reservoir in order to provide water to the residents for domestic use, agriculture and other commercial activities.
The Wallaroo Water System is defined according to the geographical features listed below:
• the river channel and catchment area of the section of the Wallaroo River and Smith Creek (including associated minor on- and off-stream catchment storages) that is an unregulated system;
• the river channel and catchment area of the section of the Wallaroo River (including the Pierre Jour Reservoir, Lake Humphrey and the Cherant and Nirvana Weir pools) that is a regulated system; and
• the Vanderbelt groundwater management area (suitable for non-potable use), which lies beneath and also extends beyond the surface water catchment areas identified above.
A map of the water report entity is provided on the following page.
The water assets that are recognised in this general purpose water accounting report are those from which the stakeholders of Wallaroo Water System will draw future benefits. However, certain water-related aspects that are present within the geographical features listed above, and for which the party managing the water assets and water liabilities of the Wallaroo Water System does not have management responsibility, were excluded from this report on the basis that they are not water assets of the water report entity. These are listed below:
• the Helgaville urban supply and wastewater system;
• the Longford irrigation supply and drainage collection network;
• the Ulandi Native Title area; and
• soil moisture.
Connections with these excluded water aspects occur and are recorded in the Statement of Changes in Water Assets and Water Liabilities and Statement of Water Flows. Connections with other water report entities include cross-boundary water flows and intervalley water trade accounts with the entities listed below:
• Menace River – located in the adjacent catchment, with an upper river diversion into the regulated section of the Wallaroo River; and
• Baxter River – located in the adjacent catchment, with the Wallaroo River being one of the tributaries to the regulated Baxter River.
Distinction between the water report entity and the report preparer
The party preparing this report is the Department of Water and the Visual Arts in the State of Minton. This is not the same as the party responsible for managing the water assets and water liabilities of the water report entity, which is Testcorp.
The information contained in the report was provided by Testcorp and is relied upon by the Department of Water and the Visual Arts. The department does not take responsibility for the management responsibilities assigned to Testcorp in relation to the water report entity.

8 Illustrative Water Accounting Reports for Australian Water Accounting Standard 1
Map of the Wallaroo Water System
Water resources
The Wallaroo River catchment experiences a semi-arid climate. The Wallaroo River is regulated from Pierre Jour Reservoir downstream to the confluence with Baxter River. Baxter River is the major river in the area, of which Wallaroo River is a tributary. Precipitation directly onto Pierre Jour Reservoir and runoff from the unregulated section of Wallaroo River and the unregulated tributary Smith Creek contribute approximately 70% of surface water flow into the regulated Wallaroo River. There is a diversion into the unregulated section of Wallaroo River through a tunnel from the Menace River, which contributes a further 17% of surface water flow into the regulated Wallaroo River.
Discharge from groundwater, minor tributaries and runoff into the regulated section of Wallaroo River below Pierre Jour Reservoir provide 5% of surface water flow into the regulated Wallaroo River. Return flows from irrigation and urban water use contribute a further 8%.
The Vanderbelt groundwater management area is located beneath the south-western section of the Wallaroo River catchment area. It includes the Cave Aquifer – an unconfined aquifer at a depth that permits reasonably accurate modelling of its volume; and the Puits Aquifer – a deeper confined aquifer, for which a volume cannot be reliably modelled. Most of the recharge (90%) to these aquifers occurs in the Wallaroo River catchment, and most extraction from these aquifers (85%) also occurs in this area.
The assessed extractable limit of groundwater from the Cave Aquifer represents approximately 11% of the total assessed groundwater resource, although a recent analysis indicated this could be increased to approximately 15% and still be within environmental management guidelines for sustainable extraction limits. For more details, see note 2b.
9Wallaroo Water System
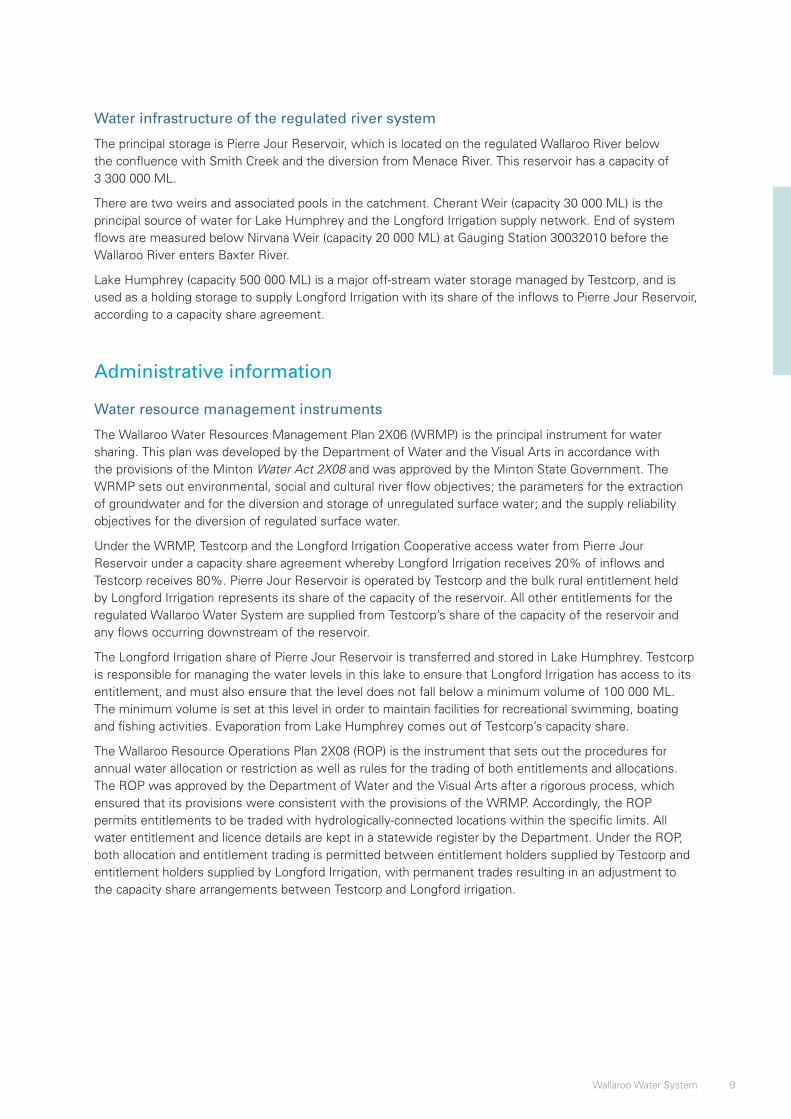
Water infrastructure of the regulated river system
The principal storage is Pierre Jour Reservoir, which is located on the regulated Wallaroo River below the confluence with Smith Creek and the diversion from Menace River. This reservoir has a capacity of 3 300 000 ML.
There are two weirs and associated pools in the catchment. Cherant Weir (capacity 30 000 ML) is the principal source of water for Lake Humphrey and the Longford Irrigation supply network. End of system flows are measured below Nirvana Weir (capacity 20 000 ML) at Gauging Station 30032010 before the Wallaroo River enters Baxter River.
Lake Humphrey (capacity 500 000 ML) is a major off-stream water storage managed by Testcorp, and is used as a holding storage to supply Longford Irrigation with its share of the inflows to Pierre Jour Reservoir, according to a capacity share agreement.
Administrative information
Water resource management instruments
The Wallaroo Water Resources Management Plan 2X06 (WRMP) is the principal instrument for water sharing. This plan was developed by the Department of Water and the Visual Arts in accordance with the provisions of the Minton Water Act 2X08 and was approved by the Minton State Government. The WRMP sets out environmental, social and cultural river flow objectives; the parameters for the extraction of groundwater and for the diversion and storage of unregulated surface water; and the supply reliability objectives for the diversion of regulated surface water.
Under the WRMP, Testcorp and the Longford Irrigation Cooperative access water from Pierre Jour Reservoir under a capacity share agreement whereby Longford Irrigation receives 20% of inflows and Testcorp receives 80%. Pierre Jour Reservoir is operated by Testcorp and the bulk rural entitlement held by Longford Irrigation represents its share of the capacity of the reservoir. All other entitlements for the regulated Wallaroo Water System are supplied from Testcorp’s share of the capacity of the reservoir and any flows occurring downstream of the reservoir.
The Longford Irrigation share of Pierre Jour Reservoir is transferred and stored in Lake Humphrey. Testcorp is responsible for managing the water levels in this lake to ensure that Longford Irrigation has access to its entitlement, and must also ensure that the level does not fall below a minimum volume of 100 000 ML. The minimum volume is set at this level in order to maintain facilities for recreational swimming, boating and fishing activities. Evaporation from Lake Humphrey comes out of Testcorp’s capacity share.
The Wallaroo Resource Operations Plan 2X08 (ROP) is the instrument that sets out the procedures for annual water allocation or restriction as well as rules for the trading of both entitlements and allocations. The ROP was approved by the Department of Water and the Visual Arts after a rigorous process, which ensured that its provisions were consistent with the provisions of the WRMP. Accordingly, the ROP permits entitlements to be traded with hydrologically-connected locations within the specific limits. All water entitlement and licence details are kept in a statewide register by the Department. Under the ROP, both allocation and entitlement trading is permitted between entitlement holders supplied by Testcorp and entitlement holders supplied by Longford Irrigation, with permanent trades resulting in an adjustment to the capacity share arrangements between Testcorp and Longford irrigation.

10 Illustrative Water Accounting Reports for Australian Water Accounting Standard 1
There are several entitlement types covered by the ROP over which Testcorp has management responsibilities:
• Wallaroo regulated entitlements – these entitlements are held by water users for purposes of irrigation, commercial and industrial activities, urban water use, environmental use, and cultural use associated with the Ulandi Native Title area. These users pump directly from the regulated Wallaroo River:
– High security entitlements are held by water users for irrigation, commercial and industrial activities. These entitlements are able to be supplied in full for each reporting period and are tradable.
– General security entitlements are held by water users for irrigation, commercial and industrial activities. These entitlements are able to be supplied in full approximately 84% of the time and are tradable.
– Urban water entitlements are held by the water system operators for Helgaville. These entitlements are tradable.
– Stock and domestic entitlements are held by residents of the Wallaroo Water Supply region for watering stock and meeting domestic needs. These entitlements are tradable.
– Environmental entitlements are held by Minton Department of the Environment. The ROP requires that environmental objectives be met by the efficient delivery of water released for other purposes. However, there is a provision for rules-based watering to meet the environmental objectives set out in the WRMP within the ROP. These entitlements are tradable.
– Cultural entitlements held by the Ulandi Indigenous people are used to maintain culturally significant sites in the Ulandi Native Title area and in ceremonies connected with culturally significant sites. These entitlements are not tradable.
The ROP also has provisions to guide the roles of a Water Resource Manager and an Environmental Water Manager. The role of the Water Resource Manager is to make allocation determinations for Wallaroo regulated entitlements and Vanderbelt groundwater entitlements, and to make restriction determinations for unregulated licences. The role of the Environmental Water Manager is to prepare and implement an Environmental Watering Plan, including the management of environmental water entitlements and allocations, which allows discretion in the way they are held and applied.
• Vanderbelt groundwater entitlements – these entitlements are held by water users located in the Vanderbelt groundwater management area for irrigation, commercial and industrial purposes. These users pump directly from Cave Aquifer using their own bores. Allocations are announced based on periodical assessments of the volume available for sustainable extraction from this resource:
– High security entitlements are held by residents of the Wallaroo Water System and Baxter Water System with direct access to the Vanderbelt groundwater management area. The sustainable extraction limit for the aquifer as a whole has never been exceeded, notwithstanding that local exceptions may occur. These entitlements are tradable.
– Groundwater stock and domestic entitlements are held by residents of the Wallaroo Water System and Baxter Water System with direct access to the Vanderbelt groundwater management area for watering stock and meeting domestic needs. These entitlements are tradable.
• Unregulated entitlements – licences to divert unregulated surface water for irrigation and stock and domestic use are issued by Testcorp. They do not specify a volume that may be taken; however, their use is metered and in the case of water shortages restrictions are imposed. No distinction is made between water that is extracted for purposes of irrigation, commercial and industrial; or stock and domestic purposes. However, the critical human needs are taken into consideration in the determination of water use restrictions. These entitlements are not tradable.
11Wallaroo Water System
Minor catchment storages on private property are not licensed, but are considered collectively significant and are included in the management regime via a system of registration. This system of registration is managed by the Department of Water and the Visual Arts.
Annual allocation determinations and announcements for Wallaroo regulated entitlements and Vanderbelt groundwater entitlements are carried out in accordance with a schedule and process specified in the ROP. Entitlement holders are notified by mail or email of their allocation balance after each determination and can also access balances online on the day of the announcement. The dates of scheduled determinations are published in the local newspaper and determination decisions are published the day after they are made.
Current obligation is only allowed for Wallaroo regulated high security entitlements, within the limit established by the WRMP. This limit is currently set at 50% of the volume of an entitlement, regardless of the allocation announced in that reporting period. A reduction of 5% is applied at the end of the financial year to the volume of allocation carried over to the following period, to account for water lost in evaporation while it is being stored.
Intervalley trade is permitted between Wallaroo Water System and other hydrologically-linked catchments; however, the volumes that are permitted to be traded are dependent on the intervalley transfer balance. The intervalley transfer from Menace River to Wallaroo River is set at a baseline of 180 000 ML per year. Similarly, the intervalley transfer baseline volume from Wallaroo River to Baxter River is set to 150 000 ML. The actual volume transferred varies from year to year due to trading activity and unregulated flows. There were no adjustments made to either the WRMP or the ROP during the reporting period.
Water management bodies
Testcorp was issued an operating licence by the Department of Water and the Visual Arts to manage the water resources of the Wallaroo Water System and to ensure stakeholders gain the greatest environmental, social and cultural, and economic benefits from those resources in line with the Wallaroo Resource Operations Plan (ROP).
Essential water services are provided in the region by Longford Irrigation Corporation Ltd, which operates the Longford Irrigation supply and collection network, and Minton Watercorp Ltd, which supplies urban potable and wastewater services to Helgaville.
The Ulandi Aboriginal Corporation is responsible for managing the cultural entitlement related to the Ulandi Native Title area.
The Minton State Government is responsible for approving and reviewing the WRMP. The Department of Water and the Visual Arts is responsible for approving and reviewing the ROP, managing a register of farm dams and private storages, and monitoring and assessing compliance with the ROP provisions. The Department of Water and the Visual Arts is also responsible for preparing ROP water accounting reports for the Minton State Government.
Testcorp was established in 1984 and its functions have evolved to cover most water resource management functions within the Wallaroo River Catchment. It is responsible for managing the water infrastructure of the Wallaroo Water System, operational management of water resources, including the administration associated with water trading and maintaining the virtual entitlement and licence register of the Wallaroo River Catchment under delegations and provisions in the ROP.
Testcorp is a government-owned corporation and has a Board of Directors with non-executive directors appointed by the Minton Minister for Water. The Board comprises three senior executives of Testcorp and four independent directors. Annette Dimmett is the current Chairman of the Board. The Board is responsible for governance of Testcorp and for meeting its responsibilities under its operating licence, the ROP and the Water Act, including facilitating the implementation of the Environmental Watering Plan (EWP). Senior management comprises: Sven Hannover (Chief Executive Officer), Samuel Crusoe (Chief Financial and Water Accounting Officer) and Terry O’Donnell (Chief Technical Services). The head office is located in Helgaville.
12 Illustrative Water Accounting Reports for Australian Water Accounting Standard 1
The Water Resource Manager is a nominated independent position within Testcorp with delegations under the ROP to independently make allocation and restriction determinations and announcements, and to work closely with other areas within Testcorp to ensure timely and efficient implementation of operational water resource administration.
The Environmental Water Manager is a nominated position within the Minton Department of Environment with delegations under the Minton Environment Act and the ROP.
Management and operational requirements
The Wallaroo Water System is managed and operated by Testcorp according to Federal and State legislation and guidelines. The externally-imposed requirements include:
• Minton Water Act 2X08
• Natural Resources Management Act 2X05 (NRM Act)
• National Water Initiative 2X05 (NWI)
• Irrigation Act 2X05
• Minton Environmental Act 2X03
• Wallaroo Resources Operations Plan
• Wallaroo River Catchment Environmental Watering Plan.
The management and operations of the Wallaroo Water System were conducted throughout the reporting period in compliance with all externally imposed requirements, with the exception of the below contraventions that occurred during the reporting period:
• The required minimum flow rate in regulated Wallaroo River was not maintained in July 2X10 (see note 6a).
• The required minimum storage level was not maintained in Lake Humphrey in September 2X10 and June 2X11 (see note 6b).
• There were three recorded instances of non-compliance with water restrictions on licensed diversions from unregulated storages (see note 7c).
13Wallaroo Water System
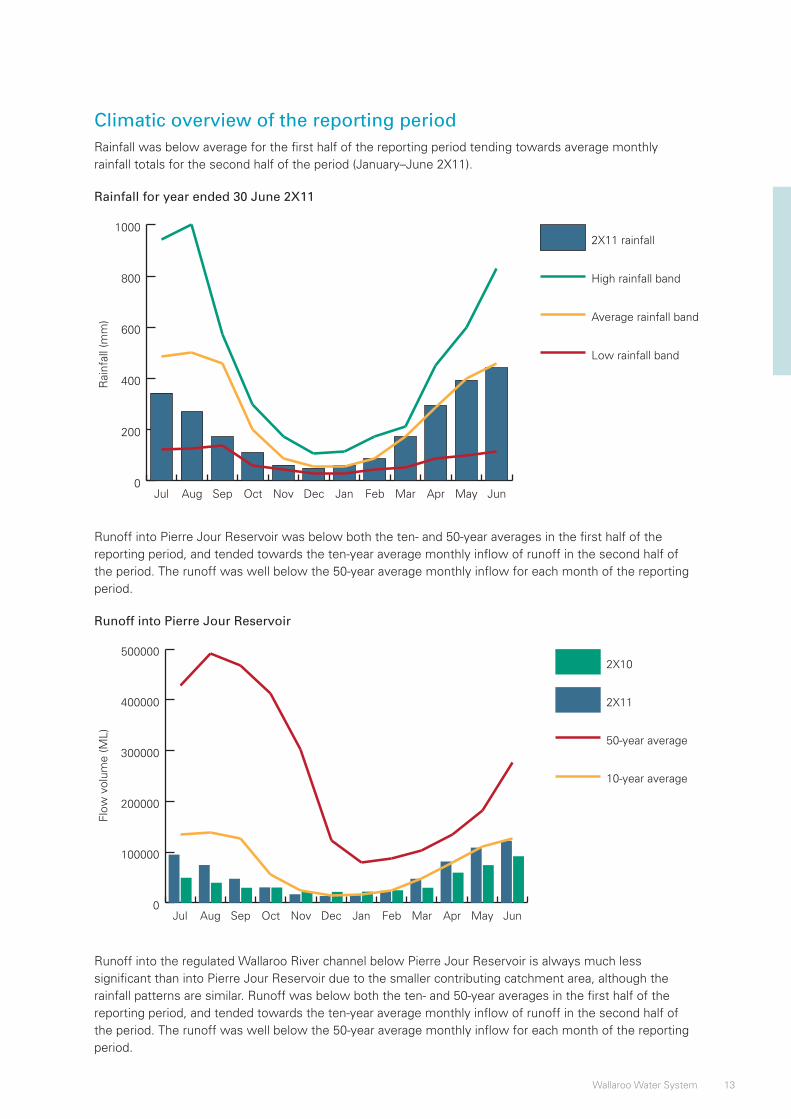
Climatic overview of the reporting periodRainfall was below average for the first half of the reporting period tending towards average monthly rainfall totals for the second half of the period (January–June 2X11).
Rainfall for year ended 30 June 2X11
0
200
400
600
800
10002X11 rainfall
High rainfall band
Average rainfall band
Low rainfall band
JunMayAprMarFebJanDecNovOctSepAugJul
Rai
nfal
l (m
m)
Runoff into Pierre Jour Reservoir was below both the ten- and 50-year averages in the first half of the reporting period, and tended towards the ten-year average monthly inflow of runoff in the second half of the period. The runoff was well below the 50-year average monthly inflow for each month of the reporting period.
Runoff into Pierre Jour Reservoir
0
100000
200000
300000
400000
5000002X10
2X11
50-year average
10-year average
JunMayAprMarFebJanDecNovOctSepAugJul
Flow
vol
ume
(ML)
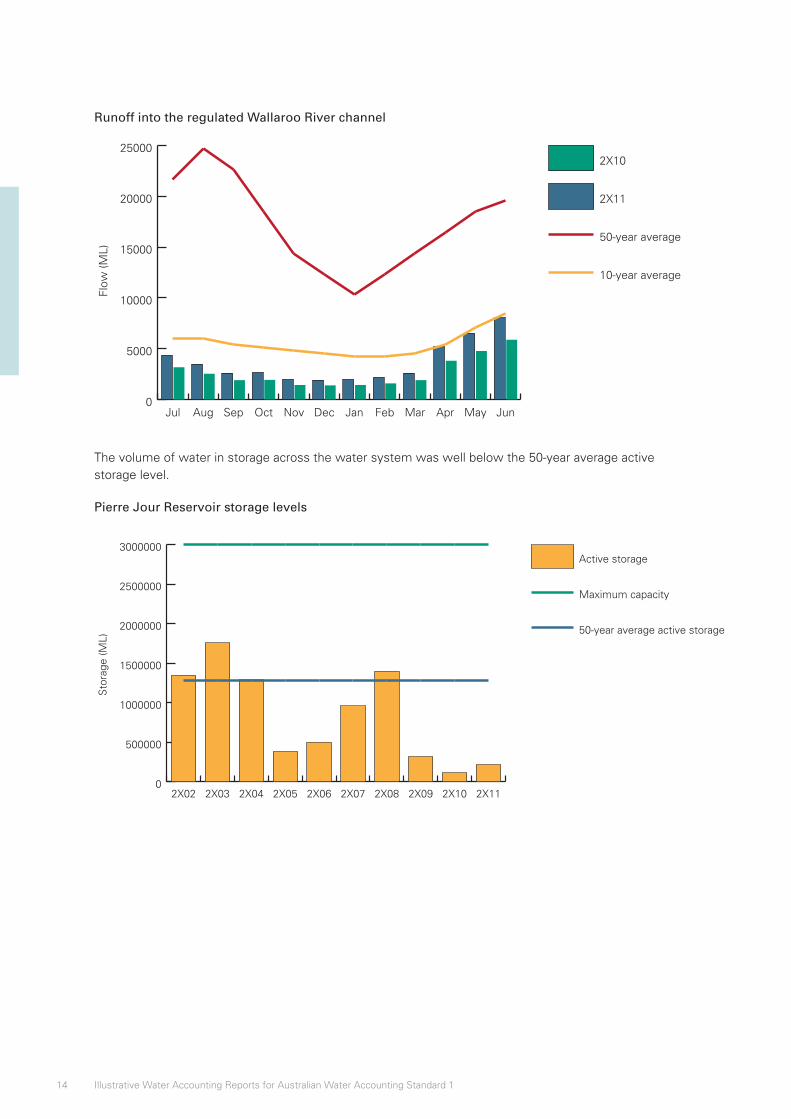
Runoff into the regulated Wallaroo River channel below Pierre Jour Reservoir is always much less significant than into Pierre Jour Reservoir due to the smaller contributing catchment area, although the rainfall patterns are similar. Runoff was below both the ten- and 50-year averages in the first half of the reporting period, and tended towards the ten-year average monthly inflow of runoff in the second half of the period. The runoff was well below the 50-year average monthly inflow for each month of the reporting period.
14 Illustrative Water Accounting Reports for Australian Water Accounting Standard 1
Runoff into the regulated Wallaroo River channel
0
5000
10000
15000
20000
250002X10
2X11
50-year average
10-year average
JunMayAprMarFebJanDecNovOctSepAugJul
Flow
(ML)
The volume of water in storage across the water system was well below the 50-year average active storage level.
Pierre Jour Reservoir storage levels
0
500000
1000000
1500000
2000000
2500000
3000000Active storage
Maximum capacity
50-year average active storage
2X112X102X092X082X072X062X052X042X032X02
Sto
rage
(ML)
15Wallaroo Water System
Accountability Statement
AWAS 1 paragraphs 62–63
Basis for Conclusions paragraphs B45–B48
Water Accounting Conceptual Framework SWAC 2: 15–16
The Accountability Statement is a statement signed and dated by the person(s) or representative(s) responsible for preparing and presenting the general purpose water accounting report. The Statement assists users of general water accounting reports determine whether the report has been prepared and presented in accordance with Australian Water Accounting Standards.
If the general purpose water accounting report is not prepared in accordance with Australian Water Accounting Standards, a statement to this effect is disclosed setting out the nature of and reason for non-compliance.
In the opinion of the undersigned, and based on the information provided and certified by Testcorp (the party accountable for managing the water assets and water liabilities of the water report entity), this general purpose water accounting report has been prepared in accordance with Australian Water Accounting Standard 1.
Joanne Humphrey Director of Resource Operation PlansMinton Department of Water and the Visual Arts
16 Illustrative Water Accounting Reports for Australian Water Accounting Standard 1
Assurance Report
AWAS 1 paragraphs 178–182
Basis for Conclusions paragraphs B165–B169
Water Accounting Conceptual Framework SWAC 2: 26–28 and SWAC 8
AWAS 1 requires a general purpose water accounting report to be subjected to assurance to establish whether it is presented fairly in accordance with Australian Water Accounting Standards. The assurance of the general purpose water accounting report is to be performed by an appropriately qualified assurance practitioner independent of the management of the water report entity and the preparer of the general purpose water accounting report.
AWAS requires a statement whether the general purpose water accounting report is presented in accordance with AWAS to be provided by the assurance practitioner in an assurance report accompanying the general purpose water accounting report.
The assurance function, undertaken by an appropriately qualified and independent assurance provider, is important to enhancing users’ confidence in the veracity of the information being presented to inform decision-making.
An assurance framework will be released for public consultation in late 2012.
17Wallaroo Water System
Water Accounting Statements
Statement of Water Assets and Water Liabilities
AWAS 1 paragraphs 21–46, 51–54 and 64–106
Implementation Guidance A, C, D and E
Basis for Conclusions paragraphs B23–B38 and B49–B129
Water Accounting Conceptual Framework SWAC 3, SWAC 4, SWAC 5 and SWAC 6
The Statement of Water Assets and Water Liabilities is a statement that provides information about the water assets and water liabilities of the water report entity at a point in time. The information in the Statement of Water Assets and Water Liabilities relates both to water and rights to, and claims against water. This statement is prepared on an accrual basis.
The Statement of Water Assets and Water Liabilities shall contain the following minimum line items:
• water assets;
• water liabilities; and
• net water assets.
Additional sub-classification of the minimum line items can be presented in accordance with AWAS 1 paragraph 66.
Items in the Statement of Water Assets and Water Liabilities are to be cross-referenced to the relevant note disclosure.
18 Illustrative Water Accounting Reports for Australian Water Accounting Standard 1
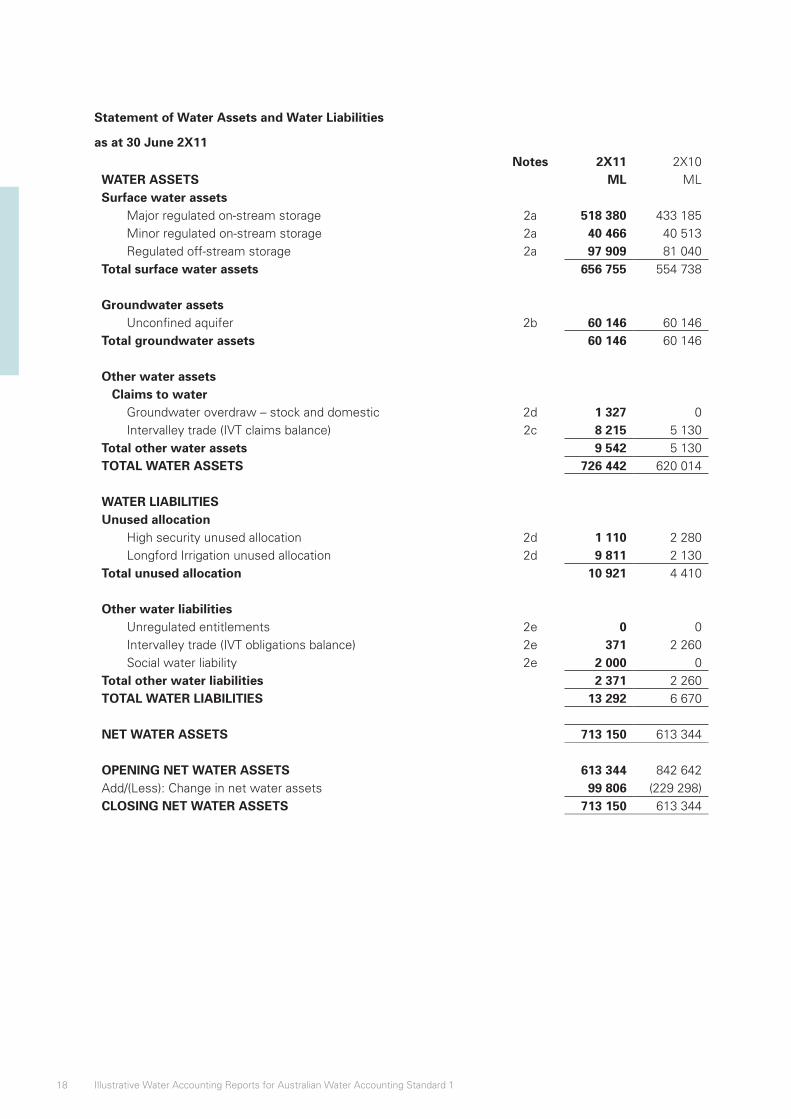
Statement of Water Assets and Water Liabilities
as at 30 June 2X11
Notes 2X11 2X10WATER ASSETS ML MLSurface water assets
Major regulated on-stream storage 2a 518 380 433 185Minor regulated on-stream storage 2a 40 466 40 513Regulated off-stream storage 2a 97 909 81 040
Total surface water assets 656 755 554 738
Groundwater assetsUnconfined aquifer 2b 60 146 60 146
Total groundwater assets 60 146 60 146
Other water assetsClaims to water
Groundwater overdraw – stock and domestic 2d 1 327 0Intervalley trade (IVT claims balance) 2c 8 215 5 130
Total other water assets 9 542 5 130TOTAL WATER ASSETS 726 442 620 014
WATER LIABILITIESUnused allocation
High security unused allocation 2d 1 110 2 280Longford Irrigation unused allocation 2d 9 811 2 130
Total unused allocation 10 921 4 410
Other water liabilitiesUnregulated entitlements 2e 0 0Intervalley trade (IVT obligations balance) 2e 371 2 260Social water liability 2e 2 000 0
Total other water liabilities 2 371 2 260TOTAL WATER LIABILITIES 13 292 6 670
NET WATER ASSETS 713 150 613 344
OPENING NET WATER ASSETS 613 344 842 642Add/(Less): Change in net water assets 99 806 (229 298)CLOSING NET WATER ASSETS 713 150 613 344

19Wallaroo Water System
Statement of Changes in Water Assets and Water Liabilities
AWAS 1 paragraphs 21–46, 51–54 and 107–114
Implementation Guidance A, C, D and E
Basis for Conclusions B23–B38 and B130–B132
Water Accounting Conceptual Framework SWAC 3, SWAC 4, SWAC 5 and SWAC 6
The Statement of Changes in Water Assets and Water Liabilities provides information about the changes that have occurred to the water report entity’s water assets and water liabilities during the reporting period. The Statement of Changes in Water Assets and Water Liabilities provides information about the increases and decreases in both water and rights to and claims against water. This statement is prepared on an accrual basis.
The Statement of Changes in Water Assets and Water Liabilities shall contain the following minimum line items:
• water asset increases;
• water asset decreases;
• water liability increases;
• water liability decreases; and
• change in net water assets
Additional sub-classification of the minimum line items can be presented in accordance with AWAS 1 paragraph 110.
Items in the Statement of Water Assets and Water Liabilities are to be cross-referenced to the relevant note disclosure.
20 Illustrative Water Accounting Reports for Australian Water Accounting Standard 1
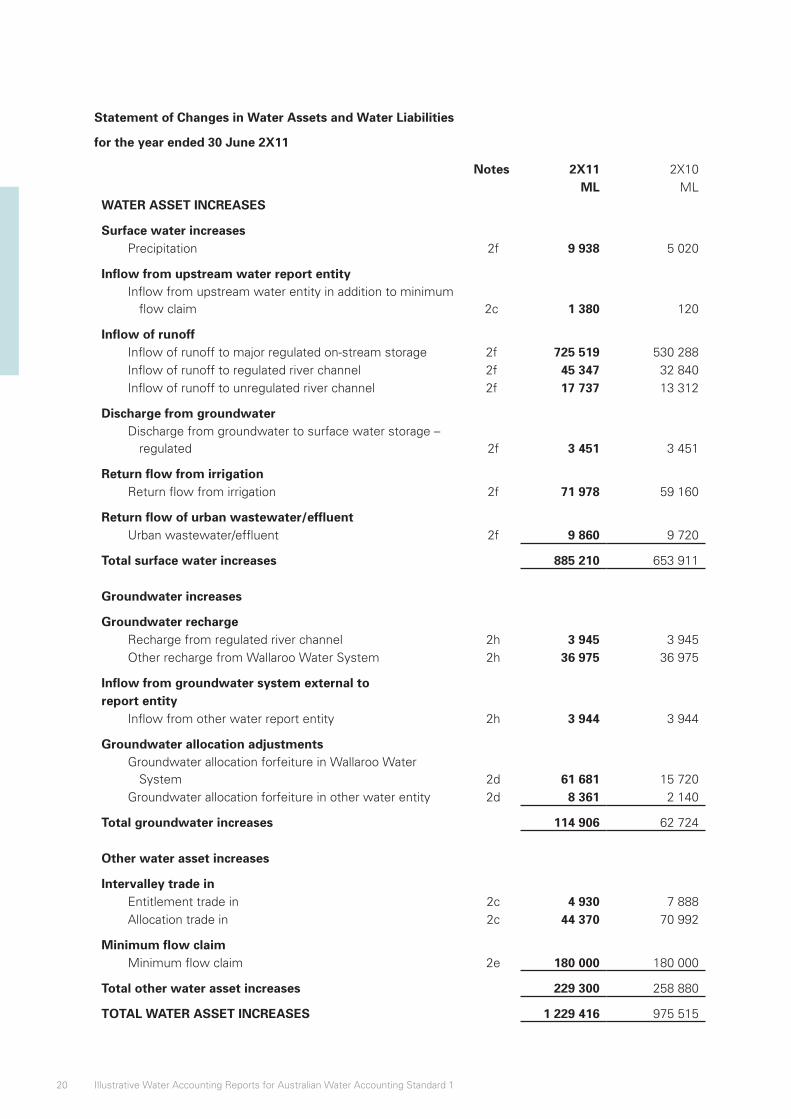
Statement of Changes in Water Assets and Water Liabilities
for the year ended 30 June 2X11
Notes 2X11 2X10ML ML
WATER ASSET INCREASES
Surface water increasesPrecipitation 2f 9 938 5 020
Inflow from upstream water report entityInflow from upstream water entity in addition to minimum
flow claim 2c 1 380 120
Inflow of runoffInflow of runoff to major regulated on-stream storage 2f 725 519 530 288Inflow of runoff to regulated river channel 2f 45 347 32 840Inflow of runoff to unregulated river channel 2f 17 737 13 312
Discharge from groundwaterDischarge from groundwater to surface water storage –
regulated 2f 3 451 3 451
Return flow from irrigation Return flow from irrigation 2f 71 978 59 160
Return flow of urban wastewater/effluentUrban wastewater/effluent 2f 9 860 9 720
Total surface water increases 885 210 653 911
Groundwater increases
Groundwater rechargeRecharge from regulated river channel 2h 3 945 3 945Other recharge from Wallaroo Water System 2h 36 975 36 975
Inflow from groundwater system external toreport entity
Inflow from other water report entity 2h 3 944 3 944
Groundwater allocation adjustmentsGroundwater allocation forfeiture in Wallaroo Water
System 2d 61 681 15 720Groundwater allocation forfeiture in other water entity 2d 8 361 2 140
Total groundwater increases 114 906 62 724
Other water asset increases
Intervalley trade inEntitlement trade in 2c 4 930 7 888Allocation trade in 2c 44 370 70 992
Minimum flow claimMinimum flow claim 2e 180 000 180 000
Total other water asset increases 229 300 258 880
TOTAL WATER ASSET INCREASES 1 229 416 975 515
21Wallaroo Water System
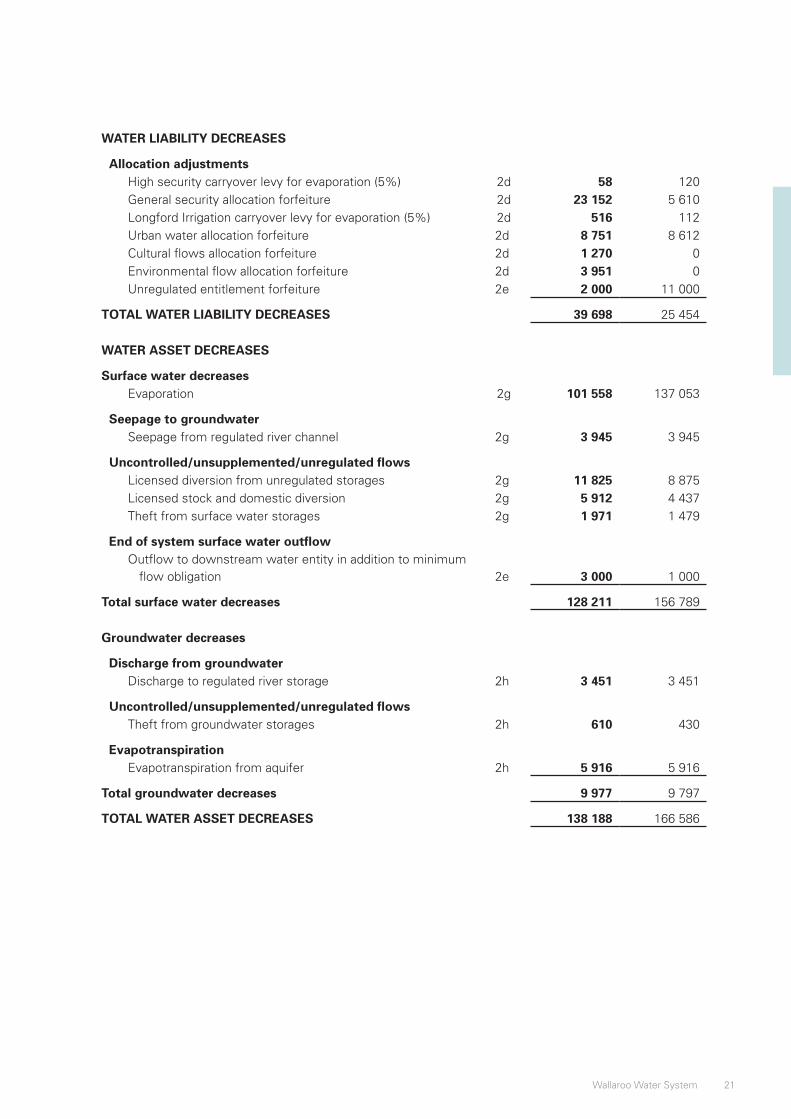
WATER LIABILITY DECREASES
Allocation adjustmentsHigh security carryover levy for evaporation (5%) 2d 58 120General security allocation forfeiture 2d 23 152 5 610Longford Irrigation carryover levy for evaporation (5%) 2d 516 112Urban water allocation forfeiture 2d 8 751 8 612Cultural flows allocation forfeiture 2d 1 270 0Environmental flow allocation forfeiture 2d 3 951 0Unregulated entitlement forfeiture 2e 2 000 11 000
TOTAL WATER LIABILITY DECREASES 39 698 25 454
WATER ASSET DECREASES
Surface water decreasesEvaporation 2g 101 558 137 053
Seepage to groundwaterSeepage from regulated river channel 2g 3 945 3 945
Uncontrolled/unsupplemented/unregulated flowsLicensed diversion from unregulated storages 2g 11 825 8 875Licensed stock and domestic diversion 2g 5 912 4 437Theft from surface water storages 2g 1 971 1 479
End of system surface water outflowOutflow to downstream water entity in addition to minimum
flow obligation 2e 3 000 1 000
Total surface water decreases 128 211 156 789
Groundwater decreases
Discharge from groundwaterDischarge to regulated river storage 2h 3 451 3 451
Uncontrolled/unsupplemented/unregulated flowsTheft from groundwater storages 2h 610 430
EvapotranspirationEvapotranspiration from aquifer 2h 5 916 5 916
Total groundwater decreases 9 977 9 797
TOTAL WATER ASSET DECREASES 138 188 166 586
22 Illustrative Water Accounting Reports for Australian Water Accounting Standard 1
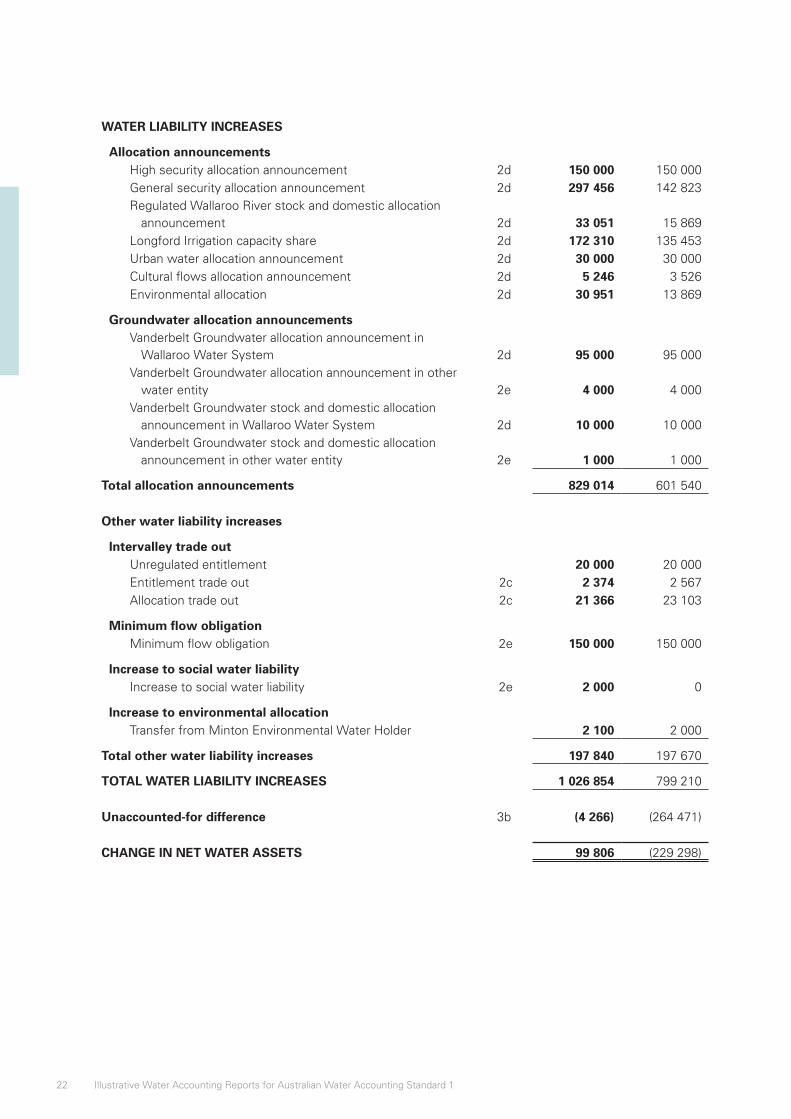
WATER LIABILITY INCREASES
Allocation announcementsHigh security allocation announcement 2d 150 000 150 000General security allocation announcement 2d 297 456 142 823Regulated Wallaroo River stock and domestic allocation
announcement 2d 33 051 15 869Longford Irrigation capacity share 2d 172 310 135 453Urban water allocation announcement 2d 30 000 30 000Cultural flows allocation announcement 2d 5 246 3 526Environmental allocation 2d 30 951 13 869
Groundwater allocation announcementsVanderbelt Groundwater allocation announcement in
Wallaroo Water System 2d 95 000 95 000Vanderbelt Groundwater allocation announcement in other
water entity 2e 4 000 4 000Vanderbelt Groundwater stock and domestic allocation
announcement in Wallaroo Water System 2d 10 000 10 000Vanderbelt Groundwater stock and domestic allocation
announcement in other water entity 2e 1 000 1 000
Total allocation announcements 829 014 601 540
Other water liability increases
Intervalley trade outUnregulated entitlement 20 000 20 000Entitlement trade out 2c 2 374 2 567Allocation trade out 2c 21 366 23 103
Minimum flow obligationMinimum flow obligation 2e 150 000 150 000
Increase to social water liabilityIncrease to social water liability 2e 2 000 0
Increase to environmental allocation Transfer from Minton Environmental Water Holder 2 100 2 000
Total other water liability increases 197 840 197 670
TOTAL WATER LIABILITY INCREASES 1 026 854 799 210
Unaccounted-for difference 3b (4 266) (264 471)
CHANGE IN NET WATER ASSETS 99 806 (229 298)
23Wallaroo Water System
Statement of Water Flows
AWAS 1 paragraphs 21–46, 51–54 and 115–127
Implementation Guidance A, C, D and E
Basis for Conclusions B23–B33, B35–B36 and B130–B132
Water Accounting Conceptual Framework SWAC 3, SWAC 4, SWAC 5 and SWAC 6
The Statement of Water Flows provides information about the nature and volumes of water flows experienced by the water report entity during the reporting period.
The Statement of Water Flows provides information on transactions, transformations and events that give rise to physical water flows during the reporting period. For example, in the case of water liabilities arising from allocation announcements, the Statement of Water Flows will:
• include the effect of decreases in water liabilities resulting from the physical outflow of water to settle announced allocations; and
• exclude the effects of allocation determinations and announcements made during the reporting period that remain undelivered at the reporting date. This is because they have not given rise to a physical water flow during the reporting period.
The Statement of Water Flows shall include line items that present the following volumes for the reporting period:
• water inflows;
• water outflows;
• change in water storage;
• opening water storage; and
• closing water storage.
Additional sub-classifications of the minimum line items should be presented in accordance with AWAS 1 paragraph 118.
Items in the Statement of Water Flows are to be cross-referenced with the relevant note disclosure.
24 Illustrative Water Accounting Reports for Australian Water Accounting Standard 1
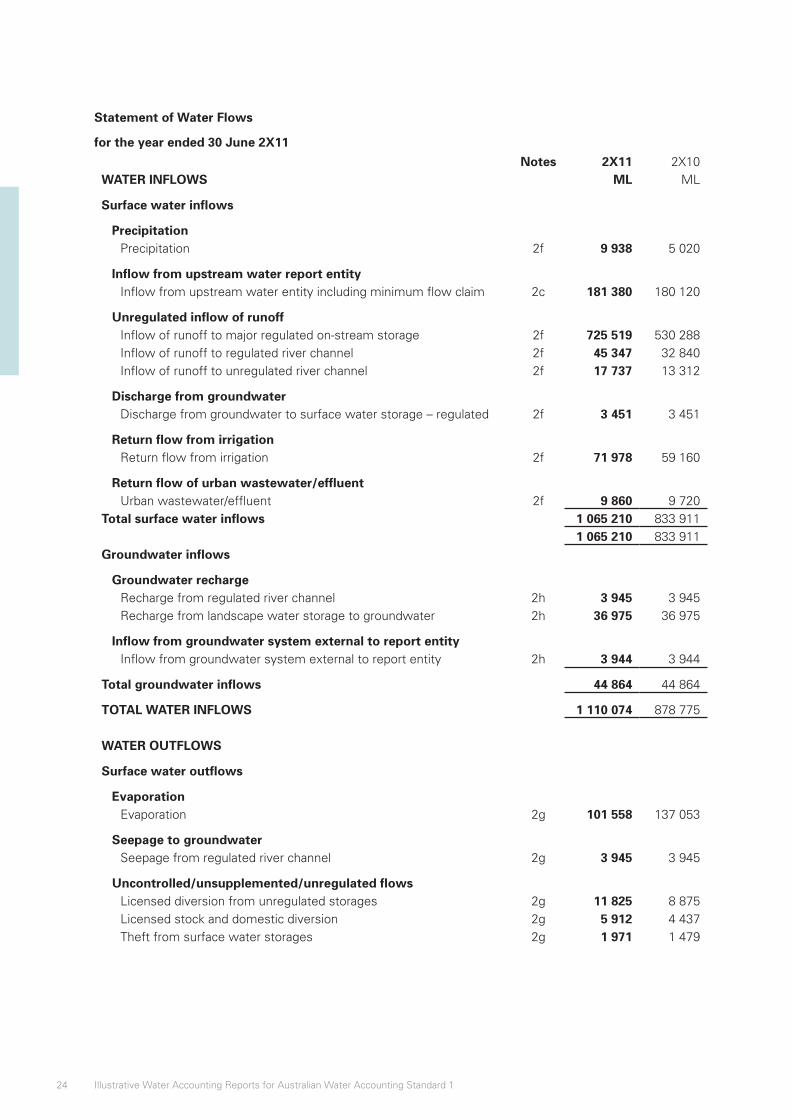
Statement of Water Flows
for the year ended 30 June 2X11
Notes 2X11 2X10WATER INFLOWS ML ML
Surface water inflows
PrecipitationPrecipitation 2f 9 938 5 020
Inflow from upstream water report entityInflow from upstream water entity including minimum flow claim 2c 181 380 180 120
Unregulated inflow of runoffInflow of runoff to major regulated on-stream storage 2f 725 519 530 288Inflow of runoff to regulated river channel 2f 45 347 32 840Inflow of runoff to unregulated river channel 2f 17 737 13 312
Discharge from groundwaterDischarge from groundwater to surface water storage – regulated 2f 3 451 3 451
Return flow from irrigation Return flow from irrigation 2f 71 978 59 160
Return flow of urban wastewater/effluentUrban wastewater/effluent 2f 9 860 9 720
Total surface water inflows 1 065 210 833 9111 065 210 833 911
Groundwater inflows
Groundwater rechargeRecharge from regulated river channel 2h 3 945 3 945Recharge from landscape water storage to groundwater 2h 36 975 36 975
Inflow from groundwater system external to report entityInflow from groundwater system external to report entity 2h 3 944 3 944
Total groundwater inflows 44 864 44 864
TOTAL WATER INFLOWS 1 110 074 878 775
WATER OUTFLOWS
Surface water outflows
EvaporationEvaporation 2g 101 558 137 053
Seepage to groundwaterSeepage from regulated river channel 2g 3 945 3 945
Uncontrolled/unsupplemented/unregulated flowsLicensed diversion from unregulated storages 2g 11 825 8 875Licensed stock and domestic diversion 2g 5 912 4 437Theft from surface water storages 2g 1 971 1 479

25Wallaroo Water System
Allocation diversionHigh security allocation diversion 2d 2g 156 727 145 299General security allocation diversion 2d 2g 259 331 110 795Regulated Wallaroo stock and domestic allocation diversion 2d 2g 33 051 15 869Longford Irrigation allocation diversion 2d 2g 155 441 121 828Urban water allocation diversion 2d 2g 21 249 21 388Cultural flows allocation diversion 2d 2g 3 976 3 526Environmental allocation diversion 2d 2g 29 100 15 869Unregulated diversions 2e 18 000 9 000
End-of-system surface water outflowOutflow to downstream water entity including minimum flow
obligation 2c 153 000 151 000
Total surface water outflows 955 086 750 363
Groundwater outflows
Discharge from groundwaterDischarge to regulated river storage 2h 3 451 3 451
Uncontrolled/unsupplemented/unregulated flowsTheft from groundwater storages 2h 610 430
EvapotranspirationEvapotranspiration from aquifer 2h 5 916 5 916
Groundwater allocation diversionVanderbelt Groundwater allocation diversion in Wallaroo Water
System 2d 25 441 74 859Vanderbelt Groundwater stock and domestic allocation diversion in
Wallaroo Water System 2d 11 327 10 000Vanderbelt Groundwater allocation diversion in other water entity 2c 960 960Vanderbelt Groundwater stock and domestic allocation diversion in
other water entity 2c 1 000 1 000
Total groundwater outflows 48 705 96 616
TOTAL WATER OUTFLOWS 1 003 791 846 979
Unaccounted-for difference 3b (4 266) (264 471)
CHANGE IN NET WATER STORAGE 102 016 (232 675)
OPENING WATER STORAGE 614 884 847 559Add: Change in Net Water Storage 102 016 (232 675)
CLOSING WATER STORAGE 716 900 614 884
26 Illustrative Water Accounting Reports for Australian Water Accounting Standard 1
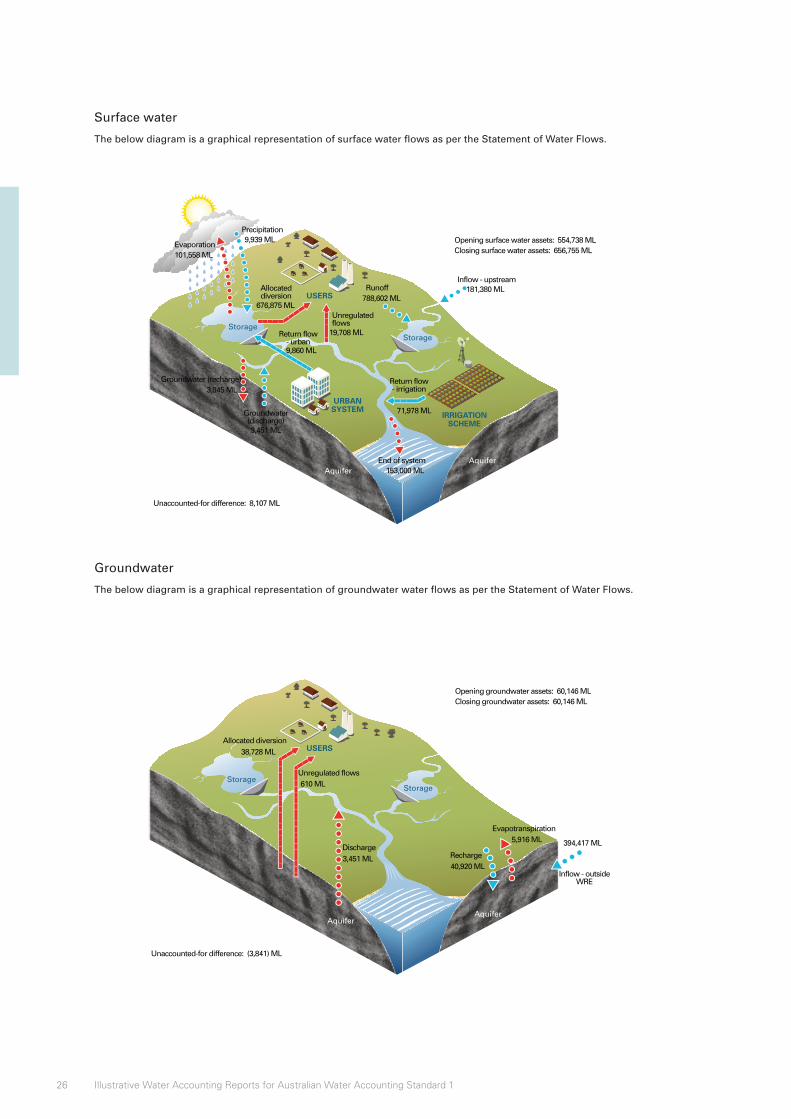
Surface water
The below diagram is a graphical representation of surface water flows as per the Statement of Water Flows.
AquiferAquifer
IRRIGATIONSCHEME
URBANSYSTEM
USERS
StorageStorage
101,558 ML
9,939 ML
181,380 ML788,602 ML
676,875 ML
3,945 ML
3,451 ML
9,860 ML
19,708 ML
153,000 ML
71,978 ML
Opening surface water assets: 554,738 MLClosing surface water assets: 656,755 ML
Unaccounted-for difference: 8,107 ML
Allocateddiversion
Unregulatedflows
Evaporation
Precipitation
RunoffInflow - upstream
Return flow- irrigation
Return flow- urban
End of system
Groundwater (recharge)
Groundwater(discharge)
Groundwater
The below diagram is a graphical representation of groundwater water flows as per the Statement of Water Flows.
AquiferAquifer
StorageStorage
USERS
394,417 ML
3,451 ML
38,728 ML
610 ML
5,916 ML
40,920 ML
Opening groundwater assets: 60,146 MLClosing groundwater assets: 60,146 ML
Unaccounted-for difference: (3,841) ML
Recharge
Inflow - outsideWRE
Evapotranspiration
Discharge
Unregulated flows
Allocated diversion
27Wallaroo Water System
Notes
AWAS 1 paragraphs 133–177
Implementation Guidance A, B, D, E, F, G and H
Basis for Conclusions paragraphs B146–B164
Water Accounting Conceptual Framework SWAC 2: 24–29
Information shall be disclosed in the notes that assist users of general purpose water accounting reports in understanding the water assets and water liabilities of the water report entity. The notes provide additional quantitative and qualitative information about the items presented in the water accounting statements. They also provide additional information on important aspects of the water report entity.
The following is a complete list of notes required by AWAS 1:
1. Significant water accounting policies
2. Supporting information to the water accounting statements
3. Restatement of comparative information
4. Prior period errors
5. Non-adjusting events after the end of the reporting period
6. Quantification approaches
7. Reconciliations
8. Future prospects
9. Contingent water assets and contingent water liabilities
10. Water assets and water liabilities that do not meet the recognition criteria
11. Water rights, water allocations, and water restrictions
12. Water market activity
13. Water for environmental, social and cultural, and economic benefit
14. Segment information
15. Group water accounting reports.
Notes 1, 2, 5, 6, 7, 8, 9, 10, 11, 12 and 13 are demonstrated in this illustrative water accounting report.

28 Illustrative Water Accounting Reports for Australian Water Accounting Standard 1
Note 1: Significant water accounting policies
AWAS 1 paragraphs 21–22, 51–54 and 136–138
AWAS 1 requires the preparer of a general purpose water accounting report to provide information on the water accounting policies adopted in the preparation of the water accounting statements in order to enhance users’ understanding of how transactions, transformations and events are reflected in the water accounting statements.
The following information shall be disclosed in the summary of significant water accounting policies:
• a statement that the general purpose water accounting report has been prepared using the accrual basis of water accounting (except for the water flow information);
• the quantification attribute and the unit of account used in the water accounting statements; and
• information on other water accounting policies used in the preparation and presentation of the general purpose water accounting report that are relevant to an understanding of the water accounting statements.
With the exception of water flow information, this general purpose water accounting report was prepared using an accrual basis of water accounting, using volume as the quantification attribute and litres as the unit of account, presented in megalitres (ML).
Recognition of water assets and water liabilities
The extractable volume of Cave Aquifer is recognised as a water asset for the Wallaroo Water System, as the recharge primarily occurs in the Wallaroo Water System. The recharge and extraction that occurs in the Wallaroo Water System is recognised in the Statement of Changes in Water Assets and Water Liabilities.
Intervalley trade occurs between stakeholders of the Wallaroo Water System and stakeholders of other hydrologically-connected systems, principally Menace Water system and Baxter Water system. This trading activity can change the total volume of water that is available within the water report entity. Balances, movements and flows associated with this activity are recognised in the water accounting statements. The intervalley trade balance is recognised both as a claim and an obligation rather than being offset as a single volume. The claims represent undelivered claims to water purchased by stakeholders of the water report entity to water held outside the water report entity. The obligations represent claims to water of the Wallaroo Water System that are held outside the water report entity.
Other trading activity also occurs between the stakeholders of the Wallaroo Water System. This trading activity does not change the total volume of water available in the water report entity, and so these volumes are not recognised in the water accounting statements. However, this information is important to a user’s understanding of the pattern and volumes of water use within the water report entity and so is disclosed in the notes.
In some cases, several interconnected water trading zones may be combined into a group water report entity and reported on a consolidated basis. When this occurs, there is likely to be trade between the component trading zones. Information about balances, movements and flows associated with these intra-entity trades are eliminated on consolidation from the water accounting statements. However, this information is material to a user’s understanding of water availability and use within the water report entity and is therefore disclosed in the notes. For the Wallaroo Water System, trading activity occurs between stakeholders of Testcorp and stakeholders of Longford Irrigation; however, Longford Irrigation is considered external to this water report entity. Therefore, this trading activity is captured in the intervalley trading activity information.
29Wallaroo Water System
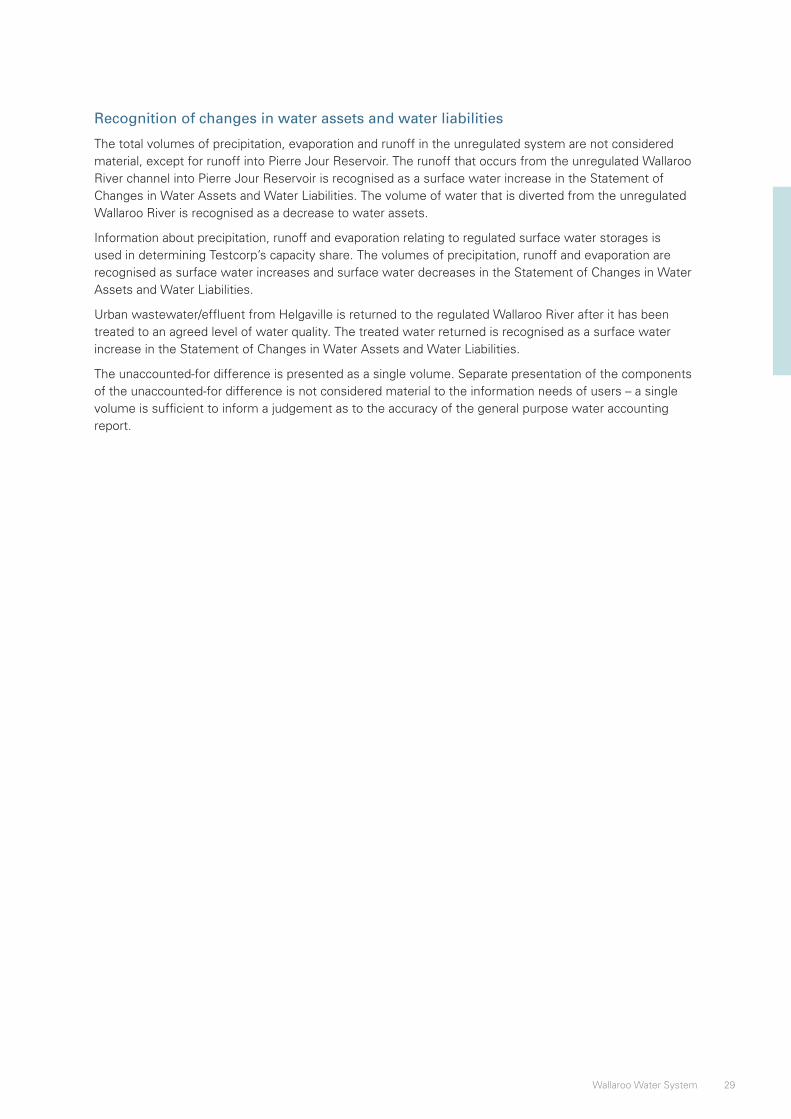
Recognition of changes in water assets and water liabilities
The total volumes of precipitation, evaporation and runoff in the unregulated system are not considered material, except for runoff into Pierre Jour Reservoir. The runoff that occurs from the unregulated Wallaroo River channel into Pierre Jour Reservoir is recognised as a surface water increase in the Statement of Changes in Water Assets and Water Liabilities. The volume of water that is diverted from the unregulated Wallaroo River is recognised as a decrease to water assets.
Information about precipitation, runoff and evaporation relating to regulated surface water storages is used in determining Testcorp’s capacity share. The volumes of precipitation, runoff and evaporation are recognised as surface water increases and surface water decreases in the Statement of Changes in Water Assets and Water Liabilities.
Urban wastewater/effluent from Helgaville is returned to the regulated Wallaroo River after it has been treated to an agreed level of water quality. The treated water returned is recognised as a surface water increase in the Statement of Changes in Water Assets and Water Liabilities.
The unaccounted-for difference is presented as a single volume. Separate presentation of the components of the unaccounted-for difference is not considered material to the information needs of users – a single volume is sufficient to inform a judgement as to the accuracy of the general purpose water accounting report.
30 Illustrative Water Accounting Reports for Australian Water Accounting Standard 1
Note 2: Information supporting the water accounting statements
AWAS 1 paragraphs 31–54 and 133–150
Basis for Conclusions paragraphs B35–B41
Water Accounting Conceptual Framework SWAC 2: 24–29
In order to assist in the ability to understand and compare the water accounting statements, AWAS 1 requires the inclusion of information in the notes that supports the items presented in the water accounting statements. The information is to be presented in the order in which each item is presented in the statements, including:
• information about the restatement of comparative information;
• information about prior period errors;
• information about non-adjusting events after the end of the reporting period;
• information about quantification approaches; and
• reconciliations and other information related to the Statement of Water Flows.
31Wallaroo Water System
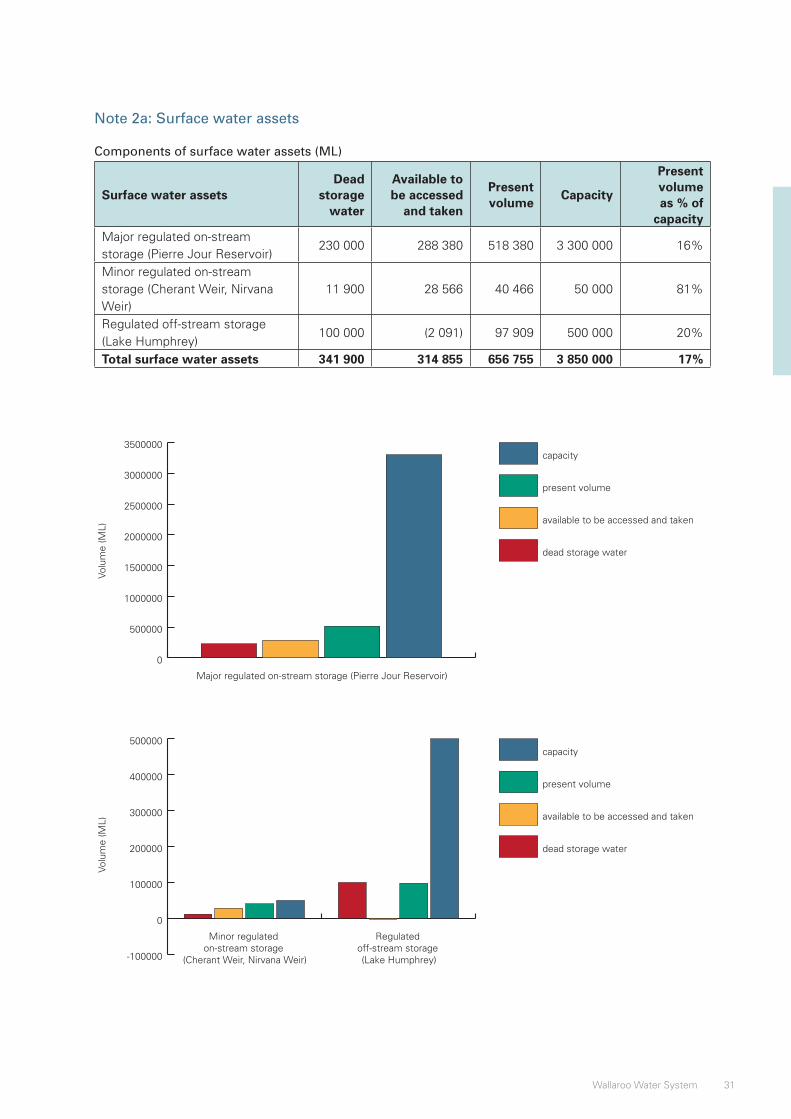
Note 2a: Surface water assets
Components of surface water assets (ML)
Surface water assetsDead
storage water
Available to be accessed
and taken
Present volume
Capacity
Present volume as % of
capacityMajor regulated on-stream storage (Pierre Jour Reservoir)
230 000 288 380 518 380 3 300 000 16%
Minor regulated on-stream storage (Cherant Weir, Nirvana Weir)
11 900 28 566 40 466 50 000 81%
Regulated off-stream storage (Lake Humphrey)
100 000 (2 091) 97 909 500 000 20%
Total surface water assets 341 900 314 855 656 755 3 850 000 17%
0
500000
1000000
1500000
2000000
2500000
3000000
3500000capacity
present volume
available to be accessed and taken
dead storage water
Major regulated on-stream storage (Pierre Jour Reservoir)
-100000
0
100000
200000
300000
400000
500000capacity
present volume
available to be accessed and taken
dead storage water
Regulated off-stream storage (Lake Humphrey)
Minor regulated on-stream storage
(Cherant Weir, Nirvana Weir)
Volu
me
(ML)
Vo
lum
e (M
L)
32 Illustrative Water Accounting Reports for Australian Water Accounting Standard 1
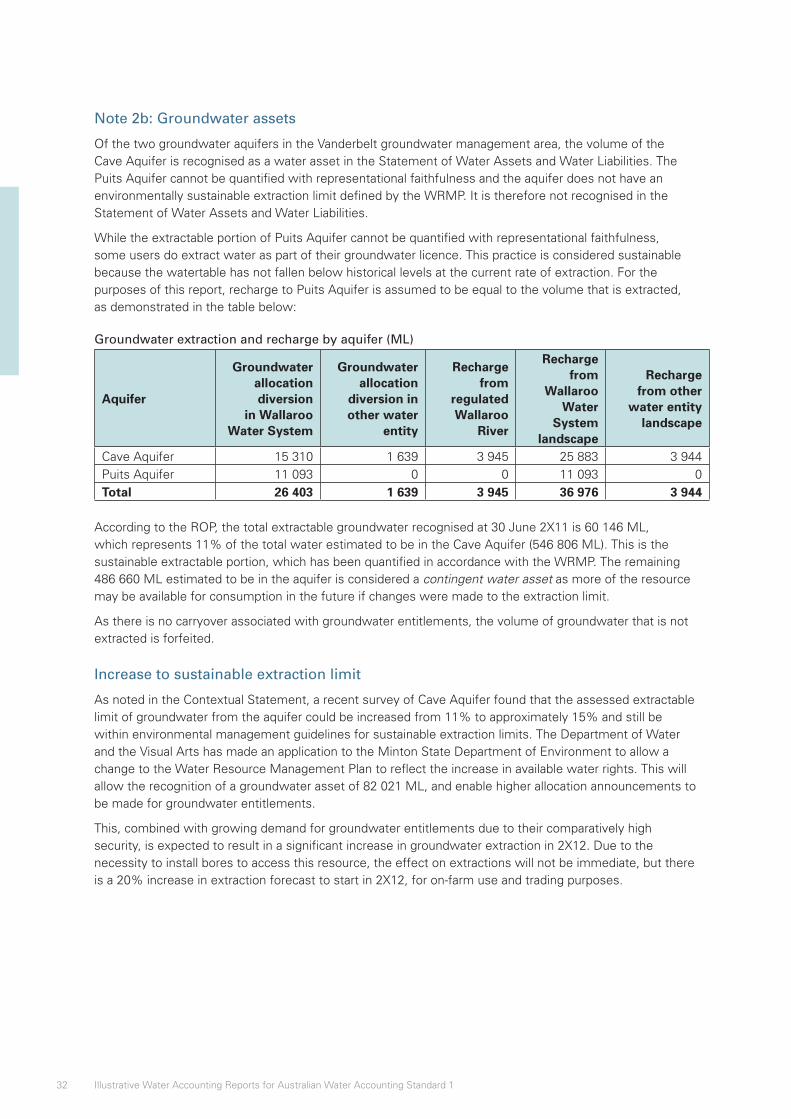
Note 2b: Groundwater assets
Of the two groundwater aquifers in the Vanderbelt groundwater management area, the volume of the Cave Aquifer is recognised as a water asset in the Statement of Water Assets and Water Liabilities. The Puits Aquifer cannot be quantified with representational faithfulness and the aquifer does not have an environmentally sustainable extraction limit defined by the WRMP. It is therefore not recognised in the Statement of Water Assets and Water Liabilities.
While the extractable portion of Puits Aquifer cannot be quantified with representational faithfulness, some users do extract water as part of their groundwater licence. This practice is considered sustainable because the watertable has not fallen below historical levels at the current rate of extraction. For the purposes of this report, recharge to Puits Aquifer is assumed to be equal to the volume that is extracted, as demonstrated in the table below:
Groundwater extraction and recharge by aquifer (ML)
Aquifer
Groundwater allocation diversion
in Wallaroo Water System
Groundwater allocation
diversion in other water
entity
Recharge from
regulated Wallaroo
River
Recharge from
Wallaroo Water
System landscape
Recharge from other
water entity landscape
Cave Aquifer 15 310 1 639 3 945 25 883 3 944Puits Aquifer 11 093 0 0 11 093 0Total 26 403 1 639 3 945 36 976 3 944
According to the ROP, the total extractable groundwater recognised at 30 June 2X11 is 60 146 ML, which represents 11% of the total water estimated to be in the Cave Aquifer (546 806 ML). This is the sustainable extractable portion, which has been quantified in accordance with the WRMP. The remaining 486 660 ML estimated to be in the aquifer is considered a contingent water asset as more of the resource may be available for consumption in the future if changes were made to the extraction limit.
As there is no carryover associated with groundwater entitlements, the volume of groundwater that is not extracted is forfeited.
Increase to sustainable extraction limit
As noted in the Contextual Statement, a recent survey of Cave Aquifer found that the assessed extractable limit of groundwater from the aquifer could be increased from 11% to approximately 15% and still be within environmental management guidelines for sustainable extraction limits. The Department of Water and the Visual Arts has made an application to the Minton State Department of Environment to allow a change to the Water Resource Management Plan to reflect the increase in available water rights. This will allow the recognition of a groundwater asset of 82 021 ML, and enable higher allocation announcements to be made for groundwater entitlements.
This, combined with growing demand for groundwater entitlements due to their comparatively high security, is expected to result in a significant increase in groundwater extraction in 2X12. Due to the necessity to install bores to access this resource, the effect on extractions will not be immediate, but there is a 20% increase in extraction forecast to start in 2X12, for on-farm use and trading purposes.
33Wallaroo Water System
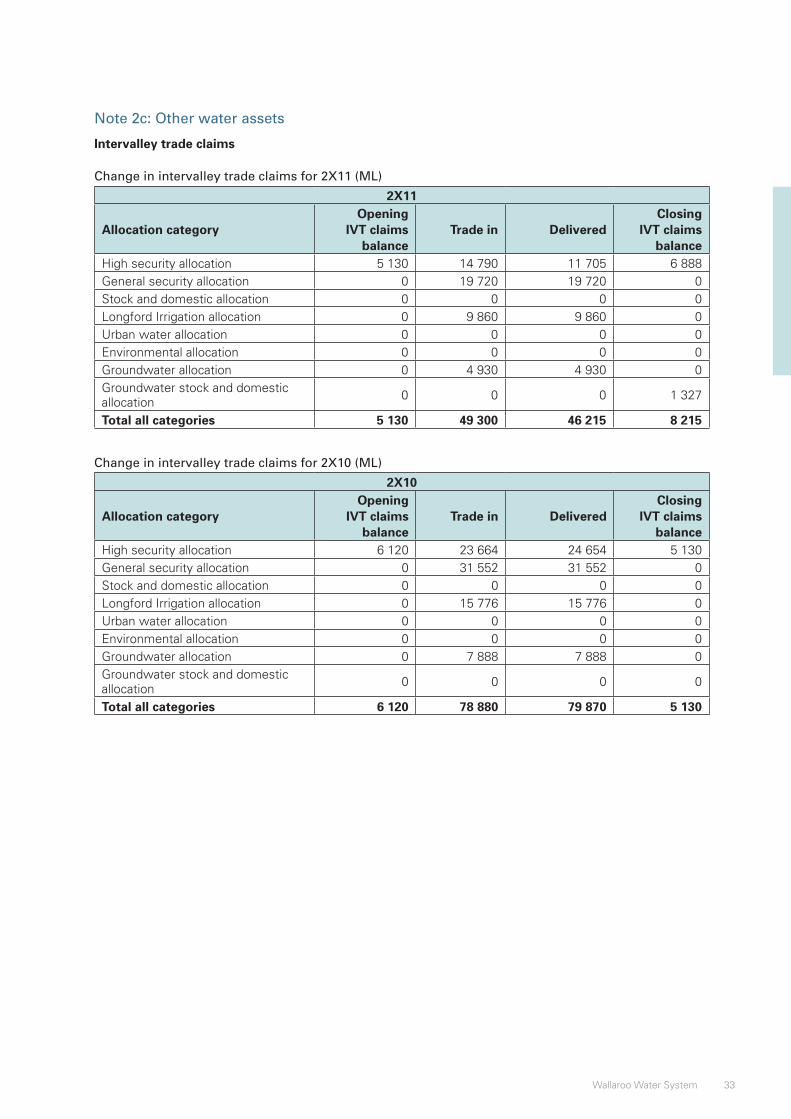
Note 2c: Other water assets
Intervalley trade claims
Change in intervalley trade claims for 2X11 (ML)
2X11
Allocation categoryOpening
IVT claims balance
Trade in DeliveredClosing
IVT claims balance
High security allocation 5 130 14 790 11 705 6 888General security allocation 0 19 720 19 720 0Stock and domestic allocation 0 0 0 0Longford Irrigation allocation 0 9 860 9 860 0Urban water allocation 0 0 0 0Environmental allocation 0 0 0 0Groundwater allocation 0 4 930 4 930 0Groundwater stock and domestic allocation
0 0 0 1 327
Total all categories 5 130 49 300 46 215 8 215
Change in intervalley trade claims for 2X10 (ML)
2X10
Allocation categoryOpening
IVT claims balance
Trade in DeliveredClosing
IVT claims balance
High security allocation 6 120 23 664 24 654 5 130General security allocation 0 31 552 31 552 0Stock and domestic allocation 0 0 0 0Longford Irrigation allocation 0 15 776 15 776 0Urban water allocation 0 0 0 0Environmental allocation 0 0 0 0Groundwater allocation 0 7 888 7 888 0Groundwater stock and domestic allocation
0 0 0 0
Total all categories 6 120 78 880 79 870 5 130
34 Illustrative Water Accounting Reports for Australian Water Accounting Standard 1
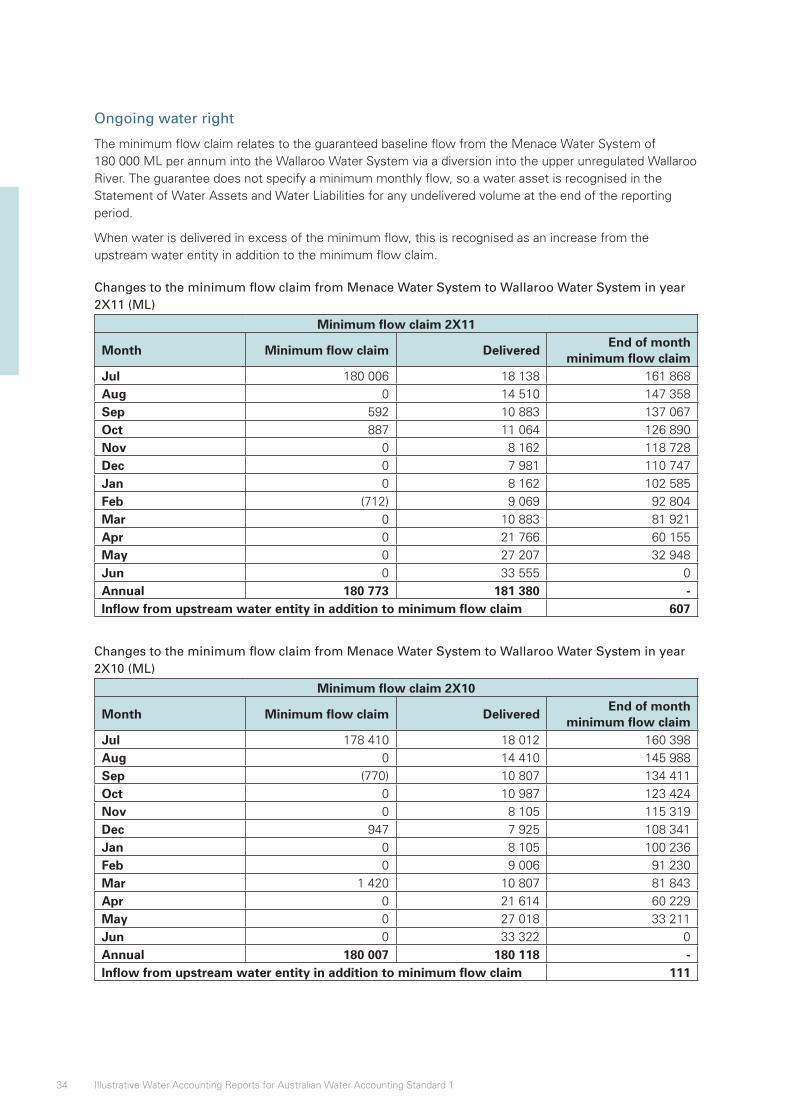
Ongoing water right
The minimum flow claim relates to the guaranteed baseline flow from the Menace Water System of 180 000 ML per annum into the Wallaroo Water System via a diversion into the upper unregulated Wallaroo River. The guarantee does not specify a minimum monthly flow, so a water asset is recognised in the Statement of Water Assets and Water Liabilities for any undelivered volume at the end of the reporting period.
When water is delivered in excess of the minimum flow, this is recognised as an increase from the upstream water entity in addition to the minimum flow claim.
Changes to the minimum flow claim from Menace Water System to Wallaroo Water System in year 2X11 (ML)
Minimum flow claim 2X11
Month Minimum flow claim DeliveredEnd of month
minimum flow claimJul 180 006 18 138 161 868Aug 0 14 510 147 358Sep 592 10 883 137 067Oct 887 11 064 126 890Nov 0 8 162 118 728Dec 0 7 981 110 747Jan 0 8 162 102 585Feb (712) 9 069 92 804Mar 0 10 883 81 921Apr 0 21 766 60 155May 0 27 207 32 948Jun 0 33 555 0Annual 180 773 181 380 -Inflow from upstream water entity in addition to minimum flow claim 607
Changes to the minimum flow claim from Menace Water System to Wallaroo Water System in year 2X10 (ML)
Minimum flow claim 2X10
Month Minimum flow claim DeliveredEnd of month
minimum flow claimJul 178 410 18 012 160 398Aug 0 14 410 145 988Sep (770) 10 807 134 411Oct 0 10 987 123 424Nov 0 8 105 115 319Dec 947 7 925 108 341Jan 0 8 105 100 236Feb 0 9 006 91 230Mar 1 420 10 807 81 843Apr 0 21 614 60 229May 0 27 018 33 211Jun 0 33 322 0Annual 180 007 180 118 -Inflow from upstream water entity in addition to minimum flow claim 111
35Wallaroo Water System
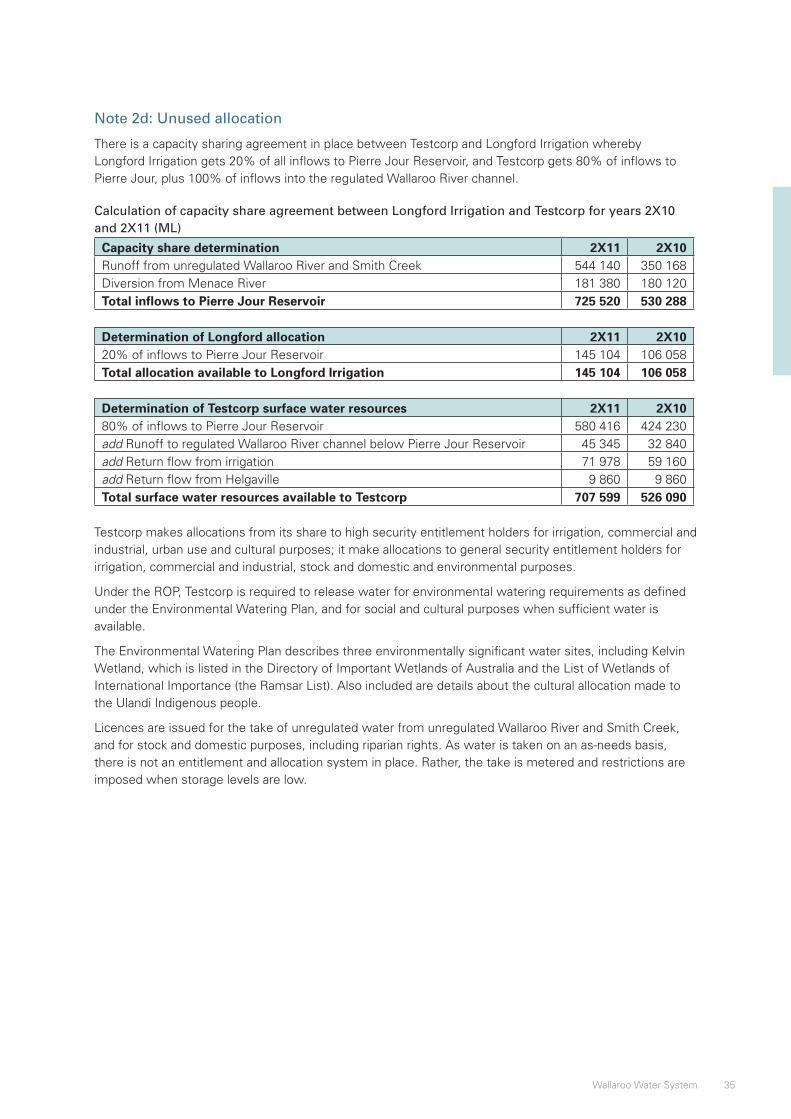
Note 2d: Unused allocation
There is a capacity sharing agreement in place between Testcorp and Longford Irrigation whereby Longford Irrigation gets 20% of all inflows to Pierre Jour Reservoir, and Testcorp gets 80% of inflows to Pierre Jour, plus 100% of inflows into the regulated Wallaroo River channel.
Calculation of capacity share agreement between Longford Irrigation and Testcorp for years 2X10 and 2X11 (ML)
Capacity share determination 2X11 2X10Runoff from unregulated Wallaroo River and Smith Creek 544 140 350 168Diversion from Menace River 181 380 180 120Total inflows to Pierre Jour Reservoir 725 520 530 288
Determination of Longford allocation 2X11 2X10²⁰% of inflows to Pierre Jour Reservoir 145 104 106 058Total allocation available to Longford Irrigation 145 104 106 058
Determination of Testcorp surface water resources 2X11 2X1080% of inflows to Pierre Jour Reservoir 580 416 424 230add Runoff to regulated Wallaroo River channel below Pierre Jour Reservoir 45 345 32 840add Return flow from irrigation 71 978 59 160add Return flow from Helgaville 9 860 9 860Total surface water resources available to Testcorp 707 599 526 090
Testcorp makes allocations from its share to high security entitlement holders for irrigation, commercial and industrial, urban use and cultural purposes; it make allocations to general security entitlement holders for irrigation, commercial and industrial, stock and domestic and environmental purposes.
Under the ROP, Testcorp is required to release water for environmental watering requirements as defined under the Environmental Watering Plan, and for social and cultural purposes when sufficient water is available.
The Environmental Watering Plan describes three environmentally significant water sites, including Kelvin Wetland, which is listed in the Directory of Important Wetlands of Australia and the List of Wetlands of International Importance (the Ramsar List). Also included are details about the cultural allocation made to the Ulandi Indigenous people.
Licences are issued for the take of unregulated water from unregulated Wallaroo River and Smith Creek, and for stock and domestic purposes, including riparian rights. As water is taken on an as-needs basis, there is not an entitlement and allocation system in place. Rather, the take is metered and restrictions are imposed when storage levels are low.
36 Illustrative Water Accounting Reports for Australian Water Accounting Standard 1
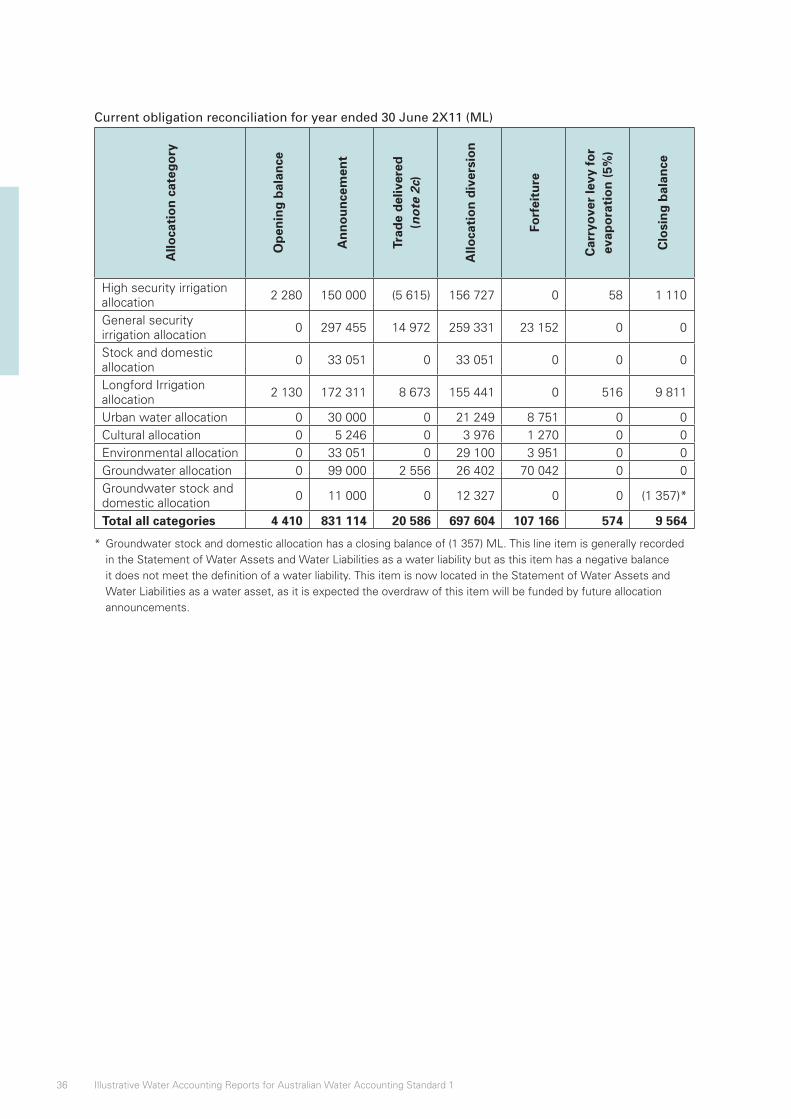
Current obligation reconciliation for year ended 30 June 2X11 (ML)
Allo
cati
on
cat
ego
ry
Op
enin
g b
alan
ce
An
no
un
cem
ent
Trad
e d
eliv
ered
(n
ote
2c)
Allo
cati
on
div
ersi
on
Forf
eitu
re
Car
ryo
ver
levy
fo
r ev
apo
rati
on
(5%
)
Clo
sin
g b
alan
ce
High security irrigation allocation
2 280 150 000 (5 615) 156 727 0 58 1 110
General security irrigation allocation
0 297 455 14 972 259 331 23 152 0 0
Stock and domestic allocation
0 33 051 0 33 051 0 0 0
Longford Irrigation allocation
2 130 172 311 8 673 155 441 0 516 9 811
Urban water allocation 0 30 000 0 21 249 8 751 0 0Cultural allocation 0 5 246 0 3 976 1 270 0 0Environmental allocation 0 33 051 0 29 100 3 951 0 0Groundwater allocation 0 99 000 2 556 26 402 70 042 0 0Groundwater stock and domestic allocation
0 11 000 0 12 327 0 0 (1 357)*
Total all categories 4 410 831 114 20 586 697 604 107 166 574 9 564
* Groundwater stock and domestic allocation has a closing balance of (1 357) ML. This line item is generally recorded in the Statement of Water Assets and Water Liabilities as a water liability but as this item has a negative balance it does not meet the definition of a water liability. This item is now located in the Statement of Water Assets and Water Liabilities as a water asset, as it is expected the overdraw of this item will be funded by future allocation announcements.
37Wallaroo Water System
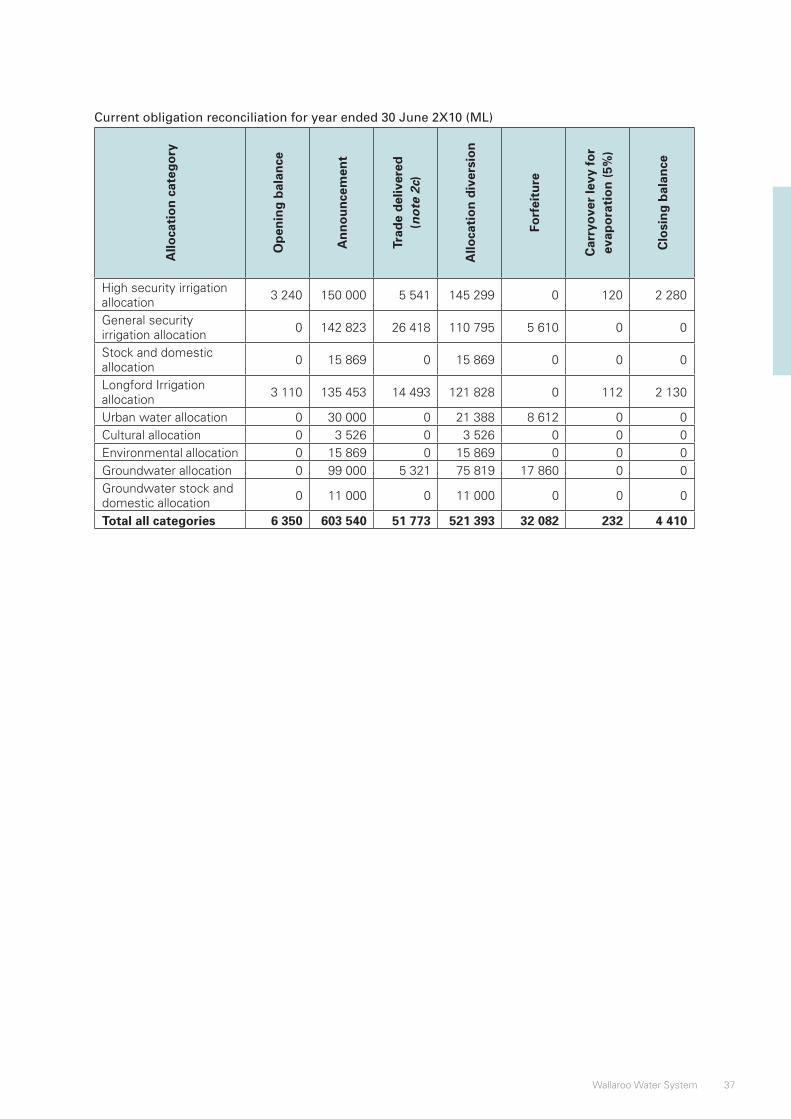
Current obligation reconciliation for year ended 30 June 2X10 (ML)
Allo
cati
on
cat
ego
ry
Op
enin
g b
alan
ce
An
no
un
cem
ent
Trad
e d
eliv
ered
(n
ote
2c)
Allo
cati
on
div
ersi
on
Forf
eitu
re
Car
ryo
ver
levy
fo
r ev
apo
rati
on
(5%
)
Clo
sin
g b
alan
ce
High security irrigation allocation
3 240 150 000 5 541 145 299 0 120 2 280
General security irrigation allocation
0 142 823 26 418 110 795 5 610 0 0
Stock and domestic allocation
0 15 869 0 15 869 0 0 0
Longford Irrigation allocation
3 110 135 453 14 493 121 828 0 112 2 130
Urban water allocation 0 30 000 0 21 388 8 612 0 0Cultural allocation 0 3 526 0 3 526 0 0 0Environmental allocation 0 15 869 0 15 869 0 0 0Groundwater allocation 0 99 000 5 321 75 819 17 860 0 0Groundwater stock and domestic allocation
0 11 000 0 11 000 0 0 0
Total all categories 6 350 603 540 51 773 521 393 32 082 232 4 410
38 Illustrative Water Accounting Reports for Australian Water Accounting Standard 1
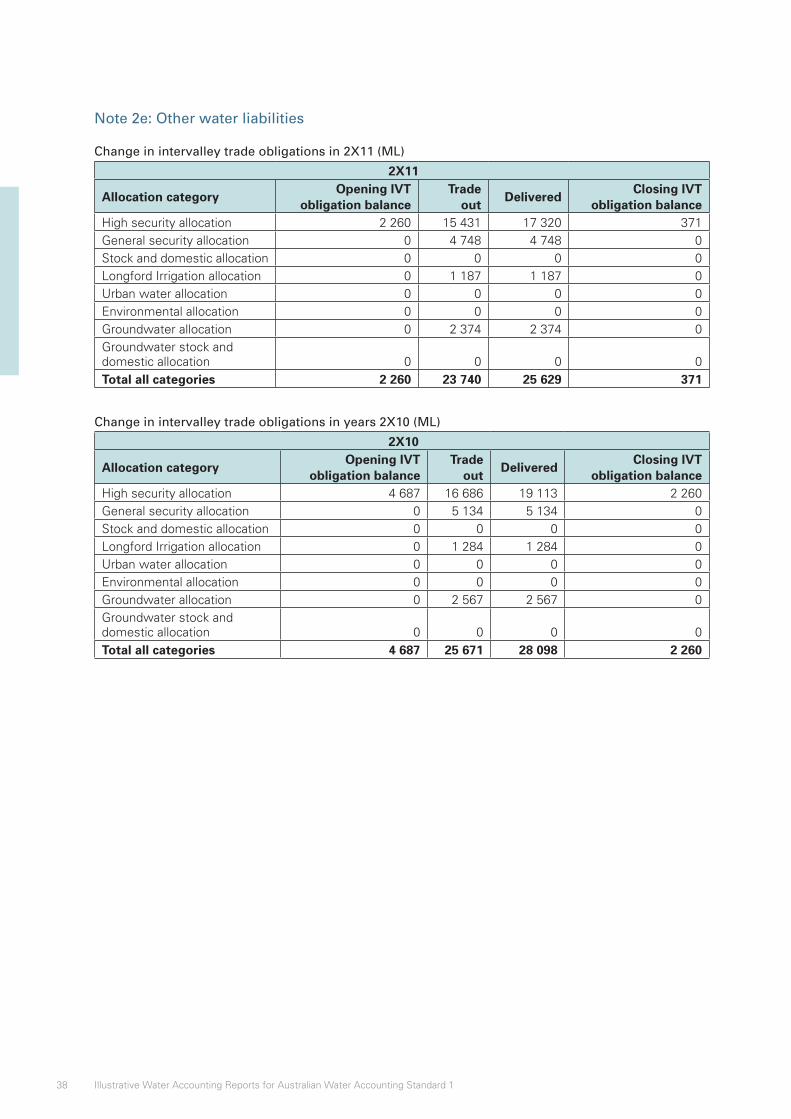
Note 2e: Other water liabilities
Change in intervalley trade obligations in 2X11 (ML)
2X11
Allocation categoryOpening IVT
obligation balanceTrade
outDelivered
Closing IVT obligation balance
High security allocation 2 260 15 431 17 320 371General security allocation 0 4 748 4 748 0Stock and domestic allocation 0 0 0 0Longford Irrigation allocation 0 1 187 1 187 0Urban water allocation 0 0 0 0Environmental allocation 0 0 0 0Groundwater allocation 0 2 374 2 374 0Groundwater stock and domestic allocation 0 0 0 0Total all categories 2 260 23 740 25 629 371
Change in intervalley trade obligations in years 2X10 (ML)
2X10
Allocation categoryOpening IVT
obligation balanceTrade
outDelivered
Closing IVT obligation balance
High security allocation 4 687 16 686 19 113 2 260General security allocation 0 5 134 5 134 0Stock and domestic allocation 0 0 0 0Longford Irrigation allocation 0 1 284 1 284 0Urban water allocation 0 0 0 0Environmental allocation 0 0 0 0Groundwater allocation 0 2 567 2 567 0Groundwater stock and domestic allocation 0 0 0 0Total all categories 4 687 25 671 28 098 2 260
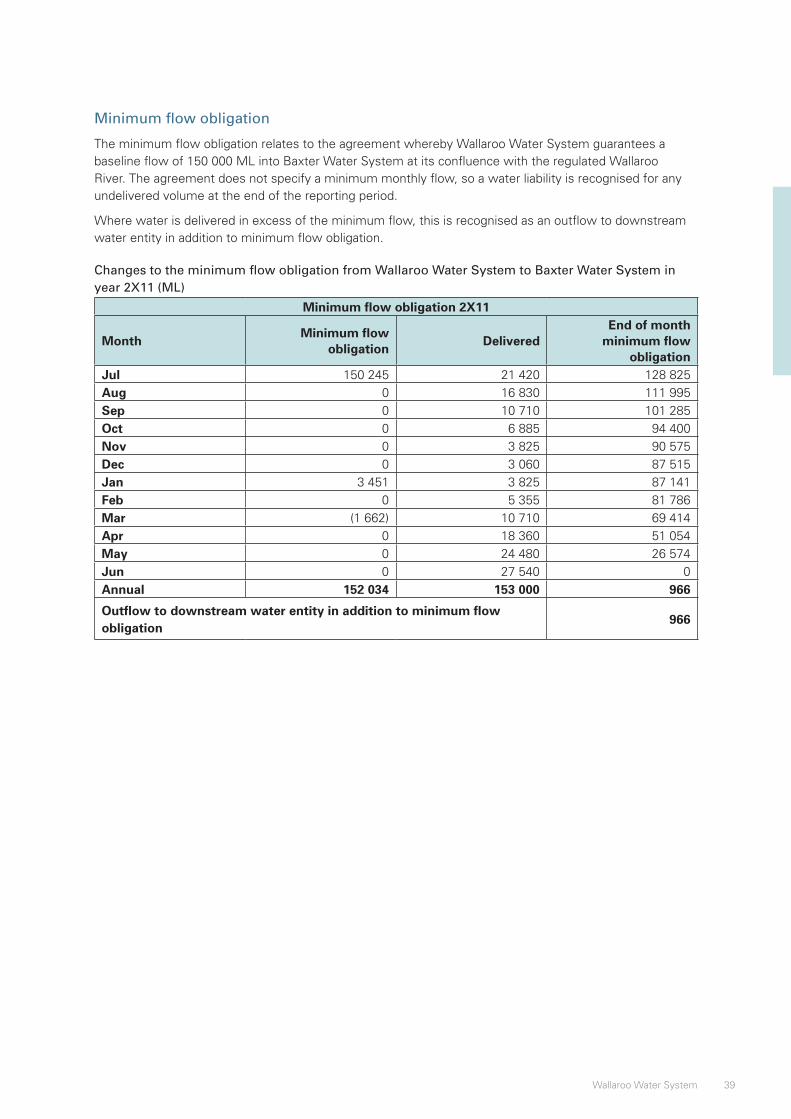
39Wallaroo Water System
Minimum flow obligation
The minimum flow obligation relates to the agreement whereby Wallaroo Water System guarantees a baseline flow of 150 000 ML into Baxter Water System at its confluence with the regulated Wallaroo River. The agreement does not specify a minimum monthly flow, so a water liability is recognised for any undelivered volume at the end of the reporting period.
Where water is delivered in excess of the minimum flow, this is recognised as an outflow to downstream water entity in addition to minimum flow obligation.
Changes to the minimum flow obligation from Wallaroo Water System to Baxter Water System in year 2X11 (ML)
Minimum flow obligation 2X11
MonthMinimum flow
obligationDelivered
End of month minimum flow
obligationJul 150 245 21 420 128 825Aug 0 16 830 111 995Sep 0 10 710 101 285Oct 0 6 885 94 400Nov 0 3 825 90 575Dec 0 3 060 87 515Jan 3 451 3 825 87 141Feb 0 5 355 81 786Mar (1 662) 10 710 69 414Apr 0 18 360 51 054May 0 24 480 26 574Jun 0 27 540 0Annual 152 034 153 000 966
Outflow to downstream water entity in addition to minimum flow obligation
966
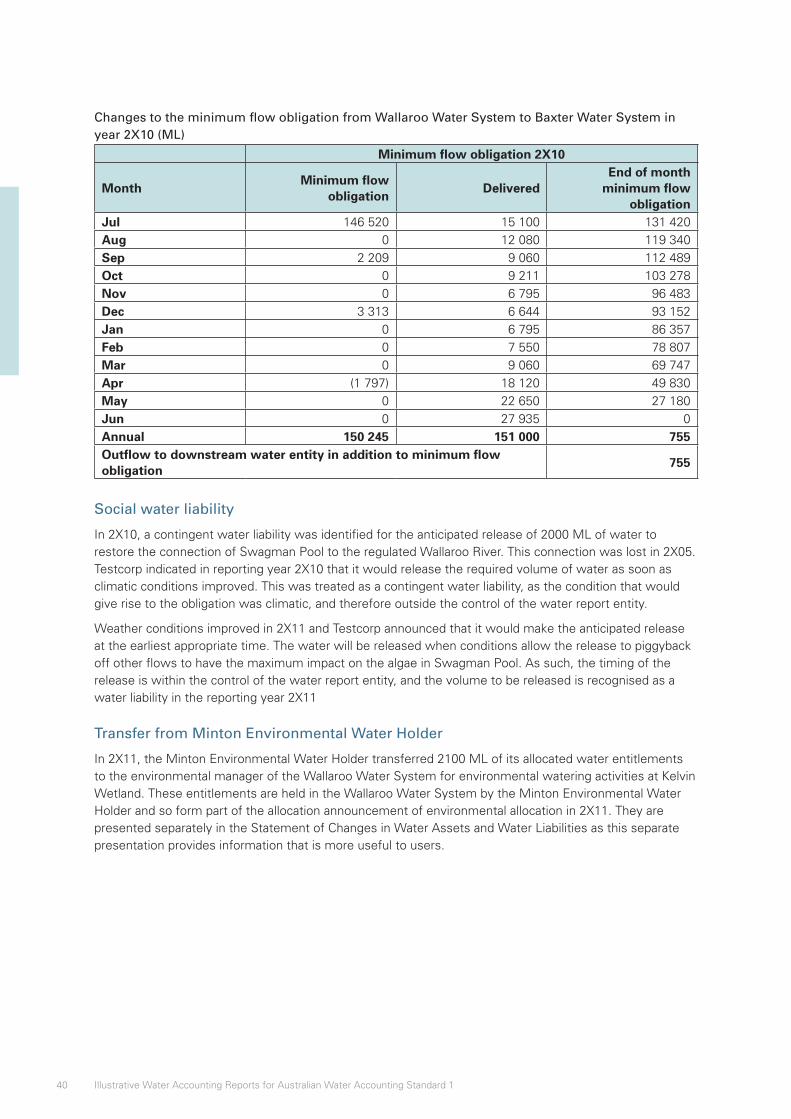
40 Illustrative Water Accounting Reports for Australian Water Accounting Standard 1
Changes to the minimum flow obligation from Wallaroo Water System to Baxter Water System in year 2X10 (ML)
Minimum flow obligation 2X10
MonthMinimum flow
obligationDelivered
End of month minimum flow
obligationJul 146 520 15 100 131 420Aug 0 12 080 119 340Sep 2 209 9 060 112 489Oct 0 9 211 103 278Nov 0 6 795 96 483Dec 3 313 6 644 93 152Jan 0 6 795 86 357Feb 0 7 550 78 807Mar 0 9 060 69 747Apr (1 797) 18 120 49 830May 0 22 650 27 180Jun 0 27 935 0Annual 150 245 151 000 755Outflow to downstream water entity in addition to minimum flow obligation
755
Social water liability
In 2X10, a contingent water liability was identified for the anticipated release of 2000 ML of water to restore the connection of Swagman Pool to the regulated Wallaroo River. This connection was lost in 2X05. Testcorp indicated in reporting year 2X10 that it would release the required volume of water as soon as climatic conditions improved. This was treated as a contingent water liability, as the condition that would give rise to the obligation was climatic, and therefore outside the control of the water report entity.
Weather conditions improved in 2X11 and Testcorp announced that it would make the anticipated release at the earliest appropriate time. The water will be released when conditions allow the release to piggyback off other flows to have the maximum impact on the algae in Swagman Pool. As such, the timing of the release is within the control of the water report entity, and the volume to be released is recognised as a water liability in the reporting year 2X11
Transfer from Minton Environmental Water Holder
In 2X11, the Minton Environmental Water Holder transferred 2100 ML of its allocated water entitlements to the environmental manager of the Wallaroo Water System for environmental watering activities at Kelvin Wetland. These entitlements are held in the Wallaroo Water System by the Minton Environmental Water Holder and so form part of the allocation announcement of environmental allocation in 2X11. They are presented separately in the Statement of Changes in Water Assets and Water Liabilities as this separate presentation provides information that is more useful to users.
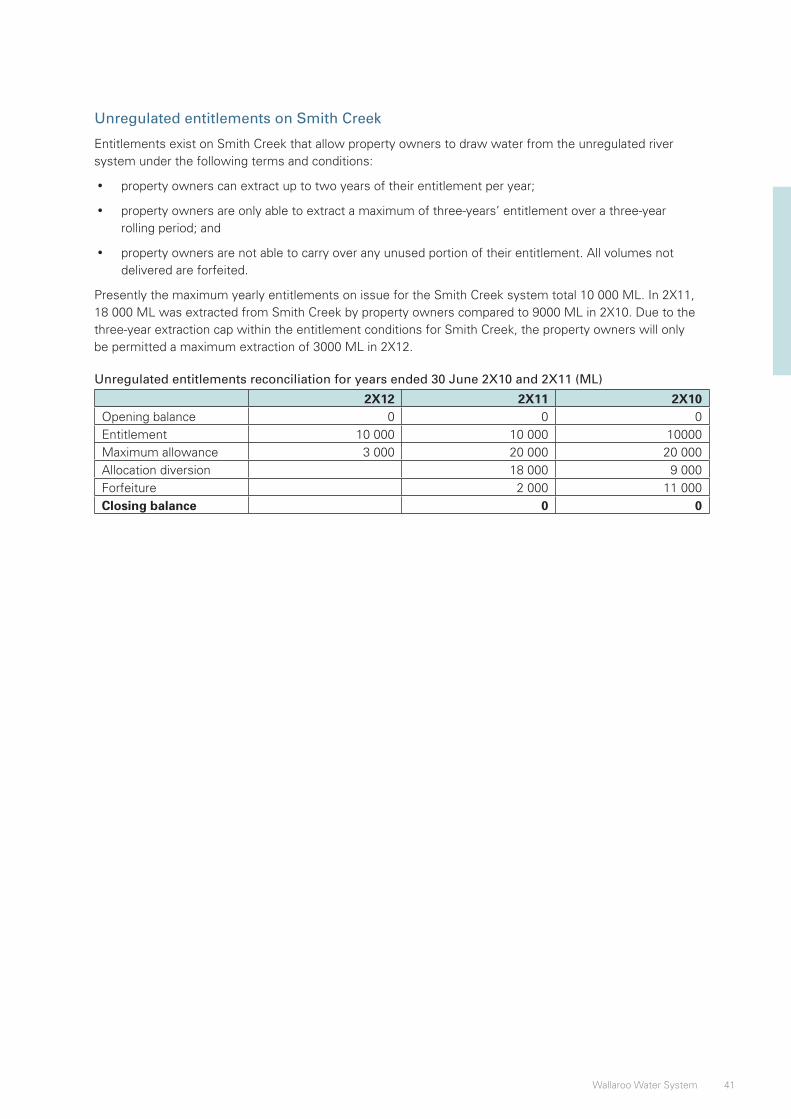
41Wallaroo Water System
Unregulated entitlements on Smith Creek
Entitlements exist on Smith Creek that allow property owners to draw water from the unregulated river system under the following terms and conditions:
• property owners can extract up to two years of their entitlement per year;
• property owners are only able to extract a maximum of three-years’ entitlement over a three-year rolling period; and
• property owners are not able to carry over any unused portion of their entitlement. All volumes not delivered are forfeited.
Presently the maximum yearly entitlements on issue for the Smith Creek system total 10 000 ML. In 2X11, 18 000 ML was extracted from Smith Creek by property owners compared to 9000 ML in 2X10. Due to the three-year extraction cap within the entitlement conditions for Smith Creek, the property owners will only be permitted a maximum extraction of 3000 ML in 2X12.
Unregulated entitlements reconciliation for years ended 30 June 2X10 and 2X11 (ML)
2X12 2X11 2X10Opening balance 0 0 0Entitlement 10 000 10 000 10000Maximum allowance 3 000 20 000 20 000 Allocation diversion 18 000 9 000Forfeiture 2 000 11 000Closing balance 0 0
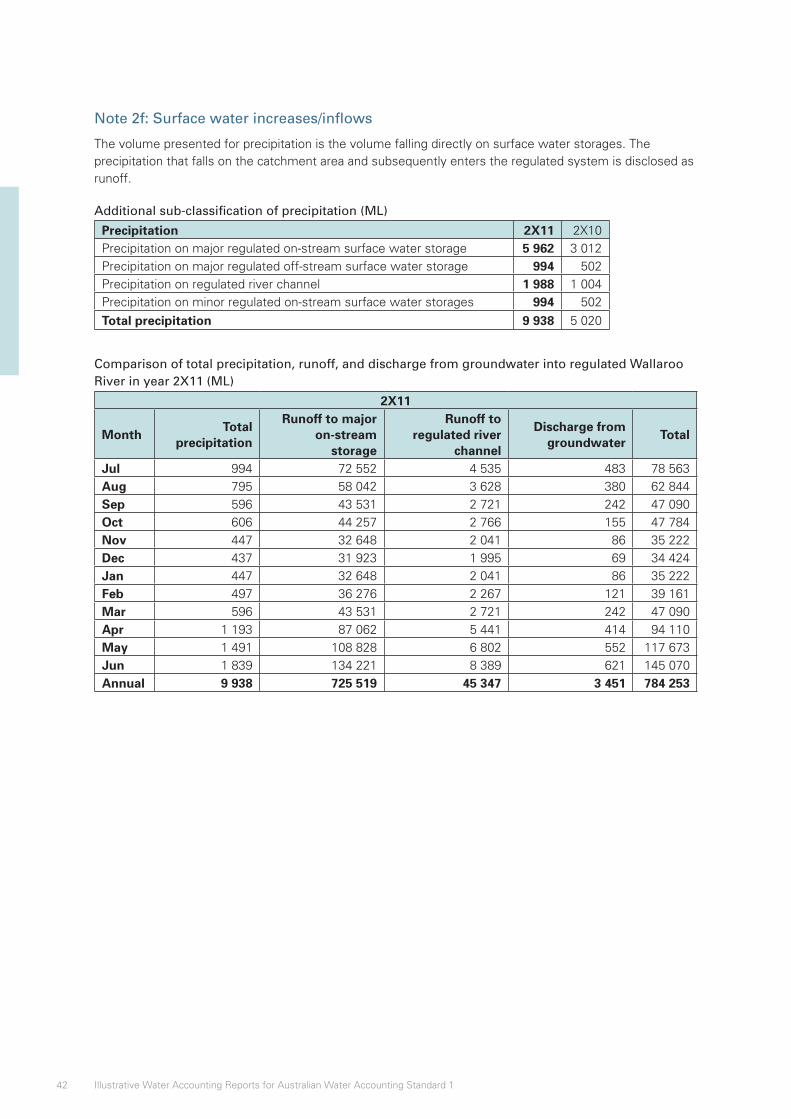
42 Illustrative Water Accounting Reports for Australian Water Accounting Standard 1
Note 2f: Surface water increases/inflows
The volume presented for precipitation is the volume falling directly on surface water storages. The precipitation that falls on the catchment area and subsequently enters the regulated system is disclosed as runoff.
Additional sub-classification of precipitation (ML)
Precipitation 2X11 2X10Precipitation on major regulated on-stream surface water storage 5 962 3 012Precipitation on major regulated off-stream surface water storage 994 502Precipitation on regulated river channel 1 988 1 004Precipitation on minor regulated on-stream surface water storages 994 502
Total precipitation 9 938 5 020
Comparison of total precipitation, runoff, and discharge from groundwater into regulated Wallaroo River in year 2X11 (ML)
2X11
MonthTotal
precipitation
Runoff to major on-stream
storage
Runoff to regulated river
channel
Discharge from groundwater
Total
Jul 994 72 552 4 535 483 78 563Aug 795 58 042 3 628 380 62 844Sep 596 43 531 2 721 242 47 090Oct 606 44 257 2 766 155 47 784Nov 447 32 648 2 041 86 35 222Dec 437 31 923 1 995 69 34 424Jan 447 32 648 2 041 86 35 222Feb 497 36 276 2 267 121 39 161Mar 596 43 531 2 721 242 47 090Apr 1 193 87 062 5 441 414 94 110May 1 491 108 828 6 802 552 117 673Jun 1 839 134 221 8 389 621 145 070Annual 9 938 725 519 45 347 3 451 784 253
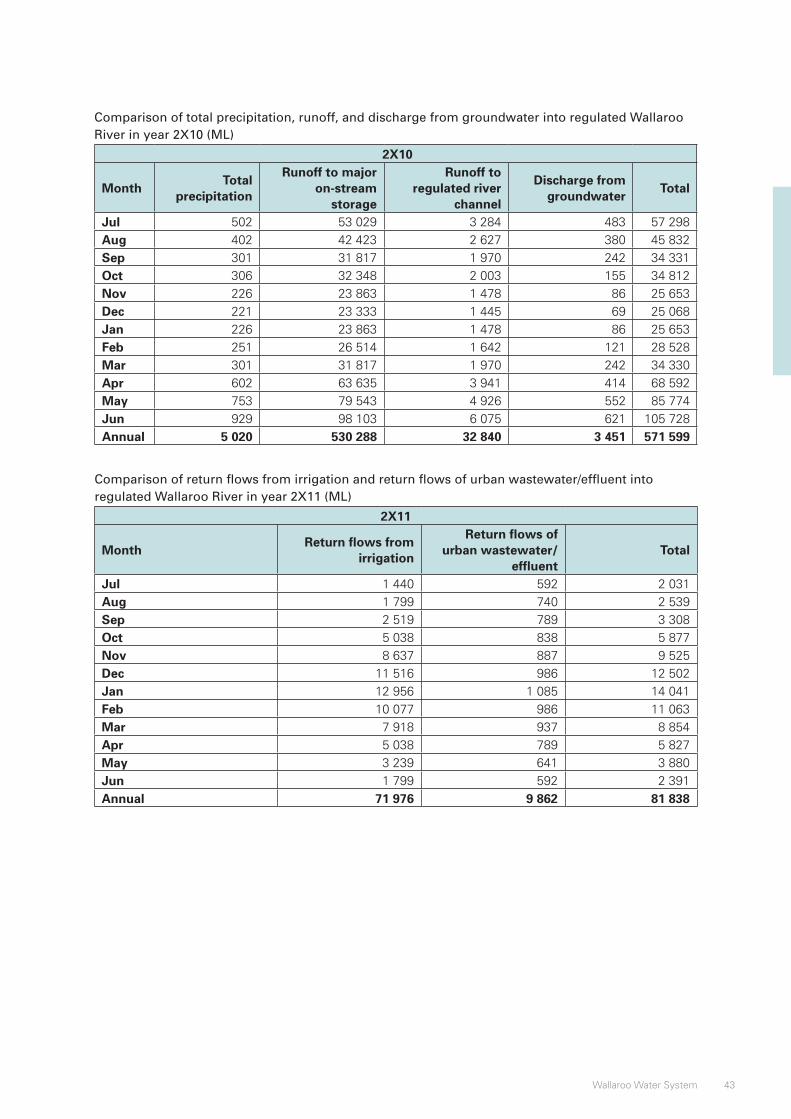
43Wallaroo Water System
Comparison of total precipitation, runoff, and discharge from groundwater into regulated Wallaroo River in year 2X10 (ML)
2X10
MonthTotal
precipitation
Runoff to major on-stream
storage
Runoff to regulated river
channel
Discharge from groundwater
Total
Jul 502 53 029 3 284 483 57 298Aug 402 42 423 2 627 380 45 832Sep 301 31 817 1 970 242 34 331Oct 306 32 348 2 003 155 34 812Nov 226 23 863 1 478 86 25 653Dec 221 23 333 1 445 69 25 068Jan 226 23 863 1 478 86 25 653Feb 251 26 514 1 642 121 28 528Mar 301 31 817 1 970 242 34 330Apr 602 63 635 3 941 414 68 592May 753 79 543 4 926 552 85 774Jun 929 98 103 6 075 621 105 728Annual 5 020 530 288 32 840 3 451 571 599
Comparison of return flows from irrigation and return flows of urban wastewater/effluent into regulated Wallaroo River in year 2X11 (ML)
2X11
MonthReturn flows from
irrigation
Return flows of urban wastewater/
effluentTotal
Jul 1 440 592 2 031Aug 1 799 740 2 539Sep 2 519 789 3 308Oct 5 038 838 5 877Nov 8 637 887 9 525Dec 11 516 986 12 502Jan 12 956 1 085 14 041Feb 10 077 986 11 063Mar 7 918 937 8 854Apr 5 038 789 5 827May 3 239 641 3 880Jun 1 799 592 2 391Annual 71 976 9 862 81 838
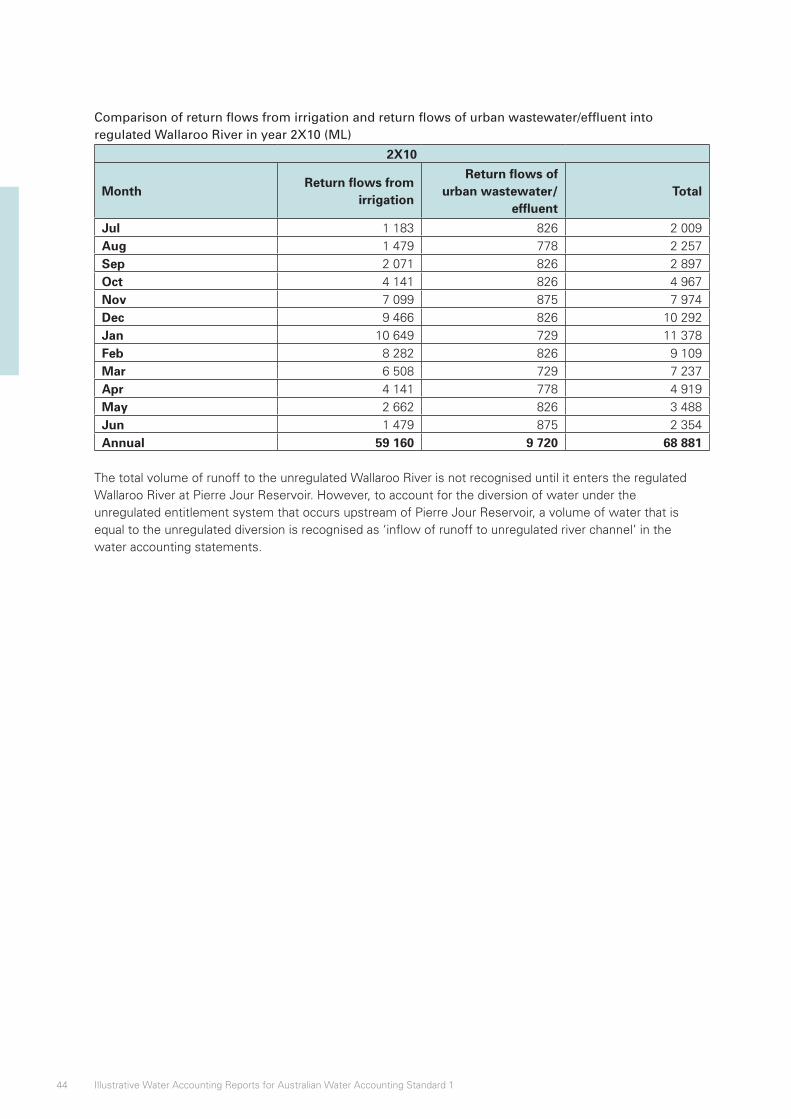
44 Illustrative Water Accounting Reports for Australian Water Accounting Standard 1
Comparison of return flows from irrigation and return flows of urban wastewater/effluent into regulated Wallaroo River in year 2X10 (ML)
2X10
MonthReturn flows from
irrigation
Return flows of urban wastewater/
effluentTotal
Jul 1 183 826 2 009Aug 1 479 778 2 257Sep 2 071 826 2 897Oct 4 141 826 4 967Nov 7 099 875 7 974Dec 9 466 826 10 292Jan 10 649 729 11 378Feb 8 282 826 9 109Mar 6 508 729 7 237Apr 4 141 778 4 919May 2 662 826 3 488Jun 1 479 875 2 354Annual 59 160 9 720 68 881
The total volume of runoff to the unregulated Wallaroo River is not recognised until it enters the regulated Wallaroo River at Pierre Jour Reservoir. However, to account for the diversion of water under the unregulated entitlement system that occurs upstream of Pierre Jour Reservoir, a volume of water that is equal to the unregulated diversion is recognised as ‘inflow of runoff to unregulated river channel’ in the water accounting statements.
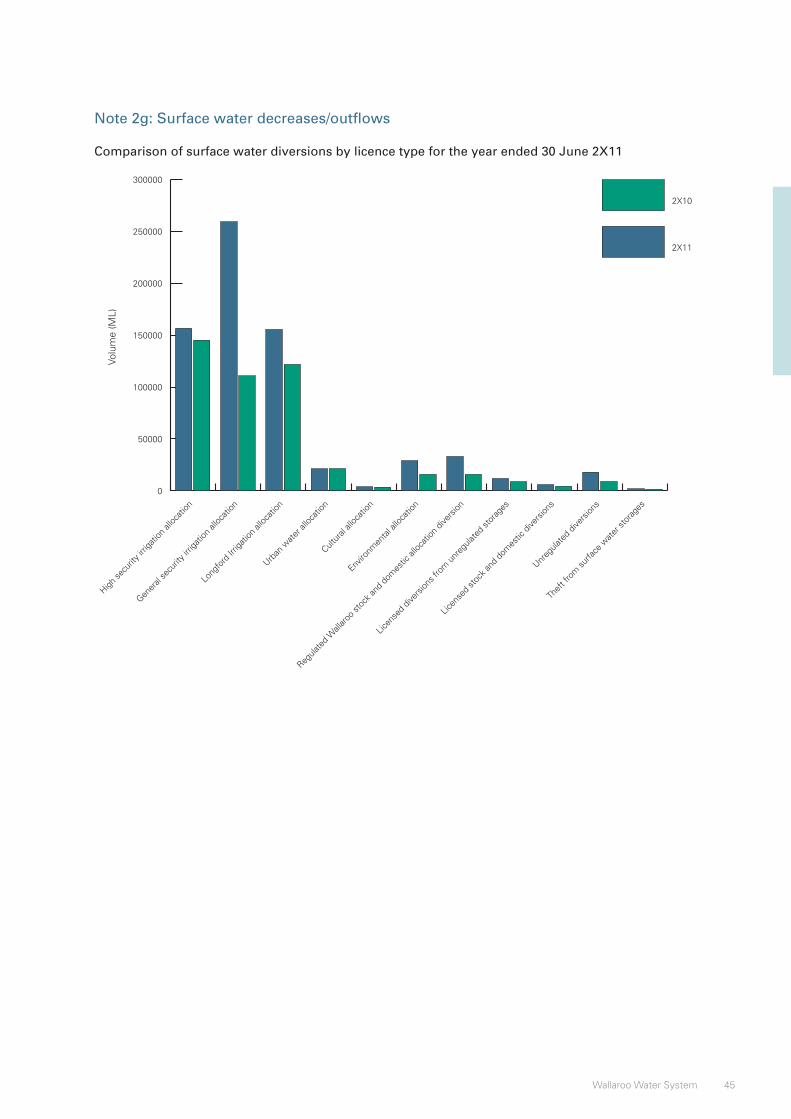
45Wallaroo Water System
Note 2g: Surface water decreases/outflows
Comparison of surface water diversions by licence type for the year ended 30 June 2X11
0
50000
100000
150000
200000
250000
300000
2X10
2X11
Thef
t fro
m su
rface
wat
er st
orag
es
Unreg
ulate
d div
ersio
ns
Licen
sed
stoc
k and
dom
estic
dive
rsion
s
Licen
sed
diver
sions
from
unr
egula
ted
stor
ages
Regula
ted
Wall
aroo
stoc
k and
dom
estic
alloc
ation
dive
rsion
Enviro
nmen
tal a
lloca
tion
Cultur
al all
ocat
ion
Urban
wat
er al
locat
ion
Long
ford
Irrig
ation
alloc
ation
Gener
al se
curit
y irri
gatio
n all
ocat
ion
High se
curit
y irri
gatio
n all
ocat
ion
Volu
me
(ML)
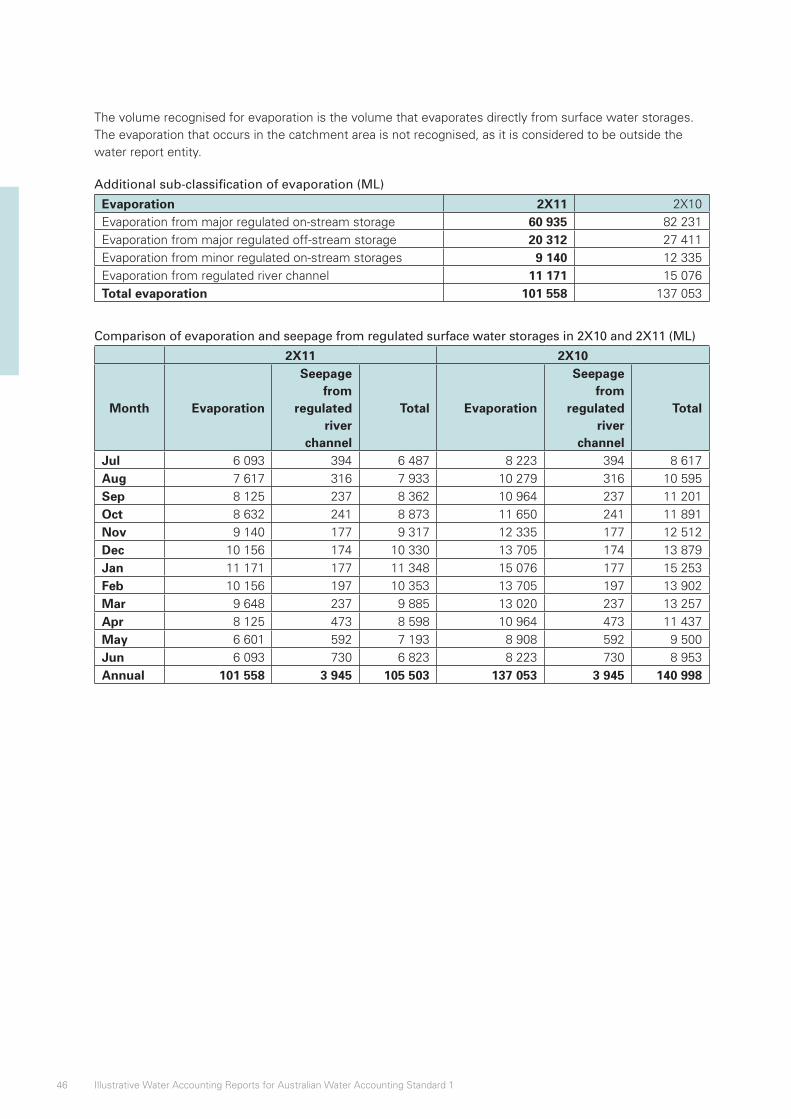
46 Illustrative Water Accounting Reports for Australian Water Accounting Standard 1
The volume recognised for evaporation is the volume that evaporates directly from surface water storages. The evaporation that occurs in the catchment area is not recognised, as it is considered to be outside the water report entity.
Additional sub-classification of evaporation (ML)
Evaporation 2X11 2X10Evaporation from major regulated on-stream storage 60 935 82 231 Evaporation from major regulated off-stream storage 20 312 27 411 Evaporation from minor regulated on-stream storages 9 140 12 335 Evaporation from regulated river channel 11 171 15 076 Total evaporation 101 558 137 053
Comparison of evaporation and seepage from regulated surface water storages in 2X10 and 2X11 (ML)
2X11 2X10
Month Evaporation
Seepage from
regulated river
channel
Total Evaporation
Seepage from
regulated river
channel
Total
Jul 6 093 394 6 487 8 223 394 8 617Aug 7 617 316 7 933 10 279 316 10 595Sep 8 125 237 8 362 10 964 237 11 201Oct 8 632 241 8 873 11 650 241 11 891Nov 9 140 177 9 317 12 335 177 12 512Dec 10 156 174 10 330 13 705 174 13 879Jan 11 171 177 11 348 15 076 177 15 253Feb 10 156 197 10 353 13 705 197 13 902Mar 9 648 237 9 885 13 020 237 13 257Apr 8 125 473 8 598 10 964 473 11 437May 6 601 592 7 193 8 908 592 9 500Jun 6 093 730 6 823 8 223 730 8 953Annual 101 558 3 945 105 503 137 053 3 945 140 998
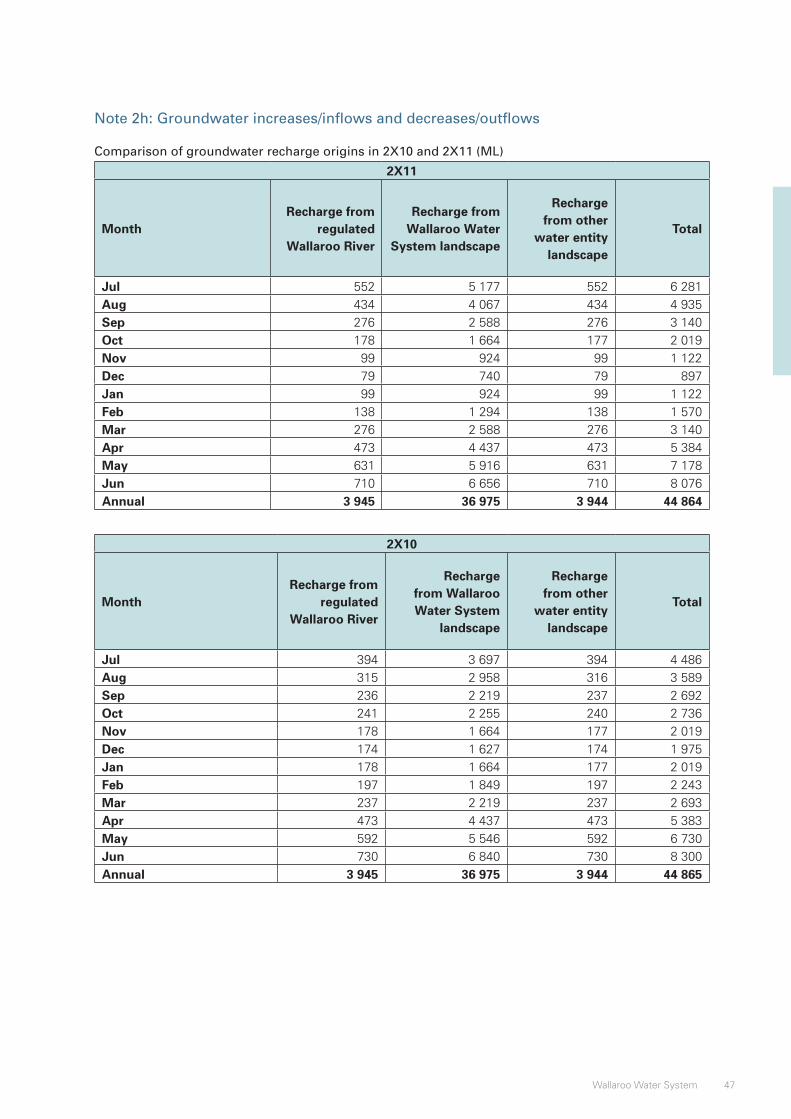
47Wallaroo Water System
Note 2h: Groundwater increases/inflows and decreases/outflows
Comparison of groundwater recharge origins in 2X10 and 2X11 (ML)
2X11
MonthRecharge from
regulated Wallaroo River
Recharge from Wallaroo Water
System landscape
Recharge from other
water entity landscape
Total
Jul 552 5 177 552 6 281Aug 434 4 067 434 4 935Sep 276 2 588 276 3 140Oct 178 1 664 177 2 019Nov 99 924 99 1 122Dec 79 740 79 897Jan 99 924 99 1 122Feb 138 1 294 138 1 570Mar 276 2 588 276 3 140Apr 473 4 437 473 5 384May 631 5 916 631 7 178Jun 710 6 656 710 8 076Annual 3 945 36 975 3 944 44 864
2X10
MonthRecharge from
regulated Wallaroo River
Recharge from Wallaroo Water System
landscape
Recharge from other
water entity landscape
Total
Jul 394 3 697 394 4 486Aug 315 2 958 316 3 589Sep 236 2 219 237 2 692Oct 241 2 255 240 2 736Nov 178 1 664 177 2 019Dec 174 1 627 174 1 975Jan 178 1 664 177 2 019Feb 197 1 849 197 2 243Mar 237 2 219 237 2 693Apr 473 4 437 473 5 383May 592 5 546 592 6 730Jun 730 6 840 730 8 300Annual 3 945 36 975 3 944 44 865
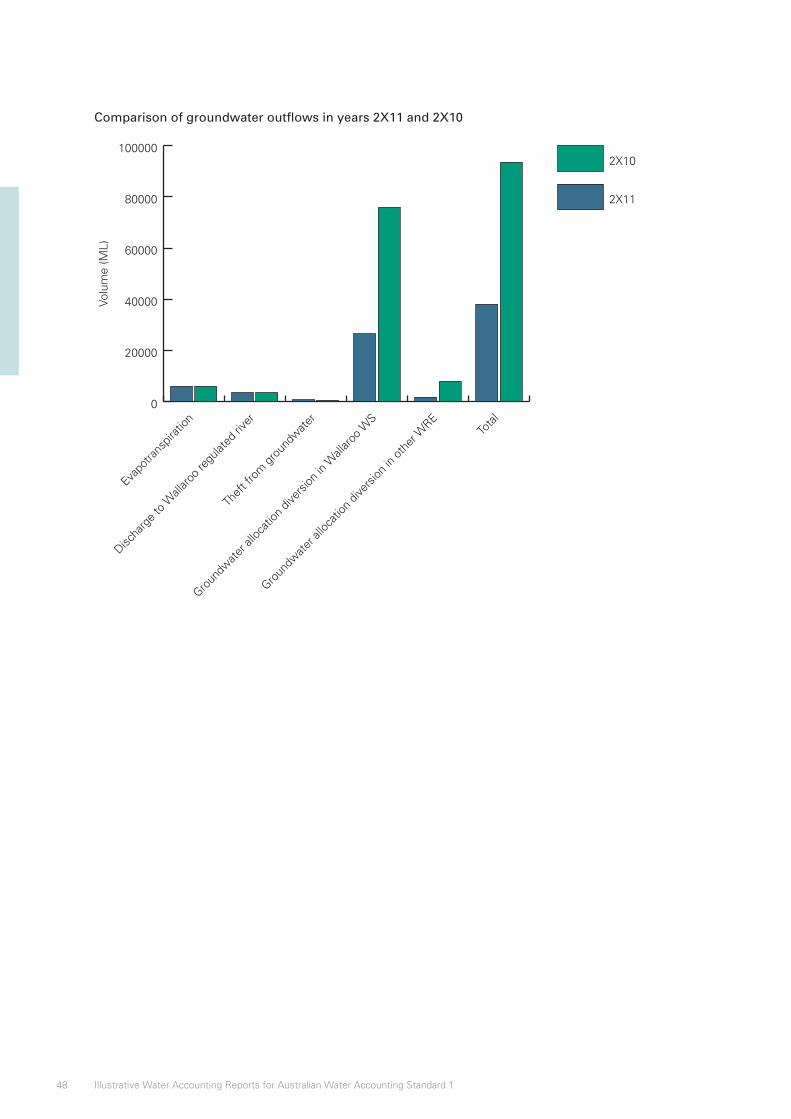
48 Illustrative Water Accounting Reports for Australian Water Accounting Standard 1
Comparison of groundwater outflows in years 2X11 and 2X10
0
20000
40000
60000
80000
1000002X10
2X11
Tota
l
Groun
dwat
er al
locat
ion d
ivers
ion in
oth
er W
RE
Groun
dwat
er al
locat
ion d
ivers
ion in
Wall
aroo
WS
Thef
t fro
m g
roun
dwat
er
Discha
rge
to W
allar
oo re
gulat
ed ri
ver
Evapo
trans
pirat
ion
Volu
me
(ML)
49Wallaroo Water System
Note 2i: Non-adjusting events after the end of the reporting period
On 1 October 2X11, the Water Resource Manager announced the first water allocation in accordance with the ROP for the regulated Wallaroo Water System. The announcements made are similar to the 2X11 reporting period and are allowed to be called upon at the announcement date according to the individual licence holders agreements.
For further information in relation to the allocation announcement see note 7b.
Note 2j: Water assets and water liabilities that fail the recognition criteria
Puits Aquifer
The volume of water in the Puits Aquifer cannot be quantified with representational faithfulness and the aquifer does not have an environmentally sustainable extraction limit defined by the water resource management plan. Therefore, it does not satisfy the recognition criteria for water assets and is not recognised in the Statement of Water Assets and Water Liabilities.
Unregulated river channel and regulated river channel
The water within the unregulated river channel and regulated river channel cannot be quantified with representational faithfulness. The water within these channels is vital to the water report entity for conveying water to reservoirs and to users, such as irrigators. The water within the unregulated river channel is estimated to be between 30 000 ML and 60 000 ML and the water within the regulated river channel storage is estimated to between 250 000 ML to 550 000 ML.
Unregulated minor storages
The volumes of water stored in on-farm dams and other unregulated storages cannot be quantified with representational faithfulness. It is estimated the maximum capacity of on-farm dams and other unregulated storages is 15 000 ML. The range of volumes stored in unregulated minor storages is estimated to be in the range of 4000 ML to 11 000 ML.
50 Illustrative Water Accounting Reports for Australian Water Accounting Standard 1
Note 3: Quantification approaches
Quantification approaches
AWAS 1 paragraphs 147–149
Basis for Conclusions paragraphs B39–B41
AWAS 1 requires disclosure of the quantification methods adopted in the preparation of the report. While different approaches may be used, information should be disclosed in the notes on the approaches adopted to assist users of the report understand how an item’s volume has been determined.
AWAS1 provides guidance on what information should be included in the notes, including:
• quantification approaches used;
• a statement as to whether these approaches are in accordance with relevant quantification standards;
• information on any quality assurance processes applied to the quantification approaches;
• levels of accuracy achieved by the various quantification processes; and
• key assumptions used in applying the quantification approaches.
Unaccounted-for difference
AWAS 1 paragraphs 114, 122 and 127
Basis for Conclusions paragraph B164
When there is an unexplained change in water assets and water liabilities during the reporting period, this volume is presented in the Statement of Changes in Water Assets and Water Liabilities and Statement of Water Flows as an unaccounted-for difference.
The unaccounted-for difference represents the difference between the changes in water assets and water liabilities determined by direct quantification of the water assets and water liabilities at each reporting date, and the volume of those changes determined by the direct quantification of the changes themselves. An unaccounted-for difference can also include volumes relating to water assets or water liabilities that cannot be quantified with representation faithfulness.
Information about any unaccounted-for difference is required to be disclosed in the notes.

51Wallaroo Water System
Note 3a: Quantification approaches
Legend to table of quantification approaches
Number Approach to quantification Description of approach
1 Measured data
Collected using hydrologic structures, hydrographic measures, gauges and meters that are consistent with industry best practice. Includes data derived from ratings curves
2 Derived from measured dataQuantified using established practices in the State of Minton
3Derived from measured data and refined/verified from model results
Quantified using established practice in the State of Minton. These practices are consistent with AS3778 – Measurement of water flow in open channels
4 Modelled outputs
The models used were subject to peer review in 2X07 by members of the Minton Department of Water and the International Water Modelling Association
5 Estimates
Estimated using established practices within Testcorp. Established practices are reviewed using models every five years, with the last review completed in 2X08
Letter Accuracy indicatorA +/- 0–5%B +/- 5–10%C +/- 10–20%D +/- 20–50%E +/- 50–100%
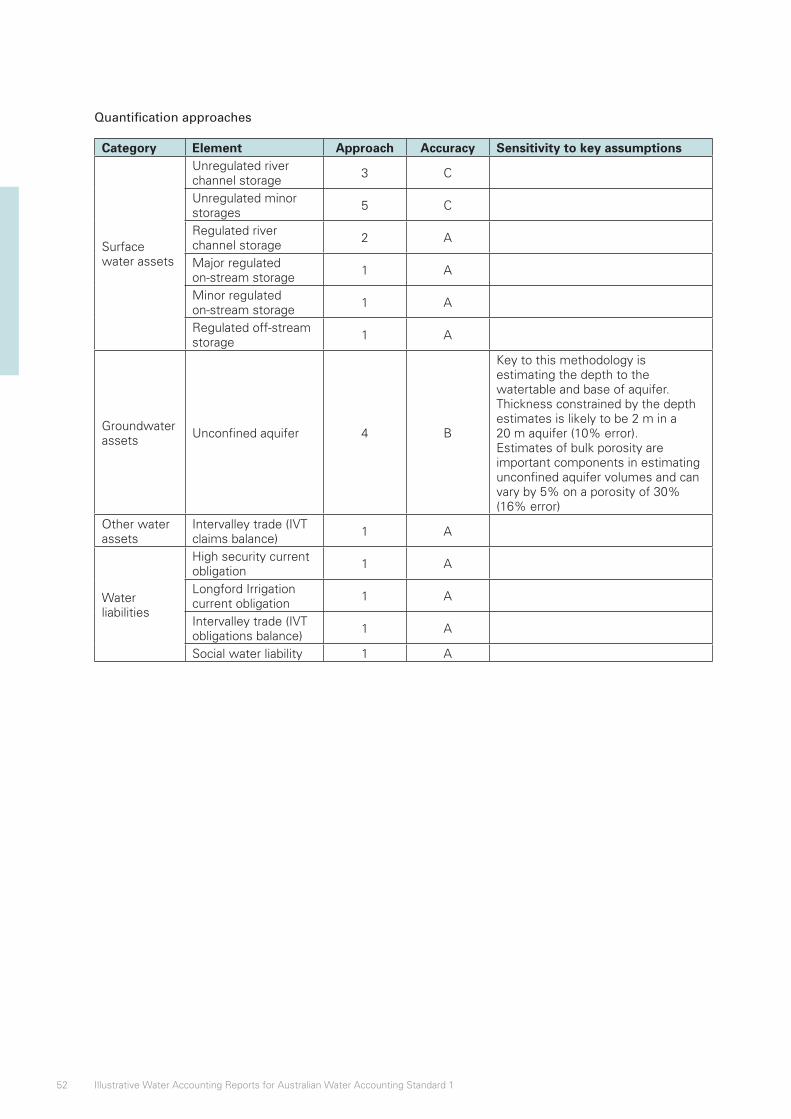
52 Illustrative Water Accounting Reports for Australian Water Accounting Standard 1
Category Element Approach Accuracy Sensitivity to key assumptions
Surface water assets
Unregulated river channel storage
3 C
Unregulated minor storages
5 C
Regulated river channel storage
2 A
Major regulated on-stream storage
1 A
Minor regulated on-stream storage
1 A
Regulated off-stream storage
1 A
Groundwater assets
Unconfined aquifer 4 B
Key to this methodology is estimating the depth to the watertable and base of aquifer. Thickness constrained by the depth estimates is likely to be 2 m in a 20 m aquifer (10% error). Estimates of bulk porosity are important components in estimating unconfined aquifer volumes and can vary by 5% on a porosity of 30% (16% error)
Other water assets
Intervalley trade (IVT claims balance)
1 A
Water liabilities
High security current obligation
1 A
Longford Irrigation current obligation
1 A
Intervalley trade (IVT obligations balance)
1 A
Social water liability 1 A
Quantification approaches
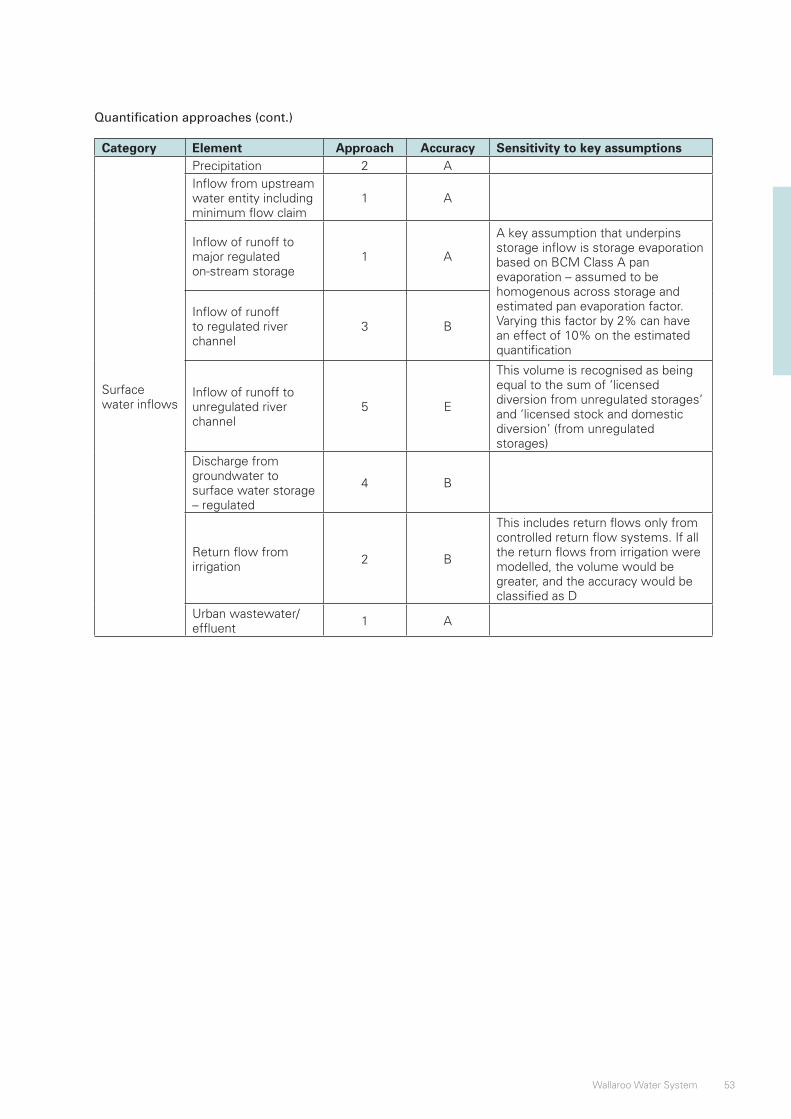
53Wallaroo Water System
Category Element Approach Accuracy Sensitivity to key assumptions
Surface water inflows
Precipitation 2 A Inflow from upstream water entity including minimum flow claim
1 A
Inflow of runoff to major regulated on-stream storage
1 A
A key assumption that underpins storage inflow is storage evaporation based on BCM Class A pan evaporation – assumed to be homogenous across storage and estimated pan evaporation factor. Varying this factor by 2% can have an effect of 10% on the estimated quantification
Inflow of runoff to regulated river channel
3 B
Inflow of runoff to unregulated river channel
5 E
This volume is recognised as being equal to the sum of ‘licensed diversion from unregulated storages’ and ‘licensed stock and domestic diversion’ (from unregulated storages)
Discharge from groundwater to surface water storage – regulated
4 B
Return flow from irrigation
2 B
This includes return flows only from controlled return flow systems. If all the return flows from irrigation were modelled, the volume would be greater, and the accuracy would be classified as D
Urban wastewater/ effluent
1 A
Quantification approaches (cont.)
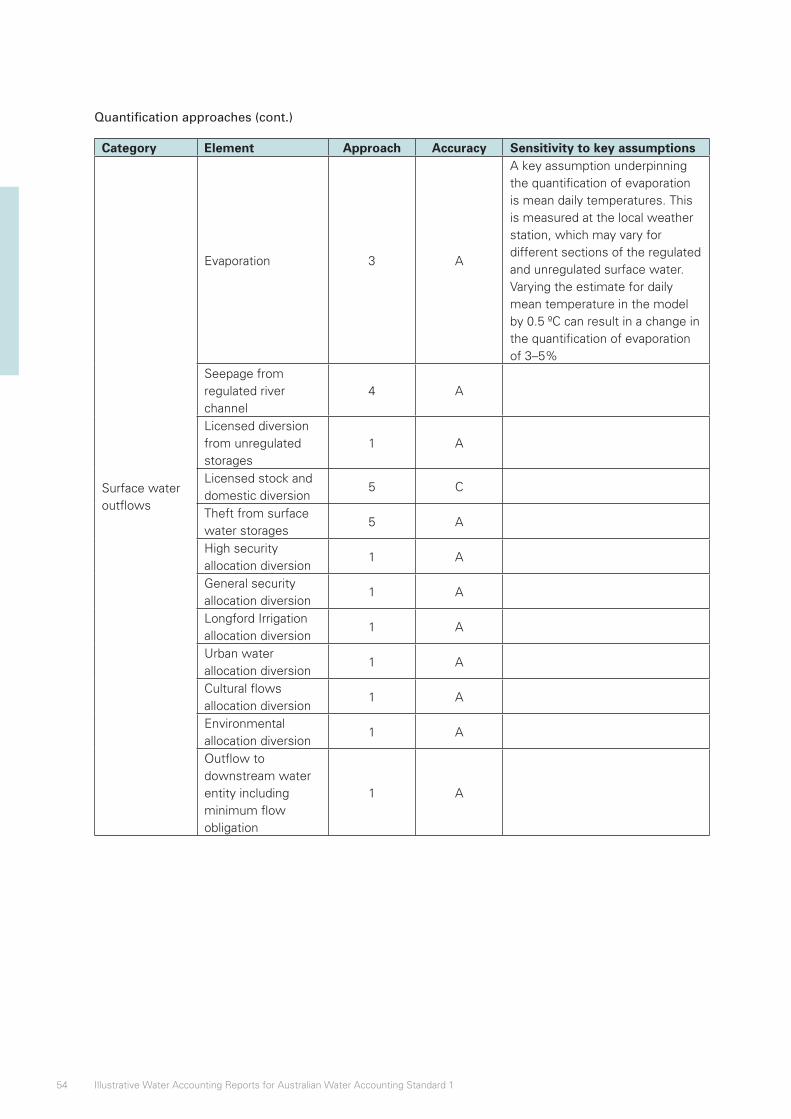
54 Illustrative Water Accounting Reports for Australian Water Accounting Standard 1
Category Element Approach Accuracy Sensitivity to key assumptions
Surface water outflows
Evaporation 3 A
A key assumption underpinning the quantification of evaporation is mean daily temperatures. This is measured at the local weather station, which may vary for different sections of the regulated and unregulated surface water. Varying the estimate for daily mean temperature in the model by 0.5 ºC can result in a change in the quantification of evaporation of 3–5%
Seepage from regulated river channel
4 A
Licensed diversion from unregulated storages
1 A
Licensed stock and domestic diversion
5 C
Theft from surface water storages
5 A
High security allocation diversion
1 A
General security allocation diversion
1 A
Longford Irrigation allocation diversion
1 A
Urban water allocation diversion
1 A
Cultural flows allocation diversion
1 A
Environmental allocation diversion
1 A
Outflow to downstream water entity including minimum flow obligation
1 A
Quantification approaches (cont.)
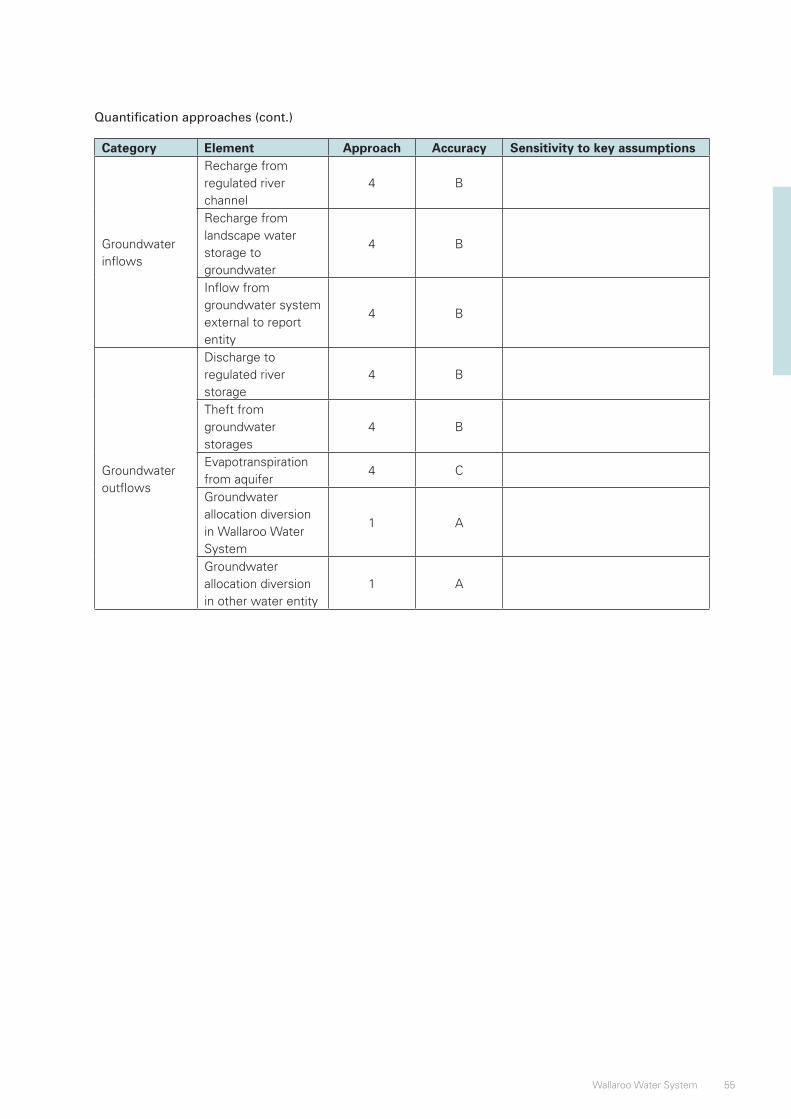
55Wallaroo Water System
Category Element Approach Accuracy Sensitivity to key assumptions
Groundwater inflows
Recharge from regulated river channel
4 B
Recharge from landscape water storage to groundwater
4 B
Inflow from groundwater system external to report entity
4 B
Groundwater outflows
Discharge to regulated river storage
4 B
Theft from groundwater storages
4 B
Evapotranspiration from aquifer
4 C
Groundwater allocation diversion in Wallaroo Water System
1 A
Groundwater allocation diversion in other water entity
1 A
Quantification approaches (cont.)
56 Illustrative Water Accounting Reports for Australian Water Accounting Standard 1
Note 3b: Unaccounted-for difference
The unaccounted-for difference comprises errors in quantification, errors in data entry, and elements that are part of the hydrological water cycle not recognised as water assets of the Wallaroo Water System. As such, it is an indication of both the accuracy of the volumes reported and the degree to which the report represents a complete water balance of the water report entity.
The volume of unaccounted-for difference as a proportion of total water assets was 3.8% in 2X11. Given that the water report entity is a physical entity, with several areas excluded (see Contextual Statement), this difference indicates that a reasonably accurate monitoring system was in place throughout 2X11. By contrast, the unaccounted-for difference in 2X10 was 29.3% of total water assets. This difference suggests that the monitoring system did not function well in the very dry climatic conditions that were prevalent during 2X10.

57Wallaroo Water System
Note 4: Reconciliations
AWAS 1 paragraph 150
Implementation Guidance A
AWAS 1 requires the following reconciliations to be disclosed in the notes:
• a reconciliation of the change in water storage presented in the Statement of Water Flows to the change in net water assets presented in the Statement of Changes in Water Assets and Water Liabilities;
• the items comprising both opening water storage and closing water storage presented in the Statement of Water Flows; and
• a reconciliation of closing water storage presented in the Statement of Water Flows to total water assets presented in the Statement of Water Assets and Water Liabilities.
The objective of these reconciliations is to provide information about the interaction and differences between the water accounting statements.
Note 4a: Reconciliation of the change in net water assets to the net change in water storage
2X11 2X10ML ML
Change in Net Water Assets 99 806 (229 298)
(Increase)/decrease in other water assetsIntervalley trade (IVT claims balance) (3 085) 990Groundwater overdraw – stock and domestic (1 327) 0
(Decrease)/increase in water liabilitiesHigh security unused allocation (1 170) (960)Longford Irrigation unused allocation 7 681 (980)Social water liability 2 000 0Intervalley trade (IVT obligations balance) (1 889) (2 427)
Net Change in Water Storage 102 016 (232 675)
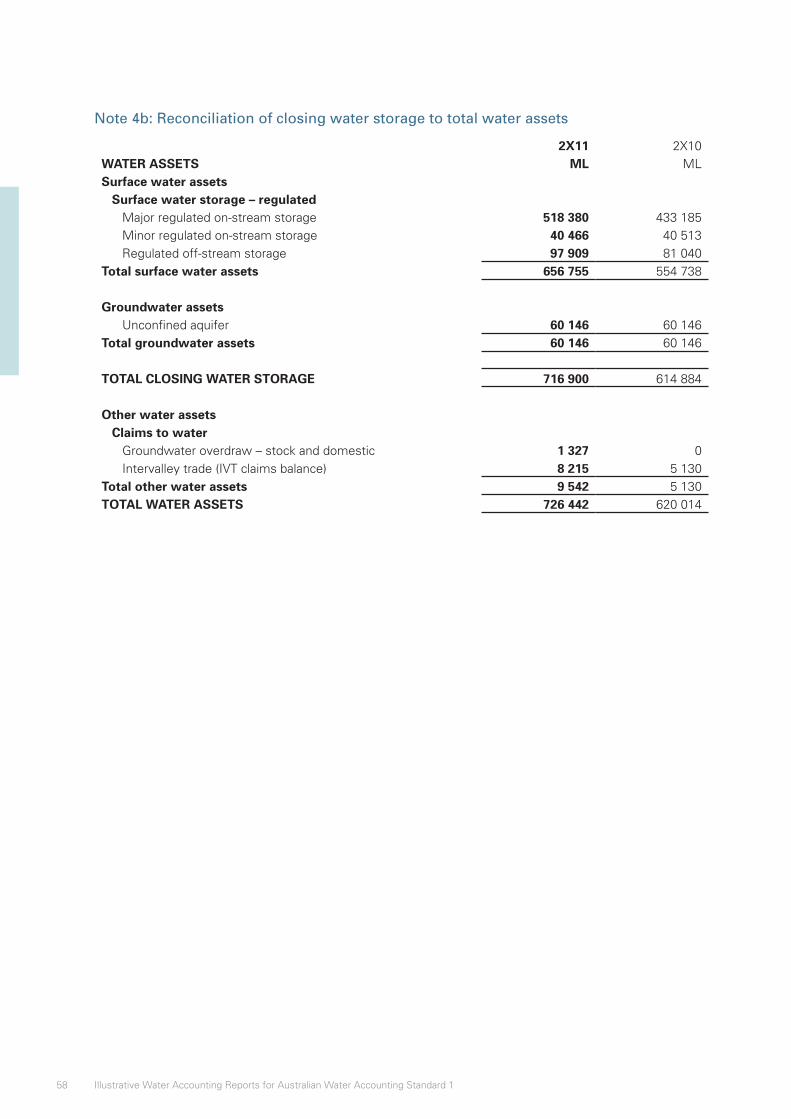
58 Illustrative Water Accounting Reports for Australian Water Accounting Standard 1
Note 4b: Reconciliation of closing water storage to total water assets
2X11 2X10WATER ASSETS ML MLSurface water assets
Surface water storage – regulatedMajor regulated on-stream storage 518 380 433 185Minor regulated on-stream storage 40 466 40 513Regulated off-stream storage 97 909 81 040
Total surface water assets 656 755 554 738
Groundwater assetsUnconfined aquifer 60 146 60 146
Total groundwater assets 60 146 60 146
TOTAL CLOSING WATER STORAGE 716 900 614 884
Other water assetsClaims to water
Groundwater overdraw – stock and domestic 1 327 0Intervalley trade (IVT claims balance) 8 215 5 130
Total other water assets 9 542 5 130TOTAL WATER ASSETS 726 442 620 014
59Wallaroo Water System
Note 5: Future prospects, contingent water assets and contingent water liabilities
AWAS 1 paragraphs 151–160
Implementation Guidance B, D and E
Basis for Conclusions paragraphs B147–B150
The future prospects note assists users of general purpose water accounting reports in understanding the extent to which water assets at the reporting date will be available to settle water liabilities and future water commitments within the next 12 months of the reporting date. The volumes presented in this note are a combination of the information found in the Statement of Water Assets and Water Liabilities and assumptions on future commitments and expected inflows.
Information about expected inflows into the water report entity is to be presented under various climatic conditions.
Contingent water assets and contingent water liabilities are not included in the Water Accounting Statements, but are disclosed in the notes.
In order to qualify as a contingent water asset or a contingent water liability, the following criteria must be met:
• Contingent water asset – A possible water asset that arises from past events and whose existence will be confirmed only by the occurrence or non-occurrence of one or more uncertain future events not wholly within the control of the management of the water report entity.
• Contingent water liability – A possible obligation that arises from past events and whose existence will be confirmed only by the occurrence or non-occurrence of one or more uncertain future events not wholly within the control of the management of the water report entity.
A brief description of each contingent water asset and contingent water liability is provided in the notes.
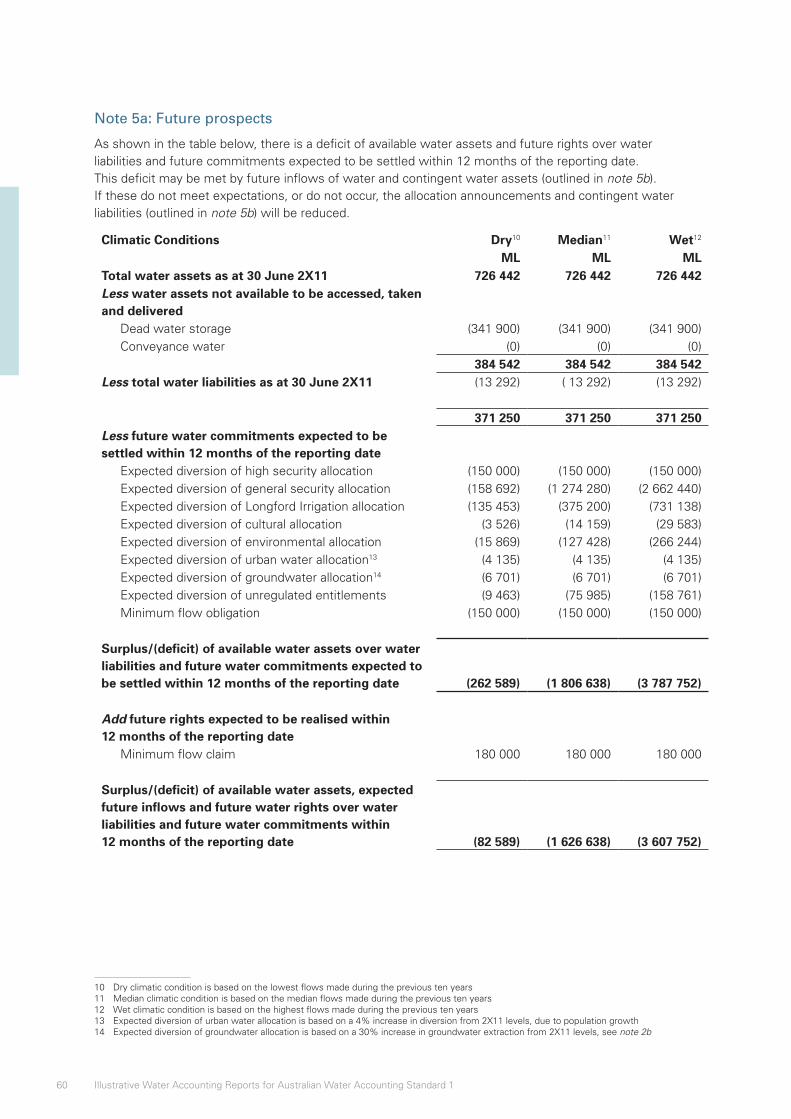
60 Illustrative Water Accounting Reports for Australian Water Accounting Standard 1
Note 5a: Future prospects
As shown in the table below, there is a deficit of available water assets and future rights over water liabilities and future commitments expected to be settled within 12 months of the reporting date. This deficit may be met by future inflows of water and contingent water assets (outlined in note 5b). If these do not meet expectations, or do not occur, the allocation announcements and contingent water liabilities (outlined in note 5b) will be reduced.1011121314
Climatic Conditions Dry10 Median11 Wet12
ML ML MLTotal water assets as at 30 June 2X11 726 442 726 442 726 442Less water assets not available to be accessed, taken and delivered
Dead water storage (341 900) (341 900) (341 900)Conveyance water (0) (0) (0)
384 542 384 542 384 542Less total water liabilities as at 30 June 2X11 (13 292) ( 13 292) (13 292)
371 250 371 250 371 250Less future water commitments expected to be settled within 12 months of the reporting date
Expected diversion of high security allocation (150 000) (150 000) (150 000)Expected diversion of general security allocation (158 692) (1 274 280) (2 662 440)Expected diversion of Longford Irrigation allocation (135 453) (375 200) (731 138)Expected diversion of cultural allocation (3 526) (14 159) (29 583)Expected diversion of environmental allocation (15 869) (127 428) (266 244)Expected diversion of urban water allocation13 (4 135) (4 135) (4 135)Expected diversion of groundwater allocation14 (6 701) (6 701) (6 701)Expected diversion of unregulated entitlements (9 463) (75 985) (158 761)Minimum flow obligation (150 000) (150 000) (150 000)
Surplus/(deficit) of available water assets over water liabilities and future water commitments expected to be settled within 12 months of the reporting date (262 589) (1 806 638) (3 787 752)
Add future rights expected to be realised within 12 months of the reporting date
Minimum flow claim 180 000 180 000 180 000
Surplus/(deficit) of available water assets, expected future inflows and future water rights over water liabilities and future water commitments within 12 months of the reporting date (82 589) (1 626 638) (3 607 752)
10 Dry climatic condition is based on the lowest flows made during the previous ten years11 Median climatic condition is based on the median flows made during the previous ten years12 Wet climatic condition is based on the highest flows made during the previous ten years13 Expected diversion of urban water allocation is based on a 4% increase in diversion from 2X11 levels, due to population growth14 Expected diversion of groundwater allocation is based on a 30% increase in groundwater extraction from 2X11 levels, see note 2b
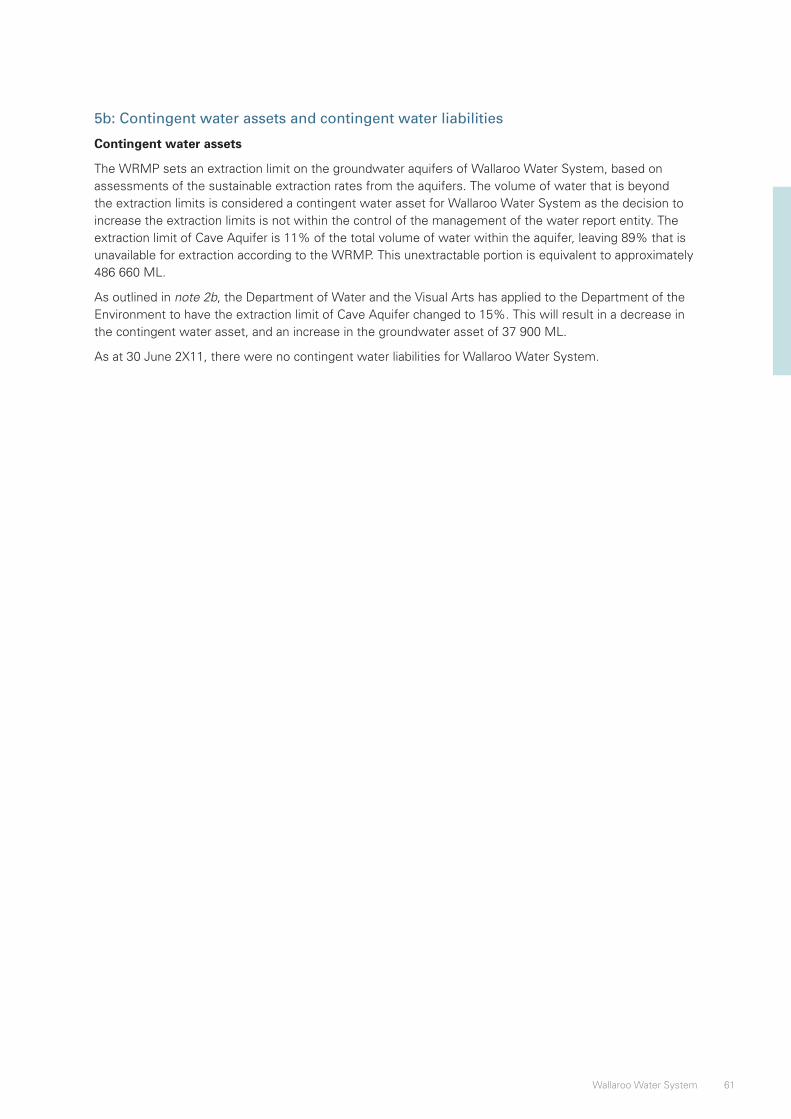
61Wallaroo Water System
5b: Contingent water assets and contingent water liabilities
Contingent water assets
The WRMP sets an extraction limit on the groundwater aquifers of Wallaroo Water System, based on assessments of the sustainable extraction rates from the aquifers. The volume of water that is beyond the extraction limits is considered a contingent water asset for Wallaroo Water System as the decision to increase the extraction limits is not within the control of the management of the water report entity. The extraction limit of Cave Aquifer is 11% of the total volume of water within the aquifer, leaving 89% that is unavailable for extraction according to the WRMP. This unextractable portion is equivalent to approximately 486 660 ML.
As outlined in note 2b, the Department of Water and the Visual Arts has applied to the Department of the Environment to have the extraction limit of Cave Aquifer changed to 15%. This will result in a decrease in the contingent water asset, and an increase in the groundwater asset of 37 900 ML.
As at 30 June 2X11, there were no contingent water liabilities for Wallaroo Water System.
62 Illustrative Water Accounting Reports for Australian Water Accounting Standard 1
Note 6: Water for environmental, social and cultural, and economic benefit
AWAS 1 paragraphs 168–171
Implementation Guidance H
Basis for Conclusions paragraphs B154–B157
AWAS1 requires a water report entity to disclose information on water that has been used during the reporting period for environmental, social and cultural benefit or economic benefit.
To meet this requirement the water report entity shall provide information on externally-imposed provisions aimed at environmental benefits and any changes made to these provisions.
The water report entity is required to provide details of any rights or customs relating to social and cultural benefits associated with the water under its management and whether this arises from externally-imposed requirements or good practice.
The water report entity is also required to provide details of the purpose, nature and volume of water accessed, taken or delivered during a reporting period for economic benefits.
Note 6a: Water for environmental benefit
Water was provided for environmental benefit based on the environmental entitlement and also in line with operating procedures.
The environmental entitlement managed by the Minton Environmental Water Holder can be accessed by the environmental manager for Wallaroo Water System based on an application process. The water entitlement is then transferred to Testcorp for environmental use based on the environmental objectives in the Water Resource Management Plan for Wallaroo Water System and the climatic conditions.
Entitlement-based environmental watering
Entitlement-based environmental watering occurred in Kelvin Wetland, which is listed in the Directory of Important Wetlands of Australia and the List of Wetlands of International Importance (the Ramsar List). The environmental water manager recommended to the Minton Environmental Water Holder a watering action to maintain vegetation health and a potential bird breeding event (2000 ML), and to improve the connectivity of a disconnected section of the wetland with the regulated Wallaroo River channel (600 ML). A volume of 2000 ML was released in January for the vegetation health and bird breeding event, and a further 100 ML released in March, piggybacking off the high river flows to improve the wetland connectivity. Because the environmental objective was met, the environmental obligation of 600 ML was effectively realised using only 100 ML from the environmental entitlement.
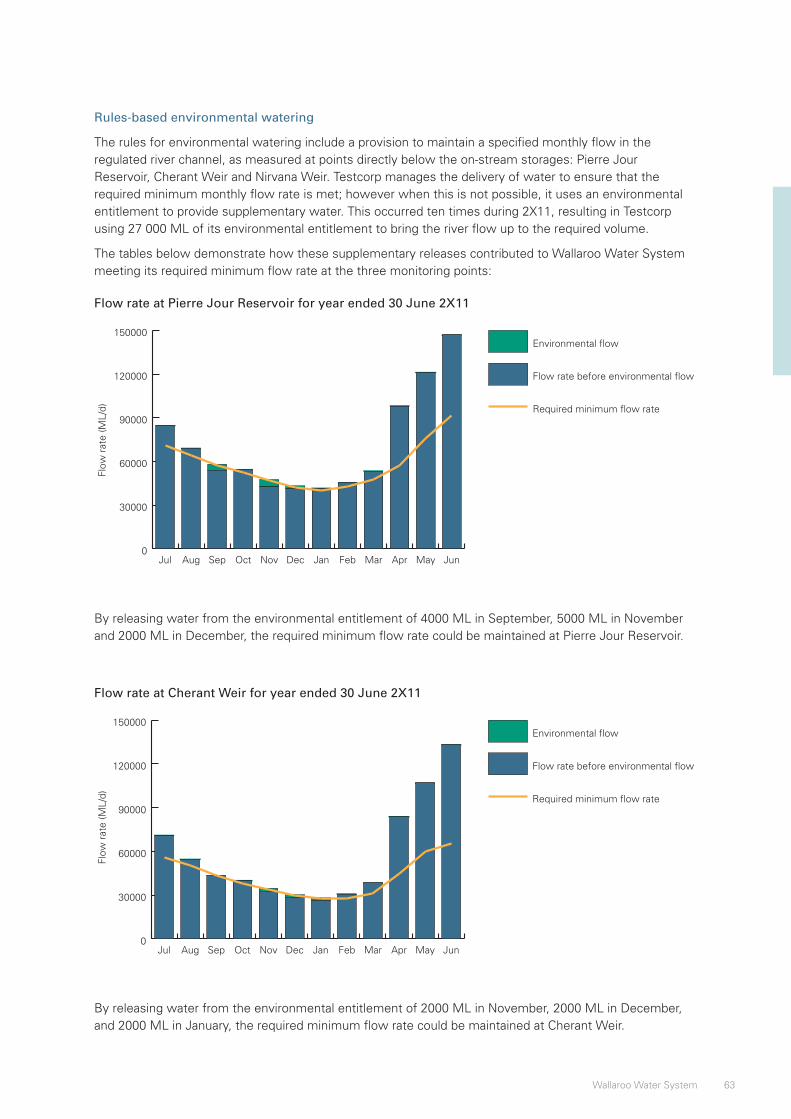
63Wallaroo Water System
Rules-based environmental watering
The rules for environmental watering include a provision to maintain a specified monthly flow in the regulated river channel, as measured at points directly below the on-stream storages: Pierre Jour Reservoir, Cherant Weir and Nirvana Weir. Testcorp manages the delivery of water to ensure that the required minimum monthly flow rate is met; however when this is not possible, it uses an environmental entitlement to provide supplementary water. This occurred ten times during 2X11, resulting in Testcorp using 27 000 ML of its environmental entitlement to bring the river flow up to the required volume.
The tables below demonstrate how these supplementary releases contributed to Wallaroo Water System meeting its required minimum flow rate at the three monitoring points:
Flow rate at Pierre Jour Reservoir for year ended 30 June 2X11
0
30000
60000
90000
120000
150000Environmental flow
Flow rate before environmental flow
Required minimum flow rate
JunMayAprMarFebJanDecNovOctSepAugJul
Flow
rat
e (M
L/d)
By releasing water from the environmental entitlement of 4000 ML in September, 5000 ML in November and 2000 ML in December, the required minimum flow rate could be maintained at Pierre Jour Reservoir.
Flow rate at Cherant Weir for year ended 30 June 2X11
0
30000
60000
90000
120000
150000Environmental flow
Flow rate before environmental flow
Required minimum flow rate
JunMayAprMarFebJanDecNovOctSepAugJul
Flow
rat
e (M
L/d)
By releasing water from the environmental entitlement of 2000 ML in November, 2000 ML in December, and 2000 ML in January, the required minimum flow rate could be maintained at Cherant Weir.

64 Illustrative Water Accounting Reports for Australian Water Accounting Standard 1
Flow rate at Nirvana Weir for year ended 30 June 2X11
0
5000
10000
15000
20000
25000
30000
35000
40000Environmental flow
Flow rate before environmental flow
Required minimum flow rate
JunMayAprMarFebJanDecNovOctSepAugJul
Flow
rat
e (M
L/d)
By releasing water from the environmental entitlement of 1000 ML in August, 4000 ML in October, 3000 ML in November and 2000 ML in January, the required minimum flow rate could be maintained at Nirvana Weir.
A breach of the Water Resource Management Plan occurred in July 2X10, when the flow rate before environmental flow did not meet the required minimum flow rate, and no environmental water was released. As the required minimum flow rate was missed by a small margin, no significant or lasting environmental damage was done.
Note 6b: Water for social and cultural benefit
Social benefit at Lake Humphrey
Lake Humphrey is used both to store the share of Pierre Jour Reservoir allocated to Longford Irrigation and for social purposes, including swimming, boating and fishing activities. For these activities to continue, Testcorp aims to ensure that the volume of water stored in Lake Humphrey does not fall below 100 000 ML.
In the reporting period 2X11, the opening storage volume was 81 040 ML, due to a combination of unusually large extractions by Longford Irrigation and unseasonably low rainfall and runoff into the lake. Testcorp released 30 000 ML into Lake Humphrey in July, and then 90 617 ML in October, following the allocation to Longford Irrigation of 120 617 ML. A further 51 693 ML was released in February, according to the February allocation announcement for Longford Irrigation. By timing the release of Longford Irrigation’s capacity share, Testcorp was able to meet the minimum storage volume in ten months out of 12, without requiring the release of additional water.
The two months in which the minimum storage volume was not met were September 2X10 and June 2X11. In both cases the actual storage volume was very close to the minimum storage volume and therefore the breach had no material effect on social activities in the lake.
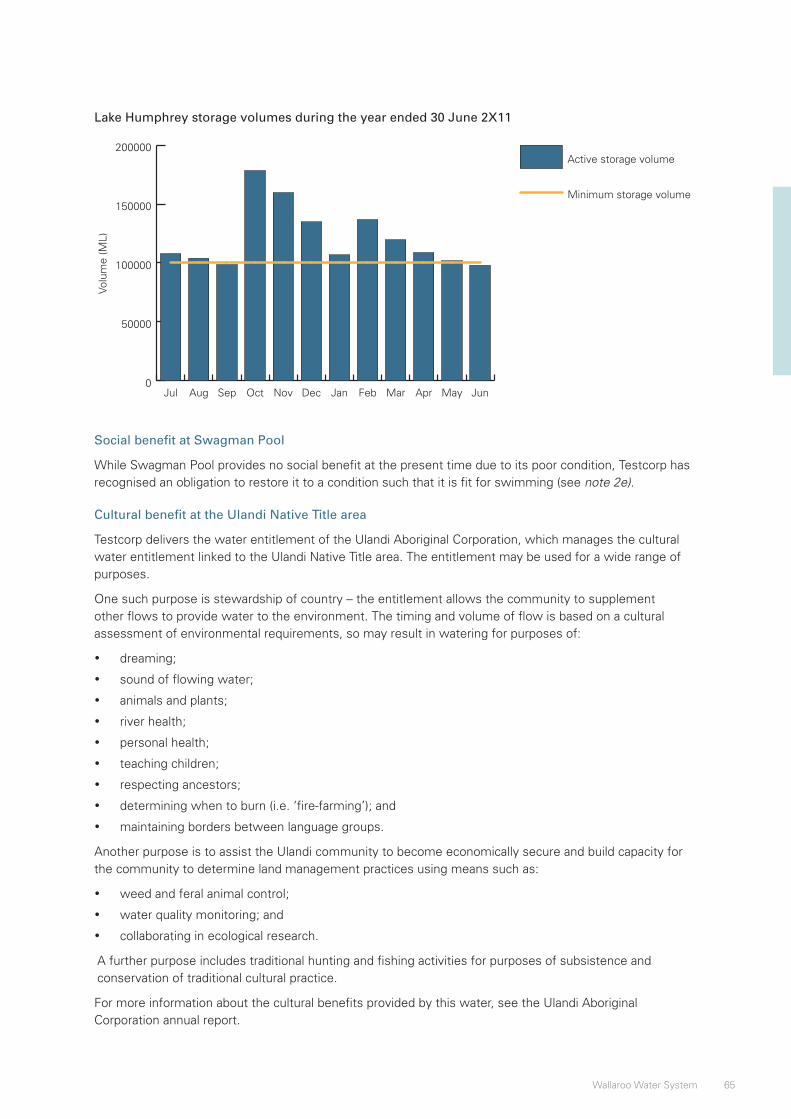
65Wallaroo Water System
Lake Humphrey storage volumes during the year ended 30 June 2X11
0
50000
100000
150000
200000Active storage volume
Minimum storage volume
JunMayAprMarFebJanDecNovOctSepAugJul
Volu
me
(ML)
Social benefit at Swagman Pool
While Swagman Pool provides no social benefit at the present time due to its poor condition, Testcorp has recognised an obligation to restore it to a condition such that it is fit for swimming (see note 2e).
Cultural benefit at the Ulandi Native Title area
Testcorp delivers the water entitlement of the Ulandi Aboriginal Corporation, which manages the cultural water entitlement linked to the Ulandi Native Title area. The entitlement may be used for a wide range of purposes.
One such purpose is stewardship of country – the entitlement allows the community to supplement other flows to provide water to the environment. The timing and volume of flow is based on a cultural assessment of environmental requirements, so may result in watering for purposes of:
• dreaming;
• sound of flowing water;
• animals and plants;
• river health;
• personal health;
• teaching children;
• respecting ancestors;
• determining when to burn (i.e. ‘fire-farming’); and
• maintaining borders between language groups.
Another purpose is to assist the Ulandi community to become economically secure and build capacity for the community to determine land management practices using means such as:
• weed and feral animal control;
• water quality monitoring; and
• collaborating in ecological research.
A further purpose includes traditional hunting and fishing activities for purposes of subsistence and conservation of traditional cultural practice.
For more information about the cultural benefits provided by this water, see the Ulandi Aboriginal Corporation annual report.

66 Illustrative Water Accounting Reports for Australian Water Accounting Standard 1
Note 6c: Water for economic benefit
Land use in the Wallaroo Water System is predominantly agriculture. Approximately 76% of the land area is used for dryland cropping and livestock grazing. While economically important, only 8% of land is used for irrigated agriculture.
Land use in the Wallaroo Water System
Land use description Total area (ha) Total area (%)Nature conservation 716 365 11.0Cropping (dryland) 781 489 12.0Forestry 260 496 4.0Livestock grazing 4 167 942 64.0Irrigated agriculture 520 993 8.0Waterbodies 52 099 0.8Built environment 13 025 0.2Total 6 512 409 100.0
Testcorp conducts a yearly survey of its water users, which receives a 70% response rate. These users primarily represent the irrigated agriculture water users, as well as some livestock, urban use and commercial and industrial users. From this survey, Testcorp identifies the end uses of the water it supplies. The graph below provides a summary of the data, by comparing the water use by agricultural sector for 2X11 and 2X10:
Comparison of water use by economic activity for years 2X11 and 2X10
0
30000
60000
90000
120000
150000Water used 2X10
Water used 2X11
Comm
ercia
l / ind
ustri
al
Dairy
Stone
fruit
Wine
gra
pes
Lives
tock
Hortic
ultur
e
Volu
me
(ML)
More information about the agricultural activities of the Wallaroo Water System and the State of Minton is available from the Australian Bureau of Agricultural and Resource Economics (ABARE) website at www.abare.gov.au
More information on the economy of the Wallaroo Water System and the State of Minton is available from the Australian Bureau of Statistics (ABS) website at www.abs.gov.au
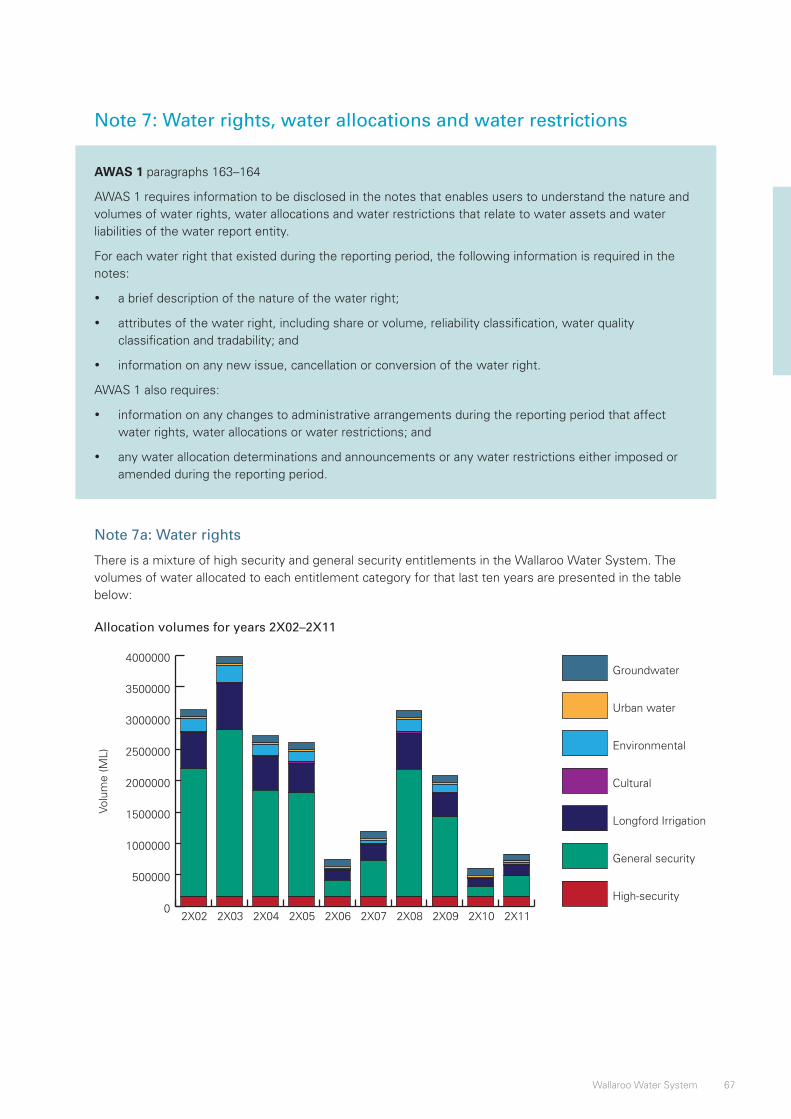
67Wallaroo Water System
Note 7: Water rights, water allocations and water restrictions
AWAS 1 paragraphs 163–164
AWAS 1 requires information to be disclosed in the notes that enables users to understand the nature and volumes of water rights, water allocations and water restrictions that relate to water assets and water liabilities of the water report entity.
For each water right that existed during the reporting period, the following information is required in the notes:
• a brief description of the nature of the water right;
• attributes of the water right, including share or volume, reliability classification, water quality classification and tradability; and
• information on any new issue, cancellation or conversion of the water right.
AWAS 1 also requires:
• information on any changes to administrative arrangements during the reporting period that affect water rights, water allocations or water restrictions; and
• any water allocation determinations and announcements or any water restrictions either imposed or amended during the reporting period.
Note 7a: Water rights
There is a mixture of high security and general security entitlements in the Wallaroo Water System. The volumes of water allocated to each entitlement category for that last ten years are presented in the table below:
Allocation volumes for years 2X02–2X11
0
500000
1000000
1500000
2000000
2500000
3000000
3500000
4000000Groundwater
Urban water
Environmental
Cultural
Longford Irrigation
General security
High-security
2X112X102X092X082X072X062X052X042X032X02
Volu
me
(ML)

68 Illustrative Water Accounting Reports for Australian Water Accounting Standard 1
Note 7b: Water allocations
Water allocations are made in February and October each year. The table below shows the relative volumes that were announced in October and February for each entitlement category in 2X11 and 2X10:
Allocation announcement dates in 2X11 and 2X10
0
50000
100000
150000
200000February
October
Enviro
nmen
tal a
lloca
tion
2X10
Enviro
nmen
tal a
lloca
tion
2X11
Urban
wat
er al
locat
ion 2
X10
Urban
wat
er al
locat
ion 2
X11
Cultur
al all
ocat
ion 2
X10
Cultur
al all
ocat
ion 2
X11
Long
ford
Irrig
ation
alloc
ation
2X10
Long
ford
Irrig
ation
alloc
ation
2X11
High se
curit
y irri
gatio
n all
ocat
ion 2
X10
High se
curit
y irri
gatio
n all
ocat
ion 2
X11
Volu
me
(ML)
The October water allocations for the next reporting period were announced on 1 October 2X11. The table below shows the announcements for each entitlement category (ML):
Allocation categoryOctober
2X11 allocation announcement
October 2X10 allocation announcement
High security irrigation allocation 105 000 105 000 General security irrigation allocation 195 437 300 000 Stock and domestic allocation 27 011 24 011 Longford Irrigation allocation 103 294 120 000 Cultural allocation 3 528 3 528 Urban water allocation 27 000 32 000 Environmental allocation 18 036 18 036 Groundwater allocation 76 123 76 123 Groundwater stock and domestic allocation 6 456 6 456
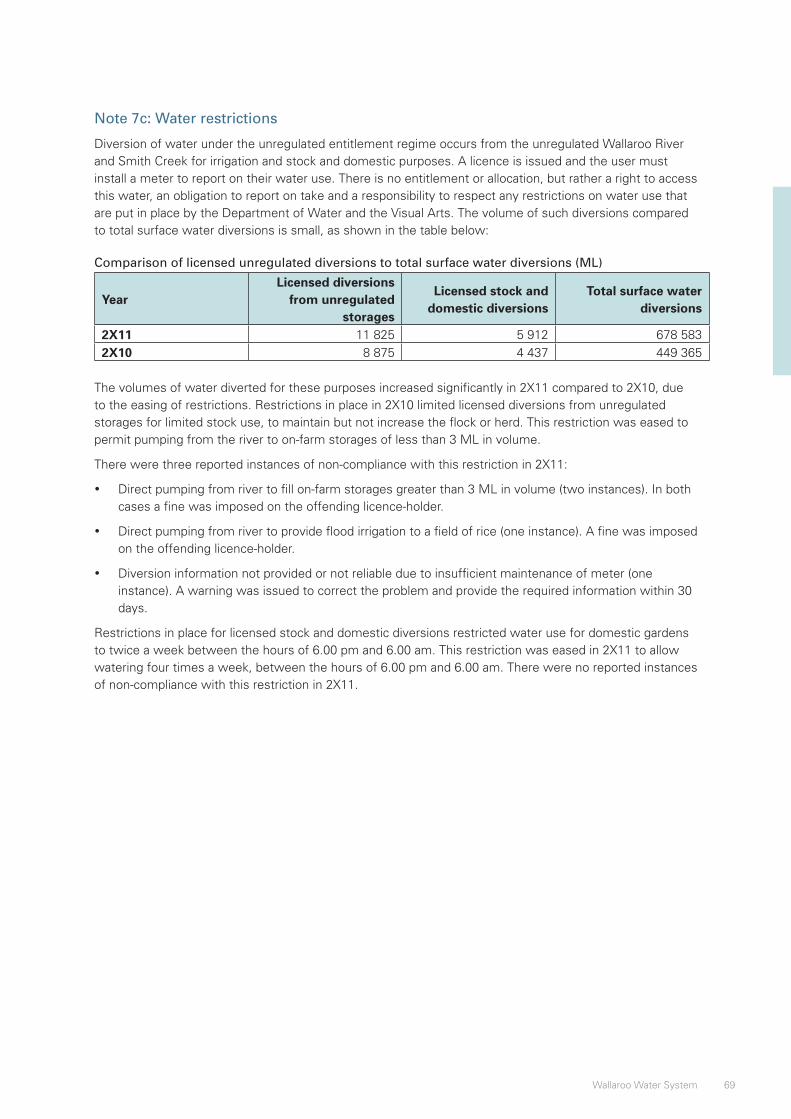
69Wallaroo Water System
Note 7c: Water restrictions
Diversion of water under the unregulated entitlement regime occurs from the unregulated Wallaroo River and Smith Creek for irrigation and stock and domestic purposes. A licence is issued and the user must install a meter to report on their water use. There is no entitlement or allocation, but rather a right to access this water, an obligation to report on take and a responsibility to respect any restrictions on water use that are put in place by the Department of Water and the Visual Arts. The volume of such diversions compared to total surface water diversions is small, as shown in the table below:
Comparison of licensed unregulated diversions to total surface water diversions (ML)
YearLicensed diversions
from unregulated storages
Licensed stock and domestic diversions
Total surface water diversions
2X11 11 825 5 912 678 5832X10 8 875 4 437 449 365
The volumes of water diverted for these purposes increased significantly in 2X11 compared to 2X10, due to the easing of restrictions. Restrictions in place in 2X10 limited licensed diversions from unregulated storages for limited stock use, to maintain but not increase the flock or herd. This restriction was eased to permit pumping from the river to on-farm storages of less than 3 ML in volume.
There were three reported instances of non-compliance with this restriction in 2X11:
• Direct pumping from river to fill on-farm storages greater than 3 ML in volume (two instances). In both cases a fine was imposed on the offending licence-holder.
• Direct pumping from river to provide flood irrigation to a field of rice (one instance). A fine was imposed on the offending licence-holder.
• Diversion information not provided or not reliable due to insufficient maintenance of meter (one instance). A warning was issued to correct the problem and provide the required information within 30 days.
Restrictions in place for licensed stock and domestic diversions restricted water use for domestic gardens to twice a week between the hours of 6.00 pm and 6.00 am. This restriction was eased in 2X11 to allow watering four times a week, between the hours of 6.00 pm and 6.00 am. There were no reported instances of non-compliance with this restriction in 2X11.
70 Illustrative Water Accounting Reports for Australian Water Accounting Standard 1
Note 8: Water market activity
AWAS 1 paragraphs 165–167
Basis for Conclusions B152–B153
AWAS 1 requires information to be disclosed in the notes that assists users to understand the nature and volumes of water market activity that occurred during the reporting period.
For each occurrence of water market activity that occurred during the reporting period, the following information is required to be disclosed:
• the number, volumes, origins and destinations of trades that have occurred during the reporting period for each type of right or claim to water of the water report entity; and
• any other information relevant to an understanding of water market activity. This would include, for example, details of externally-imposed limitations on the trading of water rights of the water report entity, compliance with those limitations and any changes to the limitations during the reporting period.
Water trading activity in the Wallaroo Water System occurs as intervalley trade and trade between stakeholders. In both cases, the parties participating in the trade must be hydrologically-connected, and possess sufficient delivery rights to make a physical transfer of water possible between Pierre Jour Reservoir and the destination. All external trade into or out of the Wallaroo Water System is considered ‘tagged trade’, as the traded allocation retains the same qualities in the destination area that it had in the origin. There are two types of trade that occur.
Temporary trade
Temporary trade can either be a once-off agreement or a lease-style agreement between two parties whereby the rights to an allocated entitlement are transferred from one party to another. The agreed volume is transferred between allocation accounts, and all other rules relating to carryover and forfeiture continue to apply, depending on the type of entitlement that was traded.
Permanent trade
Permanent trade is the permanent sale of a water entitlement, either as part of the sale of a property or as an independent transaction. The entitlement register is altered to reflect the new ownership and other rules relating to carryover and forfeiture remain the same. If the permanent trade occurs with an external entity, the intervalley account balance is adjusted accordingly. Permanent trade between stakeholders of Testcorp and stakeholders of Longford Irrigation results in an adjustment to the capacity share arrangement, rather than an adjustment to the intervalley transfer balance.

71Wallaroo Water System
Note 8a: Intervalley transfer balance
The maximum volume of water that can be traded out of Wallaroo Water System in trading with upstream catchments is limited to 180 000 ML – the Menace intervalley baseline transfer volume. This is due to the fact that if a greater volume than this was traded, there would be zero flows between Menace River and Wallaroo River and the connection would be lost. Similarly, trading with catchments downstream of Wallaroo Water System is limited to the intervalley transfer baseline volume between Wallaroo River and Baxter River, namely 150 000 ML per year. This restriction only applies when trading in an upstream direction; it does not apply to trading in a downstream direction.
Intervalley transfer claims balance
The intervalley transfer claims balance represents the volume of water that Menace Water System will deliver to Wallaroo Water System via the Menace River diversion. In order to maintain this connection, the maximum amount of water that could be traded out to Menace Water System was 180 773 ML in 2X11, and 180 006 ML in 2X10.
Change in intervalley transfer claims balance in years 2X11 and 2X10 (ML)
2X11 2X10Opening balance 180 006 178 410Entitlement trades in from Menace Water System 1 479 2 366Entitlement trades out to Menace Water System (712) (770)Closing balance 180 773 180 006
Intervalley transfer obligations balance
The intervalley transfer obligations balance represents the volume of water that Wallaroo Water System will deliver to Baxter Water System via the regulated Wallaroo River channel. In order to maintain this connection, the maximum amount of water that could be traded in from Baxter Water System River was 152 034 ML in 2X11, and 150 245 ML in 2X10.
Change in intervalley transfer obligations balance in 2X11 and 2X10 (ML)
2X11 2X10Opening balance 150 245 146 520Entitlement trades in from Baxter Water System 3 451 5 522Entitlement trades out to Baxter Water System (1 662) (1 797)Closing balance 152 034 150 245
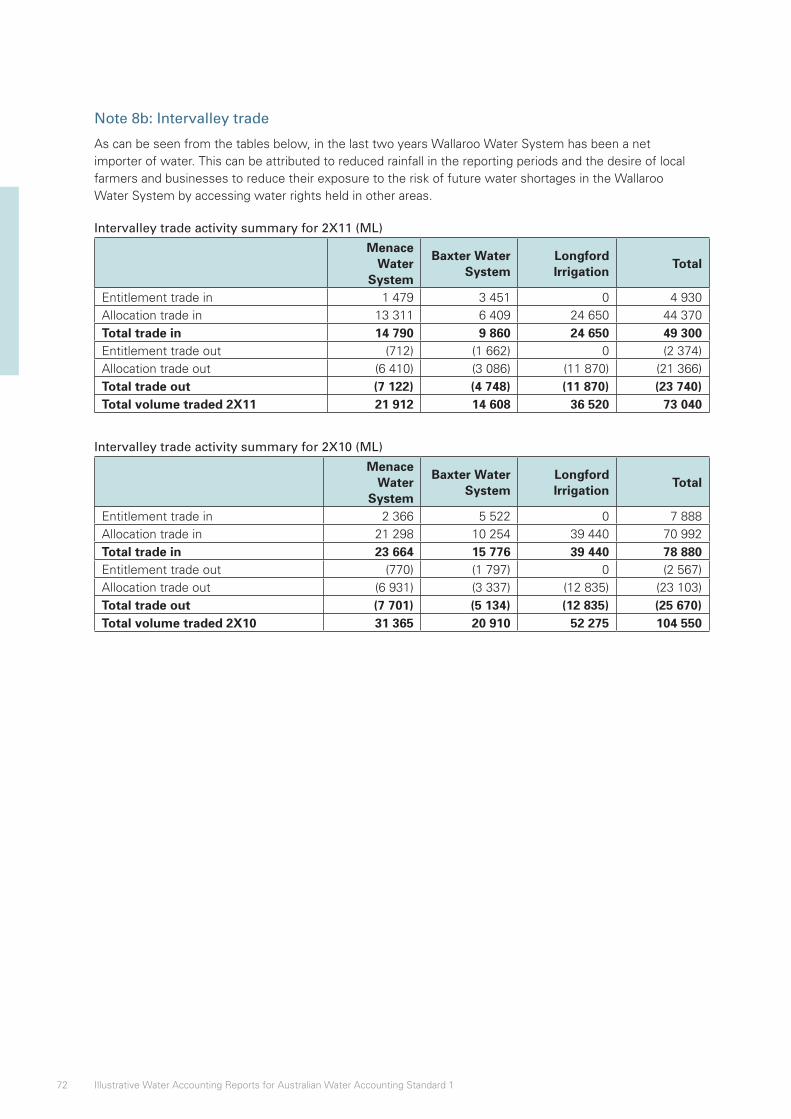
72 Illustrative Water Accounting Reports for Australian Water Accounting Standard 1
Note 8b: Intervalley trade
As can be seen from the tables below, in the last two years Wallaroo Water System has been a net importer of water. This can be attributed to reduced rainfall in the reporting periods and the desire of local farmers and businesses to reduce their exposure to the risk of future water shortages in the Wallaroo Water System by accessing water rights held in other areas.
Intervalley trade activity summary for 2X11 (ML)
Menace Water
System
Baxter Water System
Longford Irrigation
Total
Entitlement trade in 1 479 3 451 0 4 930Allocation trade in 13 311 6 409 24 650 44 370Total trade in 14 790 9 860 24 650 49 300Entitlement trade out (712) (1 662) 0 (2 374)Allocation trade out (6 410) (3 086) (11 870) (21 366)Total trade out (7 122) (4 748) (11 870) (23 740)Total volume traded 2X11 21 912 14 608 36 520 73 040
Intervalley trade activity summary for 2X10 (ML)
Menace Water
System
Baxter Water System
Longford Irrigation
Total
Entitlement trade in 2 366 5 522 0 7 888Allocation trade in 21 298 10 254 39 440 70 992Total trade in 23 664 15 776 39 440 78 880Entitlement trade out (770) (1 797) 0 (2 567)Allocation trade out (6 931) (3 337) (12 835) (23 103)Total trade out (7 701) (5 134) (12 835) (25 670)Total volume traded 2X10 31 365 20 910 52 275 104 550
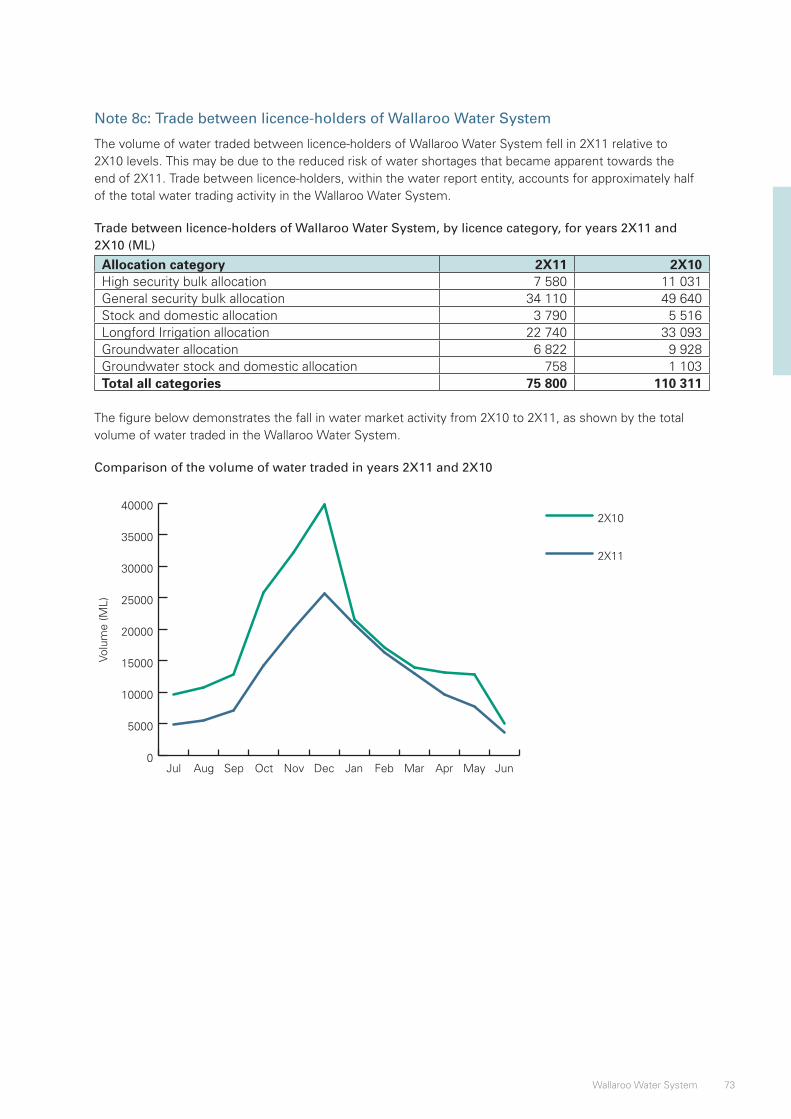
73Wallaroo Water System
Note 8c: Trade between licence-holders of Wallaroo Water System
The volume of water traded between licence-holders of Wallaroo Water System fell in 2X11 relative to 2X10 levels. This may be due to the reduced risk of water shortages that became apparent towards the end of 2X11. Trade between licence-holders, within the water report entity, accounts for approximately half of the total water trading activity in the Wallaroo Water System.
Trade between licence-holders of Wallaroo Water System, by licence category, for years 2X11 and 2X10 (ML)
Allocation category 2X11 2X10High security bulk allocation 7 580 11 031General security bulk allocation 34 110 49 640Stock and domestic allocation 3 790 5 516Longford Irrigation allocation 22 740 33 093Groundwater allocation 6 822 9 928Groundwater stock and domestic allocation 758 1 103Total all categories 75 800 110 311
The figure below demonstrates the fall in water market activity from 2X10 to 2X11, as shown by the total volume of water traded in the Wallaroo Water System.
Comparison of the volume of water traded in years 2X11 and 2X10
0
5000
10000
15000
20000
25000
30000
35000
400002X10
2X11
JunMayAprMarFebJanDecNovOctSepAugJul
Volu
me
(ML)

74 Illustrative Water Accounting Reports for Australian Water Accounting Standard 1
Illustrative Water Accounting Report
Energetico Hydro Corporation
General Purpose Water Accounting Report
30 June 2X11
Prepared by Energetico Hydro Corporation
An illustration of an Australian general purpose water accounting report for a fictitious water report entity

1Energetico Hydro Corporation
Contents Page
Glossary ........................................................................................................................................................2Contextual Statement .................................................................................................................................3
Physical information ................................................................................................................................4Administrative information ......................................................................................................................6Overview of reporting period ..................................................................................................................7
Accountability Statement .........................................................................................................................12Assurance of water accounting report ....................................................................................................13Water Accounting Statements .................................................................................................................14
Statement of Water Assets and Water Liabilities .................................................................................14Quantification approaches.....................................................................................................................15Statement of Changes in Water Assets and Water Liabilities ..............................................................17
Notes ..........................................................................................................................................................20Note 1: Significant water accounting policies .......................................................................................21Note 2: Information supporting the items presented in the water accounting statements ..................22Note 3: Reconciliations .........................................................................................................................29Note 4: Future prospects, contingent water assets and contingent water liabilities ............................30Note 5: Water for environmental, social and cultural, and economic benefit .......................................33Note 6: Segment information................................................................................................................37
2 Illustrative Water Accounting Reports for Australian Water Accounting Standard 1
GlossaryThe terms listed below are additional terms to those defined in AWAS 1 and are used in this general purpose water accounting report. They are not inconsistent with AWAS 1.
• Allocation – short version of ‘water allocation’. The specific volume of water allocated to water access entitlements in a given season or given accounting period, defined according to rules established in the relevant water plan.1
• Allocation announcement – obligating event that creates the legal right to access a water allocation and the corresponding obligation to deliver the water.
• Entitlement – short version of ‘water access entitlement’. A perpetual or ongoing entitlement to exclusive access to a share of water from a specified consumptive pool as defined in the relevant water plan.2
• Environmental benefit – part of ‘environmental and other public benefit outcomes’. Environmental and other public benefit outcomes are defined as part of the water planning process, are specified in water plans and, for example, may include a number of aspects such as:
– environmental outcomes;
– maintaining ecosystem function (e.g. through periodic inundation of floodplain wetlands);
– biodiversity;
– water quality;
– river health targets; and
– other public benefits, which may include mitigating pollution, public health (e.g. limiting noxious algal blooms), Indigenous and cultural values, recreation, fisheries, tourism, navigation and amenity values.3
• Treated effluent – water derived from wastewater which is treated to a standard that is appropriate for its intended use.
• Urban – total residential, commercial, municipal and industrial areas within a city.
1 National Water Initiative2 ibid.3 ibid.
3Energetico Hydro Corporation
Contextual Statement
AWAS 1 paragraphs 56–61
Basis for Conclusions paragraphs B42–B44
Water Accounting Conceptual Framework SWAC 1
The Contextual Statement provides users of general purpose water accounting reports with information that helps them understand the physical and administrative aspects of the water report entity. This includes information about the water assets and water liabilities, geographical and climatic conditions of the area as well as the management structure of the water report entity.
The description of the water report entity provides the users with contextual information on the physical boundaries of the water report entity. It details the features that are included and those that are excluded from the water report entity.
To comply with the requirements in AWAS 1, the following information should be included:
• a description of the water report entity;
• administrative information of the water report entity including details of any management structures and any agreements the water report entity is party to that impact on the management and operation of the water assets and water liabilities of the water report entity;
• a description of the water resources of the water report entity;
• an overview of the reporting period which includes information on the climatic conditions, before and during the reporting period, that impact on the water report entity; and
• information on any externally-imposed requirements the water report entity or its management are required to comply with, such as those contained in water resource management instruments.
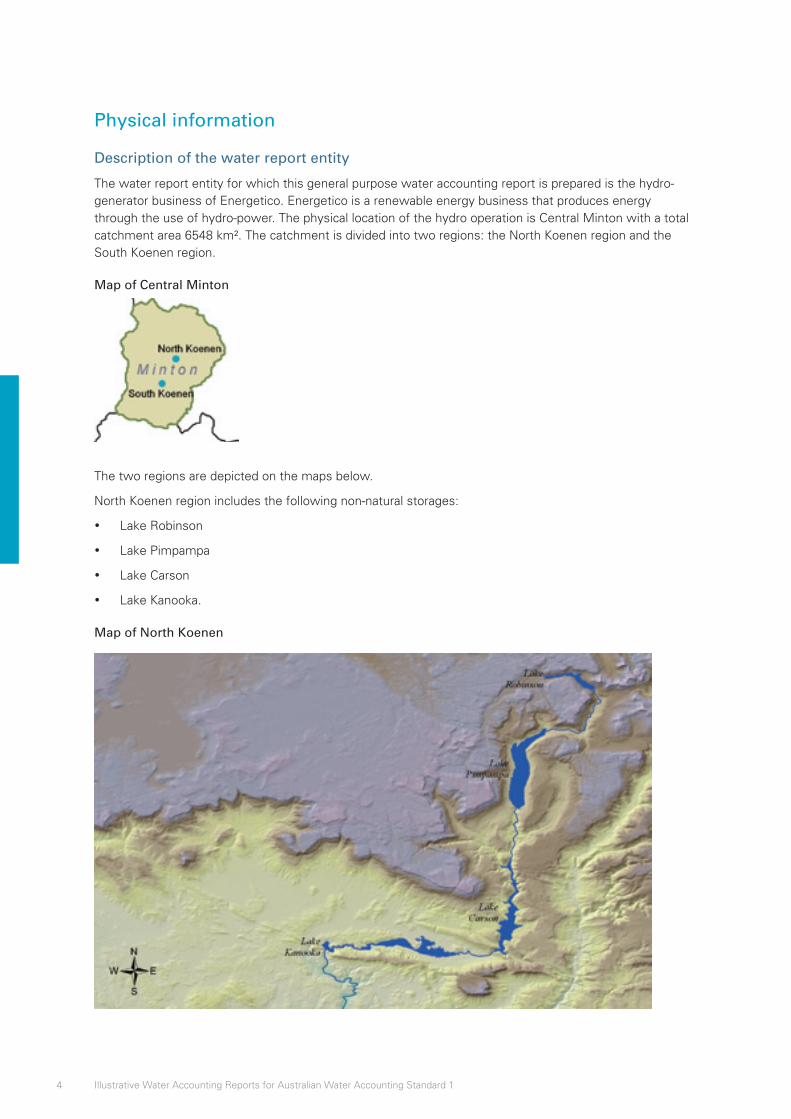
4 Illustrative Water Accounting Reports for Australian Water Accounting Standard 1
Physical information
Description of the water report entity
The water report entity for which this general purpose water accounting report is prepared is the hydro-generator business of Energetico. Energetico is a renewable energy business that produces energy through the use of hydro-power. The physical location of the hydro operation is Central Minton with a total catchment area 6548 km². The catchment is divided into two regions: the North Koenen region and the South Koenen region.
Map of Central Minton
The two regions are depicted on the maps below.
North Koenen region includes the following non-natural storages:
• Lake Robinson
• Lake Pimpampa
• Lake Carson
• Lake Kanooka.
Map of North Koenen
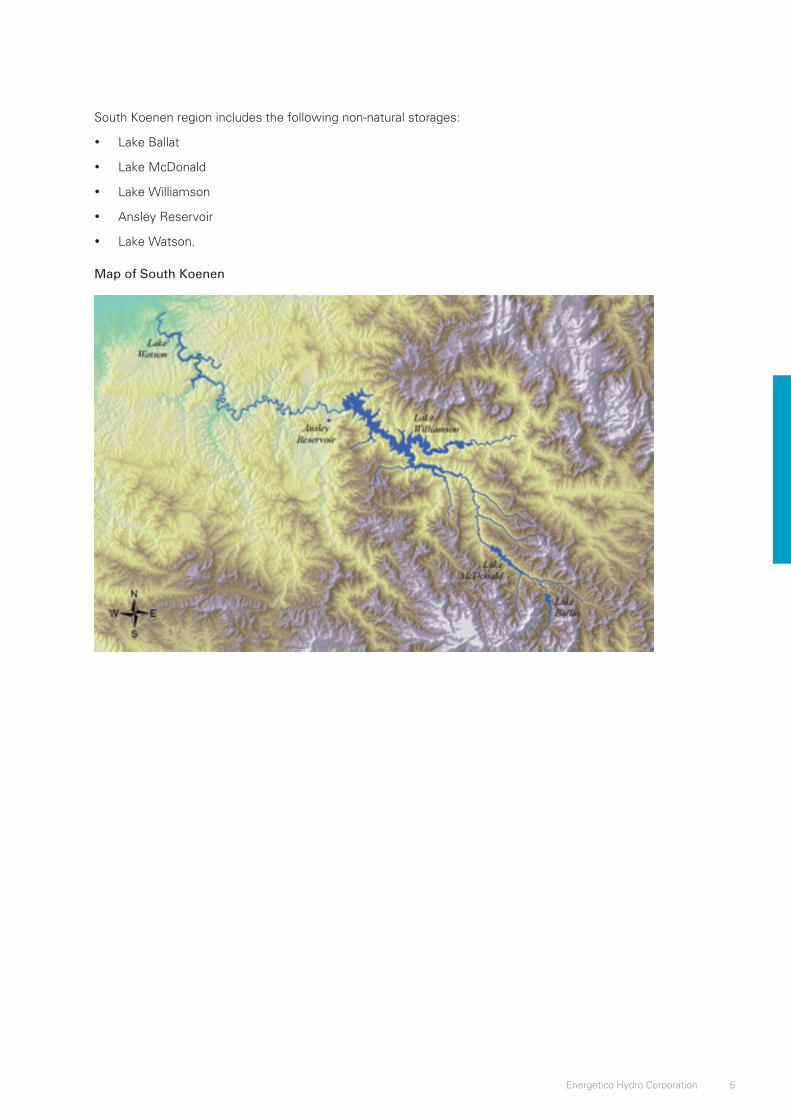
5Energetico Hydro Corporation
South Koenen region includes the following non-natural storages:
• Lake Ballat
• Lake McDonald
• Lake Williamson
• Ansley Reservoir
• Lake Watson.
Map of South Koenen
6 Illustrative Water Accounting Reports for Australian Water Accounting Standard 1
Administrative information
Water management plan
The main body with responsibility for managing the water resources of the North and South Koenen regions is the Minton State Department of Environment and Water (the Department). The Department is responsible for approving and reviewing licences of water users, managing the water resources and making allocation announcements.
Hydro-power licence and annual water operating plan
Energetico has been issued a licence from the Department. The licence enables Energetico to catch, divert, store and release water for the purpose of generating electricity. The licence also imposes obligations on Energetico to meet environmental water release targets and divert and store water for urban and irrigation use. The licence does not give Energetico ownership of the water nor does it allow Energetico to trade water.
As part of Energetico’s licence requirements, it must prepare an annual water operating plan for each water year. The annual water operating plan includes details on forecast inflows and water releases to meet generation requirements, environmental flows and the needs of other water users.
A copy of the licence can be viewed on the Department’s website, www.dew.minton.gov.au
Corporate structure
Energetico is a listed corporation on the Australian Stock Exchange with its head office in Tys. Energetico is a leading renewable energy business providing approximately 5% of the State’s energy needs. As at the reporting date, the Board of Energetico consisted of five directors who each serve a two-year rotating term. The Board’s main function is guiding the organisation on governance issues, setting broad policies and objectives, and ensuring adequate financial and water resources to meet the organisation’s objectives.
Energetico has a number of sub-committees that report directly to the Board on various issues. The sub-committee responsible for the organisation’s water resources is the Water, Environment and Sustainability Committee. This committee is chaired by Darren Lusky who is supported by four other members. The committee’s responsibilities are to:
• advise the board on environmental and sustainability policies;
• review the organisation’s environmental and sustainability performance;
• set and monitor the annual water operating plan;
• establish relationships with environmental stakeholders and governments; and
• address any environmental concerns raised.
Management and operation requirements
Energetico operations are conducted under directions issued by the Minton State Department of Environment and Water within the terms and conditions outlined in its operation licence. As part of Energetico’s internal practices, Energetico produces an annual management plan to ensure compliance with its licence and directives from the Department.
During the reporting period some exceptions occurred, which prevented compliance by Energetico with certain conditions outlined in its operation licence requirements. These exceptions are outlined below and in the notes:
• The annual release from Lake Carson to the Faulkner Wetlands was below the annual minimum release target of 10%. Further details are available in note 5 under the heading Faulkner Wetlands.
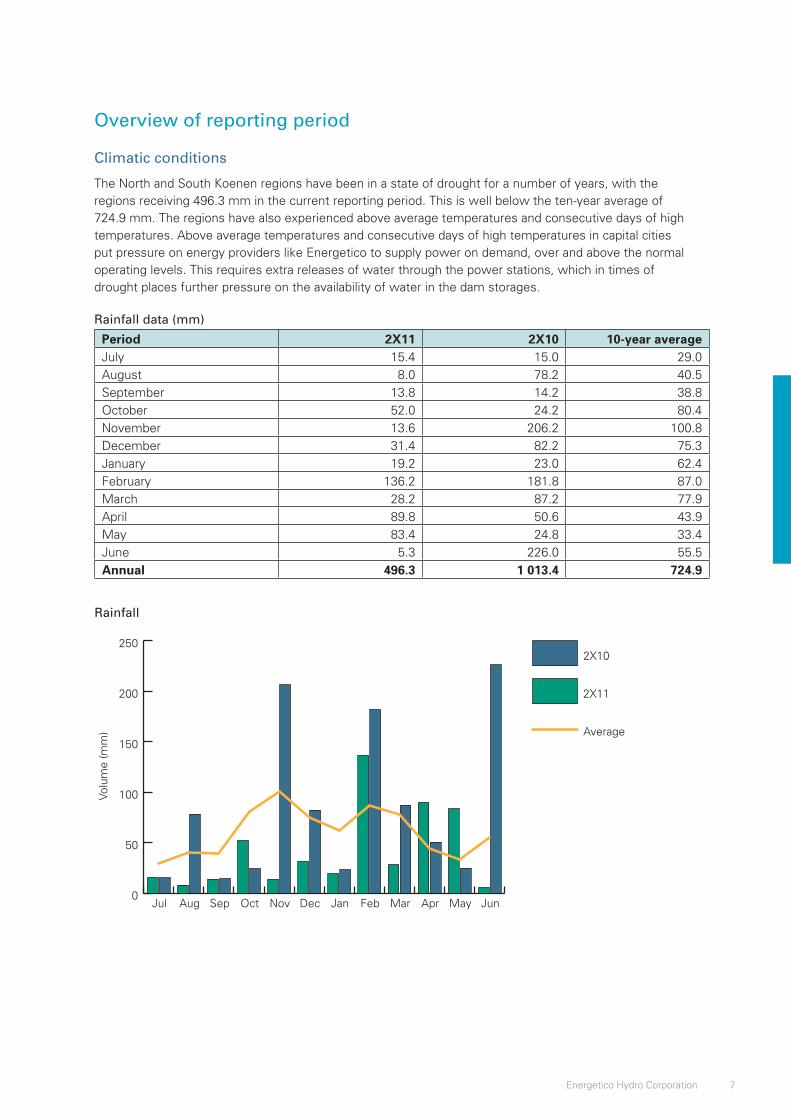
7Energetico Hydro Corporation
Overview of reporting period
Climatic conditions
The North and South Koenen regions have been in a state of drought for a number of years, with the regions receiving 496.3 mm in the current reporting period. This is well below the ten-year average of 724.9 mm. The regions have also experienced above average temperatures and consecutive days of high temperatures. Above average temperatures and consecutive days of high temperatures in capital cities put pressure on energy providers like Energetico to supply power on demand, over and above the normal operating levels. This requires extra releases of water through the power stations, which in times of drought places further pressure on the availability of water in the dam storages.
Rainfall data (mm)
Period 2X11 2X10 10-year averageJuly 15.4 15.0 29.0August 8.0 78.2 40.5September 13.8 14.2 38.8October 52.0 24.2 80.4November 13.6 206.2 100.8December 31.4 82.2 75.3January 19.2 23.0 62.4February 136.2 181.8 87.0March 28.2 87.2 77.9April 89.8 50.6 43.9May 83.4 24.8 33.4June 5.3 226.0 55.5Annual 496.3 1 013.4 724.9
Rainfall
0
50
100
150
200
2502X10
2X11
Average
JunMayAprMarFebJanDecNovOctSepAugJul
Volu
me
(mm
)
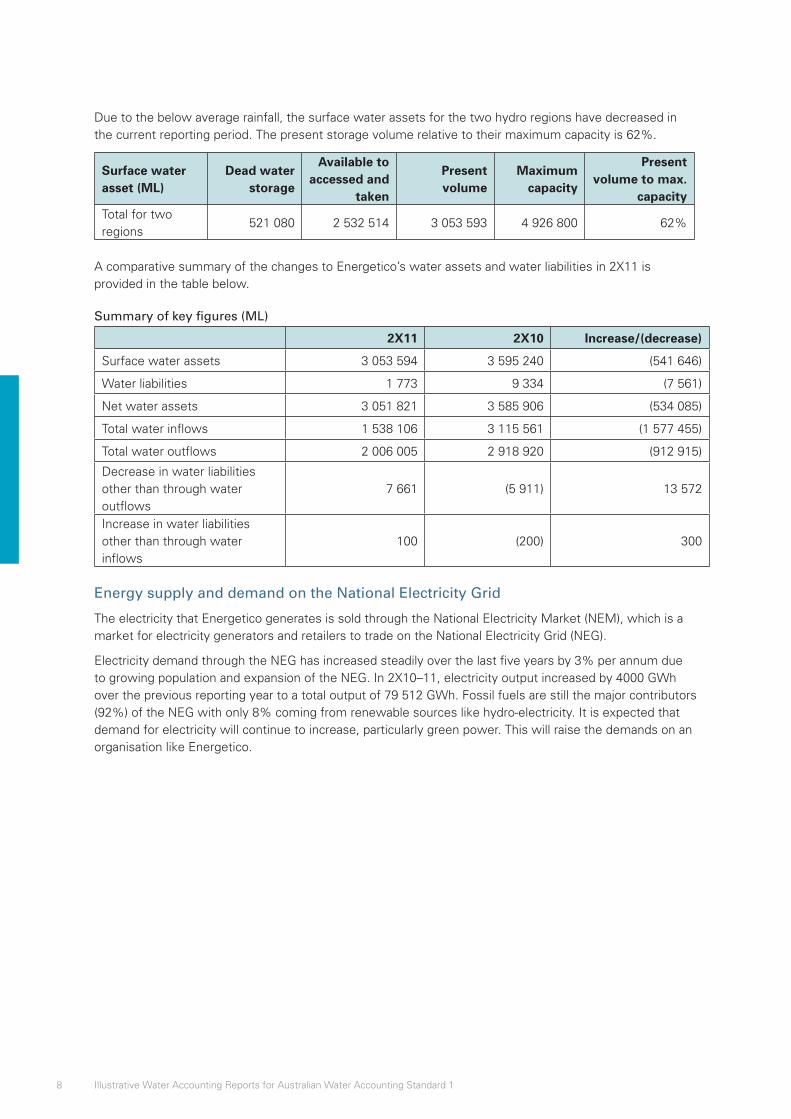
8 Illustrative Water Accounting Reports for Australian Water Accounting Standard 1
Due to the below average rainfall, the surface water assets for the two hydro regions have decreased in the current reporting period. The present storage volume relative to their maximum capacity is 62%.
Surface water asset (ML)
Dead water storage
Available to accessed and
taken
Present volume
Maximum capacity
Present volume to max.
capacity Total for two regions
521 080 2 532 514 3 053 593 4 926 800 62%
A comparative summary of the changes to Energetico’s water assets and water liabilities in 2X11 is provided in the table below.
Summary of key figures (ML)
2X11 2X10 Increase/(decrease)
Surface water assets 3 053 594 3 595 240 (541 646)
Water liabilities 1 773 9 334 (7 561)
Net water assets 3 051 821 3 585 906 (534 085)
Total water inflows 1 538 106 3 115 561 (1 577 455)
Total water outflows 2 006 005 2 918 920 (912 915)
Decrease in water liabilities other than through water outflows
7 661 (5 911) 13 572
Increase in water liabilities other than through water inflows
100 (200) 300
Energy supply and demand on the National Electricity Grid
The electricity that Energetico generates is sold through the National Electricity Market (NEM), which is a market for electricity generators and retailers to trade on the National Electricity Grid (NEG).
Electricity demand through the NEG has increased steadily over the last five years by 3% per annum due to growing population and expansion of the NEG. In 2X10–11, electricity output increased by 4000 GWh over the previous reporting year to a total output of 79 512 GWh. Fossil fuels are still the major contributors (92%) of the NEG with only 8% coming from renewable sources like hydro-electricity. It is expected that demand for electricity will continue to increase, particularly green power. This will raise the demands on an organisation like Energetico.
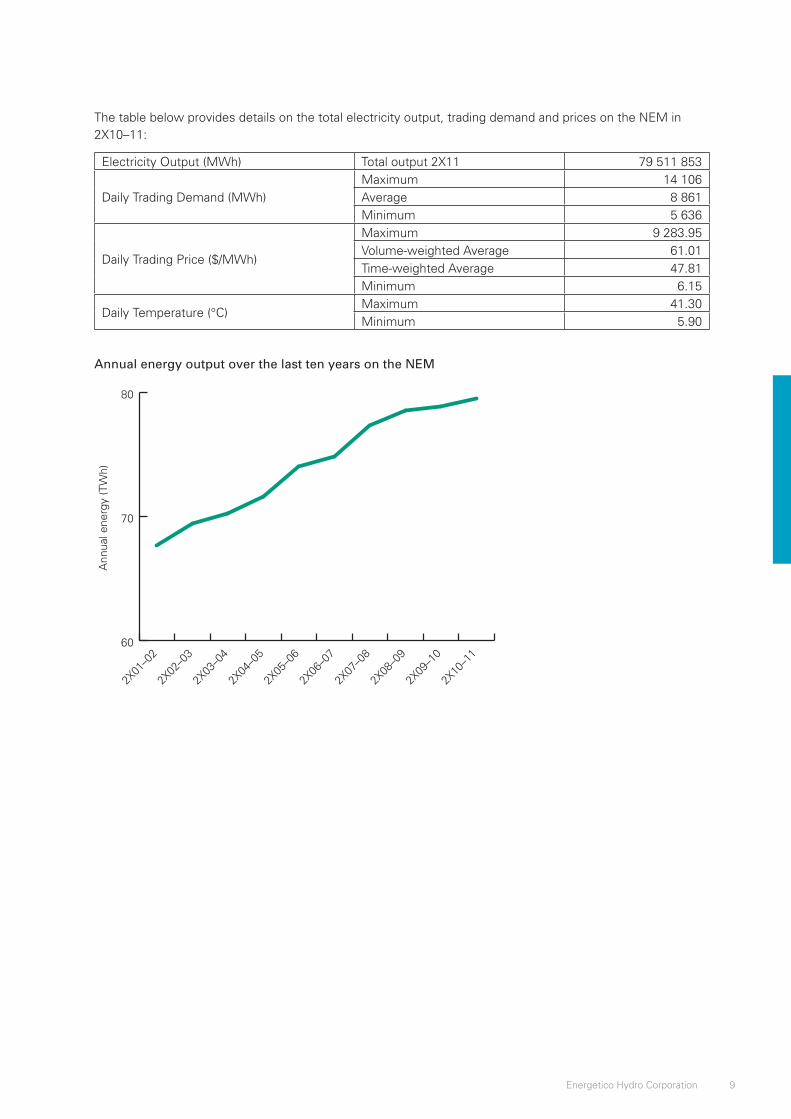
9Energetico Hydro Corporation
The table below provides details on the total electricity output, trading demand and prices on the NEM in 2X10–11:
Electricity Output (MWh) Total output 2X11 79 511 853
Daily Trading Demand (MWh)Maximum 14 106Average 8 861Minimum 5 636
Daily Trading Price ($/MWh)
Maximum 9 283.95Volume-weighted Average 61.01Time-weighted Average 47.81Minimum 6.15
Daily Temperature (°C)Maximum 41.30Minimum 5.90
Annual energy output over the last ten years on the NEM
60
70
80
2X10
–11
2X09
–10
2X08
–09
2X07
–08
2X06
–07
2X05
–06
2X04
–05
2X03
–04
2X02
–03
2X01
–02
Ann
ual e
nerg
y (T
Wh)
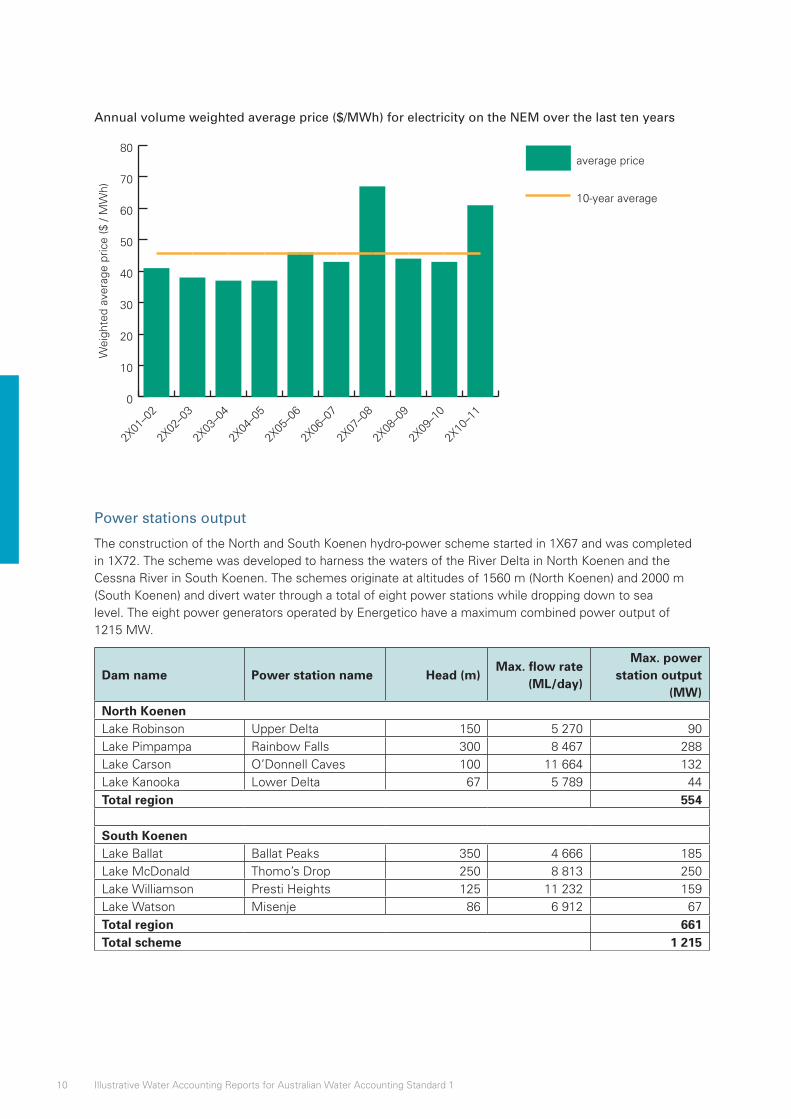
10 Illustrative Water Accounting Reports for Australian Water Accounting Standard 1
Annual volume weighted average price ($/MWh) for electricity on the NEM over the last ten years
0
10
20
30
40
50
60
70
80average price
10-year average
2X10
–11
2X09
–10
2X08
–09
2X07
–08
2X06
–07
2X05
–06
2X04
–05
2X03
–04
2X02
–03
2X01
–02
Wei
ghte
d av
erag
e pr
ice
($ /
MW
h)
Power stations output
The construction of the North and South Koenen hydro-power scheme started in 1X67 and was completed in 1X72. The scheme was developed to harness the waters of the River Delta in North Koenen and the Cessna River in South Koenen. The schemes originate at altitudes of 1560 m (North Koenen) and 2000 m (South Koenen) and divert water through a total of eight power stations while dropping down to sea level. The eight power generators operated by Energetico have a maximum combined power output of 1215 MW.
Dam name Power station name Head (m)Max. flow rate
(ML/day)
Max. power station output
(MW)North Koenen Lake Robinson Upper Delta 150 5 270 90Lake Pimpampa Rainbow Falls 300 8 467 288Lake Carson O’Donnell Caves 100 11 664 132Lake Kanooka Lower Delta 67 5 789 44Total region 554 South Koenen Lake Ballat Ballat Peaks 350 4 666 185Lake McDonald Thomo’s Drop 250 8 813 250Lake Williamson Presti Heights 125 11 232 159Lake Watson Misenje 86 6 912 67Total region 661Total scheme 1 215

11Energetico Hydro Corporation
The power stations are operated at different output modes during the year depending on the demand and cost of electricity and the amount of water available. Some of the power stations are run consistently over days and weeks to supply base load commitments producing a steady supply of electricity and outflow down the river. In other times, extra generators are run to meet peak supply demands. The amount of water run through the generators is determined by the electricity supply required. Energetico’s business objective is to try and run the generators as close as possible to their efficient load to maximise the amount of energy generation with the least amount of water input. Energetico seeks to balance the amount of water used to generate power with the amount of water available. Energetico endeavours to store excess water in periods of low rainfall for use in periods of high energy demand.
In August 2X11, a major flooding event damaged the Misenje power station at Lake Watson. The repairs are estimated to take between three to five months and, until such time, the total maximum power station output will be 1148 MW. Further information on this can be found at note 2i.

12 Illustrative Water Accounting Reports for Australian Water Accounting Standard 1
Accountability Statement
AWAS 1 paragraphs 62–63
Basis for Conclusions paragraphs B45–B48
The Accountability Statement is a statement signed and dated by the person(s) or representative(s) responsible for preparing and presenting the general purpose water accounting report. The Statement assists users of general water accounting reports determine whether the report has been prepared and presented in accordance with Australian Water Accounting Standards.
If the general purpose water accounting report is not prepared in accordance with Australian Water Accounting Standards, a statement to this effect is disclosed setting out the nature of and reason for non-compliance.
In the opinion of the undersigned, this general purpose water accounting report has been prepared in accordance with Australian Water Accounting Standard 1.
This Accountability Statement is made in accordance with a resolution of the directors, dated at Tys, in the State of Minton, on 21 August 2X11.
Gina MitchellChairmanEnergetico Hydro Corporation
13Energetico Hydro Corporation
Assurance of water accounting report
AWAS 1 paragraphs 178–182
Basis for Conclusions paragraphs B165–B169
Water Accounting Conceptual Framework SWAC 2:26–28 and SWAC 8
AWAS 1 requires a general purpose water accounting report to be subjected to assurance to establish whether it is presented fairly in accordance with Australian Water Accounting Standards. The assurance of the general purpose water accounting report is to be performed by an appropriately qualified assurance practitioner independent of the management of the water report entity and the preparer of the general purpose water accounting report.
AWAS requires a statement of whether the general purpose water accounting report is presented mainly in accordance with AWAS to be provided by the assurance practitioner in an assurance report accompanying the general purpose water accounting report.
The assurance function, undertaken by an appropriately qualified and independent assurance provider, is important in enhancing users’ confidence in the veracity of the information being presented to inform decision-making.
An assurance framework will be released for public consultation in late 2012.
14 Illustrative Water Accounting Reports for Australian Water Accounting Standard 1
Water Accounting Statements
Statement of Water Assets and Water Liabilities
AWAS 1 paragraphs 21–46, 51–54 and 64–106
Implementation Guidance A, C, D and E
Basis for Conclusions paragraphs B23–B38 and B49–B129
Water Accounting Conceptual Framework SWAC 3, SWAC 4, SWAC 5 and SWAC 6
The Statement of Water Assets and Water Liabilities is a statement that provides information about the water assets and water liabilities of the water report entity at a point in time. The information in the Statement of Water Assets and Water Liabilities relates both to water and rights to, and claims against, water. This statement is prepared on an accrual basis.
The Statement of Water Assets and Water Liabilities shall contain the following minimum line items:
• water assets;
• water liabilities; and
• net water assets.
Additional sub-classification of the minimum line items can be presented in accordance with AWAS 1 paragraph 66.
Items in the Statement of Water Assets and Water Liabilities are to be cross-referenced to the relevant note disclosure.
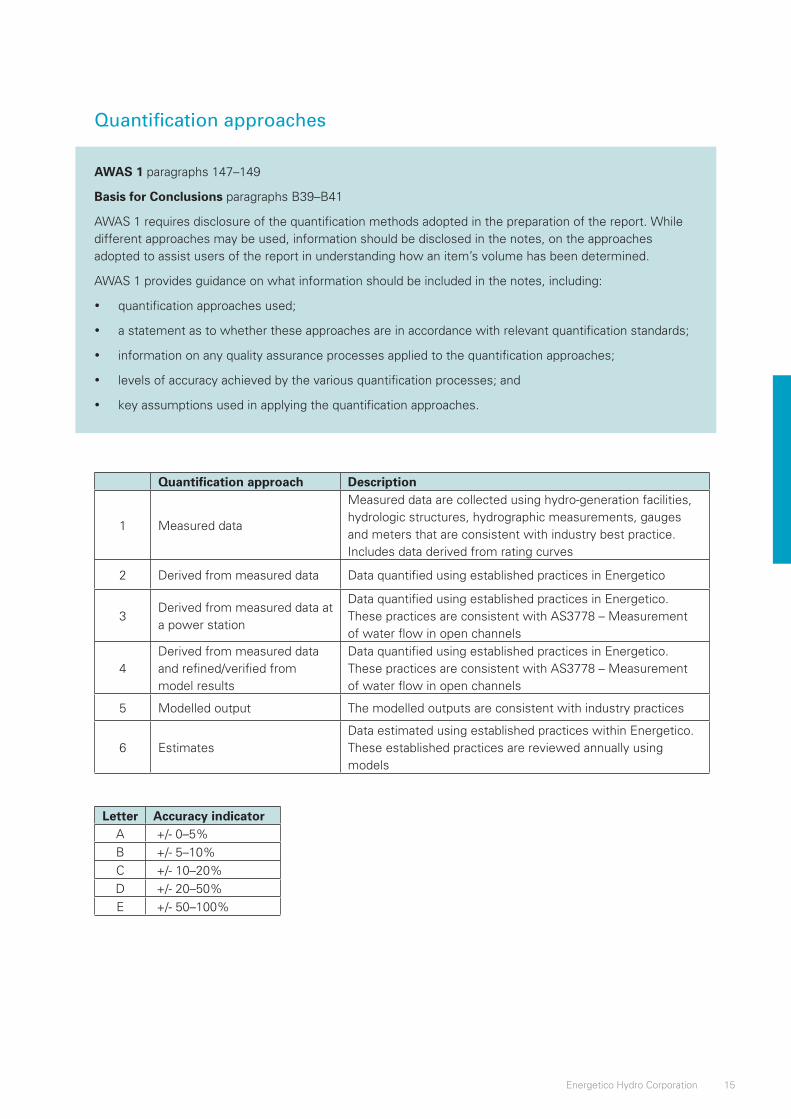
15Energetico Hydro Corporation
Quantification approaches
AWAS 1 paragraphs 147–149
Basis for Conclusions paragraphs B39–B41
AWAS 1 requires disclosure of the quantification methods adopted in the preparation of the report. While different approaches may be used, information should be disclosed in the notes, on the approaches adopted to assist users of the report in understanding how an item’s volume has been determined.
AWAS 1 provides guidance on what information should be included in the notes, including:
• quantification approaches used;
• a statement as to whether these approaches are in accordance with relevant quantification standards;
• information on any quality assurance processes applied to the quantification approaches;
• levels of accuracy achieved by the various quantification processes; and
• key assumptions used in applying the quantification approaches.
Quantification approach Description
1 Measured data
Measured data are collected using hydro-generation facilities, hydrologic structures, hydrographic measurements, gauges and meters that are consistent with industry best practice. Includes data derived from rating curves
2 Derived from measured data Data quantified using established practices in Energetico
3Derived from measured data at a power station
Data quantified using established practices in Energetico. These practices are consistent with AS3778 – Measurement of water flow in open channels
4Derived from measured data and refined/verified from model results
Data quantified using established practices in Energetico. These practices are consistent with AS3778 – Measurement of water flow in open channels
5 Modelled output The modelled outputs are consistent with industry practices
6 EstimatesData estimated using established practices within Energetico. These established practices are reviewed annually using models
Letter Accuracy indicatorA +/- 0–5%
B +/- 5–10%
C +/- 10–20%
D +/- 20–50%
E +/- 50–100%
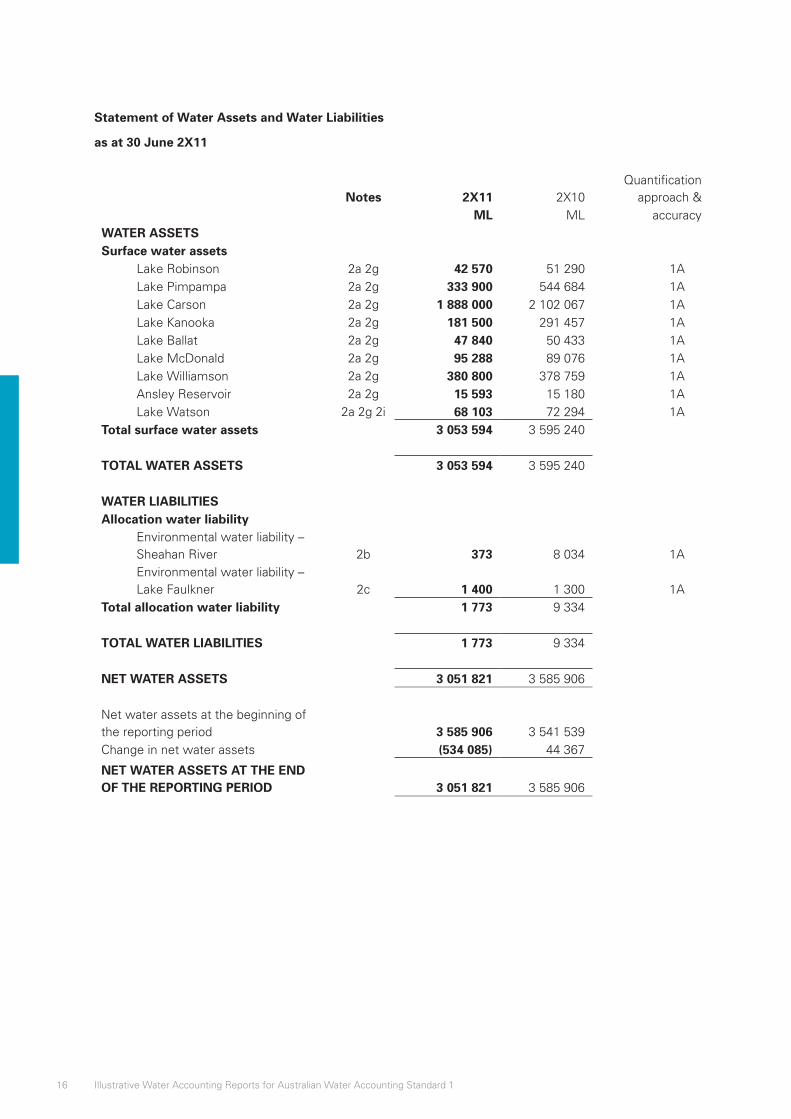
16 Illustrative Water Accounting Reports for Australian Water Accounting Standard 1
Statement of Water Assets and Water Liabilities
as at 30 June 2X11
Notes 2X11 2X10Quantification
approach & ML ML accuracy
WATER ASSETSSurface water assets
Lake Robinson 2a 2g 42 570 51 290 1ALake Pimpampa 2a 2g 333 900 544 684 1ALake Carson 2a 2g 1 888 000 2 102 067 1ALake Kanooka 2a 2g 181 500 291 457 1ALake Ballat 2a 2g 47 840 50 433 1ALake McDonald 2a 2g 95 288 89 076 1ALake Williamson 2a 2g 380 800 378 759 1AAnsley Reservoir 2a 2g 15 593 15 180 1ALake Watson 2a 2g 2i 68 103 72 294 1A
Total surface water assets 3 053 594 3 595 240
TOTAL WATER ASSETS 3 053 594 3 595 240
WATER LIABILITIESAllocation water liability
Environmental water liability – Sheahan River 2b 373 8 034 1AEnvironmental water liability – Lake Faulkner 2c 1 400 1 300 1A
Total allocation water liability 1 773 9 334
TOTAL WATER LIABILITIES 1 773 9 334
NET WATER ASSETS 3 051 821 3 585 906
Net water assets at the beginning of the reporting period 3 585 906 3 541 539Change in net water assets (534 085) 44 367
NET WATER ASSETS AT THE END OF THE REPORTING PERIOD 3 051 821 3 585 906
17Energetico Hydro Corporation
Statement of Changes in Water Assets and Water Liabilities
AWAS 1 paragraphs 21–46, 51–54 and 123–127
Implementation Guidance A, C, D and E
Basis for Conclusions paragraphs B23–B38 and B130–B132
Water Accounting Conceptual Framework SWAC 3, SWAC 4, SWAC 5 and SWAC 6
The Statement of Changes in Water Assets and Water Liabilities and the Statement of Water Flows provide users with information on the nature and volumes of changes in the water report entity’s net water assets during the reporting period and the nature and volumes of physical water flows experienced by the water report entity during the reporting period.
AWAS 1 permits these two statements to be combined, in certain circumstances, and presented as a single statement titled the Statement of Changes in Water Assets and Water Liabilities. The combined statement shall contain line items that present the following volumes as at the reporting date:
• opening water storage;
• water inflows;
• water outflows;
• change in water storage;
• closing water storage;
• increase in rights or other claims to water;
• decrease in water liabilities other than through water outflows;
• decrease in rights or other claims to water;
• increase in water liabilities other than through water inflows;
• change in net water assets from accruals; and
• change in net water assets.
The combined statement is permitted to be presented by a water report entity when, for example, it has minimal line items in the Statement of Water Assets and Water Liabilities that relate to rights or other claims to water, or present obligations over water, and only provided its use does not undermine the fair presentation of the general purpose water accounting report.
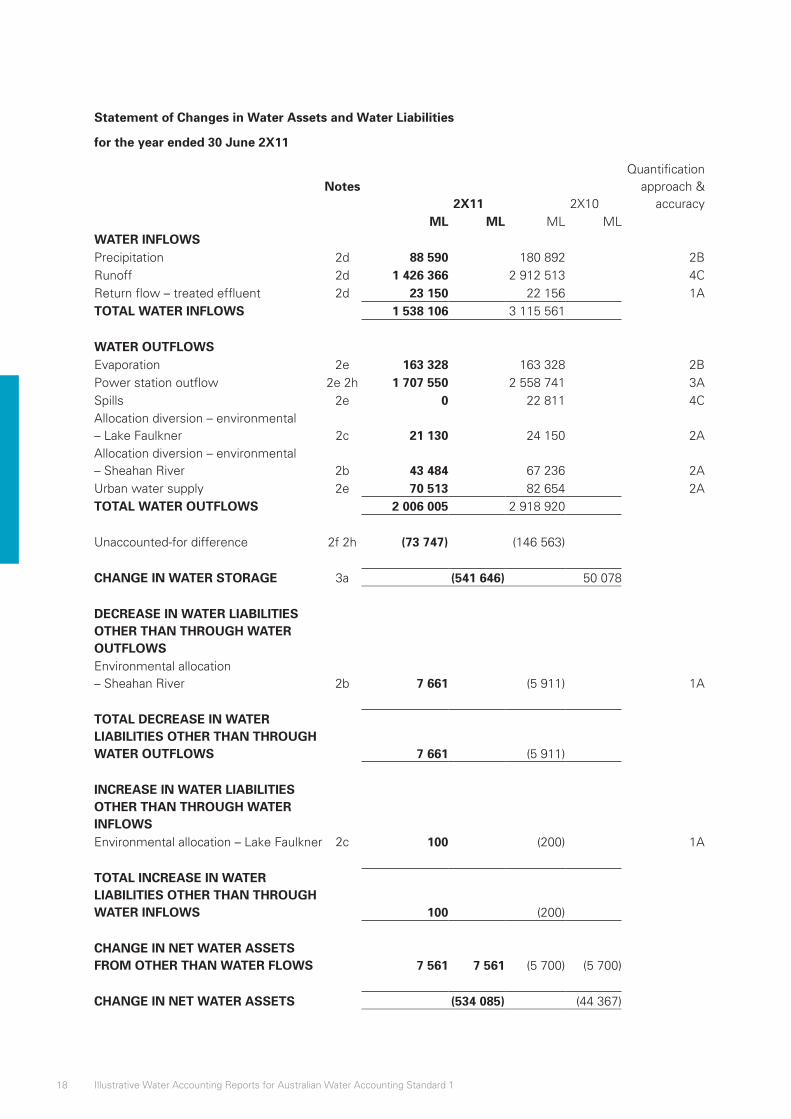
18 Illustrative Water Accounting Reports for Australian Water Accounting Standard 1
Statement of Changes in Water Assets and Water Liabilities
for the year ended 30 June 2X11
Notes
2X11 2X10
Quantificationapproach &
accuracy ML ML ML MLWATER INFLOWSPrecipitation 2d 88 590 180 892 2BRunoff 2d 1 426 366 2 912 513 4CReturn flow – treated effluent 2d 23 150 22 156 1ATOTAL WATER INFLOWS 1 538 106 3 115 561 WATER OUTFLOWSEvaporation 2e 163 328 163 328 2BPower station outflow 2e 2h 1 707 550 2 558 741 3ASpills 2e 0 22 811 4CAllocation diversion – environmental – Lake Faulkner 2c 21 130 24 150 2AAllocation diversion – environmental – Sheahan River 2b 43 484 67 236 2AUrban water supply 2e 70 513 82 654 2ATOTAL WATER OUTFLOWS 2 006 005 2 918 920 Unaccounted-for difference 2f 2h (73 747) (146 563) CHANGE IN WATER STORAGE 3a (541 646) 50 078 DECREASE IN WATER LIABILITIES OTHER THAN THROUGH WATER OUTFLOWS Environmental allocation – Sheahan River 2b 7 661 (5 911) 1A
TOTAL DECREASE IN WATER LIABILITIES OTHER THAN THROUGH WATER OUTFLOWS 7 661 (5 911)
INCREASE IN WATER LIABILITIES OTHER THAN THROUGH WATER INFLOWSEnvironmental allocation – Lake Faulkner 2c 100 (200) 1A
TOTAL INCREASE IN WATER LIABILITIES OTHER THAN THROUGH WATER INFLOWS 100 (200) CHANGE IN NET WATER ASSETS FROM OTHER THAN WATER FLOWS 7 561 7 561 (5 700) (5 700) CHANGE IN NET WATER ASSETS (534 085) (44 367)
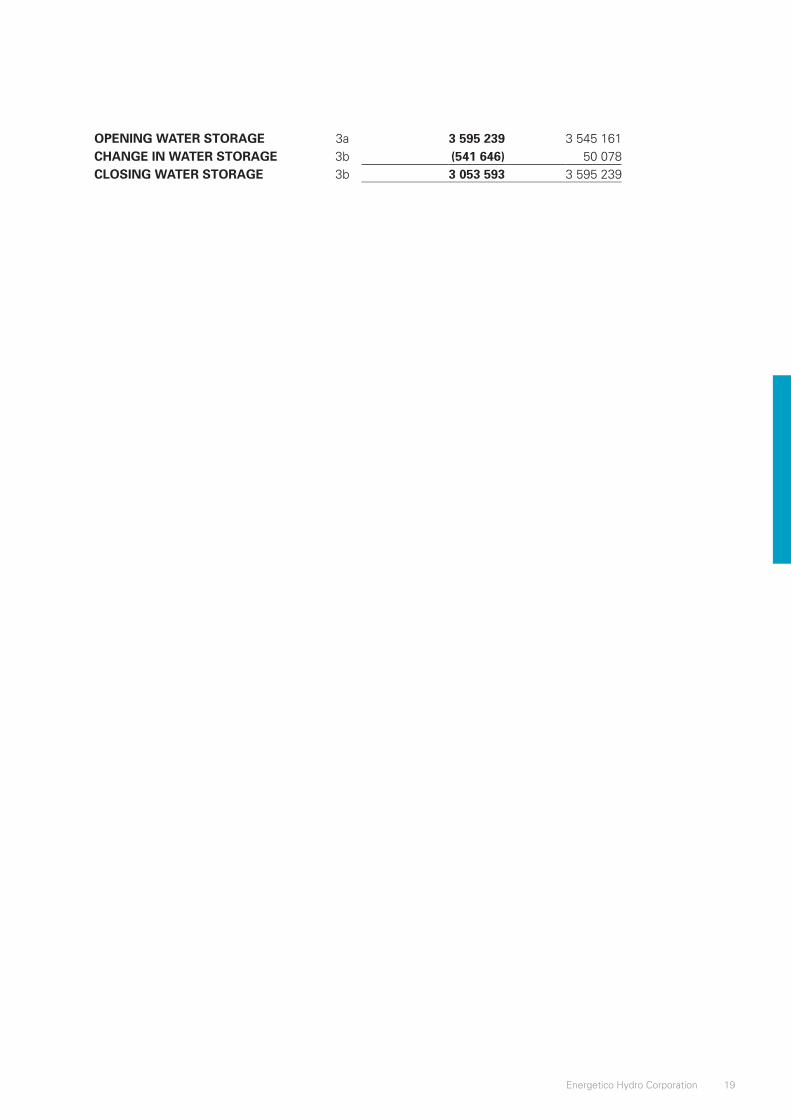
19Energetico Hydro Corporation
OPENING WATER STORAGE 3a 3 595 239 3 545 161CHANGE IN WATER STORAGE 3b (541 646) 50 078CLOSING WATER STORAGE 3b 3 053 593 3 595 239
20 Illustrative Water Accounting Reports for Australian Water Accounting Standard 1
Notes
AWAS 1 paragraphs 133–177
Implementation Guidance A, B, D, E, F, G and H
Basis for Conclusions paragraphs B146–B164
Water Accounting Conceptual Framework SWAC 2: 24–29
Information shall be disclosed in the notes that assist users of general purpose water accounting reports in understanding the water assets and water liabilities of the water report entity. The notes provide additional quantitative and qualitative information about the items presented in the water accounting statements. They also provide additional information on important aspects of the water report entity.
The following is a complete list of notes required by AWAS 1:
1. Significant water accounting policies
2. Supporting information to the water accounting statements
3. Restatement of comparative information
4. Prior period errors
5. Non-adjusting events after the end of the reporting period
6. Quantification approaches
7. Reconciliations
8. Future prospects
9. Contingent water assets and contingent water liabilities
10. Water assets and water liabilities that do not meet the recognition criteria
11. Water rights, water allocations and water restrictions
12. Water market activity
13. Water for environmental, social and cultural, and economic benefit
14. Segment information
15. Group water accounting reports.
Notes 1, 2, 3, 4, 5, 6, 7, 8, 9, 13 and 14 are demonstrated in this illustrative water accounting report.
21Energetico Hydro Corporation
Note 1: Significant water accounting policies
AWAS 1 paragraphs 21–22, 51–54 and 136–138
AWAS 1 requires the preparer of a general purpose water accounting report to provide information on the water accounting policies adopted in the preparation of the water accounting statements in order to enhance users’ understanding of how transactions, transformations and events are reflected in the water accounting statements.
The following information shall be disclosed in the summary of significant water accounting policies:
• a statement that the general purpose water accounting report has been prepared using the accrual basis of water accounting (except for the water flow information);
• the quantification attribute and the unit of account used in the water accounting statements; and
• information on other water accounting policies used in the preparation and presentation of the general purpose water accounting report that are relevant to an understanding of the water accounting statements.
With the exception of the physical water flow information, this general purpose water accounting report was prepared using an accrual basis of water accounting. The water attribute being quantified is volume and the unit of account is litres, presented in megalitres (ML).
Recognition of water assets
Water that Energetico either holds or has management responsibilities for is recognised as a water asset provided that:
1) Energetico derives future benefits from that water; and
2) the volumes of water can be quantified with representational faithfulness.
Future benefits are derived from the water when it contributes to generating hydro-electric power.
Groundwater aquifers and natural lakes, while within the physical region in which Energetico operates, are not recognised as water assets of Energetico. This is because the water is not utilised in the production of electricity and Energetico therefore does not derive future benefits from such water. Nor does Energetico hold or have management responsibility for this water.
Water within the river channel storage is vital to the hydro-generation process but only as a channel to move water between storages. The only data collected on river channels are the flow rate of the water. The volume of water within the river channel is a water asset but it fails the recognition criteria, as its volume cannot be quantified with representational faithfulness. However, its omission from the general purpose water accounting report is not considered to have a material impact.
Recognition of changes in water assets
The volumes of precipitation and evaporation are only quantified on the lake’s surface. They are not quantified for the entire region.
The power station outflows are calculated as the water is directed through the hydro-power turbines. It is assumed all water that flows out of the power station flows directly into the next storage lake as inflow from upstream power stations. Any losses or additions are accounted for as part of runoff.
Runoff is a measurement of the volume of water that flows into the lakes less inflow from upstream power stations. The runoff includes precipitation captured in the catchment area of the storage facilities less any losses in the transfer of water between power stations.
Treated effluent is recognised as a change in water assets as it will be used in conjunction with other water resources for the production of hydro-power.
22 Illustrative Water Accounting Reports for Australian Water Accounting Standard 1
Note 2: Information supporting the items presented in the water accounting statements
AWAS 1 paragraphs 31–54 and 133–150
Basis for Conclusions paragraphs B35–B41
Water Accounting Conceptual Framework SWAC 2: 24–29
In order to assist in the ability to understand and compare the water accounting statements, AWAS 1 requires the inclusion of information in the notes that supports the items presented in the water accounting statements. The information is to be presented in the order in which each item is presented in the statements, including:
• information about the restatement of comparative information;
• information about prior period errors;
• information about non-adjusting events after the end of the reporting period;
• information about quantification approaches; and
• reconciliations and other information related to the Statement of Water Flows.
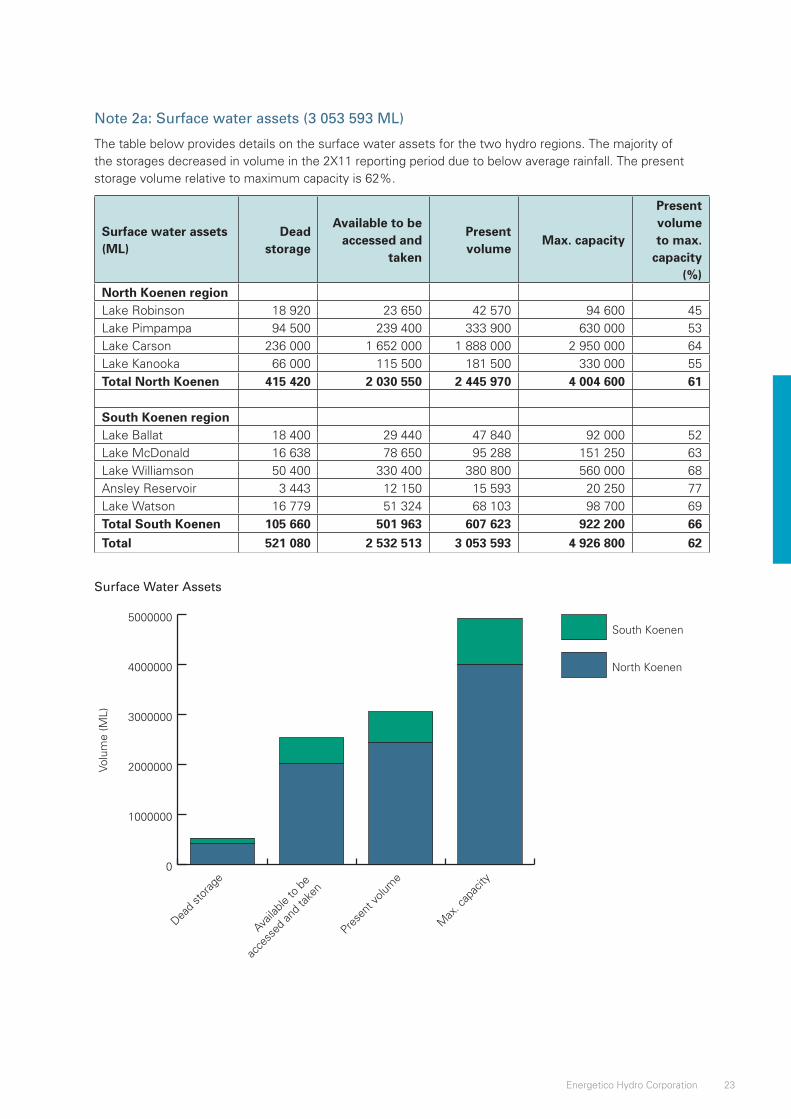
23Energetico Hydro Corporation
Note 2a: Surface water assets (3 053 593 ML)
The table below provides details on the surface water assets for the two hydro regions. The majority of the storages decreased in volume in the 2X11 reporting period due to below average rainfall. The present storage volume relative to maximum capacity is 62%.
Surface water assets (ML)
Dead storage
Available to be accessed and
taken
Present volume
Max. capacity
Present volume to max.
capacity (%)
North Koenen region Lake Robinson 18 920 23 650 42 570 94 600 45Lake Pimpampa 94 500 239 400 333 900 630 000 53Lake Carson 236 000 1 652 000 1 888 000 2 950 000 64Lake Kanooka 66 000 115 500 181 500 330 000 55Total North Koenen 415 420 2 030 550 2 445 970 4 004 600 61
South Koenen regionLake Ballat 18 400 29 440 47 840 92 000 52Lake McDonald 16 638 78 650 95 288 151 250 63Lake Williamson 50 400 330 400 380 800 560 000 68Ansley Reservoir 3 443 12 150 15 593 20 250 77Lake Watson 16 779 51 324 68 103 98 700 69Total South Koenen 105 660 501 963 607 623 922 200 66Total 521 080 2 532 513 3 053 593 4 926 800 62
Surface Water Assets
0
1000000
2000000
3000000
4000000
5000000South Koenen
North Koenen
Max
. cap
acity
Prese
nt vo
lume
Availa
ble to
be
acce
ssed
and
take
n
Dead
stor
age
Volu
me
(ML)
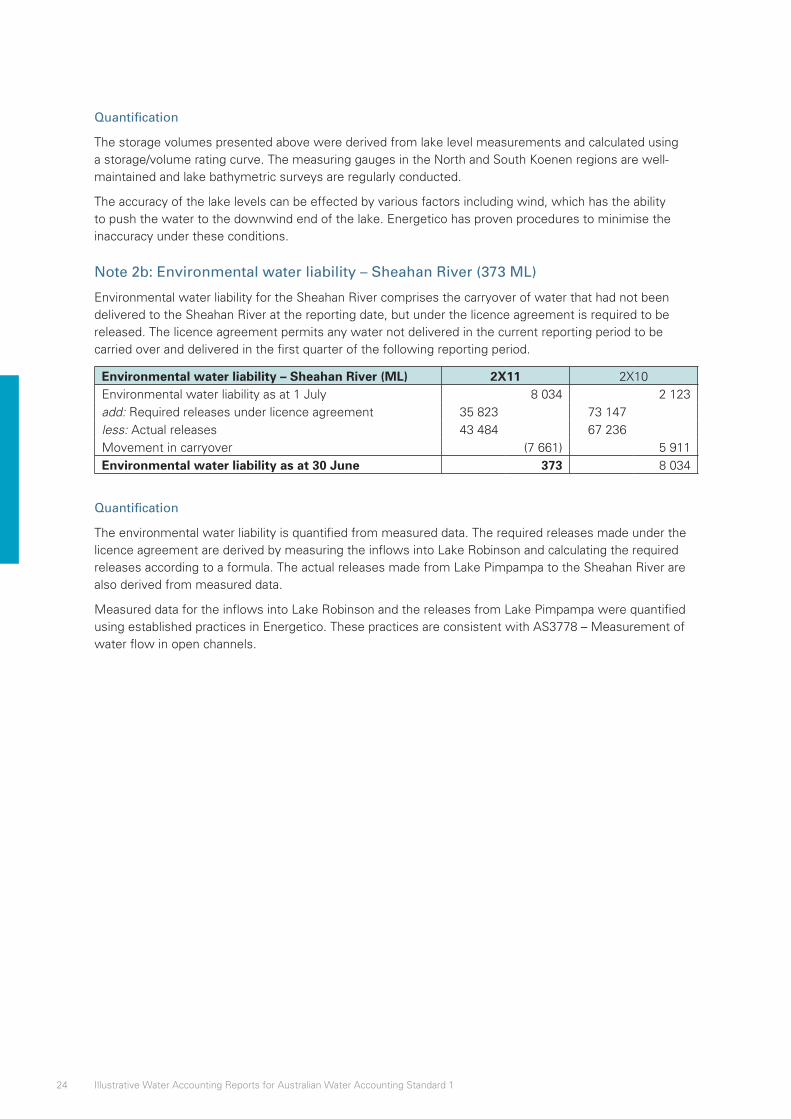
24 Illustrative Water Accounting Reports for Australian Water Accounting Standard 1
Quantification
The storage volumes presented above were derived from lake level measurements and calculated using a storage/volume rating curve. The measuring gauges in the North and South Koenen regions are well-maintained and lake bathymetric surveys are regularly conducted.
The accuracy of the lake levels can be effected by various factors including wind, which has the ability to push the water to the downwind end of the lake. Energetico has proven procedures to minimise the inaccuracy under these conditions.
Note 2b: Environmental water liability – Sheahan River (373 ML)
Environmental water liability for the Sheahan River comprises the carryover of water that had not been delivered to the Sheahan River at the reporting date, but under the licence agreement is required to be released. The licence agreement permits any water not delivered in the current reporting period to be carried over and delivered in the first quarter of the following reporting period.
Environmental water liability – Sheahan River (ML) 2X11 2X10Environmental water liability as at 1 July 8 034 2 123add: Required releases under licence agreement 35 823 73 147 less: Actual releases 43 484 67 236 Movement in carryover (7 661) 5 911Environmental water liability as at 30 June 373 8 034
Quantification
The environmental water liability is quantified from measured data. The required releases made under the licence agreement are derived by measuring the inflows into Lake Robinson and calculating the required releases according to a formula. The actual releases made from Lake Pimpampa to the Sheahan River are also derived from measured data.
Measured data for the inflows into Lake Robinson and the releases from Lake Pimpampa were quantified using established practices in Energetico. These practices are consistent with AS3778 – Measurement of water flow in open channels.
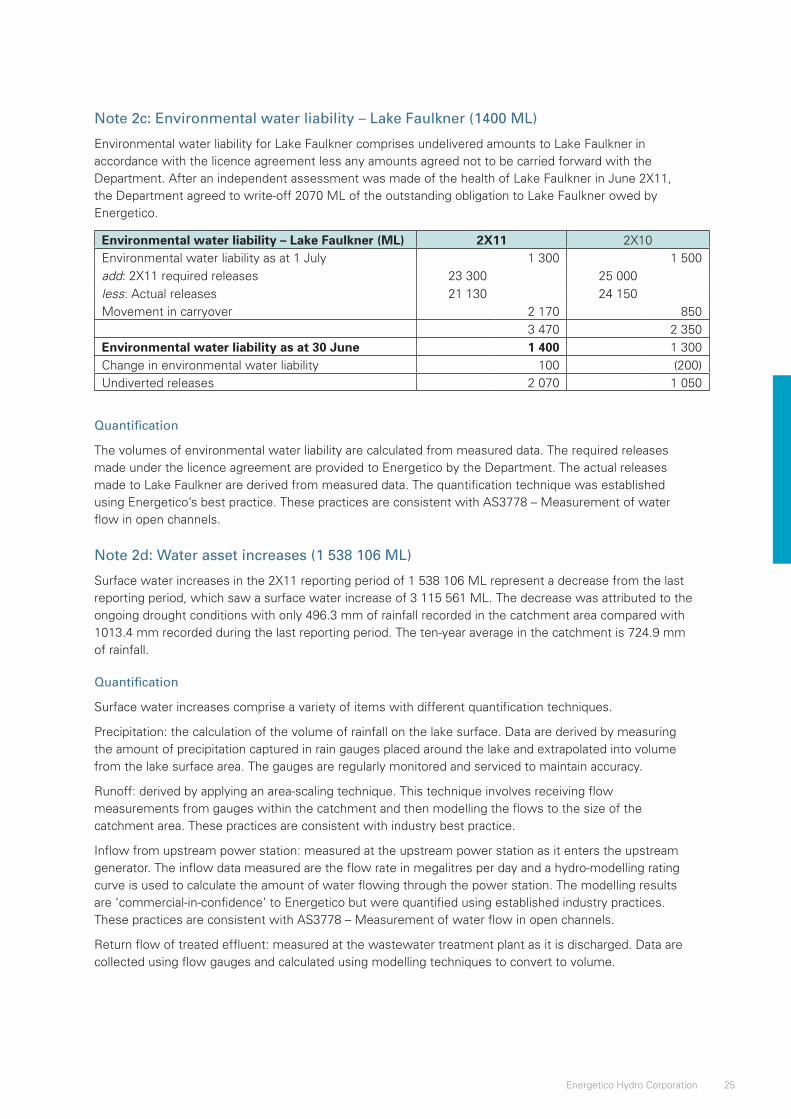
25Energetico Hydro Corporation
Note 2c: Environmental water liability – Lake Faulkner (1400 ML)
Environmental water liability for Lake Faulkner comprises undelivered amounts to Lake Faulkner in accordance with the licence agreement less any amounts agreed not to be carried forward with the Department. After an independent assessment was made of the health of Lake Faulkner in June 2X11, the Department agreed to write-off 2070 ML of the outstanding obligation to Lake Faulkner owed by Energetico.
Environmental water liability – Lake Faulkner (ML) 2X11 2X10Environmental water liability as at 1 July 1 300 1 500add: 2X11 required releases 23 300 25 000 less: Actual releases 21 130 24 150 Movement in carryover 2 170 850
3 470 2 350Environmental water liability as at 30 June 1 400 1 300Change in environmental water liability 100 (200)Undiverted releases 2 070 1 050
Quantification
The volumes of environmental water liability are calculated from measured data. The required releases made under the licence agreement are provided to Energetico by the Department. The actual releases made to Lake Faulkner are derived from measured data. The quantification technique was established using Energetico’s best practice. These practices are consistent with AS3778 – Measurement of water flow in open channels.
Note 2d: Water asset increases (1 538 106 ML)
Surface water increases in the 2X11 reporting period of 1 538 106 ML represent a decrease from the last reporting period, which saw a surface water increase of 3 115 561 ML. The decrease was attributed to the ongoing drought conditions with only 496.3 mm of rainfall recorded in the catchment area compared with 1013.4 mm recorded during the last reporting period. The ten-year average in the catchment is 724.9 mm of rainfall.
Quantification
Surface water increases comprise a variety of items with different quantification techniques.
Precipitation: the calculation of the volume of rainfall on the lake surface. Data are derived by measuring the amount of precipitation captured in rain gauges placed around the lake and extrapolated into volume from the lake surface area. The gauges are regularly monitored and serviced to maintain accuracy.
Runoff: derived by applying an area-scaling technique. This technique involves receiving flow measurements from gauges within the catchment and then modelling the flows to the size of the catchment area. These practices are consistent with industry best practice.
Inflow from upstream power station: measured at the upstream power station as it enters the upstream generator. The inflow data measured are the flow rate in megalitres per day and a hydro-modelling rating curve is used to calculate the amount of water flowing through the power station. The modelling results are ‘commercial-in-confidence’ to Energetico but were quantified using established industry practices. These practices are consistent with AS3778 – Measurement of water flow in open channels.
Return flow of treated effluent: measured at the wastewater treatment plant as it is discharged. Data are collected using flow gauges and calculated using modelling techniques to convert to volume.
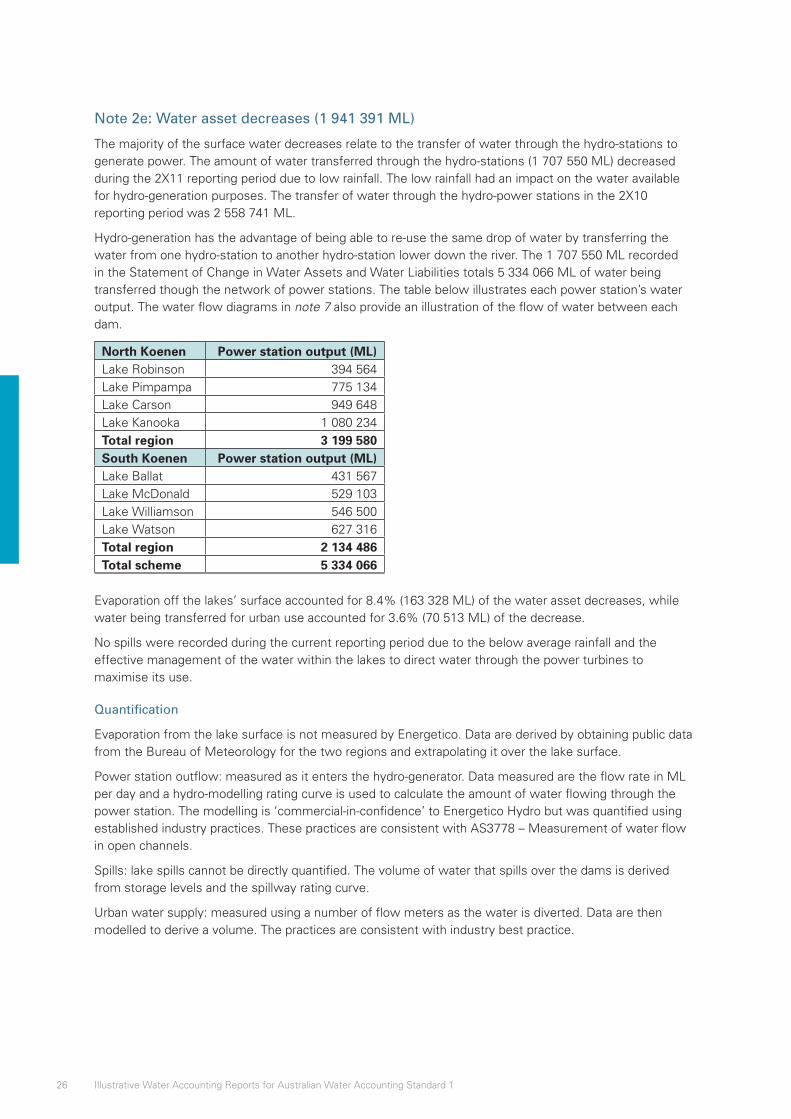
26 Illustrative Water Accounting Reports for Australian Water Accounting Standard 1
Note 2e: Water asset decreases (1 941 391 ML)
The majority of the surface water decreases relate to the transfer of water through the hydro-stations to generate power. The amount of water transferred through the hydro-stations (1 707 550 ML) decreased during the 2X11 reporting period due to low rainfall. The low rainfall had an impact on the water available for hydro-generation purposes. The transfer of water through the hydro-power stations in the 2X10 reporting period was 2 558 741 ML.
Hydro-generation has the advantage of being able to re-use the same drop of water by transferring the water from one hydro-station to another hydro-station lower down the river. The 1 707 550 ML recorded in the Statement of Change in Water Assets and Water Liabilities totals 5 334 066 ML of water being transferred though the network of power stations. The table below illustrates each power station’s water output. The water flow diagrams in note 7 also provide an illustration of the flow of water between each dam.
North Koenen Power station output (ML)Lake Robinson 394 564Lake Pimpampa 775 134Lake Carson 949 648Lake Kanooka 1 080 234Total region 3 199 580South Koenen Power station output (ML)Lake Ballat 431 567Lake McDonald 529 103Lake Williamson 546 500Lake Watson 627 316Total region 2 134 486Total scheme 5 334 066
Evaporation off the lakes’ surface accounted for 8.4% (163 328 ML) of the water asset decreases, while water being transferred for urban use accounted for 3.6% (70 513 ML) of the decrease.
No spills were recorded during the current reporting period due to the below average rainfall and the effective management of the water within the lakes to direct water through the power turbines to maximise its use.
Quantification
Evaporation from the lake surface is not measured by Energetico. Data are derived by obtaining public data from the Bureau of Meteorology for the two regions and extrapolating it over the lake surface.
Power station outflow: measured as it enters the hydro-generator. Data measured are the flow rate in ML per day and a hydro-modelling rating curve is used to calculate the amount of water flowing through the power station. The modelling is ‘commercial-in-confidence’ to Energetico Hydro but was quantified using established industry practices. These practices are consistent with AS3778 – Measurement of water flow in open channels.
Spills: lake spills cannot be directly quantified. The volume of water that spills over the dams is derived from storage levels and the spillway rating curve.
Urban water supply: measured using a number of flow meters as the water is diverted. Data are then modelled to derive a volume. The practices are consistent with industry best practice.
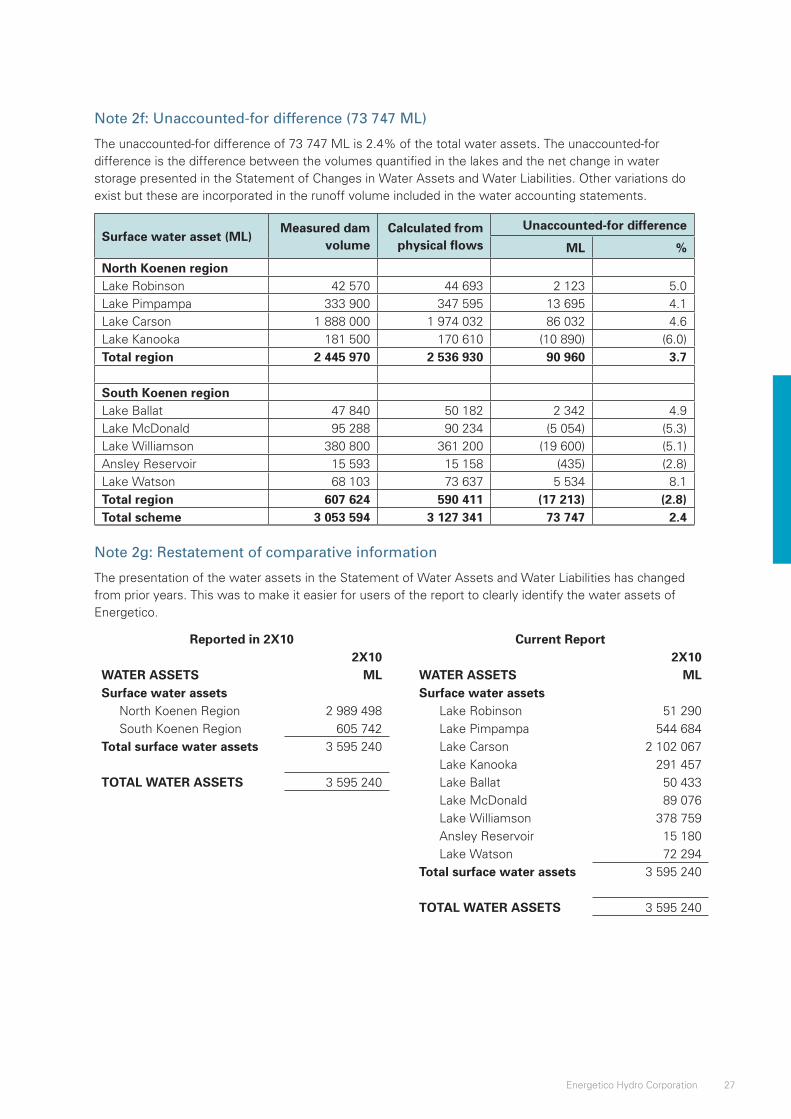
27Energetico Hydro Corporation
Note 2f: Unaccounted-for difference (73 747 ML)
The unaccounted-for difference of 73 747 ML is 2.4% of the total water assets. The unaccounted-for difference is the difference between the volumes quantified in the lakes and the net change in water storage presented in the Statement of Changes in Water Assets and Water Liabilities. Other variations do exist but these are incorporated in the runoff volume included in the water accounting statements.
Surface water asset (ML)Measured dam
volumeCalculated from
physical flows
Unaccounted-for difference
ML %
North Koenen regionLake Robinson 42 570 44 693 2 123 5.0Lake Pimpampa 333 900 347 595 13 695 4.1Lake Carson 1 888 000 1 974 032 86 032 4.6Lake Kanooka 181 500 170 610 (10 890) (6.0)Total region 2 445 970 2 536 930 90 960 3.7
South Koenen regionLake Ballat 47 840 50 182 2 342 4.9Lake McDonald 95 288 90 234 (5 054) (5.3)Lake Williamson 380 800 361 200 (19 600) (5.1)Ansley Reservoir 15 593 15 158 (435) (2.8)Lake Watson 68 103 73 637 5 534 8.1Total region 607 624 590 411 (17 213) (2.8)Total scheme 3 053 594 3 127 341 73 747 2.4
Note 2g: Restatement of comparative information
The presentation of the water assets in the Statement of Water Assets and Water Liabilities has changed from prior years. This was to make it easier for users of the report to clearly identify the water assets of Energetico.
Reported in 2X10 Current Report2X10 2X10
WATER ASSETS ML WATER ASSETS MLSurface water assets Surface water assets
North Koenen Region 2 989 498 Lake Robinson 51 290South Koenen Region 605 742 Lake Pimpampa 544 684
Total surface water assets 3 595 240 Lake Carson 2 102 067Lake Kanooka 291 457
TOTAL WATER ASSETS 3 595 240 Lake Ballat 50 433Lake McDonald 89 076Lake Williamson 378 759Ansley Reservoir 15 180Lake Watson 72 294
Total surface water assets 3 595 240
TOTAL WATER ASSETS 3 595 240
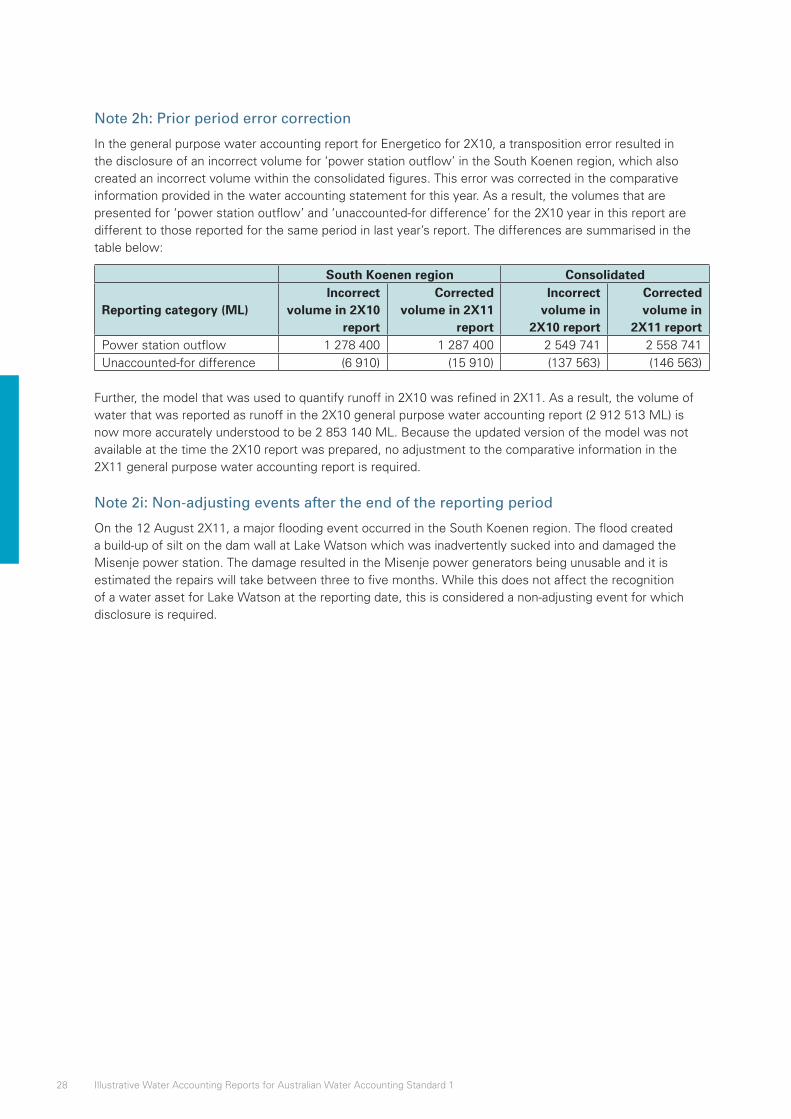
28 Illustrative Water Accounting Reports for Australian Water Accounting Standard 1
Note 2h: Prior period error correction
In the general purpose water accounting report for Energetico for 2X10, a transposition error resulted in the disclosure of an incorrect volume for ‘power station outflow’ in the South Koenen region, which also created an incorrect volume within the consolidated figures. This error was corrected in the comparative information provided in the water accounting statement for this year. As a result, the volumes that are presented for ‘power station outflow’ and ‘unaccounted-for difference’ for the 2X10 year in this report are different to those reported for the same period in last year’s report. The differences are summarised in the table below:
South Koenen region Consolidated
Reporting category (ML)Incorrect
volume in 2X10 report
Corrected volume in 2X11
report
Incorrect volume in
2X10 report
Corrected volume in
2X11 reportPower station outflow 1 278 400 1 287 400 2 549 741 2 558 741Unaccounted-for difference (6 910) (15 910) (137 563) (146 563)
Further, the model that was used to quantify runoff in 2X10 was refined in 2X11. As a result, the volume of water that was reported as runoff in the 2X10 general purpose water accounting report (2 912 513 ML) is now more accurately understood to be 2 853 140 ML. Because the updated version of the model was not available at the time the 2X10 report was prepared, no adjustment to the comparative information in the 2X11 general purpose water accounting report is required.
Note 2i: Non-adjusting events after the end of the reporting period
On the 12 August 2X11, a major flooding event occurred in the South Koenen region. The flood created a build-up of silt on the dam wall at Lake Watson which was inadvertently sucked into and damaged the Misenje power station. The damage resulted in the Misenje power generators being unusable and it is estimated the repairs will take between three to five months. While this does not affect the recognition of a water asset for Lake Watson at the reporting date, this is considered a non-adjusting event for which disclosure is required.
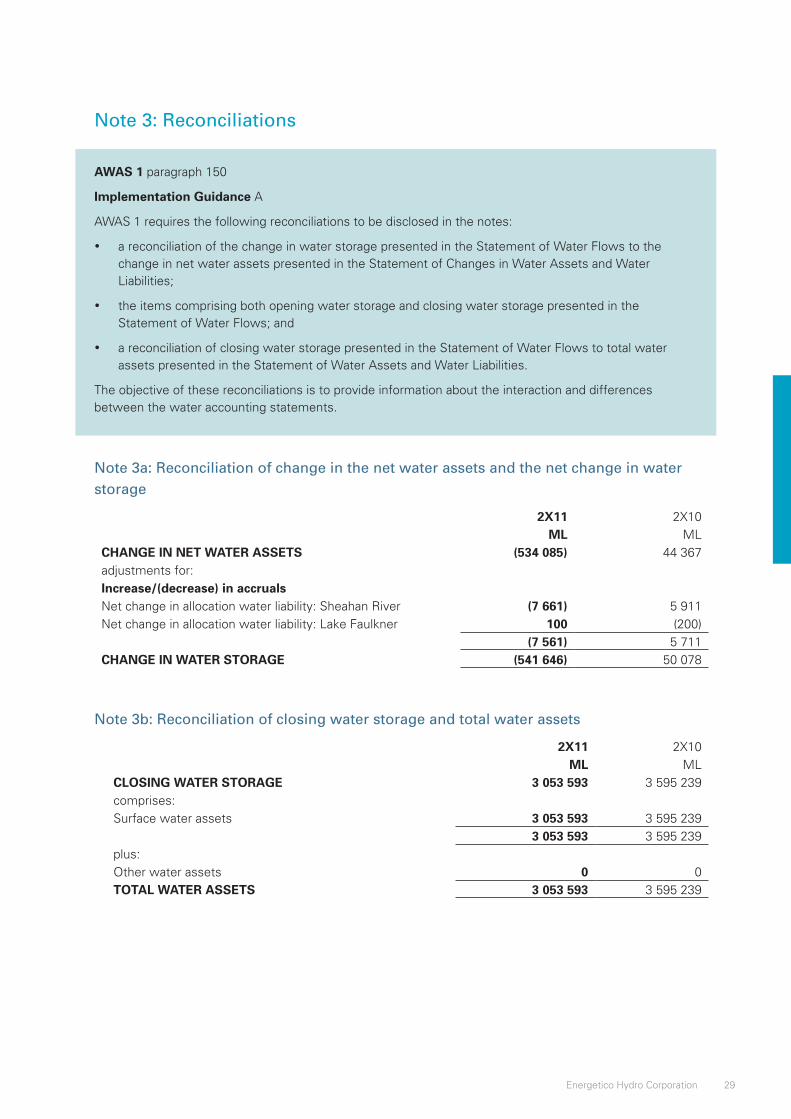
29Energetico Hydro Corporation
Note 3: Reconciliations
AWAS 1 paragraph 150
Implementation Guidance A
AWAS 1 requires the following reconciliations to be disclosed in the notes:
• a reconciliation of the change in water storage presented in the Statement of Water Flows to the change in net water assets presented in the Statement of Changes in Water Assets and Water Liabilities;
• the items comprising both opening water storage and closing water storage presented in the Statement of Water Flows; and
• a reconciliation of closing water storage presented in the Statement of Water Flows to total water assets presented in the Statement of Water Assets and Water Liabilities.
The objective of these reconciliations is to provide information about the interaction and differences between the water accounting statements.
Note 3a: Reconciliation of change in the net water assets and the net change in water storage
2X11 2X10ML ML
CHANGE IN NET WATER ASSETS (534 085) 44 367adjustments for:Increase/(decrease) in accrualsNet change in allocation water liability: Sheahan River (7 661) 5 911Net change in allocation water liability: Lake Faulkner 100 (200)
(7 561) 5 711CHANGE IN WATER STORAGE (541 646) 50 078
Note 3b: Reconciliation of closing water storage and total water assets
2X11 2X10ML ML
CLOSING WATER STORAGE 3 053 593 3 595 239comprises:Surface water assets 3 053 593 3 595 239
3 053 593 3 595 239plus:Other water assets 0 0 TOTAL WATER ASSETS 3 053 593 3 595 239
30 Illustrative Water Accounting Reports for Australian Water Accounting Standard 1
Note 4: Future prospects, contingent water assets and contingent water liabilities
AWAS 1 paragraphs 151–160
Implementation Guidance B, D and E
Basis for Conclusions paragraphs B147–B150
The future prospects note assists users of general purpose water accounting reports in understanding the extent to which water assets at the reporting date will be available to settle water liabilities and future water commitments within the next 12 months of the reporting date. The volumes presented in this note are a combination of the information found in the Statement of Water Assets and Water Liabilities and assumptions on future commitments and expected inflows.
Information about expected inflows into the water report entity is to be presented under various climatic conditions.
Contingent water assets and contingent water liabilities are not included in the Water Accounting Statements but are disclosed in the notes.
In order to qualify as a contingent water asset or a contingent water liability, the following criteria must be met:
• Contingent water asset – possible water asset that arises from past events and whose existence will be confirmed only by the occurrence or non-occurrence of one or more uncertain future events not wholly within the control of the management of the water report entity.
• Contingent water liability – possible obligation that arises from past events and whose existence will be confirmed only by the occurrence or non-occurrence of one or more uncertain future events not wholly within the control of the management of the water report entity.
A brief description of each contingent water asset and contingent water liability is provided in the notes.
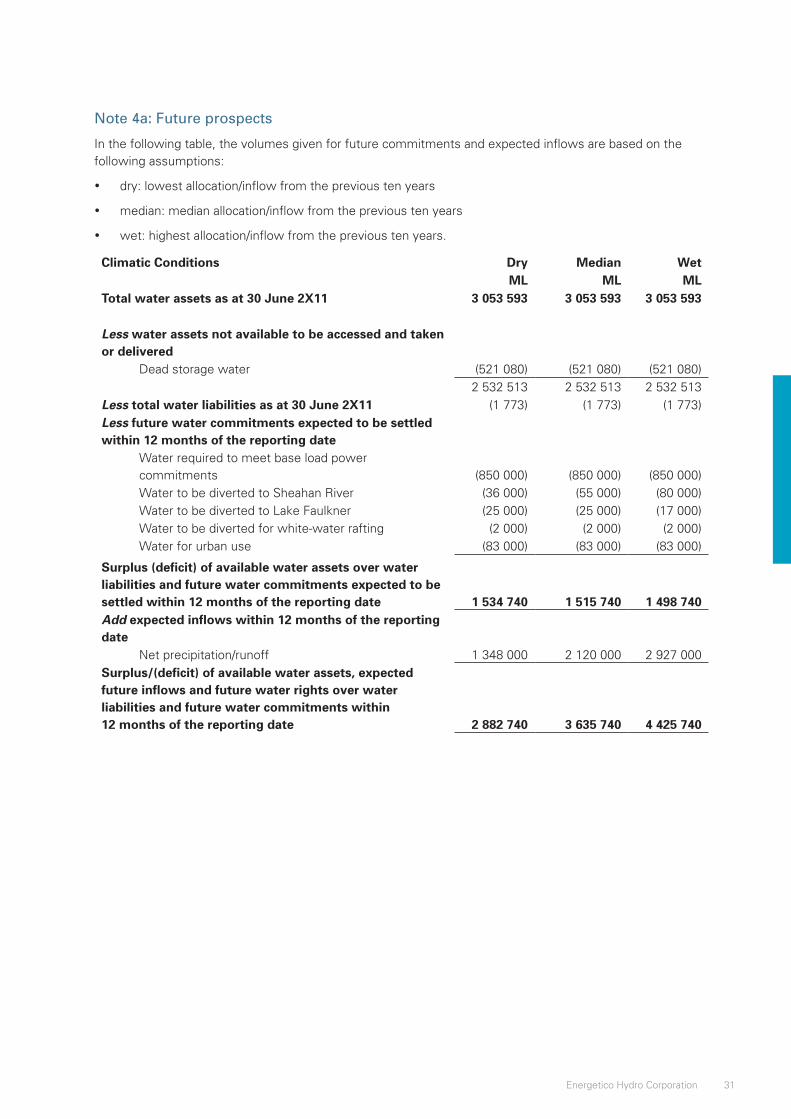
31Energetico Hydro Corporation
Note 4a: Future prospects
In the following table, the volumes given for future commitments and expected inflows are based on the following assumptions:
• dry: lowest allocation/inflow from the previous ten years
• median: median allocation/inflow from the previous ten years
• wet: highest allocation/inflow from the previous ten years.
Climatic Conditions Dry Median WetML ML ML
Total water assets as at 30 June 2X11 3 053 593 3 053 593 3 053 593
Less water assets not available to be accessed and taken or delivered
Dead storage water (521 080) (521 080) (521 080)2 532 513 2 532 513 2 532 513
Less total water liabilities as at 30 June 2X11 (1 773) (1 773) (1 773)Less future water commitments expected to be settled within 12 months of the reporting date
Water required to meet base load power commitments (850 000) (850 000) (850 000)Water to be diverted to Sheahan River (36 000) (55 000) (80 000)Water to be diverted to Lake Faulkner (25 000) (25 000) (17 000)Water to be diverted for white-water rafting (2 000) (2 000) (2 000)Water for urban use (83 000) (83 000) (83 000)
Surplus (deficit) of available water assets over water liabilities and future water commitments expected to be settled within 12 months of the reporting date 1 534 740 1 515 740 1 498 740Add expected inflows within 12 months of the reporting date
Net precipitation/runoff 1 348 000 2 120 000 2 927 000 Surplus/(deficit) of available water assets, expected future inflows and future water rights over water liabilities and future water commitments within 12 months of the reporting date 2 882 740 3 635 740 4 425 740
32 Illustrative Water Accounting Reports for Australian Water Accounting Standard 1
Note 4b: Contingent water assets and contingent water liabilities
Contingent water assets
Energetico had no contingent water assets at the reporting date.
Contingent water liabilities (1 010 000 ML)
• Ongoing water commitment – base load: Energetico has a contractual arrangement with the NEM to supply a minimum amount of base load electricity to the NEG. The estimated amount of water required to met the base load commitment is calculated to be 850 000 ML. This commitment depends on sufficient water being available.
• Ongoing water commitment – Sheahan River: In accordance with the operational licence issued by the Department, Energetico is required to release an annual minimum flow of 9% of water captured into Lake Robinson from Lake Pimpampa into the Sheahan River. The diversion of water in future periods is dependent on sufficient water being available. The annual water operating plan for the 2X11–12 reporting year estimates that 50 000 ML will be required to be released.
• Ongoing water commitment – Lake Faulkner: In accordance with the operational licence issued by the Department, Energetico is required to deliver water to Lake Faulkner to maintain the wetlands for the local bird species and the local Indigenous community. The diversion of water in future periods is dependent on sufficient water being available. The estimated water release under the water operating plan for 2X11–12 is 25 000 ML.
• Ongoing water commitment – white-water rafting: Energetico has an agreement with the organisers of the annual white-water rafting festival to release sufficient flows for their events. The flows to be released are subject to future water availability. When the flows are released they are first used to generate electricity before reaching the white-water course. The volume released for these events is equivalent to 2000 ML of water.
• Water for urban use: A number of towns and communities use the water resources within Energetico’s lakes for urban use. If water is available, urban water use has priority over Energetico’s hydro-generation requirements. Energetico’s operational plan has estimated water for urban use of 83 000 ML for the 2X11–12 water reporting year.
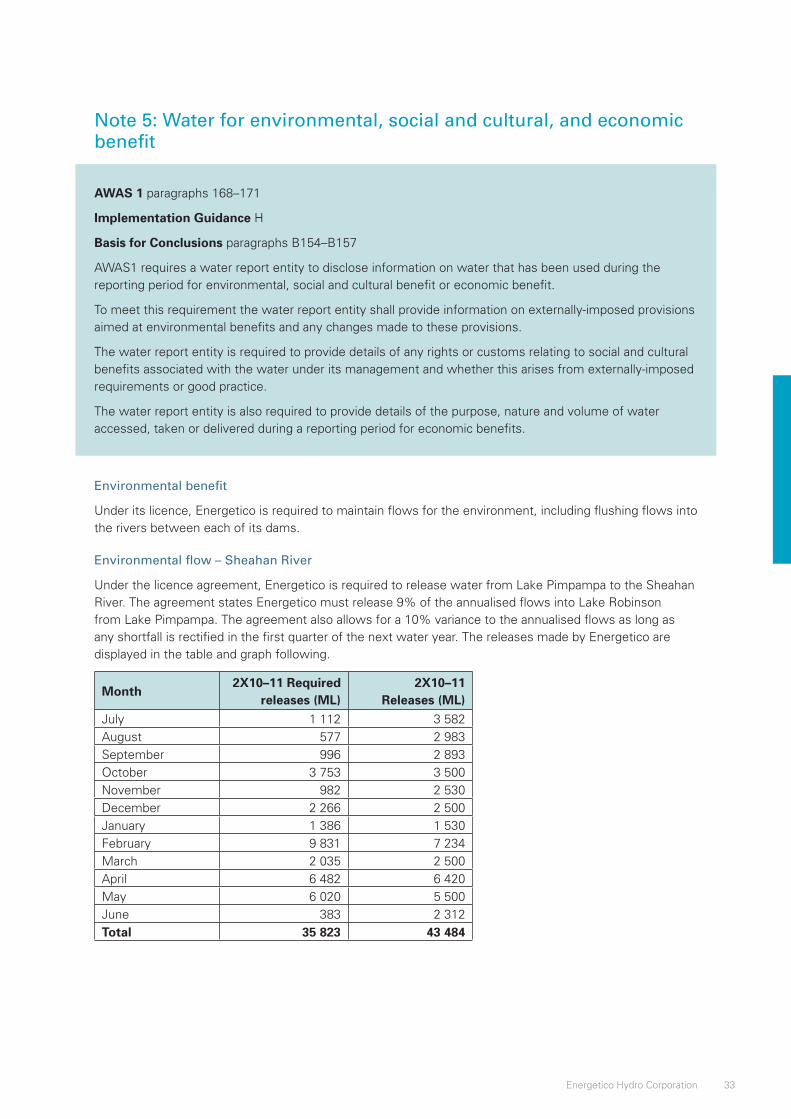
33Energetico Hydro Corporation
Note 5: Water for environmental, social and cultural, and economic benefit
AWAS 1 paragraphs 168–171
Implementation Guidance H
Basis for Conclusions paragraphs B154–B157
AWAS1 requires a water report entity to disclose information on water that has been used during the reporting period for environmental, social and cultural benefit or economic benefit.
To meet this requirement the water report entity shall provide information on externally-imposed provisions aimed at environmental benefits and any changes made to these provisions.
The water report entity is required to provide details of any rights or customs relating to social and cultural benefits associated with the water under its management and whether this arises from externally-imposed requirements or good practice.
The water report entity is also required to provide details of the purpose, nature and volume of water accessed, taken or delivered during a reporting period for economic benefits.
Environmental benefit
Under its licence, Energetico is required to maintain flows for the environment, including flushing flows into the rivers between each of its dams.
Environmental flow – Sheahan River
Under the licence agreement, Energetico is required to release water from Lake Pimpampa to the Sheahan River. The agreement states Energetico must release 9% of the annualised flows into Lake Robinson from Lake Pimpampa. The agreement also allows for a 10% variance to the annualised flows as long as any shortfall is rectified in the first quarter of the next water year. The releases made by Energetico are displayed in the table and graph following.
Month2X10–11 Required
releases (ML)2X10–11
Releases (ML)July 1 112 3 582August 577 2 983September 996 2 893October 3 753 3 500November 982 2 530December 2 266 2 500January 1 386 1 530February 9 831 7 234March 2 035 2 500April 6 482 6 420May 6 020 5 500June 383 2 312Total 35 823 43 484
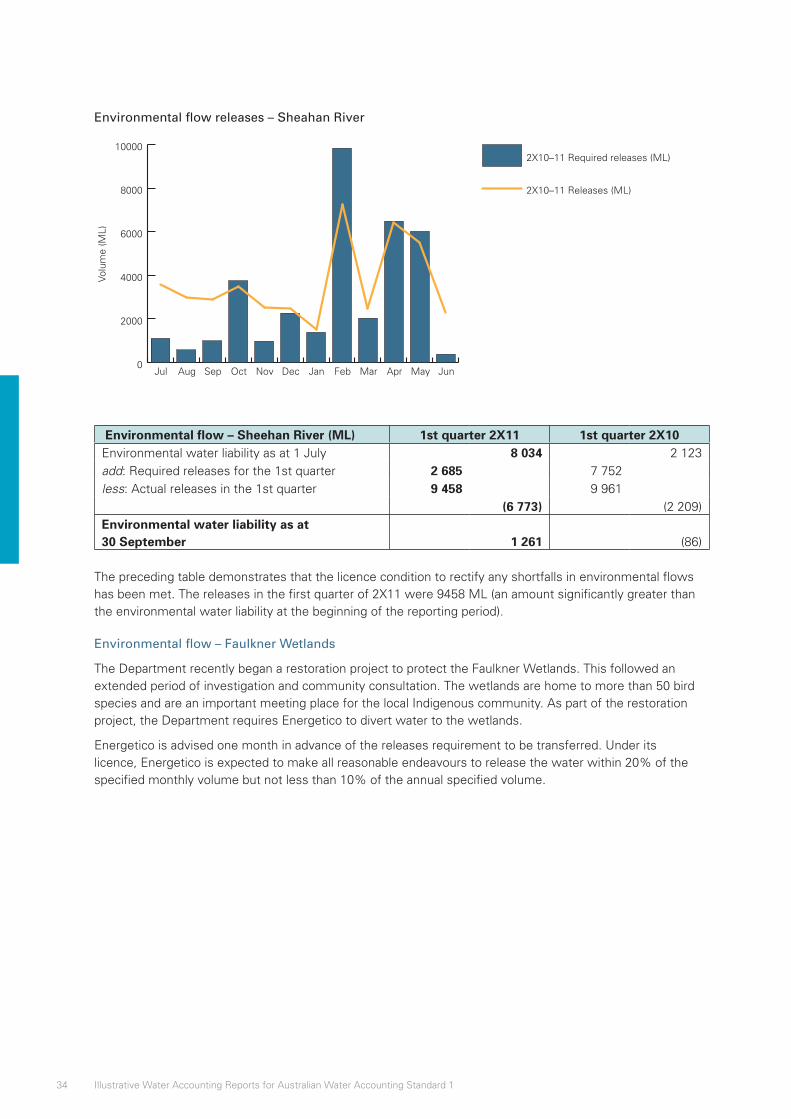
34 Illustrative Water Accounting Reports for Australian Water Accounting Standard 1
Environmental flow releases – Sheahan River
0
2000
4000
6000
8000
100002X10–11 Required releases (ML)
2X10–11 Releases (ML)
JunMayAprMarFebJanDecNovOctSepAugJul
Volu
me
(ML)
Environmental flow – Sheehan River (ML) 1st quarter 2X11 1st quarter 2X10Environmental water liability as at 1 July 8 034 2 123add: Required releases for the 1st quarter 2 685 7 752 less: Actual releases in the 1st quarter 9 458 9 961 (6 773) (2 209)Environmental water liability as at 30 September 1 261 (86)
The preceding table demonstrates that the licence condition to rectify any shortfalls in environmental flows has been met. The releases in the first quarter of 2X11 were 9458 ML (an amount significantly greater than the environmental water liability at the beginning of the reporting period).
Environmental flow – Faulkner Wetlands
The Department recently began a restoration project to protect the Faulkner Wetlands. This followed an extended period of investigation and community consultation. The wetlands are home to more than 50 bird species and are an important meeting place for the local Indigenous community. As part of the restoration project, the Department requires Energetico to divert water to the wetlands.
Energetico is advised one month in advance of the releases requirement to be transferred. Under its licence, Energetico is expected to make all reasonable endeavours to release the water within 20% of the specified monthly volume but not less than 10% of the annual specified volume.
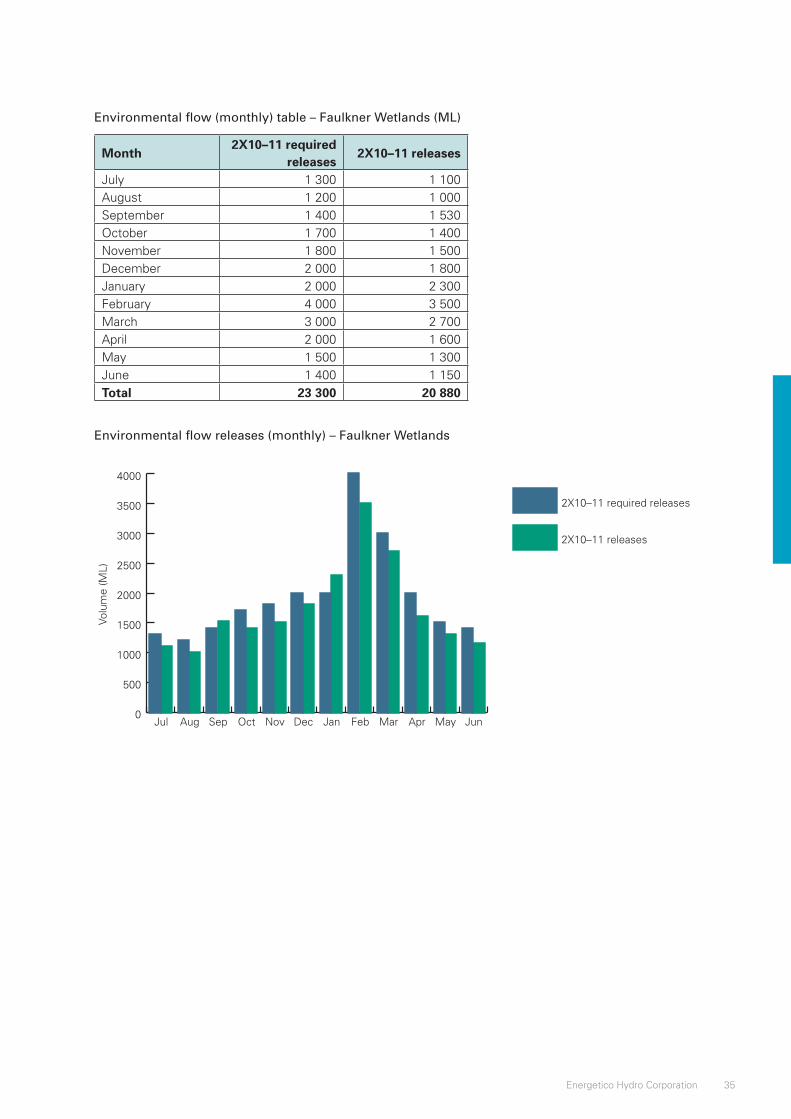
35Energetico Hydro Corporation
Environmental flow (monthly) table – Faulkner Wetlands (ML)
Month 2X10–11 required
releases2X10–11 releases
July 1 300 1 100August 1 200 1 000September 1 400 1 530October 1 700 1 400November 1 800 1 500December 2 000 1 800January 2 000 2 300February 4 000 3 500March 3 000 2 700April 2 000 1 600May 1 500 1 300June 1 400 1 150Total 23 300 20 880
Environmental flow releases (monthly) – Faulkner Wetlands
0
500
1000
1500
2000
2500
3000
3500
4000
2X10–11 releases
2X10–11 required releases
JunMayAprMarFebJanDecNovOctSepAugJul
Volu
me
(ML)
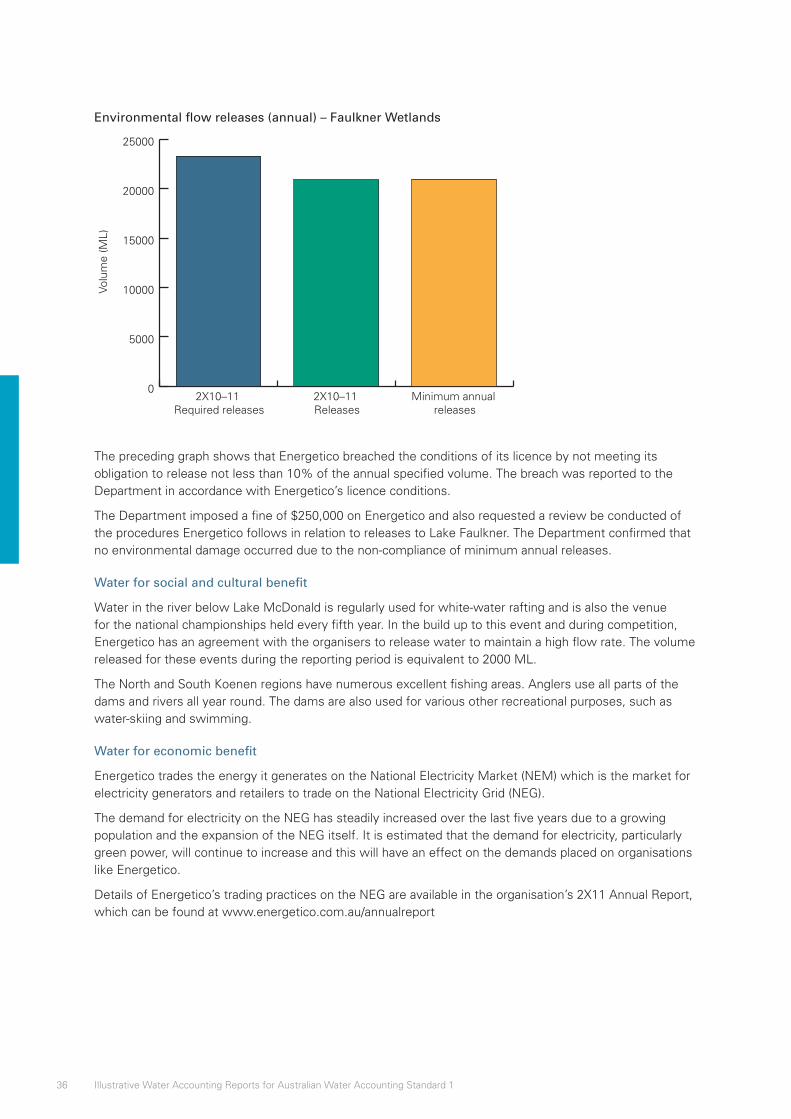
36 Illustrative Water Accounting Reports for Australian Water Accounting Standard 1
Environmental flow releases (annual) – Faulkner Wetlands
0
5000
10000
15000
20000
25000
Minimum annual releases
2X10–11 Releases
2X10–11 Required releases
Volu
me
(ML)
The preceding graph shows that Energetico breached the conditions of its licence by not meeting its obligation to release not less than 10% of the annual specified volume. The breach was reported to the Department in accordance with Energetico’s licence conditions.
The Department imposed a fine of $250,000 on Energetico and also requested a review be conducted of the procedures Energetico follows in relation to releases to Lake Faulkner. The Department confirmed that no environmental damage occurred due to the non-compliance of minimum annual releases.
Water for social and cultural benefit
Water in the river below Lake McDonald is regularly used for white-water rafting and is also the venue for the national championships held every fifth year. In the build up to this event and during competition, Energetico has an agreement with the organisers to release water to maintain a high flow rate. The volume released for these events during the reporting period is equivalent to 2000 ML.
The North and South Koenen regions have numerous excellent fishing areas. Anglers use all parts of the dams and rivers all year round. The dams are also used for various other recreational purposes, such as water-skiing and swimming.
Water for economic benefit
Energetico trades the energy it generates on the National Electricity Market (NEM) which is the market for electricity generators and retailers to trade on the National Electricity Grid (NEG).
The demand for electricity on the NEG has steadily increased over the last five years due to a growing population and the expansion of the NEG itself. It is estimated that the demand for electricity, particularly green power, will continue to increase and this will have an effect on the demands placed on organisations like Energetico.
Details of Energetico’s trading practices on the NEG are available in the organisation’s 2X11 Annual Report, which can be found at www.energetico.com.au/annualreport
37Energetico Hydro Corporation
Note 6: Segment information
AWAS 1 paragraphs 172–176
Basis for Conclusions paragraphs B158–B163
When information about discrete components of the water report entity would affect the decisions users make on the basis of the general purpose water accounting report, information that will allow the users to evaluate those discrete components shall be disclosed.
Segments are identified by considering the physical, operational or administrative aspects of the water report entity. The identification of segments shall be retained from one reporting period to the next unless a change provides information that is more useful to users of general purpose water accounting reports.
The two segments of Energetico are the North Koenen and South Koenen regions. Segment information is provided for the two regions as their river systems are not connected and are operated independently.
The operation of Energetico’s power generators in the North Koenen region is on the Delta River, which starts at an elevation of 1560 m and flows north through the Myranda National Park before flowing out to sea near the city of Bakana.
The operation of Energetico’s power generators in the South Koenen region is on the Cessna River, which starts at an elevation of 2000 m and flows southeast through the Rocky Ranges before flowing into Oyster Bay.
The entity with overall management responsibility of the water resource in the North and South Koenen regions is the Department. The Department permits Energetico to conduct hydro-power operations within the area subject to specific licence conditions.
Each region has a dedicated team who monitors the water resources and operations. The team within each region reports to Energetico’s Water, Environment and Sustainability Committee. The committee details can be found in the Contextual Statement under the heading ‘Corporate structure’.
The North and South Koenen regions have similar climatic conditions, which have been reported in the Contextual Statement under the heading ‘Overview of reporting period’.
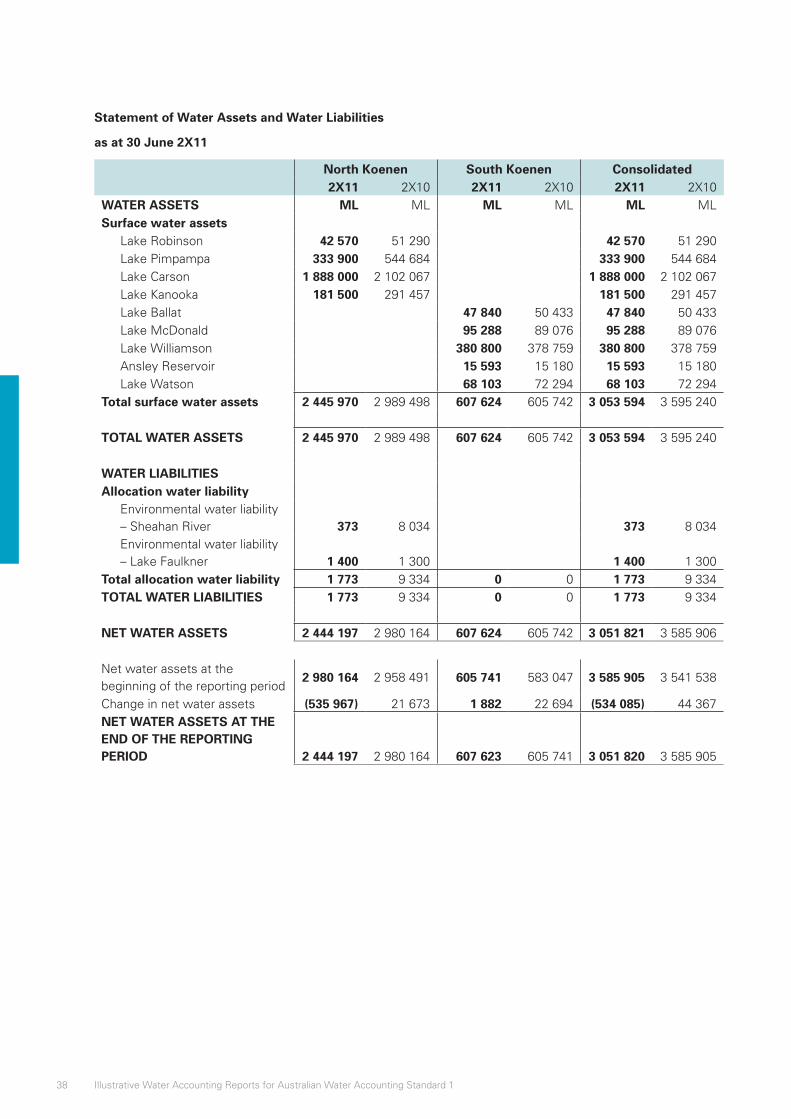
38 Illustrative Water Accounting Reports for Australian Water Accounting Standard 1
Statement of Water Assets and Water Liabilities
as at 30 June 2X11
North Koenen South Koenen Consolidated2X11 2X10 2X11 2X10 2X11 2X10
WATER ASSETS ML ML ML ML ML MLSurface water assets
Lake Robinson 42 570 51 290 42 570 51 290Lake Pimpampa 333 900 544 684 333 900 544 684Lake Carson 1 888 000 2 102 067 1 888 000 2 102 067Lake Kanooka 181 500 291 457 181 500 291 457Lake Ballat 47 840 50 433 47 840 50 433Lake McDonald 95 288 89 076 95 288 89 076Lake Williamson 380 800 378 759 380 800 378 759Ansley Reservoir 15 593 15 180 15 593 15 180Lake Watson 68 103 72 294 68 103 72 294
Total surface water assets 2 445 970 2 989 498 607 624 605 742 3 053 594 3 595 240
TOTAL WATER ASSETS 2 445 970 2 989 498 607 624 605 742 3 053 594 3 595 240
WATER LIABILITIESAllocation water liability
Environmental water liability – Sheahan River 373 8 034 373 8 034Environmental water liability – Lake Faulkner 1 400 1 300 1 400 1 300
Total allocation water liability 1 773 9 334 0 0 1 773 9 334TOTAL WATER LIABILITIES 1 773 9 334 0 0 1 773 9 334
NET WATER ASSETS 2 444 197 2 980 164 607 624 605 742 3 051 821 3 585 906
Net water assets at the beginning of the reporting period
2 980 164 2 958 491 605 741 583 047 3 585 905 3 541 538
Change in net water assets (535 967) 21 673 1 882 22 694 (534 085) 44 367NET WATER ASSETS AT THE END OF THE REPORTING PERIOD 2 444 197 2 980 164 607 623 605 741 3 051 820 3 585 905
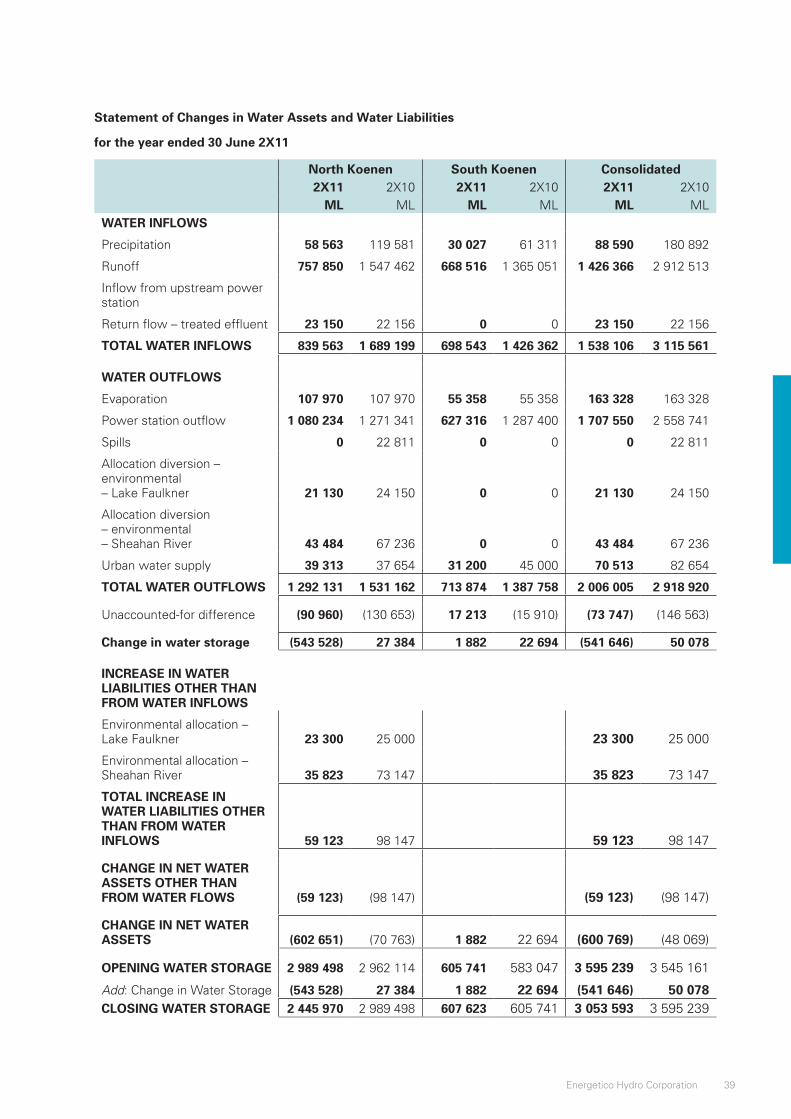
39Energetico Hydro Corporation
Statement of Changes in Water Assets and Water Liabilities
for the year ended 30 June 2X11
North Koenen South Koenen Consolidated2X11 2X10 2X11 2X10 2X11 2X10
ML ML ML ML ML MLWATER INFLOWS
Precipitation 58 563 119 581 30 027 61 311 88 590 180 892
Runoff 757 850 1 547 462 668 516 1 365 051 1 426 366 2 912 513
Inflow from upstream power station
Return flow – treated effluent 23 150 22 156 0 0 23 150 22 156
TOTAL WATER INFLOWS 839 563 1 689 199 698 543 1 426 362 1 538 106 3 115 561
WATER OUTFLOWS
Evaporation 107 970 107 970 55 358 55 358 163 328 163 328
Power station outflow 1 080 234 1 271 341 627 316 1 287 400 1 707 550 2 558 741
Spills 0 22 811 0 0 0 22 811
Allocation diversion – environmental – Lake Faulkner 21 130 24 150 0 0 21 130 24 150
Allocation diversion – environmental – Sheahan River 43 484 67 236 0 0 43 484 67 236
Urban water supply 39 313 37 654 31 200 45 000 70 513 82 654
TOTAL WATER OUTFLOWS 1 292 131 1 531 162 713 874 1 387 758 2 006 005 2 918 920
Unaccounted-for difference (90 960) (130 653) 17 213 (15 910) (73 747) (146 563)
Change in water storage (543 528) 27 384 1 882 22 694 (541 646) 50 078
INCREASE IN WATER LIABILITIES OTHER THAN FROM WATER INFLOWS
Environmental allocation – Lake Faulkner 23 300 25 000 23 300 25 000
Environmental allocation – Sheahan River 35 823 73 147 35 823 73 147
TOTAL INCREASE IN WATER LIABILITIES OTHER THAN FROM WATER INFLOWS 59 123 98 147 59 123 98 147
CHANGE IN NET WATER ASSETS OTHER THAN FROM WATER FLOWS (59 123) (98 147) (59 123) (98 147)
CHANGE IN NET WATER ASSETS (602 651) (70 763) 1 882 22 694 (600 769) (48 069)
OPENING WATER STORAGE 2 989 498 2 962 114 605 741 583 047 3 595 239 3 545 161
Add: Change in Water Storage (543 528) 27 384 1 882 22 694 (541 646) 50 078CLOSING WATER STORAGE 2 445 970 2 989 498 607 623 605 741 3 053 593 3 595 239
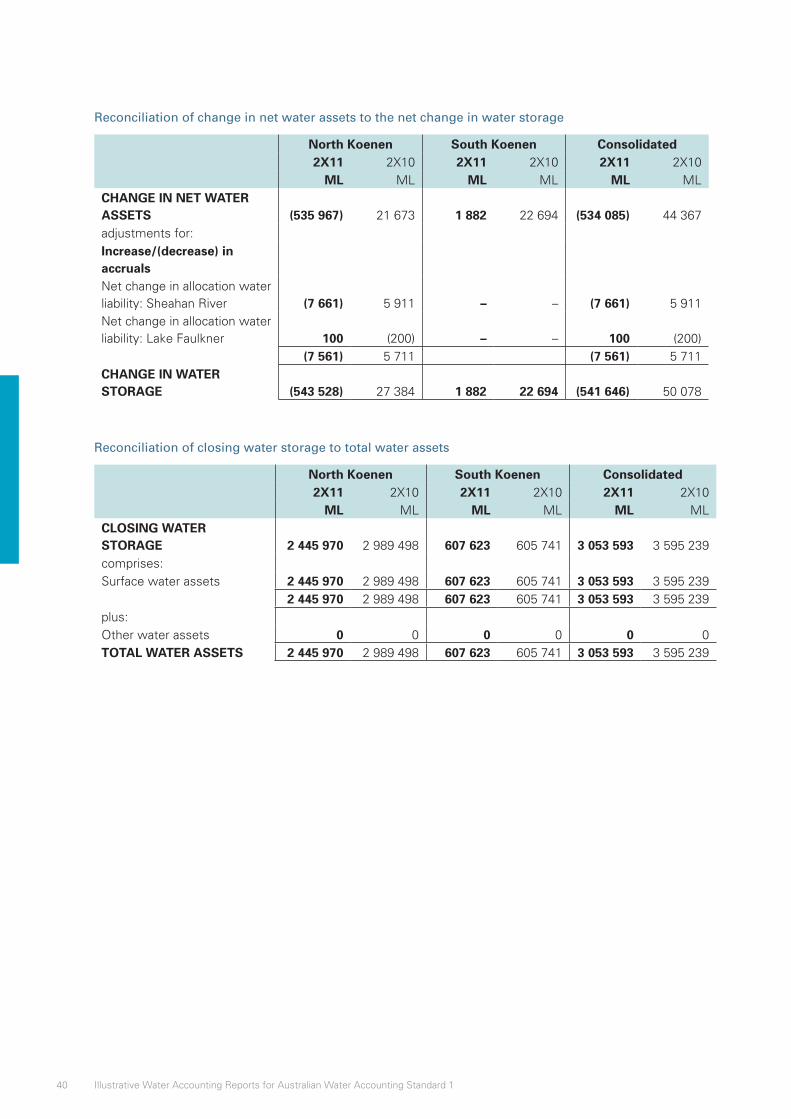
40 Illustrative Water Accounting Reports for Australian Water Accounting Standard 1
Reconciliation of change in net water assets to the net change in water storage
North Koenen South Koenen Consolidated2X11 2X10 2X11 2X10 2X11 2X10
ML ML ML ML ML MLCHANGE IN NET WATER ASSETS (535 967) 21 673 1 882 22 694 (534 085) 44 367adjustments for:Increase/(decrease) in accrualsNet change in allocation water liability: Sheahan River (7 661) 5 911 – – (7 661) 5 911Net change in allocation water liability: Lake Faulkner 100 (200) – – 100 (200)
(7 561) 5 711 (7 561) 5 711CHANGE IN WATER STORAGE (543 528) 27 384 1 882 22 694 (541 646) 50 078
Reconciliation of closing water storage to total water assets
North Koenen South Koenen Consolidated2X11 2X10 2X11 2X10 2X11 2X10
ML ML ML ML ML MLCLOSING WATER STORAGE 2 445 970 2 989 498 607 623 605 741 3 053 593 3 595 239comprises:Surface water assets 2 445 970 2 989 498 607 623 605 741 3 053 593 3 595 239
2 445 970 2 989 498 607 623 605 741 3 053 593 3 595 239plus:Other water assets 0 0 0 0 0 0TOTAL WATER ASSETS 2 445 970 2 989 498 607 623 605 741 3 053 593 3 595 239
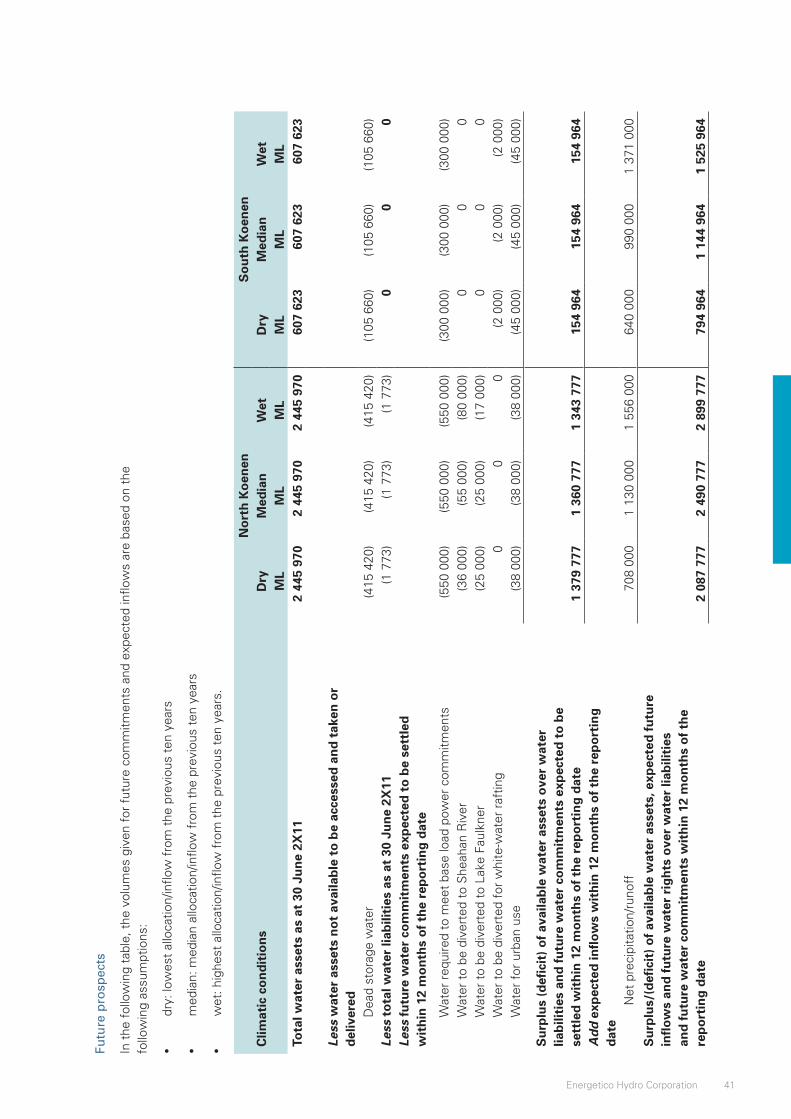
41Energetico Hydro Corporation
Futu
re p
rosp
ects
In t
he f
ollo
win
g ta
ble,
the
vol
umes
giv
en f
or f
utur
e co
mm
itmen
ts a
nd e
xpec
ted
inflo
ws
are
base
d on
the
fo
llow
ing
assu
mpt
ions
:
•dr
y: lo
wes
t al
loca
tion/
inflo
w f
rom
the
pre
viou
s te
n ye
ars
•m
edia
n: m
edia
n al
loca
tion/
inflo
w f
rom
the
pre
viou
s te
n ye
ars
•w
et: h
ighe
st a
lloca
tion/
inflo
w f
rom
the
pre
viou
s te
n ye
ars.
No
rth
Ko
enen
So
uth
Ko
enen
Clim
atic
co
nd
itio
ns
Dry
Med
ian
Wet
Dry
Med
ian
Wet
ML
ML
ML
ML
ML
ML
Tota
l wat
er a
sset
s as
at
30 J
un
e 2X
11 2
445
970
2 4
45 9
70 2
445
970
607
623
607
623
607
623
Less
wat
er a
sset
s n
ot
avai
lab
le t
o b
e ac
cess
ed a
nd
tak
en o
r d
eliv
ered
Dea
d st
orag
e w
ater
(415
420
)(4
15 4
20)
(415
420
)(1
05 6
60)
(105
660
)(1
05 6
60)
Less
to
tal w
ater
liab
iliti
es a
s at
30
Jun
e 2X
11(1
773
)(1
773
)(1
773
)0
00
Less
fu
ture
wat
er c
om
mit
men
ts e
xpec
ted
to
be
sett
led
w
ith
in 1
2 m
on
ths
of
the
rep
ort
ing
dat
e
Wat
er r
equi
red
to m
eet
base
load
pow
er c
omm
itmen
ts(5
50 0
00)
(550
000
)(5
50 0
00)
(300
000
)(3
00 0
00)
(300
000
)W
ater
to
be d
iver
ted
to S
heah
an R
iver
(36
000)
(55
000)
(80
000)
00
0W
ater
to
be d
iver
ted
to L
ake
Faul
kner
(25
000)
(25
000)
(17
000)
00
0W
ater
to
be d
iver
ted
for
whi
te-w
ater
raf
ting
00
0(2
000
)(2
000
)(2
000
)W
ater
for
urb
an u
se(3
8 00
0)(3
8 00
0)(3
8 00
0)(4
5 00
0)(4
5 00
0)(4
5 00
0)
Su
rplu
s (d
efici
t) o
f av
aila
ble
wat
er a
sset
s o
ver
wat
er
liab
iliti
es a
nd
fu
ture
wat
er c
om
mit
men
ts e
xpec
ted
to
be
sett
led
wit
hin
12
mo
nth
s o
f th
e re
po
rtin
g d
ate
1 3
79 7
77 1
360
777
1 3
43 7
7715
4 96
415
4 96
415
4 96
4A
dd
exp
ecte
d in
flo
ws
wit
hin
12
mo
nth
s o
f th
e re
po
rtin
g
dat
eN
et p
reci
pita
tion/
runo
ff70
8 00
0 1
130
000
1 5
56 0
0064
0 00
099
0 00
0 1
371
000
Su
rplu
s/(d
efici
t) o
f av
aila
ble
wat
er a
sset
s, e
xpec
ted
fu
ture
in
flo
ws
and
fu
ture
wat
er r
igh
ts o
ver
wat
er li
abili
ties
an
d f
utu
re w
ater
co
mm
itm
ents
wit
hin
12
mo
nth
s o
f th
e re
po
rtin
g d
ate
2 0
87 7
77 2
490
777
2 8
99 7
7779
4 96
4 1
144
964
1 5
25 9
64
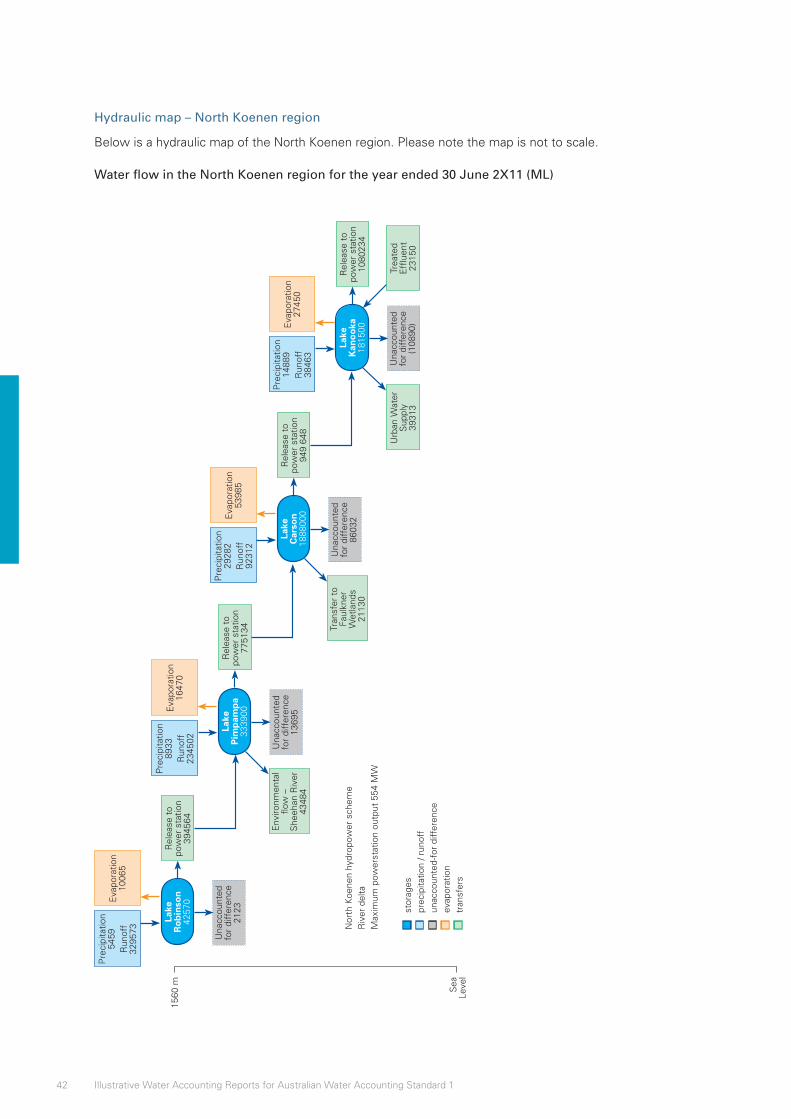
42 Illustrative Water Accounting Reports for Australian Water Accounting Standard 1
Hydraulic map – North Koenen region
Below is a hydraulic map of the North Koenen region. Please note the map is not to scale.
Water flow in the North Koenen region for the year ended 30 June 2X11 (ML)La
ke
Ro
bin
son
4257
0
Pre
cipi
tatio
n54
59R
unof
f32
9573
Rel
ease
to
pow
er s
tatio
n39
4564
Una
ccou
nted
fo
r di
ffer
ence
2123
Eva
pora
tion
1006
5
Lake
K
ano
oka
1815
00
Pre
cipi
tatio
n14
889
Run
off
3846
3
Rel
ease
to
pow
er s
tatio
n10
8023
4
Una
ccou
nted
fo
r di
ffer
ence
(108
90)Eva
pora
tion
2745
0
Lake
P
imp
amp
a33
3900
Pre
cipi
tatio
n89
33R
unof
f23
4502
Nor
th K
oene
n hy
drop
ower
sch
eme
Riv
er d
elta
Max
imum
pow
erst
atio
n ou
tput
554
MW
stor
ages
prec
ipita
tion
/ run
off
unac
coun
ted-
for
diff
eren
ce
evap
orat
ion
tran
sfer
s
Rel
ease
to
pow
er s
tatio
n77
5134
Una
ccou
nted
fo
r di
ffer
ence
1369
5Eva
pora
tion
1647
0
Lake
C
arso
n18
8800
0
Pre
cipi
tatio
n29
282
Run
off
9231
2
Rel
ease
to
pow
er s
tatio
n94
9 64
8
Tran
sfer
to
Faul
kner
W
etla
nds
2113
0
Urb
an W
ater
S
uppl
y39
313
Env
ironm
enta
l flo
w –
S
heeh
an R
iver
4348
4
1560
m Sea
Leve
l
Una
ccou
nted
fo
r di
ffer
ence
8603
2Eva
pora
tion
5398
5
Trea
ted
E
fflue
nt23
150
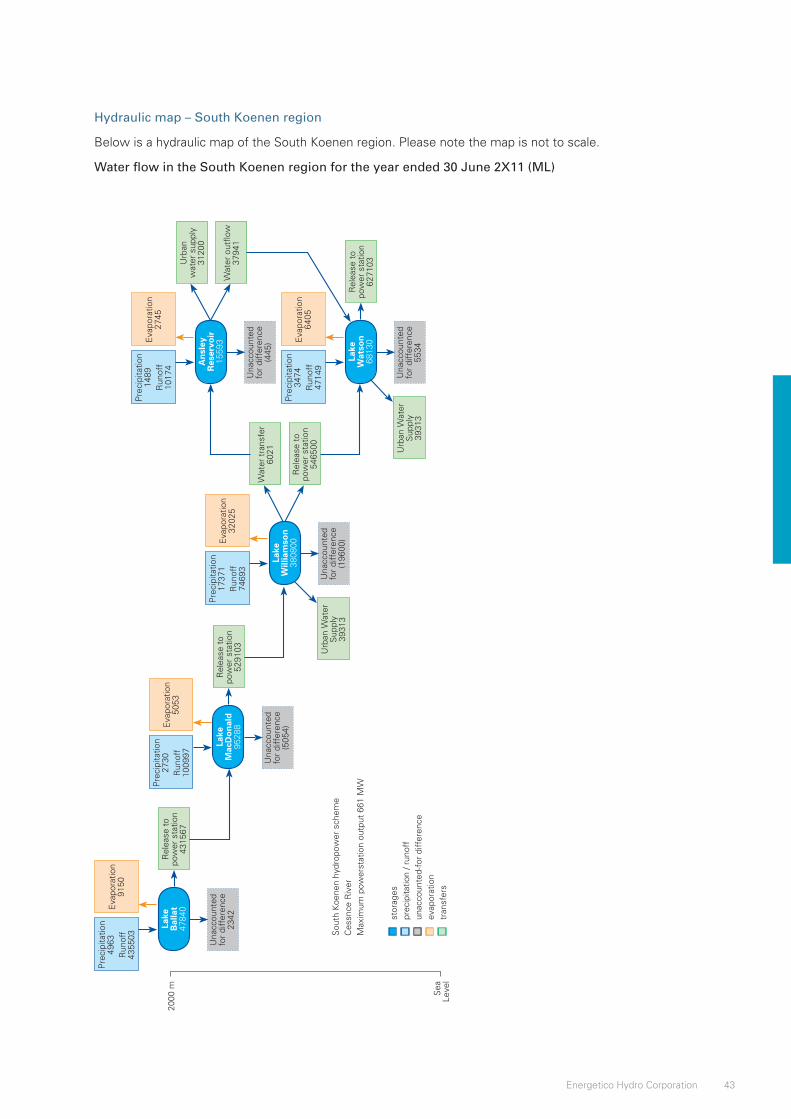
43Energetico Hydro Corporation
Hydraulic map – South Koenen region
Below is a hydraulic map of the South Koenen region. Please note the map is not to scale.
Water flow in the South Koenen region for the year ended 30 June 2X11 (ML)La
ke
Bal
lat
4784
0
Pre
cipi
tatio
n49
63R
unof
f43
5503
Rel
ease
to
pow
er s
tatio
n43
1567
Una
ccou
nted
fo
r di
ffer
ence
2342
Eva
pora
tion
9150
Lake
W
atso
n68
130
An
sley
R
eser
voir
1559
3
Pre
cipi
tatio
n34
74R
unof
f47
149
Pre
cipi
tatio
n14
89R
unof
f10
174
Rel
ease
to
pow
er s
tatio
n62
7103
Una
ccou
nted
fo
r di
ffer
ence
5534
Una
ccou
nted
fo
r di
ffer
ence
(445
) Eva
pora
tion
6405
Eva
pora
tion
2745
Lake
M
acD
on
ald
9528
8
Pre
cipi
tatio
n27
30R
unof
f10
0997
Sou
th K
oene
n hy
drop
ower
sch
eme
Ces
snce
Riv
erM
axim
um p
ower
stat
ion
outp
ut 6
61 M
W
Rel
ease
to
pow
er s
tatio
n52
9103
Una
ccou
nted
fo
r di
ffer
ence
(505
4)
Eva
pora
tion
5053
Lake
W
illia
mso
n38
0800
Pre
cipi
tatio
n17
371
Run
off
7469
3
Rel
ease
to
pow
er s
tatio
n54
6500
Wat
er o
utflo
w37
941
Wat
er t
rans
fer
6021
Urb
an
wat
er s
uppl
y31
200
Urb
an W
ater
S
uppl
y39
313
2000
m Sea
Leve
l
Una
ccou
nted
fo
r di
ffer
ence
(196
00)Eva
pora
tion
3202
5
Urb
an W
ater
S
uppl
y39
313
stor
ages
prec
ipita
tion
/ run
off
unac
coun
ted-
for
diff
eren
ce
evap
orat
ion
tran
sfer
s

44 Illustrative Water Accounting Reports for Australian Water Accounting Standard 1

Illustrative Water Accounting Report
Terra Firma Water Supply System
General Purpose Water Accounting Report
31 December 2X11
Prepared by Terra Firma Corporation
An illustration of an Australian general purpose water accounting report for a fictitious water report entity

1Terra Firma Water Supply System
Contents
Page
Glossary ........................................................................................................................................................2Contextual Statement .................................................................................................................................3
Physical information ................................................................................................................................4Administrative information ......................................................................................................................7Overview of reporting period ..................................................................................................................8
Accountability Statement .........................................................................................................................11Assurance of water accounting report ....................................................................................................12Water Accounting Statements .................................................................................................................13
Statement of Water Assets and Water Liabilities .................................................................................13Statement of Changes in Water Assets and Water Liabilities ..............................................................15Statement of Water Flows ....................................................................................................................17
Notes ..........................................................................................................................................................20Note 1: Significant water accounting policies .......................................................................................21Note 2: Information supporting the items presented in the water accounting statements ..................22Note 3: Quantification approaches ........................................................................................................28Note 4: Reconciliations .........................................................................................................................30Note 5: Future prospects, contingent water assets and contingent water liabilities ............................31Note 6: Water rights, water allocations and water restrictions .............................................................34Note 7: Water market activity ...............................................................................................................38Note 8: Water for environmental, social and cultural, and economic benefit .......................................39Note 9: Segment information................................................................................................................43
2 Illustrative Water Accounting Reports for Australian Water Accounting Standard 1
GlossaryThe terms listed below are not defined in AWAS 1 but are used in this general purpose water accounting report. They are not inconsistent with AWAS 1.
• Allocation – short version of ‘water allocation’. The specific volume of water allocated to water access entitlements in a given season or given accounting period, defined according to rules established in the relevant water plan.1
• Allocation announcement – obligating event that creates the legal right to access a water allocation.
• Desalination – process of removing excess salt and other minerals from water in order to produce potable water.
• Entitlement – short version of ‘water access entitlement’: perpetual or ongoing entitlement to exclusive access to a share of water from a specified consumptive pool as defined in the relevant water plan.2
• Environmental/social/cultural benefit – part of ‘environmental and other public benefit outcomes’. Environmental and other public benefit outcomes are defined as part of the water planning process, are specified in water plans and may include a number of aspects, including:
– environmental outcomes: maintaining ecosystem function (e.g. through periodic inundation of floodplain wetlands);
– biodiversity;
– water quality;
– river health targets; and
– other public benefits – mitigating pollution, public health (e.g. limiting noxious algal blooms), Indigenous and cultural values, recreation, fisheries, tourism, navigation and amenity values.3
• High/general/low security entitlement – frequency with which water allocated under a water access entitlement is able to be supplied in full.4
• Potable water – water that is suitable for drinking.
• Recycled water – water derived from wastewater, which is treated to a standard that is appropriate for its intended use.
• Urban – total residential, commercial, municipal and industrial area within a city or town.
• Wastewater – water that, because of its quality, is of no further immediate value for the purpose for which it is intended or in pursuit of which it was produced.
• Water supply system – system that is hydrologically connected and described at the level desired for management purposes (e.g. sub-catchment, catchment, basin or drainage division and/or groundwater management unit, sub-aquifer, aquifer, groundwater basin).
1 National Water Initiative2 ibid.3 ibid.4 ibid.
3Terra Firma Water Supply System
Contextual Statement
AWAS 1 paragraphs 56–61
Basis for Conclusions paragraphs B42–B44
Water Accounting Conceptual Framework SWAC 1
The Contextual Statement provides users of general purpose water accounting reports with information that helps them understand the physical and administrative aspects of the water report entity. This includes information about the water assets and water liabilities, geographical and climatic conditions of the area as well as the management structure of the water report entity.
The description of the water report entity provides the users with contextual information on the physical boundaries of the water report entity. It details the features that are included and the features that are excluded from the water report entity.
To comply with the requirements in AWAS 1, the following information should be included:
• a description of the water report entity;
• administrative information of the water report entity including details of any management structures and any agreements the water report entity is party to that impact on the management and operation of the water assets and water liabilities of the water report entity;
• a description of the water resources of the water report entity;
• an overview of the reporting period which includes information on the climatic conditions, before and during the reporting period, that impact on the water report entity; and
• information on any externally-imposed requirements the water report entity or its management are required to comply with, such as those contained in water resource management instruments.
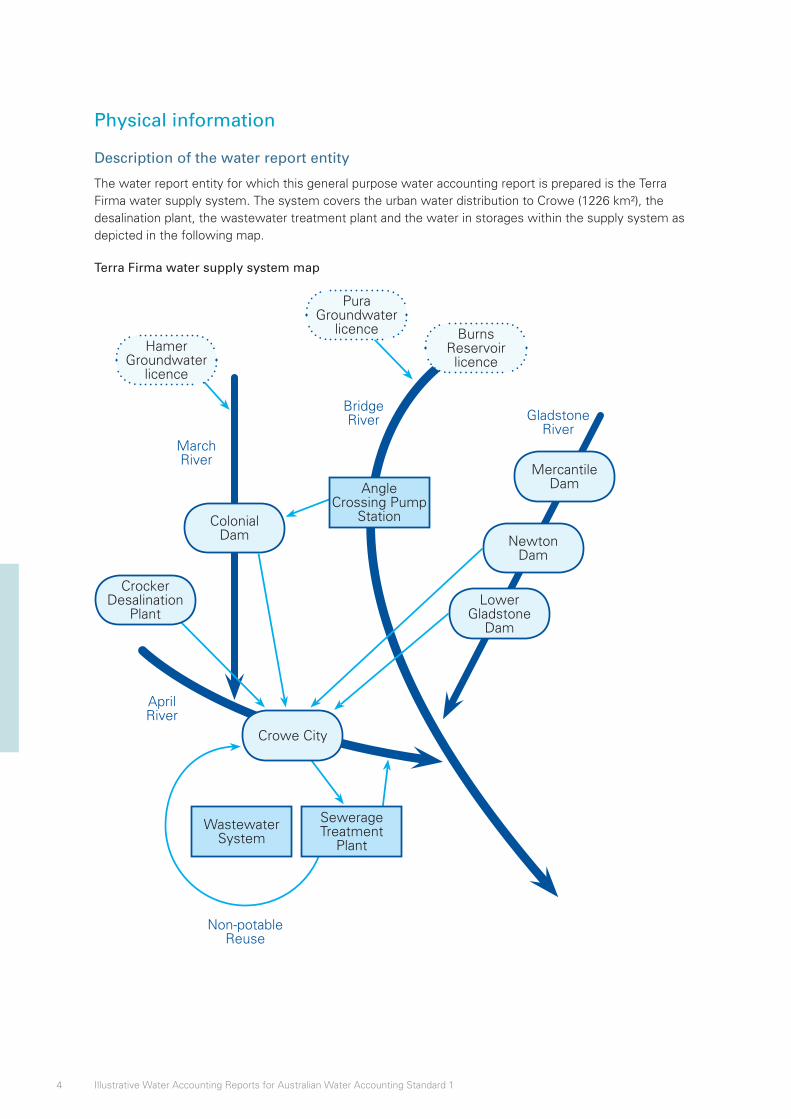
4 Illustrative Water Accounting Reports for Australian Water Accounting Standard 1
Physical information
Description of the water report entity
The water report entity for which this general purpose water accounting report is prepared is the Terra Firma water supply system. The system covers the urban water distribution to Crowe (1226 km²), the desalination plant, the wastewater treatment plant and the water in storages within the supply system as depicted in the following map.
Terra Firma water supply system map
MercantileDam
Gladstone River
Bridge River
March River
April River
Non-potable Reuse
Crowe City
NewtonDam
ColonialDam
Hamer Groundwater
licence
Pura Groundwater
licence
Lower Gladstone
Dam
Angle Crossing Pump
Station
Wastewater System
Crocker Desalination
Plant
Burns Reservoir licence
Sewerage Treatment
Plant
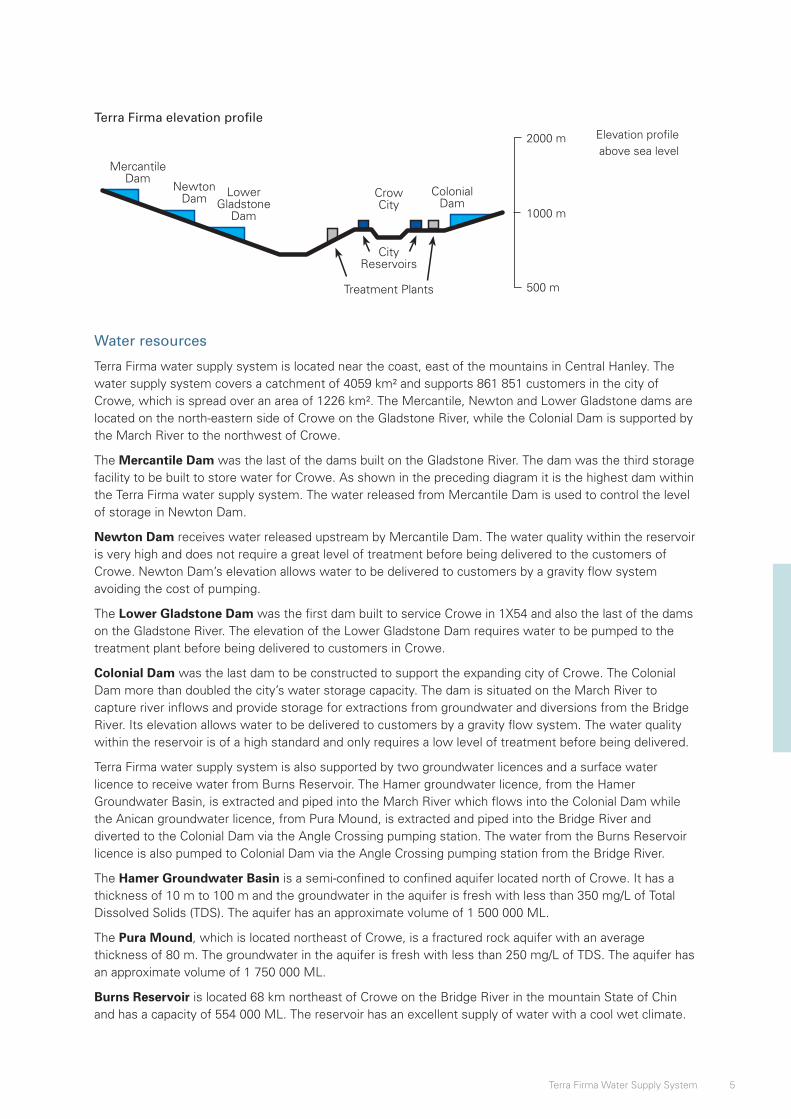
5Terra Firma Water Supply System
Terra Firma elevation profile
MercantileDam
NewtonDam Lower
GladstoneDam
ColonialDam
City Reservoirs
Crow City
Treatment Plants
2000 m
1000 m
500 m
Elevation profile above sea level
Water resources
Terra Firma water supply system is located near the coast, east of the mountains in Central Hanley. The water supply system covers a catchment of 4059 km² and supports 861 851 customers in the city of Crowe, which is spread over an area of 1226 km². The Mercantile, Newton and Lower Gladstone dams are located on the north-eastern side of Crowe on the Gladstone River, while the Colonial Dam is supported by the March River to the northwest of Crowe.
The Mercantile Dam was the last of the dams built on the Gladstone River. The dam was the third storage facility to be built to store water for Crowe. As shown in the preceding diagram it is the highest dam within the Terra Firma water supply system. The water released from Mercantile Dam is used to control the level of storage in Newton Dam.
Newton Dam receives water released upstream by Mercantile Dam. The water quality within the reservoir is very high and does not require a great level of treatment before being delivered to the customers of Crowe. Newton Dam’s elevation allows water to be delivered to customers by a gravity flow system avoiding the cost of pumping.
The Lower Gladstone Dam was the first dam built to service Crowe in 1X54 and also the last of the dams on the Gladstone River. The elevation of the Lower Gladstone Dam requires water to be pumped to the treatment plant before being delivered to customers in Crowe.
Colonial Dam was the last dam to be constructed to support the expanding city of Crowe. The Colonial Dam more than doubled the city’s water storage capacity. The dam is situated on the March River to capture river inflows and provide storage for extractions from groundwater and diversions from the Bridge River. Its elevation allows water to be delivered to customers by a gravity flow system. The water quality within the reservoir is of a high standard and only requires a low level of treatment before being delivered.
Terra Firma water supply system is also supported by two groundwater licences and a surface water licence to receive water from Burns Reservoir. The Hamer groundwater licence, from the Hamer Groundwater Basin, is extracted and piped into the March River which flows into the Colonial Dam while the Anican groundwater licence, from Pura Mound, is extracted and piped into the Bridge River and diverted to the Colonial Dam via the Angle Crossing pumping station. The water from the Burns Reservoir licence is also pumped to Colonial Dam via the Angle Crossing pumping station from the Bridge River.
The Hamer Groundwater Basin is a semi-confined to confined aquifer located north of Crowe. It has a thickness of 10 m to 100 m and the groundwater in the aquifer is fresh with less than 350 mg/L of Total Dissolved Solids (TDS). The aquifer has an approximate volume of 1 500 000 ML.
The Pura Mound, which is located northeast of Crowe, is a fractured rock aquifer with an average thickness of 80 m. The groundwater in the aquifer is fresh with less than 250 mg/L of TDS. The aquifer has an approximate volume of 1 750 000 ML.
Burns Reservoir is located 68 km northeast of Crowe on the Bridge River in the mountain State of Chin and has a capacity of 554 000 ML. The reservoir has an excellent supply of water with a cool wet climate.
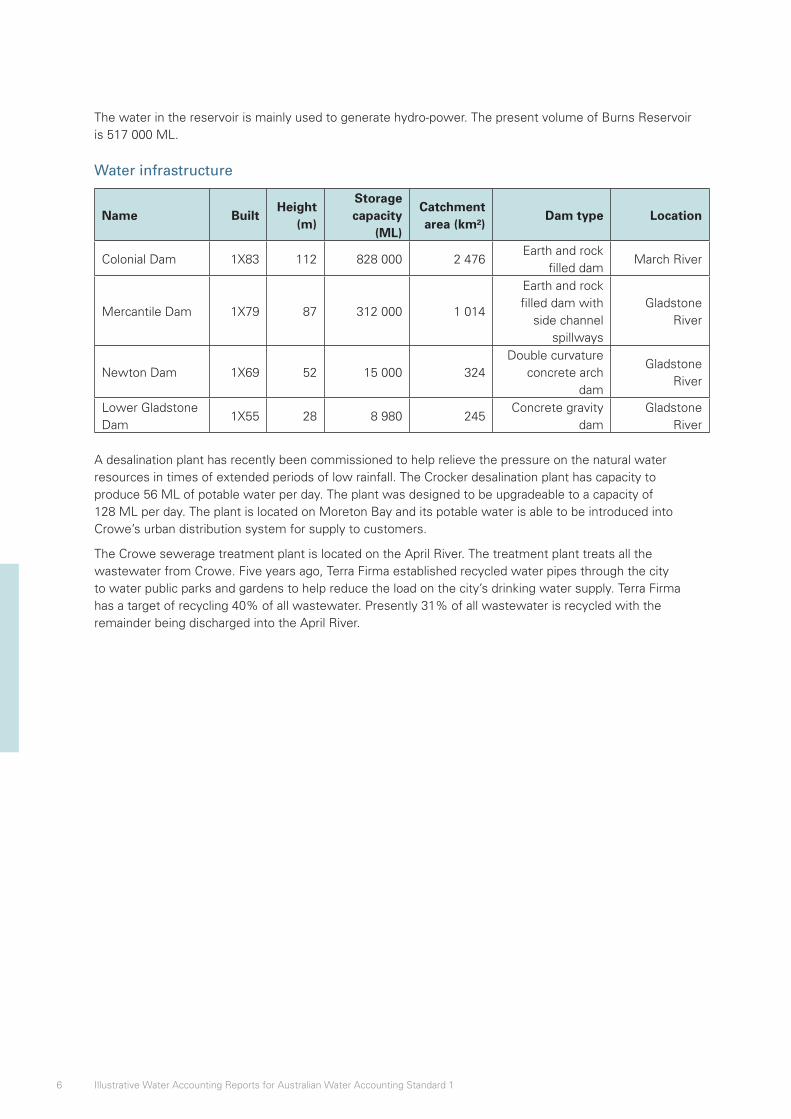
6 Illustrative Water Accounting Reports for Australian Water Accounting Standard 1
The water in the reservoir is mainly used to generate hydro-power. The present volume of Burns Reservoir is 517 000 ML.
Water infrastructure
Name BuiltHeight
(m)
Storage capacity
(ML)
Catchment area (km²)
Dam type Location
Colonial Dam 1X83 112 828 000 2 476Earth and rock
filled damMarch River
Mercantile Dam 1X79 87 312 000 1 014
Earth and rock filled dam with
side channel spillways
Gladstone River
Newton Dam 1X69 52 15 000 324Double curvature
concrete arch dam
Gladstone River
Lower Gladstone Dam
1X55 28 8 980 245Concrete gravity
damGladstone
River
A desalination plant has recently been commissioned to help relieve the pressure on the natural water resources in times of extended periods of low rainfall. The Crocker desalination plant has capacity to produce 56 ML of potable water per day. The plant was designed to be upgradeable to a capacity of 128 ML per day. The plant is located on Moreton Bay and its potable water is able to be introduced into Crowe’s urban distribution system for supply to customers.
The Crowe sewerage treatment plant is located on the April River. The treatment plant treats all the wastewater from Crowe. Five years ago, Terra Firma established recycled water pipes through the city to water public parks and gardens to help reduce the load on the city’s drinking water supply. Terra Firma has a target of recycling 40% of all wastewater. Presently 31% of all wastewater is recycled with the remainder being discharged into the April River.

7Terra Firma Water Supply System
Administrative information
Water management bodies
The Department of Conservation (the Department) is the body responsible for the overall management of water resources in the State of Central Hanley. The Department issues and monitors water licences under the Water Resources Act 2X07.
Terra Firma, under a licence issued from the Department, is responsible for the day-to-day management of water resources in the Terra Firma water supply system.
The licence allows Terra Firma to take water from the Gladstone, Bridge and March rivers for the purpose of urban water supply for the residents of Crowe. The licence requires Terra Firma to manage water resources in accordance with the Water Resources Act 2X07 and to follow the Environmental Flow Guidelines 2X07. The licence also imposes requirements for Terra Firma to monitor, sample and analyse water quality in the rivers and dams in accordance with Australian Standard AS 5667–1998 parts 1, 4 and 6, and with the Standard Methods for the Examination of Water and Wastewater.
Corporate information
Terra Firma is a government-owned corporation established in 2X03 by the Central Hanley State Government to manage the Crowe water supply. A Board of Directors comprising four senior executives and four non-executive directors appointed by the Minister for Conservation are employed to govern Terra Firma. The Board is responsible for the governance of the corporation and for ensuring it meets its obligations under the licence, which includes securing the future supply of water to the citizens and businesses of Crowe.
The management and operations of Terra Firma Corporation are conducted in compliance with several externally-imposed requirements, which include:
• Water Management Act 2X07
• Environmental Flow Guidelines 2X07
• Australian Standard AS 5667–1998 parts 1,4 and 6
• Standard Methods for the Examination of Water and Wastewater
• Directions issued by the Central Hanley State Department of Conservation
• Directions issued by the Chin State Department of Water and Energy
• Terra Firma Corporation Licence, document no. WLCC17265, issued by the Central Hanley State Department of Conservation.
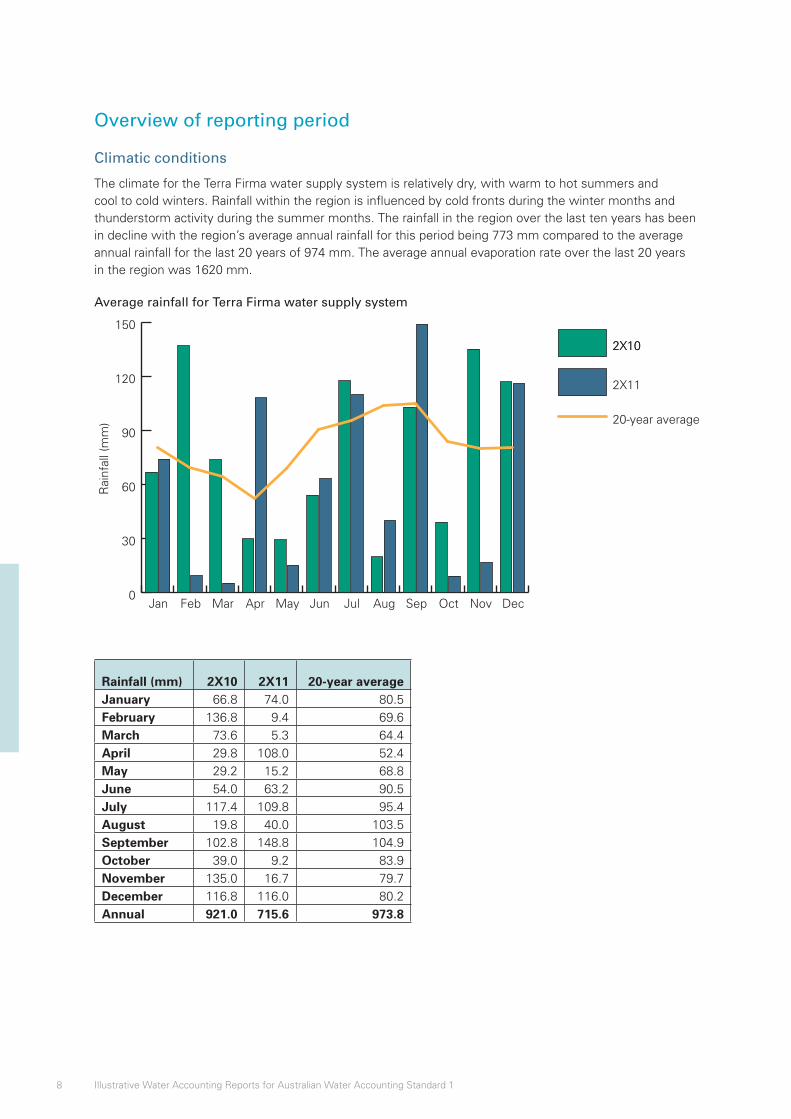
8 Illustrative Water Accounting Reports for Australian Water Accounting Standard 1
Overview of reporting period
Climatic conditions
The climate for the Terra Firma water supply system is relatively dry, with warm to hot summers and cool to cold winters. Rainfall within the region is influenced by cold fronts during the winter months and thunderstorm activity during the summer months. The rainfall in the region over the last ten years has been in decline with the region’s average annual rainfall for this period being 773 mm compared to the average annual rainfall for the last 20 years of 974 mm. The average annual evaporation rate over the last 20 years in the region was 1620 mm.
Average rainfall for Terra Firma water supply system
0
30
60
90
120
150
2X10
2X11
2X10
20-year average
DecNovOctSepAugJulJunMayAprMarFebJan
Rai
nfal
l (m
m)
Rainfall (mm) 2X10 2X11 20-year averageJanuary 66.8 74.0 80.5February 136.8 9.4 69.6March 73.6 5.3 64.4April 29.8 108.0 52.4May 29.2 15.2 68.8June 54.0 63.2 90.5July 117.4 109.8 95.4August 19.8 40.0 103.5September 102.8 148.8 104.9October 39.0 9.2 83.9November 135.0 16.7 79.7December 116.8 116.0 80.2Annual 921.0 715.6 973.8

9Terra Firma Water Supply System
The decline in average rainfall in the Terra Firma water supply system is illustrated by the following graph. The average rainfall in the region over the last ten years was 401 mm less than the average rainfall in the preceding ten years (1X92–2X01). 2X11 was a dry year with rainfall below the last five- and ten-year averages. This compares with 2X10, which had rainfall above the last ten-year average but still falling below the long-term average. The rainfall outlook for the next five years is for below average rainfall patterns similar to the last ten years.
Comparison of rainfall averages
0 200 400 600 800 1000 1200
Forecast 2X12 to 2X16
Average 2X76 to 2X11
Average 2X02 to 2X11
Average 1X92 to 2X01
Average 1X92 to 2X11
2X11
2X10
Rainfall (mm)
With the continued decline in rainfall in the water supply system, less water is flowing into the water supply dams that support Crowe. If the long-term trend continues, the city’s water supply system will be unable to support the needs of the residents. Terra Firma, in the last five years, has implemented strategies to reduce the threat to the city’s water supply by implementing water restrictions, purchasing two groundwater licences and purchasing rights to water from regions that have a high security of water. Terra Firma has also just commissioned the Crocker desalination plant to supplement natural water inflows in times of low rainfall.
Allocations and restrictions
Terra Firma is responsible for managing water restrictions on behalf of the Department. During the last five years, Terra Firma has imposed water restrictions on the city due to the decline in the city’s water supply. Crowe has a four-stage water restriction policy to help conserve its water resources in times of low storage levels. The policy imposes varying degrees of restrictions on water use. The objective of each restriction stage is to reduce the amount of water used as a percentage of normal average water use of the city. As at the reporting date, Crowe is on Stage 2 water restriction, which aims to reduce water usage by 25%.
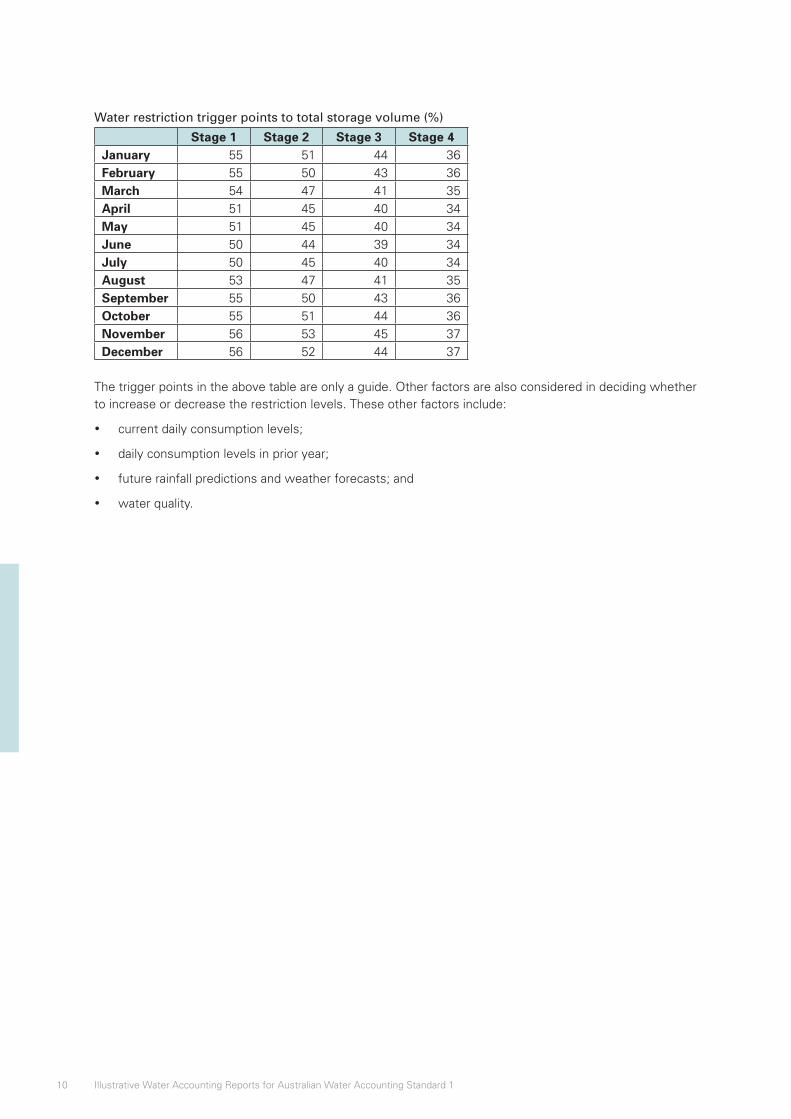
10 Illustrative Water Accounting Reports for Australian Water Accounting Standard 1
Water restriction trigger points to total storage volume (%)
Stage 1 Stage 2 Stage 3 Stage 4January 55 51 44 36February 55 50 43 36March 54 47 41 35April 51 45 40 34May 51 45 40 34June 50 44 39 34July 50 45 40 34August 53 47 41 35September 55 50 43 36October 55 51 44 36November 56 53 45 37December 56 52 44 37
The trigger points in the above table are only a guide. Other factors are also considered in deciding whether to increase or decrease the restriction levels. These other factors include:
• current daily consumption levels;
• daily consumption levels in prior year;
• future rainfall predictions and weather forecasts; and
• water quality.
11Terra Firma Water Supply System
Accountability Statement
AWAS 1 paragraphs 62–63
Basis for Conclusions paragraphs B45–B48
Water Accounting Conceptual Framework SWAC2: 15–16
The Accountability Statement is a statement signed and dated by the person(s) or representative(s) responsible for preparing and presenting the general purpose water accounting report. The Statement assists users of general water accounting reports determine whether the report has been prepared and presented in accordance with Australian Water Accounting Standards.
If the general purpose water accounting report is not prepared in accordance with Australian Water Accounting Standards, a statement to this effect is disclosed setting out the nature of and reason for non-compliance.
In the opinion of the undersigned:
This general purpose water accounting report has been prepared and presented in accordance with Australian Water Accounting Standards issued by the Water Accounting Standards Board.
This accountability statement is made in accordance with a resolution of the directors, dated at Crowe, in the State of Central Hanley, on 19 March 2X12.
Ruth Dillon Setanta VolkChairperson Chief Executive OfficerTerra Firma Corporation Terra Firma Corporation
12 Illustrative Water Accounting Reports for Australian Water Accounting Standard 1
Assurance of water accounting report
AWAS 1 paragraphs 178–182
Basis for Conclusions paragraphs B165–B169
Water Accounting Conceptual Framework SWAC 2:26–28 and SWAC 8
AWAS 1 requires a general purpose water accounting report to be subjected to assurance to establish whether it is presented fairly in accordance with Australian Water Accounting Standards. The assurance of the general purpose water accounting report entity is to be performed by an appropriately qualified assurance practitioner independent of the management of the water report entity and the preparer of the general purpose water accounting report.
AWAS requires a statement of whether the general purpose water accounting report is presented mainly in accordance with AWAS to be provided by the assurance practitioner in an assurance report accompanying the general purpose water accounting report.
The assurance function, undertaken by an appropriately qualified and independent assurance provider, is important in enhancing users’ confidence in the veracity of the information being presented to inform decision-making.
An assurance framework will be released for public consultation in late 2012.
13Terra Firma Water Supply System
Water Accounting Statements
Statement of Water Assets and Water Liabilities
AWAS 1 paragraphs 21–46, 51–54 and 64–106
Implementation Guidance A, C, D and E
Basis for Conclusions paragraphs B23–B38 and B49–B129
Water Accounting Conceptual Framework SWAC3, SWAC 4, SWAC 5 and SWAC 6
The Statement of Water Assets and Water Liabilities is a statement that provides information about the water assets and water liabilities of the water report at a point in time. The information in the Statement of Water Assets and Water Liabilities relates both to water and rights to and claims against water. This statement is prepared on an accrual basis.
The Statement of Water Assets and Water Liabilities shall contain the following minimum line items:
• water assets;
• water liabilities; and
• net water assets.
Additional sub-classification of the minimum line items can be presented in accordance with AWAS 1 paragraph 66.
Items in the Statement of Water Assets and Water Liabilities are to be cross-referenced to the relevant note disclosure.
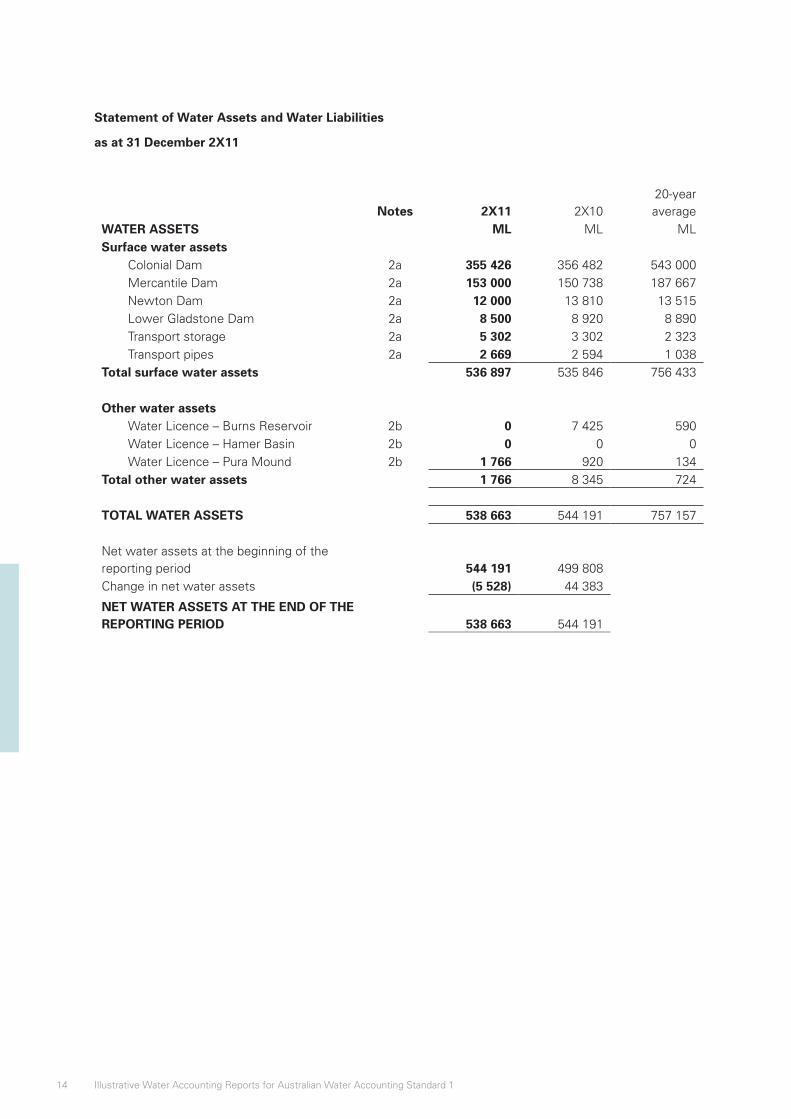
14 Illustrative Water Accounting Reports for Australian Water Accounting Standard 1
Statement of Water Assets and Water Liabilities
as at 31 December 2X11
Notes 2X11 2X10²⁰-year average
WATER ASSETS ML ML MLSurface water assets
Colonial Dam 2a 355 426 356 482 543 000Mercantile Dam 2a 153 000 150 738 187 667Newton Dam 2a 12 000 13 810 13 515Lower Gladstone Dam 2a 8 500 8 920 8 890Transport storage 2a 5 302 3 302 2 323Transport pipes 2a 2 669 2 594 1 038
Total surface water assets 536 897 535 846 756 433
Other water assetsWater Licence – Burns Reservoir 2b 0 7 425 590Water Licence – Hamer Basin 2b 0 0 0Water Licence – Pura Mound 2b 1 766 920 134
Total other water assets 1 766 8 345 724
TOTAL WATER ASSETS 538 663 544 191 757 157
Net water assets at the beginning of the reporting period 544 191 499 808Change in net water assets (5 528) 44 383
NET WATER ASSETS AT THE END OF THE REPORTING PERIOD 538 663 544 191
15Terra Firma Water Supply System
Statement of Changes in Water Assets and Water Liabilities
AWAS 1 paragraphs 21–46, 51–54 and 107–114
Implementation Guidance A, C, D and E
Basis for Conclusions B23–B38 and B130–B132
Water Accounting Conceptual Framework SWAC3, SWAC 4, SWAC 5 and SWAC 6
The Statement of Changes in Water Assets and Water Liabilities provides information about the changes that have occurred to the water report entity’s water assets and water liabilities during the reporting period. The Statement of Changes in Water Assets and Water Liabilities provides information about the increases and decreases in both water and rights to and claims against water. This statement is prepared on an accrual basis.
The Statement of Changes in Water Assets and Water Liabilities shall contain the following minimum line items:
• water asset increases;
• water asset decreases;
• water liability increases;
• water liability decreases; and
• change in net water assets.
Additional sub-classification of the minimum line items can be presented in accordance with AWAS 1 paragraph 110.
Items in the Statement of Water Assets and Water Liabilities are to be cross-referenced to the relevant note disclosure.
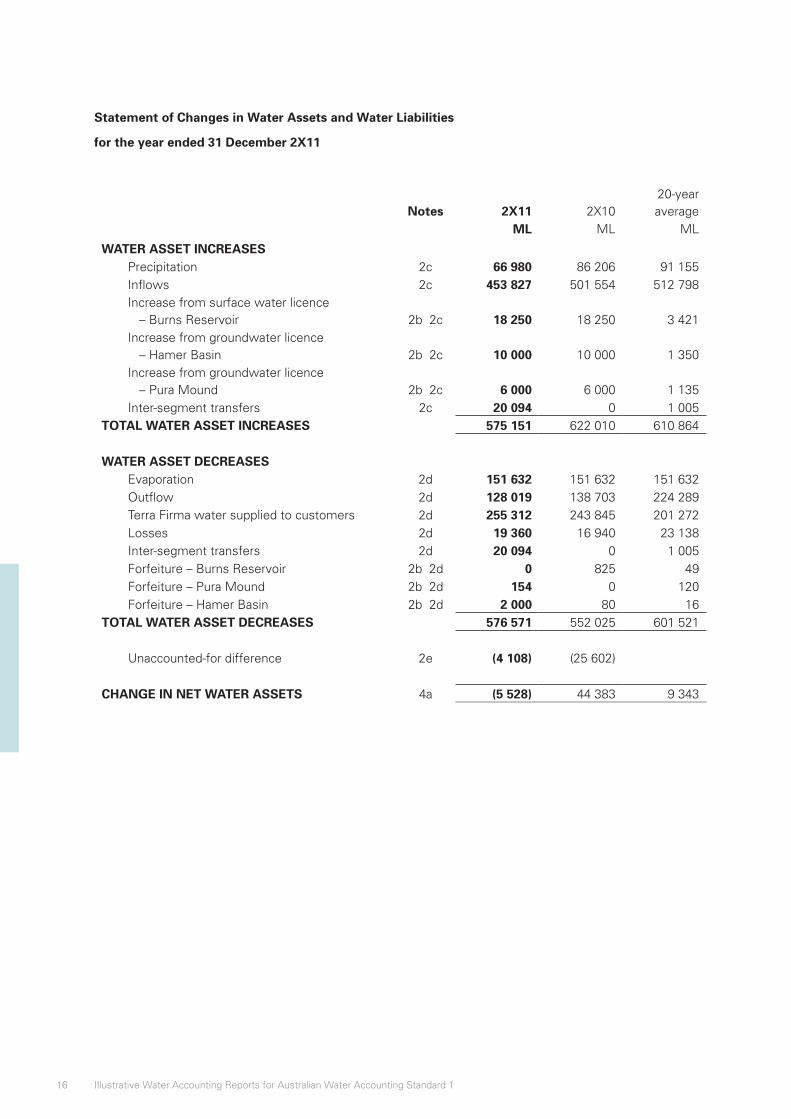
16 Illustrative Water Accounting Reports for Australian Water Accounting Standard 1
Statement of Changes in Water Assets and Water Liabilities
for the year ended 31 December 2X11
Notes 2X11 2X10²⁰-year average
WATER ASSET INCREASES
ML ML ML
Precipitation 2c 66 980 86 206 91 155Inflows 2c 453 827 501 554 512 798Increase from surface water licence
– Burns Reservoir 2b 2c 18 250 18 250 3 421Increase from groundwater licence
– Hamer Basin 2b 2c 10 000 10 000 1 350Increase from groundwater licence
– Pura Mound 2b 2c 6 000 6 000 1 135Inter-segment transfers 2c 20 094 0 1 005
TOTAL WATER ASSET INCREASES 575 151 622 010 610 864
WATER ASSET DECREASESEvaporation 2d 151 632 151 632 151 632Outflow 2d 128 019 138 703 224 289Terra Firma water supplied to customers 2d 255 312 243 845 201 272Losses 2d 19 360 16 940 23 138Inter-segment transfers 2d 20 094 0 1 005Forfeiture – Burns Reservoir 2b 2d 0 825 49Forfeiture – Pura Mound 2b 2d 154 0 120Forfeiture – Hamer Basin 2b 2d 2 000 80 16
TOTAL WATER ASSET DECREASES 576 571 552 025 601 521
Unaccounted-for difference 2e (4 108) (25 602)
CHANGE IN NET WATER ASSETS 4a (5 528) 44 383 9 343

17Terra Firma Water Supply System
Statement of Water Flows
AWAS 1 paragraphs 21–46, 51–54 and 115–127
Implementation Guidance A, C, D and E
Basis for Conclusions B23–B38 and B130–B132
Water Accounting Conceptual Framework SWAC3, SWAC 4, SWAC 5 and SWAC 6
The Statement of Water Flows provides information about the nature and volumes of water flows experienced by the water report entity during the reporting period.
The Statement of Water Flows provides information on transactions, transformations and events that give rise to physical water flows during the reporting period. For example, in the case of water liabilities arising from allocation announcements, the Statement of Water Flows will:
• include the effect of decreases in water liabilities resulting from the physical outflow of water to settle announced allocations; and
• exclude the effects of allocation determinations and announcements made during the reporting period that remain undelivered at the reporting date. This is because they have not given rise to a physical water flow during the reporting period.
The Statement of Water Flows shall include line items that present the following volumes for the reporting period:
• water inflows;
• water outflows;
• change in water storage;
• opening water storage; and
• closing water storage.
Additional sub-classifications of the minimum line items should be presented in accordance with AWAS 1 paragraph 118.
Items in the Statement of Water Flows are to be cross-referenced to the relevant note disclosure.
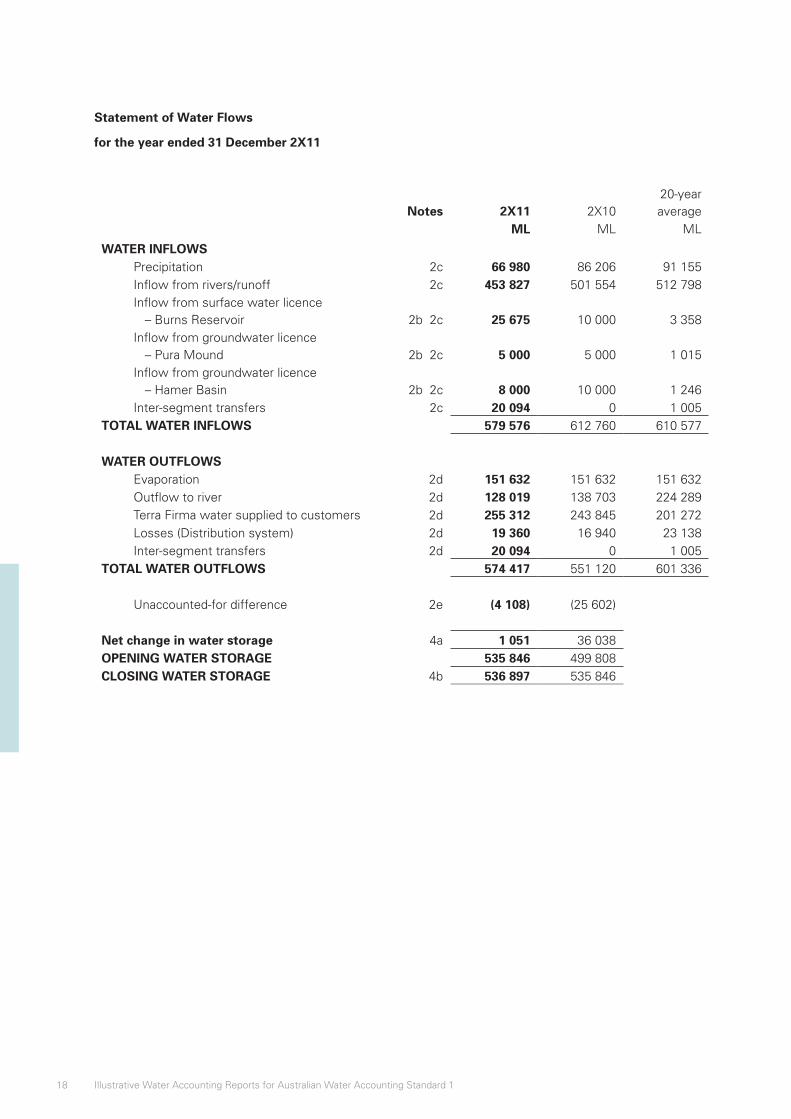
18 Illustrative Water Accounting Reports for Australian Water Accounting Standard 1
Statement of Water Flows
for the year ended 31 December 2X11
Notes 2X11 2X10²⁰-year average
WATER INFLOWS
ML ML ML
Precipitation 2c 66 980 86 206 91 155Inflow from rivers/runoff 2c 453 827 501 554 512 798Inflow from surface water licence
– Burns Reservoir 2b 2c 25 675 10 000 3 358Inflow from groundwater licence
– Pura Mound 2b 2c 5 000 5 000 1 015Inflow from groundwater licence
– Hamer Basin 2b 2c 8 000 10 000 1 246Inter-segment transfers 2c 20 094 0 1 005
TOTAL WATER INFLOWS 579 576 612 760 610 577
WATER OUTFLOWSEvaporation 2d 151 632 151 632 151 632Outflow to river 2d 128 019 138 703 224 289Terra Firma water supplied to customers 2d 255 312 243 845 201 272Losses (Distribution system) 2d 19 360 16 940 23 138Inter-segment transfers 2d 20 094 0 1 005
TOTAL WATER OUTFLOWS 574 417 551 120 601 336
Unaccounted-for difference 2e (4 108) (25 602)
Net change in water storage 4a 1 051 36 038OPENING WATER STORAGE 535 846 499 808CLOSING WATER STORAGE 4b 536 897 535 846
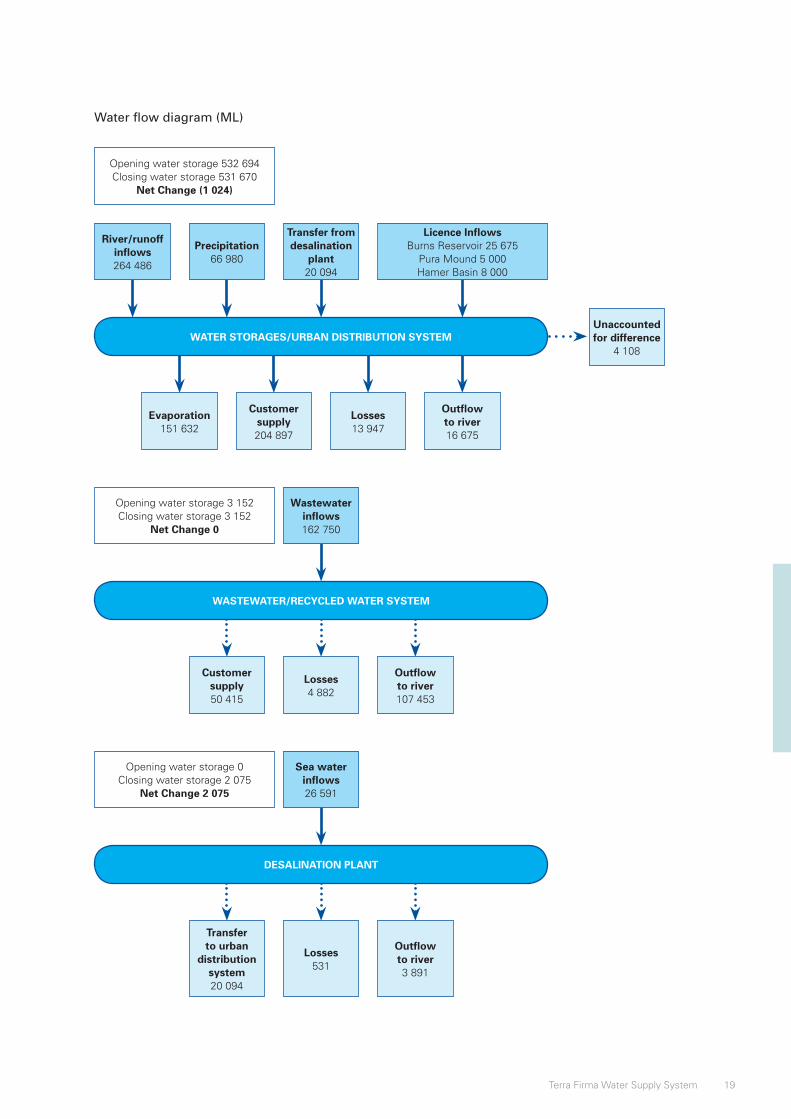
19Terra Firma Water Supply System
Water flow diagram (ML)
Unaccounted for difference
4 108
Outflow to river16 675
Losses13 947
Customer supply204 897
Evaporation151 632
WATER STORAGES/URBAN DISTRIBUTION SYSTEM
Licence InflowsBurns Reservoir 25 675
Pura Mound 5 000Hamer Basin 8 000
Transfer from desalination
plant20 094
Precipitation66 980
River/runoff inflows264 486
Opening water storage 532 694Closing water storage 531 670
Net Change (1 024)
Outflow to river107 453
Losses4 882
Customer supply50 415
WASTEWATER/RECYCLED WATER SYSTEM
Wastewaterinflows162 750
Opening water storage 3 152Closing water storage 3 152
Net Change 0
Outflow to river3 891
Losses531
Transfer to urban
distribution system20 094
DESALINATION PLANT
Sea water inflows26 591
Opening water storage 0Closing water storage 2 075
Net Change 2 075

20 Illustrative Water Accounting Reports for Australian Water Accounting Standard 1
Notes
AWAS 1 paragraphs 133–177
Basis for Conclusions paragraphs B146–B164
Water Accounting Conceptual Framework SWAC 2: 24–29
Information shall be disclosed in the notes that assist users of general purpose water accounting reports in understanding the water assets and water liabilities of the water report entity. The notes provide additional quantitative and qualitative information about the items presented in the water accounting statements. They also provide additional information on important aspects of the water report entity.
The following is a complete list of notes required by AWAS 1:
1. Significant water accounting policies
2. Supporting information to the water accounting statements
3. Restatement of comparative information
4. Prior period errors
5. Non-adjusting events after the end of the reporting period
6. Quantification approaches
7. Reconciliations
8. Future prospects
9. Contingent water assets and contingent water liabilities
10. Water assets and water liabilities that do not meet the recognition criteria
11. Water rights, water allocations, and water restrictions
12. Water market activity
13. Water for environmental, social and cultural, and economic benefit
14. Segment information
15. Group water accounting reports.
Notes 1, 2, 5, 6, 7, 8, 9, 11, 12, 13, and 14 are demonstrated in this illustrative water accounting report.
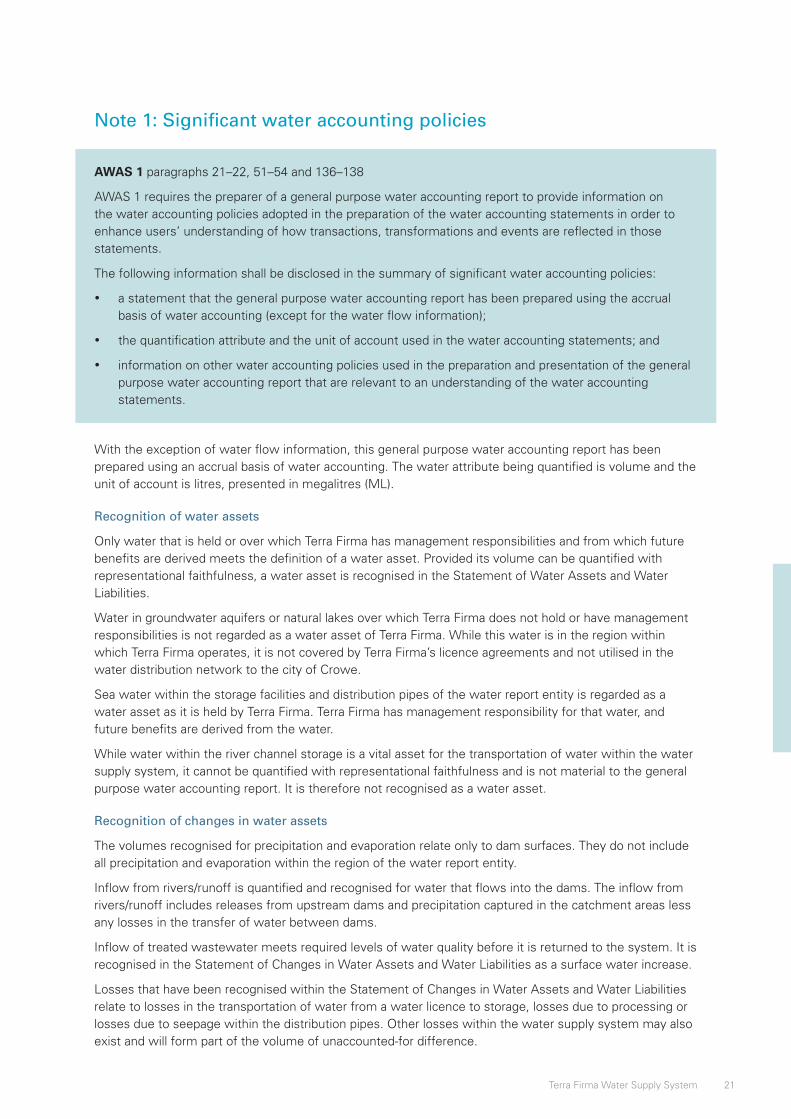
21Terra Firma Water Supply System
Note 1: Significant water accounting policies
AWAS 1 paragraphs 21–22, 51–54 and 136–138
AWAS 1 requires the preparer of a general purpose water accounting report to provide information on the water accounting policies adopted in the preparation of the water accounting statements in order to enhance users’ understanding of how transactions, transformations and events are reflected in those statements.
The following information shall be disclosed in the summary of significant water accounting policies:
• a statement that the general purpose water accounting report has been prepared using the accrual basis of water accounting (except for the water flow information);
• the quantification attribute and the unit of account used in the water accounting statements; and
• information on other water accounting policies used in the preparation and presentation of the general purpose water accounting report that are relevant to an understanding of the water accounting statements.
With the exception of water flow information, this general purpose water accounting report has been prepared using an accrual basis of water accounting. The water attribute being quantified is volume and the unit of account is litres, presented in megalitres (ML).
Recognition of water assets
Only water that is held or over which Terra Firma has management responsibilities and from which future benefits are derived meets the definition of a water asset. Provided its volume can be quantified with representational faithfulness, a water asset is recognised in the Statement of Water Assets and Water Liabilities.
Water in groundwater aquifers or natural lakes over which Terra Firma does not hold or have management responsibilities is not regarded as a water asset of Terra Firma. While this water is in the region within which Terra Firma operates, it is not covered by Terra Firma’s licence agreements and not utilised in the water distribution network to the city of Crowe.
Sea water within the storage facilities and distribution pipes of the water report entity is regarded as a water asset as it is held by Terra Firma. Terra Firma has management responsibility for that water, and future benefits are derived from the water.
While water within the river channel storage is a vital asset for the transportation of water within the water supply system, it cannot be quantified with representational faithfulness and is not material to the general purpose water accounting report. It is therefore not recognised as a water asset.
Recognition of changes in water assets
The volumes recognised for precipitation and evaporation relate only to dam surfaces. They do not include all precipitation and evaporation within the region of the water report entity.
Inflow from rivers/runoff is quantified and recognised for water that flows into the dams. The inflow from rivers/runoff includes releases from upstream dams and precipitation captured in the catchment areas less any losses in the transfer of water between dams.
Inflow of treated wastewater meets required levels of water quality before it is returned to the system. It is recognised in the Statement of Changes in Water Assets and Water Liabilities as a surface water increase.
Losses that have been recognised within the Statement of Changes in Water Assets and Water Liabilities relate to losses in the transportation of water from a water licence to storage, losses due to processing or losses due to seepage within the distribution pipes. Other losses within the water supply system may also exist and will form part of the volume of unaccounted-for difference.
22 Illustrative Water Accounting Reports for Australian Water Accounting Standard 1
Note 2: Information supporting the items presented in the water accounting statements
AWAS 1 paragraphs 31–54 and 133–150
Basis for Conclusions paragraphs B35–B41
Water Accounting Conceptual Framework SWAC 2: 24–29
In order to assist in the ability to understand and compare the water accounting statements, AWAS 1 requires the inclusion of information in the notes that supports the items presented in the water accounting statements. The information is to be presented in the order in which each item is presented in the statements, including:
• information about the restatement of comparative information;
• information about prior period errors;
• information about non-adjusting events after the end of the reporting period;
• information about quantification approaches; and
• reconciliations and other information related to the Statement of Water Flows.
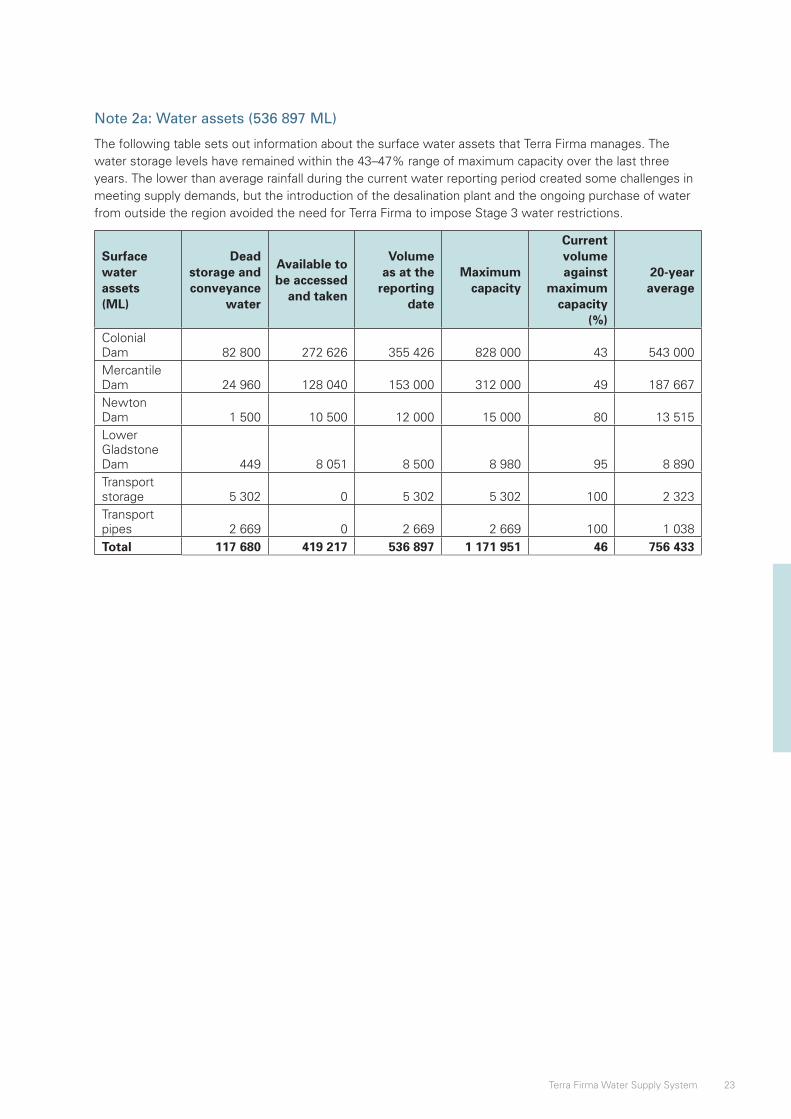
23Terra Firma Water Supply System
Note 2a: Water assets (536 897 ML)
The following table sets out information about the surface water assets that Terra Firma manages. The water storage levels have remained within the 43–47% range of maximum capacity over the last three years. The lower than average rainfall during the current water reporting period created some challenges in meeting supply demands, but the introduction of the desalination plant and the ongoing purchase of water from outside the region avoided the need for Terra Firma to impose Stage 3 water restrictions.
Surface water assets (ML)
Dead storage and conveyance
water
Available to be accessed
and taken
Volume as at the
reporting date
Maximum capacity
Current volume against
maximum capacity
(%)
20-year average
Colonial Dam 82 800 272 626 355 426 828 000 43 543 000Mercantile Dam 24 960 128 040 153 000 312 000 49 187 667Newton Dam 1 500 10 500 12 000 15 000 80 13 515Lower Gladstone Dam 449 8 051 8 500 8 980 95 8 890Transport storage 5 302 0 5 302 5 302 100 2 323Transport pipes 2 669 0 2 669 2 669 100 1 038Total 117 680 419 217 536 897 1 171 951 46 756 433
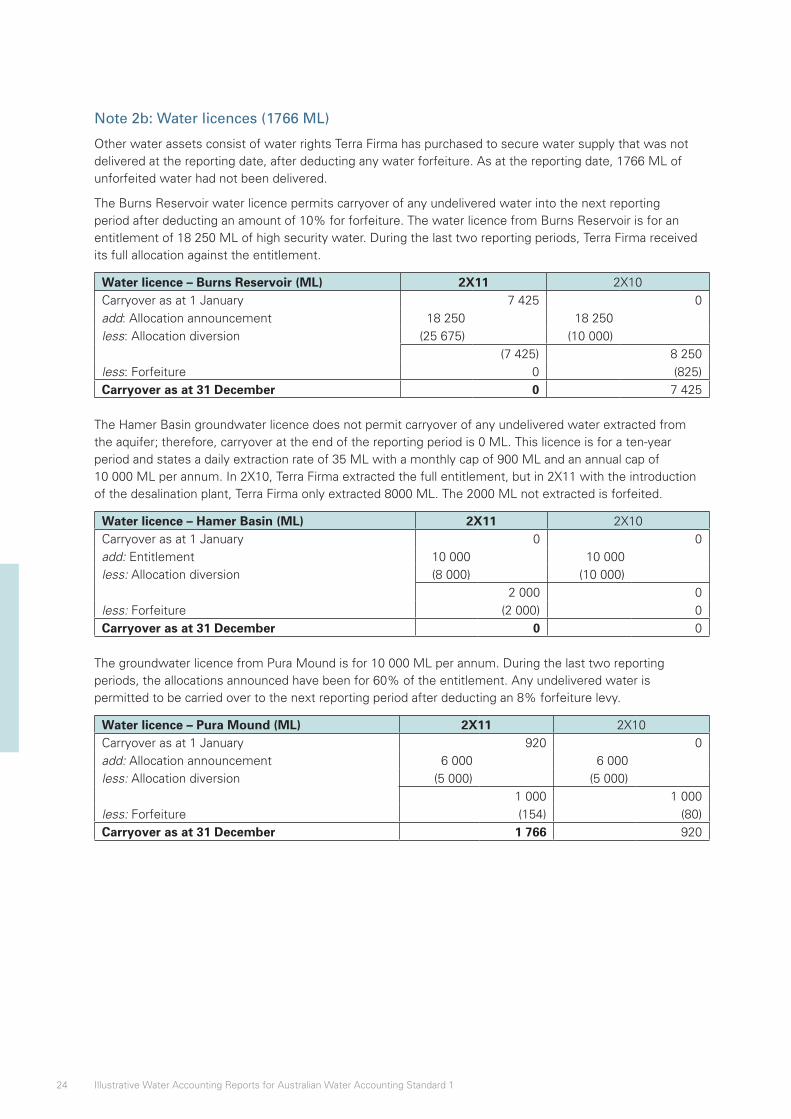
24 Illustrative Water Accounting Reports for Australian Water Accounting Standard 1
Note 2b: Water licences (1766 ML)
Other water assets consist of water rights Terra Firma has purchased to secure water supply that was not delivered at the reporting date, after deducting any water forfeiture. As at the reporting date, 1766 ML of unforfeited water had not been delivered.
The Burns Reservoir water licence permits carryover of any undelivered water into the next reporting period after deducting an amount of 10% for forfeiture. The water licence from Burns Reservoir is for an entitlement of 18 250 ML of high security water. During the last two reporting periods, Terra Firma received its full allocation against the entitlement.
Water licence – Burns Reservoir (ML) 2X11 2X10Carryover as at 1 January 7 425 0add: Allocation announcement 18 250 18 250less: Allocation diversion (25 675) (10 000) (7 425) 8 250less: Forfeiture 0 (825)Carryover as at 31 December 0 7 425
The Hamer Basin groundwater licence does not permit carryover of any undelivered water extracted from the aquifer; therefore, carryover at the end of the reporting period is 0 ML. This licence is for a ten-year period and states a daily extraction rate of 35 ML with a monthly cap of 900 ML and an annual cap of 10 000 ML per annum. In 2X10, Terra Firma extracted the full entitlement, but in 2X11 with the introduction of the desalination plant, Terra Firma only extracted 8000 ML. The 2000 ML not extracted is forfeited.
Water licence – Hamer Basin (ML) 2X11 2X10Carryover as at 1 January 0 0add: Entitlement 10 000 10 000 less: Allocation diversion (8 000) (10 000) 2 000 0less: Forfeiture (2 000) 0Carryover as at 31 December 0 0
The groundwater licence from Pura Mound is for 10 000 ML per annum. During the last two reporting periods, the allocations announced have been for 60% of the entitlement. Any undelivered water is permitted to be carried over to the next reporting period after deducting an 8% forfeiture levy.
Water licence – Pura Mound (ML) 2X11 2X10Carryover as at 1 January 920 0add: Allocation announcement 6 000 6 000 less: Allocation diversion (5 000) (5 000) 1 000 1 000less: Forfeiture (154) (80)Carryover as at 31 December 1 766 920
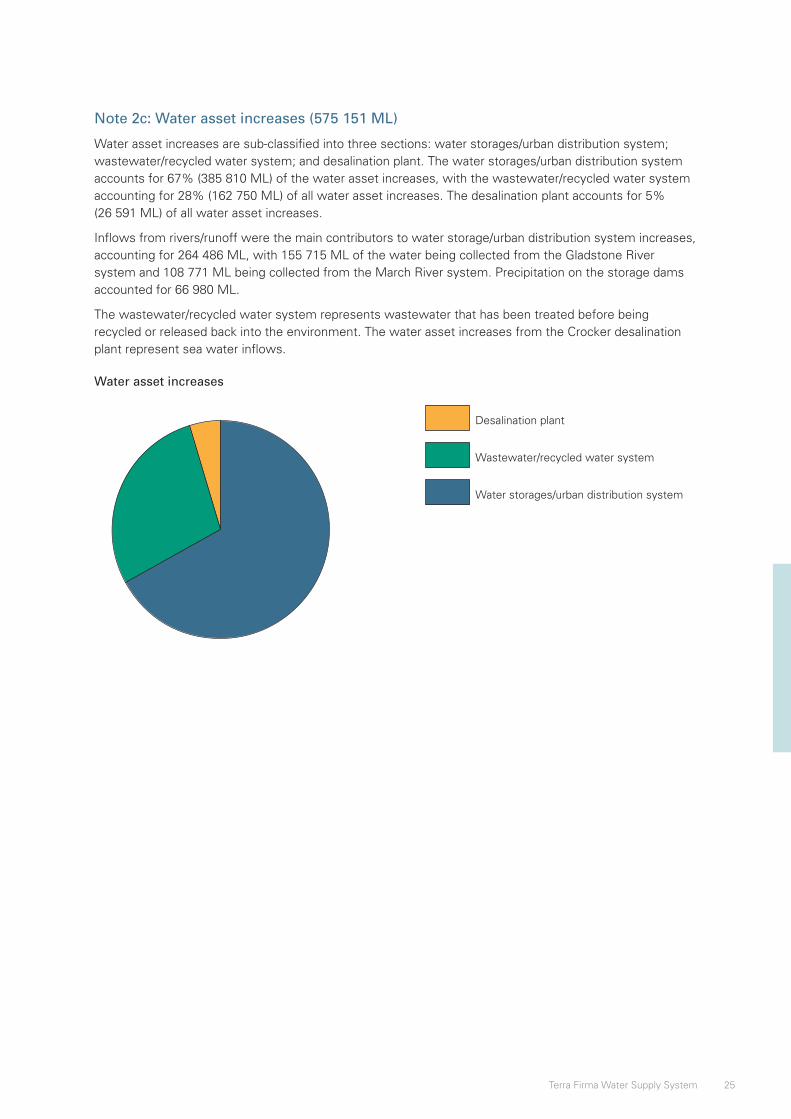
25Terra Firma Water Supply System
Note 2c: Water asset increases (575 151 ML)
Water asset increases are sub-classified into three sections: water storages/urban distribution system; wastewater/recycled water system; and desalination plant. The water storages/urban distribution system accounts for 67% (385 810 ML) of the water asset increases, with the wastewater/recycled water system accounting for 28% (162 750 ML) of all water asset increases. The desalination plant accounts for 5% (26 591 ML) of all water asset increases.
Inflows from rivers/runoff were the main contributors to water storage/urban distribution system increases, accounting for 264 486 ML, with 155 715 ML of the water being collected from the Gladstone River system and 108 771 ML being collected from the March River system. Precipitation on the storage dams accounted for 66 980 ML.
The wastewater/recycled water system represents wastewater that has been treated before being recycled or released back into the environment. The water asset increases from the Crocker desalination plant represent sea water inflows.
Water asset increases
Desalination plant
Wastewater/recycled water system
Water storages/urban distribution system
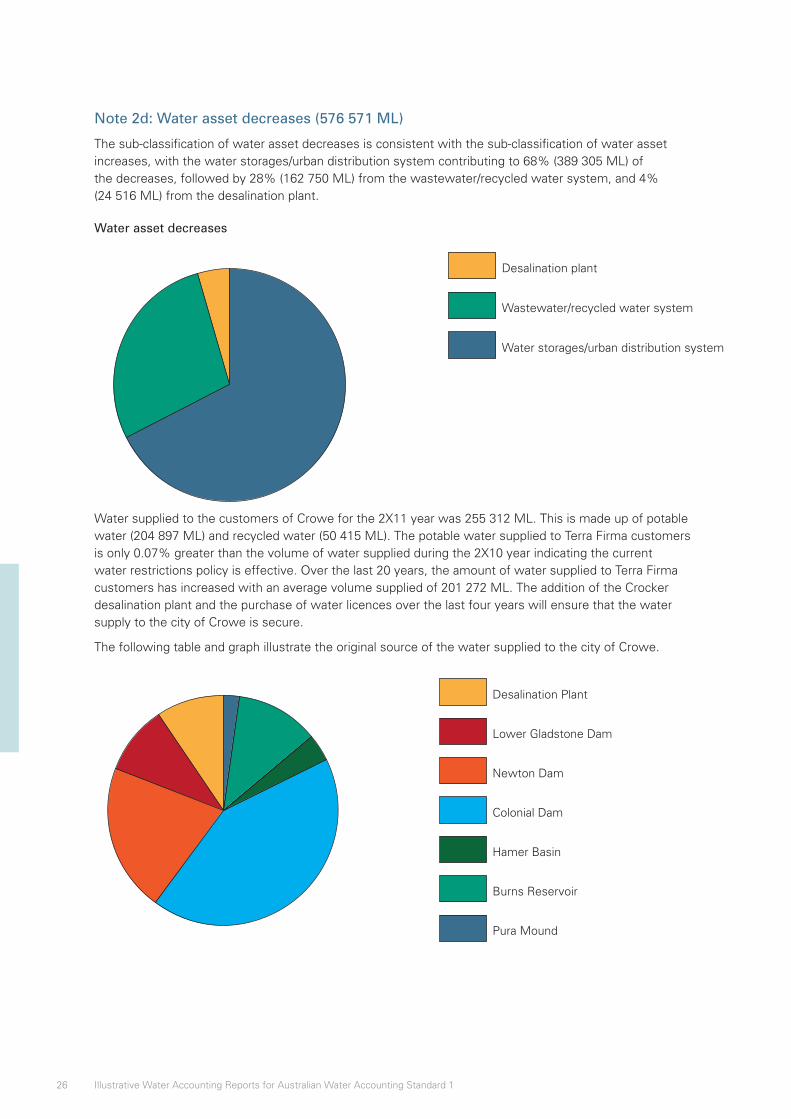
26 Illustrative Water Accounting Reports for Australian Water Accounting Standard 1
Note 2d: Water asset decreases (576 571 ML)
The sub-classification of water asset decreases is consistent with the sub-classification of water asset increases, with the water storages/urban distribution system contributing to 68% (389 305 ML) of the decreases, followed by 28% (162 750 ML) from the wastewater/recycled water system, and 4% (24 516 ML) from the desalination plant.
Water asset decreases
Desalination plant
Wastewater/recycled water system
Water storages/urban distribution system
Water supplied to the customers of Crowe for the 2X11 year was 255 312 ML. This is made up of potable water (204 897 ML) and recycled water (50 415 ML). The potable water supplied to Terra Firma customers is only 0.07% greater than the volume of water supplied during the 2X10 year indicating the current water restrictions policy is effective. Over the last 20 years, the amount of water supplied to Terra Firma customers has increased with an average volume supplied of 201 272 ML. The addition of the Crocker desalination plant and the purchase of water licences over the last four years will ensure that the water supply to the city of Crowe is secure.
The following table and graph illustrate the original source of the water supplied to the city of Crowe.
Desalination Plant
Lower Gladstone Dam
Newton Dam
Colonial Dam
Hamer Basin
Burns Reservoir
Pura Mound
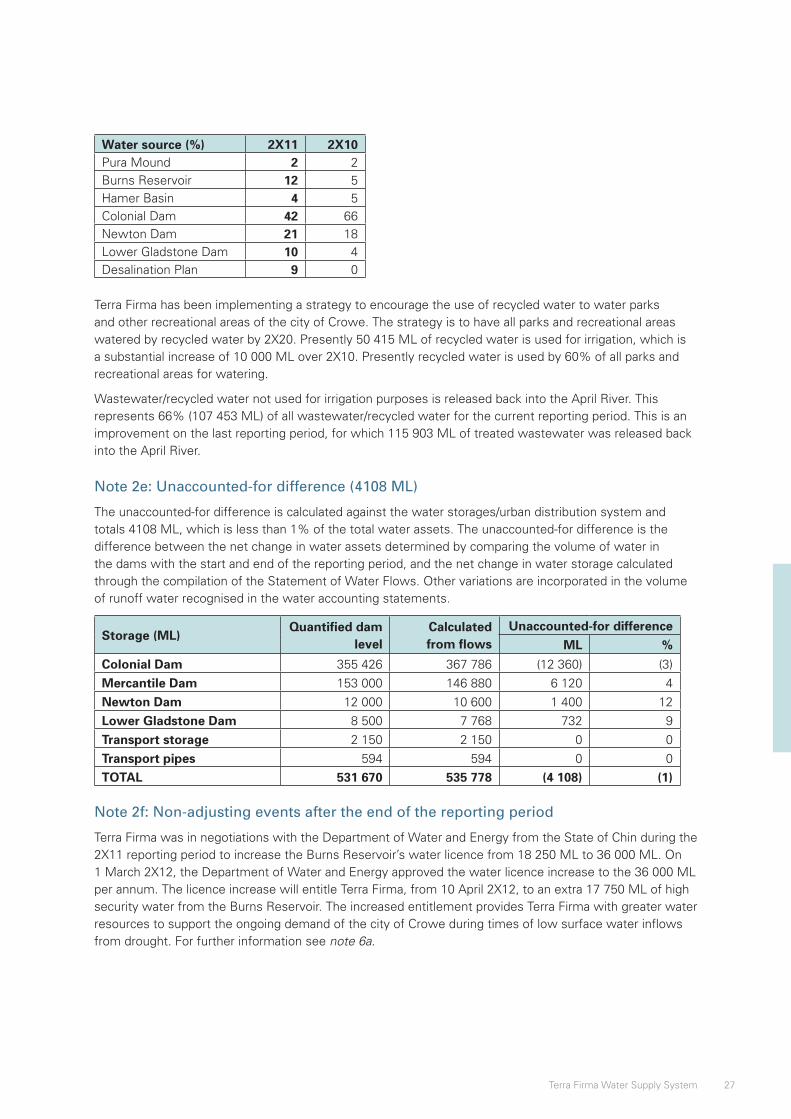
27Terra Firma Water Supply System
Water source (%) 2X11 2X10Pura Mound 2 2Burns Reservoir 12 5Hamer Basin 4 5Colonial Dam 42 66Newton Dam 21 18Lower Gladstone Dam 10 4Desalination Plan 9 0
Terra Firma has been implementing a strategy to encourage the use of recycled water to water parks and other recreational areas of the city of Crowe. The strategy is to have all parks and recreational areas watered by recycled water by 2X20. Presently 50 415 ML of recycled water is used for irrigation, which is a substantial increase of 10 000 ML over 2X10. Presently recycled water is used by 60% of all parks and recreational areas for watering.
Wastewater/recycled water not used for irrigation purposes is released back into the April River. This represents 66% (107 453 ML) of all wastewater/recycled water for the current reporting period. This is an improvement on the last reporting period, for which 115 903 ML of treated wastewater was released back into the April River.
Note 2e: Unaccounted-for difference (4108 ML)
The unaccounted-for difference is calculated against the water storages/urban distribution system and totals 4108 ML, which is less than 1% of the total water assets. The unaccounted-for difference is the difference between the net change in water assets determined by comparing the volume of water in the dams with the start and end of the reporting period, and the net change in water storage calculated through the compilation of the Statement of Water Flows. Other variations are incorporated in the volume of runoff water recognised in the water accounting statements.
Storage (ML)Quantified dam
levelCalculated from flows
Unaccounted-for differenceML %
Colonial Dam 355 426 367 786 (12 360) (3)
Mercantile Dam 153 000 146 880 6 120 4
Newton Dam 12 000 10 600 1 400 12
Lower Gladstone Dam 8 500 7 768 732 9
Transport storage 2 150 2 150 0 0
Transport pipes 594 594 0 0
TOTAL 531 670 535 778 (4 108) (1)
Note 2f: Non-adjusting events after the end of the reporting period
Terra Firma was in negotiations with the Department of Water and Energy from the State of Chin during the 2X11 reporting period to increase the Burns Reservoir’s water licence from 18 250 ML to 36 000 ML. On 1 March 2X12, the Department of Water and Energy approved the water licence increase to the 36 000 ML per annum. The licence increase will entitle Terra Firma, from 10 April 2X12, to an extra 17 750 ML of high security water from the Burns Reservoir. The increased entitlement provides Terra Firma with greater water resources to support the ongoing demand of the city of Crowe during times of low surface water inflows from drought. For further information see note 6a.
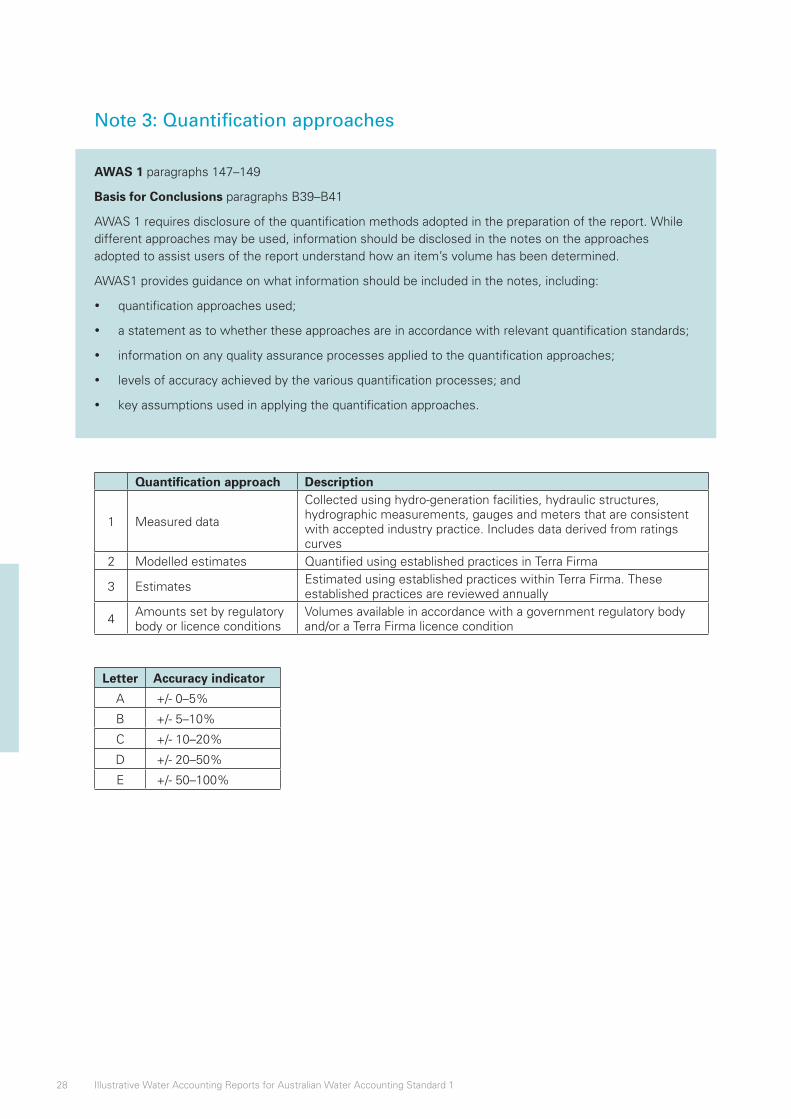
28 Illustrative Water Accounting Reports for Australian Water Accounting Standard 1
Note 3: Quantification approaches
AWAS 1 paragraphs 147–149
Basis for Conclusions paragraphs B39–B41
AWAS 1 requires disclosure of the quantification methods adopted in the preparation of the report. While different approaches may be used, information should be disclosed in the notes on the approaches adopted to assist users of the report understand how an item’s volume has been determined.
AWAS1 provides guidance on what information should be included in the notes, including:
• quantification approaches used;
• a statement as to whether these approaches are in accordance with relevant quantification standards;
• information on any quality assurance processes applied to the quantification approaches;
• levels of accuracy achieved by the various quantification processes; and
• key assumptions used in applying the quantification approaches.
Quantification approach Description
1 Measured data
Collected using hydro-generation facilities, hydraulic structures, hydrographic measurements, gauges and meters that are consistent with accepted industry practice. Includes data derived from ratings curves
2 Modelled estimates Quantified using established practices in Terra Firma
3 EstimatesEstimated using established practices within Terra Firma. These established practices are reviewed annually
4Amounts set by regulatory body or licence conditions
Volumes available in accordance with a government regulatory body and/or a Terra Firma licence condition
Letter Accuracy indicator
A +/- 0–5%
B +/- 5–10%
C +/- 10–20%
D +/- 20–50%
E +/- 50–100%
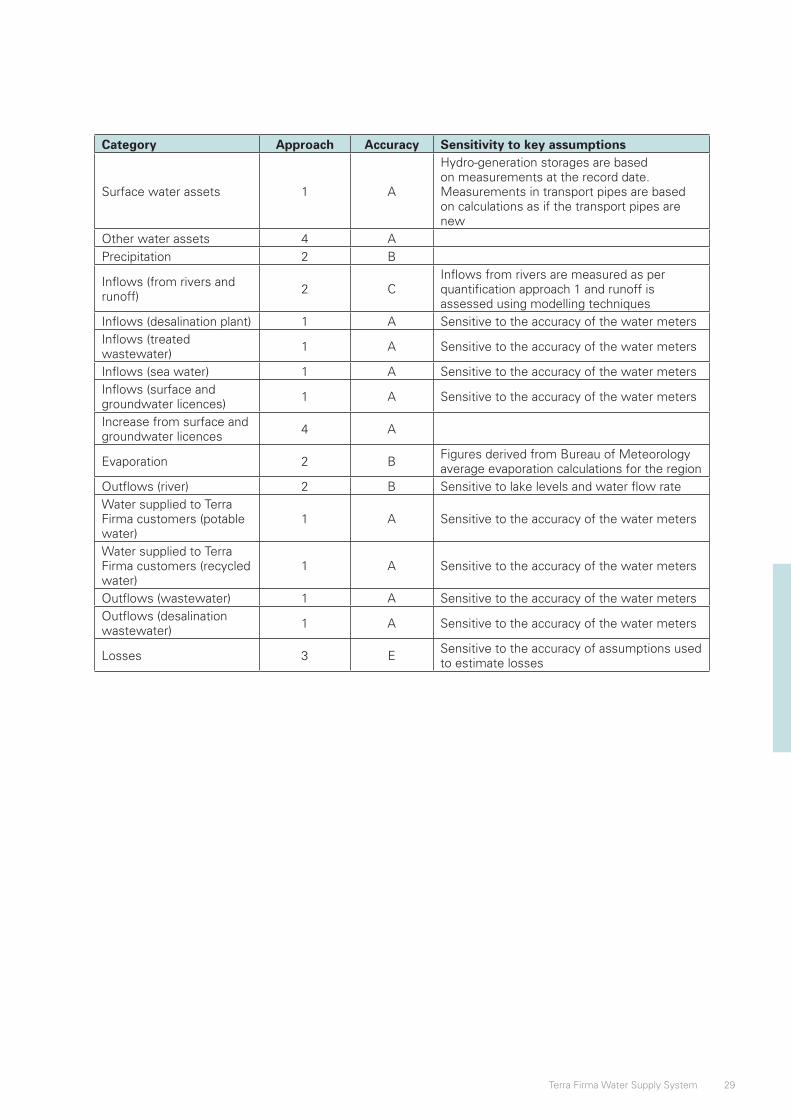
29Terra Firma Water Supply System
Category Approach Accuracy Sensitivity to key assumptions
Surface water assets 1 A
Hydro-generation storages are based on measurements at the record date. Measurements in transport pipes are based on calculations as if the transport pipes are new
Other water assets 4 APrecipitation 2 B
Inflows (from rivers and runoff)
2 CInflows from rivers are measured as per quantification approach 1 and runoff is assessed using modelling techniques
Inflows (desalination plant) 1 A Sensitive to the accuracy of the water metersInflows (treated wastewater)
1 A Sensitive to the accuracy of the water meters
Inflows (sea water) 1 A Sensitive to the accuracy of the water metersInflows (surface and groundwater licences)
1 A Sensitive to the accuracy of the water meters
Increase from surface and groundwater licences
4 A
Evaporation 2 BFigures derived from Bureau of Meteorology average evaporation calculations for the region
Outflows (river) 2 B Sensitive to lake levels and water flow rateWater supplied to Terra Firma customers (potable water)
1 A Sensitive to the accuracy of the water meters
Water supplied to Terra Firma customers (recycled water)
1 A Sensitive to the accuracy of the water meters
Outflows (wastewater) 1 A Sensitive to the accuracy of the water metersOutflows (desalination wastewater)
1 A Sensitive to the accuracy of the water meters
Losses 3 ESensitive to the accuracy of assumptions used to estimate losses
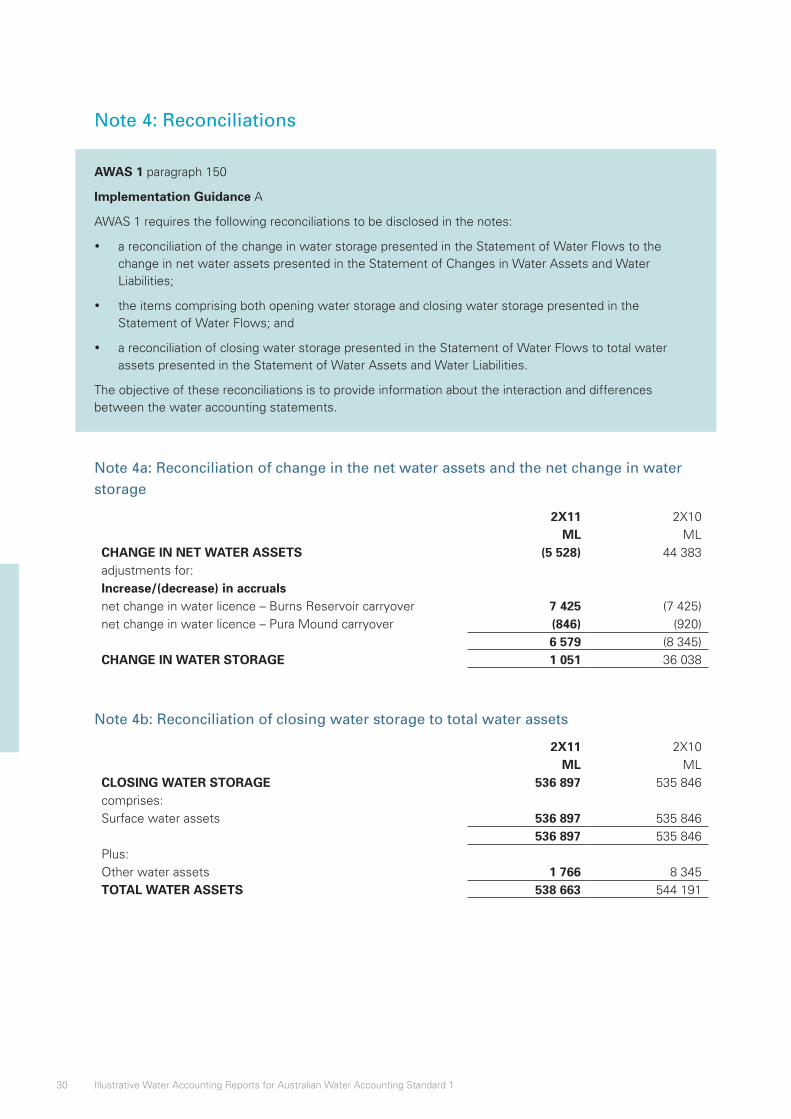
30 Illustrative Water Accounting Reports for Australian Water Accounting Standard 1
Note 4: Reconciliations
AWAS 1 paragraph 150
Implementation Guidance A
AWAS 1 requires the following reconciliations to be disclosed in the notes:
• a reconciliation of the change in water storage presented in the Statement of Water Flows to the change in net water assets presented in the Statement of Changes in Water Assets and Water Liabilities;
• the items comprising both opening water storage and closing water storage presented in the Statement of Water Flows; and
• a reconciliation of closing water storage presented in the Statement of Water Flows to total water assets presented in the Statement of Water Assets and Water Liabilities.
The objective of these reconciliations is to provide information about the interaction and differences between the water accounting statements.
Note 4a: Reconciliation of change in the net water assets and the net change in water storage
2X11 2X10ML ML
CHANGE IN NET WATER ASSETS (5 528) 44 383adjustments for:Increase/(decrease) in accrualsnet change in water licence – Burns Reservoir carryover 7 425 (7 425)net change in water licence – Pura Mound carryover (846) (920)
6 579 (8 345)CHANGE IN WATER STORAGE 1 051 36 038
Note 4b: Reconciliation of closing water storage to total water assets
2X11 2X10ML ML
CLOSING WATER STORAGE 536 897 535 846comprises:Surface water assets 536 897 535 846
536 897 535 846Plus:Other water assets 1 766 8 345TOTAL WATER ASSETS 538 663 544 191
31Terra Firma Water Supply System
Note 5: Future prospects, contingent water assets and contingent water liabilities
AWAS 1 paragraphs 151–160
Implementation Guidance B, D and E
Basis for Conclusions paragraphs B147–B150
The future prospects note assists users of general purpose water accounting reports to understand the extent to which water assets at the reporting date will be available to settle water liabilities and future water commitments within 12 months of the reporting date. The volumes presented in this note are a combination of the information found in the Statement of Water Assets and Water Liabilities and assumptions on future commitments and expected inflows.
Information about expected inflows into the water report entity is to be presented under various climatic conditions.
Contingent water assets and contingent water liabilities are not included in the Water Accounting Statements, but are disclosed in the notes.
In order to qualify as a contingent water asset or a contingent water liability, the following criteria must be met:
• Contingent water asset – possible water asset that arises from past events and whose existence will be confirmed only by the occurrence or non-occurrence of one or more uncertain future events not wholly within the control of the management of the water report entity.
• Contingent water liability – possible obligation that arises from past events and whose existence will be confirmed only by the occurrence or non-occurrence of one or more uncertain future events not wholly within the control of the management of the water report entity.
A brief description of each contingent water asset and contingent water liability is disclosed in the notes.
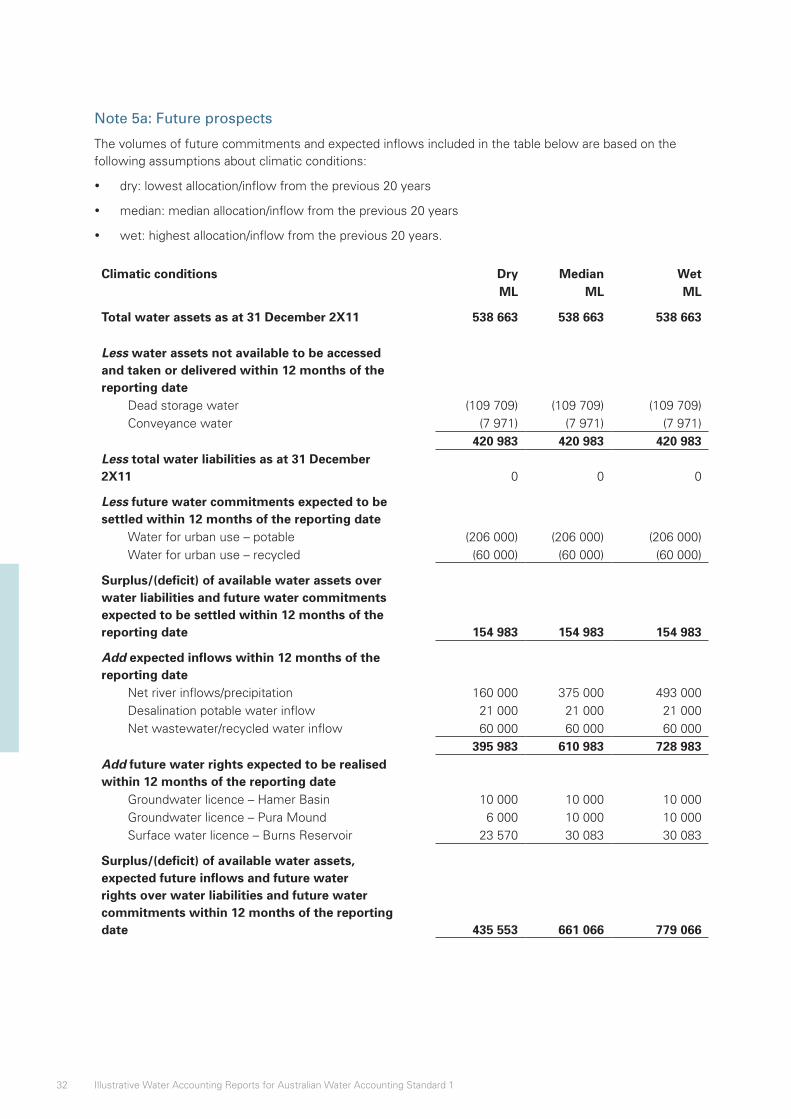
32 Illustrative Water Accounting Reports for Australian Water Accounting Standard 1
Note 5a: Future prospects
The volumes of future commitments and expected inflows included in the table below are based on the following assumptions about climatic conditions:
• dry: lowest allocation/inflow from the previous 20 years
• median: median allocation/inflow from the previous 20 years
• wet: highest allocation/inflow from the previous 20 years.
Climatic conditions Dry Median WetML ML ML
Total water assets as at 31 December 2X11 538 663 538 663 538 663
Less water assets not available to be accessed and taken or delivered within 12 months of the reporting date
Dead storage water (109 709) (109 709) (109 709)Conveyance water (7 971) (7 971) (7 971)
420 983 420 983 420 983Less total water liabilities as at 31 December 2X11 0 0 0
Less future water commitments expected to be settled within 12 months of the reporting date
Water for urban use – potable (206 000) (206 000) (206 000)Water for urban use – recycled (60 000) (60 000) (60 000)
Surplus/(deficit) of available water assets over water liabilities and future water commitments expected to be settled within 12 months of the reporting date 154 983 154 983 154 983
Add expected inflows within 12 months of the reporting date
Net river inflows/precipitation 160 000 375 000 493 000Desalination potable water inflow 21 000 21 000 21 000Net wastewater/recycled water inflow 60 000 60 000 60 000
395 983 610 983 728 983Add future water rights expected to be realised within 12 months of the reporting date
Groundwater licence – Hamer Basin 10 000 10 000 10 000Groundwater licence – Pura Mound 6 000 10 000 10 000Surface water licence – Burns Reservoir 23 570 30 083 30 083
Surplus/(deficit) of available water assets, expected future inflows and future water rights over water liabilities and future water commitments within 12 months of the reporting date 435 553 661 066 779 066
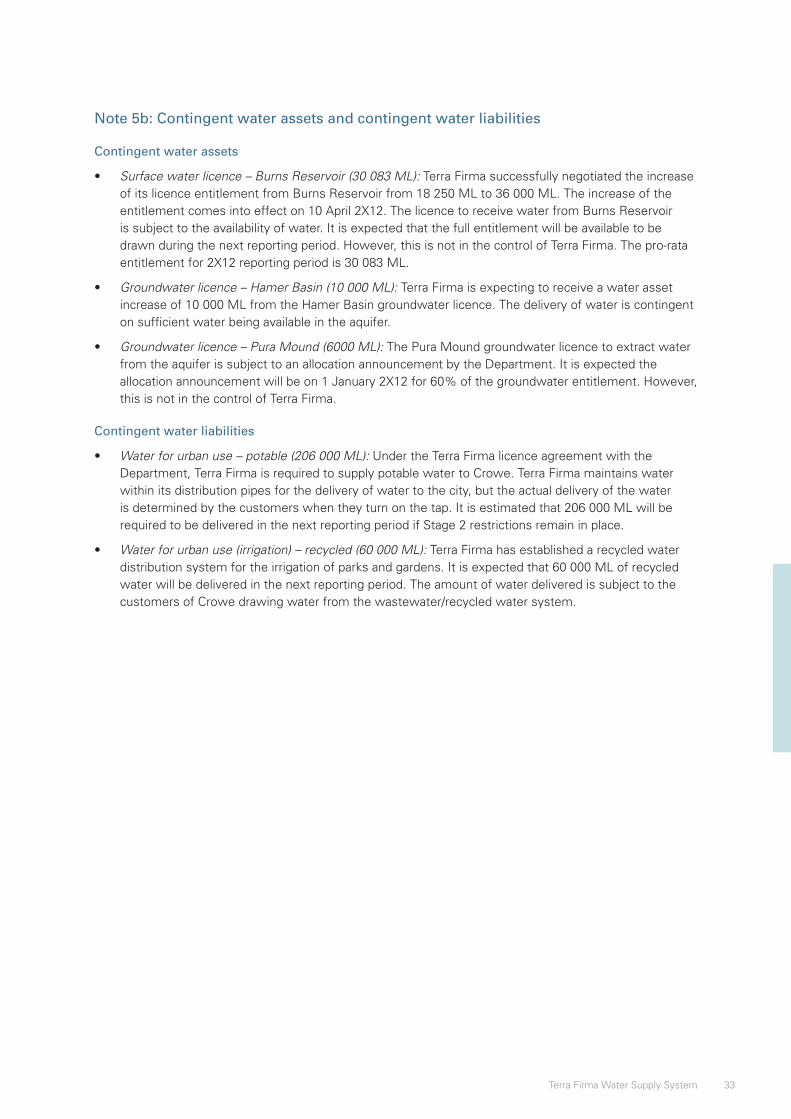
33Terra Firma Water Supply System
Note 5b: Contingent water assets and contingent water liabilities
Contingent water assets
• Surface water licence – Burns Reservoir (30 083 ML): Terra Firma successfully negotiated the increase of its licence entitlement from Burns Reservoir from 18 250 ML to 36 000 ML. The increase of the entitlement comes into effect on 10 April 2X12. The licence to receive water from Burns Reservoir is subject to the availability of water. It is expected that the full entitlement will be available to be drawn during the next reporting period. However, this is not in the control of Terra Firma. The pro-rata entitlement for 2X12 reporting period is 30 083 ML.
• Groundwater licence – Hamer Basin (10 000 ML): Terra Firma is expecting to receive a water asset increase of 10 000 ML from the Hamer Basin groundwater licence. The delivery of water is contingent on sufficient water being available in the aquifer.
• Groundwater licence – Pura Mound (6000 ML): The Pura Mound groundwater licence to extract water from the aquifer is subject to an allocation announcement by the Department. It is expected the allocation announcement will be on 1 January 2X12 for 60% of the groundwater entitlement. However, this is not in the control of Terra Firma.
Contingent water liabilities
• Water for urban use – potable (206 000 ML): Under the Terra Firma licence agreement with the Department, Terra Firma is required to supply potable water to Crowe. Terra Firma maintains water within its distribution pipes for the delivery of water to the city, but the actual delivery of the water is determined by the customers when they turn on the tap. It is estimated that 206 000 ML will be required to be delivered in the next reporting period if Stage 2 restrictions remain in place.
• Water for urban use (irrigation) – recycled (60 000 ML): Terra Firma has established a recycled water distribution system for the irrigation of parks and gardens. It is expected that 60 000 ML of recycled water will be delivered in the next reporting period. The amount of water delivered is subject to the customers of Crowe drawing water from the wastewater/recycled water system.
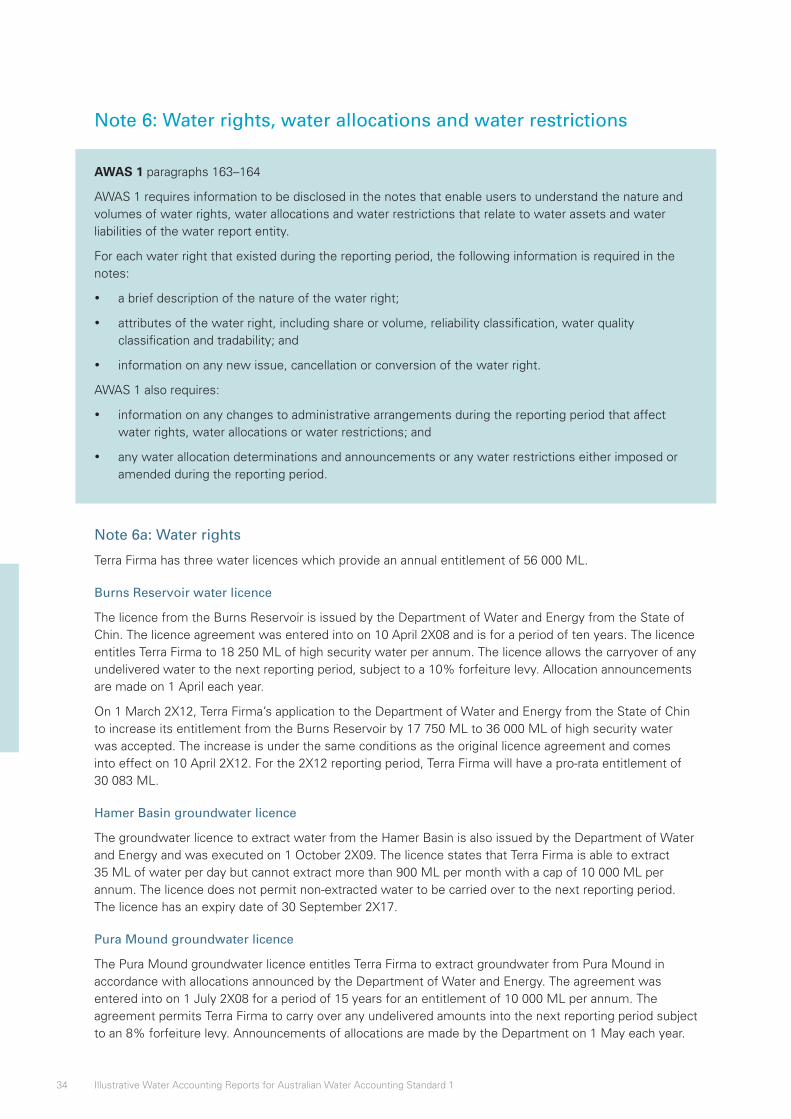
34 Illustrative Water Accounting Reports for Australian Water Accounting Standard 1
Note 6: Water rights, water allocations and water restrictions
AWAS 1 paragraphs 163–164
AWAS 1 requires information to be disclosed in the notes that enable users to understand the nature and volumes of water rights, water allocations and water restrictions that relate to water assets and water liabilities of the water report entity.
For each water right that existed during the reporting period, the following information is required in the notes:
• a brief description of the nature of the water right;
• attributes of the water right, including share or volume, reliability classification, water quality classification and tradability; and
• information on any new issue, cancellation or conversion of the water right.
AWAS 1 also requires:
• information on any changes to administrative arrangements during the reporting period that affect water rights, water allocations or water restrictions; and
• any water allocation determinations and announcements or any water restrictions either imposed or amended during the reporting period.
Note 6a: Water rights
Terra Firma has three water licences which provide an annual entitlement of 56 000 ML.
Burns Reservoir water licence
The licence from the Burns Reservoir is issued by the Department of Water and Energy from the State of Chin. The licence agreement was entered into on 10 April 2X08 and is for a period of ten years. The licence entitles Terra Firma to 18 250 ML of high security water per annum. The licence allows the carryover of any undelivered water to the next reporting period, subject to a 10% forfeiture levy. Allocation announcements are made on 1 April each year.
On 1 March 2X12, Terra Firma’s application to the Department of Water and Energy from the State of Chin to increase its entitlement from the Burns Reservoir by 17 750 ML to 36 000 ML of high security water was accepted. The increase is under the same conditions as the original licence agreement and comes into effect on 10 April 2X12. For the 2X12 reporting period, Terra Firma will have a pro-rata entitlement of 30 083 ML.
Hamer Basin groundwater licence
The groundwater licence to extract water from the Hamer Basin is also issued by the Department of Water and Energy and was executed on 1 October 2X09. The licence states that Terra Firma is able to extract 35 ML of water per day but cannot extract more than 900 ML per month with a cap of 10 000 ML per annum. The licence does not permit non-extracted water to be carried over to the next reporting period. The licence has an expiry date of 30 September 2X17.
Pura Mound groundwater licence
The Pura Mound groundwater licence entitles Terra Firma to extract groundwater from Pura Mound in accordance with allocations announced by the Department of Water and Energy. The agreement was entered into on 1 July 2X08 for a period of 15 years for an entitlement of 10 000 ML per annum. The agreement permits Terra Firma to carry over any undelivered amounts into the next reporting period subject to an 8% forfeiture levy. Announcements of allocations are made by the Department on 1 May each year.
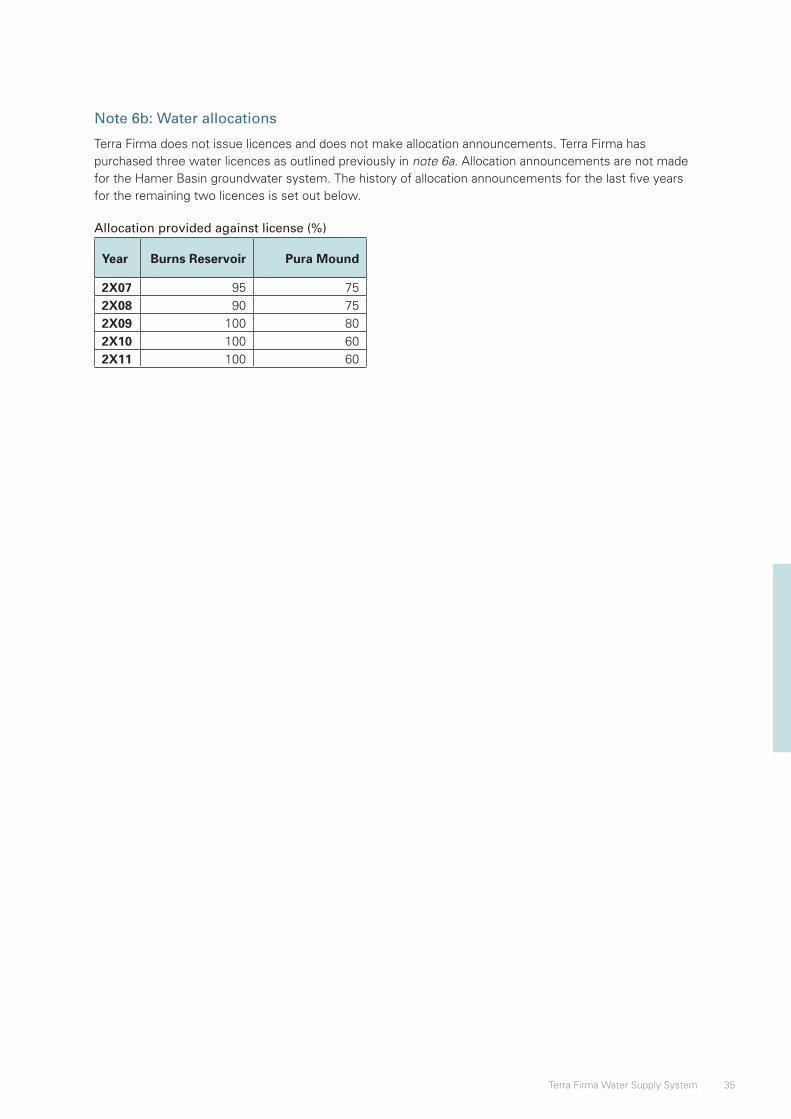
35Terra Firma Water Supply System
Note 6b: Water allocations
Terra Firma does not issue licences and does not make allocation announcements. Terra Firma has purchased three water licences as outlined previously in note 6a. Allocation announcements are not made for the Hamer Basin groundwater system. The history of allocation announcements for the last five years for the remaining two licences is set out below.
Allocation provided against license (%)
Year Burns Reservoir Pura Mound
2X07 95 752X08 90 752X09 100 802X10 100 602X11 100 60
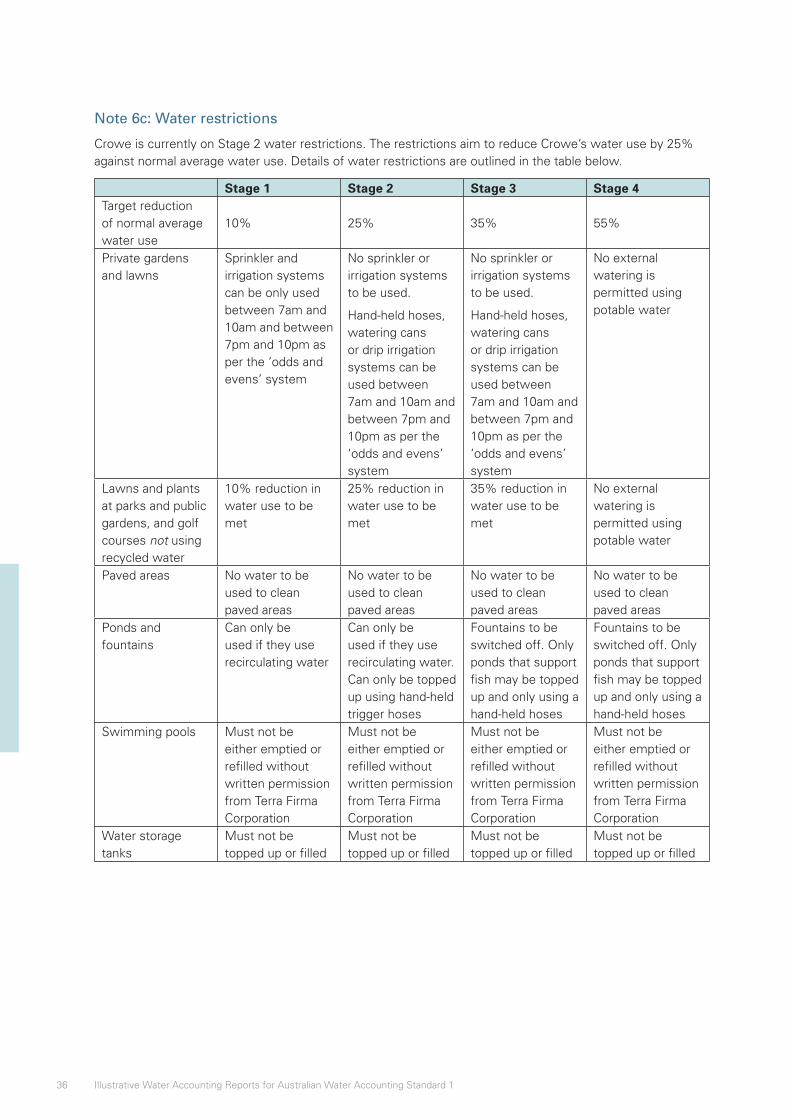
36 Illustrative Water Accounting Reports for Australian Water Accounting Standard 1
Note 6c: Water restrictions
Crowe is currently on Stage 2 water restrictions. The restrictions aim to reduce Crowe’s water use by 25% against normal average water use. Details of water restrictions are outlined in the table below.
Stage 1 Stage 2 Stage 3 Stage 4Target reduction of normal average water use
10% 25% 35% 55%
Private gardens and lawns
Sprinkler and irrigation systems can be only used between 7am and 10am and between 7pm and 10pm as per the ‘odds and evens’ system
No sprinkler or irrigation systems to be used.
Hand-held hoses, watering cans or drip irrigation systems can be used between 7am and 10am and between 7pm and 10pm as per the ‘odds and evens’ system
No sprinkler or irrigation systems to be used.
Hand-held hoses, watering cans or drip irrigation systems can be used between 7am and 10am and between 7pm and 10pm as per the ‘odds and evens’ system
No external watering is permitted using potable water
Lawns and plants at parks and public gardens, and golf courses not using recycled water
10% reduction in water use to be met
25% reduction in water use to be met
35% reduction in water use to be met
No external watering is permitted using potable water
Paved areas No water to be used to clean paved areas
No water to be used to clean paved areas
No water to be used to clean paved areas
No water to be used to clean paved areas
Ponds and fountains
Can only be used if they use recirculating water
Can only be used if they use recirculating water. Can only be topped up using hand-held trigger hoses
Fountains to be switched off. Only ponds that support fish may be topped up and only using a hand-held hoses
Fountains to be switched off. Only ponds that support fish may be topped up and only using a hand-held hoses
Swimming pools Must not be either emptied or refilled without written permission from Terra Firma Corporation
Must not be either emptied or refilled without written permission from Terra Firma Corporation
Must not be either emptied or refilled without written permission from Terra Firma Corporation
Must not be either emptied or refilled without written permission from Terra Firma Corporation
Water storage tanks
Must not be topped up or filled
Must not be topped up or filled
Must not be topped up or filled
Must not be topped up or filled
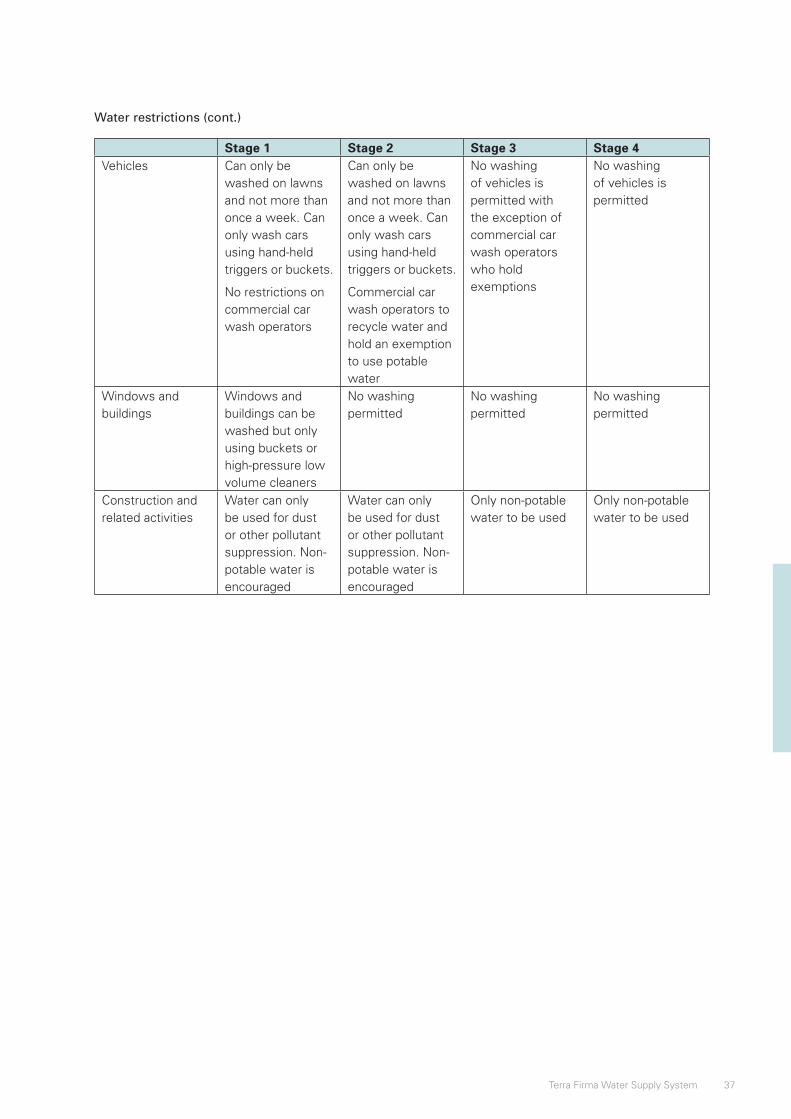
37Terra Firma Water Supply System
Water restrictions (cont.)
Stage 1 Stage 2 Stage 3 Stage 4Vehicles Can only be
washed on lawns and not more than once a week. Can only wash cars using hand-held triggers or buckets.
No restrictions on commercial car wash operators
Can only be washed on lawns and not more than once a week. Can only wash cars using hand-held triggers or buckets.
Commercial car wash operators to recycle water and hold an exemption to use potable water
No washing of vehicles is permitted with the exception of commercial car wash operators who hold exemptions
No washing of vehicles is permitted
Windows and buildings
Windows and buildings can be washed but only using buckets or high-pressure low volume cleaners
No washing permitted
No washing permitted
No washing permitted
Construction and related activities
Water can only be used for dust or other pollutant suppression. Non-potable water is encouraged
Water can only be used for dust or other pollutant suppression. Non-potable water is encouraged
Only non-potable water to be used
Only non-potable water to be used
38 Illustrative Water Accounting Reports for Australian Water Accounting Standard 1
Note 7: Water market activity
AWAS 1 paragraphs 165–167
Basis for Conclusions paragraphs B152–B153
AWAS 1 requires information to be disclosed in the notes that assists users to understand the nature and volumes of water market activity that occurred during the reporting period.
For each occurrence of water market activity that occurred during the reporting period, the following information is required to be disclosed:
• the number, volumes, origins and destinations of trades that have occurred during the reporting period for each type of right or claim to water of the water report entity; and
• any other information relevant to an understanding of water market activity. This would include, for example, details of externally-imposed limitations on the trading of water rights of the water report entity, compliance with those limitations and any changes to the limitations during the reporting period.
Terra Firma, under the licence issued from the Department of Water and Energy is responsible for the day-to-day management of the water resources within the Crowe water supply system. The water within the catchment is used solely for the urban supply to Crowe. The licence agreement does not permit trading of the water within the water supply system.
Terra Firma has purchased three water licences to receive water from outside the Crowe water supply system. Details of the licences are set out in note 6.
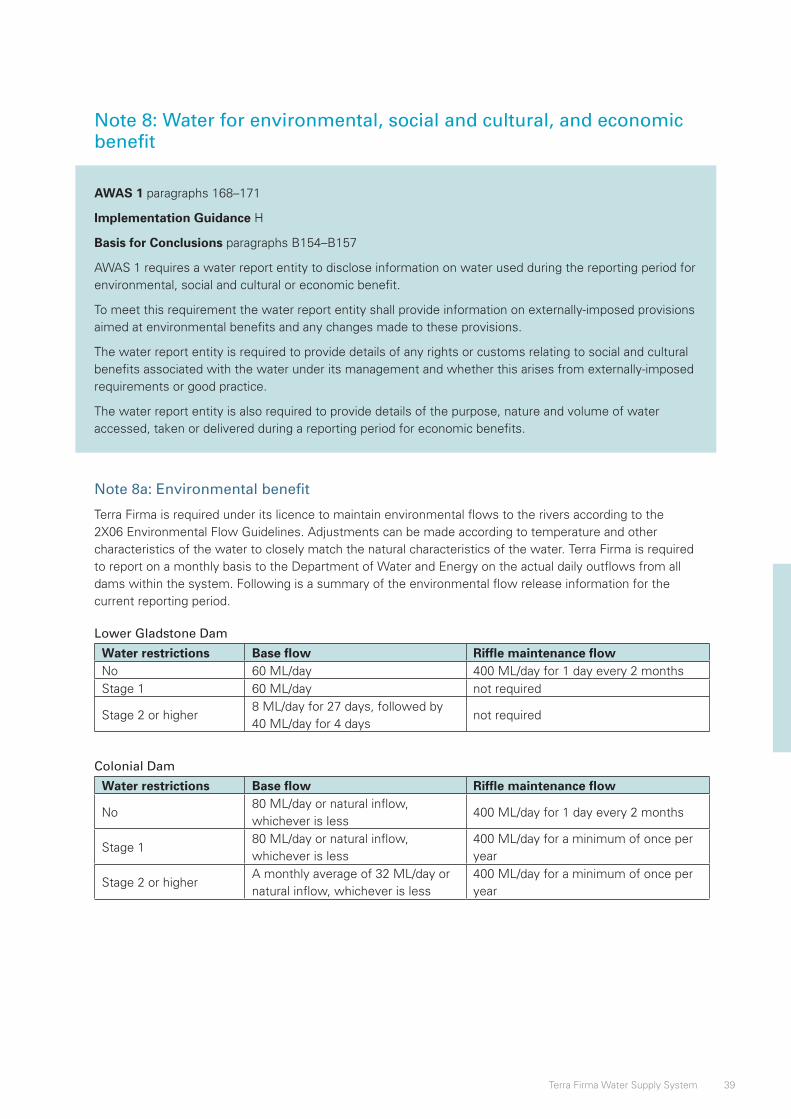
39Terra Firma Water Supply System
Note 8: Water for environmental, social and cultural, and economic benefit
AWAS 1 paragraphs 168–171
Implementation Guidance H
Basis for Conclusions paragraphs B154–B157
AWAS 1 requires a water report entity to disclose information on water used during the reporting period for environmental, social and cultural or economic benefit.
To meet this requirement the water report entity shall provide information on externally-imposed provisions aimed at environmental benefits and any changes made to these provisions.
The water report entity is required to provide details of any rights or customs relating to social and cultural benefits associated with the water under its management and whether this arises from externally-imposed requirements or good practice.
The water report entity is also required to provide details of the purpose, nature and volume of water accessed, taken or delivered during a reporting period for economic benefits.
Note 8a: Environmental benefit
Terra Firma is required under its licence to maintain environmental flows to the rivers according to the 2X06 Environmental Flow Guidelines. Adjustments can be made according to temperature and other characteristics of the water to closely match the natural characteristics of the water. Terra Firma is required to report on a monthly basis to the Department of Water and Energy on the actual daily outflows from all dams within the system. Following is a summary of the environmental flow release information for the current reporting period.
Lower Gladstone Dam
Water restrictions Base flow Riffle maintenance flowNo 60 ML/day 400 ML/day for 1 day every 2 monthsStage 1 60 ML/day not required
Stage 2 or higher8 ML/day for 27 days, followed by 40 ML/day for 4 days
not required
Colonial Dam
Water restrictions Base flow Riffle maintenance flow
No80 ML/day or natural inflow, whichever is less
400 ML/day for 1 day every 2 months
Stage 180 ML/day or natural inflow, whichever is less
400 ML/day for a minimum of once per year
Stage 2 or higherA monthly average of 32 ML/day or natural inflow, whichever is less
400 ML/day for a minimum of once per year
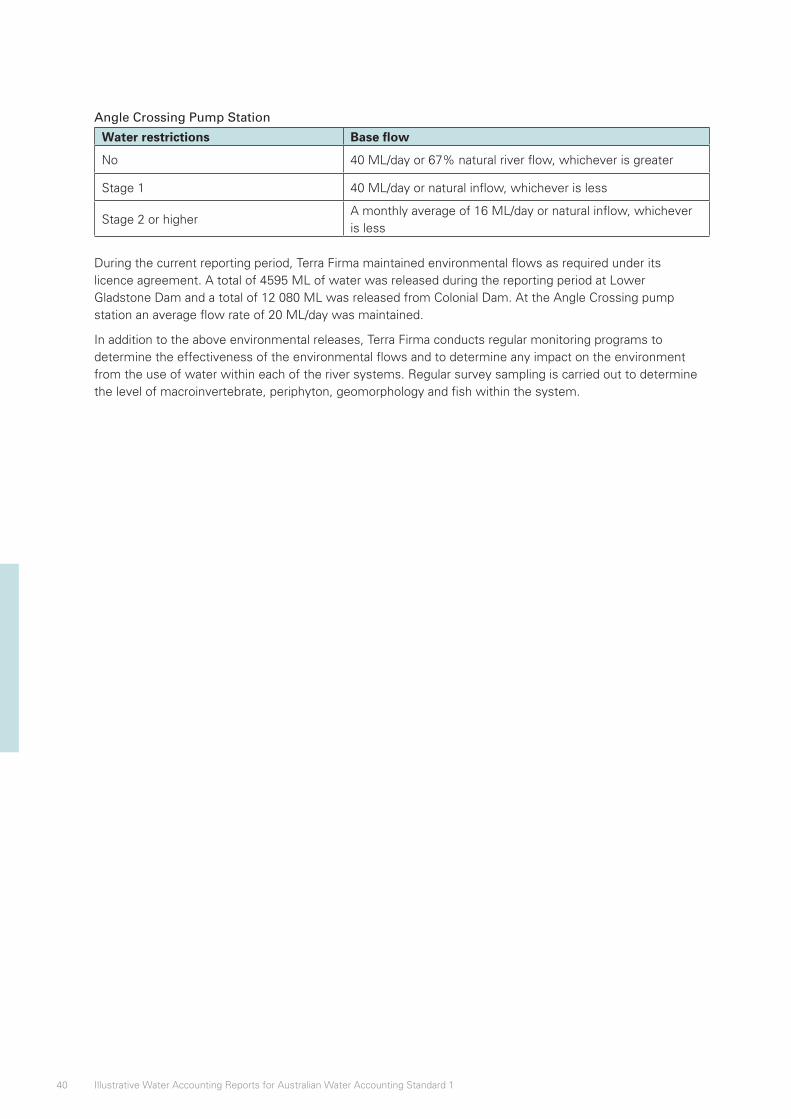
40 Illustrative Water Accounting Reports for Australian Water Accounting Standard 1
Angle Crossing Pump Station
Water restrictions Base flow
No 40 ML/day or 67% natural river flow, whichever is greater
Stage 1 40 ML/day or natural inflow, whichever is less
Stage 2 or higherA monthly average of 16 ML/day or natural inflow, whichever is less
During the current reporting period, Terra Firma maintained environmental flows as required under its licence agreement. A total of 4595 ML of water was released during the reporting period at Lower Gladstone Dam and a total of 12 080 ML was released from Colonial Dam. At the Angle Crossing pump station an average flow rate of 20 ML/day was maintained.
In addition to the above environmental releases, Terra Firma conducts regular monitoring programs to determine the effectiveness of the environmental flows and to determine any impact on the environment from the use of water within each of the river systems. Regular survey sampling is carried out to determine the level of macroinvertebrate, periphyton, geomorphology and fish within the system.
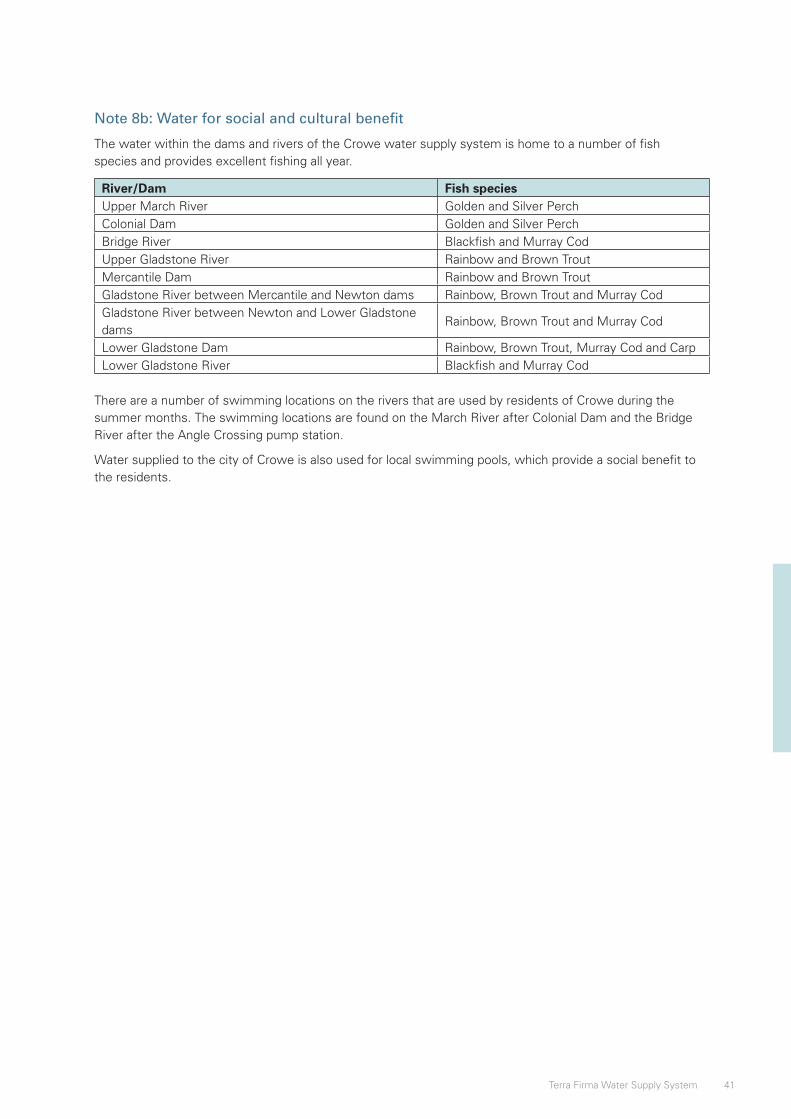
41Terra Firma Water Supply System
Note 8b: Water for social and cultural benefit
The water within the dams and rivers of the Crowe water supply system is home to a number of fish species and provides excellent fishing all year.
River/Dam Fish speciesUpper March River Golden and Silver PerchColonial Dam Golden and Silver PerchBridge River Blackfish and Murray CodUpper Gladstone River Rainbow and Brown TroutMercantile Dam Rainbow and Brown TroutGladstone River between Mercantile and Newton dams Rainbow, Brown Trout and Murray CodGladstone River between Newton and Lower Gladstone dams
Rainbow, Brown Trout and Murray Cod
Lower Gladstone Dam Rainbow, Brown Trout, Murray Cod and CarpLower Gladstone River Blackfish and Murray Cod
There are a number of swimming locations on the rivers that are used by residents of Crowe during the summer months. The swimming locations are found on the March River after Colonial Dam and the Bridge River after the Angle Crossing pump station.
Water supplied to the city of Crowe is also used for local swimming pools, which provide a social benefit to the residents.
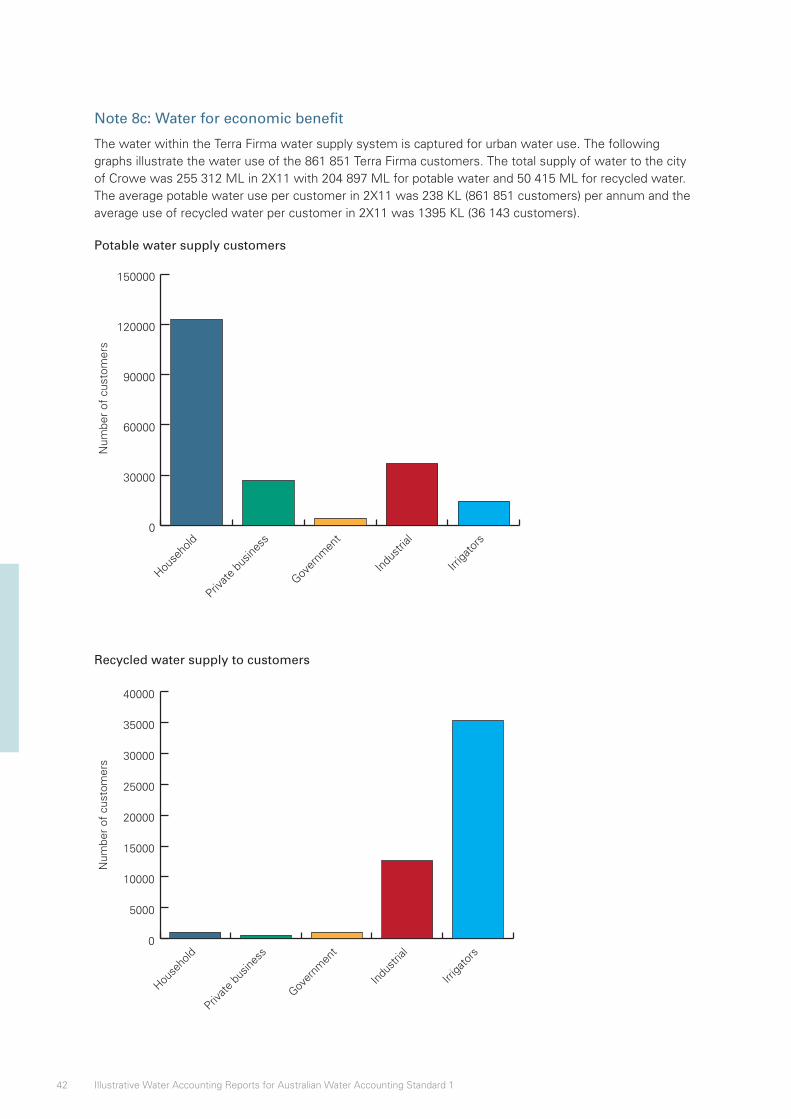
42 Illustrative Water Accounting Reports for Australian Water Accounting Standard 1
Note 8c: Water for economic benefit
The water within the Terra Firma water supply system is captured for urban water use. The following graphs illustrate the water use of the 861 851 Terra Firma customers. The total supply of water to the city of Crowe was 255 312 ML in 2X11 with 204 897 ML for potable water and 50 415 ML for recycled water. The average potable water use per customer in 2X11 was 238 KL (861 851 customers) per annum and the average use of recycled water per customer in 2X11 was 1395 KL (36 143 customers).
Potable water supply customers
0
30000
60000
90000
120000
150000
Irriga
tors
Indu
stria
l
Gover
nmen
t
Privat
e bu
sines
s
House
hold
Num
ber
of c
usto
mer
s
Recycled water supply to customers
0
5000
10000
15000
20000
25000
30000
35000
40000
Irriga
tors
Indu
stria
l
Gover
nmen
t
Privat
e bu
sines
s
House
hold
Num
ber
of c
usto
mer
s
43Terra Firma Water Supply System
Note 9: Segment information
AWAS 1 paragraphs 172–176
Basis for Conclusions paragraphs B158–B163
When information about discrete components of the water report entity would affect the decisions users make on the basis of the general purpose water accounting report, information that will allow the users to evaluate those discrete components shall be disclosed.
Segments are identified by considering the physical, operational or administrative aspects of the water report entity. The identification of segments shall be retained from one reporting period to the next unless a change provides information that is more useful to users of general purpose water accounting reports.
Terra Firma is divided into three segments based on its operating divisions. The three divisions are all operated under the same corporate/administrative structure. For information on the corporate/administrative structure, please refer to the Contextual Statement. Information on the climatic conditions experienced by the three divisions can also be found in the Contextual Statement.
The operating divisions are:
• water distribution system/urban distribution system – encompasses both the freshwater storage dams and the urban supply system to the city of Crowe;
• wastewater/recycling water system – treats wastewater for release back into the environment and supplies recycled water for use on the city of Crowe’s parks and recreational areas; and
• desalination plant – converts sea water into potable water for consumption in the city of Crowe.
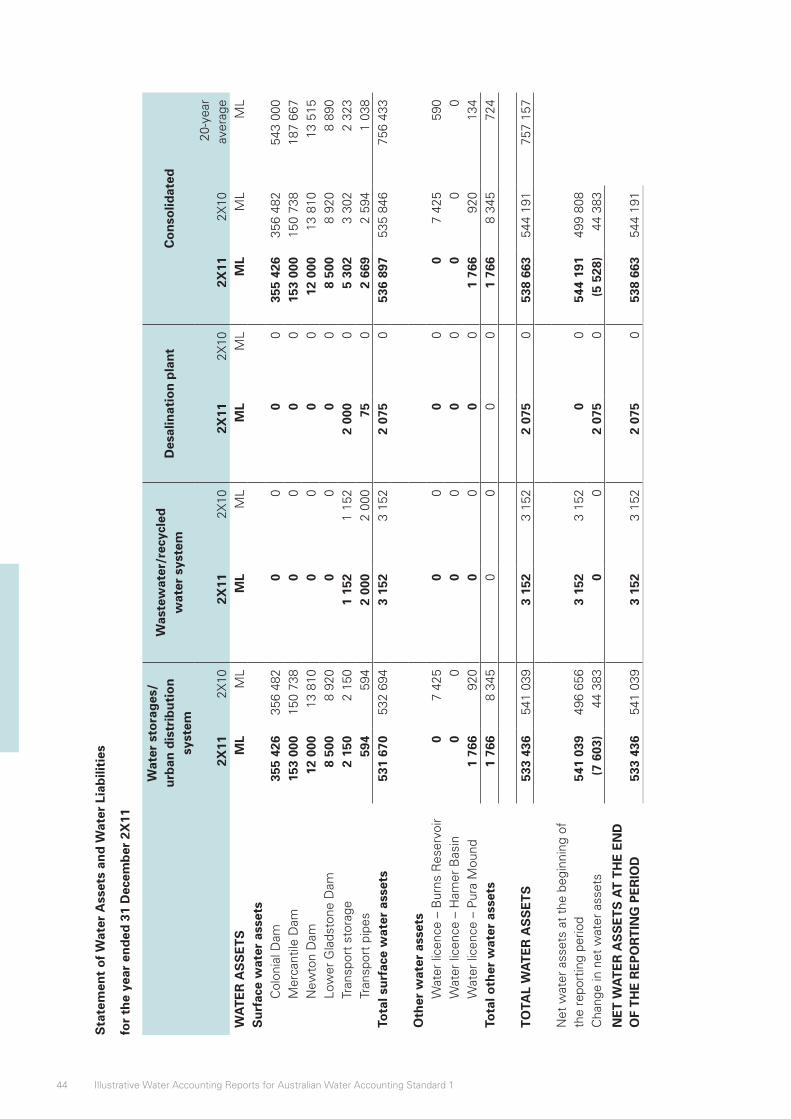
44 Illustrative Water Accounting Reports for Australian Water Accounting Standard 1
Sta
tem
ent
of
Wat
er A
sset
s an
d W
ater
Lia
bili
ties
for
the
year
en
ded
31
Dec
emb
er 2
X11
Wat
er s
tora
ges
/u
rban
dis
trib
uti
on
sy
stem
Was
tew
ater
/rec
ycle
d
wat
er s
yste
mD
esal
inat
ion
pla
nt
Co
nso
lidat
ed
2X11
2X10
2X11
2X10
2X11
2X10
2X11
2X10
20-y
ear
aver
age
WA
TE
R A
SS
ET
SM
LM
LM
LM
LM
LM
LM
LM
LM
LS
urf
ace
wat
er a
sset
s
Col
onia
l Dam
355
426
356
482
00
00
355
426
356
482
543
000
Mer
cant
ile D
am15
3 00
015
0 73
80
00
015
3 00
015
0 73
818
7 66
7N
ewto
n D
am12
000
13 8
100
00
012
000
13 8
1013
515
Low
er G
lads
tone
Dam
8 50
08
920
00
00
8 50
08
920
8 89
0Tr
ansp
ort
stor
age
2 15
02
150
1 15
21
152
2 00
0 0
5 30
23
302
2 32
3Tr
ansp
ort
pipe
s 5
94 5
942
000
2 00
0 7
5 0
2 66
92
594
1 03
8To
tal s
urf
ace
wat
er a
sset
s53
1 67
053
2 69
43
152
3 15
22
075
053
6 89
753
5 84
675
6 43
3
Oth
er w
ater
ass
ets
W
ater
lice
nce
– B
urns
Res
ervo
ir 0
7 42
50
00
0 0
7 42
5 5
90W
ater
lice
nce
– H
amer
Bas
in 0
00
00
0 0
0 0
Wat
er li
cenc
e –
Pur
a M
ound
1 76
6 9
200
00
01
766
920
134
Tota
l oth
er w
ater
ass
ets
1 76
68
345
00
00
1 76
68
345
724
T
OTA
L W
AT
ER
AS
SE
TS
533
436
541
039
3 15
23
152
2 07
5 0
538
663
544
191
757
157
N
et w
ater
ass
ets
at t
he b
egin
ning
of
the
repo
rtin
g pe
riod
541
039
496
656
3 15
23
152
0 0
544
191
499
808
Cha
nge
in n
et w
ater
ass
ets
(7 6
03)
44 3
83 0
02
075
0(5
528
)44
383
NE
T W
AT
ER
AS
SE
TS
AT
TH
E E
ND
O
F T
HE
RE
PO
RT
ING
PE
RIO
D53
3 43
654
1 03
93
152
3 15
22
075
053
8 66
354
4 19
1
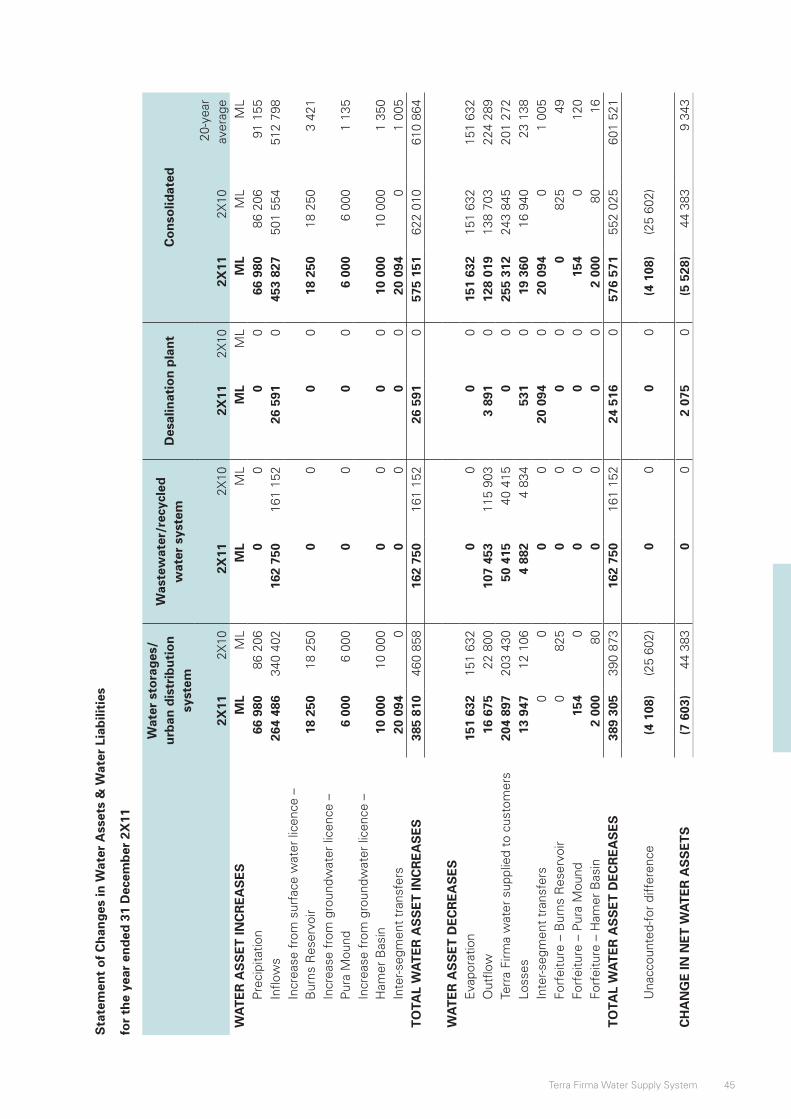
45Terra Firma Water Supply System
Sta
tem
ent
of
Wat
er A
sset
s an
d W
ater
Lia
bili
ties
for
the
year
en
ded
31
Dec
emb
er 2
X11
Wat
er s
tora
ges
/u
rban
dis
trib
uti
on
sy
stem
Was
tew
ater
/rec
ycle
d
wat
er s
yste
mD
esal
inat
ion
pla
nt
Co
nso
lidat
ed
2X11
2X10
2X11
2X10
2X11
2X10
2X11
2X10
20-y
ear
aver
age
WA
TE
R A
SS
ET
SM
LM
LM
LM
LM
LM
LM
LM
LM
LS
urf
ace
wat
er a
sset
s
Col
onia
l Dam
355
426
356
482
00
00
355
426
356
482
543
000
Mer
cant
ile D
am15
3 00
015
0 73
80
00
015
3 00
015
0 73
818
7 66
7N
ewto
n D
am12
000
13 8
100
00
012
000
13 8
1013
515
Low
er G
lads
tone
Dam
8 50
08
920
00
00
8 50
08
920
8 89
0Tr
ansp
ort
stor
age
2 15
02
150
1 15
21
152
2 00
0 0
5 30
23
302
2 32
3Tr
ansp
ort
pipe
s 5
94 5
942
000
2 00
0 7
5 0
2 66
92
594
1 03
8To
tal s
urf
ace
wat
er a
sset
s53
1 67
053
2 69
43
152
3 15
22
075
053
6 89
753
5 84
675
6 43
3
Oth
er w
ater
ass
ets
W
ater
lice
nce
– B
urns
Res
ervo
ir 0
7 42
50
00
0 0
7 42
5 5
90W
ater
lice
nce
– H
amer
Bas
in 0
00
00
0 0
0 0
Wat
er li
cenc
e –
Pur
a M
ound
1 76
6 9
200
00
01
766
920
134
Tota
l oth
er w
ater
ass
ets
1 76
68
345
00
00
1 76
68
345
724
T
OTA
L W
AT
ER
AS
SE
TS
533
436
541
039
3 15
23
152
2 07
5 0
538
663
544
191
757
157
N
et w
ater
ass
ets
at t
he b
egin
ning
of
the
repo
rtin
g pe
riod
541
039
496
656
3 15
23
152
0 0
544
191
499
808
Cha
nge
in n
et w
ater
ass
ets
(7 6
03)
44 3
83 0
02
075
0(5
528
)44
383
NE
T W
AT
ER
AS
SE
TS
AT
TH
E E
ND
O
F T
HE
RE
PO
RT
ING
PE
RIO
D53
3 43
654
1 03
93
152
3 15
22
075
053
8 66
354
4 19
1
Sta
tem
ent
of
Ch
ang
es in
Wat
er A
sset
s &
Wat
er L
iab
iliti
es
for
the
year
en
ded
31
Dec
emb
er 2
X11
Wat
er s
tora
ges
/u
rban
dis
trib
uti
on
sy
stem
Was
tew
ater
/rec
ycle
d
wat
er s
yste
mD
esal
inat
ion
pla
nt
Co
nso
lidat
ed
2X11
2X10
2X11
2X10
2X11
2X10
2X11
2X10
20-y
ear
aver
age
WA
TE
R A
SS
ET
INC
RE
AS
ES
ML
ML
ML
ML
ML
ML
ML
ML
ML
Pre
cipi
tatio
n66
980
86 2
060
00
066
980
86 2
0691
155
Inflo
ws
264
486
340
402
162
750
161
152
26 5
91 0
453
827
501
554
512
798
Incr
ease
fro
m s
urfa
ce w
ater
lice
nce
– B
urns
Res
ervo
ir18
250
18 2
500
00
018
250
18 2
503
421
Incr
ease
fro
m g
roun
dwat
er li
cenc
e –
P
ura
Mou
nd6
000
6 00
00
00
06
000
6 00
01
135
Incr
ease
fro
m g
roun
dwat
er li
cenc
e –
Ham
er B
asin
10 0
0010
000
00
00
10 0
0010
000
1 35
0In
ter-s
egm
ent
tran
sfer
s20
094
00
00
020
094
01
005
TO
TAL
WA
TE
R A
SS
ET
INC
RE
AS
ES
385
810
460
858
162
750
161
152
26 5
91 0
575
151
622
010
610
864
W
AT
ER
AS
SE
T D
EC
RE
AS
ES
E
vapo
ratio
n15
1 63
215
1 63
20
00
015
1 63
215
1 63
215
1 63
2O
utflo
w16
675
22 8
0010
7 45
311
5 90
33
891
012
8 01
913
8 70
322
4 28
9Te
rra
Firm
a w
ater
sup
plie
d to
cus
tom
ers
204
897
203
430
50 4
1540
415
00
255
312
243
845
201
272
Loss
es13
947
12 1
064
882
4 83
4 5
31 0
19 3
6016
940
23 1
38In
ter-s
egm
ent
tran
sfer
s0
00
020
094
020
094
01
005
Forf
eitu
re –
Bur
ns R
eser
voir
082
50
00
0 0
825
49
Forf
eitu
re –
Pur
a M
ound
154
00
00
0 1
54 0
120
Forf
eitu
re –
Ham
er B
asin
2 00
0 8
00
00
02
000
80
16
TO
TAL
WA
TE
R A
SS
ET
DE
CR
EA
SE
S38
9 30
539
0 87
316
2 75
016
1 15
224
516
057
6 57
155
2 02
560
1 52
1
Una
ccou
nted
-for
diff
eren
ce(4
108
)(2
5 60
2)0
00
0(4
108
)(2
5 60
2)
CH
AN
GE
IN N
ET
WA
TE
R A
SS
ET
S(7
603
)44
383
0 0
2 07
5 0
(5 5
28)
44 3
839
343
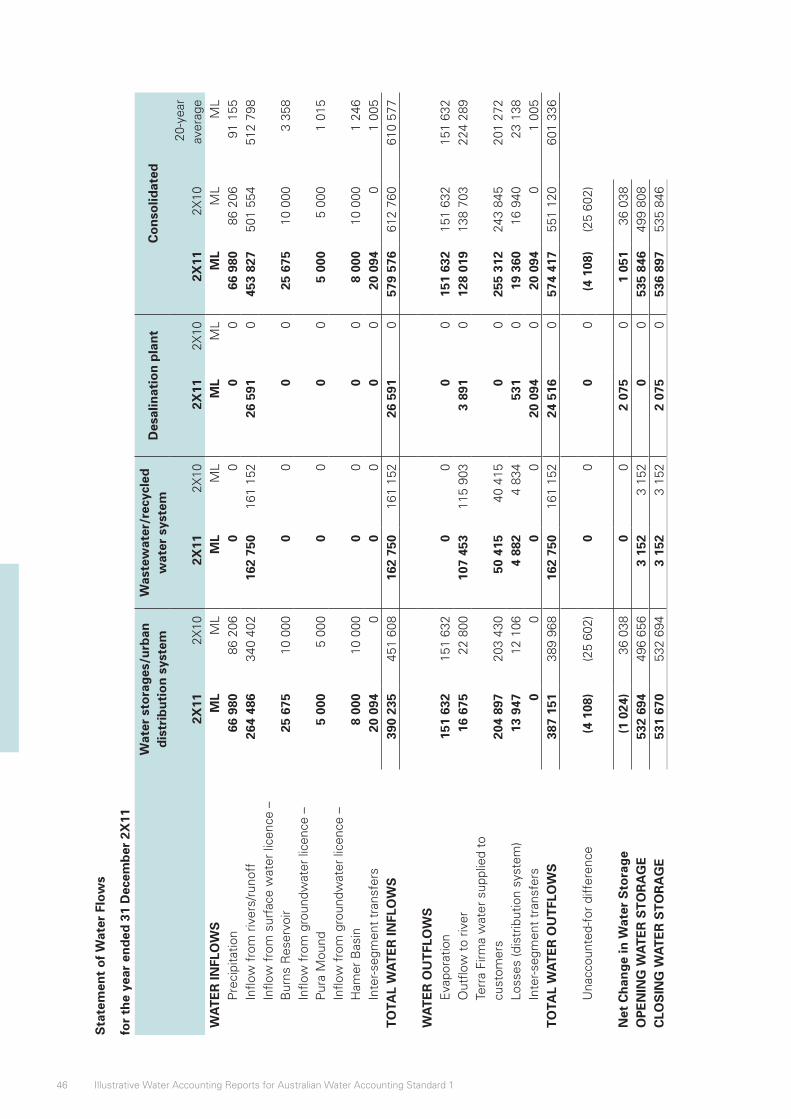
46 Illustrative Water Accounting Reports for Australian Water Accounting Standard 1
Sta
tem
ent
of
Wat
er F
low
s
for
the
year
en
ded
31
Dec
emb
er 2
X11
Wat
er s
tora
ges
/urb
an
dis
trib
uti
on
sys
tem
Was
tew
ater
/rec
ycle
d
wat
er s
yste
mD
esal
inat
ion
pla
nt
Co
nso
lidat
ed
2X11
2X10
2X11
2X10
2X11
2X10
2X11
2X10
20-y
ear
aver
age
WA
TE
R IN
FLO
WS
ML
ML
ML
ML
ML
ML
ML
ML
ML
Pre
cipi
tatio
n66
980
86 2
06 0
0 0
066
980
86 2
0691
155
Inflo
w f
rom
riv
ers/
runo
ff26
4 48
634
0 40
216
2 75
016
1 15
226
591
045
3 82
750
1 55
451
2 79
8In
flow
fro
m s
urfa
ce w
ater
lice
nce
– B
urns
Res
ervo
ir25
675
10 0
00 0
0 0
025
675
10 0
003
358
Inflo
w f
rom
gro
undw
ater
lice
nce
–
Pur
a M
ound
5 00
05
000
0 0
0 0
5 00
05
000
1 01
5In
flow
fro
m g
roun
dwat
er li
cenc
e –
Ham
er B
asin
8 00
010
000
0 0
0 0
8 00
010
000
1 24
6In
ter-s
egm
ent
tran
sfer
s20
094
0 0
0 0
020
094
01
005
TO
TAL
WA
TE
R IN
FLO
WS
390
235
451
608
162
750
161
152
26 5
91 0
579
576
612
760
610
577
W
AT
ER
OU
TFL
OW
S
Eva
pora
tion
151
632
151
632
0 0
0 0
151
632
151
632
151
632
Out
flow
to
river
16 6
7522
800
107
453
115
903
3 89
1 0
128
019
138
703
224
289
Terr
a Fi
rma
wat
er s
uppl
ied
to
cust
omer
s20
4 89
720
3 43
050
415
40 4
15 0
025
5 31
224
3 84
520
1 27
2Lo
sses
(dis
trib
utio
n sy
stem
)13
947
12 1
064
882
4 83
4 5
31 0
19 3
6016
940
23 1
38In
ter-s
egm
ent
tran
sfer
s 0
0 0
020
094
020
094
01
005
TO
TAL
WA
TE
R O
UT
FLO
WS
387
151
389
968
162
750
161
152
24 5
16 0
574
417
551
120
601
336
U
nacc
ount
ed-f
or d
iffer
ence
(4 1
08)
(25
602)
0 0
0 0
(4 1
08)
(25
602)
N
et C
han
ge
in W
ater
Sto
rag
e(1
024
)36
038
0 0
2 07
5 0
1 05
136
038
OP
EN
ING
WA
TE
R S
TO
RA
GE
532
694
496
656
3 15
23
152
0 0
535
846
499
808
CLO
SIN
G W
AT
ER
ST
OR
AG
E53
1 67
053
2 69
43
152
3 15
22
075
053
6 89
753
5 84
6
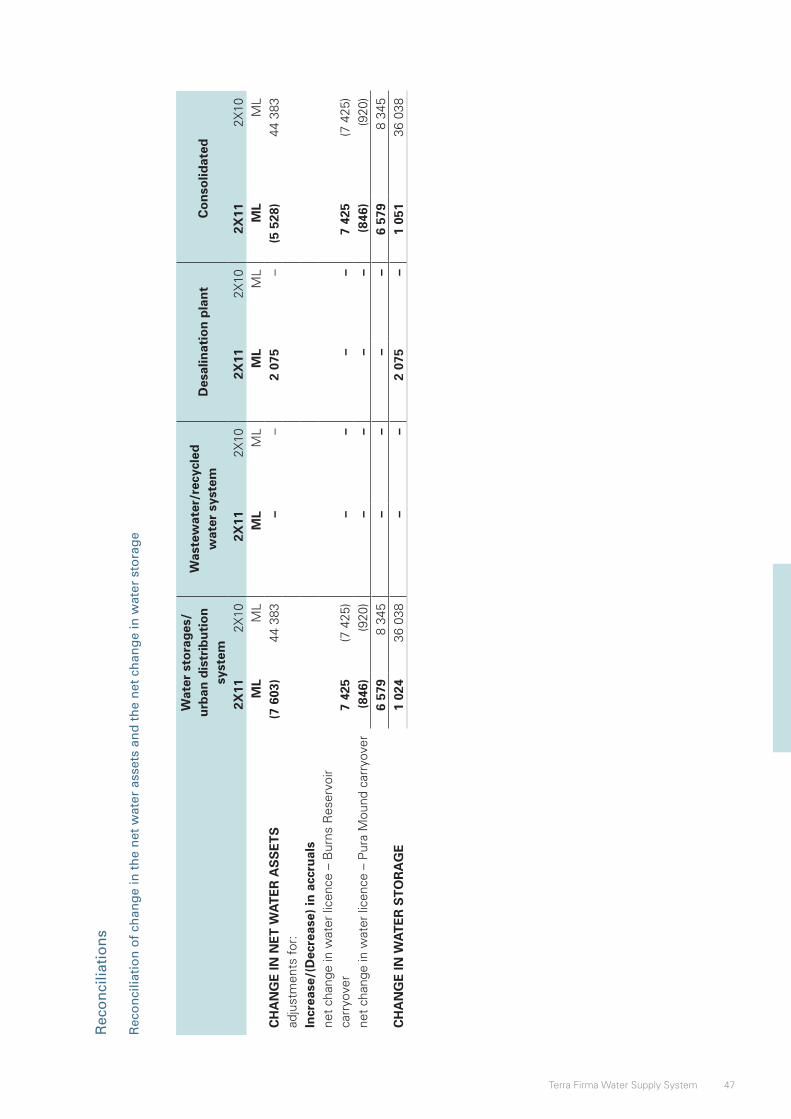
47Terra Firma Water Supply System
Sta
tem
ent
of
Wat
er F
low
s
for
the
year
en
ded
31
Dec
emb
er 2
X11
Wat
er s
tora
ges
/urb
an
dis
trib
uti
on
sys
tem
Was
tew
ater
/rec
ycle
d
wat
er s
yste
mD
esal
inat
ion
pla
nt
Co
nso
lidat
ed
2X11
2X10
2X11
2X10
2X11
2X10
2X11
2X10
20-y
ear
aver
age
WA
TE
R IN
FLO
WS
ML
ML
ML
ML
ML
ML
ML
ML
ML
Pre
cipi
tatio
n66
980
86 2
06 0
0 0
066
980
86 2
0691
155
Inflo
w f
rom
riv
ers/
runo
ff26
4 48
634
0 40
216
2 75
016
1 15
226
591
045
3 82
750
1 55
451
2 79
8In
flow
fro
m s
urfa
ce w
ater
lice
nce
– B
urns
Res
ervo
ir25
675
10 0
00 0
0 0
025
675
10 0
003
358
Inflo
w f
rom
gro
undw
ater
lice
nce
–
Pur
a M
ound
5 00
05
000
0 0
0 0
5 00
05
000
1 01
5In
flow
fro
m g
roun
dwat
er li
cenc
e –
Ham
er B
asin
8 00
010
000
0 0
0 0
8 00
010
000
1 24
6In
ter-s
egm
ent
tran
sfer
s20
094
0 0
0 0
020
094
01
005
TO
TAL
WA
TE
R IN
FLO
WS
390
235
451
608
162
750
161
152
26 5
91 0
579
576
612
760
610
577
W
AT
ER
OU
TFL
OW
S
Eva
pora
tion
151
632
151
632
0 0
0 0
151
632
151
632
151
632
Out
flow
to
river
16 6
7522
800
107
453
115
903
3 89
1 0
128
019
138
703
224
289
Terr
a Fi
rma
wat
er s
uppl
ied
to
cust
omer
s20
4 89
720
3 43
050
415
40 4
15 0
025
5 31
224
3 84
520
1 27
2Lo
sses
(dis
trib
utio
n sy
stem
)13
947
12 1
064
882
4 83
4 5
31 0
19 3
6016
940
23 1
38In
ter-s
egm
ent
tran
sfer
s 0
0 0
020
094
020
094
01
005
TO
TAL
WA
TE
R O
UT
FLO
WS
387
151
389
968
162
750
161
152
24 5
16 0
574
417
551
120
601
336
U
nacc
ount
ed-f
or d
iffer
ence
(4 1
08)
(25
602)
0 0
0 0
(4 1
08)
(25
602)
N
et C
han
ge
in W
ater
Sto
rag
e(1
024
)36
038
0 0
2 07
5 0
1 05
136
038
OP
EN
ING
WA
TE
R S
TO
RA
GE
532
694
496
656
3 15
23
152
0 0
535
846
499
808
CLO
SIN
G W
AT
ER
ST
OR
AG
E53
1 67
053
2 69
43
152
3 15
22
075
053
6 89
753
5 84
6
Rec
on
cilia
tio
ns
Rec
on
cilia
tio
n o
f ch
ang
e in
th
e n
et w
ater
ass
ets
and
th
e n
et c
han
ge
in w
ater
sto
rag
e
Wat
er s
tora
ges
/u
rban
dis
trib
uti
on
sy
stem
Was
tew
ater
/rec
ycle
d
wat
er s
yste
mD
esal
inat
ion
pla
nt
Co
nso
lidat
ed
2X11
2X10
2X11
2X10
2X11
2X10
2X11
2X10
ML
ML
ML
ML
ML
ML
ML
ML
CH
AN
GE
IN N
ET
WA
TE
R A
SS
ET
S(7
603
) 4
4 38
3–
–2
075
– (5
528
) 4
4 38
3ad
just
men
ts f
or:
Incr
ease
/(D
ecre
ase)
in a
ccru
als
net
chan
ge in
wat
er li
cenc
e –
Bur
ns R
eser
voir
carr
yove
r7
425
(7 4
25)
––
––
7 42
5(7
425
)ne
t ch
ange
in w
ater
lice
nce
– P
ura
Mou
nd c
arry
over
(846
) (9
20)
––
––
(846
) (9
20)
6 57
98
345
––
––
6 57
9 8
345
CH
AN
GE
IN W
AT
ER
ST
OR
AG
E1
024
36 0
38–
– 2
075
– 1
051
36
038
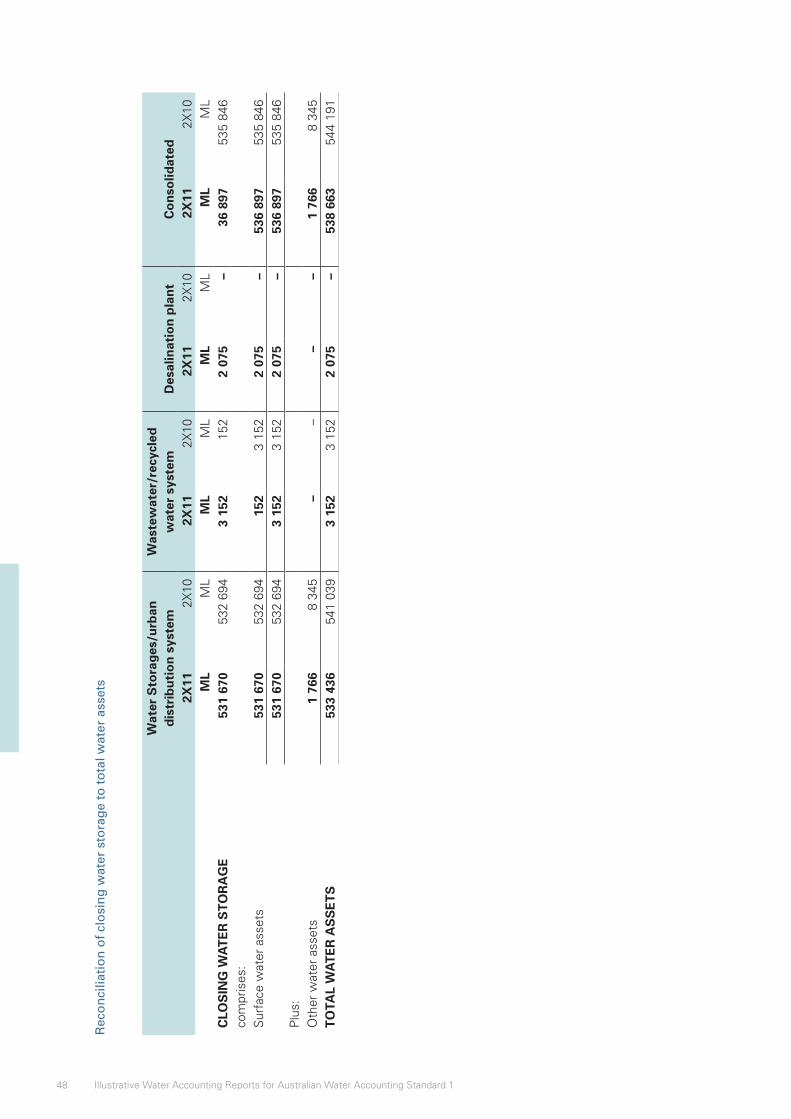
48 Illustrative Water Accounting Reports for Australian Water Accounting Standard 1
Rec
on
cilia
tio
n o
f cl
osi
ng
wat
er s
tora
ge
to t
ota
l wat
er a
sset
s
Wat
er S
tora
ges
/urb
an
dis
trib
uti
on
sys
tem
Was
tew
ater
/rec
ycle
d
wat
er s
yste
mD
esal
inat
ion
pla
nt
Co
nso
lidat
ed2X
112X
102X
112X
102X
112X
102X
112X
10M
LM
LM
LM
LM
LM
LM
LM
LC
LOS
ING
WA
TE
R S
TO
RA
GE
531
670
532
694
3 1
5215
22
075
–36
897
535
846
com
pris
es:
Sur
face
wat
er a
sset
s53
1 67
0 5
32 6
9415
23
152
2 07
5–
536
897
535
846
531
670
532
694
3 1
523
152
2 0
75–
536
897
535
846
Plu
s:O
ther
wat
er a
sset
s1
766
8 3
45–
––
–1
766
8 3
45T
OTA
L W
AT
ER
AS
SE
TS
533
436
541
039
3 15
2 3
152
2 07
5–
538
663
544
191
Illustrative Water Accounting Report
Minton Environmental Water Holdings
General Purpose Water Accounting Report
30 June 2X11
Prepared by Minton Environmental Water Holder
An illustration of an Australian general purpose water accounting report for a fictitious water report entity

1Minton Environmental Water Holdings
ContentsPage
Glossary ........................................................................................................................................................2Contextual Statement .................................................................................................................................3
Description of the water report entity .....................................................................................................4Administrative information ......................................................................................................................6
Accountability Statement .........................................................................................................................15Assurance of water accounting report ....................................................................................................16Water Accounting Statements .................................................................................................................17
Statement of Water Assets and Water Liabilities .................................................................................17Statement of Changes in Water Assets and Water Liabilities ..............................................................19Statement of Water Flows ....................................................................................................................21
Notes ..........................................................................................................................................................22Note 1: Significant water accounting policies .......................................................................................23Note 2: Information supporting items presented in the water accounting statements ........................24Note 3: Other disclosures .....................................................................................................................28
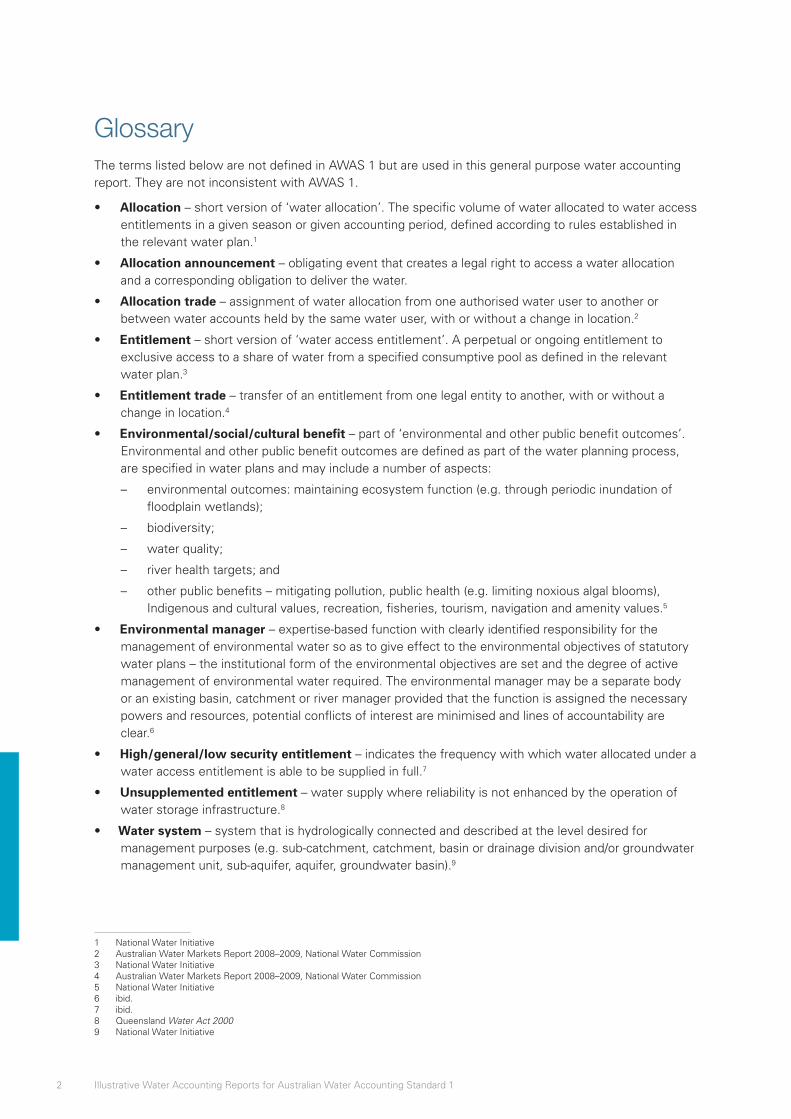
2 Illustrative Water Accounting Reports for Australian Water Accounting Standard 1
GlossaryThe terms listed below are not defined in AWAS 1 but are used in this general purpose water accounting report. They are not inconsistent with AWAS 1.
• Allocation – short version of ‘water allocation’. The specific volume of water allocated to water access entitlements in a given season or given accounting period, defined according to rules established in the relevant water plan.1
• Allocation announcement – obligating event that creates a legal right to access a water allocation and a corresponding obligation to deliver the water.
• Allocation trade – assignment of water allocation from one authorised water user to another or between water accounts held by the same water user, with or without a change in location.2
• Entitlement – short version of ‘water access entitlement’. A perpetual or ongoing entitlement to exclusive access to a share of water from a specified consumptive pool as defined in the relevant water plan.3
• Entitlement trade – transfer of an entitlement from one legal entity to another, with or without a change in location.4
• Environmental/social/cultural benefit – part of ‘environmental and other public benefit outcomes’. Environmental and other public benefit outcomes are defined as part of the water planning process, are specified in water plans and may include a number of aspects:
– environmental outcomes: maintaining ecosystem function (e.g. through periodic inundation of floodplain wetlands);
– biodiversity;
– water quality;
– river health targets; and
– other public benefits – mitigating pollution, public health (e.g. limiting noxious algal blooms), Indigenous and cultural values, recreation, fisheries, tourism, navigation and amenity values.5
• Environmental manager – expertise-based function with clearly identified responsibility for the management of environmental water so as to give effect to the environmental objectives of statutory water plans – the institutional form of the environmental objectives are set and the degree of active management of environmental water required. The environmental manager may be a separate body or an existing basin, catchment or river manager provided that the function is assigned the necessary powers and resources, potential conflicts of interest are minimised and lines of accountability are clear.6
• High/general/low security entitlement – indicates the frequency with which water allocated under a water access entitlement is able to be supplied in full.7
• Unsupplemented entitlement – water supply where reliability is not enhanced by the operation of water storage infrastructure.8
• Water system – system that is hydrologically connected and described at the level desired for management purposes (e.g. sub-catchment, catchment, basin or drainage division and/or groundwater management unit, sub-aquifer, aquifer, groundwater basin).9
1 National Water Initiative2 Australian Water Markets Report 2008–2009, National Water Commission3 National Water Initiative4 Australian Water Markets Report 2008–2009, National Water Commission5 National Water Initiative6 ibid.7 ibid.8 Queensland Water Act 20009 National Water Initiative
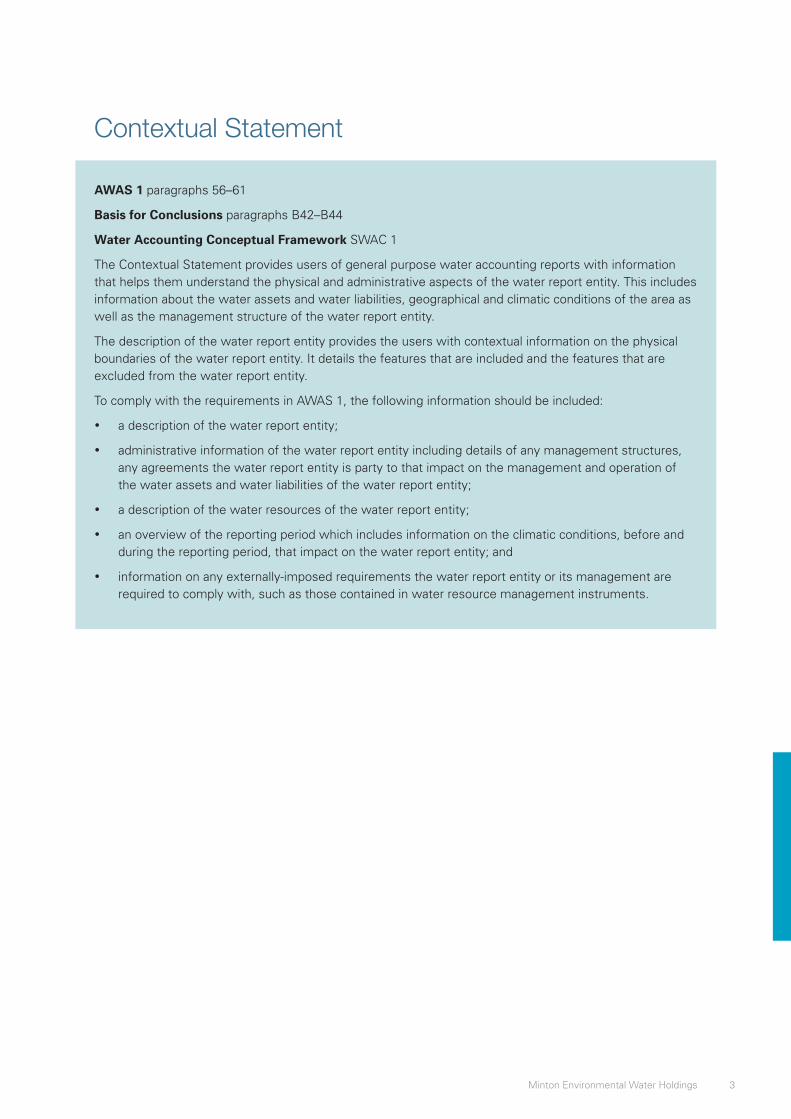
3Minton Environmental Water Holdings
Contextual Statement
AWAS 1 paragraphs 56–61
Basis for Conclusions paragraphs B42–B44
Water Accounting Conceptual Framework SWAC 1
The Contextual Statement provides users of general purpose water accounting reports with information that helps them understand the physical and administrative aspects of the water report entity. This includes information about the water assets and water liabilities, geographical and climatic conditions of the area as well as the management structure of the water report entity.
The description of the water report entity provides the users with contextual information on the physical boundaries of the water report entity. It details the features that are included and the features that are excluded from the water report entity.
To comply with the requirements in AWAS 1, the following information should be included:
• a description of the water report entity;
• administrative information of the water report entity including details of any management structures, any agreements the water report entity is party to that impact on the management and operation of the water assets and water liabilities of the water report entity;
• a description of the water resources of the water report entity;
• an overview of the reporting period which includes information on the climatic conditions, before and during the reporting period, that impact on the water report entity; and
• information on any externally-imposed requirements the water report entity or its management are required to comply with, such as those contained in water resource management instruments.
4 Illustrative Water Accounting Reports for Australian Water Accounting Standard 1
Description of the water report entityThe water report entity for which this general purpose water accounting report is prepared is the Minton Environmental Water Holdings (the Holdings). The manager and holder of the environmental water entitlements which comprise the Holdings is the Minton Environmental Water Holder (MEWH) whose role is defined by the Minton Environment Act 2X06. The MEWH is an officer of the Minton State Department.
The scope of activity of MEWH is limited by the sources of the environmental water entitlements in the Holdings and the points of application of the environmental watering which MEWH approves. The water report entity excludes those aspects of water management not controlled by MEWH.
According to the Minton Environmental Act 2X06, the responsibilities of MEWH are to achieve environmental watering objectives by:
• managing the Holdings of environmental water entitlements and the associated allocations;
• making allocations available for environmental watering; and
• cooperating with natural resource and water system managers, and local community stakeholders.
The environmental water entitlements used for environmental watering are held by MEWH on behalf of the Minton State Government. They were recovered through purchase of water entitlements, creation of new entitlements by funding water saving infrastructure and irrigation improvements, and some donations of water entitlements.
Physical description of the Holdings
The environmental water entitlements are held in four water systems of the State of Minton. Of these systems, three are hydrologically connected to each other (the ‘connected water systems’) and one, the Guard water system, is hydrologically separated from the connected water systems by a line of hills and an aquitard. The entitlements and allocations of the connected water systems can be traded within and between the connected systems; however, they cannot be traded with the separate Guard water system.
Connected water systems:
• Menace water system
• Wallaroo water system
• Baxter water system.
Separate water system:
• Guard water system.
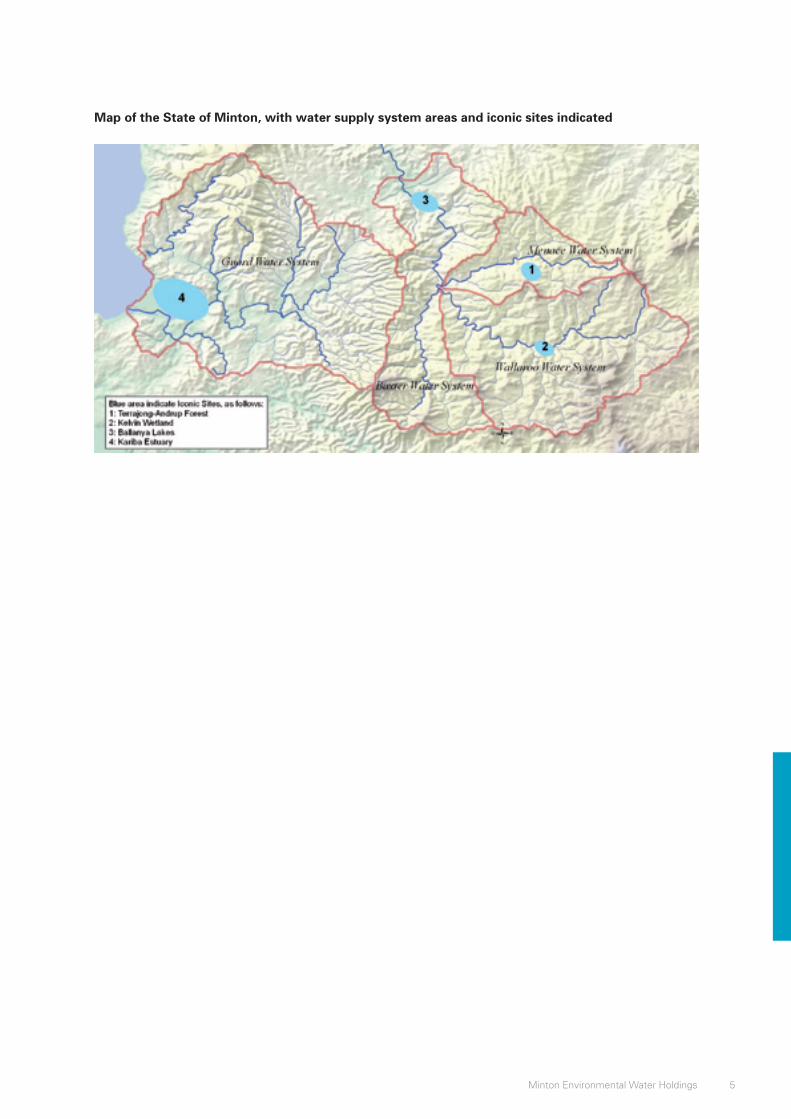
5Minton Environmental Water Holdings
Map of the State of Minton, with water supply system areas and iconic sites indicated
6 Illustrative Water Accounting Reports for Australian Water Accounting Standard 1
Administrative informationThe MEWH was established by the Minton Environment Act 2X06 (the Act), which among other things provides the framework and direction for environmental watering in the State of Minton. The Act created the MEWH as an independent officer, with support staff in an office provided by the Department of the Environment. The MEWH is independent from State Ministers and their departments. The MEWH must however ensure that the Holdings, which comprise environmental entitlements prescribed in the Minton Water Act 2X08, are managed consistent with the environmental objectives in the Environmental Water Management Strategy (EWMS). The EWMS is prepared (and reviewed every three years) by the Department of Environment, consistent with guidelines issued by the Minister for Environment, and in consultation with MEWH and other stakeholders. The EWMS is approved by the Secretary of the Department of Environment. The MEWH must also prepare an annual corporate plan, publish an annual report of the MEWH’s activities and, as required, submit to regular questioning by the Minton Government Committee on Natural Resources.
The MEWH takes advice on priorities for application of environmental water from an Environmental Watering Scientific Advisory Committee, as well as from operational partners. The iconic environmental sites are managed by staff from the Department of Environment, who assist the MEWH with planning for annual watering and activities at the sites. When MEWH takes a decision on a watering action, a MEWH instruction is issued to Minton State Water to deliver water allocation available from the Holdings to a particular environmental site. Administrative arrangements are undertaken by the MEWH office and regular liaison occurs with Minton State Water to adapt the watering as necessary to the actual circumstances which transpire during the authorised watering period. If necessary, a further MEWH instruction may be issued.
Monitoring aimed at improving the effectiveness of environmental water delivery is included in operating arrangements negotiated between MEWH and Minton State Water. Monitoring aimed at understanding the effectiveness of environmental watering, in contributing to the environmental condition of iconic environmental sites, is undertaken by the Department of Environment.
Prioritisation of environmental watering actions
To ensure the greatest amount of benefit is delivered from the Holdings, watering actions are prioritised by MEWH using the following criteria (which are prescribed in the EWMS):
• extent, significance and likelihood of the expected environmental benefit;
• opportunity to complement the watering with water from other sources or with other environmental measures;
• cost-effectiveness of the watering;
• risk to the environmental site of not taking any watering action, as well as risk from the watering; and
• watering history of the site.
7Minton Environmental Water Holdings
Management and operational requirements
The MEWH manages the Holdings in compliance with the:
• Minton Water Act 2X08
• Natural Resources Management Act 2X05 (NRM Act)
• Minton Environment Act 2X03
• Minton Environmental Water Management Strategy (EWMS).
The MEWH has established operating arrangements in cooperation with Minton State Water to manage the Holdings. These include:
• Minton Annual Environmental Watering Plan, which is a scoping document based on scenario planning and provides insight into likely priority watering actions for a range of conditions which may be experienced in the water year (1 July to 30 June); and
• Minton Environmental Water Delivery Arrangements, which outline how MEWH instructions will be implemented, cover operational practice and risk management and monitoring of delivery effectiveness.
The Natural Resources Management Act 2X05 (NRM Act) limits the volume of allocation carryover to 20% of high security entitlement volume. Any unused allocation in addition to this volume is forfeited at the end of the water year (reporting period). The EWMS obliges the MEWH to endeavour to trade any allocation that may be unused at the end of the water year, rather than have it forfeited. In 2X11, 480 ML of unused allocation was traded and 300 ML was forfeited as it was not traded before the end of the reporting period due to a lack of buyers.
Environmental watering objectives
The EWMS includes four nationally significant iconic sites: Terrajong–Andrup Forest, Kelvin Wetland, Ballanya Lakes and Kariba Estuary; as well as the Environmental Watering Objectives Matrix and the preferred long-term watering regime for each iconic environmental site. These sites and their environmental significance are described below:
• Terrajong–Andrup Forest is a protected national park and is partly watered by an aquifer that is recharged during flood events in the eastern section of the Menace water system. It contains a large number of old-growth Tuart trees, which were once common in the Menace water system and supported a thriving timber industry in the 19th century. The Terrajong–Andrup Forest is now an important tourist attraction in the Menace water system.
Monitoring tools in place at Terrajong–Andrup Forest
Ecosystem property Measurable attribute Measurement method
Habitat qualityConcentration of nutrients in water bodies, e.g. nitrogen and phosphorous
Manual samples
Species abundance/health Tuart abundance and conditionTransect and quadrant surveys
Groundwater level Depth of aquifer below ground-levelMonitoring bores (3 x bores)
HydraulicsWater velocity entering and leaving the iconic site
Spot gauging
• Kelvin Wetland is located in the Wallaroo water system and is a key breeding ground for the endangered Intermediate Egret and the popular angling fish, the Golden Perch. Kelvin Wetland is listed on the Directory of Important Wetlands of Australia and the List of Wetlands of International Importance (the Ramsar List). Environmental watering of Kelvin Wetland is only achievable at certain times of the year when the release and delivery of the environmental water coincides with an unregulated flow event which raises the river to the required level to enable diversion into the wetland.
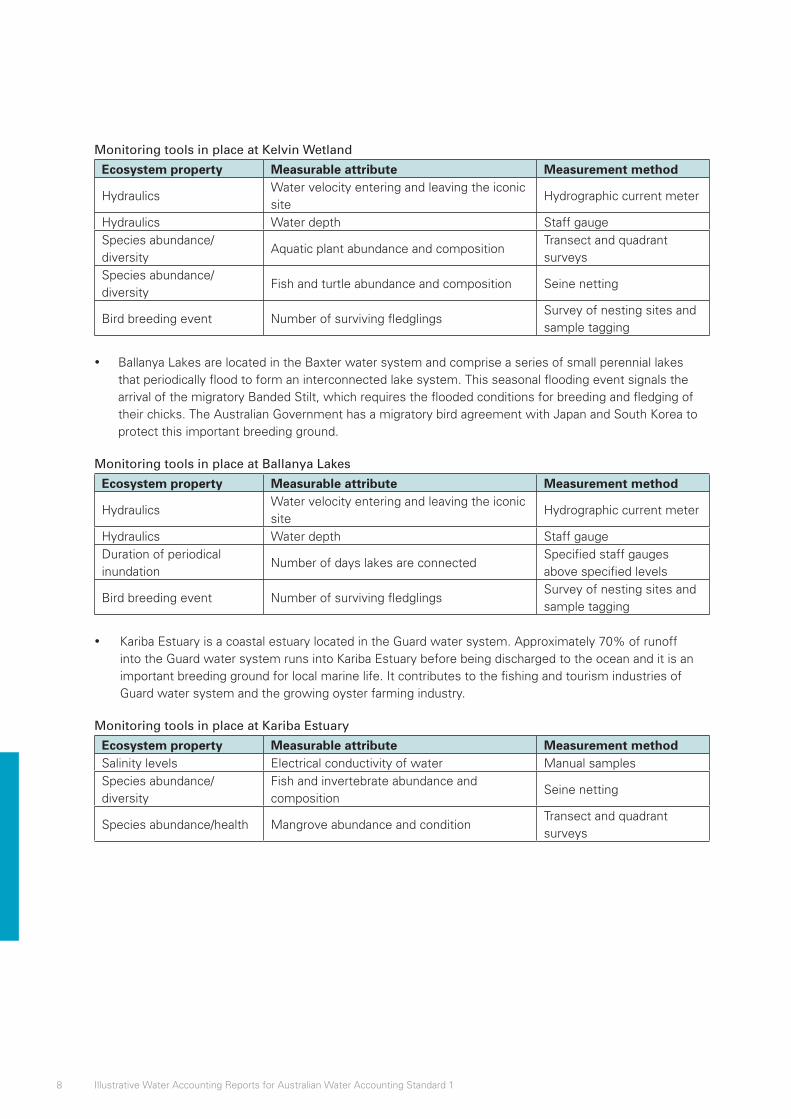
8 Illustrative Water Accounting Reports for Australian Water Accounting Standard 1
Monitoring tools in place at Kelvin Wetland
Ecosystem property Measurable attribute Measurement method
HydraulicsWater velocity entering and leaving the iconic site
Hydrographic current meter
Hydraulics Water depth Staff gaugeSpecies abundance/diversity
Aquatic plant abundance and compositionTransect and quadrant surveys
Species abundance/diversity
Fish and turtle abundance and composition Seine netting
Bird breeding event Number of surviving fledglingsSurvey of nesting sites and sample tagging
• Ballanya Lakes are located in the Baxter water system and comprise a series of small perennial lakes that periodically flood to form an interconnected lake system. This seasonal flooding event signals the arrival of the migratory Banded Stilt, which requires the flooded conditions for breeding and fledging of their chicks. The Australian Government has a migratory bird agreement with Japan and South Korea to protect this important breeding ground.
Monitoring tools in place at Ballanya Lakes
Ecosystem property Measurable attribute Measurement method
HydraulicsWater velocity entering and leaving the iconic site
Hydrographic current meter
Hydraulics Water depth Staff gaugeDuration of periodical inundation
Number of days lakes are connectedSpecified staff gauges above specified levels
Bird breeding event Number of surviving fledglingsSurvey of nesting sites and sample tagging
• Kariba Estuary is a coastal estuary located in the Guard water system. Approximately 70% of runoff into the Guard water system runs into Kariba Estuary before being discharged to the ocean and it is an important breeding ground for local marine life. It contributes to the fishing and tourism industries of Guard water system and the growing oyster farming industry.
Monitoring tools in place at Kariba Estuary
Ecosystem property Measurable attribute Measurement methodSalinity levels Electrical conductivity of water Manual samplesSpecies abundance/diversity
Fish and invertebrate abundance and composition
Seine netting
Species abundance/health Mangrove abundance and conditionTransect and quadrant surveys
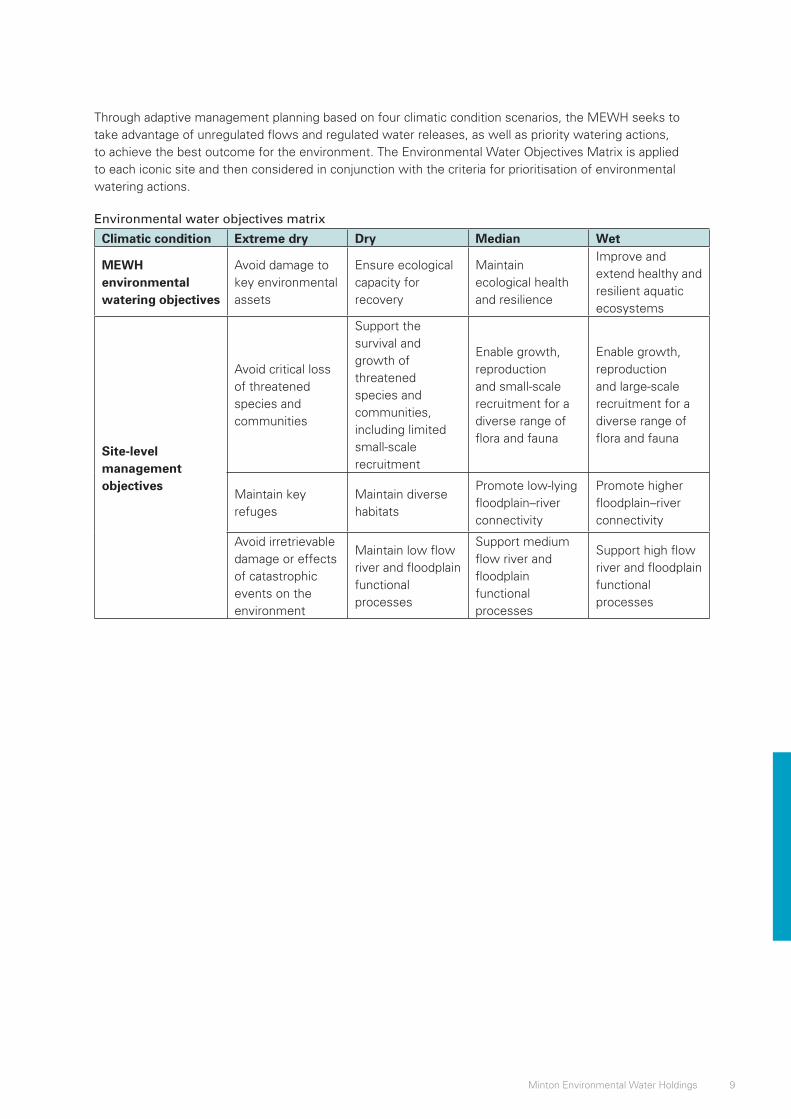
9Minton Environmental Water Holdings
Through adaptive management planning based on four climatic condition scenarios, the MEWH seeks to take advantage of unregulated flows and regulated water releases, as well as priority watering actions, to achieve the best outcome for the environment. The Environmental Water Objectives Matrix is applied to each iconic site and then considered in conjunction with the criteria for prioritisation of environmental watering actions.
Environmental water objectives matrix
Climatic condition Extreme dry Dry Median Wet
MEWH environmental watering objectives
Avoid damage to key environmental assets
Ensure ecological capacity for recovery
Maintain ecological health and resilience
Improve and extend healthy and resilient aquatic ecosystems
Site-level management objectives
Avoid critical loss of threatened species and communities
Support the survival and growth of threatened species and communities, including limited small-scale recruitment
Enable growth, reproduction and small-scale recruitment for a diverse range of flora and fauna
Enable growth, reproduction and large-scale recruitment for a diverse range of flora and fauna
Maintain key refuges
Maintain diverse habitats
Promote low-lying floodplain–river connectivity
Promote higher floodplain–river connectivity
Avoid irretrievable damage or effects of catastrophic events on the environment
Maintain low flow river and floodplain functional processes
Support medium flow river and floodplain functional processes
Support high flow river and floodplain functional processes
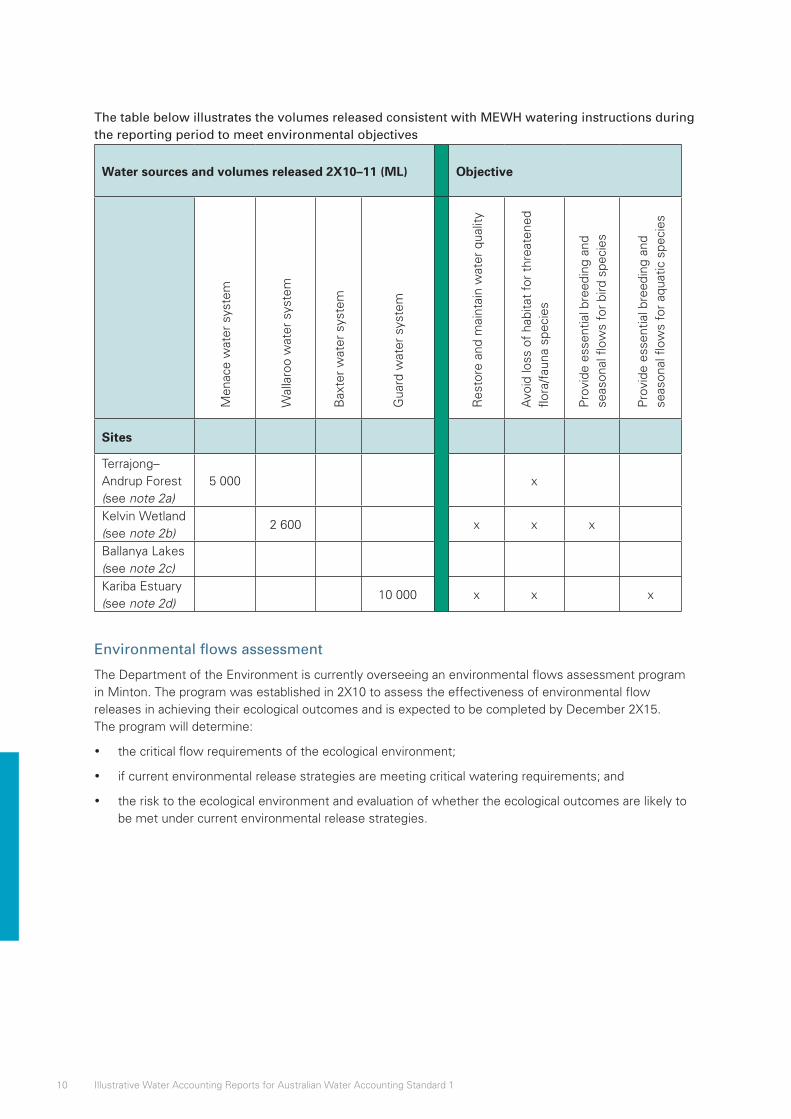
10 Illustrative Water Accounting Reports for Australian Water Accounting Standard 1
The table below illustrates the volumes released consistent with MEWH watering instructions during the reporting period to meet environmental objectives
Water sources and volumes released 2X10–11 (ML) Objective
Men
ace
wat
er s
yste
m
Wal
laro
o w
ater
sys
tem
Bax
ter
wat
er s
yste
m
Gua
rd w
ater
sys
tem
Res
tore
and
mai
ntai
n w
ater
qua
lity
Avo
id lo
ss o
f ha
bita
t fo
r th
reat
ened
flo
ra/f
auna
spe
cies
Pro
vide
ess
entia
l bre
edin
g an
d se
ason
al fl
ows
for
bird
spe
cies
Pro
vide
ess
entia
l bre
edin
g an
d se
ason
al fl
ows
for
aqua
tic s
peci
es
Sites
Terrajong–Andrup Forest(see note 2a)
5 000 x
Kelvin Wetland(see note 2b)
2 600 x x x
Ballanya Lakes(see note 2c)Kariba Estuary(see note 2d)
10 000 x x x
Environmental flows assessment
The Department of the Environment is currently overseeing an environmental flows assessment program in Minton. The program was established in 2X10 to assess the effectiveness of environmental flow releases in achieving their ecological outcomes and is expected to be completed by December 2X15. The program will determine:
• the critical flow requirements of the ecological environment;
• if current environmental release strategies are meeting critical watering requirements; and
• the risk to the ecological environment and evaluation of whether the ecological outcomes are likely to be met under current environmental release strategies.
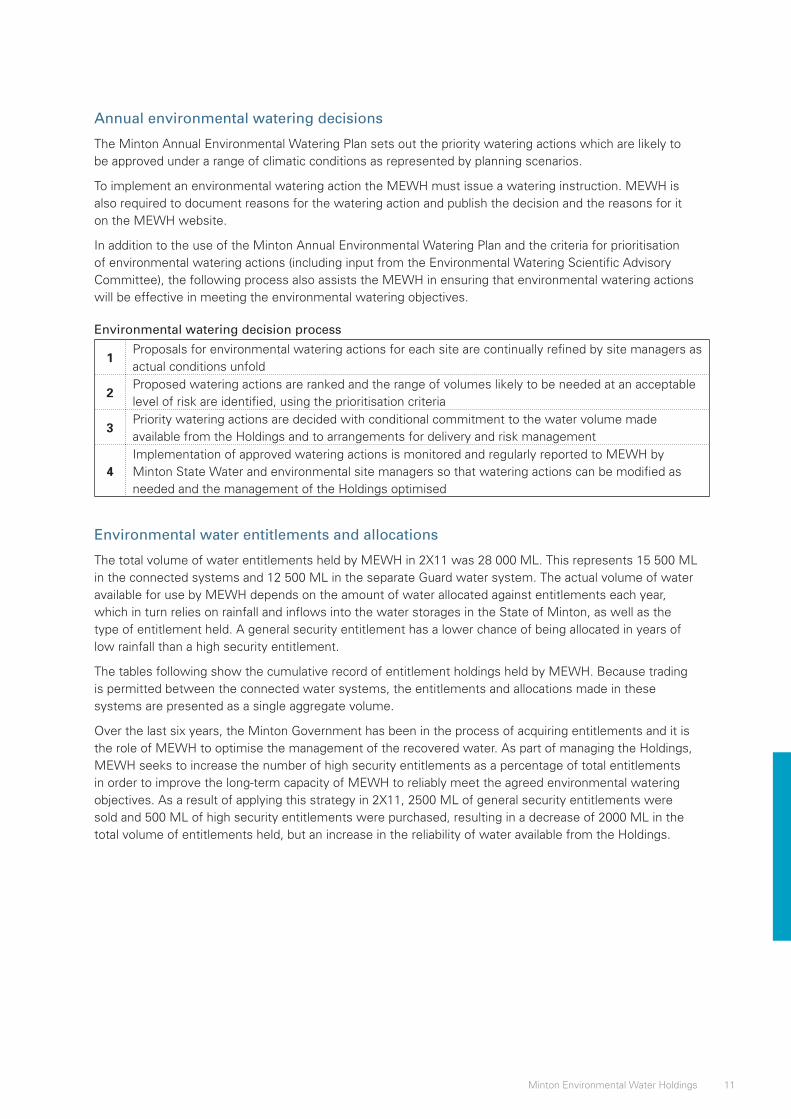
11Minton Environmental Water Holdings
Annual environmental watering decisions
The Minton Annual Environmental Watering Plan sets out the priority watering actions which are likely to be approved under a range of climatic conditions as represented by planning scenarios.
To implement an environmental watering action the MEWH must issue a watering instruction. MEWH is also required to document reasons for the watering action and publish the decision and the reasons for it on the MEWH website.
In addition to the use of the Minton Annual Environmental Watering Plan and the criteria for prioritisation of environmental watering actions (including input from the Environmental Watering Scientific Advisory Committee), the following process also assists the MEWH in ensuring that environmental watering actions will be effective in meeting the environmental watering objectives.
Environmental watering decision process
1Proposals for environmental watering actions for each site are continually refined by site managers as actual conditions unfold
2Proposed watering actions are ranked and the range of volumes likely to be needed at an acceptable level of risk are identified, using the prioritisation criteria
3Priority watering actions are decided with conditional commitment to the water volume made available from the Holdings and to arrangements for delivery and risk management
4Implementation of approved watering actions is monitored and regularly reported to MEWH by Minton State Water and environmental site managers so that watering actions can be modified as needed and the management of the Holdings optimised
Environmental water entitlements and allocations
The total volume of water entitlements held by MEWH in 2X11 was 28 000 ML. This represents 15 500 ML in the connected systems and 12 500 ML in the separate Guard water system. The actual volume of water available for use by MEWH depends on the amount of water allocated against entitlements each year, which in turn relies on rainfall and inflows into the water storages in the State of Minton, as well as the type of entitlement held. A general security entitlement has a lower chance of being allocated in years of low rainfall than a high security entitlement.
The tables following show the cumulative record of entitlement holdings held by MEWH. Because trading is permitted between the connected water systems, the entitlements and allocations made in these systems are presented as a single aggregate volume.
Over the last six years, the Minton Government has been in the process of acquiring entitlements and it is the role of MEWH to optimise the management of the recovered water. As part of managing the Holdings, MEWH seeks to increase the number of high security entitlements as a percentage of total entitlements in order to improve the long-term capacity of MEWH to reliably meet the agreed environmental watering objectives. As a result of applying this strategy in 2X11, 2500 ML of general security entitlements were sold and 500 ML of high security entitlements were purchased, resulting in a decrease of 2000 ML in the total volume of entitlements held, but an increase in the reliability of water available from the Holdings.
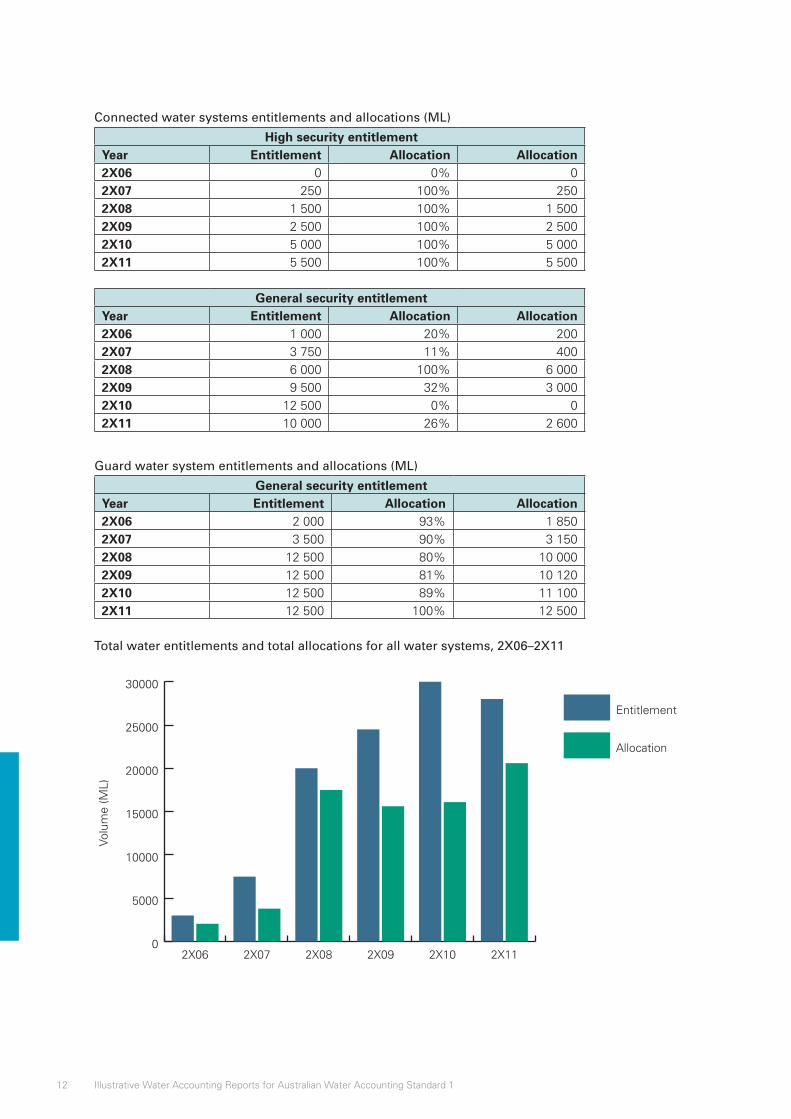
12 Illustrative Water Accounting Reports for Australian Water Accounting Standard 1
Connected water systems entitlements and allocations (ML)
High security entitlementYear Entitlement Allocation Allocation2X06 0 0% 02X07 250 100% 2502X08 1 500 100% 1 5002X09 2 500 100% 2 5002X10 5 000 100% 5 0002X11 5 500 100% 5 500
General security entitlementYear Entitlement Allocation Allocation2X06 1 000 20% 2002X07 3 750 11% 4002X08 6 000 100% 6 0002X09 9 500 32% 3 0002X10 12 500 0% 02X11 10 000 26% 2 600
Guard water system entitlements and allocations (ML)
General security entitlementYear Entitlement Allocation Allocation2X06 2 000 93% 1 8502X07 3 500 90% 3 1502X08 12 500 80% 10 0002X09 12 500 81% 10 1202X10 12 500 89% 11 1002X11 12 500 100% 12 500
Total water entitlements and total allocations for all water systems, 2X06–2X11
0
5000
10000
15000
20000
25000
30000
Allocation
Entitlement
2X112X102X092X082X072X06
Volu
me
(ML)
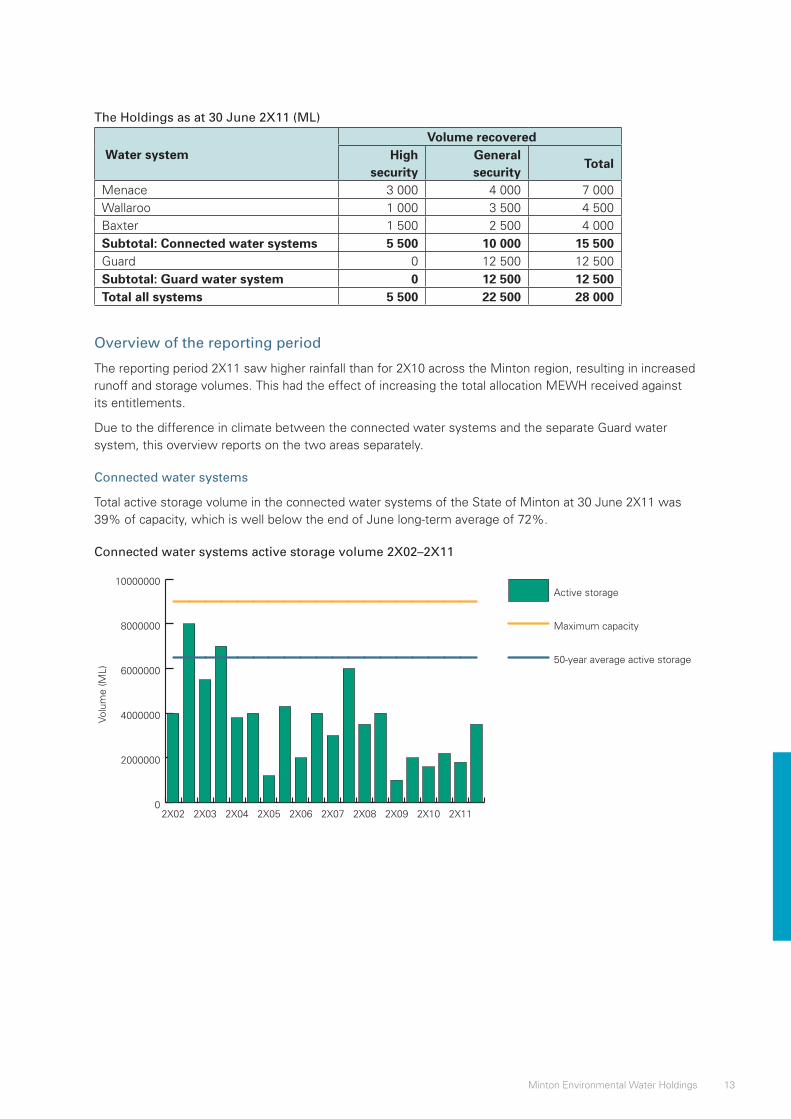
13Minton Environmental Water Holdings
The Holdings as at 30 June 2X11 (ML)
Water system Volume recovered
High security
General security
Total
Menace 3 000 4 000 7 000Wallaroo 1 000 3 500 4 500Baxter 1 500 2 500 4 000Subtotal: Connected water systems 5 500 10 000 15 500Guard 0 12 500 12 500Subtotal: Guard water system 0 12 500 12 500Total all systems 5 500 22 500 28 000
Overview of the reporting period
The reporting period 2X11 saw higher rainfall than for 2X10 across the Minton region, resulting in increased runoff and storage volumes. This had the effect of increasing the total allocation MEWH received against its entitlements.
Due to the difference in climate between the connected water systems and the separate Guard water system, this overview reports on the two areas separately.
Connected water systems
Total active storage volume in the connected water systems of the State of Minton at 30 June 2X11 was 39% of capacity, which is well below the end of June long-term average of 72%.
Connected water systems active storage volume 2X02–2X11
0
2000000
4000000
6000000
8000000
10000000Active storage
Maximum capacity
50-year average active storage
2X112X102X092X082X072X062X052X042X032X02
Volu
me
(ML)
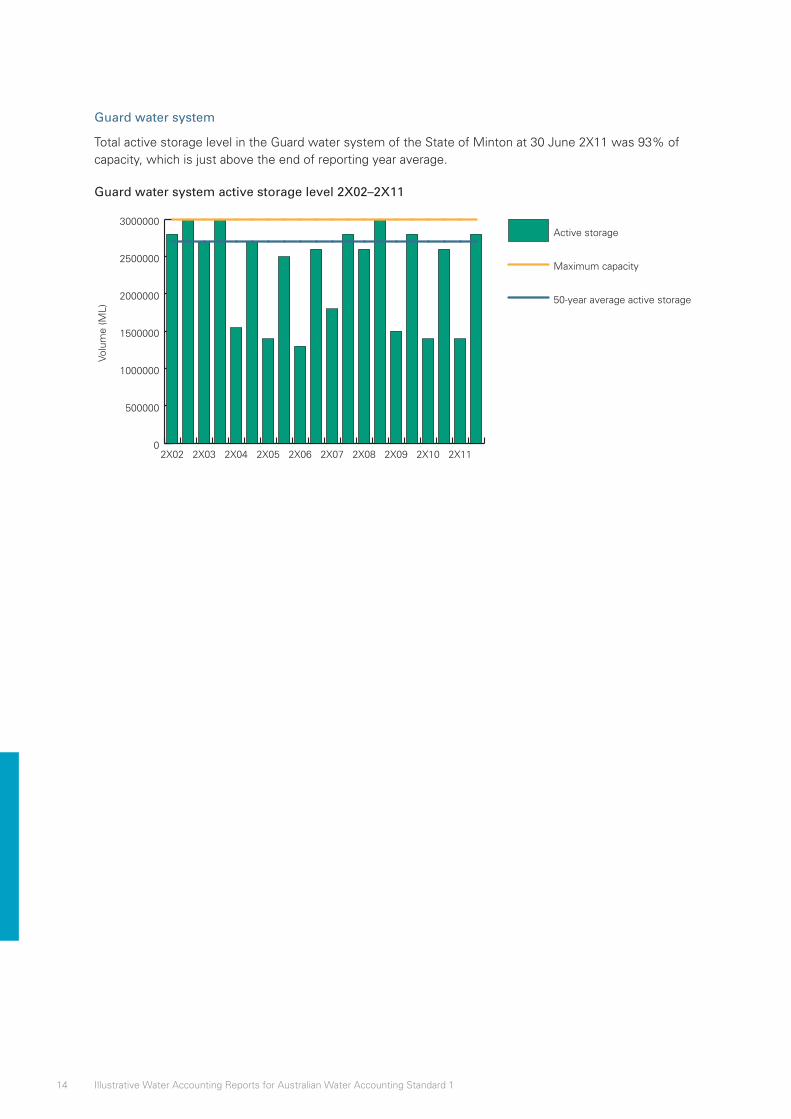
14 Illustrative Water Accounting Reports for Australian Water Accounting Standard 1
Guard water system
Total active storage level in the Guard water system of the State of Minton at 30 June 2X11 was 93% of capacity, which is just above the end of reporting year average.
Guard water system active storage level 2X02–2X11
0
500000
1000000
1500000
2000000
2500000
3000000Active storage
Maximum capacity
50-year average active storage
2X112X102X092X082X072X062X052X042X032X02
Volu
me
(ML)
15Minton Environmental Water Holdings
Accountability Statement
AWAS 1 paragraphs 62–63
Basis for Conclusions paragraphs B45–B48
Water Accounting Conceptual Framework SWAC 2: 15–16
The Accountability Statement is a statement signed and dated by the person(s) or representative(s) responsible for preparing and presenting the general purpose water accounting report. The Statement assists users of general water accounting reports determine whether the report has been prepared and presented in accordance with Australian Water Accounting Standards.
If the general purpose water accounting report is not prepared in accordance with Australian Water Accounting Standards, a statement to this effect is disclosed setting out the nature of and reason for non-compliance.
In the opinion of the undersigned, this general purpose water accounting report complies with Australian Water Accounting Standards as issued by the Water Accounting Standards Board.
Annika JohnsonMinton Environmental Water Holder
16 Illustrative Water Accounting Reports for Australian Water Accounting Standard 1
Assurance of water accounting report
AWAS 1 paragraphs 178–182
Basis for Conclusions paragraphs B165–B169
Water Accounting Conceptual Framework SWAC 2:26–28 and SWAC 8
AWAS 1 requires a general purpose water accounting report to be subjected to assurance to establish whether it is presented fairly in accordance with Australian Water Accounting Standards. The assurance of the general purpose water accounting report is to be performed by an appropriately qualified assurance practitioner independent of the management of the water report entity and the preparer of the general purpose water accounting report.
AWAS requires a statement of whether the general purpose water accounting report is presented mainly in accordance with AWAS to be provided by the assurance practitioner in an assurance report accompanying the general purpose water accounting report.
The assurance function, undertaken by an appropriately qualified and independent assurance provider, is important in enhancing users’ confidence in the veracity of the information being presented to inform decision-making.
An assurance framework will be released for public consultation in late 2012.
17Minton Environmental Water Holdings
Water Accounting Statements
Statement of Water Assets and Water Liabilities
AWAS 1 paragraphs 21–46, 51–54 and 64–106
Implementation Guidance A, C, D and E
Basis for Conclusions paragraphs B23–B38 and B49–B129
Water Accounting Conceptual Framework SWAC3, SWAC 4, SWAC 5 and SWAC 6
The Statement of Water Assets and Water Liabilities is a statement that provides information about the water assets and water liabilities of the water report entity at a point in time. The information in the Statement of Water Assets and Water Liabilities relates both to water and rights to, and claims against water. This statement is prepared on an accrual basis.
The Statement of Water Assets and Water Liabilities shall contain the following minimum line items:
• water assets;
• water liabilities; and
• net water assets.
Additional sub-classification of the minimum line items can be presented in accordance with AWAS 1 paragraph 66.
Items in the Statement of Water Assets and Water Liabilities are to be cross-referenced to the relevant note disclosure.
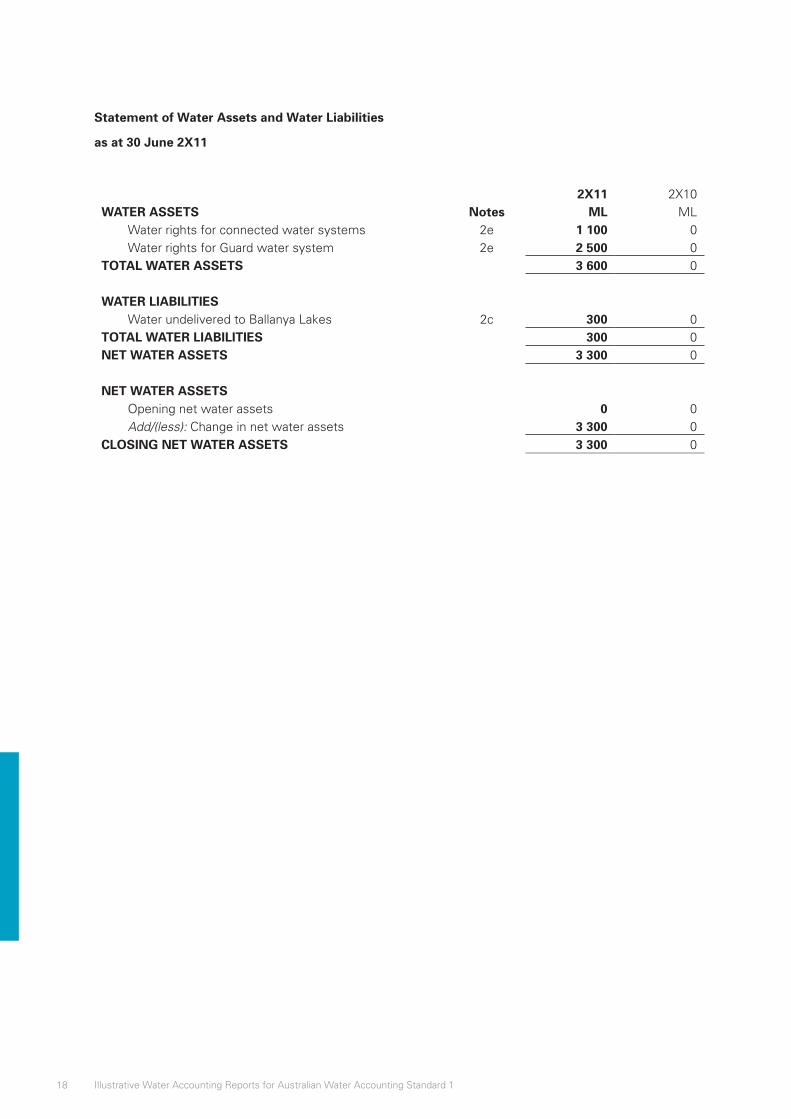
18 Illustrative Water Accounting Reports for Australian Water Accounting Standard 1
Statement of Water Assets and Water Liabilities
as at 30 June 2X11
2X11 2X10WATER ASSETS Notes ML ML
Water rights for connected water systems 2e 1 100 0Water rights for Guard water system 2e 2 500 0
TOTAL WATER ASSETS 3 600 0
WATER LIABILITIESWater undelivered to Ballanya Lakes 2c 300 0
TOTAL WATER LIABILITIES 300 0NET WATER ASSETS 3 300 0
NET WATER ASSETSOpening net water assets 0 0Add/(less): Change in net water assets 3 300 0
CLOSING NET WATER ASSETS 3 300 0
19Minton Environmental Water Holdings
Statement of Changes in Water Assets and Water Liabilities
AWAS 1 paragraphs 21–46, 51–54 and 107–114
Implementation Guidance A, C, D and E
Basis for Conclusions paragraphs B23–B38 and B130–B132
Water Accounting Conceptual Framework SWAC 3, SWAC 4, SWAC 5 and SWAC 6
The Statement of Changes in Water Assets and Water Liabilities provides information about the changes that have occurred to the water report entity’s water assets and water liabilities during the reporting period. The Statement of Changes in Water Assets and Water Liabilities provides information about the increases and decreases in both water and rights to and claims against water. This statement is prepared on an accrual basis.
The Statement of Changes in Water Assets and Water Liabilities shall contain the following minimum line items:
• water asset increases;
• water asset decreases;
• water liability increases;
• water liability decreases; and
• change in net water assets.
Additional sub-classification of the minimum line items can be presented in accordance with AWAS 1 paragraph 110.
Items in the Statement of Water Assets and Water Liabilities are to be cross-referenced to the relevant note.
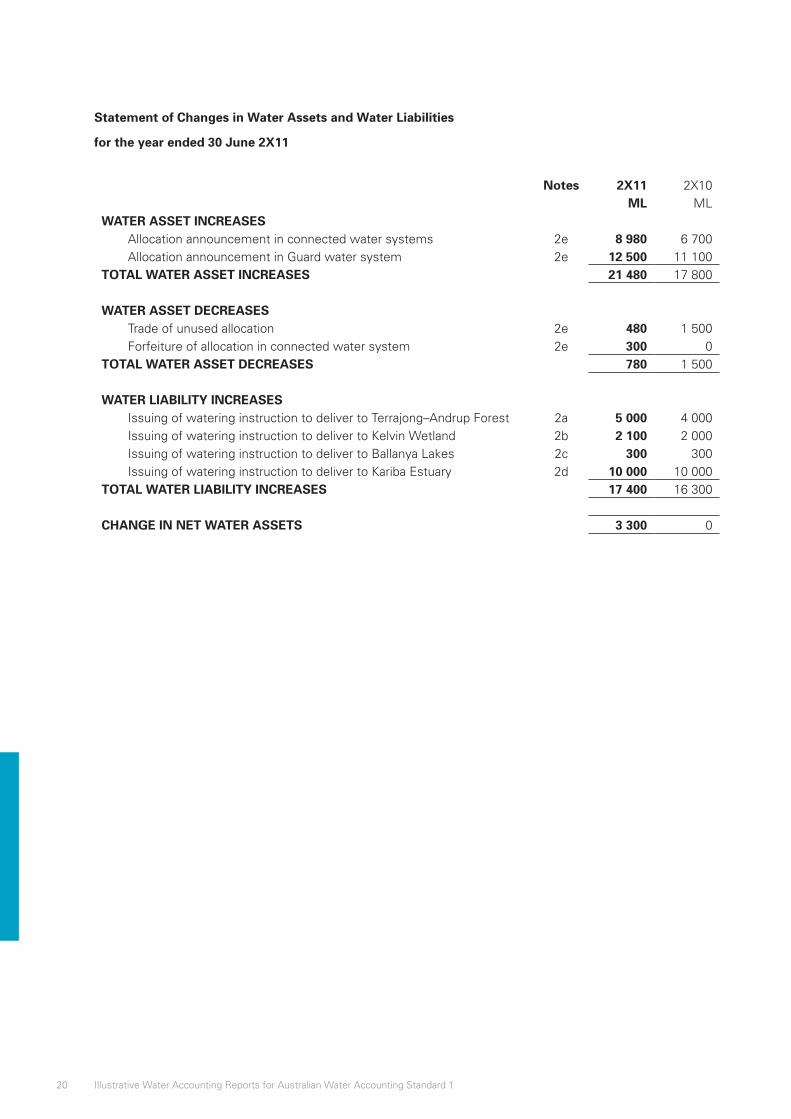
20 Illustrative Water Accounting Reports for Australian Water Accounting Standard 1
Statement of Changes in Water Assets and Water Liabilities
for the year ended 30 June 2X11
Notes 2X11 2X10ML ML
WATER ASSET INCREASESAllocation announcement in connected water systems 2e 8 980 6 700Allocation announcement in Guard water system 2e 12 500 11 100
TOTAL WATER ASSET INCREASES 21 480 17 800
WATER ASSET DECREASESTrade of unused allocation 2e 480 1 500Forfeiture of allocation in connected water system 2e 300 0
TOTAL WATER ASSET DECREASES 780 1 500
WATER LIABILITY INCREASESIssuing of watering instruction to deliver to Terrajong–Andrup Forest 2a 5 000 4 000Issuing of watering instruction to deliver to Kelvin Wetland 2b 2 100 2 000Issuing of watering instruction to deliver to Ballanya Lakes 2c 300 300Issuing of watering instruction to deliver to Kariba Estuary 2d 10 000 10 000
TOTAL WATER LIABILITY INCREASES 17 400 16 300
CHANGE IN NET WATER ASSETS 3 300 0
21Minton Environmental Water Holdings
Statement of Water Flows
AWAS 1 paragraphs 21–46, 51–54 and 115–127
Implementation Guidance A, C, D and E
Basis for Conclusions paragraphs B23–B38 and B130–B132
Water Accounting Conceptual Framework SWAC 3, SWAC 4, SWAC 5 and SWAC 6
The Statement of Water Flows contains information that enables users to understand the nature and volumes of physical water flows experienced by the water report entity during the reporting period. This statement presents movements in only physical water. If the water report entity does not have any physical water flow events, the presentation of the Statement of Water Flows may not be required and an explanation shall be disclosed in the significant water accounting policy.
In this illustration the Statement of Water Flows is omitted as the Minton Environmental Water Holdings does not recognise any physical water assets and as a result does not recognise any water inflows and water outflows.
22 Illustrative Water Accounting Reports for Australian Water Accounting Standard 1
Notes
AWAS 1 paragraphs 133–177
Implementation Guidance A, B, D, E, F, G and H
Basis for Conclusions paragraphs B146–B164
Water Accounting Conceptual Framework SWAC 2: 24–29
Information shall be disclosed in the notes that assists users of general purpose water accounting reports in understanding the water assets and water liabilities of the water report entity. The notes provide additional quantitative and qualitative information about the items presented in the water accounting statements. They also provide additional information on important aspects of the water report entity.
The following is a complete list of notes required by AWAS 1:
1. Significant water accounting policies
2. Supporting information to the water accounting statements
3. Restatement of comparative information
4. Prior period errors
5. Non-adjusting events after the end of the reporting period
6. Quantification approaches
7. Reconciliations
8. Future prospects
9. Contingent water assets and contingent water liabilities
10. Water assets and water liabilities that do not meet the recognition criteria
11. Water rights, water allocations and water restrictions
12. Water market activity
13. Water for environmental, social and cultural, and economic benefit
14. Segment information
15. Group water accounting reports.
Notes 1, 2, 7, 8, 9 and 13 are demonstrated in this illustrative water accounting report.
23Minton Environmental Water Holdings
Note 1: Significant water accounting policies
AWAS 1 paragraphs 21–22, 51–54 and 136–138
AWAS 1 requires the preparer of a general purpose water accounting report to provide information on the water accounting policies adopted in the preparation of the water accounting statements in order to enhance users’ understanding of how transactions, transformations and events are reflected in the water accounting statements.
The following information shall be disclosed in the summary of significant water accounting policies:
• a statement that the general purpose water accounting report has been prepared using the accrual basis of water accounting (except for the water flow information);
• the quantification attribute and the unit of account used in the water accounting statements; and
• information on other water accounting policies used in the preparation and presentation of the general purpose water accounting report that are relevant to an understanding of the water accounting statements.
This general purpose water accounting report was prepared using an accrual basis of accounting. The water attribute being quantified is volume and the unit of account is litres, presented in megalitres (ML).
Recognition of water assets and water liabilities
Water allocations are recognised as water assets at the date of the allocation announcement.
The physical water held within the environmental sites is not a water asset of MEWH. For water to meet the definition of a water asset, it must meet the definition of water, it must either be held or transferred by MEWH, and MEWH must derive future benefits from the water.
The MEWH does not manage the physical water with the environmental sites; it is responsible for deciding the application of the environmental water and administratively transfers the water allocation for use at the site.
Obligations to deliver water to an environmental site are recognised as water liabilities at the time of the formal issuing of the watering action, as per a MEWH watering instruction. The water liability continues to be recognised in the Statement of Water Assets and Water Liabilities until it is settled by delivery of environmental claims.
Recognition of changes in water assets and water liabilities
Changes to water assets and water liabilities are recognised in the Statement of Changes in Water Assets and Water Liabilities at the time of the formal issuing of the watering action. Physical water flows are not recognised in the Statement of Changes in Water Assets and Water Liabilities as MEWH does not manage the physical water inflows or water outflows.
Omission of statement of physical water flows
The Holdings comprise rights or claims to water, including water allocations and their administrative transfer, but do not include, and nor does the management responsibility of MEWH, the physical transfer of water from storages to environmental sites. As such, the Holdings have no physical water inflows. While it is the case that physical water outflows occur when the water liabilities of the water report entity are realised, there are no outflows from a physical water asset held by MEWH. Therefore, the Statement of Physical Water Flows was omitted from this general purpose water accounting report.
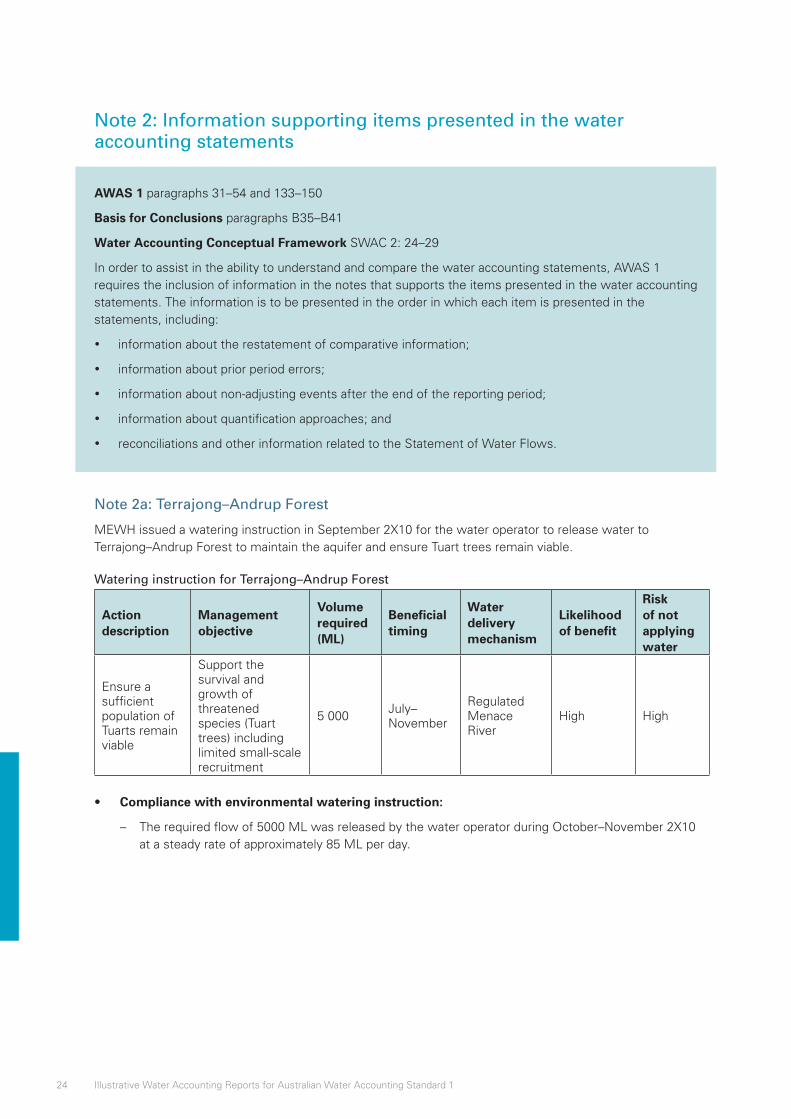
24 Illustrative Water Accounting Reports for Australian Water Accounting Standard 1
Note 2: Information supporting items presented in the water accounting statements
AWAS 1 paragraphs 31–54 and 133–150
Basis for Conclusions paragraphs B35–B41
Water Accounting Conceptual Framework SWAC 2: 24–29
In order to assist in the ability to understand and compare the water accounting statements, AWAS 1 requires the inclusion of information in the notes that supports the items presented in the water accounting statements. The information is to be presented in the order in which each item is presented in the statements, including:
• information about the restatement of comparative information;
• information about prior period errors;
• information about non-adjusting events after the end of the reporting period;
• information about quantification approaches; and
• reconciliations and other information related to the Statement of Water Flows.
Note 2a: Terrajong–Andrup Forest
MEWH issued a watering instruction in September 2X10 for the water operator to release water to Terrajong–Andrup Forest to maintain the aquifer and ensure Tuart trees remain viable.
Watering instruction for Terrajong–Andrup Forest
Action description
Management objective
Volume required (ML)
Beneficial timing
Water delivery mechanism
Likelihood of benefit
Risk of not applying water
Ensure a sufficient population of Tuarts remain viable
Support the survival and growth of threatened species (Tuart trees) including limited small-scale recruitment
5 000July–November
Regulated Menace River
High High
• Compliance with environmental watering instruction:
– The required flow of 5000 ML was released by the water operator during October–November 2X10 at a steady rate of approximately 85 ML per day.
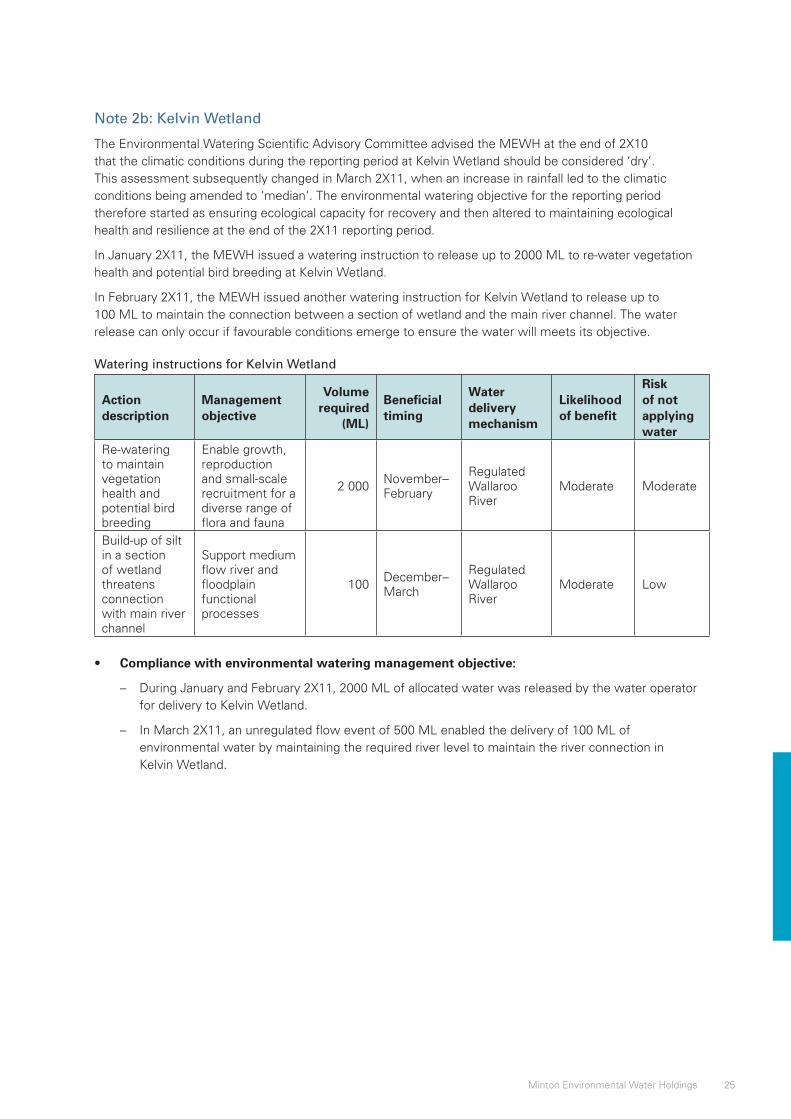
25Minton Environmental Water Holdings
Note 2b: Kelvin Wetland
The Environmental Watering Scientific Advisory Committee advised the MEWH at the end of 2X10 that the climatic conditions during the reporting period at Kelvin Wetland should be considered ‘dry’. This assessment subsequently changed in March 2X11, when an increase in rainfall led to the climatic conditions being amended to ‘median’. The environmental watering objective for the reporting period therefore started as ensuring ecological capacity for recovery and then altered to maintaining ecological health and resilience at the end of the 2X11 reporting period.
In January 2X11, the MEWH issued a watering instruction to release up to 2000 ML to re-water vegetation health and potential bird breeding at Kelvin Wetland.
In February 2X11, the MEWH issued another watering instruction for Kelvin Wetland to release up to 100 ML to maintain the connection between a section of wetland and the main river channel. The water release can only occur if favourable conditions emerge to ensure the water will meets its objective.
Watering instructions for Kelvin Wetland
Action description
Management objective
Volume required
(ML)
Beneficial timing
Water delivery mechanism
Likelihood of benefit
Risk of not applying water
Re-watering to maintain vegetation health and potential bird breeding
Enable growth, reproduction and small-scale recruitment for a diverse range of flora and fauna
2 000November–February
Regulated Wallaroo River
Moderate Moderate
Build-up of silt in a section of wetland threatens connection with main river channel
Support medium flow river and floodplain functional processes
100December–March
Regulated Wallaroo River
Moderate Low
• Compliance with environmental watering management objective:
– During January and February 2X11, 2000 ML of allocated water was released by the water operator for delivery to Kelvin Wetland.
– In March 2X11, an unregulated flow event of 500 ML enabled the delivery of 100 ML of environmental water by maintaining the required river level to maintain the river connection in Kelvin Wetland.
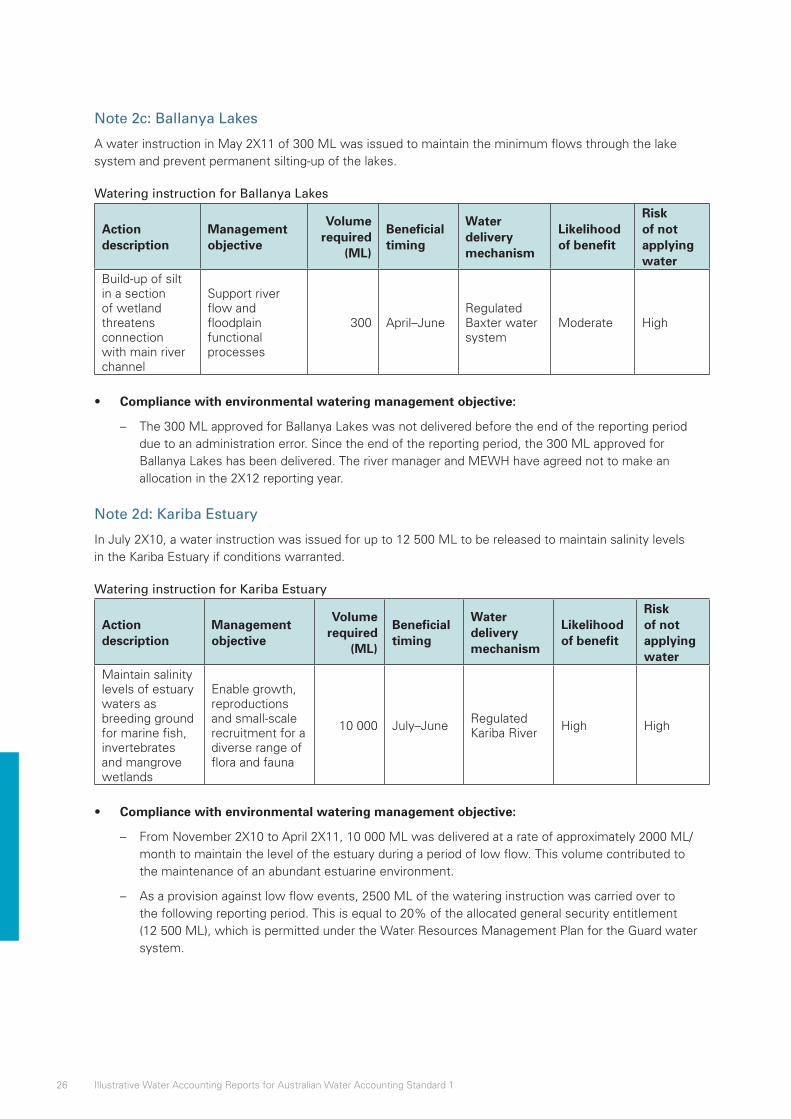
26 Illustrative Water Accounting Reports for Australian Water Accounting Standard 1
Note 2c: Ballanya Lakes
A water instruction in May 2X11 of 300 ML was issued to maintain the minimum flows through the lake system and prevent permanent silting-up of the lakes.
Watering instruction for Ballanya Lakes
Action description
Management objective
Volume required
(ML)
Beneficial timing
Water delivery mechanism
Likelihood of benefit
Risk of not applying water
Build-up of silt in a section of wetland threatens connection with main river channel
Support river flow and floodplain functional processes
300 April–JuneRegulated Baxter water system
Moderate High
• Compliance with environmental watering management objective:
– The 300 ML approved for Ballanya Lakes was not delivered before the end of the reporting period due to an administration error. Since the end of the reporting period, the 300 ML approved for Ballanya Lakes has been delivered. The river manager and MEWH have agreed not to make an allocation in the 2X12 reporting year.
Note 2d: Kariba Estuary
In July 2X10, a water instruction was issued for up to 12 500 ML to be released to maintain salinity levels in the Kariba Estuary if conditions warranted.
Watering instruction for Kariba Estuary
Action description
Management objective
Volume required
(ML)
Beneficial timing
Water delivery mechanism
Likelihood of benefit
Risk of not applying water
Maintain salinity levels of estuary waters as breeding ground for marine fish, invertebrates and mangrove wetlands
Enable growth, reproductions and small-scale recruitment for a diverse range of flora and fauna
10 000 July–JuneRegulated Kariba River
High High
• Compliance with environmental watering management objective:
– From November 2X10 to April 2X11, 10 000 ML was delivered at a rate of approximately 2000 ML/month to maintain the level of the estuary during a period of low flow. This volume contributed to the maintenance of an abundant estuarine environment.
– As a provision against low flow events, 2500 ML of the watering instruction was carried over to the following reporting period. This is equal to 20% of the allocated general security entitlement (12 500 ML), which is permitted under the Water Resources Management Plan for the Guard water system.
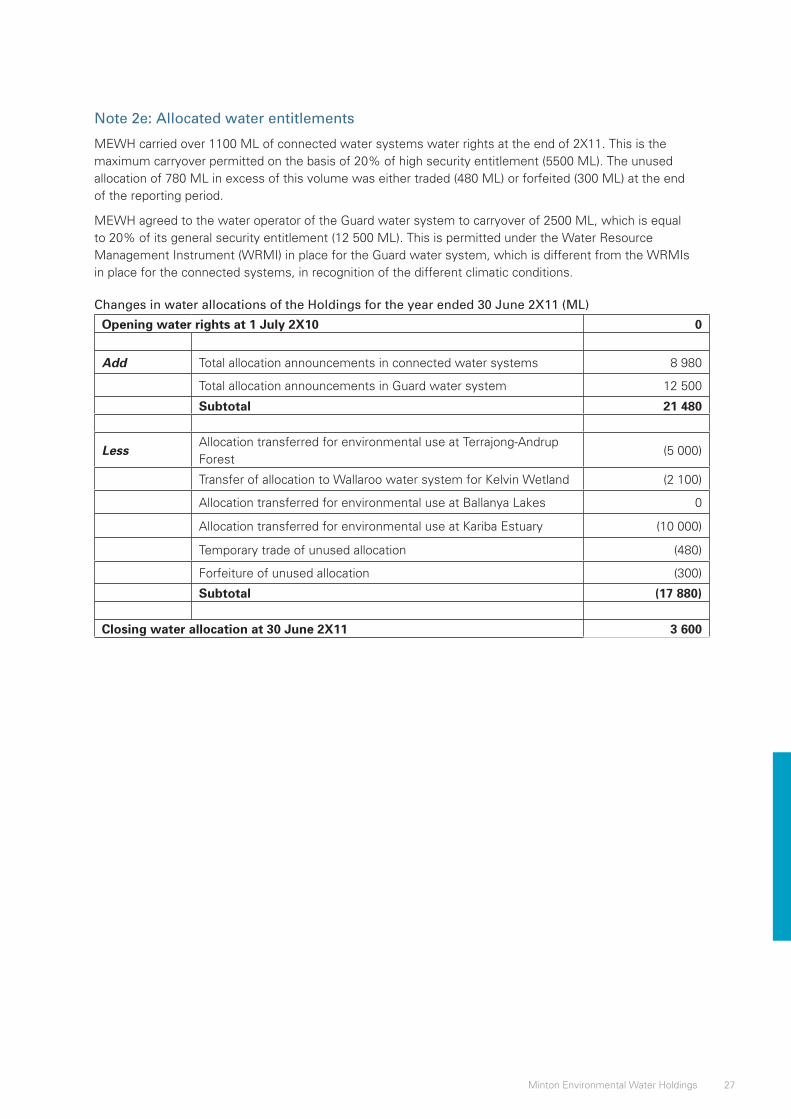
27Minton Environmental Water Holdings
Note 2e: Allocated water entitlements
MEWH carried over 1100 ML of connected water systems water rights at the end of 2X11. This is the maximum carryover permitted on the basis of 20% of high security entitlement (5500 ML). The unused allocation of 780 ML in excess of this volume was either traded (480 ML) or forfeited (300 ML) at the end of the reporting period.
MEWH agreed to the water operator of the Guard water system to carryover of 2500 ML, which is equal to 20% of its general security entitlement (12 500 ML). This is permitted under the Water Resource Management Instrument (WRMI) in place for the Guard water system, which is different from the WRMIs in place for the connected systems, in recognition of the different climatic conditions.
Changes in water allocations of the Holdings for the year ended 30 June 2X11 (ML)
Opening water rights at 1 July 2X10 0
Add Total allocation announcements in connected water systems 8 980
Total allocation announcements in Guard water system 12 500
Subtotal 21 480
LessAllocation transferred for environmental use at Terrajong-Andrup Forest
(5 000)
Transfer of allocation to Wallaroo water system for Kelvin Wetland (2 100)
Allocation transferred for environmental use at Ballanya Lakes 0
Allocation transferred for environmental use at Kariba Estuary (10 000)
Temporary trade of unused allocation (480)
Forfeiture of unused allocation (300)
Subtotal (17 880)
Closing water allocation at 30 June 2X11 3 600
28 Illustrative Water Accounting Reports for Australian Water Accounting Standard 1
Note 3: Other disclosures
AWAS 1 paragraphs 151–160
Implementation Guidance B, D and E
Basis for Conclusions paragraphs B147–B150
The future prospects note assists users of general purpose water accounting reports in understanding the extent to which water assets at the reporting date will be available to settle water liabilities and future water commitments within the next 12 months of the reporting date. The volumes presented in this note are a combination of the information found in the Statement of Water Assets and Water Liabilities and assumptions on future commitments and expected inflows.
Information about expected inflows into the water report entity is to be presented under various climatic conditions.
Contingent water assets and contingent water liabilities are not included in the Water Accounting Statements, but are disclosed in the notes.
In order to qualify as a contingent water asset or a contingent water liability, the following criteria must be met:
• Contingent water asset – possible water asset that arises from past events and whose existence will be confirmed only by the occurrence or non-occurrence of one or more uncertain future events not wholly within the control of the management of the water report entity.
• Contingent water liability – possible obligation that arises from past events and whose existence will be confirmed only by the occurrence or non-occurrence of one or more uncertain future events not wholly within the control of the management of the water report entity.
A brief description of each contingent water asset and contingent water liability is provided in the notes.
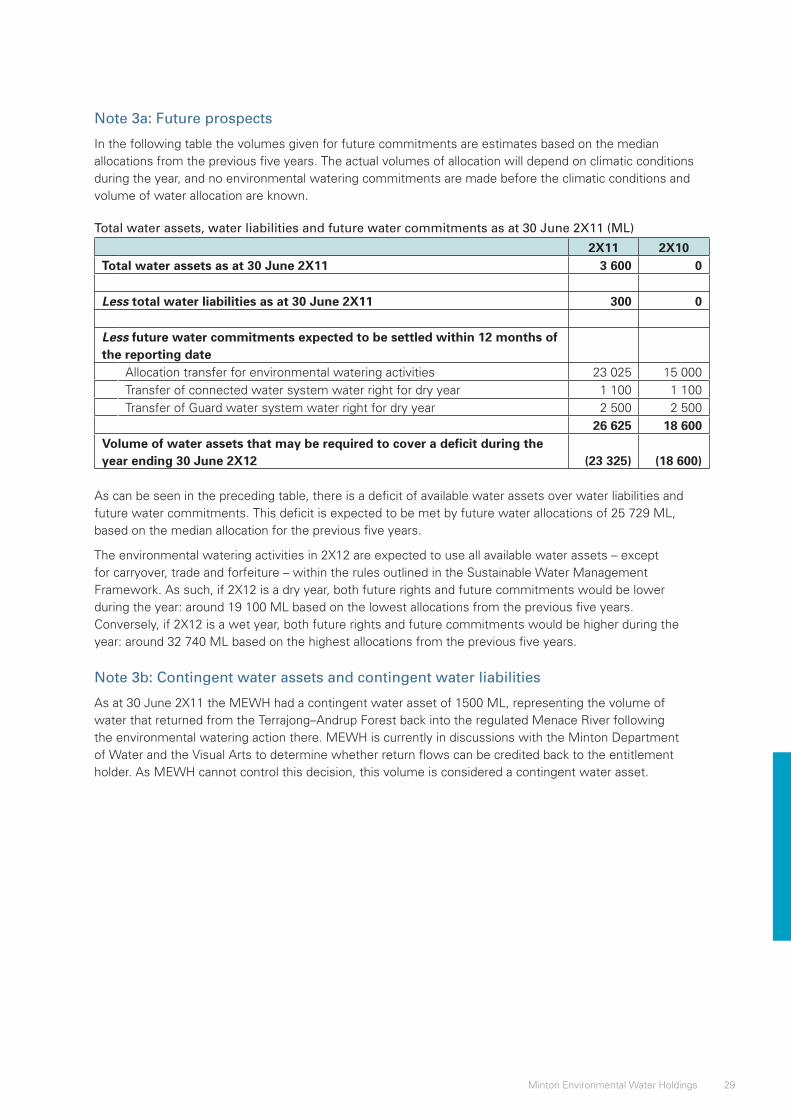
29Minton Environmental Water Holdings
Note 3a: Future prospects
In the following table the volumes given for future commitments are estimates based on the median allocations from the previous five years. The actual volumes of allocation will depend on climatic conditions during the year, and no environmental watering commitments are made before the climatic conditions and volume of water allocation are known.
Total water assets, water liabilities and future water commitments as at 30 June 2X11 (ML)
2X11 2X10Total water assets as at 30 June 2X11 3 600 0 Less total water liabilities as at 30 June 2X11 300 0 Less future water commitments expected to be settled within 12 months of the reporting date Allocation transfer for environmental watering activities 23 025 15 000 Transfer of connected water system water right for dry year 1 100 1 100 Transfer of Guard water system water right for dry year 2 500 2 500 26 625 18 600Volume of water assets that may be required to cover a deficit during the year ending 30 June 2X12 (23 325) (18 600)
As can be seen in the preceding table, there is a deficit of available water assets over water liabilities and future water commitments. This deficit is expected to be met by future water allocations of 25 729 ML, based on the median allocation for the previous five years.
The environmental watering activities in 2X12 are expected to use all available water assets – except for carryover, trade and forfeiture – within the rules outlined in the Sustainable Water Management Framework. As such, if 2X12 is a dry year, both future rights and future commitments would be lower during the year: around 19 100 ML based on the lowest allocations from the previous five years. Conversely, if 2X12 is a wet year, both future rights and future commitments would be higher during the year: around 32 740 ML based on the highest allocations from the previous five years.
Note 3b: Contingent water assets and contingent water liabilities
As at 30 June 2X11 the MEWH had a contingent water asset of 1500 ML, representing the volume of water that returned from the Terrajong–Andrup Forest back into the regulated Menace River following the environmental watering action there. MEWH is currently in discussions with the Minton Department of Water and the Visual Arts to determine whether return flows can be credited back to the entitlement holder. As MEWH cannot control this decision, this volume is considered a contingent water asset.

Notes

For more information, visit:
www.bom.gov.au/water/standards/wasb