Identification of fused cells by genetic...
49
Department of Clinical and Experimental Medicine Final Thesis The use of genetic polymorphisms for identification of fused cells Therese Klippmark LiU-IKE-EX—08/14 Department of Clinical and Experimental Medicine Linköpings universitet SE-581 85 Linköping, Sweden
Transcript of Identification of fused cells by genetic...

Department of Clinical and Experimental Medicine
Final Thesis
The use of genetic polymorphisms for identification of
fused cells
Therese Klippmark
LiU-IKE-EX—08/14
Department of Clinical and Experimental Medicine
Linköpings universitet
SE-581 85 Linköping, Sweden

Department of Clinical and Experimental Medicine
Final Thesis
The use of genetic polymorphisms for identification of
fused cells
Therese Klippmark
LiU-IKE-EX—08/14
Supervisor: Bertil Lindblom and Helena Nilsson
National Board of Forensic Medicine
Examiner: Per-Eric Lindgren
Department of Clinical and Experimental Medicine
Linköpings universitet
SE-581 85 Linköping, Sweden

Abstract
Metastasis is a feared aspect of cancer and little is known about the underlying mechanisms. It
is proposed that metastasis is caused by cell fusion between tumour and immune active
phagocyte cells, for example macrophages. Such hybrid cells could then develop immortality
and chemo tactic mobility. In two different systems it was examined whether it is possible to
detect variation in cancer cells that would explain an initial fusion between tumour cells and
leukocyte cells. Both systems included use of STR markers. Human colon carcinoma cells,
which originally had been grown in nude mice, were investigated with mouse specific
primers. These showed no trace of mouse DNA, which they most probably would have if cell
fusion had occurred. Human breast cancer cells grown in nude mice, that had received
injection of stem cell from male blood, showed no presence of Y-chromosomes. Blood, which
was analyzed from one of the mice, showed a weak presence of something else than just
mouse DNA. The result was however vague and hard to evaluate, and tries to reproduce the
positive outcome failed. No evidence, which indicated that cell fusion occurred, was possible
to demonstrate. On the other hand, there are previous studies that show how metastases can
express macrophage specific properties, which gives all reason for further investigations.

Sammanfattning
Metastaser är en fruktad komplikation vid cancersjukdomar, men vad som ligger bakom
utvecklingen av dessa dåligt känt. En teori är att metastaser skulle kunna uppkomma genom
att en tumörcell och en immunaktiv cell, som till exempel en makrofag, fuserar med varandra.
En tumöromvandlad cell saknar förmågan att gå i apoptos medan en makrofag har
kemotaktisk mobilitet. En ny cell som bildats genom fusion skulle kunna ärva båda dessa
egenskaper och således ha egenskapen att dela sig oändligt antal gånger och förmågan att röra
sig ut i kroppen och etablera sig i olika vävnader. Denna teori har funnits länge, men hitintills
finns inga entydiga bevis för att det är på det här sättet. I den här studien undersöktes det om
man med hjälp av STR markörer kan påvisa någon variation i tumörceller som skulle kunna
förklara en ursprunglig fusion mellan tumörcell och immunaktiv cell. Två olika system
analyserades. I det första systemet undersöktes coloncancerceller från människa, som hade
odlats i möss, med musspecifika primers. Inga spår av DNA från mus kunde påvisas, vilket
det troligtvis skulle ha gjort om cellfusion förekommit. Det andra systemet involverade
undersökningar av kvinnliga bröstcancerceller som fått växa i möss, till vilka manliga stam-
celler injicerats. Ingen närvaro av Y-kromosomer kunde påvisas. Blod från en mus som
undersöktes indikerade på att något annat än bara musceller fanns i blodet men resultaten var
mycket svaga och svåra att utvärdera. Resultatet kunde inte upprepas. Inga belägg för att
cellfusion förekommit gick att påvisa med någon av dessa undersökningar. Trots att vi i denna
studie inte kunnat finna bevis som stödjer cellfusionsteorin så finns det ändå tidigare underlag
som gör det, till exempel att metastaser kan uppvisa makrofagspecifika egenskaper. Det gör
att det finns all anledning att undersöka saken vidare.

Abbreviations and explanations
BLAST Basic local alignment search tool. http://blast.ncbi.nlm.nih.gov
CE Capillary Electrophoresis
Crossed linked Water that is crossed linked with ultraviolet light giving DNA
MilliQ water (deoxyribonucleic acid) free water.
DNA profile A unique and unalterable pattern, specific for one person only and
is the same for all tissues and body fluids.
Ensembl http://www.ebi.ac.uk/ensembl/
Entrez Genome http://www.ncbi.nlm.nih.gov/sites/entrez
FISH Fluorescent In Situ Hybridisation
KM12C Parental cell line of colon cancer that is poorly metastatic.
KM12SM Highly metastatic colon cancer cell line deriving from KM12C and
have been harvested in nude mouse, diploid.
KM12L4 Highly metastatic colon cancer cell line deriving from KM12C and
have been harvested in nude mouse, tetraploid.
MCF-7 One of the most common human breast cancer cell lines.
PCR Polymerase chain reaction
PSQ Pyrosequencing
STR Short tandem repeats
Tm Melting temperature

Table of contents
INTRODUCTION .................................................................................................................... 6
CELL FUSION AND CANCER METASTASIS .................................................................................. 6
THE AIM OF THE PROJECT ........................................................................................................ 6
NATIONAL BOARD OF FORENSIC MEDICINE .............................................................................. 7
THEORETICAL BACKGROUND ........................................................................................ 8
THE CELL FUSION AND CANCER THEORY ................................................................................. 8
Cell fusion .......................................................................................................................... 8
Cancer initiation and progression ..................................................................................... 9
The nude mice model ........................................................................................................ 10
Microchimerism ............................................................................................................... 10
Metastatic cancer cells due to cell fusion ........................................................................ 11
BIOINFORMATICS AND COMPUTER TOOLS FOR PRIMER DESIGN .............................................. 12
Primer design ................................................................................................................... 12
Basic local alignment search tool - BLAST ..................................................................... 13
Ensembl ............................................................................................................................ 14
Pyrosequencing assay design software ......................................................................... 14
GENOMIC PROFILING ............................................................................................................. 15
The biology ....................................................................................................................... 15
STR analysis ..................................................................................................................... 16
Y-STR analysis.................................................................................................................. 16
Polymerase chain reaction - PCR .................................................................................... 16
MATERIALS AND METHODS........................................................................................... 18
DNA EXTRACTION ................................................................................................................ 18
Extraction from tissue ...................................................................................................... 18
Extraction from blood ...................................................................................................... 18
PCR AMPLIFYING .................................................................................................................. 19
Mouse specific STR .......................................................................................................... 19
Human STR ...................................................................................................................... 19
Y-chromosome STR .......................................................................................................... 20
CAPILLARY ELECTROPHORESIS AND DATA ANALYSIS ............................................................ 20
Mouse specific STR .......................................................................................................... 20
Human STR ...................................................................................................................... 21
Y-chromosome STR .......................................................................................................... 21
ETHICAL PERMISSIONS .......................................................................................................... 21
PART I – INVESTIGATION OF COLON CARCINOMA CELL LINES ................................................ 21
Design of mouse specific primers..................................................................................... 21
Reaction optimization ....................................................................................................... 23
Investigation of human colon tumour cell lines ............................................................... 24
PART II – INVESTIGATION OF BREAST CANCER CELL LINE ..................................................... 24
Breast cancer cell line DNA profile ................................................................................. 25

Male donor stem cell DNA profile ................................................................................... 25
Investigation of human breast tumour cells with STR profiling ...................................... 25
Sensitivity and inhibitory tests.......................................................................................... 26
RESULTS ................................................................................................................................ 27
PART I – INVESTIGATION OF COLON CARCINOMA CELL LINES ................................................ 27
PART II – INVESTIGATION OF BREAST CANCER CELL LINE ..................................................... 28
Breast cancer cell line DNA profile ................................................................................. 28
Male donor stem cell DNA profile ................................................................................... 29
Investigation of human breast tumour cells with STR analysis ....................................... 29
Sensitivity and inhibitory tests.......................................................................................... 32
DISCUSSION ......................................................................................................................... 33
CONCLUSIONS AND FUTURE RESEARCH .................................................................. 37
ACKNOWLEDGEMENTS ................................................................................................... 38
REFERENCES ....................................................................................................................... 39
6
Introduction
Cell fusion and cancer metastasis
It is well-known that cell fusion generates viable cells and has a major role in mammalian
development and differentiation (Ogle et al., 2005). Cell fusion is also proposed to have
functions, which can promote diseases, especially cancer development and progression
(Duelli and Lazebnik, 2003; Larsson et al., 2008). The idea that cell fusion contributes to
tumour progression was first proposed several years ago. In 1911 the German pathologist,
Otto Aichel, presented a theory that tumour malignancy and metastasis is a consequence of
cell hybridization between tumour cells and white blood cells. These could be macrophages or
other bone-marrow derived cells (Pawelek, 2005). When two cells fuse, a new cell with traits
and capabilities originating from both cells may be obtained (Fiedl, 2005). By this view, a
fusion of tumour cells and tumour invading-leukocytes could develop both immortality and
chemo tactic mobility. The new hybrid cells would have unrestrained growth from the tumour
cells and low tissue stringency from the leukocytes (Rachkovsky et al., 1997). It was this
combination of extra and different chromosomes from two cell types Aichel meant could lead
to a phenotype with metastatic behavior, that is to say a malignant cell (Pawelek and
Chakraborty, 2008).
So far it has been difficult to show this theory by objective facts and it still lacks proof (Fiedl,
2005), but nothing that contradicts this theory has either been found (Pawelek, 2005). Recent
findings, however, promote cell fusion as a factor for metastasis progression. For example,
macrophage specific surface structures have been found in breast cancer cells in 48 % of 127
studied patients (Shabo et al., 2008) and Y-chromosomes have been found in metastases of
female tumour cells (Guettier et al., 2005). Studies on mice also show that metastatic cells can
express multiple macrophage reminding characteristics (Huysentruyt et al., 2008).
The aim of the project
The aim of this project was to see if it, with STR (short tandem repeat) analyses, was possible
to observe signs of cell fusions between tumour cells and immune cells in cancer metastasis.
The project was a part of a more extensive study, in which several more persons were
involved. The cell fusion hypothesis is neither new nor proved, so to increase chances for
proof of the problem was viewed from several angles and the project divided into three parts.
The first part included an investigation of human tumour cells, originating from a colon
carcinoma cell line, transplanted into nude mice and harvested from occurring metastases.

7
The question was to see if the cell lines from the harvested metastases had any DNA
(deoxyribonucleic acid) that originated from the mouse genome. If it was possible to find
mouse DNA in the metastasis cell lines this would have indicated that a cell fusion between
human tumour cells and mouse leukocytes had occurred. The investigation included specific
DNA sequences for a small part of some of the mouse chromosomes.
The second part included an investigation of human tumour cells, originating from a breast
cancer cell line, transplanted into nude mice and transfused with human stem cells obtained
from male blood donors. The intention was to look for presence of Y-chromosome markers as
a sign that cell fusions can be of primary importance for development of cancer metastases.
A third part would have involved research for Y-chromosome markers in metastases from
female patients who received male blood during earlier surgery. Previous investigations have
been performed on fixated material and Y-chromosome markers were observed. This result
promotes a fusion between tumour cells and immune stem cells, originating from the blood
transfusions, but it can also be a result of microchimerism, or a contamination.
National board of forensic medicine
The national board of forensic medicine is a public authority that works actively to ensure
justice in Sweden. The board was formed in 1991 and consist of four different fields of
operations: forensic genetics, forensic toxicology, forensic medicine and forensic psychiatry.
The board departments are based in six areas around the country and accumulate a wide range
of professional knowledge that ensures a consistent level of expertise in the legal system. The
department of forensic genetics, located in Linköping, prime task is paternity investigations,
but all kind of family analyses are performed, for example establishment of asylum and
family reunion cases. The departments DNA analysis skills are also useful in identification
cases, for example in the tsunami catastrophe this board had a major role.
This cell fusion project does not lie in the frame of the national board of forensic medicine’s
commission activity. It is however an opportunity where their expertise within genetics have a
great contribution potential. Besides, the board’s everyday method, works exceptionally well
for performing cell fusion investigations. Research like this also challenges the technique in
use and leaves room for development.

8
Theoretical background
The cell fusion and cancer theory Cell fusion
Cell fusion is the process where two or more cells merge into one (Duelli and Lazebnik,
2003). This process is fundamental and necessary in the formation of vital cells. Fertilization,
tissue regeneration, placenta, bone and muscle development and the immune response system
are some of the biological processes in which involvement of cell fusion is important (Chen
and Olson, 2005). Cell fusion might also participate in stem cell differentiation and is thought
to promote diseases, especially cancer development and progression (Duelli and Lazebnik,
2003, Larsson et al., 2008)
The mechanisms by which cells interact and fuse are complex and consist of multiple steps.
These involve cell-cell recognition, adhesion and membrane merging (Duelli and Lazebnik,
2003; Tysnes and Bjerkvig, 2007). Although cell fusion occurs and is important in all life
forms, little is known about the underlying mechanism. Knowledge of cell-cell fusion has
however come from study of virus-cell fusions. It is suggested that cell-cell fusions share the
same mechanism despite of cell type (Chen and Olson, 2005; Ogle et al., 2005).
A widely accepted theory for the cell fusion process is explained by viral entry (Ogle et al.,
2005). Factors which seem to be involved in regulation of the cell fusion process are:
receptors and ligands, membrane domain organizing proteins, proteases, signaling molecules
and fusogenic proteins (Larsson et al., 2008). Initially, in order for two membranes to
approach each other and fuse, energy is required. This might be facilitated by a ligand-
receptor interaction. Also, fusogenic proteins show direct involvement in the membrane
merging process (Ogle et al., 2005). One family of fusogenic proteins, called syncytin, is
proposed to be involved in mammal cell fusion. These proteins represent conserved
endogenous retroviral (Env) sequences and binds cell membranes closer together by forming
alpha-helical bundles (Larsson et al., 2008). Since viruses overall has the ability to fuse cells
and fusogenic properties in many cases are unclear, one explanation is that fusion is caused by
viruses or virus like particles (Duelli and Lazebnik, 2007). When the external membrane layer
comes in contact, an hour-glass like structure is shaped and when they fuse a stalk-like
formation is formed. Tensions in this extending structure also promote the inner membrane
layer to fuse and a fusion pore is created, forming one single cell. (Ogle et al., 2005)

9
Cell fusion can occur both between cells of the same lineage and differentiation called
homotypic cell fusion, or between cells of different origin called heterotypic cell fusion
(Friedl, 2005). Homotypic fusion can lead to formation of either a cell with multiple nuclei
known as syncyticum, or a cell with one nucleus known as synkaryon. Heterotypic fusion
generates hybrid cells, either single nucleated synkaryons or multi nucleated heterokaryons
(Ogle et al., 2005). In all cases the fused cells forms a new cell with traits and capabilities
originating from both cells (Friedl, 2005). Synkaryons often do proliferate and in rare cases
these could explain progress of tumours (Ogle et al., 2005). Especially fusion caused by
viruses has a correlation to cancer initiation and progression (Duelli and Lazebnik, 2007).
Cancer initiation and progression
Cancer cells have the ability to proliferate despite of normal controls on cell division and are
malignant when they can survive and colonize new sites (Alberts et al., 2002). The initiation
of tumours is controlled by at least three classes of cancer critical genes: Proto-onco genes,
tumour suppressor genes and genes that help repairing DNA. Normal cell growth and
differentiation has to be changed in order for tumours to develop (Tysnes and Bjerkvig,
2007). The sporadic nature of cancer development may involve a combined set of molecular
mechanisms and there are two models provided to explain this. Accumulation of critical
mutations in the regulating genes leading to cancer is one theory and formation of aneuploid
cells leading to genetic instability is the other one. Both events are often involved but whether
mutation or aneuploidy comes first is not clear and is still debated (Duelli et al., 2005; Tysnes
and Bjerkvig, 2007).
Another known event that may play an essential role in cancer initiation and progression is, as
mentioned, cell fusion. When cells merge, loss, disjunction or translocation of chromosomes,
causing chromosomal abnormality, can occur. This causes mostly cells to undergo apoptosis.
Some events, such as immediate chromosomal doubling, might however decrease the chances
for this, since the loss of chromosomal material would be compensated. Fusions might also
increase the likelihood of producing aneuploid cells, which in turn can lead to cancer. By this
view, cell fusion has potential to promote cancerous cells. (Duelli et al., 2005)
Metastasis is a feared aspect of cancer since it is the primary cause of morbidity and mortality
for the patients. This phenomenon is processed in multiple steps, where the cancer cells
detach from the mother tumour, invade surrounding tissues and vessels, and establish
colonization and proliferation of lymph nodes and distant organs. Cancer cells are often first
and preferably spread to liver, lung, bone, and pleura since these organs promote tumour cell

10
growth. Studies, however, show that only a tiny proportion of all malignant cells manage to
escape attack from the immune system, survive and produce daughter tumours at new sites
(Alberts et al., 2002; Huysentruyt et al., 2008). Notable documentation is that metastases and
poor prognoses correlate with aneuploidy and new gene expression patterns (Pawelek, 2005).
The nude mice model
Since the mouse or mus musculus shows great similarity with human genomics it often serves
as model organism. They do not only share about 99% of the genes, they also share common
diseases (Waterston et al., 2002). These include cancer, in which research the mouse has been
a model for a long time (Peters et al., 2007). The mouse is unsurpassed for research because it
is small, hardy, a rapid breeder and can be manipulated cost-effectively. Comparison between
mice and humans are possible because likewise the Human Genome Project, the mouse
genome also has been sequenced. To sum up, with mouse as a model organism, human genes
can be studied and knowledge about diseases can be gained (Waterston et al., 2002).
Nude mice are homozygous for the recessive nude mutation gene. This makes them hairless
and born with almost totally absence of thymus. Thymus generates T-cells lymphocytes that
are essential for the immune system. Lack of thymus therefore makes them immunodeficient
and excellent laboratory animals, because this gives them the ability to maintain foreign
tissues. In cancer research, nude mice are a great breakthrough. Since they cannot reject
transplants, a tumour can be studied in an animal system. (JAX Mice Database, 2008)
Microchimerism
Chimerism is when two individually derived populations of cells that differ genetically are
observed in the same organism or organ. If one of the cell populations is presented in low
concentration among the majority of the other, it is called microchimerism (Strachan and
Read, 2004). This phenomenon is frequent in female moms and may be due to transfer of
foetal cells during pregnancies, called foetal microchimerism (Gadi and Nelson, 2007). Male
microchimerism is the presence of male cells in adult women originating from previous male
offspring. Besides cell transfer in pregnant women, micro chimeras could survive across
generations or occur as a result of blood transfusion or transplants, for example of bone
marrow (Guettier et al., 2005). Chimeric foetal cells appear to have properties reminding of
stem cells and may give protective effects against malignant cells (Gadi and Nelson, 2007;
Guettier et al., 2005), in contrary to hybrids of tumours and transplanted bone-marrow derived
cells, which are consistent with cancer progression (Pawelek, 2005).

11
Metastatic cancer cells due to cell fusion
The role of cell fusion and the risk with formation of synkaryons in cancer development is
widely discussed and has been since the 1980s (Morikawa et al., 1988; Giavazzi et al., 1986)
The first time cell fusion was mentioned as a phenomenon which could promote initiation and
progression of tumours, was by a German named Otto Aichel, and the year was 1911. The
theory he presented intended that tumour malignancy and metastasis is a consequence of an
inappropriate heterotypic cell fusion between tumour cells and leukocytes, for example
macrophages (Pawelek, 2005).
Macrophages, which are formed by proliferation and differentiation of the bone marrow
derived leukocytes called monocytes, are foremost related to the innate immune response but
they are also an important link to the adaptive immune system (Fogg el al., 2006; Richardsen
et al., 2008). Macrophages have however also shown to be significant in tumour cell
migration, invasion and metastasis (Shabo et al., 2008). Recent studies has found that
expression of macrophage properties may have prognostic importance in cancer, especially in
poor prognosis with development of metastasis, and supports Aichel’s theory. That metastatic
cells could express macrophage specific markers is documented, but if these markers are
result of cell fusion between leukocytes and tumour cells is however not certain (Pawelek and
Chakraborty, 2008; Huysentruyt et al., 2008; Shabo et al., 2008).
When cell fusion occurs a new cell, which will inherit traits and characteristics from both
parental cells is formed (Friedl, 2005). For example, when cell fusion occurs between a
mobile bone-marrow derived cell with low tissue stringency and an immortal tumour cell with
unrestrained growth, a new hybrid cell with both chemo tactic mobility and immortality may
be formed (Rachkovsky et al., 1997). Phenotypes with these new traits can occur when extra
and various chromosomes are mixed and might be compared with a metastatic behaviour and
thereby malignancy. With this insight it is easy to imagine how a metastatic cell could express
macrophage specific markers (Pawelek and Chakraborty, 2008).
Enhanced metastatic potential in tumour-macrophage hybrids is acknowledged but whether
hybrids are formed naturally as a step in human malignancy has been hard to prove (Pawelek,
2005; Rachkovsky et al., 1997). Several studies have however promoted metastatic
progression due to cell fusion. Some examples follows:

12
Bioinformatics and computer tools for primer design
Bioinformatics is an interdisciplinary field were biology and computer science is combined.
In this discipline, methods in mathematic-, statistic- and computer science are used for large-
scale analysis of biological oriented data. Software systems are used for sorting, organizing,
processing and displaying biological information. This makes the enormous and varied data
that are generated more easy to handle and understand. The data is stored and organized into
different databases and diverse applications are used to analyze and present the data in a
biologically significant way. (Luscombe et al., 2001)
Primer design
An important factor for successfulness in biochemistry or molecular biology techniques, such
as Polymerase chain reaction (PCR) and DNA sequencing, is proper primer design.
Example 4
Presence of Y-chromosome markers in cells from female patients could be an indication that cell fusion is
involved in malignancy. Y-chromosomes in female are however frequently observed as a result of male
microchimerism which could occur due to previous pregnancies with male foetues, transfusion or
transplantation. It is therefore important to establish that the presence of the Y-chromosomes in the
metastasis de facto is due to cell fusion and not a result of micro chimers.
Gadi and Nelson, 2008; Guettier et al., 2005
Example 3
The latest study presented by Huysentruyt et al., (2008) provides the first evidence in mouse that metastatic
cells can express multiple macrophage reminding characteristics both molecular and behavioral.
Morphology, surface adhesion, gene expression, phagocytosis and lipid composition is included. By better
understanding the biological processes in cancer potential treatments can be evaluated. A therapy which
targets cells with macrophage properties is suggested to be a way for effectively dealing with cancer.
Huysentruyt et al., 2008
Example 2
In a study presented by Shabo et al., 2008, specific macrophage surface structures, CD163, had been found
on breast cancer cells in 48 % of 127 studied patients. This antigen associates with a more aggressive disease
with occurrence of metastasis and thereby reduced life length. Also, overproduction of the macrophage
stimulation factor 1 receptor, CSF-1, have been shown to correlate with poor prognosis in breast cancer.
Shabo et al., 2008
Example 1
Pawelek describes in an article two patients who show indications of cell fusion occurrence between tumours
and transplanted cells. Both have developed metastases after they received bone-marrow transplantations.
One patient was a child who received bone-marrow from his brother. The metastases kept A alleles. Since
the patient’s blood type was 00 and the brother’s was A0 it must have come from the donor, most likely
developed due to cell fusion. The other patient was a female who received bone-marrow from her son. The
cancer cells had trisomy 17 and a Y-chromosome. If the trisomy was a result of cell fusion or a result of
trisomy in the patients is unclear, however the cells would have been hybrids.
Pawelek, 2005

13
Table 1. Seven general guidelines for primer design (Information from: Butler, 2005; Coyne et al., 2001).
Guideline Factor and affection
1
Primer length should be between 17-30 bases. The optimum length is however dependent upon
the G+C contents and the melting temperature (Tm) of the other primer in the pair. The Tm
increases with the primer length and with increasing G+C contents.
2 The G+C contents in primers should be 50-60%.
3 Primers 3’-end should terminate in G or C or CG or GC because it increases priming efficiency.
4 The Tm of the primers should be fairly equal and a degree around 55-80C is preferred. Tm is the
temperature where 50% of the DNA have been separated and 50% form stable double helix
structure.
5 The primers 3’-ends must not complement each other. If they do undesired pairings such as
´primer dimers´ could occur and less primer for the final reaction is then available.
6
The primer sequence must not complement itself. No more than four base pair in series should be
complementary. Self-complementary primers have the ability to build hairpin loops and less
primer would then be available for the intended reaction.
7 Areas of Gs and Cs are more stable than As and Ts areas because of theirs triple bounding
capacity. The 3’-end must therefore not terminate with more than three Gs or Cs. If it does
mispriming could occur at GC rich areas.
Short synthetic oligonucleotides are designed after consideration of various aspects and
desirable predictions about the primers. Factors that are of critical importance and can affect
the PCR are primer length, G+C contents, 3’-end termination and melting temperature (Tm). It
is also important to avoid sequences that promote mispriming, synthesises ´primer dimers´ or
complement itself. More detailed information about these factors is presented in Table 1. In
order to design specific primers, complex enough, so the likelihood of annealing to sequences
other then the target is very low, some of the factors might however be hard to comply with.
Additionally, characteristics such as primer specificity to the target region must be weighed
against the other factors affecting the PCR. (Butler, 2005; Coyne et al., 2001)
Basic local alignment search tool - BLAST
Basic local alignment search tool is an alignment program that searches for similarities
between sequences. The program takes a query (the user’s sequence), indexes it and scans it
against a database. The database can represent a genome, for example the human or the mouse
genome. All combinations between the query and database are compared and BLAST returns
a list of matches. Besides performing alignments, BLAST scores each alignment and provides
them with statistical significance information in form of expectation values. The lower
expectations value the better significance. BLAST is a common and widely used tool in
bioinformatics research and is available at the national centre for biotechnology information
(NCBI) web site. (Johnson et al., 2008)

14
Ensembl
Ensembl is one of many applications which can handle genomic data effectively. In this
system, the web site is the part that provides access to a wide range of genomic information.
For example, the genome from mammals, such as human and mouse, is available through
Ensembl. Except to gain information of organisms, irrespective of if it is specific information
from one individual or more wide information from multiple organisms, this web site also
provides similarity searches through BLAST. Ensembl is a dynamic software system and it
contributes to improve analysis of genomic information and its usability. (Stalker et al., 2004)
Pyrosequencing assay design software
Pyrosequensing (PSQ) assay design is a simple and fast tool. This program enables design of
functional assays for almost any genetic marker (Figure 1). Genetic studies can often vary in
application needs and this program has integrated functions, both for PCR and sequencing
design, which offers flexibility. For example, PCR primer setting can be changed. Change in
primer length and position are easily made, which alters G+C contents and Tm. A primer set
can also be locked in a desired position for analysis and score settings. (Biotage, 2008)
Sequences can be entered direct from databases, such as BLAST, GeneBank and Ensembl. By
simply running the program, complete primers sets are generated, both for PCR and DNA
sequencing. PSQ assay design tool analyses all primer sets and score them. The primer set
with highest likelihood of performing a successful assay gets the top score. (Biotage, 2008)
Figure 1. Illustration of the Pyrosequensing assay design tool showing a part of the mouse chromosome 18
sequence. Forward primer and reversed primer sequences are presented in the upper right corner under primer
set. Examples of primer combinations for this sequence are sorted after score in the right of the figure (best
score in the top). In the table, length, position, melting temerature and G+C contents are presented. Changes
can easily be made by pulling the primers along the sequence in the top of the figure. (Print screen from
pyrosequensing assay design software)

15
Genomic profiling
Most of the human genome (99.9%) is identical among all individuals but a small percent
differ. Genomic or DNA profiling focuses on these regions and makes discriminations
between individuals possible, by analyzing DNA structures (Jackson and Jackson, 2008).
The biology
In the human genome there are many areas of non-coding DNA. In these areas, there are
regions of repetitive DNA, which forms sequences with detectable patterns. The sequence
length varies when the number of repeats alters. Some regions show great variations and by
detecting a number of these at the same time an individual pattern can be created. Alec
Jeffreys was, in 1984, one of the first to show genomic profiling (Jeffreys et al., 1985).
Modern DNA profiling is based on short tandem repeat (STR) regions (Figure 2a). The most
prevalent method for genomic profiling uses these and is based on PCR. By definition, the
lengths of STRs are short, between 1 and 4 base pairs and the sequence length is estimated by
numbers of repeats. For a given STR, the number of repeated sequences will vary depending
on how many was inherited from each parent.
Figure 2. DNA profile generated in GeneMapper ID v3.1. (a) Short Tandem repeats - The sequence is repeated.
How many times depends on the inherited allele. In the example there is one allele with ten repeats and one with
twelve. Every person carries two alleles for each gene. (b) DNA profile - A unique pattern is created when
several STR markers are combined and it is characteristic for one individual. Statistically no other person could
have the exact same profile, except for identical twins. One peak for a given STR marker means that a person
has two alleles with the same number of repeats and two peaks means different number of repeats. For example
the STRs in (a) with ten and twelve repeats could look like the peaks for the STR marker CSF1PO in (b).
(b) DNA profile
CATG
G 12 repeats
CATG
G CATG
G CATG
G CATG
G CATG
G CATG
G CATG
G CATG
G CATG
G CATG
G CATG
G CATG
G CATG
G CATG
G CATG
G CATG
G CATG
G CATG
G CATG
G CATG
G CATG
G
10 repeats
(a) Short Tandem Repeats 5’→ 3’

16
Genetically, individuals differ because they contain different combination of alleles. This
combination of alleles for a couple of selected STR markers creates a DNA profile, when
sequenced and examined together (Figure 2b). A DNA profile is a unique and unalterable
pattern characteristic for one individual only, no matter which tissue and body fluid analyzed
(Jackson and Jackson, 2008).
STR analysis
STR analysis uses these highly polymorphic regions of short repeated DNA sequences in
order to create a profile. Four nucleotide repeats is most common in human profiling, for
example CATG. Analysis of shorter STR, for example of two or three, tends to generate
stutter products, which are additional peaks beside the true major peak. Because the number
of repeats in different individuals varies, STR of different lengths is created and these can be
used to discriminate between different persons. (Jackson and Jackson, 2008)
Genomic profiling involves analysis of a couple of STR markers on different chromosomes.
The analysis is performed mostly by three major techniques: DNA extraction, polymerase
chain reaction and electrophoresis (Jackson and Jackson, 2008). DNA extraction is a routine
procedure in forensic and molecular analyses. From a biological sample DNA is isolated and
in order to receive enough DNA for PCR only a few nucleated cells are needed. PCR
amplifies the selected STRs with use of target specific primers and then electrophoresis is
used for sequencing. In capillary electrophoresis (CE) and data analysis two small peaks will
occur if a person is heterozygous for a STR marker, and one great peak will occur if a person
is homozygous. A profile is created by combination of such peaks for a number of STR
markers. For example, a primer kit can consist of sixteen different STR markers (Butler,
2005). Statistically, it is impossible for two people to be identical in all markers and they will
be distinguished from each other. Exceptions are identical twins (Jeffreys et al., 1985).
Y-STR analysis
Like the name indicate, this analysis target polymorphic regions on the Y-chromosome. While
STR analysis with the amelogenin marker can distinguish between X and Y chromosomes,
this analysis examine the male Y chromosome only, but does that in multiple locations. This
analysis is for example helpful in cases when related males are investigated. (Butler, 2005)
Polymerase chain reaction - PCR
It was in the mid- 1980s Kary Mullis developed the sensitive and rapid polymerase chain
reaction technique. This enzymatic process is controlled by a thermal cycling and enables
amplification of specific DNA sequences. Reactions are required for the amplification and

17
these consist of a mixture of different components. Important are the two primers that flank
the target region to be copied. Other components are deoxyribonucleotides (dNTPs), which
serve as building blocks, heat stable DNA polymerase such as Taq polymerase and template
DNA for copying. The PCR amplification process commonly consists of three different
temperatures that are repeated 25-35 times as described in Figure 3. The target region is
duplicated within each cycle. This is however only in theory, the actually amount doubled is
dependent on the process efficiency. In all processes this is affected by for example PCR
inhibitors from extracted DNA. (Butler, 2005)
Figure 3. PCR amplification. Specific DNA sequences are copied by a temperature cycle, which is repeated over
and over again for 25-35 times. First in each cycle, double stranded template strands are separated by heat,
~93-95°C. Second, the temperature lowers to about 50-70°C and this enable the primers to anneal to target. At
last, a raise in temperature gives the DNA polymerase an optimal temperature to copy each template by use of
dNTP as building blocks. After synthesis the temperature is raised and the cycle starts all over again.
93-95
50-70
70-75
At a temperature of
93-95°C the dsDNA
is denaturated.
Temperature cycle
DNA synthesizes
at a temperature
about 70-75°C.
A temperature about 50-70°C
allows the primers to anneal.

18
Materials and methods
The methods used to investigate whether cell fusion can be obtained were based on different
configurations of DNA extraction, PCR amplification and capillary electrophoresis. These
were repeated several times during the project, in some cases with adjustments. The
adjustments will be described, while basic descriptions of the techniques are described
initially.
DNA extraction
Three different extraction methods were used. The DNA concentrations were measured in
Ultrospec
2100 pro (Amersham Pharmacia Biotech Abs) regardless of extraction method.
Extraction from tissue
A QIAamp DNA Mini Kit (Qiagen) was used for DNA extraction from tissue. Tissues were
lysated in proteinase K and buffert ATL in 56C. Buffer AL was added and the tube vortexed
and incubated in 70C for 10 minutes. 95% ethanol was added and the contents of the tubes
were pipetted to QIAamp mini spin columns in 2mL collection tubes. The mini spin columns
were centrifuged in 6000g for 1 minute and the collected solution removed. Buffer AW1 was
added, centrifuged and removed like above. Buffer AW2 was added, centrifuged in 1400g for
3 minutes and collected solution was removed. DNA was eluted with Buffer AE in room
temperature for 5 minutes. DNA was collected in clean 1.5 mL microcentrifuge tubes by
centrifuge mini spin columns in 6000g for 1 minute.
Extraction from blood
Extraction from blood was performed in two ways, Qiagen or King Fisher mL extraction.
Qiagen extraction - A QIAamp DNA Mini Kit (Qiagen) was used for extraction. Suspensions
were mixed and incubated for 10 minutes in 56C in Proteinase K and buffer AL. 95%
ethanol was added and the rest of the extraction was performed in the same way as in the
extraction from tissues.
King Fisher mL extraction - Extractions of DNA from EDTA (ethylenediaminetetraacetic
acid) blood were performed in KingFisher tubes (Thermo Labsystems) with program
gDNA2E1.9 or PYROgDNA1 at KingFisher mL instrument (Thermo Labsystems). A
MagAttact
DNA Blood Mini M48 Kit (Qiagen, Cat No. 951336) containing three buffers
and a MagAttact
Suspension B were used. Blood was mixed with buffer ML and

19
MagAttact
Suspension B for 10 minutes. Buffer ML lysate the blood while the suspension
containing magnetic particles binds to DNA and transfer the sample to the following steps.
The sample was washed 3 times in buffer MWI for 2 minutes and once in buffer MWII for 2
minutes. With program gDNA2E1.9 the magnetic particles were dried for 10 minutes and
DNA was then eluted with crossed linked MilliQ water for 5 minutes. With program
PYROgDNA1 the sample were rinsed for 5 seconds and DNA was eluted. The process runs
automatically. KingFisher mL tip comb (Thermo Labsystems) were used as a wall between
the instruments magnet and the magnetic particles.
PCR amplifying
The amplifications were carried out in MicroAmp™Optical 96-well plates (Applied
Biosystems) or in MicroAMP™Strips (Applied Biosystems) and run in 96-Well GeneAMP
PCR system 9700 (Applied Biosystems). Three different amplification setups were used.
Mouse specific STR
The reactions were setup as follows: 1x PCR-buffer II (Applied Biosystems), 1x4dNTPs
(Applied Biosystems), 50% glycerol, 10pmol/L forward primer (Cybergene) (for sequences
see Appendix A), 10pmol/L reverse primer (Cybergene), 5U/L Taq Gold DNA Polymerase
(Applied Biosystems), to each reaction 1L 1ng/L template DNA and 25mM MgCl2 in
altered volumes were added, and crossed linked MilliQ water to a final volume of 10L in
each well. The amplification was run with conditions as follows: 95C for 11 minutes, 30
cycles with 94C, 58.2C and 72C for 1 minute each, then hold at 72C for 7 minutes.
Human STR
A AmpFlSTR® Identifiler® PCR Amplification Kit (Applied Biosystems, Part No. 4322288)
with primers for 15 STR markers and the amelogenin marker, for X- and Y-chromosomes,
was used. The reactions were setup as follows: 1x AmpFlSTR PCR Reaction Mix (Applied
Biosystems), AmpFlSTR Identifiler Primer Set (Applied Biosystems), crossed linked
MilliQ water, 5U/L Taq Gold DNA Polymerase (Applied Biosystems), to the reactions 1L
1ng/L target DNA or 4L AmpF l STR Control DNA 9947A (Applied Biosystems) were
added, and crossed linked MilliQ water to a final volume of 10L in each well. The
amplification was run with conditions as follows: 95C for 11 minutes, 30 cycles with 94C,
59C and 72C for 1 minute each, then hold at 60C for 60 minutes.

20
Y-chromosome STR
A PowerPlex® Y System (Promega Biotech, Cat.# DC6760) with primer kit for 11 STR
markers for the Y-chromosome was used. The reactions were setup as follows: 1x Gold ST*R
10x Buffer (Promega Biotech), PowerPlex 10x Primer Pair mix (Promega Biotech), crossed
linked MilliQ water, 5U/L Taq Gold DNA Polymerase (Applied Biosystems), to the
reactions 1L 1ng/L target DNA or 1.2L 1ng/L 9947 DNA (control X) or 9948Male DNA
(control Y) (Promega Biotech) were added, and crossed linked MilliQ water to a final volume
of 10L in each well. The amplification was run with conditions as follows: 95C for 11
minutes, 10 cycles with 94C and 60C for 30 seconds each and 70C for 45 seconds, 22
cycles with 90C and 58C for 30 seconds each and 72C for 45 seconds, then hold at 60C
for 30 minutes.
Capillary electrophoresis and data analysis
Samples containing 1µL of the amplified product and 8µL in-lane standard were loaded to an
ABI Prism
3100 Genetic Analyzer (Applied Biosystems). It is a DNA analysis system with
sixteen capillaries, which operates parallel and offers efficient sample processing. Contents of
the in-lane standards added, and electrophoresis conditions used, were specific for each
analyzing method. Single stranded conformation of the amplified products was generated by
infusion of formamide. The capillary length was 36 cm and the separation media used was
3100 pop4 polymer (Applied Biosystems).
The data generated throughout CE were analyzed with GeneMapper ID v3.1 software
(Applied Biosystems). The size standards used consisted of DNA fragment of known lengths
and were labelled with respective fluorophore. Allelic ladders for each system were loaded on
to the ABI genetic analyser and enabled allelic calling of the amplified products. For the
designed mouse specific primers, neither size standard nor allelic ladder was available. Peaks
generated, depend on allelic contents, and define a profile specific for one organism. Presence
or lack of peaks, peak height and position were investigated and compared.
Mouse specific STR
A mixture of 1800µL Hi-Di™ Formamide (Applied Biosystems) and 70µL GeneScan™
500ROX™ Size Standard (Applied Biosystems) was used as standard. Sample was injected
for 5 seconds at 3 kV, and the electrophoresis was run in 1100 seconds at 15 kV and 60C.
21
Human STR
A mixture of 1800µL Hi-Di™ Formamide (Applied Biosystems) and 70µL GeneScan™
500LIZ™ Size Standard (Applied Biosystems) was used as standard. Sample was injected for
5 seconds at 5 kV, and the electrophoresis was run in 1400 seconds at 15 kV and 60C
Y-chromosome STR
A mixture of 1800µL Hi-Di™ Formamide (Applied Biosystems) and 70µL Internal Lane
Standard 600 (ILS600) (Promega Biotech) was used as standard. Sample was injected for 5
seconds at 5 kV, and the electrophoresis was run in 1400 seconds at 15 kV and 60C
Ethical permissions
Following ethical permissions have been searched and approved: Performance of animal
testing was allowed by Animal Ethic Research Board in Linköping. The approved permission
is dated 28/11-07 and have dnr 90-07. Use of donor stem cells was allowed by Human Ethical
Research Board. Approved permission is M26-08 and is dated 30/1- 08. The donor was also
Informed Constent. Use of patient samples was allowed by Human Ethical Research Board.
These were, however, never investigated.
Part I – Investigation of colon carcinoma cell lines
The materials analyzed in this first part were the human colon tumour cell lines KM12C,
KM12SM and KM12L4 provided by Åsa Wallin and Xiao-Feng San at Dept. of Medical
Oncology at Linköping University. These were investigated in order to see if it was possible
to find DNA that originated from mouse in the metastasis cell lines, which would have
indicated that cell fusion had occurred. According to Morikawa et al. (1988) KM12C is the
parental cell line, poorly metastatic and diploid. KM12SM and KM12L4 have been derived
from KM12C by repeatedly injected tumour cell into nude mice for growth. These are both
highly metastatic. KM12SM is diploid while KM12L4 is tetraploid.
Design of mouse specific primers
To be able to distinguish mouse cells from human tumour cells, primers specific for mouse
were designed (see Table 2). This was done by use of entrez, Ensembl, BLAST and PSQ
assay design
In order to visualize the mus musculus genome, select ten of the shortest chromosomes and
choose primers, both entrez genome project at NCBI and Ensembl were used. For each
chromosome nucleotide sequences containing 17-30 base pairs, which generate PCR products
22
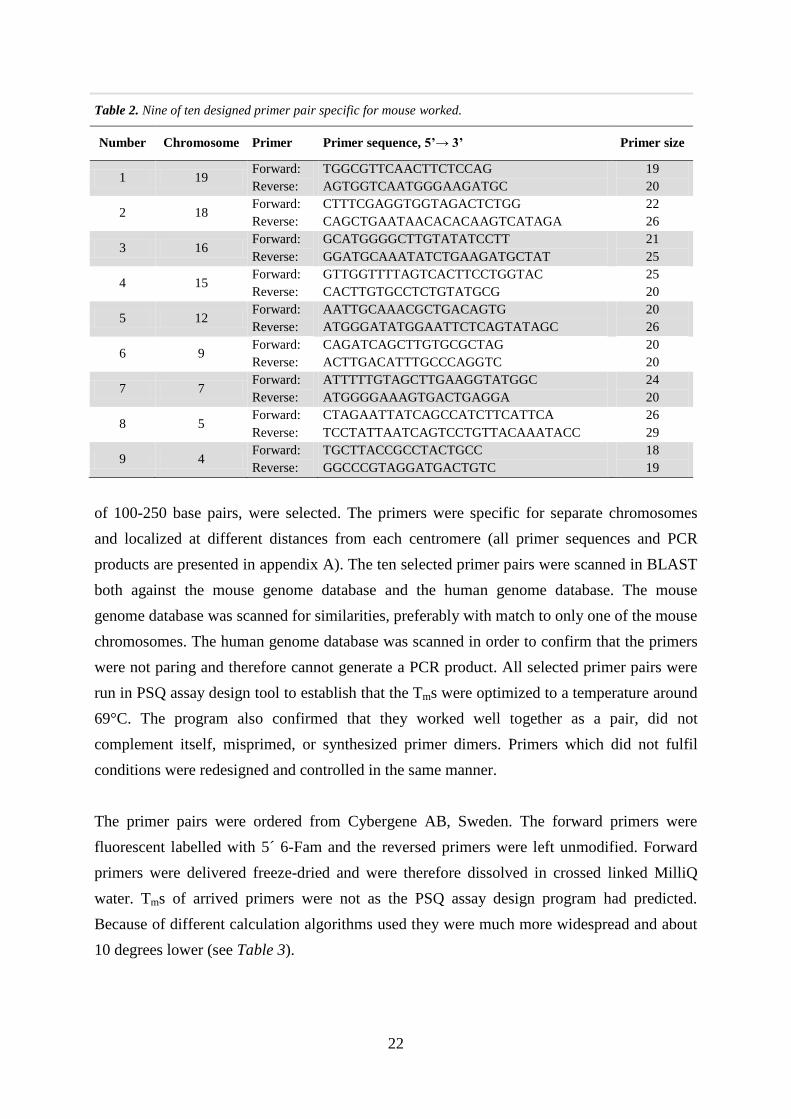
Table 2. Nine of ten designed primer pair specific for mouse worked.
Number Chromosome Primer Primer sequence, 5’→ 3’ Primer size
1 19 Forward:
Reverse:
TGGCGTTCAACTTCTCCAG
AGTGGTCAATGGGAAGATGC
19
20
2 18 Forward:
Reverse:
CTTTCGAGGTGGTAGACTCTGG
CAGCTGAATAACACACAAGTCATAGA
22
26
3 16 Forward:
Reverse:
GCATGGGGCTTGTATATCCTT
GGATGCAAATATCTGAAGATGCTAT
21
25
4 15 Forward:
Reverse:
GTTGGTTTTAGTCACTTCCTGGTAC
CACTTGTGCCTCTGTATGCG
25
20
5 12 Forward:
Reverse:
AATTGCAAACGCTGACAGTG
ATGGGATATGGAATTCTCAGTATAGC
20
26
6 9 Forward:
Reverse:
CAGATCAGCTTGTGCGCTAG
ACTTGACATTTGCCCAGGTC
20
20
7 7 Forward:
Reverse:
ATTTTTGTAGCTTGAAGGTATGGC
ATGGGGAAAGTGACTGAGGA
24
20
8 5 Forward:
Reverse:
CTAGAATTATCAGCCATCTTCATTCA
TCCTATTAATCAGTCCTGTTACAAATACC
26
29
9 4 Forward:
Reverse:
TGCTTACCGCCTACTGCC
GGCCCGTAGGATGACTGTC
18
19
of 100-250 base pairs, were selected. The primers were specific for separate chromosomes
and localized at different distances from each centromere (all primer sequences and PCR
products are presented in appendix A). The ten selected primer pairs were scanned in BLAST
both against the mouse genome database and the human genome database. The mouse
genome database was scanned for similarities, preferably with match to only one of the mouse
chromosomes. The human genome database was scanned in order to confirm that the primers
were not paring and therefore cannot generate a PCR product. All selected primer pairs were
run in PSQ assay design tool to establish that the Tms were optimized to a temperature around
69°C. The program also confirmed that they worked well together as a pair, did not
complement itself, misprimed, or synthesized primer dimers. Primers which did not fulfil
conditions were redesigned and controlled in the same manner.
The primer pairs were ordered from Cybergene AB, Sweden. The forward primers were
fluorescent labelled with 5´ 6-Fam and the reversed primers were left unmodified. Forward
primers were delivered freeze-dried and were therefore dissolved in crossed linked MilliQ
water. Tms of arrived primers were not as the PSQ assay design program had predicted.
Because of different calculation algorithms used they were much more widespread and about
10 degrees lower (see Table 3).
23
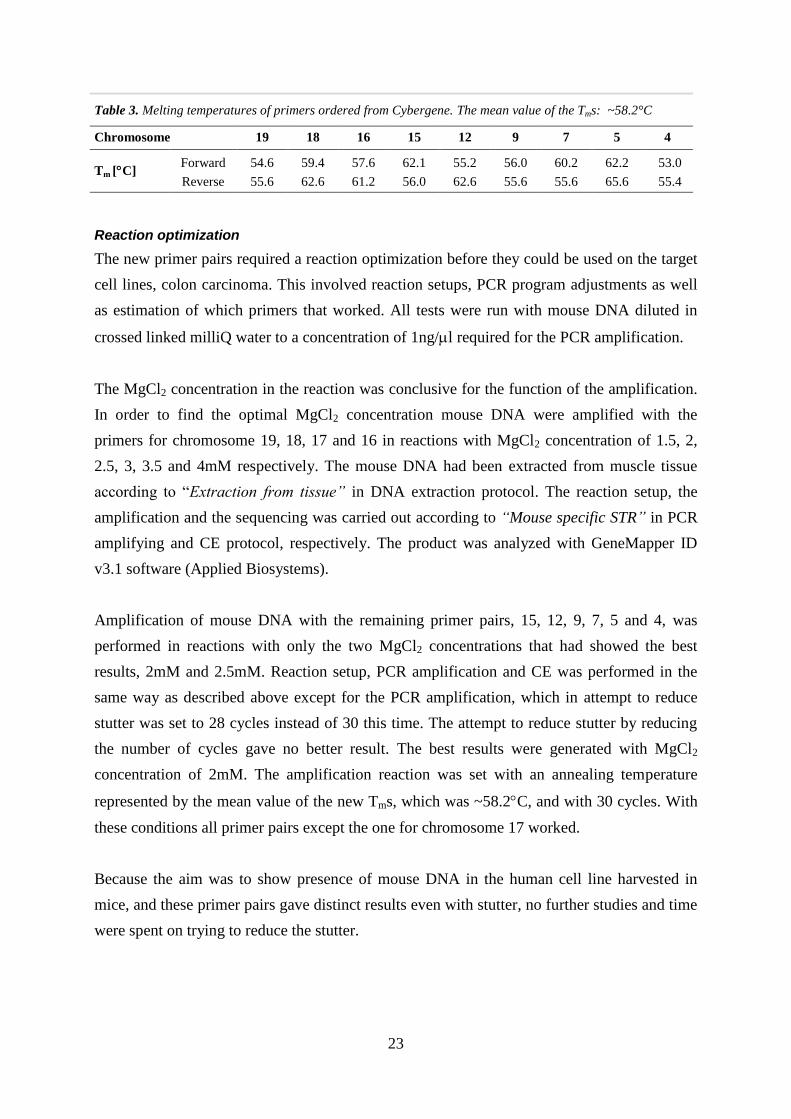
Table 3. Melting temperatures of primers ordered from Cybergene. The mean value of the Tms: ~58.2°C
Chromosome 19 18 16 15 12 9 7 5 4
Tm [C] Forward 54.6 59.4 57.6 62.1 55.2 56.0 60.2 62.2 53.0
Reverse 55.6 62.6 61.2 56.0 62.6 55.6 55.6 65.6 55.4
Reaction optimization
The new primer pairs required a reaction optimization before they could be used on the target
cell lines, colon carcinoma. This involved reaction setups, PCR program adjustments as well
as estimation of which primers that worked. All tests were run with mouse DNA diluted in
crossed linked milliQ water to a concentration of 1ng/l required for the PCR amplification.
The MgCl2 concentration in the reaction was conclusive for the function of the amplification.
In order to find the optimal MgCl2 concentration mouse DNA were amplified with the
primers for chromosome 19, 18, 17 and 16 in reactions with MgCl2 concentration of 1.5, 2,
2.5, 3, 3.5 and 4mM respectively. The mouse DNA had been extracted from muscle tissue
according to ―Extraction from tissue” in DNA extraction protocol. The reaction setup, the
amplification and the sequencing was carried out according to “Mouse specific STR” in PCR
amplifying and CE protocol, respectively. The product was analyzed with GeneMapper ID
v3.1 software (Applied Biosystems).
Amplification of mouse DNA with the remaining primer pairs, 15, 12, 9, 7, 5 and 4, was
performed in reactions with only the two MgCl2 concentrations that had showed the best
results, 2mM and 2.5mM. Reaction setup, PCR amplification and CE was performed in the
same way as described above except for the PCR amplification, which in attempt to reduce
stutter was set to 28 cycles instead of 30 this time. The attempt to reduce stutter by reducing
the number of cycles gave no better result. The best results were generated with MgCl2
concentration of 2mM. The amplification reaction was set with an annealing temperature
represented by the mean value of the new Tms, which was ~58.2C, and with 30 cycles. With
these conditions all primer pairs except the one for chromosome 17 worked.
Because the aim was to show presence of mouse DNA in the human cell line harvested in
mice, and these primer pairs gave distinct results even with stutter, no further studies and time
were spent on trying to reduce the stutter.

24
Investigation of human colon tumour cell lines
The first step in the investigation process was to control the designed primers. A positive
control, in which primers were tested against mouse cells, and a negative control, in which
primers were tested against human cells, were performed. Mouse and human DNA were
amplified with the nine primer pairs for chromosome 19, 18, 16, 15, 12, 9, 7, 5 and 4 with
2mM MgCl2. Reaction setup, 30 cycles PCR amplification and CE was performed in the same
way as described earlier.
To make sure that the negative control above was correct, a positive control for the human
DNA was performed. Reaction setup and amplification was run according to “Human STR”
under PCR amplification and the product were sequenced and analyzed as described in CE
protocol ―Human STR”.
In the following steps, the human colon tumour cell lines KM12C, KM12SM and KM12L4
were investigated both with human STR analysis and with the designed mouse specific
primers. The human STR analysis were used both in order to see contingent changes between
the cell lines, and thereby differences before and after transplantation in nude mice, and as a
positive control for the cell lines. Mouse specific primers were used in order to see if any
DNA originating from mouse could be found. DNA from the cultivated cell lines had been
extracted according to Qiagen extraction in the DNA extraction protocol “Extraction of
blood”. The reaction setup, PCR amplification, CE and data analysis were performed as
described earlier. The amplification with the mouse specific primers was performed using 30
cycles.
Part II – Investigation of breast cancer cell line
The materials used in this part came from nude mice and were produced by Linda Bojmar at
the Department of Cell Biology at Linköping University. The work implemented was briefly
what follows.
Human breast cancer cell line, MCF-7, was cultured until enough cells for transplantation had
grown. These female tumour cells were transplanted into five nude mice. Oestrogen pellets
were inserted under the skin in the neck of female nude mice, which supplied the tumour cells
and allowed them to grow and become tumours. When the tumours had grown for about three
weeks and an increased size was established, the transplantations were followed by a
transfusion of human bone-marrow stem cells obtained from a male blood donor. Intention
was to see if these stem cells would fuse with the tumours cells. The stem cells were collected

25
freezed from the blood central in Linköping, defrosted in 37C water, diluted in PBS
(Phosphate Buffered Saline) and finally injected, venously in the tail and intraperitoneally, in
to the nude mice. After about three weeks and when the tumours had reached a size of 0.5-1
centimeter they were removed and delivered for cell fusion investigation. Four of the animals
generated tumours for analysis. Except for the tumours, muscle tissues were collected from
mouse 1 and 4, and spleen tissue, liver tissue and blood were collected from mouse 4. Before
the transplantation the cultivated breast cancer cell line had been investigated for presence of
Y chromosome markers to ensure that the cells lacked such from the start.
Breast cancer cell line DNA profile
Before transplantation, the tumour cells had been analyzed and a full DNA profile of the
breast cancer cell line was available for comparison (performed at The National Board of
Forensic Medicine before this project began).
Male donor stem cell DNA profile
A DNA profile was created from male donor blood, used for transfusion into nude mice. The
profile purpose was comparison with the tumour cell in order to observe possible match due
to cell fusion. From a small amount of the donor blood, washed in PBS, DNA was extracted.
The DNA extraction was performed according to Qiagen extraction in DNA extraction
protocol “Extraction from blood”. DNA diluted to 2ng/L was amplified and separated,
according to ‖Human STR” under PCR amplification and CE, respectively.
Investigation of human breast tumour cells with STR profiling
Tumours, originating from breast cancer cell line MCF-7, transplanted and harvested in four
nude mice were investigated. Reactions setup, PCR amplifications and sequencing of the
tumours from mouse 1, 2 and 3 were performed according to both “Human STR”, “Y-
chromosome STR and “Mouse specific STR” (in part I) in PCR amplifying and CE protocols,
respectively. The tumour from mouse 4, delivered later than the other three, was only
investigated according to the “Human STR” protocols. Except for analysis of the tumours,
muscle tissue from mouse 1 and muscle-, spleen- and liver tissues and blood from mouse 4
were investigated. The tissues from mouse 1 and 4 were investigated in the same way as the
tumours from mouse 1 and 4, respectively. DNA from all tumours and tissues had been
extracted as described in “Extraction from tissue” under DNA extraction. Blood from mouse
4 had been extracted according to “Extraction from blood” King Fisher mL and the
gDNA2E1.9 program.

26
All DNA from mouse 4 were run a second time, but with a higher concentration of target
DNA in the reaction setup, 4µL instead of 1µL, with reduced amount of water as result. The
blood from mouse 4 was investigated both a third and a fourth time. The third time with 1µL
and 2µL target DNA in the reaction setup. The PCR amplification were run both as mentioned
earlier and with a weak program for human STRs with conditions as follows: 94C for 11
minutes, 10 cycles with 94C, 59C and 72C for 1 minute each, 20 cycles with 90C, 59C
and 72C for 1 minute, then hold at 60C for 60 minutes. CE and data analysis were
performed like earlier. The fourth analysis of the mouse blood was made by performing a new
King Fisher mL extraction of the blood. This time with PYROgDNA1 program that generated
a larger amount of DNA from the extraction. The reaction was setup with 1µL target DNA
and the amplification was performed both according to ―Human STR” and with the weak
program mentioned above.
Sensitivity and inhibitory tests
The amount of DNA accessible is crucial for the results. In order to test how much DNA it is
required to generate a profile, or at least se trace of it, and see if mouse DNA in any way
inhibit the reaction, human DNA was diluted to known concentration in mouse DNA and in
crossed linked milliQ water. Known amount of human DNA diluted in mouse DNA and in
water respectively, was setup, amplified, separated and analyzed according to ―Human STR”
protocols. The mouse/human solutions and blood from both King Fisher mL extraction
programs were investigated according to “Mouse specific STR” protocols.

27
Results
Profile figures presented are print screens from GeneMapper ID v3.1 software.
Part I – Investigation of colon carcinoma cell lines
All controls had approved results. Positive control against mouse generated peaks of predicted
sizes and showed that all nine primer pairs were successful (see Appendix B). The negative
control against human was empty and the positive control for the human DNA gave a full
STR profile, showing that the primers does not target human DNA and are specific for mouse
DNA. None of the three investigated cell lines, KM12C, KM12SM and KM12L4, showed
trace of chromosomal material from mouse, all DNA profiles came out negative. One
example is presented in Figure 4.
Figure 4. (Left) Analysis results of KM12C, KM12SM and KM12L4 cell lines with mouse specific primers for
chromosome 19. All primer pairs generated the same negative result with no trace of mouse DNA in the cell
lines, like this example. (Right) Positive control against mouse and negative control against human with the
mouse specific primers for chromosome 19 shows that the results left are reliable.
Table 4. Comparison between parental cell line KM12C and the two highly metastatic cell lines KM12SM and
KM12L4. Differences in the number of repeats are highlighted.
Marker KM12C KM12SM KM12L4
D8S1179 11 13 12 13 12 13
D21S11 27 34.2 27 34.2 27 34.2
D7S820 8 8.3 8 8.3 8 8.3
CSF1PO 10 12 10 12 10 12
D3S1358 13 14 14 15 16 14 15
TH01 9.3 9.3 9.3 9.3 9.3 9.3
D13S317 12 15 13 15 13 15
D16S539 11 11 11 12 13 11 12
D2S1338 22 23 24 22 23 21 22 23 24
D19S433 11 14 11 14 11 14
vWA 17 17 17 17 17 17
TPOX 11 12 11 12 11 12
D18S51 13 13 14 14 14 14
Amelogenin X X X X X X
D5S818 10 17 11 17 11 17
FGA 20 22 20 22 20 22
KM12C
KM12SM
KM12L4
Positive
Negative
Water

28
With human STR markers full DNA profiles for all cell lines were received. In seven of the
sixteen markers solitary change in the number of repeats was observed. No significant
differences could be observed between the highly metastatic cell lines, KM12SM and
KM12L4, compared to the poorly metastatic cell line, KM12C (Table 4 and Figure 5).
Figure 5. Comparison between the profiles for KM12C, KM12SM and KM12L4. As resumed in Table 4 above
no significant differences between the cell lines could be observed. The profiles were almost identical, since the
peaks were similar in height and position and with a few exceptions they had same number of repeated regions.
Part II – Investigation of breast cancer cell line Breast cancer cell line DNA profile
Figure 6. DNA profile of the female breast cancer cells, created with human STR analysis before transplantation
into nude mice.
KM12C
KM12SM
KM12L4
KM12C
KM12SM
KM12L4
29
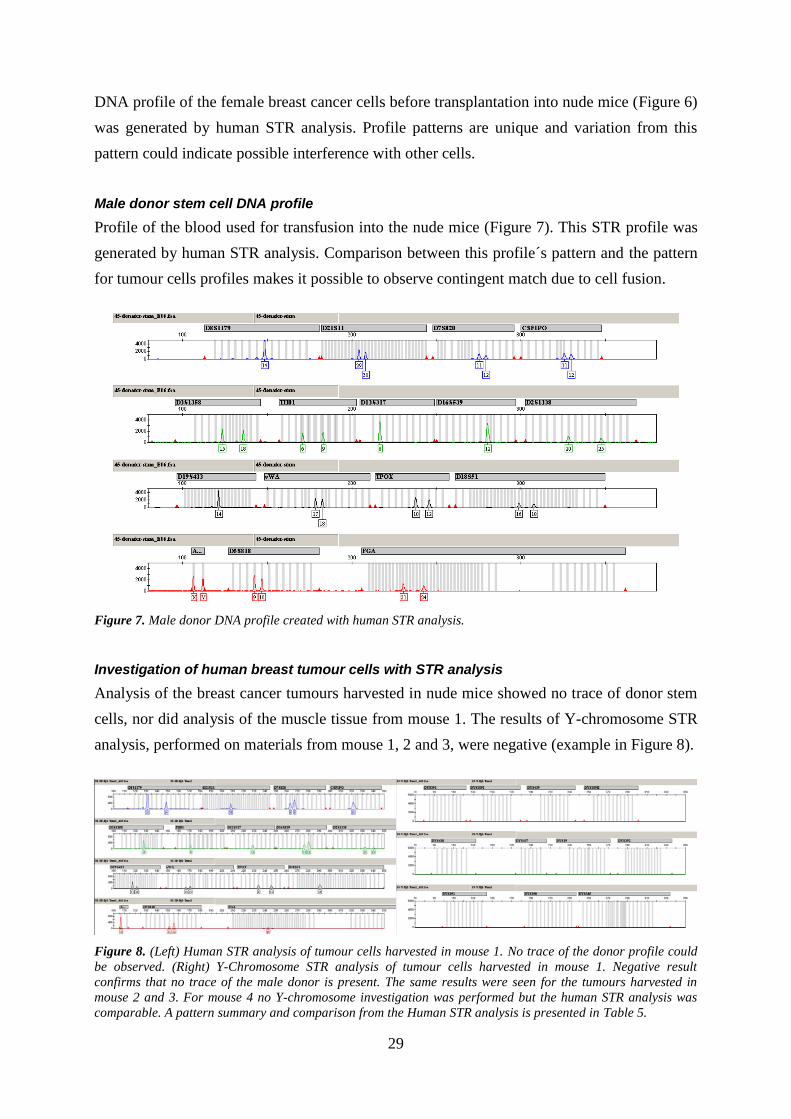
DNA profile of the female breast cancer cells before transplantation into nude mice (Figure 6)
was generated by human STR analysis. Profile patterns are unique and variation from this
pattern could indicate possible interference with other cells.
Male donor stem cell DNA profile
Profile of the blood used for transfusion into the nude mice (Figure 7). This STR profile was
generated by human STR analysis. Comparison between this profile´s pattern and the pattern
for tumour cells profiles makes it possible to observe contingent match due to cell fusion.
Figure 7. Male donor DNA profile created with human STR analysis.
Investigation of human breast tumour cells with STR analysis
Analysis of the breast cancer tumours harvested in nude mice showed no trace of donor stem
cells, nor did analysis of the muscle tissue from mouse 1. The results of Y-chromosome STR
analysis, performed on materials from mouse 1, 2 and 3, were negative (example in Figure 8).
Figure 8. (Left) Human STR analysis of tumour cells harvested in mouse 1. No trace of the donor profile could
be observed. (Right) Y-Chromosome STR analysis of tumour cells harvested in mouse 1. Negative result
confirms that no trace of the male donor is present. The same results were seen for the tumours harvested in
mouse 2 and 3. For mouse 4 no Y-chromosome investigation was performed but the human STR analysis was
comparable. A pattern summary and comparison from the Human STR analysis is presented in Table 5.

30
The mouse specific analysis showed, as expected, presence of mouse DNA in the three
tumours. The human STR analysis, performed on all four tumours, showed clear MCF-7 cell
line profiles. No significant difference compared to each other or to the cancer cell profile
generated before the transplantation could be obtained (see Table 5). In the muscle tissue
from mouse 1, trace of tumour cells could be seen. Nothing that indicated that cell fusion
occurred was possible to see. (For all profiles of breast cancer tumours see Appendix C.)
Table 5. Comparison between tumour cells before and after transplantation into nude mice and a simile with
the donor bone-marrow stem cells injected in the mice.
Marker Tumour cells
before
transplantation
Donor
stem
cells
Tumour cells
after
transplantation
Mouse 1
Tumour cells
after
transplantation
Mouse 2
Tumour cells
after
transplantation
Mouse 3
Tumour cells
after
transplantation
Mouse 4
D8S1179 10 14 14 14 10 14 10 14 10 14 10 14
D21S11 30 30 29 30 30 30 30 30 30 30 30 30
D7S820 8 9 11 12 8 9 8 9 8 9 8 9
CSF1PO 10 10 11 12 10 10 10 10 10 10 10 10
D3S1358 16 16? 15 18 16 16 16 16 16 16 16 16
TH01 6 6 6 9 6 6 6 6 6 6 6 6
D13S317 11 11 8 8 11 11 11 11 11 11 11 11
D16S539 11 12 12 12 11 12 11 12 11 12 11 12
D2S1338 21 23 20 25 21 23 21 23 21 23 21 23
D19S433 13 14 14 14 13 14 13 14 13 14 13 14
vWA 14 15 17 18 14 15 14 15 14 15 14 15
TPOX 9 12 10 12 9 12 9 12 9 12 9 12
D18S51 14 14 16 18 14 14 14 14 14 14 14 14
Amelogenin X X X Y X X X X X X X X
D5S818 11 12 9 10 11 12 11 12 11 12 11 12
FGA 23 24 25 21 24 23? 24 25? 23 24 25? 23 24 25 23 4 25
? = Peaks that were very low and laid below approved limit.
No trace of donor stem cell neither tumour cells could be observed in the human STR analysis
of muscle- spleen and liver tissue from mouse 4. In three of four parallel tests, performed with
1µL DNA from the same blood extracted in the same way, with gDNA2E1.9 program, trace
of both X and Y chromosomes could be observed (one example is presented in Figure 9).
Besides X and Y some other peaks could also be distinguished. The peaks were however few
and they were all very small (see Table 6). Both positive and negative controls in this analysis
were clear and neither showed any trace of contamination (For all four test and controls see
Appendix D). Because the blood had showed weak results, attempts to generate more distinct
results were made. A second analysis of tumour, tissues and blood from mouse 4, performed
with more DNA, 4µL, resulted in negative outcome. This time neither the blood showed
peaks. The blood that was analyzed a third time with less amounts of DNA, 1µL and 2µL, and
31
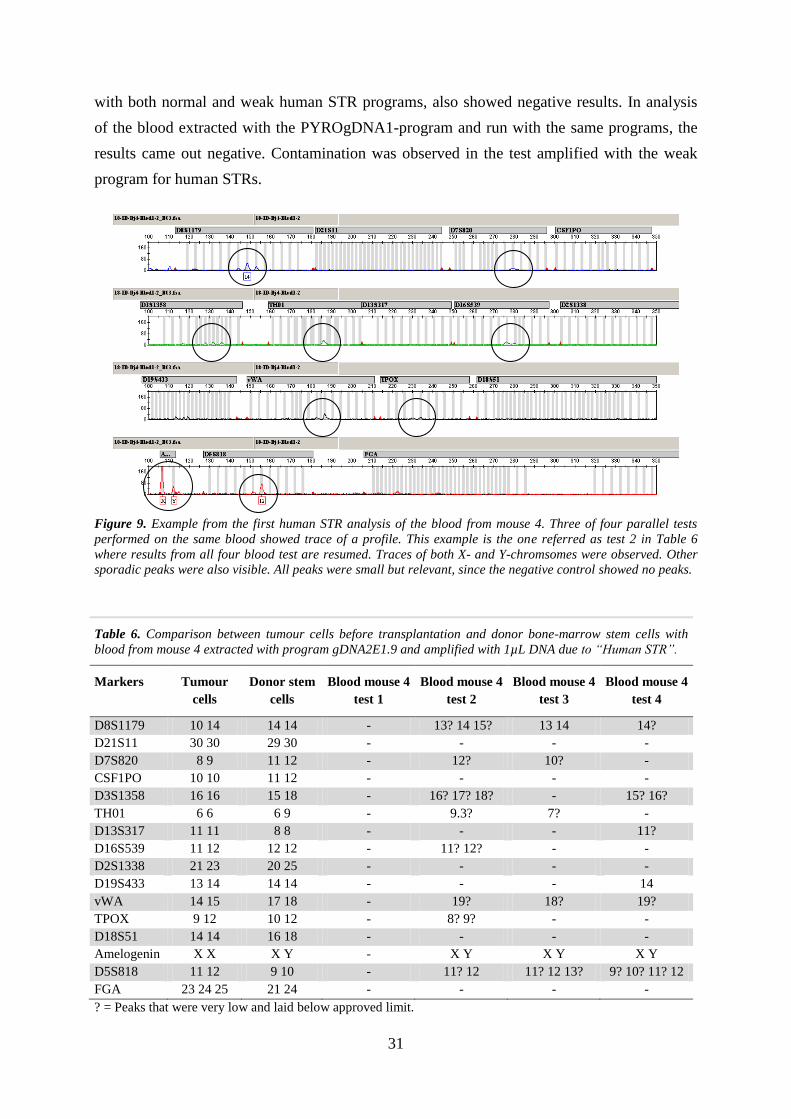
with both normal and weak human STR programs, also showed negative results. In analysis
of the blood extracted with the PYROgDNA1-program and run with the same programs, the
results came out negative. Contamination was observed in the test amplified with the weak
program for human STRs.
Figure 9. Example from the first human STR analysis of the blood from mouse 4. Three of four parallel tests
performed on the same blood showed trace of a profile. This example is the one referred as test 2 in Table 6
where results from all four blood test are resumed. Traces of both X- and Y-chromsomes were observed. Other
sporadic peaks were also visible. All peaks were small but relevant, since the negative control showed no peaks.
Table 6. Comparison between tumour cells before transplantation and donor bone-marrow stem cells with
blood from mouse 4 extracted with program gDNA2E1.9 and amplified with 1µL DNA due to “Human STR”.
Markers Tumour
cells
Donor stem
cells
Blood mouse 4
test 1
Blood mouse 4
test 2
Blood mouse 4
test 3
Blood mouse 4
test 4
D8S1179 10 14 14 14 - 13? 14 15? 13 14 14?
D21S11 30 30 29 30 - - - -
D7S820 8 9 11 12 - 12? 10? -
CSF1PO 10 10 11 12 - - - -
D3S1358 16 16 15 18 - 16? 17? 18? - 15? 16?
TH01 6 6 6 9 - 9.3? 7? -
D13S317 11 11 8 8 - - - 11?
D16S539 11 12 12 12 - 11? 12? - -
D2S1338 21 23 20 25 - - - -
D19S433 13 14 14 14 - - - 14
vWA 14 15 17 18 - 19? 18? 19?
TPOX 9 12 10 12 - 8? 9? - -
D18S51 14 14 16 18 - - - -
Amelogenin X X X Y - X Y X Y X Y
D5S818 11 12 9 10 - 11? 12 11? 12 13? 9? 10? 11? 12
FGA 23 24 25 21 24 - - - -
? = Peaks that were very low and laid below approved limit.
32
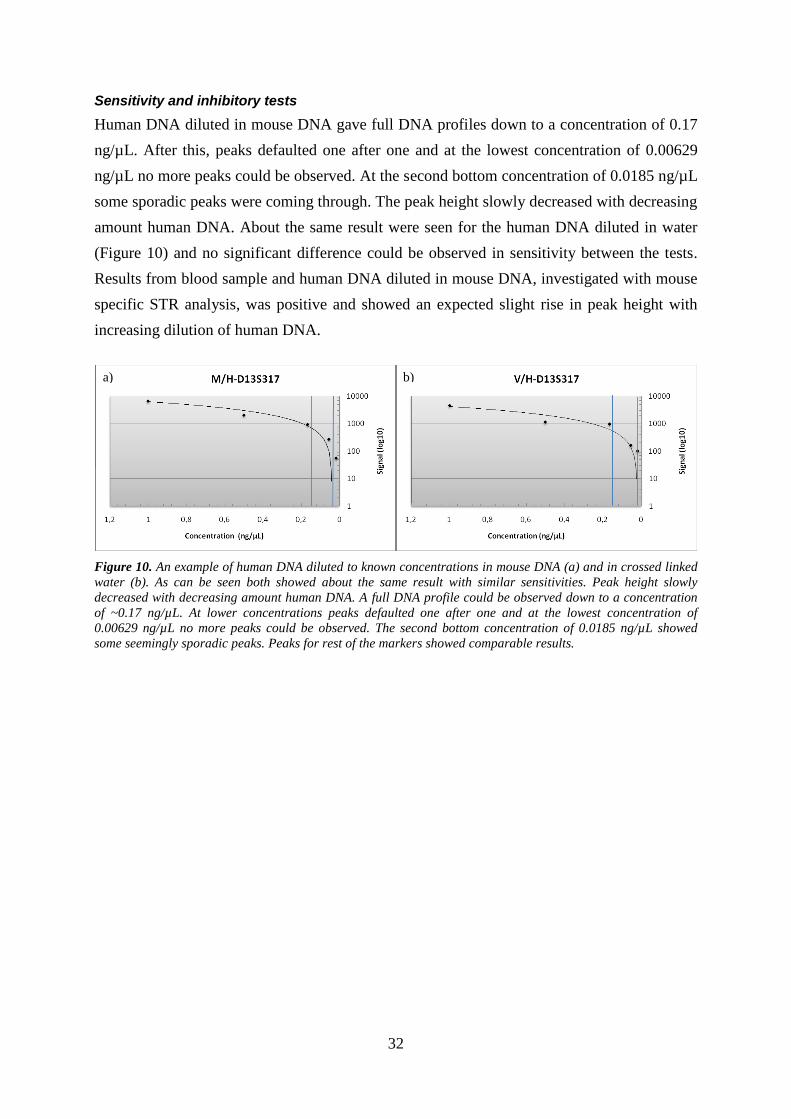
Sensitivity and inhibitory tests
Human DNA diluted in mouse DNA gave full DNA profiles down to a concentration of 0.17
ng/µL. After this, peaks defaulted one after one and at the lowest concentration of 0.00629
ng/µL no more peaks could be observed. At the second bottom concentration of 0.0185 ng/µL
some sporadic peaks were coming through. The peak height slowly decreased with decreasing
amount human DNA. About the same result were seen for the human DNA diluted in water
(Figure 10) and no significant difference could be observed in sensitivity between the tests.
Results from blood sample and human DNA diluted in mouse DNA, investigated with mouse
specific STR analysis, was positive and showed an expected slight rise in peak height with
increasing dilution of human DNA.
Figure 10. An example of human DNA diluted to known concentrations in mouse DNA (a) and in crossed linked
water (b). As can be seen both showed about the same result with similar sensitivities. Peak height slowly
decreased with decreasing amount human DNA. A full DNA profile could be observed down to a concentration
of ~0.17 ng/µL. At lower concentrations peaks defaulted one after one and at the lowest concentration of
0.00629 ng/µL no more peaks could be observed. The second bottom concentration of 0.0185 ng/µL showed
some seemingly sporadic peaks. Peaks for rest of the markers showed comparable results.
a) b)

33
Discussion
The cell fusion theory and its possible involvement in metastasis development and cancer
progression is interesting and important to map. First and foremost, in vivo occurrence of the
cell fusion phenomenon must be viewed. That was the intention of this pilot study.
In part I, the colon carcinoma cell lines KM12C, KM12SM and KM12L4 were investigated
with mouse specific STR and human STR analysis. Nothing that indicated cell fusion between
mouse leukocytes and colon tumour cells could be found. The results from mouse specific
STR analysis showed no trace of mouse DNA. This was expected because earlier, with use of
species-specific pyrosequensing that targets all species (Karlsson and Holmlund, 2007), these
cell lines had been investigated for mouse mitochondrial material, but nothing could be found.
By this knowledge it was predicted that no mouse chromosomal material would be found
either, which showed to be true. The cell lines were however only analysed with restricted
number of primer sequences, for nine of the mouse total nineteen chromosomes (Appendix
A). That means that no overall picture was made, and with focus on different parts of the
chromosomes another result could possibly have been achieved. Control analyses of the
mouse specific primers clearly had shown that they worked (Appendix B). Most plausible is
then that at least one of the nine primer sequences would have shown trace of mouse material
if there was any. An assumption was therefore that no mouse DNA was present and no cell
fusion hence occurred. These results were also supported by the human STR analysis, which
showed no significant difference between the profiles. Slight changes in the allelic patterns
were obtained (shown in Table 4). But, gain or loss of one or a few repeated units is often
seen in cell lines and has probably nothing to do with the cell fusion process.
Even if we did not observe any DNA from mouse, cell fusion could have taken place. We do
not know how many divisions the tumour cells had gone through before picked for analysis. It
is possible that the tumour cells had dedifferentiated and pushed out the chromosomes related
to the mouse. It is however less likely that all mouse and none of the human chromosomes
should have been dropped out. Therefore, we do not believe that cell fusion has taken place.
Early studies on colon carcinoma cell lines have shown that implantation of these cell lines
allows tumour to grow and metastases to occur. Which cell lines used, have an essential role
for the capacity to form metastases. Highly metastatic cell lines have most potential to survive
in new areas (Morikawa et al., 1988; Giavazzi et a., 1986). According to this knowledge it
was not surprising that we did not find mouse DNA in the poorly metastatic KM12C cell line.
Signs of cell fusion, if there had been any, would most probably been obtained in KM12SM

34
or KM12L4 cell lines because they have higher metastatic tendency. But, no mouse DNA was
found which point out that no cell fusion had occurred.
In part II, the tumours of human breast cancer cell line MCF-7 origin, collected from the nude
mice, were investigated with human STR and Y-chromosome STR analyses. Only STR
profiles that corresponded to the breast cancer cell line were obtained. No signs of STR
profiles or Y-chromosome markers that could be traced back to the donor stem cells were
found (see Appendix C and Table 5). Nothing that indicated presence of donor stem cells and
a possible cell fusion was observed. The muscle tissue from mouse 1 showed trace of the
breast cancer profile, but this was most probably due to contamination during sample
collection. From mouse 4, not only the tumour was analyzed. In order to search for DNA of
human origin samples of muscle-, spleen- and liver tissue, and blood were investigated. As
mentioned the tumour showed no sign of donor stem cells and nor did the muscle-, spleen- or
liver tissue. Since both positive and negative controls were approved we assume that the
analyses were trustable and that no human cells were present.
In addition to DNA profiling the tumours from mouse 1, 2 and 3 were also analyzed by
chromosome karyotyping and Fluorescent In Situ Hybridization (FISH). These analyses were
performed at the Cyptogenetic laboratory in the department of Cell Biology and at the
Department of Pathology, University Hospital Linköping. None of the investigations showed
presence of Y-chromosomes in the tumours which support our results. The karyotyping result
from mouse 1 showed only fibroblast cells from the mouse. For mouse 2 and 3, both human
and mouse cells were present. But, chromosome abnormalities in the cancer cells made it
impossible to see possible Y-chromosomes. The FISH result from all three mice only showed
X-chromosomes and therefore scored as negative. (Personal communications)
Recent studies have shown that fusion between cancer cells and macrophages can occur in
mouse models. Tumour cells could then gain macrophage characteristics and increased
metastatic potential (Huysentruyt et al., 2008; Rachkovsky et al., 1997). Y-chromosomes have
also been found in metastases from female patient who received bone-marrow from a male
(Pawelek, 2005). Despite previous findings we could not show signs of cell fusion in the
tumours. An explanation for this could be that the donor stem cells had been frozen and were
not viable enough. Or perhaps the time between injection of stem cells and the removal of the
tumours for analysis was too short for the stem cells to migrate to the tumour. The method
might not be sensitive enough to detect very small amounts of DNA and therefore missed

35
possible human DNA. Because the results from DNA profiling, karyotyping and FISH all
were negative we do not believe that cell fusion had occurred in the tumours.
In three of four parallel tests performed on the blood samples from mouse 4 traces of a profile
were distinguishable (see Appendix D). Since all controls were in order, this was interesting
and strongly indicated that something else than mouse DNA was present in the blood and that
it was not a contamination. Several factors aggravated estimation of the obtained profiles. The
breast cancer cell lines were degenerated, several markers in the profiles shared a common
pattern and in cell lines it is common that one or a few repeated units are added or deleted.
Additionally, the results were very weak, the peak heights were not always approved and only
a few peaks were visible, which also varied between the tests. A few findings could however
be deduced. The peaks seemed to be risen sporadically. Both X-and Y-chromosome markers
were obtained and indicated presence of male DNA, which would be the donor stem cells (see
Table 6). The D5S818 marker showed trace of 12 repeats which could be matched to the
tumour profile. In a closer look, peaks corresponding to 11 repeats and maybe also 10 and 9
repeats could be seen, which indicated presence of donor stem cell DNA also. The vWA
marker showed weak trace of sequences with 18 or 19 repeats, which might be matched to the
donor profile that has 17 and 19. What also could be noticed was that the X-marker peak was
greatly higher than the Y-marker peak. This could be a cause of mixed STR profiles between
XX tumour cells and XY donor stem cells. To look only at the peak height is however not a
reliable way to judge if it is a mix of DNA or not. But, some other peaks in the profiles did as
mentioned also show weak signs that both profiles were present.
Out of these findings we believe that it was traces of the donor stem cells we obtained in the
blood sample, and even though the breast cancer cell line was not supposed to be able to
migrate the same pass for them. The profile patterns were however hard to evaluate and
nothing have been proven. Desirable was to see a more distinct result, which we tried to
create in three more attempts but failed. We still believe that human DNA was present in the
sample, but in such small amounts that it was hard to detect. If it was donor stem cells we
observed it would mean that they were viable, but probably need more time in order to
migrate to other tissues or to the tumour. If it was a mixed profile it probably means
simultaneous presence of donor stem and tumour cells, not any proof of cell fusion. In order
to obtain fused cells, single micro-dissected cells need to be analyzed, which in lack of
definite results not could be performed. Without more definite results we cannot say anything
for certain and more research is required. Even if the tumour cells were unable to migrate,
presence of a DNA profile of tumour origin found in the blood indicate that tumour cells had

36
migrated from the inoculation place. This could be a passive migration for example caused by
follow the blood flow. Another possibility is that the tumour cells had fused with migrating
cells, for example macrophages. Our results however do not prove that this has happened.
Since we could see traces of a profile in 3 of 4 parallel tests, but failed to repeat them, we
wanted to investigate how sensitive the test was and if it was possible that a greater amount of
mouse DNA could have inhibited the PCR process by nonspecific binding to mouse DNA at
any stage. The sensitivity and inhibitory results contradicted this and pointed out that reasons
why we could not see any profiles might be because there were no human DNA present or
that the concentration was lower than 0.0185 ng/µL. At this concentration a few sporadic
peaks could be seen, but at lower concentration no peaks at all were obtained. Which peaks
that occurred at 0.0185 ng/µL were unpredictable and seemed to vary. This was comparable
with the result we saw in the blood sample analyses. An assumption is therefore that human
DNA was present in an amount that lies on detection limit, which would explain why there
were so few peaks and why they differed from each other. If it is like this, the question why
we could not repeat the results is however still unclear. Maybe it was just a coincidence that it
gave distinguishable result the first time and if repeated several times more the results maybe
could have been seen again. Or maybe the DNA was broken down, passing the limit before
the second analyze.
Further on, analysis of patient samples will be performed. This is probably the most
interesting investigation. Like described in introduction part III, female patients who had
received bone-marrow or blood and later developed metastasis is the target for the
investigation. This was supposed to be a part of this project, but the patient samples did not
arrive and could not be investigated right now. The material is currently under assembling and
on other way this project will continue.

37
Conclusions and future research
None of the investigations we performed showed that cell fusion had occurred. The blood
investigated from mouse 4 was the closest we came of finding the donor stem cells, and that
was a very weak indication that not can be seen as proof in any way. Whether cell fusion can
occur and if hybrids have increased metastatic potential seems, however, not to be questioned
as much as to what extent cell fusion affect tumour development and progression. Despite
lack of support in this study, there are previous materials which shows example of how
metastases can express macrophage specific characteristics and argues for more research in
the area. The blood that showed traces of a profile, which may have come from both donor
stem cells and tumour cells was very interesting, but in lack of a more resolute analysis result
nothing more than speculation can be made from these. As it is right now, investigations
using other conditions are needed and maybe a more sensitive method can be developed,
which can detect smaller DNA amounts.
The project does not end here. In the near future more research will be performed on new
nude mice. If this theory is true, and cancer cells can be viewed as hybrids with leukocytes, it
can open up new possibilities for diagnosing and treating cancer. Maybe new and improved
drugs can be developed.

38
Acknowledgements
Thanks to everyone at the Department of Forensic Genetics and Forensic Toxicology for
always being helpful and making the work pleasant and fun.
My special thanks to:
Bertil Lindblom for handing me this interesting project, giving me the opportunity to do it at
the National Board of Forensic Medicine and for all valuable guidance throughout the work.
Helena Nilsson for all your guidance in the laboratory and also for taking time whenever I
needed help.
Joar Svanvik first, for leading this project and providing the materials for the analyses, but
also for giving me feedback on my report.
Linda Bojmar for giving me insight in your work, valuable communication and interchange
of results. Good luck with the continuing project.

39
References
Alberts B., Johnson A., Lewis J., Raff M., Roberts K., Walter P. (2002). Molecular Biology of the Cell.4th
ed,
New York, Garland Science, pp. 1313-1362
Butler JM. (2005). Forensic DNA typing, biology, technology, and genetics of STR markers. 2nd
ed, London,
Elsevier Academic Press. pp. 17-144.
Biotage. (2008). Pyrosequencing®
Assay Design Software.
http://www.pyrosequencing.com
Controlled: 2008-09-02
Chen EH., Olson EN. (2005). Unveiling the mechanism of Cell-Cell Fusion. Science 308:369-373.
Coyne VE., James MD., Sheron JR., Rybicki EP. (2001). PCR primer design and reaction optimisation.
Molecular Biology Techniques Manual, 3rded 1-11. Department of Molecular and Cell Biology,
University of Cape Town.
http://www.mcb.uct.ac.za/pcroptim.htm
Controlled: 2008-04-12
Duelli D and Lazebnik Y. (2003). Cell fusion: A hidden enemy?. Cancer cell 3:445-448.
Duelli DM., Hearn S., Myers MP., Lazebnik Y. (2005). A primate virus generates transformed human cells by
fusion. The Journal of Cell Biology 171:493-503
Duelli D and Lazebnik Y. (2007). Cell-to-cell fusion as a link between viruses and cancer. Nature Reviews,
Cancer 7:968-976.
Friedl P. (2005). Cell fusion: new mechanism of plasticity in cancer. The lancet oncology 6:916-918.
Fogg DK., Sibon C., Miled C., Jung S., Aucouturier P., Littman DR., Cumano A., Geissmann F. (2006). A
Clonogenic Bone Marrow Progenitor Specific for macrophages and Dendritic Cells. Science 311:83-87.
Gadi VK. and Nelson JL. (2007). Fetal Microchimerism in Women with Breast Cancer. Cancer Research
67:9035-9038.
Giavazzi R., Campbell DE., Jessup JM., Cleray K., Fidler IJ. (1986). Metastatic Behavior of Tumor Cells
Isolated from Primary and Metastatic Human Colorectal Carcinomas Implanted into Different Sites in
Nude Mice. Cancer Research 46:1928-1933.
Guettier C., Sebagh M., Buard J., Feneux D., Ortin-Serrano M., Gigou M., Tricottet V., Reynès M., Samuel D.,
Féray C. (2005). Male Cell MicroChimerism in Normal and Diseased Female Livers From Fetal Life to
Adulthood. Hepatology 42:35-43.
Huysentruyth LC., Mukherjee P., Banerjee D., Shelton LM., Seyfried TN. (2008). Metastatic cancer cells with
macrophage properties: Evidence from a new murine tumor model. International journal of cancer
123:73-84.
Jackson ARW. and Jackson JM. (2008). Forensic Science . 2nd
ed, Harlow, Pearson Prentice Hall. pp. 137-190.
JAX Mice Database. (2008). Nude mice, Strain Name: B6.Cg-Foxn1nu
/J, Stock Number: 000819. The Jackson
Laboratory.
http://jaxmice.jax.org/strain/000819.html
Controlled: 2008-04-21
Jeffreys AJ., Wilson V., Thein SL. (1985). Individual-specific ’fingerprints’ of human DNA. Nature 316:76-79.
Johnson M., Zaretskaya I., Raytselis Y., Merezhuk Y., McGinnis S., Madden Tl. (2008). NCBI BLAST: a better
web interface. Nucleic Acids Research 36(Web Server issue):W5-9, DOI:10.1093/nar/gkn201.

40
Karlsson AO. and Holmlund G. (2007). Identification of mammal species using species-specific DNA
pyrosequencing. Forensic science international 173:16-20.
Larsson L-I., Bjerregaard B., Talts JF. (2008). Cell fusion in mammals. Histochemistry and cell biology 129:551-
561.
Luscombe NM., Greenbaum D., Gerstein M. (2001). What is Bioinformatics? A Proposed Definition and
Overview of the Field. Methods of Information in Medicine 40:346-58.
Morikawa K., Walker SM., Jessup JM., Fidler IJ. (1988). In Vivo Selection of Highly Metastatic Cells from
Surgical Specimens of Different Primary Human Colon Carcinomas Implanted into Nude Mice. Cancer
Research 48:1943-1948.
Ogle BM., Cascalho M., Platt JL. (2005). Biological implications of cell fusion. Nature reviews, Molecular cell
biology 6:567-574.
Pawelek JM. (2005). Tumour-cell fusion as a source of myeloid traits in cancer. The lancet oncology 6:988-
993.
Pawelek JM and Chakraborty AK. (2008). Fusion of tumour cells with bone marrow-derived cells: a unifying
explanation for metastasis. Nature Reviews, Cancer, 8:377-386.
Personal communication. Linda Bojmar, Student, Linköping University. Attendant in the cell fusion project and
have performed the mouse experiments.
Peters LL., Robledo RF., Bult CJ., Churchill GA., Paigen BJ., Svenson KL. (2007). The mouse as a model for
human biology: a resourse guide for complex trait analysis. Nature Reviews, Genetics 8:58-69.
Rachkovsky M., Sodi S., Chakraborty A., Avissar Y., Bolognia J., McNiff JM., Platt J., Bermudes D., Pawelek
JM. (1997). Melanoma macrophage hybrids with enhanced metastatic potential. Clinical &
experimental metastasis 16:299-312.
Richardsen E., Uglehus RD., Due J., Busch C., Busund L-TR. (2008). The prognostic impact of M-CSF, CSF-1
receptor, CD68 and CD3 in prostatic carcinoma. Histopathology 53:30-38
Shabo I., Stål O., Olsson H., Doré S., Svanvik J. (2008). Breast cancer expression of CD163, a macrophage
scavenger receptor, is related to early distant reduced patient survival. International journal of cancer
123:780-786.
Stalker J., Gibbins B., Meidl P., Smith J., Spooner W., Hotz H-R., Cox AV. (2004). The Ensembl Web Site:
Mechanics of a Genome Browser. Genome Research 14:951-955.
Strachan T. and Read AP.. (2004). Human Molecular Genetics. 3rd
ed, New York, Garland Publishing. pp.110-
113.
Tysnes BB and Bjerkvig R., (2007). Cancer initiation and progression: involvement of stem cells and the
microenvironment. Biochimica et biophysica acta 1175:283-297.
Waterston RH., Lindblad-Toh K., Birney E., Rogers J., Abril JF., Agarwal P., Agarwala R., Ainscough R.,
Alexandersson M., An P., Antonarakis SE., Attwood J., Baertsch R., Bailey J., Barlow DG.,Beck S.,
Berry E., BloomT., Bork P.,Botcherby M., Bray N., Brent MR., Brown DG., Brown SD., Bult C., Burton
J., Butler J., et al. (2002). Initial sequencing and comparative analysis of the mouse genome. Nature
420:520-562.

1
Appendix A – Mouse specific primer pairs and PCR products The nine designed primer pairs and the target sequences are viewed in Table A 1. Total size of
the sequences and other product data is presented in Table A 2.
Table A 1. Mouse specific primer sequences and PCR products. All primer pairs have lengths in between 17-
30 base pairs and targets nine of the mouse shortest chromosomes.
Chromosome 19
Chromosome 18
Chromosome 16
Chromosome 15
Chromosome 12

2
Chromosome 9
Chromosome 7
Chromosome 5
Chromosome 4
Table A 2. Product data. All PCR products have a size between 121 and 249 base pairs. The target regions
are localized on different distance from each chromosomes centromere.
Number Chromosome Locus GI Strain Sequence
size Marker location
1 19 NT_082868.6 149270273 C57BL/6J 132 3556525-3556656
2 18 NT_039674.7 149269870 C57BL/6J 159 47117630-47117788
3 16 NT_039625.7 149268225 C57BL/6J 185 4970970-4971161
4 15 NT_039618.7 149266481 C57BL/6J 246 4435051-4435296
5 12 NT_039551.7 149263363 C57BL/6J 121 45438883-45439003
6 9 NT_039474.7 149260095 C57BL/6J 158 4166155-4166312
7 7 NT_039433.7 149257821 C57BL/6J 195 53360828-53361022
8 5 NT_039305.7 149283955 C57BL/6J 178 33488852-33489001
9 4 NT_166289.1 149252316 C57BL/6J 194 7509284-7509477

3
Appendix B – Mouse specific STR analysis Analysis of mouse tissue with the nine mouse specific primer pairs created the following
profile in GeneMapper ID v3.1. With MgCl2 concentration of 2mM, annealing temperature of
~58.2C and 30 cycles PCR according to PCR amplification ―Mouse specific STR‖, peaks of
expected sizes were generated.
Figure B 1. Profile for mouse cells performed with nine designed mouse specific primers

4
Appendix C – Breast cancer tumour profiles DNA profiles for breast cancer cell lines after growth in nude mice. The profiles are generated
by human STR analysis in GeneMapper ID v3.1.
Figure C 1. DNA profile of the tumour harvested in mouse 1
Figure C 2. DNA profile of the tumour harvested in mouse 2

5
Figure C 3. DNA profile of the tumour harvested in mouse 3
Figure C 4. DNA profile of the tumour harvested in mouse 4
Figure C 5. Negative control test (left) and positive control test (right) – both pass

6
Appendix D - DNA analysis of blood from mouse 4 The first human STR analysis of blood from mouse 4. All four tests were extracted, amplified
and separated the same way and in parallel runs. Profiles were generated in GeneMapper ID
v3.1.
Figure D 1. Test 1 - negative
Figure D 2. Test 2 - sporadic peaks

7
Figure D 3. Test 3 - sporadic peaks
Figure D 4. Test 4 - sporadic peaks
Figure D 5. Negative control (left) and positive control (right) – both pass