Just in time - CORE · Resume (dansk) Bakterien Vibrio cholerae, årsagen til diare sygdommen...
54
Just in time Chromosomal replication in Vibrio cholerae display approximate termination synchrony Master thesis by Tue Rasmussen December 2006 Roskilde University Department of Science, Systems and Models
Transcript of Just in time - CORE · Resume (dansk) Bakterien Vibrio cholerae, årsagen til diare sygdommen...

Just in time
Chromosomal replication in Vibrio cholerae display approximate termination synchrony
Master thesis by Tue Rasmussen
December 2006
Roskilde University
Department of Science, Systems and Models

Preface This thesis is handed in as a master thesis (25 ECTS points) for the M(Sc.) degree (Cand. Scient.) in Molecular Biology and Chemistry at the Department of Science, Systems and Models at Roskilde University. The work was conducted at the department in the period from March 2006 until December 2006.
___________________________________________
No matter. Try again. Fail again. Fail better.
Samuel Beckett ___________________________________________
Supervisor Associate professor, Ole Skovgaard, Cand. Polyt., PhD. at the Department of Science, Systems and Models at Roskilde University. Acknowledgement My supervisor, Ole Skovgaard, who went above and beyond the call of duty, being very supportive of my work and always ready to share his vast knowledge of bacterial genetics. Rasmus Bugge Jensen (RUC) for discussing theory and developing the tools necessary to estimate Vibrio cholerae cell cycle parameters. Tove Atlung (RUC) for invaluable assistance in suggesting growth mediums for my experiments and Flemming Hansen (DTU) for access to his program WinFlow. My father, Jesper Rasmussen (DFVF) for aid and advice on using qPCR and for critical reading of this manuscript. Kristine Groth Knudsen for giving me access to her vast collection of literature on replication. Leise Rieber, Kirsten Pedersen and Christa Persson for good advice on laboratory procedures and help when needed. Furthermore I would like to thank Kim, Casper, Birgit and Susanne for good company in the new lab. Anders Løbner-Olesen (RUC) and Rasmus Bugge Jensen for enabling me to participate in the EMBO meeting, and my supervisor Ole Skovgaard for the opportunity to present a poster containing the data from my thesis. I furthermore would like to thank Matthew Waldor (Tuft University) and Anders Løbner-Olesen, for discussions regarding replication synchrony. Though we never actually agreed, their input has been invaluable to the development of a model of the timing of Vibrio cholerae replication and to my resolve to produce convincing evidence to support it. At the end I would like to thank my family and friends, who actually did attempt to figure out what the heck this work was good for. Tue Rasmussen
1
Summary The bacterium Vibrio cholerae, the cause of the diarrhoeal disease cholera, has its genome divided between two chromosomes, a feature uncommon in the bacterial world. The two chromosomes are of dissimilar sizes, chromosome II consists of 1.07 million basepairs, while the large chromosome I consists of 2.96 million basepairs and hold most of the bacteria’s essential genes. The two chromosomes also have distinctly different origins of replication. The origin of chromosome I is homologues to that of Escherichia coli, while the origin of chromosome II is more plasmid like. It have been reported that the replication of the two chromosomes initiate at the same point in the cell cycle (Egan et al 2004 Curr. Biol. 14:R501-R502). The result was based on a rifampicin/cephalexin runout experiment. This finding did not agree with our early findings and recently published results showing that the two chromosomes of V. cholerae have independent mechanisms controlling the initiation of replication. The timing of chromosomal replication was therefore carefully reinvestigated by modelling flow cytometry data and marker frequency analysis based on quantitative PCR. The results show that the two chromosomes of V. cholerae does not initiate synchronously, rather chromosome II is replicated late in the C-period in such a way that the replication of the two chromosomes terminate at approximately the same time. Furthermore we report that treating V. cholerae with rifampicin produce an unexpected artefact, which have wrongly been interpreted as initiation synchrony. The artefact arises due to delayed rifampicin action on chromosome II, compared to chromosome I.
2

Resume (dansk) Bakterien Vibrio cholerae, årsagen til diare sygdommen kolera, har et genom som er fordelt på to kromosomer, en ualmindelig konstellation blandt bakterier. De to kromosomer er af uens størrelse, kromosom II består af 1,07 millioner basepar, mens det større kromosom I består af 2,96 millioner basepar og indeholder de fleste af bakteriens essentielle gener. De to kromosomer har forskellige typer replikations origins. Origin på kromosom I ligner det fra Escherichia coli, mens origin på kromosom II er mere plasmid lignende. Det er blevet rapporteret at replikationen af de to kromosomer initierer på samme tidspunkt i cellecyklus (Egan et al 2004 Curr. Biol. 14:R501-R502). Dette resultat var baseret på et rifampicin/cephalexin runout eksperiment. Disse resultater var ikke overensstemmende med vores tidlige data og nyligt publicerede resultater, som viser at de to kromosomer i V. cholerae har uafhængige kontrolmekanismer som styrer initieringen af replikationen. Timingen af kromosom replikationen blev derfor grundigt genundersøgt ved hjælp af flowcytometry og marker frekvens analyse baseret på kvantitativ PCR. Resultaterne viser at V. choleraes to kromosomer ikke initierer synkront, men at kromosom II replikerer sent i C-perioden, med en sådan timing at replikationen af de to kromosomer terminerer på cirka samme tidspunkt. Udover dette rapporterer vi at rifampicin behandling af V. cholerae producerer et artefakt som ikke var ventet. Dette artefakt er fejlagtigt blevet fortolket som et tegn på initierings synkroni. Artefaktet opstår som følge af at rifampicin virker senere på kromosom II end på kromosom I.
3
Contents
Preface 1
Summary 2
Resume (dansk) 3
Contents 4
1. Introduction 6
1.1 Why Vibrio cholerae is interesting 6
1.2 The aim of the thesis 7
1.3 The structure of the thesis 7
2. Bacteria with multiple chromosomes 9
2.1 Definition of a chromosome 9
2.2 Occurrence of multiple chromosomes 10
3. Escherichia coli and the replication machinery 11
3.1 Replication 11
3.2 Chromosomal origin of replication 12
3.3 Positive control 12
3.4 Negative control 13
3.5 Sequestration 13
3.6 Coordination with cell cycle 14
3.7 Multifork replication 14
3.8 Constant initiation mass 15
3.9 Synchrony 16
4. Plasmid replication 17
4.1 Origin of replication 17
4.2 Positive control 17
4.3 Negative control 18
4.4 Sequestration 18
4.5 Plasmid maintenance 18
4.6 Synchrony 19
5. Vibrio cholerae replication 20
5.1 Chromosomal configuration 20
4

5.2 oriCIvc 21
5.3 oriCIIvc 21
5.4 Initiation of chromosome I replication 22
5.5 Initiation of chromosome II replication 22
5.6 Dam and SeqA 23
5.7 Synchrony 24
5.8 Chromosome segregation 25
6. Materials and methods 27
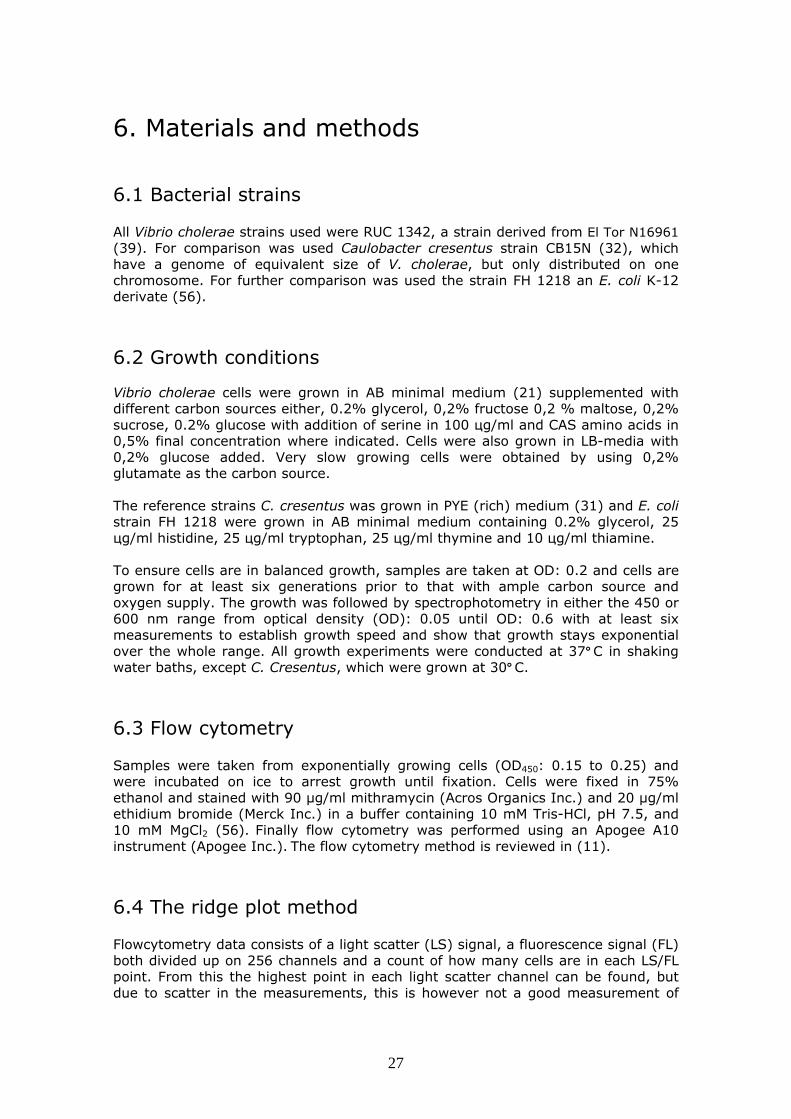
6.1 Bacterial strains 27
6.2 Growth conditions 27
6.3 Flow cytometry 27
6.4 The ridge plot method 27
6.5 The 2D method 28
6.6 RIF-runout 29
6.7 Quantitative PCR 29
6.8 Primers 29
6.9 Marker frequency model 30
7. Results 31
7.1 The ridge plot analysis 31
7.2 The 2D analysis 35
7.3 Marker frequency analysis 37
7.4 The effect of RIF-treatment in V. cholerae 38
8. Discussion 39
8.1 Chromosome II is replicated late in the C-period 39
8.2 Rifampicin action is delayed on chromosome II 40
8.3 Reinterpretation of segregation data 41
8.4 The minimal C+D-period is less than 40 minutes 42
8.5 Termination synchrony, an oxymoron? 42
8.6 A model for Vibrio cholerae replication 43
8.7 Verifying the model 44 8.8 Evolution 45
9. Conclusion 46
10. Reference list 47
5
1. Introduction The gram-negative bacterium Vibrio cholerae, part of the Vibrionales order has attracted a lot of clinical research attention, due to its ability to cause the diarrhoeal disease carrying its name. Normally living in aquatic environments in the tropics and subtropics, it has the ability to colonize the colon of a wide range of species including humans. The cholera disease has since 1852 been responsible for seven pandemic outbreaks spanning the globe, the latest pandemic started in the 1960ies by the sub-strain O1 El Tor and is still responsible for outbreaks in primarily underdeveloped countries (44,76). A new strain called O139 have been responsible for epidemic outbreaks as late as 1992 in areas of India where sanitary conditions and sewage systems are lacking. Upon ingestion of larger quanta of cholerae bacteria, sufficient numbers will make it through the acidic conditions of the stomach and colonize the small intestines. In the small intestines, it releases the cholerae toxin (CT) which activates a cellular protein called the adenylate cyclase and leads to a massive efflux of salts to the intestines, thereby inducing osmotic draining of body fluids (61,92). The loss can be as severe as 10 litres a day and untreated this can lead to death by dehydration in a few days. Untreated cholerae is deadly in around 60% of cases. The cure though is well described and consists of providing a mix of water, glucose and essential salts to be taken orally or intravenously. This can be combined with common broad spectra antibiotics such as tetracycline. This combined treatment decreases the deadliness of the disease to well under 1% (76).
1.1 Why Vibrio cholerae is interesting The cholerae disease, even though still a reoccurring scourge for underdeveloped countries, need no advanced science to cure, only the basic human need of a clean and safe water supply. Sadly this basic commodity is still lacking for large parts of the worlds population. The bacteria Vibrio cholerae though also holds the key to several interesting evolutionary questions. Life is divided into two distinct groups, the eukarya, of which we and all cells with a nucleus are part of and the prokarya, the simplest form of life. One of the features earlier thought to separate the two basic groups of life from each other are that eukaryots genomes are divided on numerous chromosomes, while the genome of prokaryots are generally contained on one single chromosome (3). This were discovered recently not to be accurate as several bacteria species, have more than one chromosome, including Vibrio cholerae which contains two (39,88). The first question raised is why do most bacteria contain only one chromosome and a few bacteria more. What are the evolutionary advantages of dividing the genome into several chromosomes, when most bacteria have not evolved so? The second question raised is in which way is the process of replicating several chromosomes taking place in a prokaryote. Eukaryotic cell division is a tightly regulated process, where the cell goes through distinct phases licensing the replication of the chromosomes and ensuring their faithful distribution to the two daughter cells during mitosis (3). This also makes eukaryotic cell division a slow process, which for one of the simplest members, budding yeast, takes
6
approximately 1.5 hours. Prokaryotic cell cycles are evolutionary adapted to changing environments and prokaryotes have to be able to proliferate fast. Vibrio cholerae cells are able to divide every 18 minutes under optimal conditions. The question is how do bacteria, which have considerably faster cell cycles ensure the faithful replication and distribution of several chromosomes to daughter cells? These questions, I am afraid, will not be answered fully in this thesis.
1.2 The aim of the thesis The current research on the cell cycle of Vibrio cholerae have answered several questions and of course left a lot more, as the field is new. The two Vibrio cholerae chromosomes have been shown to be of dissimilar size, chromosome I is approximately three times the size of chromosome II (39,88). The two chromosomes replicate from origins, using factors called initiator proteins, which are distinct for each chromosome. DnaA is the initiator for chromosome I and RctB for chromosome II (26,30). An interesting finding were done showing that both chromosomes initiate their replication at the same time in the cell cycle (29), thereby showing a possible evolutionary link to the eukaryotic licensing system. How intriguing this finding might be, during the work on my thesis, my co-workers and I saw evidence that the conclusion that both chromosomes initiate at the same time in the cell cycle was flawed. The first hint came from the fact that chromosome II replication initiates independently of DnaA (26,30) and microscopy studies of the segregation of the chromosomes (34,85), further supported our views. So the aim of this thesis were diverted from pursuing a wide range of interesting questions on V. cholerae replication to: Reinvestigate if the two chromosomes of Vibrio cholerae initiate synchronously in the cell cycle, or if another model of initiation is more plausible. The result of this investigation is a small but essential part of the answer to the two major evolutionary questions stated above.
1.3 The structure of the thesis The field of bacteria with multiple chromosome was first started around 1989 (18,52,67,87) and the thesis is starting with a short review of multi-chromosome bacteria and in which parts of the bacterial domain they are represented. This is combined with a setting down of the criteria for what is a bona fide chromosome (chapter 2). The structure of the thesis builds up the theoretical foundation of how replication of bacterial chromosomes takes place. This is done by using Escherichia coli as a model organism (chapter 3). E. coli is chosen because its replication have been intensively studied and is closely related to that of V. cholerae chromosome I. A further model system for V. cholerae is the plasmid P1 (chapter 4), the replication of which is well described and its control mechanisms hold similarities to the replication of chromosome II in V. cholerae. The replication of V. cholerae are a novel field and have only been studied since 2003 (30,39) and the limited literature in the field are reviewed in (chapter 5).
7
The materials and methods section describes the experimental methods and the materials used in conducting the research of this thesis (chapter 6). The process of setting up experiments to address the question if synchronous initiation of replication do occur in Vibrio cholerae and the results obtained from the experiments are presented in (chapter 7). The results are discussed along with their broader impact on the V. cholerae replication field of research and where to proceed in the imminent future. This is followed up by a further discussion on multiple chromosomes in bacteria (Chapter 8 & 9).
8

2. Bacteria with multiple chromosomes
2.1 Definition of a chromosome Bacteria commonly have their whole genome on one circular chromosome, of sizes less than 107 basepairs (76). This makes it obvious to define the chromosome as it hold all the essential genes for the survival and proliferation of the cell. Several criteria have been set up for defining genetic elements other than the first chromosome as bona fide chromosomes. A) The first requirement is that the genetic element carries essential genes, which are indispensable under the cells normal growth (60). As the cell often includes extrachromosomal genetic elements like plasmids, which carry genes that help the cell grow under certain circumstances. Examples are antibiotic resistances or new metabolic pathways that enable the cell to live in specific niches. These plasmids, though beneficial, are dispensable as the cell can proliferate without them. So only genetic elements encoding core elements of the metabolism, genes involved in cell growth and division, transcription and translation would qualify as a chromosome (60). B) The second and more tricky option is to define a minimum size of the genetic element to qualify as a chromosome (60). An example of a small essential genetic element is the 7.8 Kb pLeu in Buchnera sp. APS, which holds the essential gene for leucine biosynthesis, while the 100 KB megaplasmid P1 hold no essential genes and therefore is dispensable (17). According to the first criteria the only difference between a dispensable plasmid and a chromosome is the transfer of one essential gene (28). But size seems like a poor choice. C) The third requirement is that the genetic element is replicated cell cycle-linked (28). Plasmids have control mechanism that control their copy-number, but their replication is generally not tied to the cell cycle, though this have been debated (42,47,49,54), but merely consists of turning on replication at low copy-numbers and turning of at high copy numbers. It is suggested that a bona fide chromosome replicates related to the cell cycle, at a specific point (28). This is the equivalent of the chromosome replication in E. coli where its single chromosome is replicated once and only once per cell cycle (13). A definition based on size, is impractical to use as a rule for when a genetic element is a chromosome. The two other criterions are more useful as a chromosome must contain at least one gene, where the loss of it will make the bacteria unviable. To avoid classifying a genetic element with one essential open reading frame as a chromosome, a good criteria is that the replication is cell cycle linked. This points towards the cell having taken control of the genetic element, helping its maintenance (28).
9
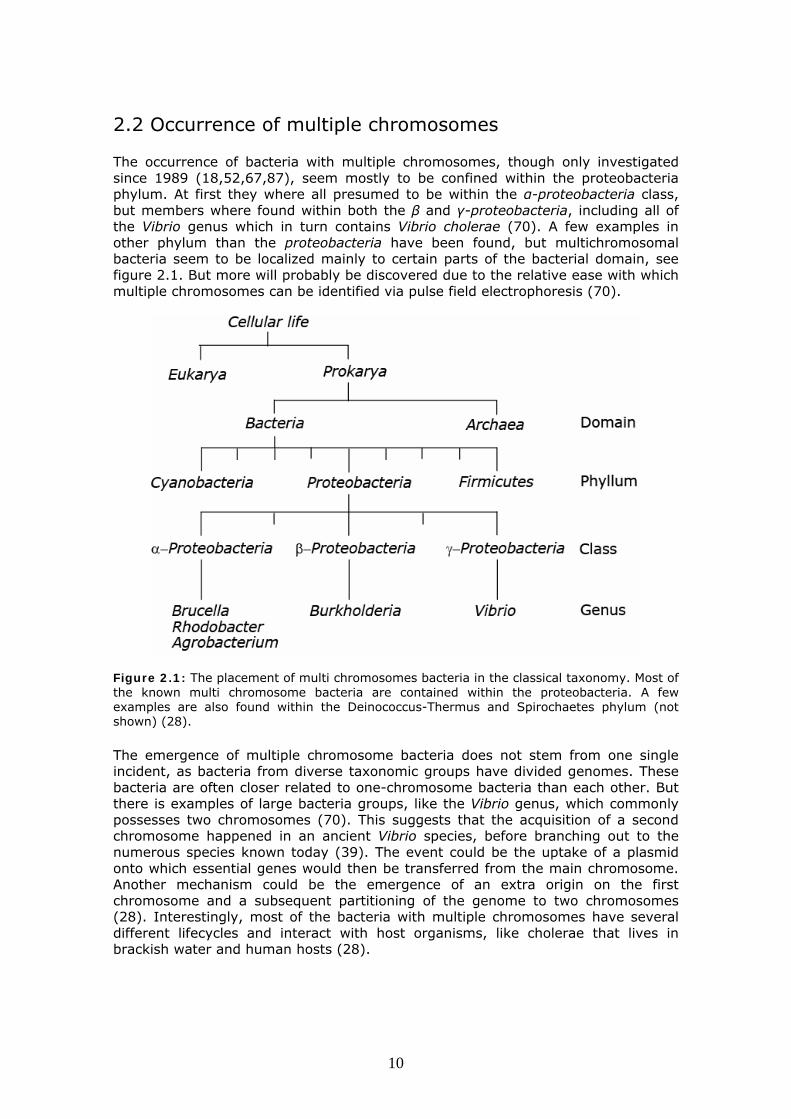
2.2 Occurrence of multiple chromosomes The occurrence of bacteria with multiple chromosomes, though only investigated since 1989 (18,52,67,87), seem mostly to be confined within the proteobacteria phylum. At first they where all presumed to be within the α-proteobacteria class, but members where found within both the β and γ-proteobacteria, including all of the Vibrio genus which in turn contains Vibrio cholerae (70). A few examples in other phylum than the proteobacteria have been found, but multichromosomal bacteria seem to be localized mainly to certain parts of the bacterial domain, see figure 2.1. But more will probably be discovered due to the relative ease with which multiple chromosomes can be identified via pulse field electrophoresis (70).
Figure 2.1: The placement of multi chromosomes bacteria in the classical taxonomy. Most of the known multi chromosome bacteria are contained within the proteobacteria. A few examples are also found within the Deinococcus-Thermus and Spirochaetes phylum (not shown) (28). The emergence of multiple chromosome bacteria does not stem from one single incident, as bacteria from diverse taxonomic groups have divided genomes. These bacteria are often closer related to one-chromosome bacteria than each other. But there is examples of large bacteria groups, like the Vibrio genus, which commonly possesses two chromosomes (70). This suggests that the acquisition of a second chromosome happened in an ancient Vibrio species, before branching out to the numerous species known today (39). The event could be the uptake of a plasmid onto which essential genes would then be transferred from the main chromosome. Another mechanism could be the emergence of an extra origin on the first chromosome and a subsequent partitioning of the genome to two chromosomes (28). Interestingly, most of the bacteria with multiple chromosomes have several different lifecycles and interact with host organisms, like cholerae that lives in brackish water and human hosts (28).
10
3. Escherichia coli and the replication machinery The replication of genomic DNA is a key component for the life cycle of any living organism. The replication is a well-regulated process with the purpose of making an exact copy of the DNA for passing on to the next generation. Escherichia coli K-12, has one circular chromosome of 4.6 million basepairs (9). It has been studied intensively during the last 40 years and is the best described model for chromosomal replication in bacteria. E. coli is closely related to V. cholerae as they both are part of Υ-proteobacteria, and the replication of the E. coli chromosome is very similar to that of V. cholerae chromosome I, while chromosome II differs considerably (39). Both E. coli and V. cholerae are furthermore both part of the Dam-clade, a group of bacteria using methylation of adenine bases for coordination of cellular processes including replication (57).
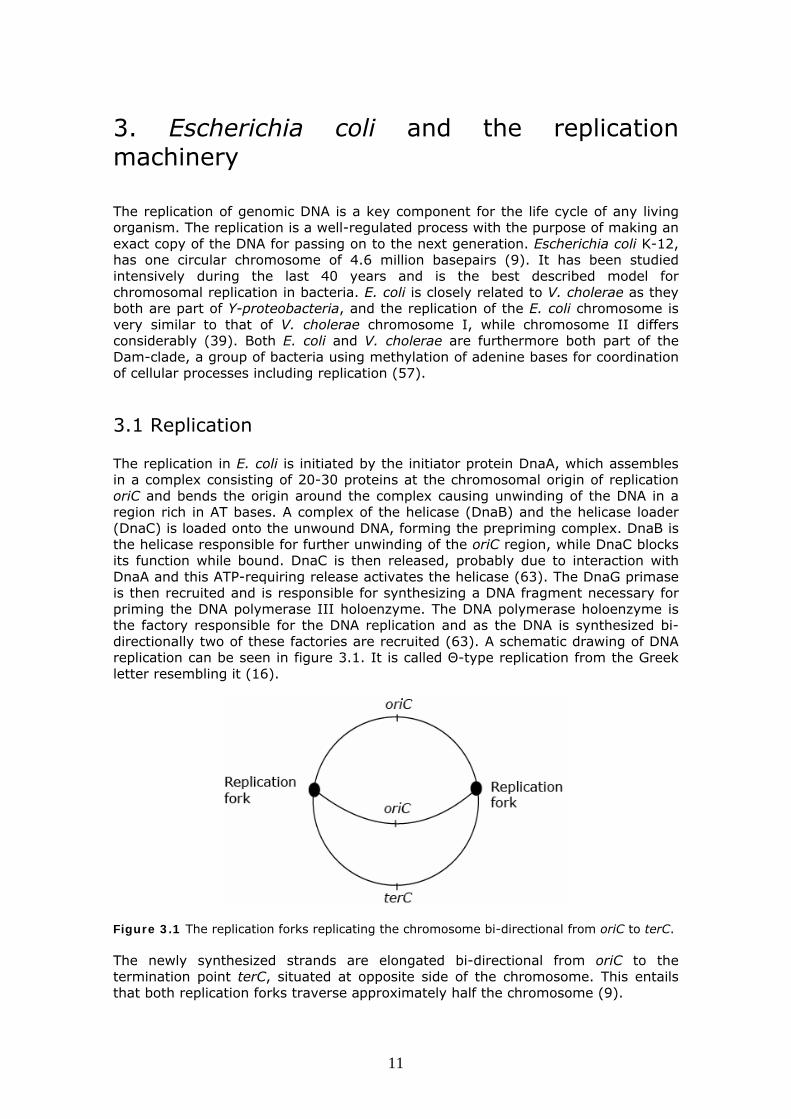
3.1 Replication The replication in E. coli is initiated by the initiator protein DnaA, which assembles in a complex consisting of 20-30 proteins at the chromosomal origin of replication oriC and bends the origin around the complex causing unwinding of the DNA in a region rich in AT bases. A complex of the helicase (DnaB) and the helicase loader (DnaC) is loaded onto the unwound DNA, forming the prepriming complex. DnaB is the helicase responsible for further unwinding of the oriC region, while DnaC blocks its function while bound. DnaC is then released, probably due to interaction with DnaA and this ATP-requiring release activates the helicase (63). The DnaG primase is then recruited and is responsible for synthesizing a DNA fragment necessary for priming the DNA polymerase III holoenzyme. The DNA polymerase holoenzyme is the factory responsible for the DNA replication and as the DNA is synthesized bi-directionally two of these factories are recruited (63). A schematic drawing of DNA replication can be seen in figure 3.1. It is called Θ-type replication from the Greek letter resembling it (16).
Figure 3.1 The replication forks replicating the chromosome bi-directional from oriC to terC. The newly synthesized strands are elongated bi-directional from oriC to the termination point terC, situated at opposite side of the chromosome. This entails that both replication forks traverse approximately half the chromosome (9).
11
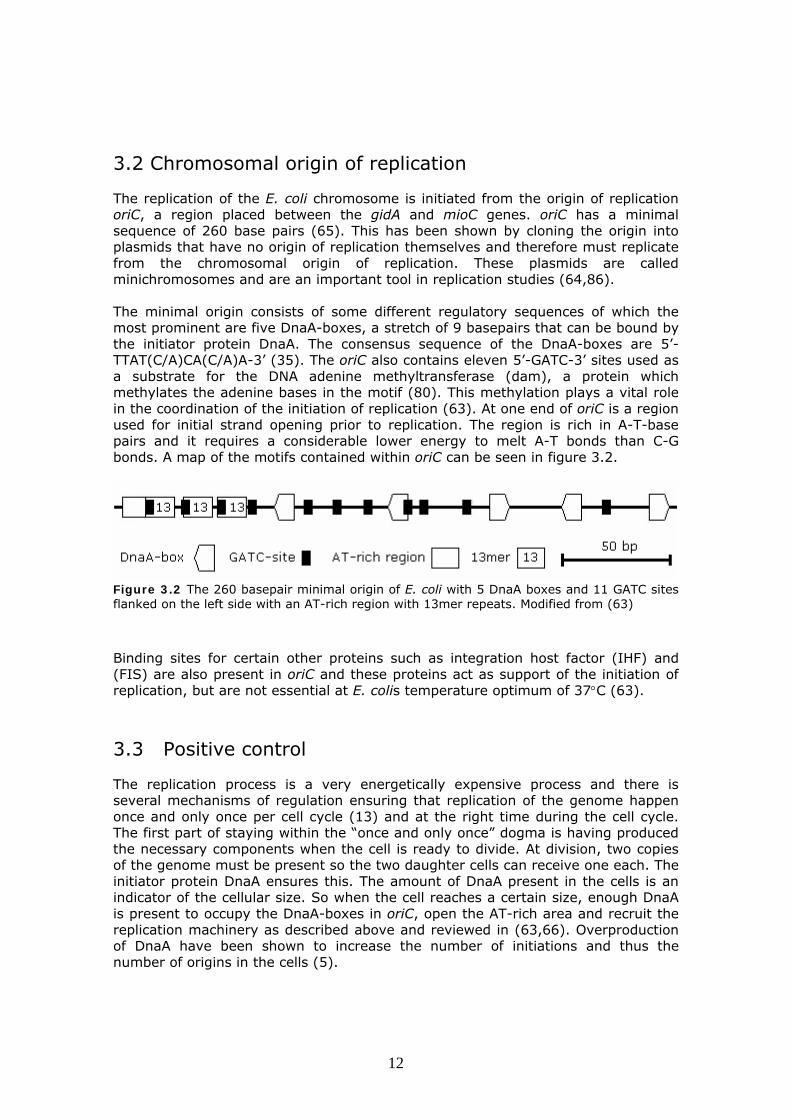
3.2 Chromosomal origin of replication The replication of the E. coli chromosome is initiated from the origin of replication oriC, a region placed between the gidA and mioC genes. oriC has a minimal sequence of 260 base pairs (65). This has been shown by cloning the origin into plasmids that have no origin of replication themselves and therefore must replicate from the chromosomal origin of replication. These plasmids are called minichromosomes and are an important tool in replication studies (64,86). The minimal origin consists of some different regulatory sequences of which the most prominent are five DnaA-boxes, a stretch of 9 basepairs that can be bound by the initiator protein DnaA. The consensus sequence of the DnaA-boxes are 5’-TTAT(C/A)CA(C/A)A-3’ (35). The oriC also contains eleven 5’-GATC-3’ sites used as a substrate for the DNA adenine methyltransferase (dam), a protein which methylates the adenine bases in the motif (80). This methylation plays a vital role in the coordination of the initiation of replication (63). At one end of oriC is a region used for initial strand opening prior to replication. The region is rich in A-T-base pairs and it requires a considerable lower energy to melt A-T bonds than C-G bonds. A map of the motifs contained within oriC can be seen in figure 3.2.
Figure 3.2 The 260 basepair minimal origin of E. coli with 5 DnaA boxes and 11 GATC sites flanked on the left side with an AT-rich region with 13mer repeats. Modified from (63)
Binding sites for certain other proteins such as integration host factor (IHF) and (FIS) are also present in oriC and these proteins act as support of the initiation of replication, but are not essential at E. colis temperature optimum of 37°C (63). 3.3 Positive control The replication process is a very energetically expensive process and there is several mechanisms of regulation ensuring that replication of the genome happen once and only once per cell cycle (13) and at the right time during the cell cycle. The first part of staying within the “once and only once” dogma is having produced the necessary components when the cell is ready to divide. At division, two copies of the genome must be present so the two daughter cells can receive one each. The initiator protein DnaA ensures this. The amount of DnaA present in the cells is an indicator of the cellular size. So when the cell reaches a certain size, enough DnaA is present to occupy the DnaA-boxes in oriC, open the AT-rich area and recruit the replication machinery as described above and reviewed in (63,66). Overproduction of DnaA have been shown to increase the number of initiations and thus the number of origins in the cells (5).
12
3.4 Negative control To ensure the second part of the dogma “only once per cell cycle”, several mechanisms to control the level of DnaA in the cells exist. First part of controlling DnaA levels is the regulation of the dnaA gene, which is regulated by a DnaA-box placed in the middle of the genes promoter. This ensures that the dnaA gene is negatively regulated by its own product, a mechanism called autorepression (4). A way of limiting DnaA availability is titration. Approximately 300 DnaA-boxes are distributed around the chromosome. These DnaA-boxes binds DnaA and thus make it unavailable for forming the initiation complex (37). A very potent titration site, a cluster of DnaA-boxes called the datA site, has been shown to have an important regulatory effect. By removing the site initiations were increased and inserting more datA sites on the chromosome decreased the initiations (50). The datA site is located close to oriC, which means the number of this potent titration site doubles shortly after initiation. This is helping to prevent reinitiations just after the first initiation event by titrating DnaA (37). Another feature of DnaA makes it possible to reduce the active levels. DnaA have a bound ATP molecule, which can be hydrolysed to ADP, making the DnaA protein unable to participate in the initiation complex. A complex consisting of the β-clamp subunit of the polymerase III holoenzyme, DnaA and a protein called Hda, for homologous to DnaA, is responsible for the hydrolysis of the DnaA bound ATP in a process call RIDA for regulatory inactivation of DnaA. This complex, which assemblies during initiation, makes the participating DnaA unavailable for reforming an initiation complex (45,46,79). The dnaA is autoregulated but higher levels of Hda induce higher levels of DnaA. This is probably due to the fact that DnaA-ATP is a much better repressor of DnaA activity than DnaA-ADP. These mechanisms are maintaining the homeostasis level of the initiation protein (79).
3.5 Sequestration These above-mentioned forms of negative regulation do not alone ensure the once per cell cycle dictum. As the initiation potential still remains high after initiation, a further control mechanism employed is called sequestration. Sequestration requires that the cell is able to distinguish between newly replicated DNA and old DNA. This distinguishing is obtained by the DNA adenine methyltransferase (Dam) which puts a methyl cap on each adenine base in the 5’-GATC-3’ palindrome. The methylation is not present on the newly synthesized DNA strand. DNA where only one strand is methylated is called hemimethylated (80). This has wide implication for several functions of the cell including DNA-mismatch repair and replication (57). The 5’-GATC-3’ sequences are present around the chromosome but in the oriC region they are over represented with eleven 5’-GATC-3’ sites. The sites in oriC is bound by a protein called SeqA when the 5’-GATC-3’ are in their hemimethylated state (59,90). This protein inhibits methylation of the adenine bases and sequestrates the origin, making it unavailable for initiation complex formation. This is called the eclipse period and lasts around a third of the cell cycle (91). Dam and SeqA thus ensures that no extra initiations occur and that the chromosome is replicated once and only once per cell cycle.
13

3.6 Coordination with cell cycle A bacterial cell is borne in a division event and each cell contains all the necessary cell machinery to proliferate and at least one completed copy of the genome. At slow growth the cell then increases in mass, synthesizing proteins and cell wall components, until the point where initiation mass is reached. The period up until this point is called the B-period. The chromosome then starts to replicate, a process that in E. coli takes no less than 40 minutes, even under ideal growth conditions (22), while the cell mass still increases. This period is called the C-period and is defined by the time required for the replication forks to proceed from oriC to terC. After the termination of chromosomal replication, the chromosomes are then segregated fully and distributed to the two ends of the cell and the septum is set down, while cellular mass still increases. This period, the D-period, last until the cell divide. The minimal D-period in E. coli is 20 minutes (22,68). A representation of the cell cycle can be seen in figure 3.3.
Figure 3.3 The bacterial cell cycle with the three distinct periods birth (B), chromosomal replication (C) and division (D) (22).
3.7 Multifork replication A feature that distinguishes bacteria from eukaryotic cells is their ability to have several cell cycles running at the same time. While eukaryotic cells have a licensing system to enter G1/M phase, which is only possible to renew after a division event, bacteria can have several replications running overlapping (13). E. coli is able to divide every 20 minutes in rich medium, a feat requiring that several rounds of replication takes place at the same time as the C and D periods take a minimum of 60 minutes, examples of this can be seen in figure 3.4. This entails that cells can be borne already containing the chromosomal origin of replication that will once belong to their granddaughter cells.
14
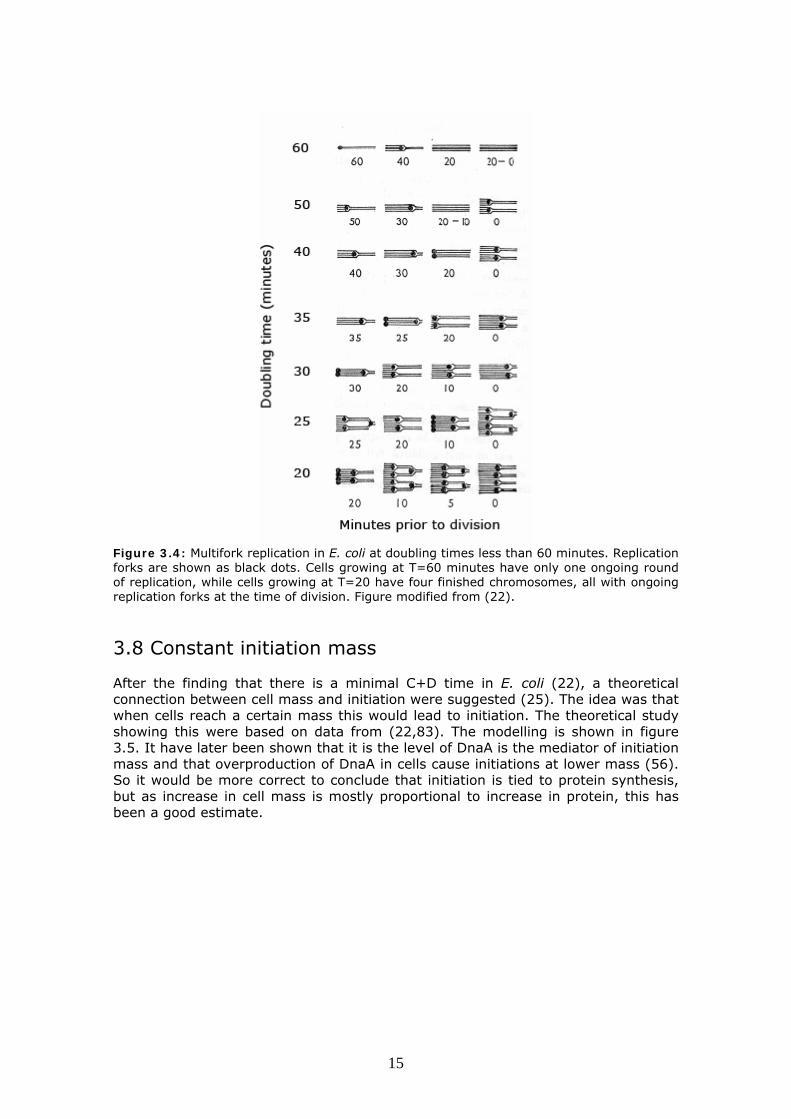
Figure 3.4: Multifork replication in E. coli at doubling times less than 60 minutes. Replication forks are shown as black dots. Cells growing at T=60 minutes have only one ongoing round of replication, while cells growing at T=20 have four finished chromosomes, all with ongoing replication forks at the time of division. Figure modified from (22).
3.8 Constant initiation mass After the finding that there is a minimal C+D time in E. coli (22), a theoretical connection between cell mass and initiation were suggested (25). The idea was that when cells reach a certain mass this would lead to initiation. The theoretical study showing this were based on data from (22,83). The modelling is shown in figure 3.5. It have later been shown that it is the level of DnaA is the mediator of initiation mass and that overproduction of DnaA in cells cause initiations at lower mass (56). So it would be more correct to conclude that initiation is tied to protein synthesis, but as increase in cell mass is mostly proportional to increase in protein, this has been a good estimate.
15
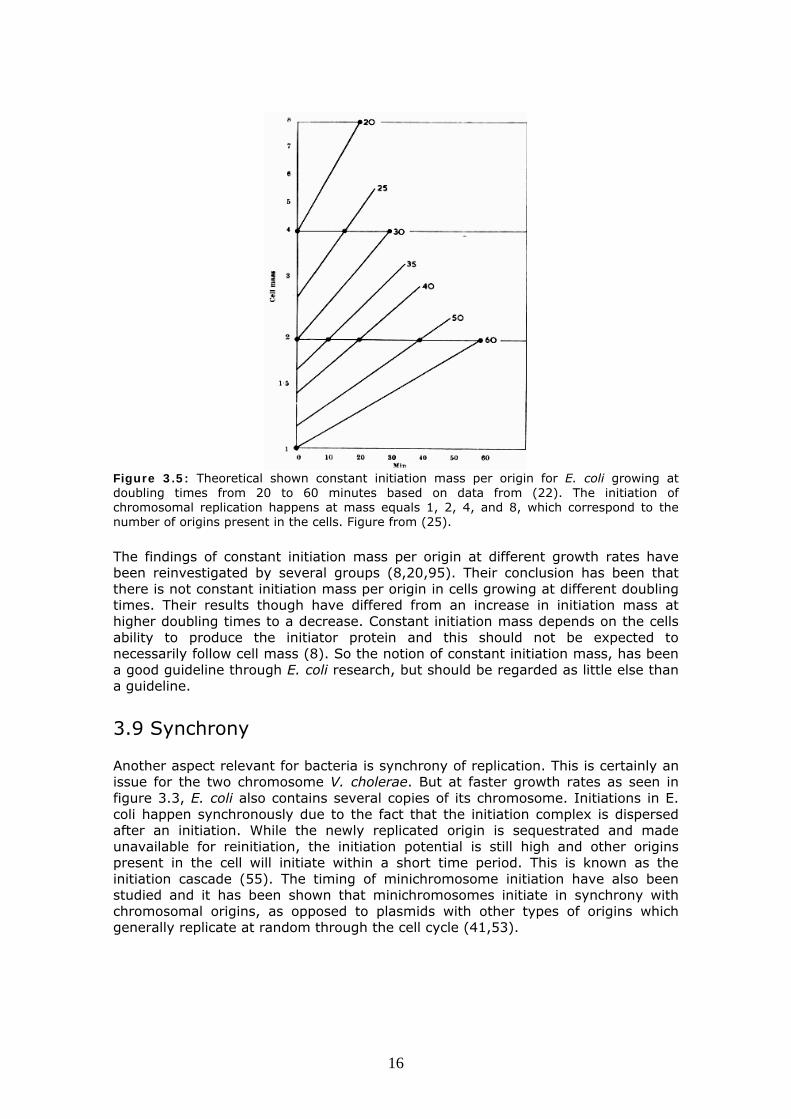
Figure 3.5: Theoretical shown constant initiation mass per origin for E. coli growing at doubling times from 20 to 60 minutes based on data from (22). The initiation of chromosomal replication happens at mass equals 1, 2, 4, and 8, which correspond to the number of origins present in the cells. Figure from (25).
The findings of constant initiation mass per origin at different growth rates have been reinvestigated by several groups (8,20,95). Their conclusion has been that there is not constant initiation mass per origin in cells growing at different doubling times. Their results though have differed from an increase in initiation mass at higher doubling times to a decrease. Constant initiation mass depends on the cells ability to produce the initiator protein and this should not be expected to necessarily follow cell mass (8). So the notion of constant initiation mass, has been a good guideline through E. coli research, but should be regarded as little else than a guideline. 3.9 Synchrony Another aspect relevant for bacteria is synchrony of replication. This is certainly an issue for the two chromosome V. cholerae. But at faster growth rates as seen in figure 3.3, E. coli also contains several copies of its chromosome. Initiations in E. coli happen synchronously due to the fact that the initiation complex is dispersed after an initiation. While the newly replicated origin is sequestrated and made unavailable for reinitiation, the initiation potential is still high and other origins present in the cell will initiate within a short time period. This is known as the initiation cascade (55). The timing of minichromosome initiation have also been studied and it has been shown that minichromosomes initiate in synchrony with chromosomal origins, as opposed to plasmids with other types of origins which generally replicate at random through the cell cycle (41,53).
16

4. Plasmid replication Replication in the low-copy-number plasmid P1 has certain interesting features relevant for the replication of V. cholerae chromosome II. The plasmid is chosen due to its chromosome-like Θ-type replication, where replication is initiated from one origin and continues bi-directional. It is noteworthy that P1 also is a bacteriophage capable for general transduction, and has been used as a method for moving genetic elements between strains (97). The following will focus only on its replication in the phages lysogenic state, where it is maintained as a approximately 100 kb plasmid or a derivative of it called mini-P1, which is a small plasmid replicated from the P1 origin of replication.
4.1 Origin of replication The plasmid P1 is replicated from a 1.4 kb DNA fragment containing the minimal origin consisting of 258 bases and flanked by two trans acting loci called incA and repA (1). The minimal origin (oriP1) have features specific for plasmids called iterons, which are repeated conserved sequences of 19 basepairs. The iterons are binding sites for the initiator protein. Plasmids featuring iterons are called iteron plasmids and P1 features 5 of these sequences in its minimal origin. In addition to iterons, the origin contains five 5’-GATC-3’ sites used for Dam-methylation and they are surrounded by 11-mer sequences much similar to the 13-mer SeqA binding site in oriC (6). This region has a high AT-content which is used for strand opening prior to replication. The ends of the minimal origin contain DnaA-boxes two at one end and three at the other. See figure 4.1.
Figure 4.1: The minimal origin of replication for plasmid P1, oriP1. Modified from (17).
4.2 Positive control Positive control is very important for the proliferation of plasmids in hosts. The main positive control is the gene product from the repA locus, RepA, a 34-kdalton initiator protein. RepA binds to the iterons, forming an initiation complex that melts the strand at the AT rich part of the origin and starts the replication (94). RepA is autoregulated. In E. coli the host protein DnaA also functions as a positive factor because it promotes strand opening and helps recruiting the host cells factors such as the helicase (73). DnaA thus functions as a connection between the host cells machinery and P1, but not as an initiator protein. Such an effect is observed in a wide range of plasmids and hosts (17).
17
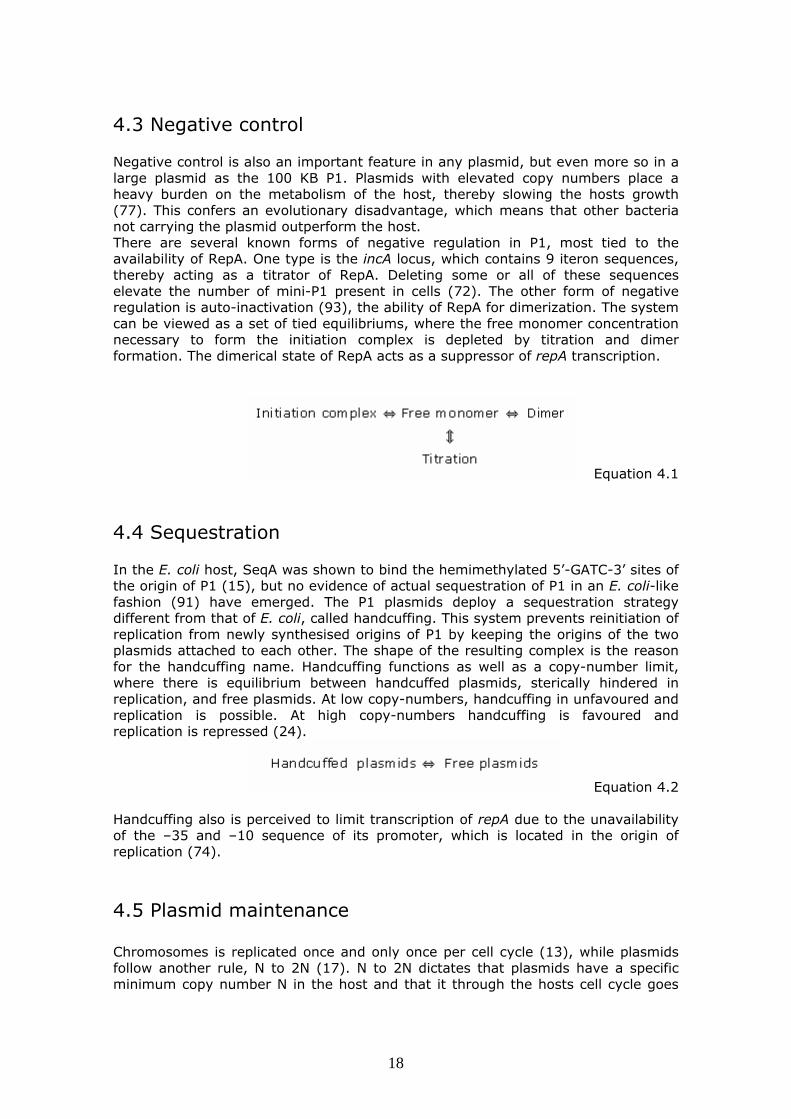
4.3 Negative control Negative control is also an important feature in any plasmid, but even more so in a large plasmid as the 100 KB P1. Plasmids with elevated copy numbers place a heavy burden on the metabolism of the host, thereby slowing the hosts growth (77). This confers an evolutionary disadvantage, which means that other bacteria not carrying the plasmid outperform the host. There are several known forms of negative regulation in P1, most tied to the availability of RepA. One type is the incA locus, which contains 9 iteron sequences, thereby acting as a titrator of RepA. Deleting some or all of these sequences elevate the number of mini-P1 present in cells (72). The other form of negative regulation is auto-inactivation (93), the ability of RepA for dimerization. The system can be viewed as a set of tied equilibriums, where the free monomer concentration necessary to form the initiation complex is depleted by titration and dimer formation. The dimerical state of RepA acts as a suppressor of repA transcription.
Equation 4.1
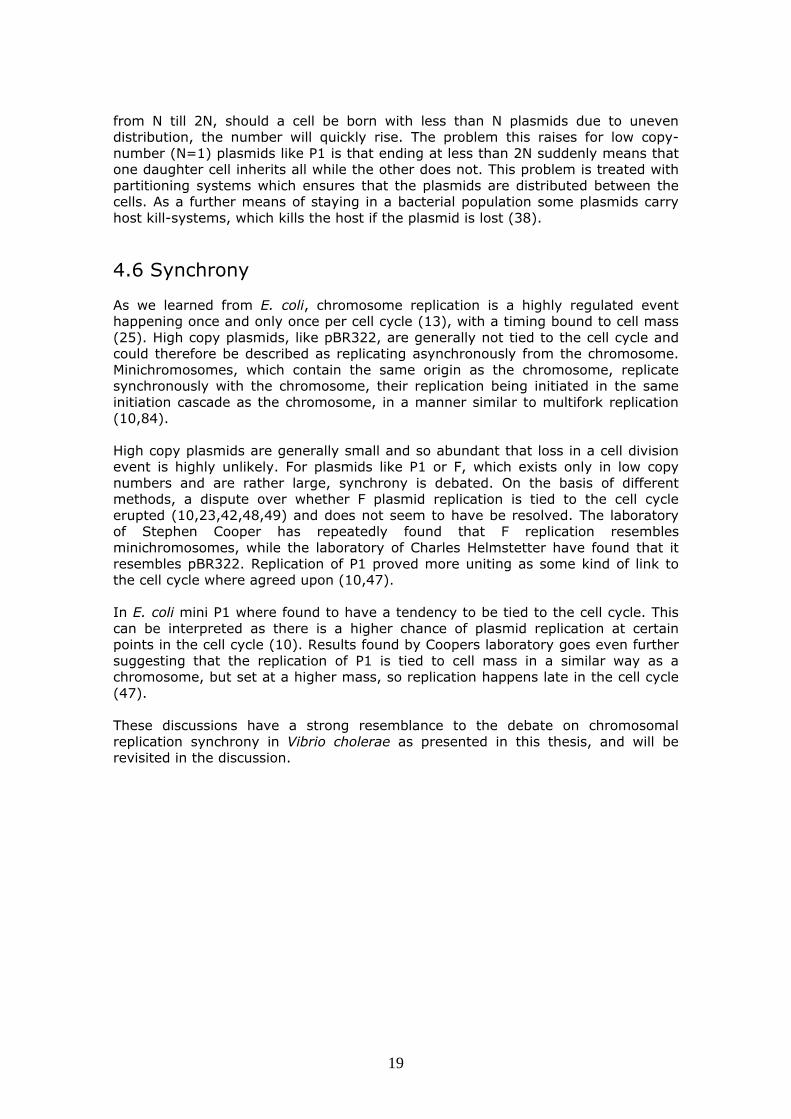
4.4 Sequestration In the E. coli host, SeqA was shown to bind the hemimethylated 5’-GATC-3’ sites of the origin of P1 (15), but no evidence of actual sequestration of P1 in an E. coli-like fashion (91) have emerged. The P1 plasmids deploy a sequestration strategy different from that of E. coli, called handcuffing. This system prevents reinitiation of replication from newly synthesised origins of P1 by keeping the origins of the two plasmids attached to each other. The shape of the resulting complex is the reason for the handcuffing name. Handcuffing functions as well as a copy-number limit, where there is equilibrium between handcuffed plasmids, sterically hindered in replication, and free plasmids. At low copy-numbers, handcuffing in unfavoured and replication is possible. At high copy-numbers handcuffing is favoured and replication is repressed (24).
Equation 4.2 Handcuffing also is perceived to limit transcription of repA due to the unavailability of the –35 and –10 sequence of its promoter, which is located in the origin of replication (74).
4.5 Plasmid maintenance Chromosomes is replicated once and only once per cell cycle (13), while plasmids follow another rule, N to 2N (17). N to 2N dictates that plasmids have a specific minimum copy number N in the host and that it through the hosts cell cycle goes
18
from N till 2N, should a cell be born with less than N plasmids due to uneven distribution, the number will quickly rise. The problem this raises for low copy-number (N=1) plasmids like P1 is that ending at less than 2N suddenly means that one daughter cell inherits all while the other does not. This problem is treated with partitioning systems which ensures that the plasmids are distributed between the cells. As a further means of staying in a bacterial population some plasmids carry host kill-systems, which kills the host if the plasmid is lost (38).
4.6 Synchrony As we learned from E. coli, chromosome replication is a highly regulated event happening once and only once per cell cycle (13), with a timing bound to cell mass (25). High copy plasmids, like pBR322, are generally not tied to the cell cycle and could therefore be described as replicating asynchronously from the chromosome. Minichromosomes, which contain the same origin as the chromosome, replicate synchronously with the chromosome, their replication being initiated in the same initiation cascade as the chromosome, in a manner similar to multifork replication (10,84). High copy plasmids are generally small and so abundant that loss in a cell division event is highly unlikely. For plasmids like P1 or F, which exists only in low copy numbers and are rather large, synchrony is debated. On the basis of different methods, a dispute over whether F plasmid replication is tied to the cell cycle erupted (10,23,42,48,49) and does not seem to have be resolved. The laboratory of Stephen Cooper has repeatedly found that F replication resembles minichromosomes, while the laboratory of Charles Helmstetter have found that it resembles pBR322. Replication of P1 proved more uniting as some kind of link to the cell cycle where agreed upon (10,47). In E. coli mini P1 where found to have a tendency to be tied to the cell cycle. This can be interpreted as there is a higher chance of plasmid replication at certain points in the cell cycle (10). Results found by Coopers laboratory goes even further suggesting that the replication of P1 is tied to cell mass in a similar way as a chromosome, but set at a higher mass, so replication happens late in the cell cycle (47). These discussions have a strong resemblance to the debate on chromosomal replication synchrony in Vibrio cholerae as presented in this thesis, and will be revisited in the discussion.
19
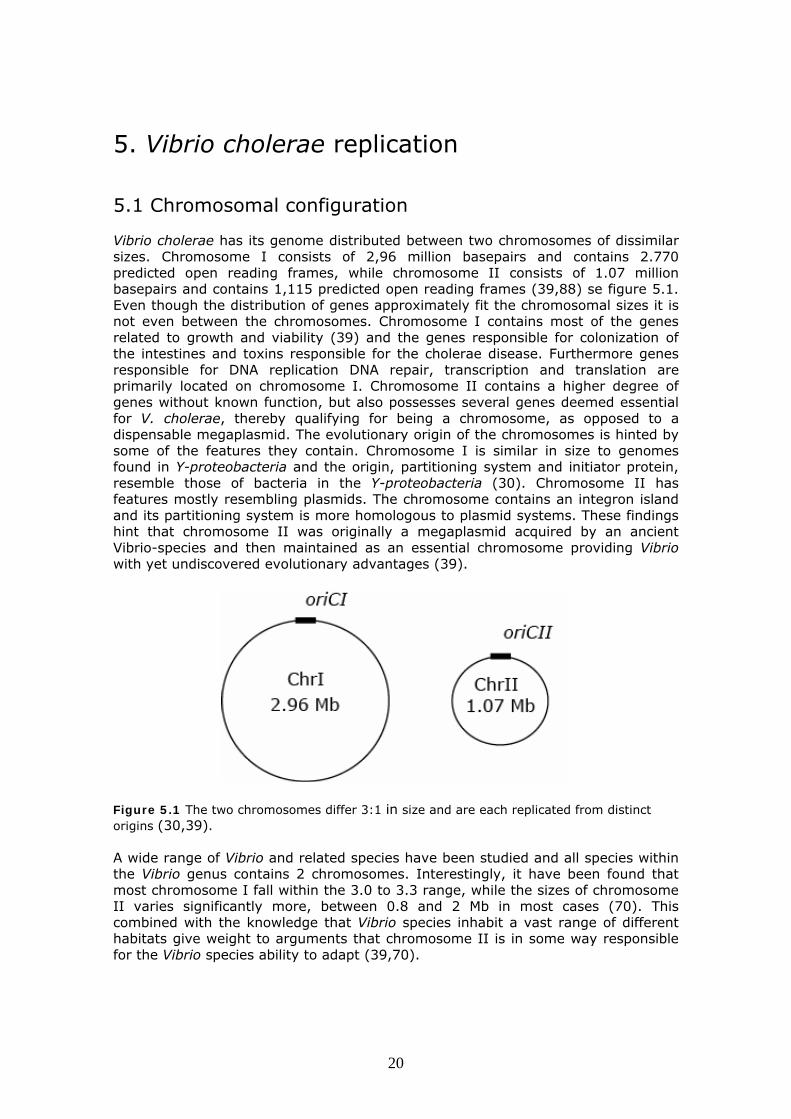
5. Vibrio cholerae replication 5.1 Chromosomal configuration Vibrio cholerae has its genome distributed between two chromosomes of dissimilar sizes. Chromosome I consists of 2,96 million basepairs and contains 2.770 predicted open reading frames, while chromosome II consists of 1.07 million basepairs and contains 1,115 predicted open reading frames (39,88) se figure 5.1. Even though the distribution of genes approximately fit the chromosomal sizes it is not even between the chromosomes. Chromosome I contains most of the genes related to growth and viability (39) and the genes responsible for colonization of the intestines and toxins responsible for the cholerae disease. Furthermore genes responsible for DNA replication DNA repair, transcription and translation are primarily located on chromosome I. Chromosome II contains a higher degree of genes without known function, but also possesses several genes deemed essential for V. cholerae, thereby qualifying for being a chromosome, as opposed to a dispensable megaplasmid. The evolutionary origin of the chromosomes is hinted by some of the features they contain. Chromosome I is similar in size to genomes found in Υ-proteobacteria and the origin, partitioning system and initiator protein, resemble those of bacteria in the Υ-proteobacteria (30). Chromosome II has features mostly resembling plasmids. The chromosome contains an integron island and its partitioning system is more homologous to plasmid systems. These findings hint that chromosome II was originally a megaplasmid acquired by an ancient Vibrio-species and then maintained as an essential chromosome providing Vibrio with yet undiscovered evolutionary advantages (39).
Figure 5.1 The two chromosomes differ 3:1 in size and are each replicated from distinct origins (30,39). A wide range of Vibrio and related species have been studied and all species within the Vibrio genus contains 2 chromosomes. Interestingly, it have been found that most chromosome I fall within the 3.0 to 3.3 range, while the sizes of chromosome II varies significantly more, between 0.8 and 2 Mb in most cases (70). This combined with the knowledge that Vibrio species inhabit a vast range of different habitats give weight to arguments that chromosome II is in some way responsible for the Vibrio species ability to adapt (39,70).
20

Since the publication of the complete genomic sequence of V. cholerae (39), research have started on chromosomal replication with Egan and Waldor (30) establishing the basic requirements of replication of the two chromosomes.
5.2 oriCIvc The origin of chromosome I oriCIvc was first suggested from the complete genomic sequence by its proximity to genes associated with replication (dnaA and dnaN) and sequence homology to the origins of E. coli and V. harveyi (39). Deletion studies on mini-chromosomes narrowed in oriCIvc to approximately 400 bp containing five DnaA boxes and an AT-rich region as well as 14 3’-GATC-5’ sites (30), see figure 5.2. Mini-chromosomes containing the 447 bp intergenic region between gidA and mioC where able to replicate autonomously in E. coli, showing that E. coli were able to supply all the factors necessary for chromosome I proliferation (30).
Figure 5.2 The origin of chromosome I oriCIvc, is situated between gidA and mioC and is very similar to oriC of E. coli, having five DnaA boxes, GATC sites and an AT-rich region for strand opening. Furthermore, it contains a binding site for IHF (not shown). Figure modified from (30). 5.3 oriCIIvc The origin of chromosome II, oriCIIvc, were identified by G/C-skew analysis (C-G/C+G), which is an analysis that depends on the different rates of mutations caused by leading and lagging strand replication (39,58). Homology to other organisms and known origin proximal genes, did not bring any results, due to the distinctly different kind of origin present on chromosome II than related γ-proteobacteria (39).
Figure 5.3 The intergenic region ig2 between the loci rctA and rctB. Only the right side of the intergenic region is necessary for mini-chromosome replication and it contains the minimal origin (30).
21

The origin of chromosome II was found to be in an intergenic region (ig2) figure 5.3, flanked by two loci of which one, called rctB for replication of chromosome II proved necessary for replication of minichromosomes in E. coli, but not in V. cholerae, showing that it works in trans. The other locus rctA where first suspected to be essential for minichromosomes replication in V. cholerae, but later shown not to be (30,89). The origin contains 6 iteron-like 12-mer sequences, placed with a regular interval. The consensus for the 12-mer is (A/T)TGATCATNN(A/T)T. Furthermore, it contains 12 3’-GATC-5’ and an AT-rich region. One single DnaA-box is present, suggesting that DnaA in some way is used in the initiation of chromosome II replication. A binding site for the IHF protein is also present in oriCIIvc. The left site of the ig2 region also contains repeated sequences used for binding RctB. There are 4 copies of an 11-mer stretch with a consensus sequence 5’-ATGATCAAGAG-3’ and one more of the 12mer sequence. The minimal origin is shown in figure 5.4.
Figure 5.4: The origin of chromosome II oriCIIvc, is situated between rctA and rctB and bear greater resemblance to plasmid origins than the E. coli origin. The origin contains six iteron-like 12-mer repeat sequences, and only a single DnaA-box. Like oriP1 and oriC it contains GATC sites and an AT-rich region. Figure modified from (30).
5.4 Initiation of chromosome I replication The origin of chromosome I is very similar to that of E. coli (30) and it has been shown that mini-chromosomes carrying only oriCIvc were able to replicate in E. coli (39), thereby showing that all the factors necessary for initiation in V. cholerae are homologous to E. coli. There are minor differences, such as that no protein homologues to the DnaC clamp loader is present in V. cholerae, but the overall initiation process is presumed to be similar to that of E. coli. A further study shows that chromosome I and chromosome II are under independent control mechanisms and that higher levels of DnaA only have the ability to increase initiations from oriCIvc (26). 5.5 Initiation of chromosome II replication Chromosome II is replicated from oriCIIvc, but this sequence did not prove enough for mini-chromosome replication in E. coli. In addition to that, the rctB gene, producing a 658 amino acid protein RctB, was identified as a necessary factor. RctB functions in the same way as DnaA from E. coli or P1 RepA, as an initiator protein (26) that binds the origin (30). The rctB gene was shown to be autoregulated and interestingly both the presence of Dam and DnaA had effect on the transcription from the rctB promoter (PrctB). The former have a slight positive effect and the latter have a slight negative effect (71) (27). Furthermore, IHF had a positive effect
22

on the transcription of rctB, which is speculated to be due to the IHF site being 129 basepairs upstream of PrctB and that IHF activates the transcription by bending the DNA, thereby favouring open complex formation in the promoter –10 region (89). The locus rctA on the other side of the origin was first presumed to be transcribed as an RNA needed in the initiation (30). The RNA were later shown to be unnecessary by minichromosome deletion analysis and the gene locus itself had an inhibitory effect on minichromosomes copy number (89). The locus was shown to bind RctB in vitro in a mobility shift assay. rctA is thus a titration site for RctB (89). Furthermore, the promoter for the rctA locus were negatively regulated by RctB, which leads to a titration model, where high levels of RctB repressed both the rctA and rctB promoters, while low levels of RctB enabled transcription from the two promoters. This in turn lead to de novo synthesis of RctB and the release of RctB bound to the titration sites in the rctA locus (89). See figure 5.5.
Figure 5.5: RctB is a negative regulator of the transcription from two promoters, one regulating rctB and one regulating rctA. The transcription of rctA is shown to release RctB titrated to the region. High levels of RctB keep both promoters shut, while low levels activate both promoters. From (89). Chromosome II replication is initiated by RctB and even though the origin contains a DnaA-box, increased levels of DnaA does not increase initiations from the origin of chromosome two. So the two chromosomes have independent control mechanism (26). It have been suggested in plasmids that binding of DnaA helps recruit the cellular replication machinery (17), a similar mechanism is likely for chromosome II. 5.6 Dam and SeqA Vibrio cholerae have both the dam and seqA genes, needed for sequestration and setting down the eclipse period (7,30,91). In contrast to the situation in E. coli, where both dam and seqA are dispensable genes, they have proved to be essential in replication of V. cholerae minichromosomes. Minichromosomes containing oriCIvc could not be transformed in E. coli seqA- or dam- or the double mutant. Mini-chromosomes containing oriCIIvc could be transformed in to a seqA- but not into dam- or the double mutant (30). The requirement for Dam and SeqA, could mean that initiation of replication is coordinated by sequestration or a handcuffing mechanism, as described in chapter 3 and 4.
23
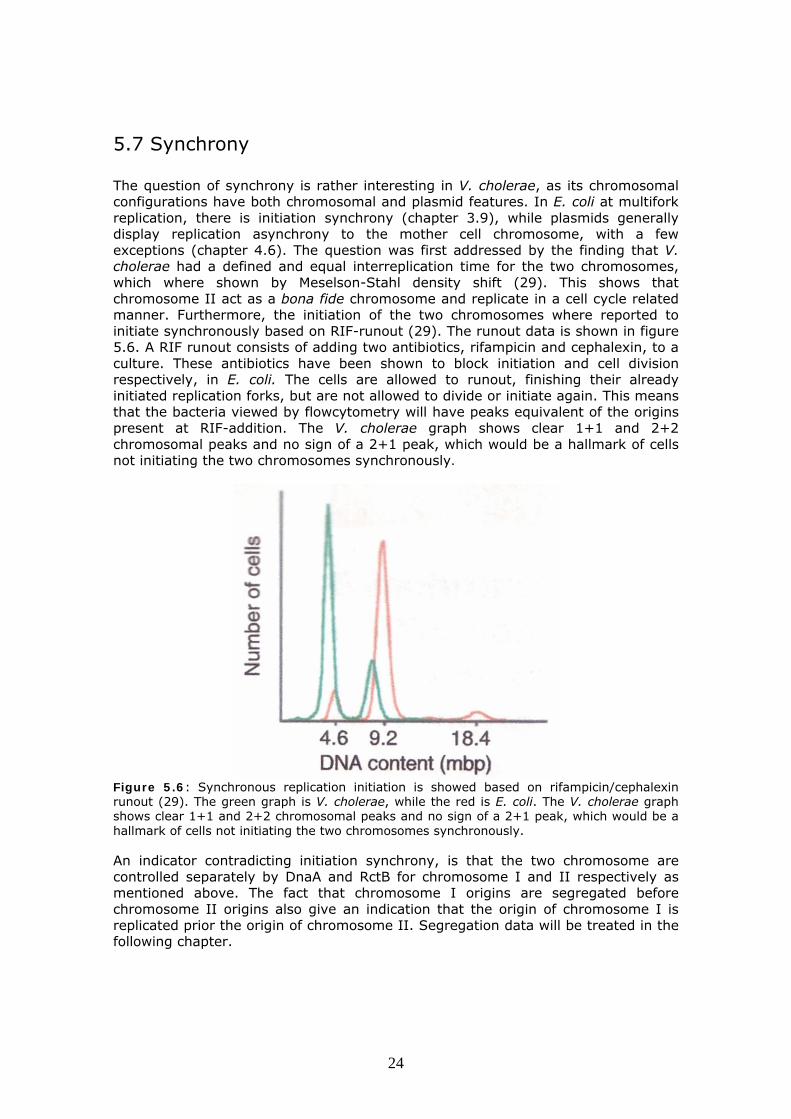
5.7 Synchrony The question of synchrony is rather interesting in V. cholerae, as its chromosomal configurations have both chromosomal and plasmid features. In E. coli at multifork replication, there is initiation synchrony (chapter 3.9), while plasmids generally display replication asynchrony to the mother cell chromosome, with a few exceptions (chapter 4.6). The question was first addressed by the finding that V. cholerae had a defined and equal interreplication time for the two chromosomes, which where shown by Meselson-Stahl density shift (29). This shows that chromosome II act as a bona fide chromosome and replicate in a cell cycle related manner. Furthermore, the initiation of the two chromosomes where reported to initiate synchronously based on RIF-runout (29). The runout data is shown in figure 5.6. A RIF runout consists of adding two antibiotics, rifampicin and cephalexin, to a culture. These antibiotics have been shown to block initiation and cell division respectively, in E. coli. The cells are allowed to runout, finishing their already initiated replication forks, but are not allowed to divide or initiate again. This means that the bacteria viewed by flowcytometry will have peaks equivalent of the origins present at RIF-addition. The V. cholerae graph shows clear 1+1 and 2+2 chromosomal peaks and no sign of a 2+1 peak, which would be a hallmark of cells not initiating the two chromosomes synchronously.
Figure 5.6: Synchronous replication initiation is showed based on rifampicin/cephalexin runout (29). The green graph is V. cholerae, while the red is E. coli. The V. cholerae graph shows clear 1+1 and 2+2 chromosomal peaks and no sign of a 2+1 peak, which would be a hallmark of cells not initiating the two chromosomes synchronously. An indicator contradicting initiation synchrony, is that the two chromosome are controlled separately by DnaA and RctB for chromosome I and II respectively as mentioned above. The fact that chromosome I origins are segregated before chromosome II origins also give an indication that the origin of chromosome I is replicated prior the origin of chromosome II. Segregation data will be treated in the following chapter.
24
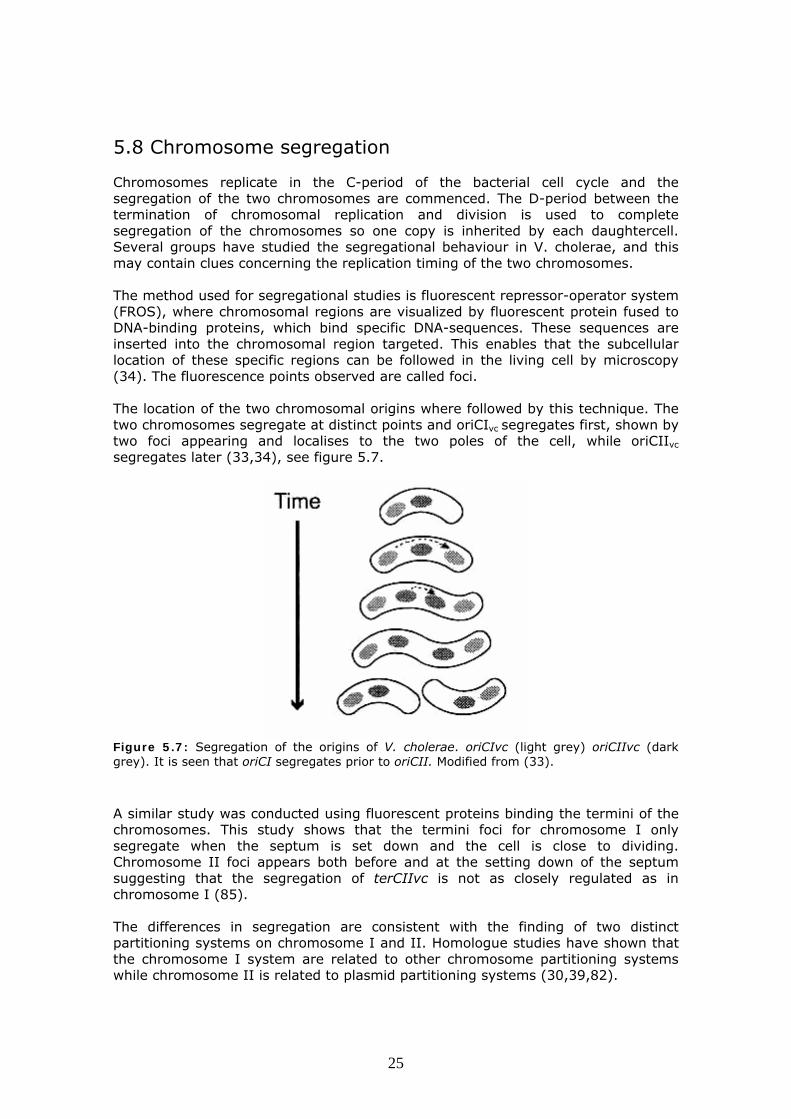
5.8 Chromosome segregation Chromosomes replicate in the C-period of the bacterial cell cycle and the segregation of the two chromosomes are commenced. The D-period between the termination of chromosomal replication and division is used to complete segregation of the chromosomes so one copy is inherited by each daughtercell. Several groups have studied the segregational behaviour in V. cholerae, and this may contain clues concerning the replication timing of the two chromosomes. The method used for segregational studies is fluorescent repressor-operator system (FROS), where chromosomal regions are visualized by fluorescent protein fused to DNA-binding proteins, which bind specific DNA-sequences. These sequences are inserted into the chromosomal region targeted. This enables that the subcellular location of these specific regions can be followed in the living cell by microscopy (34). The fluorescence points observed are called foci. The location of the two chromosomal origins where followed by this technique. The two chromosomes segregate at distinct points and oriCIvc segregates first, shown by two foci appearing and localises to the two poles of the cell, while oriCIIvc
segregates later (33,34), see figure 5.7.
Figure 5.7: Segregation of the origins of V. cholerae. oriCIvc (light grey) oriCIIvc (dark grey). It is seen that oriCI segregates prior to oriCII. Modified from (33). A similar study was conducted using fluorescent proteins binding the termini of the chromosomes. This study shows that the termini foci for chromosome I only segregate when the septum is set down and the cell is close to dividing. Chromosome II foci appears both before and at the setting down of the septum suggesting that the segregation of terCIIvc is not as closely regulated as in chromosome I (85).
The differences in segregation are consistent with the finding of two distinct partitioning systems on chromosome I and II. Homologue studies have shown that the chromosome I system are related to other chromosome partitioning systems while chromosome II is related to plasmid partitioning systems (30,39,82).
25
There are certain problems using segregation data for determining replication synchrony. Two foci at the same position cannot be resolved and can be interpreted as only one focus point or two coherent foci. Segregation is not necessarily tied to replication, as two modes of segregation are known. Direct segregation right after replication is called coreplicated segregation, while examples of sister chromosome cohesion, where the chromosomes stick until the setting down of the septum, is known as well (85).
26
6. Materials and methods 6.1 Bacterial strains All Vibrio cholerae strains used were RUC 1342, a strain derived from El Tor N16961 (39). For comparison was used Caulobacter cresentus strain CB15N (32), which have a genome of equivalent size of V. cholerae, but only distributed on one chromosome. For further comparison was used the strain FH 1218 an E. coli K-12 derivate (56). 6.2 Growth conditions Vibrio cholerae cells were grown in AB minimal medium (21) supplemented with different carbon sources either, 0.2% glycerol, 0,2% fructose 0,2 % maltose, 0,2% sucrose, 0.2% glucose with addition of serine in 100 цg/ml and CAS amino acids in 0,5% final concentration where indicated. Cells were also grown in LB-media with 0,2% glucose added. Very slow growing cells were obtained by using 0,2% glutamate as the carbon source. The reference strains C. cresentus was grown in PYE (rich) medium (31) and E. coli strain FH 1218 were grown in AB minimal medium containing 0.2% glycerol, 25 цg/ml histidine, 25 цg/ml tryptophan, 25 цg/ml thymine and 10 цg/ml thiamine. To ensure cells are in balanced growth, samples are taken at OD: 0.2 and cells are grown for at least six generations prior to that with ample carbon source and oxygen supply. The growth was followed by spectrophotometry in either the 450 or 600 nm range from optical density (OD): 0.05 until OD: 0.6 with at least six measurements to establish growth speed and show that growth stays exponential over the whole range. All growth experiments were conducted at 37°C in shaking water baths, except C. Cresentus, which were grown at 30°C. 6.3 Flow cytometry Samples were taken from exponentially growing cells (OD450: 0.15 to 0.25) and were incubated on ice to arrest growth until fixation. Cells were fixed in 75% ethanol and stained with 90 μg/ml mithramycin (Acros Organics Inc.) and 20 μg/ml ethidium bromide (Merck Inc.) in a buffer containing 10 mM Tris-HCl, pH 7.5, and 10 mM MgCl2 (56). Finally flow cytometry was performed using an Apogee A10 instrument (Apogee Inc.). The flow cytometry method is reviewed in (11). 6.4 The ridge plot method Flowcytometry data consists of a light scatter (LS) signal, a fluorescence signal (FL) both divided up on 256 channels and a count of how many cells are in each LS/FL point. From this the highest point in each light scatter channel can be found, but due to scatter in the measurements, this is however not a good measurement of
27

where the weight of the data is lying. Instead, we introduced a method called the “Ridge” method, which evaluates a window of 11 fluorescence channel in each light scatter channel and gives the middle point of the window with the highest combined count. An example of this can be seen in figure 6.1. The produced ridge can be used to analyse the cell cycle and is particularly relevant for two chromosome bacteria as a relative rate of replication during the C-period can be deduced from the plot. As the dataset consisted of 2562 data points a Perl script was used to filter the data and extract the ridges.
Figure 6.1: An example of the ridge method of analysing flow cytometry data. In every light scatter channel a window of fluorescence channels (Grey) is set down where it yields the highest combined value. Here shown with a window of 5. The middle point of the window, which is not necessarily the highest value, is then plotted as the ridge of the graph (Dark grey). 6.5 The 2D method It is possible to determine cell-cycle parameters from fluorescence histograms of exponentially growing cultures using software developed by Michelsen et al (68). We have redesigned this software to simulate two chromosomes. Slow growing cells will have a number of cells in all of the three phases of the cell cycle. The cells in the B period will contain one chromosome, the cells in the C-period will contain an integer between one and two, while the cells in the D-period will contain two chromosomes. This can be seen in fluorescence histograms as two peaks of cells containing one chromosome and two chromosomes respectively, connected by a ridge of replicating cells. This experimental histogram can be modelled by computer software. The input parameters to the software are the length of the C and D period and the standard deviations of the one and two chromosome peak. The program are based on experimental data showing that the standard deviation increases linearly with channel number between peak one and peak two (68). Furthermore a the age distribution of an ideal culture is taken into account (75). A full description of the program can be found in Michelsen et al (68). To accommodate two-chromosome analysis an additional input to the software is the timing of chromosome II initiation. The simulation enables us to address the question of synchrony, as we can decide which timing of chromosome II initiation that fits the data best.
28
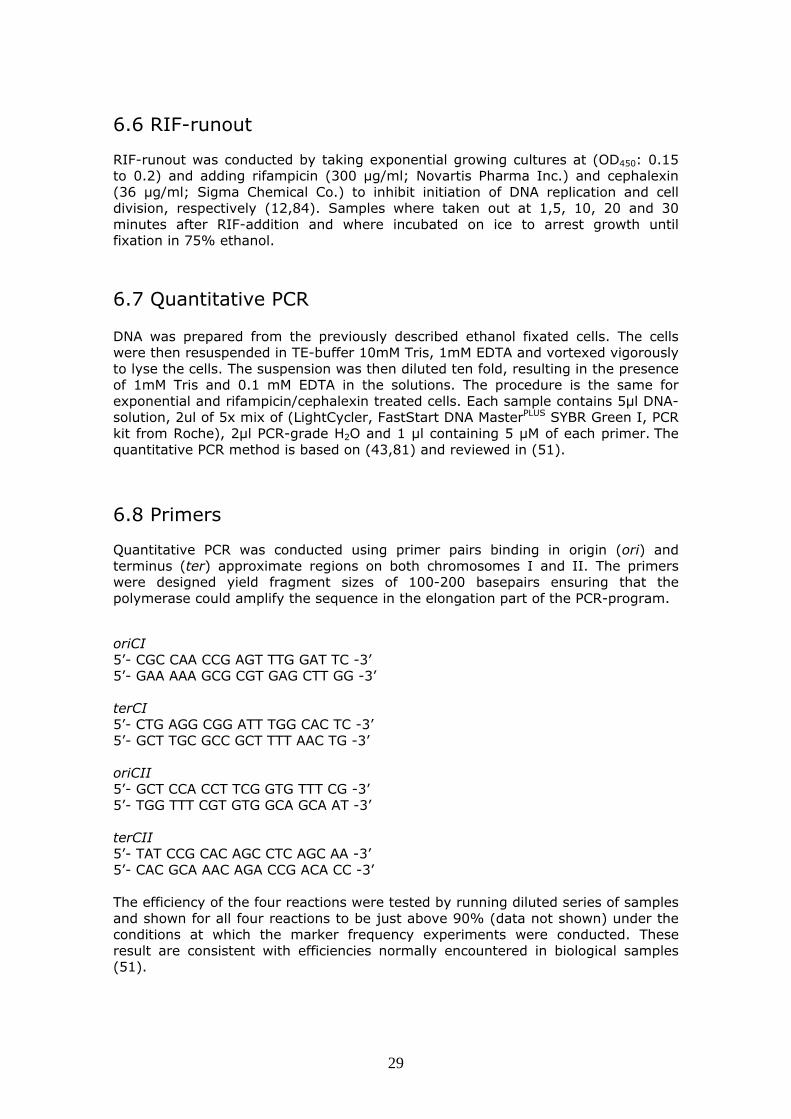
6.6 RIF-runout RIF-runout was conducted by taking exponential growing cultures at (OD450: 0.15 to 0.2) and adding rifampicin (300 μg/ml; Novartis Pharma Inc.) and cephalexin (36 μg/ml; Sigma Chemical Co.) to inhibit initiation of DNA replication and cell division, respectively (12,84). Samples where taken out at 1,5, 10, 20 and 30 minutes after RIF-addition and where incubated on ice to arrest growth until fixation in 75% ethanol.
6.7 Quantitative PCR DNA was prepared from the previously described ethanol fixated cells. The cells were then resuspended in TE-buffer 10mM Tris, 1mM EDTA and vortexed vigorously to lyse the cells. The suspension was then diluted ten fold, resulting in the presence of 1mM Tris and 0.1 mM EDTA in the solutions. The procedure is the same for exponential and rifampicin/cephalexin treated cells. Each sample contains 5μl DNA-solution, 2ul of 5x mix of (LightCycler, FastStart DNA MasterPLUS SYBR Green I, PCR kit from Roche), 2μl PCR-grade H2O and 1 μl containing 5 μM of each primer. The quantitative PCR method is based on (43,81) and reviewed in (51).
6.8 Primers Quantitative PCR was conducted using primer pairs binding in origin (ori) and terminus (ter) approximate regions on both chromosomes I and II. The primers were designed yield fragment sizes of 100-200 basepairs ensuring that the polymerase could amplify the sequence in the elongation part of the PCR-program.
oriCI 5’- CGC CAA CCG AGT TTG GAT TC -3’ 5’- GAA AAA GCG CGT GAG CTT GG -3’ terCI 5’- CTG AGG CGG ATT TGG CAC TC -3’ 5’- GCT TGC GCC GCT TTT AAC TG -3’ oriCII 5’- GCT CCA CCT TCG GTG TTT CG -3’ 5’- TGG TTT CGT GTG GCA GCA AT -3’ terCII 5’- TAT CCG CAC AGC CTC AGC AA -3’ 5’- CAC GCA AAC AGA CCG ACA CC -3’ The efficiency of the four reactions were tested by running diluted series of samples and shown for all four reactions to be just above 90% (data not shown) under the conditions at which the marker frequency experiments were conducted. These result are consistent with efficiencies normally encountered in biological samples (51).
29
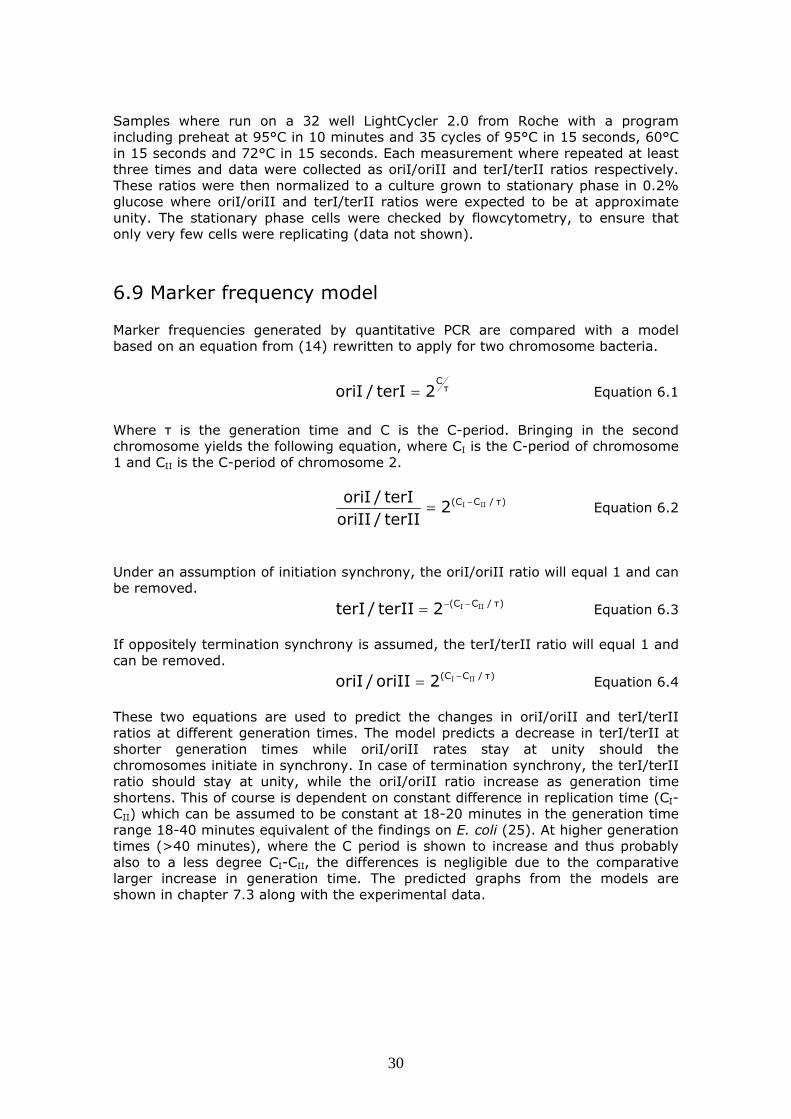
Samples where run on a 32 well LightCycler 2.0 from Roche with a program including preheat at 95°C in 10 minutes and 35 cycles of 95°C in 15 seconds, 60°C in 15 seconds and 72°C in 15 seconds. Each measurement where repeated at least three times and data were collected as oriI/oriII and terI/terII ratios respectively. These ratios were then normalized to a culture grown to stationary phase in 0.2% glucose where oriI/oriII and terI/terII ratios were expected to be at approximate unity. The stationary phase cells were checked by flowcytometry, to ensure that only very few cells were replicating (data not shown).
6.9 Marker frequency model Marker frequencies generated by quantitative PCR are compared with a model based on an equation from (14) rewritten to apply for two chromosome bacteria.
τC
2terI/oriI = Equation 6.1
Where τ is the generation time and C is the C-period. Bringing in the second chromosome yields the following equation, where CI is the C-period of chromosome 1 and CII is the C-period of chromosome 2.
)τ/CC( III2terII/oriIIterI/oriI −= Equation 6.2
Under an assumption of initiation synchrony, the oriI/oriII ratio will equal 1 and can be removed.
)τ/CC( III2terII/terI −−= Equation 6.3 If oppositely termination synchrony is assumed, the terI/terII ratio will equal 1 and can be removed.
)τ/CC( III2oriII/oriI −= Equation 6.4 These two equations are used to predict the changes in oriI/oriII and terI/terII ratios at different generation times. The model predicts a decrease in terI/terII at shorter generation times while oriI/oriII rates stay at unity should the chromosomes initiate in synchrony. In case of termination synchrony, the terI/terII ratio should stay at unity, while the oriI/oriII ratio increase as generation time shortens. This of course is dependent on constant difference in replication time (CI-CII) which can be assumed to be constant at 18-20 minutes in the generation time range 18-40 minutes equivalent of the findings on E. coli (25). At higher generation times (>40 minutes), where the C period is shown to increase and thus probably also to a less degree CI-CII, the differences is negligible due to the comparative larger increase in generation time. The predicted graphs from the models are shown in chapter 7.3 along with the experimental data.
30
7. Results
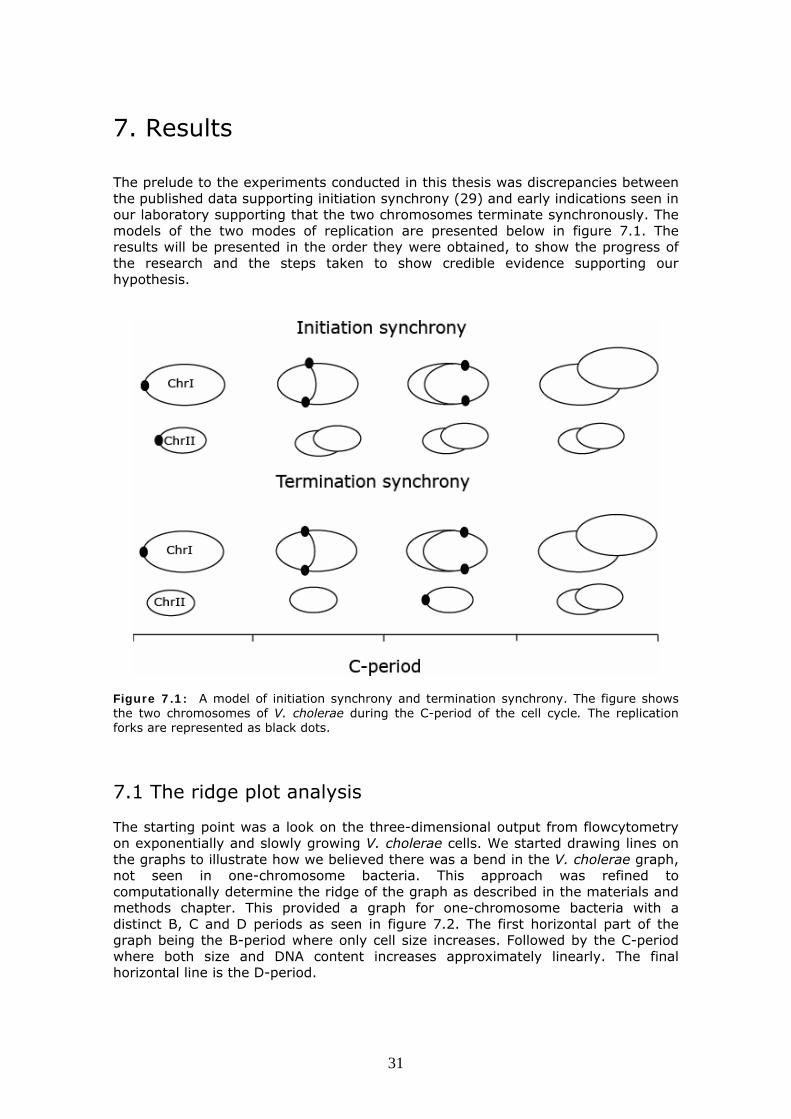
The prelude to the experiments conducted in this thesis was discrepancies between the published data supporting initiation synchrony (29) and early indications seen in our laboratory supporting that the two chromosomes terminate synchronously. The models of the two modes of replication are presented below in figure 7.1. The results will be presented in the order they were obtained, to show the progress of the research and the steps taken to show credible evidence supporting our hypothesis.
Figure 7.1: A model of initiation synchrony and termination synchrony. The figure shows the two chromosomes of V. cholerae during the C-period of the cell cycle. The replication forks are represented as black dots.
7.1 The ridge plot analysis The starting point was a look on the three-dimensional output from flowcytometry on exponentially and slowly growing V. cholerae cells. We started drawing lines on the graphs to illustrate how we believed there was a bend in the V. cholerae graph, not seen in one-chromosome bacteria. This approach was refined to computationally determine the ridge of the graph as described in the materials and methods chapter. This provided a graph for one-chromosome bacteria with a distinct B, C and D periods as seen in figure 7.2. The first horizontal part of the graph being the B-period where only cell size increases. Followed by the C-period where both size and DNA content increases approximately linearly. The final horizontal line is the D-period.
31
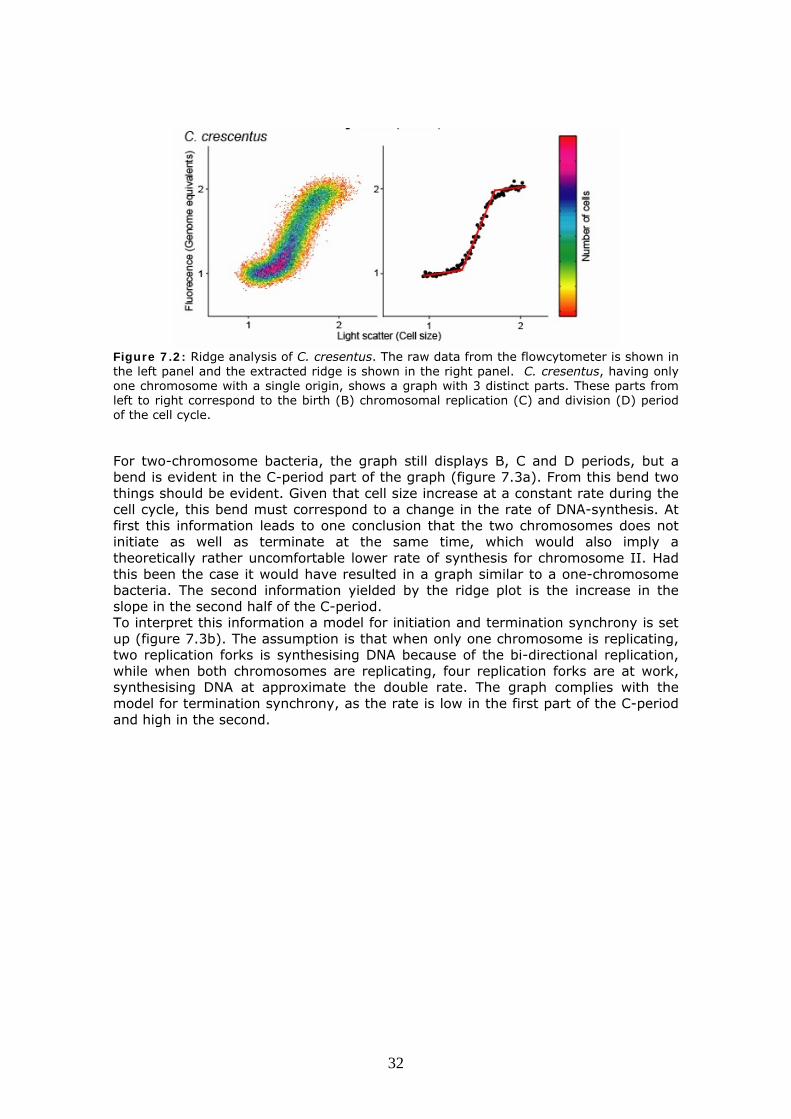
Figure 7.2: Ridge analysis of C. cresentus. The raw data from the flowcytometer is shown in the left panel and the extracted ridge is shown in the right panel. C. cresentus, having only one chromosome with a single origin, shows a graph with 3 distinct parts. These parts from left to right correspond to the birth (B) chromosomal replication (C) and division (D) period of the cell cycle. For two-chromosome bacteria, the graph still displays B, C and D periods, but a bend is evident in the C-period part of the graph (figure 7.3a). From this bend two things should be evident. Given that cell size increase at a constant rate during the cell cycle, this bend must correspond to a change in the rate of DNA-synthesis. At first this information leads to one conclusion that the two chromosomes does not initiate as well as terminate at the same time, which would also imply a theoretically rather uncomfortable lower rate of synthesis for chromosome II. Had this been the case it would have resulted in a graph similar to a one-chromosome bacteria. The second information yielded by the ridge plot is the increase in the slope in the second half of the C-period. To interpret this information a model for initiation and termination synchrony is set up (figure 7.3b). The assumption is that when only one chromosome is replicating, two replication forks is synthesising DNA because of the bi-directional replication, while when both chromosomes are replicating, four replication forks are at work, synthesising DNA at approximate the double rate. The graph complies with the model for termination synchrony, as the rate is low in the first part of the C-period and high in the second.
32

Figure 7.3: 3D ridge analysis of Vibrio cholerae A: V. cholerae shows a bend in the C period part of the graph corresponding to a change in the rate of DNA synthesis. A higher rate is observed in the end of the C-period. This is consistent with a model for termination synchrony shown in figure B where chromosome II is initiated late in the C-period. V. cholerae chromosome I consists of 2,97 million basepairs and chromosome II consists of 1.07 million basepairs (39). The expected position of the bend assuming ideal termination synchrony is at 5.3 million basepairs or 1.49 genome equivalents. Furthermore as the DNA-synthesis rate doubles as the second chromosome initiate, the slope of the second part of the C-period should be double of the first part. The ridge method lacks the resolution to address these questions and it is unlikely that the system behaves ideally. To further support these data, the experiment was conducted for V. cholerae growing at different doubling times and compared with Caulobacter cresentus and Escherichia coli. The ridge plots are presented in figure 7.4. The results are consistent with termination synchrony at all doubling times and the ridge plot shows a distinct difference between one and two chromosome bacteria.
33
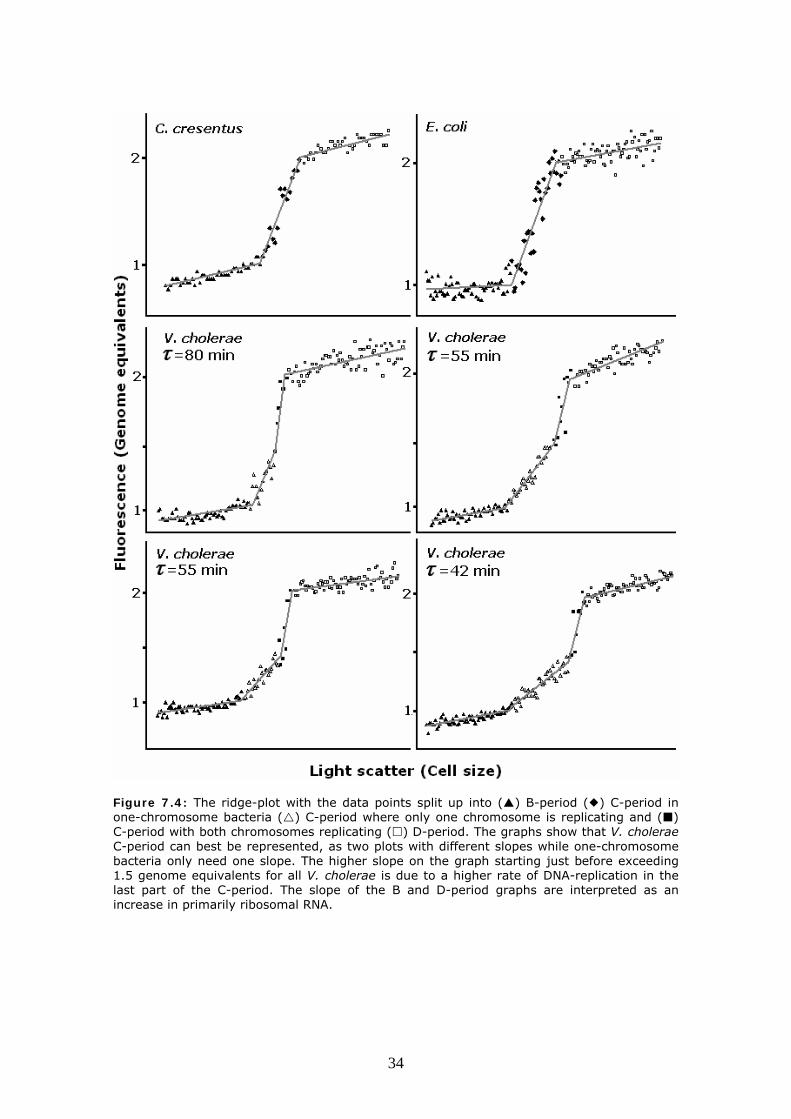
Figure 7.4: The ridge-plot with the data points split up into ( ) B-period ( ) C-period in one-chromosome bacteria ( ) C-period where only one chromosome is replicating and ( ) C-period with both chromosomes replicating ( ) D-period. The graphs show that V. cholerae C-period can best be represented, as two plots with different slopes while one-chromosome bacteria only need one slope. The higher slope on the graph starting just before exceeding 1.5 genome equivalents for all V. cholerae is due to a higher rate of DNA-replication in the last part of the C-period. The slope of the B and D-period graphs are interpreted as an increase in primarily ribosomal RNA.
34
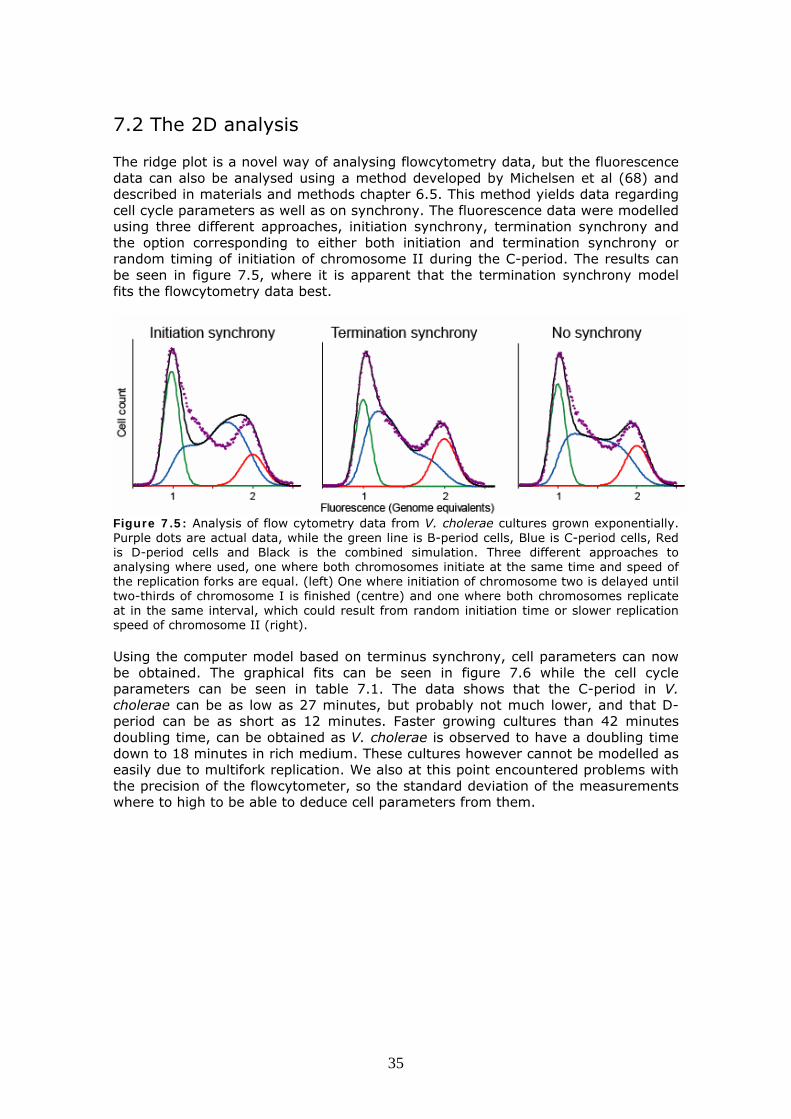
7.2 The 2D analysis The ridge plot is a novel way of analysing flowcytometry data, but the fluorescence data can also be analysed using a method developed by Michelsen et al (68) and described in materials and methods chapter 6.5. This method yields data regarding cell cycle parameters as well as on synchrony. The fluorescence data were modelled using three different approaches, initiation synchrony, termination synchrony and the option corresponding to either both initiation and termination synchrony or random timing of initiation of chromosome II during the C-period. The results can be seen in figure 7.5, where it is apparent that the termination synchrony model fits the flowcytometry data best.
Figure 7.5: Analysis of flow cytometry data from V. cholerae cultures grown exponentially. Purple dots are actual data, while the green line is B-period cells, Blue is C-period cells, Red is D-period cells and Black is the combined simulation. Three different approaches to analysing where used, one where both chromosomes initiate at the same time and speed of the replication forks are equal. (left) One where initiation of chromosome two is delayed until two-thirds of chromosome I is finished (centre) and one where both chromosomes replicate at in the same interval, which could result from random initiation time or slower replication speed of chromosome II (right). Using the computer model based on terminus synchrony, cell parameters can now be obtained. The graphical fits can be seen in figure 7.6 while the cell cycle parameters can be seen in table 7.1. The data shows that the C-period in V. cholerae can be as low as 27 minutes, but probably not much lower, and that D-period can be as short as 12 minutes. Faster growing cultures than 42 minutes doubling time, can be obtained as V. cholerae is observed to have a doubling time down to 18 minutes in rich medium. These cultures however cannot be modelled as easily due to multifork replication. We also at this point encountered problems with the precision of the flowcytometer, so the standard deviation of the measurements where to high to be able to deduce cell parameters from them.
35
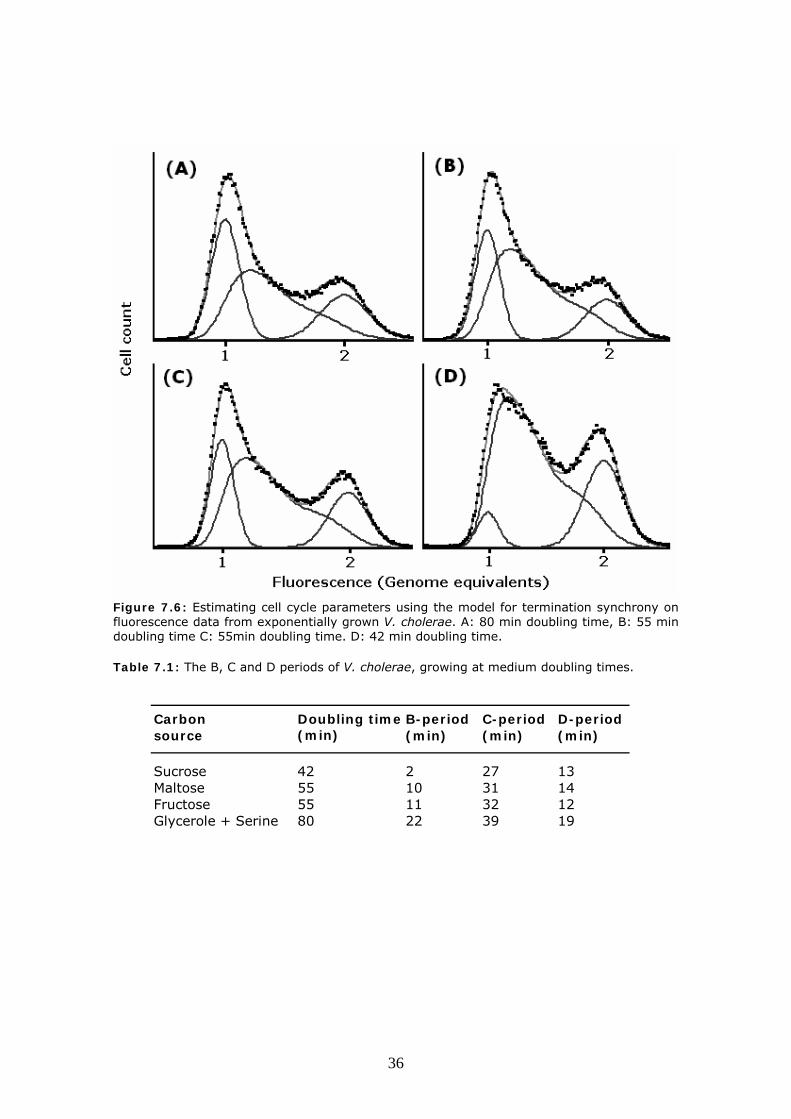
Figure 7.6: Estimating cell cycle parameters using the model for termination synchrony on fluorescence data from exponentially grown V. cholerae. A: 80 min doubling time, B: 55 min doubling time C: 55min doubling time. D: 42 min doubling time. Table 7.1: The B, C and D periods of V. cholerae, growing at medium doubling times.
Carbon Doubling time B-period C-period D-periodsource (min) (min) (min) (min)
Sucrose 42 2 27 13Maltose 55 10 31 14Fructose 55 11 32 12Glycerole + Serine 80 22 39 19
36
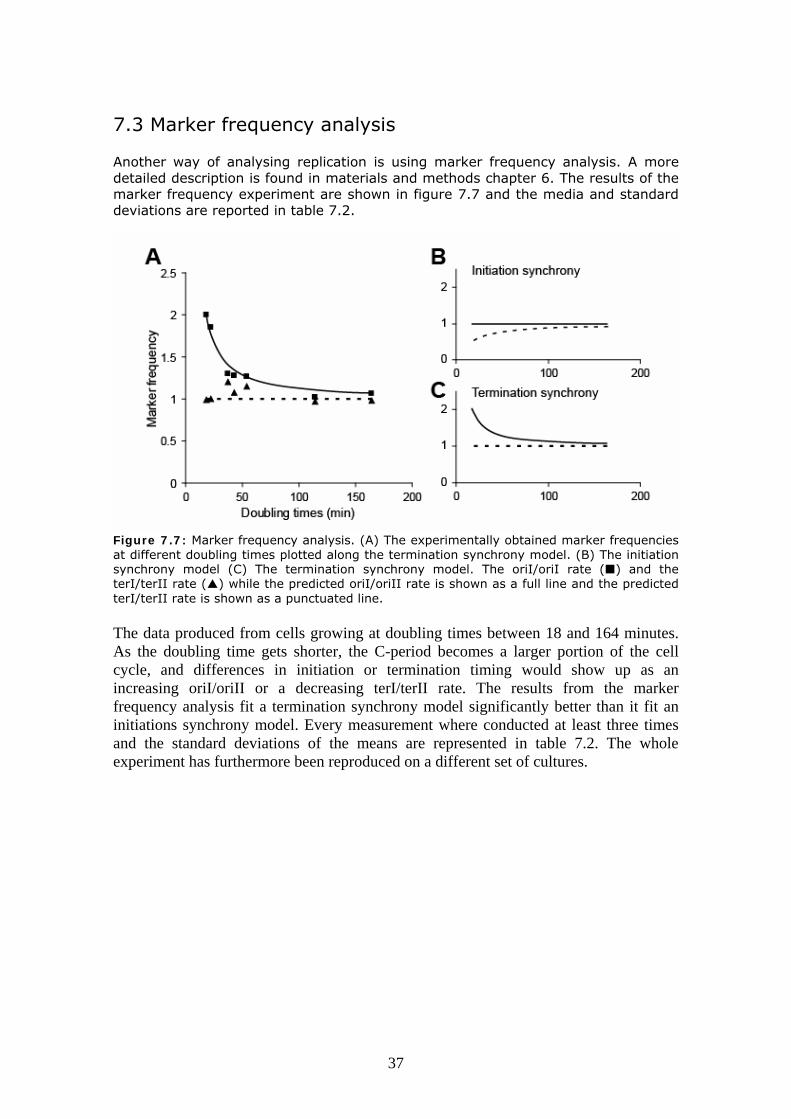
7.3 Marker frequency analysis Another way of analysing replication is using marker frequency analysis. A more detailed description is found in materials and methods chapter 6. The results of the marker frequency experiment are shown in figure 7.7 and the media and standard deviations are reported in table 7.2.
Figure 7.7: Marker frequency analysis. (A) The experimentally obtained marker frequencies at different doubling times plotted along the termination synchrony model. (B) The initiation synchrony model (C) The termination synchrony model. The oriI/oriI rate ( ) and the terI/terII rate ( ) while the predicted oriI/oriII rate is shown as a full line and the predicted terI/terII rate is shown as a punctuated line. The data produced from cells growing at doubling times between 18 and 164 minutes. As the doubling time gets shorter, the C-period becomes a larger portion of the cell cycle, and differences in initiation or termination timing would show up as an increasing oriI/oriII or a decreasing terI/terII rate. The results from the marker frequency analysis fit a termination synchrony model significantly better than it fit an initiations synchrony model. Every measurement where conducted at least three times and the standard deviations of the means are represented in table 7.2. The whole experiment has furthermore been reproduced on a different set of cultures.
37
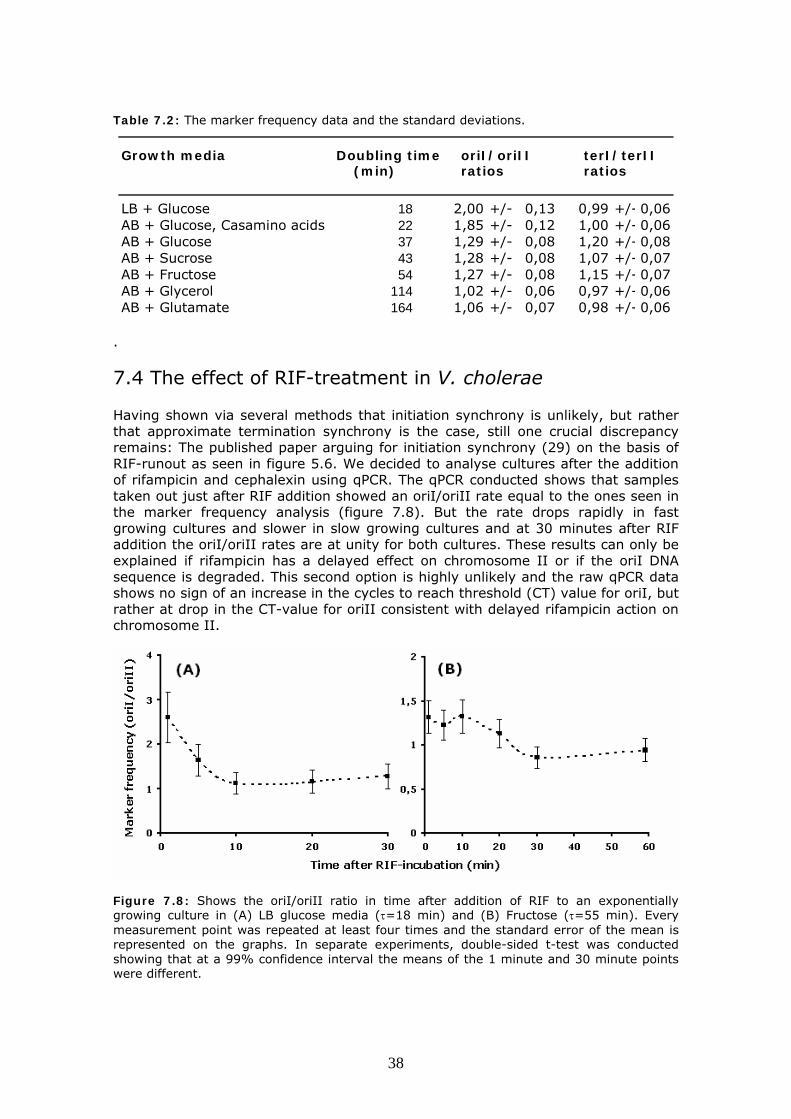
Table 7.2: The marker frequency data and the standard deviations.
Growth media Doubling time oriI/oriII terI/terII(min) ratios ratios
LB + Glucose 18 2,00 +/- 0,13 0,99 +/- 0,06AB + Glucose, Casamino acids 22 1,85 +/- 0,12 1,00 +/- 0,06AB + Glucose 37 1,29 +/- 0,08 1,20 +/- 0,08AB + Sucrose 43 1,28 +/- 0,08 1,07 +/- 0,07AB + Fructose 54 1,27 +/- 0,08 1,15 +/- 0,07AB + Glycerol 114 1,02 +/- 0,06 0,97 +/- 0,06AB + Glutamate 164 1,06 +/- 0,07 0,98 +/- 0,06
.
7.4 The effect of RIF-treatment in V. cholerae Having shown via several methods that initiation synchrony is unlikely, but rather that approximate termination synchrony is the case, still one crucial discrepancy remains: The published paper arguing for initiation synchrony (29) on the basis of RIF-runout as seen in figure 5.6. We decided to analyse cultures after the addition of rifampicin and cephalexin using qPCR. The qPCR conducted shows that samples taken out just after RIF addition showed an oriI/oriII rate equal to the ones seen in the marker frequency analysis (figure 7.8). But the rate drops rapidly in fast growing cultures and slower in slow growing cultures and at 30 minutes after RIF addition the oriI/oriII rates are at unity for both cultures. These results can only be explained if rifampicin has a delayed effect on chromosome II or if the oriI DNA sequence is degraded. This second option is highly unlikely and the raw qPCR data shows no sign of an increase in the cycles to reach threshold (CT) value for oriI, but rather at drop in the CT-value for oriII consistent with delayed rifampicin action on chromosome II.
Figure 7.8: Shows the oriI/oriII ratio in time after addition of RIF to an exponentially growing culture in (A) LB glucose media (τ=18 min) and (B) Fructose (τ=55 min). Every measurement point was repeated at least four times and the standard error of the mean is represented on the graphs. In separate experiments, double-sided t-test was conducted showing that at a 99% confidence interval the means of the 1 minute and 30 minute points were different.
38
8. Discussion The aim of this thesis has been to reinvestigate if the two chromosomes of Vibrio cholerae initiate synchronously in the cell cycle, or if another model of initiation is more plausible. We have set up an alternative model of termination synchrony and produced data supporting it. The scope of these results will be discussed. 8.1 Chromosome II is replicated late in the C-period The ridge plot analysis for all of the V. cholerae cultures tested (figure 7.3 and 7.4), showed a ~2-fold increase in the DNA-replication rate at the point where approximately half the DNA is replicated. This indicates that a new replication is initiated and corresponds to chromosome II being replicated alongside the last third of chromosome I. None of the one-chromosome bacteria tested showed an equivalent change in the rate of DNA-replication (figure 7.2 and 7.4). The 2D analysis of the cell cycle, shows for all cultures tested, that the fluorescence histogram is best fitted by a termination synchrony model (figure 7.5 and 7.6) where chromosome II is set to initiate when 2/3 of chromosome I is replicated. This entails that the two chromosomes of V. cholerae terminate at the same time and that their respective replication rates are the same. An initiation and a no synchrony model could not be made to fit the experimental data. The fit of the termination synchrony model to the experimental data could be improved slightly by either allowing chromosome II to terminate shortly after chromosome I or by reducing the replication speed to 90% when both chromosomes where replicating (data not shown). The marker frequency analysis shows that the oriI/oriII rate is at unity in slow growing cultures (τ=164 min) and rises to ~2 in fast growing cultures (τ=18 min), (figure 7.7a). This confirms there is a timing difference between the initiation on the two chromosomes and that chromosome II initiates later in the cell cycle. The terI/terII rate stays at unity at all growth rates (figure 7.7a), which confirms that the chromosomes terminate at approximately the same time in the cell cycle. The experimental oriI/oriII and terI/terII rates furthermore fit an equation of termination synchrony as explained in chapter 6.9 and seen in figure 7.7abc. The major finding in the thesis is that chromosome II does not initiate synchronously with chromosome I but rather is delayed approximately 2/3 of the C-period, so that replication of the two chromosomes terminate at approximately the same time. The rate of replication for the two chromosomes is found to be similar, possible with a little slowdown in replication speed when both chromosomes replicate. The finding of approximate termination synchrony contradict an earlier published report of initiation synchrony(29) described in chapter 5.7. Thus my finding requires strong evidence to support it. I have presented data from three separate methods which constitutes a strong case arguing for that the two chromosomes of V. cholerae does not initiate synchronously, but rather the initiation of chromosome II is delayed so the two chromosomes terminate at approximately the same point in the cell cycle.
39
8.2 Rifampicin action is delayed on chromosome II I have shown by three methods that initiation synchrony is unlikely and that the chromosomes terminate replication at approximate the same time. To improve my argumentation further I decided to figure out why the earlier published data were faulty and could be interpreted as initiation synchrony (29). The initiation synchrony reported is based on RIF-runout experiment, which is further described in chapter 5.7. RIF-treatment consists of the antibiotics rifampicin and cephalexin. Rifampicin blocks initiation, while cephalexin blocks cell division. Cephalexin seems to work in V. cholerae, as cultures with two genome equivalents are observable after RIF-runout, so rifampicin is most likely candidate. Rifampicin has been used together with chloramphenicol to study initiation and the functions of the two antibiotics are well described in E. coli. Rifampicin blocks the synthesis of mRNA by inhibiting the RNA polymerase, while chloramphenicol blocks protein synthesis. Interestingly, rifampicin blocks initiation of replication almost immediately, while chloramphenicol action is delayed by as much as 10-20 minutes in E. coli (19,62). This is intriguing as initiation of chromosomal replication is dependent on the levels of DnaA. As rifampicin blocks initiation on the mRNA level, protein synthesis should stop later and thus the blocking of initiation should be delayed even more than experienced with chloramphenicol. The prevalent theory, is that the RNA polymerase participates in initiation of replication, probably, but not necessarily, by synthesizing a short RNA (78,98). There have been several known cases of rifampicin resistance in E. coli (36,69). This prompted me to investigate the effect of RIF-treatment on the initiation of the two chromosomes in V. cholerae. By using marker frequency analysis I showed that initiations occur on chromosome II after the addition of RIF (figure 7.8). The analysis were conducted with cells at different growth rates (τ=18 min and τ=55 min) and both experiments showed initiations on chromosome II after RIF addition, while chromosome I initiations where halted almost immediately as in E. coli. Initiations seem to occur on chromosome II as late as 20-25 minutes after addition of RIF in the slowest growing culture. The RIF-runout experiment leading to the initiation synchrony conclusion was conducted at slower growth speed than our marker frequency analysis. At the reported doubling time (τ=144 min) (29), later initiations on chromosome II are impossible to detect by marker frequency analysis due to the inherent low oriI/oriII ratio of the exponential culture (see figure 7.7a). It is impossible to obtain high enough resolution with qPCR to detect the changes. But there is no reason why the presented data should not be relevant at all growth rates. I have amply shown that the RIF-runout method produces an artefact in V. cholerae and thus is a questionable method to use. Before using the RIF-runout method on V. cholerae, measures should be taken to ensure in which cases RIF-treatment produces valid results, if in any. The explanation of the artifact experienced in V. cholerae, could be that RNA-polymerase is necessary for initiation of the E. coli-like chromosome I, but not in the initiation of the plasmid-like chromosome II. This would lead to quick stop of initiation on chromosome I and a slow stop on chromosome II due to an eventual lack of RctB. Such a mechanism would fit the experimental data and open up for more interesting question about the initiation process in chromosome II.
40
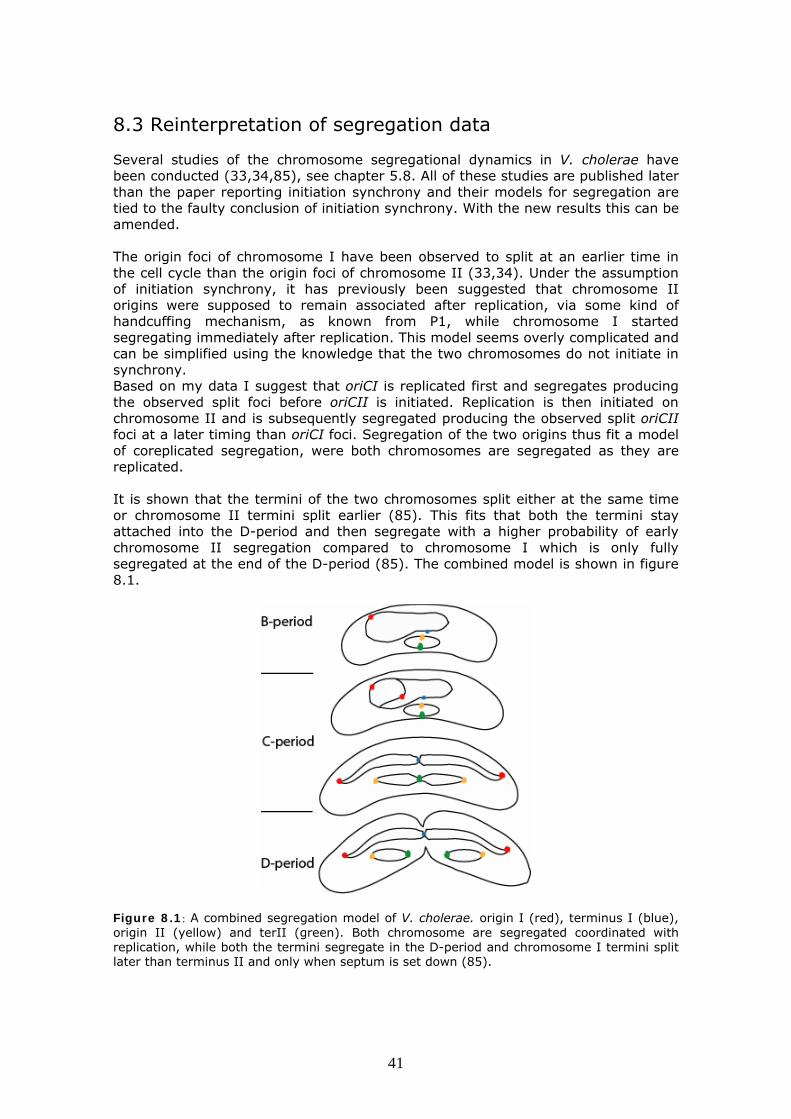
8.3 Reinterpretation of segregation data Several studies of the chromosome segregational dynamics in V. cholerae have been conducted (33,34,85), see chapter 5.8. All of these studies are published later than the paper reporting initiation synchrony and their models for segregation are tied to the faulty conclusion of initiation synchrony. With the new results this can be amended. The origin foci of chromosome I have been observed to split at an earlier time in the cell cycle than the origin foci of chromosome II (33,34). Under the assumption of initiation synchrony, it has previously been suggested that chromosome II origins were supposed to remain associated after replication, via some kind of handcuffing mechanism, as known from P1, while chromosome I started segregating immediately after replication. This model seems overly complicated and can be simplified using the knowledge that the two chromosomes do not initiate in synchrony. Based on my data I suggest that oriCI is replicated first and segregates producing the observed split foci before oriCII is initiated. Replication is then initiated on chromosome II and is subsequently segregated producing the observed split oriCII foci at a later timing than oriCI foci. Segregation of the two origins thus fit a model of coreplicated segregation, were both chromosomes are segregated as they are replicated. It is shown that the termini of the two chromosomes split either at the same time or chromosome II termini split earlier (85). This fits that both the termini stay attached into the D-period and then segregate with a higher probability of early chromosome II segregation compared to chromosome I which is only fully segregated at the end of the D-period (85). The combined model is shown in figure 8.1.
Figure 8.1: A combined segregation model of V. cholerae. origin I (red), terminus I (blue), origin II (yellow) and terII (green). Both chromosome are segregated coordinated with replication, while both the termini segregate in the D-period and chromosome I termini split later than terminus II and only when septum is set down (85).
41
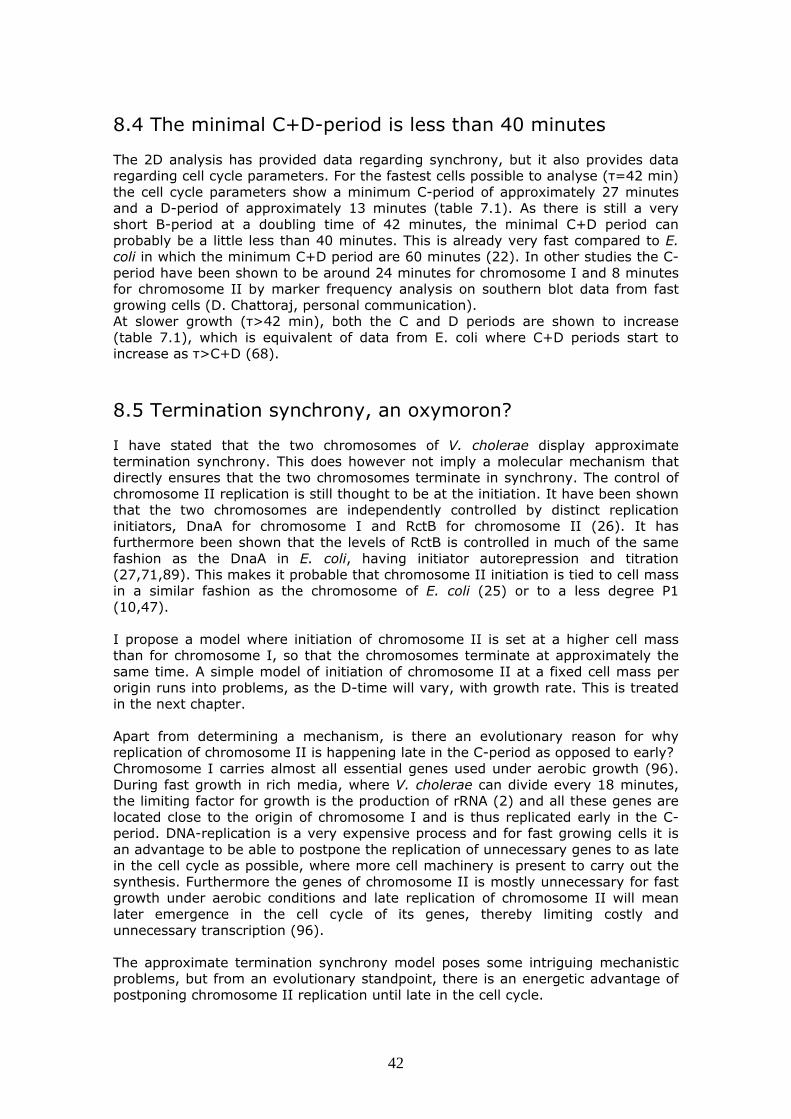
8.4 The minimal C+D-period is less than 40 minutes The 2D analysis has provided data regarding synchrony, but it also provides data regarding cell cycle parameters. For the fastest cells possible to analyse (τ=42 min) the cell cycle parameters show a minimum C-period of approximately 27 minutes and a D-period of approximately 13 minutes (table 7.1). As there is still a very short B-period at a doubling time of 42 minutes, the minimal C+D period can probably be a little less than 40 minutes. This is already very fast compared to E. coli in which the minimum C+D period are 60 minutes (22). In other studies the C-period have been shown to be around 24 minutes for chromosome I and 8 minutes for chromosome II by marker frequency analysis on southern blot data from fast growing cells (D. Chattoraj, personal communication). At slower growth (τ>42 min), both the C and D periods are shown to increase (table 7.1), which is equivalent of data from E. coli where C+D periods start to increase as τ>C+D (68). 8.5 Termination synchrony, an oxymoron? I have stated that the two chromosomes of V. cholerae display approximate termination synchrony. This does however not imply a molecular mechanism that directly ensures that the two chromosomes terminate in synchrony. The control of chromosome II replication is still thought to be at the initiation. It have been shown that the two chromosomes are independently controlled by distinct replication initiators, DnaA for chromosome I and RctB for chromosome II (26). It has furthermore been shown that the levels of RctB is controlled in much of the same fashion as the DnaA in E. coli, having initiator autorepression and titration (27,71,89). This makes it probable that chromosome II initiation is tied to cell mass in a similar fashion as the chromosome of E. coli (25) or to a less degree P1 (10,47). I propose a model where initiation of chromosome II is set at a higher cell mass than for chromosome I, so that the chromosomes terminate at approximately the same time. A simple model of initiation of chromosome II at a fixed cell mass per origin runs into problems, as the D-time will vary, with growth rate. This is treated in the next chapter. Apart from determining a mechanism, is there an evolutionary reason for why replication of chromosome II is happening late in the C-period as opposed to early? Chromosome I carries almost all essential genes used under aerobic growth (96). During fast growth in rich media, where V. cholerae can divide every 18 minutes, the limiting factor for growth is the production of rRNA (2) and all these genes are located close to the origin of chromosome I and is thus replicated early in the C-period. DNA-replication is a very expensive process and for fast growing cells it is an advantage to be able to postpone the replication of unnecessary genes to as late in the cell cycle as possible, where more cell machinery is present to carry out the synthesis. Furthermore the genes of chromosome II is mostly unnecessary for fast growth under aerobic conditions and late replication of chromosome II will mean later emergence in the cell cycle of its genes, thereby limiting costly and unnecessary transcription (96). The approximate termination synchrony model poses some intriguing mechanistic problems, but from an evolutionary standpoint, there is an energetic advantage of postponing chromosome II replication until late in the cell cycle.
42
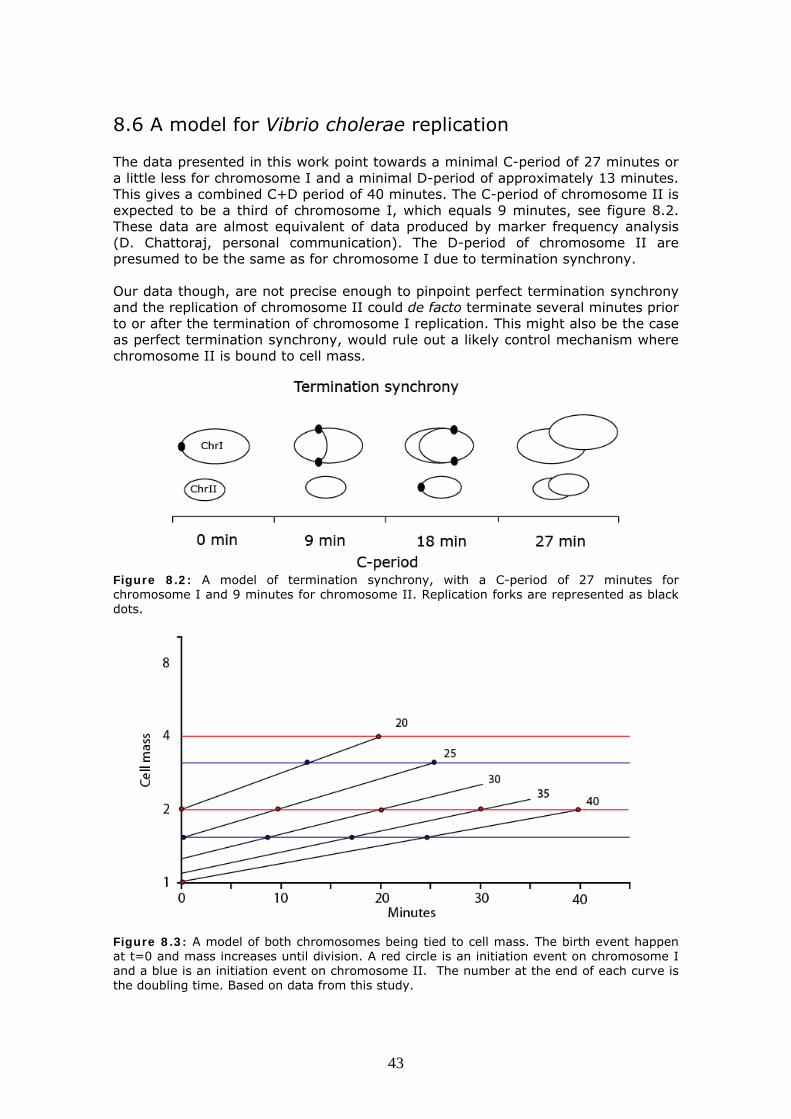
8.6 A model for Vibrio cholerae replication The data presented in this work point towards a minimal C-period of 27 minutes or a little less for chromosome I and a minimal D-period of approximately 13 minutes. This gives a combined C+D period of 40 minutes. The C-period of chromosome II is expected to be a third of chromosome I, which equals 9 minutes, see figure 8.2. These data are almost equivalent of data produced by marker frequency analysis (D. Chattoraj, personal communication). The D-period of chromosome II are presumed to be the same as for chromosome I due to termination synchrony. Our data though, are not precise enough to pinpoint perfect termination synchrony and the replication of chromosome II could de facto terminate several minutes prior to or after the termination of chromosome I replication. This might also be the case as perfect termination synchrony, would rule out a likely control mechanism where chromosome II is bound to cell mass.
Figure 8.2: A model of termination synchrony, with a C-period of 27 minutes for chromosome I and 9 minutes for chromosome II. Replication forks are represented as black dots.
Figure 8.3: A model of both chromosomes being tied to cell mass. The birth event happen at t=0 and mass increases until division. A red circle is an initiation event on chromosome I and a blue is an initiation event on chromosome II. The number at the end of each curve is the doubling time. Based on data from this study.
43
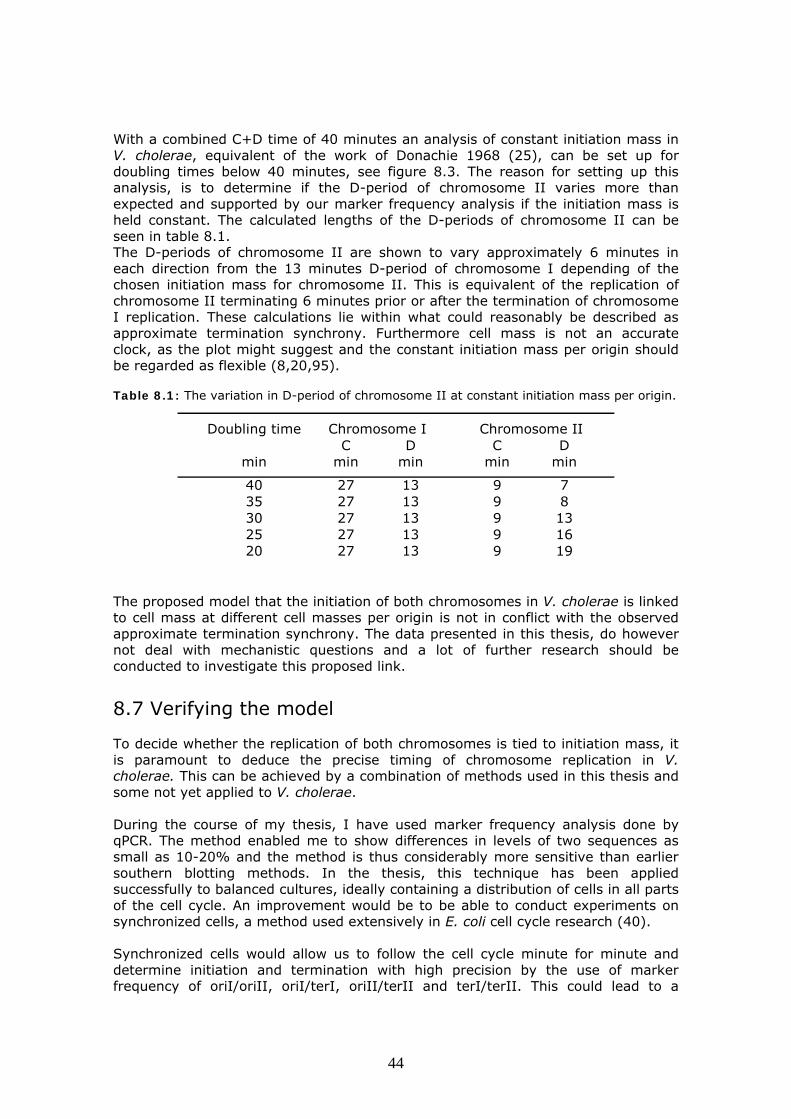
With a combined C+D time of 40 minutes an analysis of constant initiation mass in V. cholerae, equivalent of the work of Donachie 1968 (25), can be set up for doubling times below 40 minutes, see figure 8.3. The reason for setting up this analysis, is to determine if the D-period of chromosome II varies more than expected and supported by our marker frequency analysis if the initiation mass is held constant. The calculated lengths of the D-periods of chromosome II can be seen in table 8.1. The D-periods of chromosome II are shown to vary approximately 6 minutes in each direction from the 13 minutes D-period of chromosome I depending of the chosen initiation mass for chromosome II. This is equivalent of the replication of chromosome II terminating 6 minutes prior or after the termination of chromosome I replication. These calculations lie within what could reasonably be described as approximate termination synchrony. Furthermore cell mass is not an accurate clock, as the plot might suggest and the constant initiation mass per origin should be regarded as flexible (8,20,95). Table 8.1: The variation in D-period of chromosome II at constant initiation mass per origin.
Doubling time Chromosome I Chromosome IIC D C D
min min min min min
40 27 13 9 735 27 13 9 830 27 13 9 1325 27 13 9 1620 27 13 9 19
The proposed model that the initiation of both chromosomes in V. cholerae is linked to cell mass at different cell masses per origin is not in conflict with the observed approximate termination synchrony. The data presented in this thesis, do however not deal with mechanistic questions and a lot of further research should be conducted to investigate this proposed link.
8.7 Verifying the model To decide whether the replication of both chromosomes is tied to initiation mass, it is paramount to deduce the precise timing of chromosome replication in V. cholerae. This can be achieved by a combination of methods used in this thesis and some not yet applied to V. cholerae. During the course of my thesis, I have used marker frequency analysis done by qPCR. The method enabled me to show differences in levels of two sequences as small as 10-20% and the method is thus considerably more sensitive than earlier southern blotting methods. In the thesis, this technique has been applied successfully to balanced cultures, ideally containing a distribution of cells in all parts of the cell cycle. An improvement would be to be able to conduct experiments on synchronized cells, a method used extensively in E. coli cell cycle research (40). Synchronized cells would allow us to follow the cell cycle minute for minute and determine initiation and termination with high precision by the use of marker frequency of oriI/oriII, oriI/terI, oriII/terII and terI/terII. This could lead to a
44
conclusion on the question of replication of chromosome II is initiated at a constant mass per origin. Several experiments to synchronize V. cholerae cells where attempted during the course of my thesis, but none proved successful even on a E. coli B/r, for which the method have been successfully applied in another laboratory (40). This was probably due to the rather complicated experimental set up required for a bacterial baby-cell machine used (40). As time was in short supply and other experiments proved more successful, my attention were diverted to these other lines of research. This is a shame, as synchronized V. cholerae cells could prove a powerful tool for examining a wide range of cell cycle related questions.
8.8 Evolution According to the definition of a chromosome presented in chapter 2, the replication of a chromosomes is bound to the cell cycle and initiate at a specific time point in the cell cycle as opposed to a plasmid that replicates at random (28). Chromosome II contains essential genes (39) and I have shown that its replication is coordinated with the V. cholerae cell cycle, thus making it a bona fide chromosome. But what are the evolutionary advantages of dividing the genome into several chromosomes, when most bacteria have not evolved so? The Vibrio genus consist of more than 60 species which all contain two chromosomes (70). An interesting observation is that chromosome I of Vibrio species are very stable at between 3 to 3.3 million basepairs, while chromosome II varies considerably between 0.8 million basepairs to around 2 million base pairs (70). A study of gene expression in Vibrio cholerae shows a higher degree of transcription from chromosome II during colon colonisation, compared to cells growing in vitro under aerobic conditions. Especially genes for anaerobic growth and iron transport, which are limiting factors in the intestines, were highly expressed. Both gene clusters are located on chromosome II (96). These findings indicate that multiple chromosomes give a regulatory advantage in switching between the different portfolios of genes needed at a change of habitat. This could also account for the large differences in size of chromosome two of the Vibrio species, as they have adapted to a diverse range of habitats.
45
9. Conclusion The work in this thesis is a reinvestigation of the finding that the two chromosomes of Vibrio cholerae initiate their replication synchronously as reported by Egan et al (29). This finding was based on a RIF-runout experiment. I carefully investigated the timing of replication of the two chromosomes of V. cholerae using modelling of flow cytometry data and marker frequency analysis. The resulting data shows that the two chromosomes of Vibrio cholerae, does not initiate their replication at the same point of the cell cycle, but rather that initiation of chromosome II is delayed until approximately 2/3 of chromosome I have been replicated. The two chromosomes are instead shown to terminate replication at approximately the same time. The RIF-runout technique used by Egan et al (29) was reinvestigated and the results shows unexpectedly that rifampicin have a delayed effect on chromosome II, which explains why RIF-treated cells wrongly show an initiation synchrony phenotype. A further study of why rifampicin have this profoundly different effect on the two chromosomes could bring some interesting observations regarding the initiation mechanism of chromosome II. On the basis of modelling of the fluorescence histogram from flow cytometry (68) certain cell cycle parameters have been deduced. It was shown that the C-period of V. cholerae has a minimum length of approximately 27 minutes and that the D-period has a minimum length of 13 minutes. This yields a combined C+D time of 40 minutes compared to 60 minutes for E. coli (22). These results are expected to be valid for doubling times up till 40 minutes, while at higher doubling times, both the C and D period are shown to increase. The initiation of replication of the two chromosomes in Vibrio cholerae are controlled independently (30). As it is shown in this thesis, they also initiate at distinctly different time points in the cell cycle, but not in a random fashion. I suggest a model in which both chromosomes are tied to the cell mass through their respective initiator proteins (25). This would require the initiation masses of the two chromosomes to differ in a way, so they are evolutionary set to terminate at approximately the same time. This hypothesis requires further investigation.
46
10. Reference list
1. Abeles, A. L., K. M. Snyder, and D. K. Chattoraj. 1984. P1 plasmid replication: Replicon structure. J. Mol. Biol. 173:307-324.
2. Aiyar, S. E., T. Gaal, and R. L. Gourse. 2002. rRNA promoter activity in the fast-growing bacterium Vibrio natriegens. J. Bacteriol. 184:1349-1358.
3. Alberts, B., A. Johnson, J. Lewis, M. Raff, K. Roberts, and P. Walter. 2002. Molecular biology of the cell. Garland science, Oxford.
4. Atlung, T., E. Clausen, and F. G. Hansen. 1984. Autorepression of the dnaA gene of Escherichia coli, p. 199-207. In U. Huebscher and S. Spadari (ed.), Proteins involved in DNA replication. New York and London, Plenum Press.
5. Atlung, T., A. Løbner-Olesen, and F. G. Hansen. 1987. Overproduction of DnaA protein stimulates initiation of chromosome and minichromosome replication in E. coli. Mol. Gen. Genet. 206:51-59.
6. Austin, S., F. Hart, A. Abeles, and N. Sternberg. 1982. Genetic and physical map of a P1 miniplasmid. J. Bacteriol. 152:63-71.
7. Bandyopadhyay, R. and J. Das. 1994. The DNA adenine methyltransferase-encoding gene (dam) of Vibrio cholerae. Gene 140:67-71.
8. Bipatnath, M., P. P. Dennis, and H. Bremer. 1998. Initiation and velocity of chromosome replication in Escherichia coli B/r and K-12. J. Bacteriol. 180:265-273.
9. Blattner, F. R., G. Plunkett, III, C. A. Bloch, N. T. Perna, V. Burland, M. Riley, J. Collado-Vides, J. D. Glasner, C. K. Rode, G. F. Mayhew, J. Gregor, N. W. Davis, H. A. Kirkpatrick, M. A. Goeden, D. J. Rose, B. Mau, and Y. Shao. 1997. The complete genome sequence of Escherichia coli K-12. Science 277:1453-1474.
10. Bogan, J. A., J. E. Grimwade, M. Thornton, P. Zhou, G. D. Denning, and C. E. Helmstetter. 2001. P1 and NR1 plasmid replication during the cell cycle of Escherichia coli. Plasmid 45:200-208.
11. Boye, E. and A. Lobner-Olesen. 1990. Flow cytometry: illuminating microbiology. New Biol. 2:119-125.
12. Boye, E. and A. Lobner-Olesen. 1991. Bacterial growth control studied by flow cytometry. Res. Microbiol. 142:131-135.
13. Boye, E., A. Lobner-Olesen, and K. Skarstad. 2000. Limiting DNA replication to once and only once. Embo Reports 1:479-483.
14. Bremer, H. and G. Churchward. 1977. An examination of the Cooper-Helmstetter theory of DNA replication in bacteria and its underlying assumptions. J Theor. Biol. 69:645-654.
15. Brendler, T., A. Abeles, and S. Austin. 1995. A protein that binds to the P1 origin core and the oriC 13mer region in a methylation-specific fashion is the product of the host seqA gene. EMBO J. 14:4083-4089.
16. Cairns, J. 1963. The bacterial chromosome and its manner of replication as seen by autoradiography. J. Mol. Biol. 6:208-213.
47
17. Chattoraj, D. K. and T. D. Schneider. 1997. Replication Control of plasmid P1 and Its Host Chromosome: The Common Ground. Progress in neucleic acid research 57:145-186.
18. Cheng, H. P. and T. G. Lessie. 1994. Multiple replicons constituting the genome of Pseudomonas cepacia 17616. J. Bacteriol. 176:4034-4042.
19. Churchward, G. and H. Bremer. 1977. Determination of deoxyribonucleic acid replication time in exponentially growing Escherichia coli B/r. J. Bacteriol. 130:1206-1213.
20. Churchward, G., E. Estiva, and H. Bremer. 1981. Growth rate-dependent control of chromosome replication initiation in Escherichia coli. J. Bacteriol. 145:1232-1238.
21. Clark, D. J. and O. Maaløe. 1967. DNA replication and the division cycle in Escherichia coli. J. Mol. Biol. 23:99-112.
22. Cooper, S. and C. E. Helmstetter. 1968. Chromosome replication and the division cycle of Escherichia coli B/r. J Mol. Biol. 31:519-540.
23. Cooper, S. and J. D. Keasling. 1998. Cycle-specific replication of chromosomal and F-plasmid origins. FEMS Microbiol. Lett. 163:217-222.
24. Das, N. and D. K. Chattoraj. 2004. Origin pairing ('handcuffing') and unpairing in the control of P1 plasmid replication. Mol. Microbiol. 54:836-849.
25. Donachie, W. 1968. Relationship between cell size and time of initiation of DNA replication. Nature 219:1077-1079.
26. Duigou, S., K. G. Knudsen, O. Skovgaard, E. S. Egan, A. Lobner-Olesen, and M. K. Waldor. 2006. Independent control of replication initiation of the two Vibrio cholerae chromosomes by DnaA and RctB. J. Bacteriol. 188:6419-6424.
27. Egan, E. S., S. Duigou, and M. K. Waldor. 2006. Autorepression of RctB, an initiator of Vibrio cholerae chromosome II replication. J. Bacteriol. 188:789-793.
28. Egan, E. S., M. A. Fogel, and M. K. Waldor. 2005. Divided genomes: negotiating the cell cycle in prokaryotes with multiple chromosomes. Mol. Microbiol. 56:1129-1138.
29. Egan, E. S., A. Lobner-Olesen, and M. K. Waldor. 2004. Synchronous replication initiation of the two Vibrio cholerae chromosomes. Curr. Biol. 14:R501-R502.
30. Egan, E. S. and M. K. Waldor. 2003. Distinct replication requirements for the two Vibrio cholerae chromosomes. Cell 114:521-530.
31. Ely, B. 1991. Genetics of Caulobacter crescentus. Methods Enzymol. 204:372-384.
32. Evinger, M. and N. Agabian. 1977. Envelope-associated nucleoid from Caulobacter crescentus stalked and swarmer cells. J. Bacteriol. 132:294-301.
33. Fiebig, A., K. Keren, and J. A. Theriot. 2006. Fine-scale time-lapse analysis of the biphasic, dynamic behaviour of the two Vibrio cholerae chromosomes. Mol. Microbiol. 60:1164-1178.
34. Fogel, M. A. and M. K. Waldor. 2005. Distinct segregation dynamics of the two Vibrio cholerae chromosomes. Mol. Microbiol. 55:125-136.
48
35. Fuller, R. S., B. E. Funnell, and A. Kornberg. 1984. The dnaA protein complex with the E. coli chromosomal origin (oriC) and other sites. Cell 38:889-900.
36. Hansen, F. G. 1995. Reinitiation kinetics in eight dnaA(Ts) mutants of Escherichia coli: rifampicin resistant initiation of chromosome replication. Mol. Microbiol. 15:133-140.
37. Hansen, F. G., B. B. Christensen, and T. Atlung. 1991. The initiator titration model: computer simulation of chromosome and minichromosome control. Res. Microbiol. 142:161-167.
38. Hayes, F. 2003. Toxins-antitoxins: plasmid maintenance, programmed cell death, and cell cycle arrest. Science 301:1496-1499.
39. Heidelberg, J. F., J. A. Eisen, W. C. Nelson, R. A. Clayton, M. L. Gwinn, R. J. Dodson, D. H. Haft, E. K. Hickey, J. D. Peterson, L. Umayam, S. R. Gill, K. E. Nelson, T. D. Read, H. Tettelin, D. Richardson, M. D. Ermolaeva, J. Vamathevan, S. Bass, H. Qin, I. Dragoi, P. Sellers, L. McDonald, T. Utterback, R. D. Fleishmann, W. C. Nierman, and O. White. 2000. DNA sequence of both chromosomes of the cholera pathogen Vibrio cholerae. Nature 406:477-483.
40. Helmstetter, C. E., C. Eenhuis, P. Theisen, J. Grimwade, and A. C. Leonard. 1992. Improved bacterial baby machine: application to Escherichia coli K-12. J. Bacteriol. 174:3445-3449.
41. Helmstetter, C. E. and A. C. Leonard. 1987. Coordinate initiation of chromosome and minichromosome replication in Escherichia coli. J. Bacteriol. 169:3489-3494.
42. Helmstetter, C. E., M. Thornton, P. Zhou, J. A. Bogan, A. C. Leonard, and J. E. Grimwade. 1997. Replication and segregation of a miniF plasmid during the division cycle of Escherichia coli. J. Bacteriol. 179:1393-1399.
43. Higuchi, R., G. Dollinger, P. S. Walsh, and R. Griffith. 1992. Simultaneous amplification and detection of specific DNA sequences. Biotechnology (N. Y. ) 10:413-417.
44. Howard-Jones, N. 1984. Robert Koch and the cholera vibrio: a centenary. Br. Med. J. (Clin. Res. Ed) 288:379-381.
45. Katayama, T., T. Kubota, K. Kurokawa, E. Crooke, and K. Sekimizu. 1998. The initiator function of DnaA protein is negatively regulated by the sliding clamp of the E. coli chromosomal replicase. Cell 94:61-71.
46. Kato, J. and T. Katayama. 2001. Hda, a novel DnaA-related protein, regulates the replication cycle in Escherichia coli. EMBO J. 20:4253-4262.
47. Keasling, J. D., B. O. Palsson, and S. Cooper. 1992. Replication of prophage P1 is cell-cycle specific. J. Bacteriol. 174:4457-4462.
48. Keasling, J. D., B. O. Palsson, and S. Cooper. 1992. Replication of mini-F plasmids during the bacterial division cycle. Res. Microbiol. 143:541-548.
49. Keasling, J. D., B. O. Palsson, and S. Cooper. 1991. Cell-cycle specific F plasmid replication: regulation by cell size control of initiation. J. Bacteriol. 173:2673-2680.
50. Kitagawa, R., T. Ozaki, S. Moriya, and T. Ogawa. 1998. Negative control of replication initiation by a novel chromosomal locus exhibiting exceptional affinity for Esherichia coli DnaA protein. Genes Dev 12:3032-3043.
49

51. Kubista, M., J. M. Andrade, M. Bengtsson, A. Forootan, J. Jonak, K. Lind, R. Sindelka, R. Sjöback, B. Sjögreen, L. Strömbom, A. Stahlberg, and N. Zoric. 2006. The real-time polymerase chain reaction. Molecular asppects of medicine 27:95-125.
52. lardet-Servent, A., S. Michaux-Charachon, E. Jumas-Bilak, L. Karayan, and M. Ramuz. 1993. Presence of one linear and one circular chromosome in the Agrobacterium tumefaciens C58 genome. J. Bacteriol. 175:7869-7874.
53. Leonard, A. C. and C. E. Helmstetter. 1986. Cell cycle-specific replication of Escherichia coli minichromosomes. Proc. Natl. Acad. Sci. U. S. A 83:5101-5105.
54. Leonard, A. C. and C. E. Helmstetter. 1988. Replication patterns of multiple plasmids coexisting in Escherichia coli. J. Bacteriol. 170:1380-1383.
55. Løbner-Olesen, A., F. G. Hansen, K. V. Rasmussen, B. Martin, and P. L. Kuempel. 1994. The initiation cascade for chromosome replication in wild-type and Dam methyltransferase deficient Escherichia coli cells. EMBO J. 13:1856-1862.
56. Løbner-Olesen, A., K. Skarstad, F. G. Hansen, K. von Meyenburg, and E. Boye. 1989. The DnaA protein determines the initiation mass of Escherichia coli K-12. Cell 57:881-889.
57. Lobner-Olesen, A., O. Skovgaard, and M. G. Marinus. 2005. Dam methylation: coordinating cellular processes. Curr. Opin. Microbiol. 8:154-160.
58. Lobry, J. R. 1996. Asymmetric substitution patterns in the two DNA strands of bacteria. Mol. Biol. Evol. 13:660-665.
59. Lu, M., J. L. Campbell, E. Boye, and N. Kleckner. 1994. SeqA: a negative modulator of replication initiation in E. coli. Cell 77:413-426.
60. Mackenzie, C., S. Kaplan, and M. Choudhary. 2004. Multiple chromosomes, p. 82-101. In R. V. Miller and M. J. Day (ed.), Microbial evolution: Gene Establishment, Survival and Exchange, Washington DC.
61. Mekalanos, J. J., E. J. Rubin, and M. K. Waldor. 1997. Cholera: molecular basis for emergence and pathogenesis. FEMS Immunol. Med. Microbiol. 18:241-248.
62. Messer, W. 1972. Initiation of deoxyribonucleic acid replication in Escherichia coli B-r: chronology of events and transcriptional control of initiation. J. Bacteriol. 112:7-12.
63. Messer, W. 2002. The bacterial replication initiator DnaA. DnaA and oriC, the bacterial mode to initiate DNA replication. FEMS Microbiol. Rev. 26:355-374.
64. Messer, W., H. E. Bergmans, M. Meijer, J. E. Womack, F. G. Hansen, and K. von Meyenburg. 1978. Minichromosomes: Plasmids which carry the E. coli replication origin. Mol. Gen. Genet. 162:269-275.
65. Messer, W., M. Meijer, H. E. Bergmans, F. G. Hansen, K. von Meyenburg, E. Beck, and H. Schaller. 1979. Origin of replication, oriC, of the Escherichia coli K- 12 chromosome: Nucleotide sequence. Cold Spring Harbor Symp. Quant. Biol. 43:139-145.
66. Messer, W. and C. Weigel. 1996. Initiation of chromosome replication, p. 1579-1601. In F. C. Neidhardt, R. Curtiss, III, J. L. Ingraham, E. C. C. Lin, K. B. Low, B. Magasanik, W. S. Reznikoff, M. Riley, M. Schaechter, and H. E. Umbarger (ed.),
50

Escherichia coli and Salmonella: cellular and molecular biology. American Society for Microbiology, Washington, DC.
67. Michaux, S., J. Paillisson, M. J. Carles-Nurit, G. Bourg, A. lardet-Servent, and M. Ramuz. 1993. Presence of two independent chromosomes in the Brucella melitensis 16M genome. J. Bacteriol. 175:701-705.
68. Michelsen, O., M. J. Teixeira de Mattos, P. R. Jensen, and F. G. Hansen. 2003. Precise determinations of C and D periods by flow cytometry in Escherichia coli K-12 and B/r. Microbiology 149:1001-1010.
69. Morigen, F. Molina, and K. Skarstad. 2005. Deletion of the datA site does not affect once-per-cell-cycle timing but induces rifampin-resistant replication. J. Bacteriol. 187:3913-3920.
70. Okada, K., T. Iida, K. Kita-Tsukamoto, and T. Honda. 2005. Vibrios commonly possess two chromosomes. J. Bacteriol. 187:752-757.
71. Pal, D., T. Venkova-Canova, P. Srivastava, and D. K. Chattoraj. 2005. Multipartite regulation of rctB, the replication initiator gene of Vibrio cholerae chromosome II. J. Bacteriol. 187:7167-7175.
72. Pal, S. K., R. J. Mason, and D. K. Chattoraj. 1986. P1 plasmid replication, role of initiator titration in copy number control. J. Mol. Biol. 192:275-285.
73. Park, K. and D. K. Chattoraj. 2001. DnaA boxes in the P1 plasmid origin: the effect of their position on the directionality of replication and plasmid copy number. J. Mol. Biol. 310:69-81.
74. Paulsson, J. and D. K. Chattoraj. 2006. Origin inactivation in bacterial DNA replication control. Mol. Microbiol. 61:9-15.
75. POWELL, E. O. 1958. An outline of the pattern of bacterial generation times. J. Gen. Microbiol. 18:382-417.
76. Prescott, L. M., J. M. Harley, and D. A. Klein. 2005. Microbiology. The Mcgraw-Hill Companies inc, New York.
77. Proctor, G. N. 1994. Mathematics of microbial plasmid instability and subsequent differential growth of plasmid-free and plasmid-containing cells, relevant to the analysis of experimental colony number data. Plasmid 32:101-130.
78. Projan, S. J. and J. A. Wechsler. 1981. RNA polymerase is required for DNA initiation in vitro. Mol. Gen. Genet. 183:78-81.
79. Riber, L., J. A. Olsson, R. B. Jensen, O. Skovgaard, S. Dasgupta, M. G. Marinus, and A. Lobner-Olesen. 2006. Hda-mediated inactivation of the DnaA protein and dnaA gene autoregulation act in concert to ensure homeostatic maintenance of the Escherichia coli chromosome. Genes Dev. 20:2121-2134.
80. Russell, D. W. and N. D. Zinder. 1987. Hemimethylation prevents DNA replication in E. coli. Cell 50:1071-1079.
81. Saiki, R. K., S. Scharf, F. Faloona, K. B. Mullis, G. T. Horn, H. A. Erlich, and N. Arnheim. 1985. Enzymatic amplification of beta-globin genomic sequences and restriction site analysis for diagnosis of sickle cell anemia. Science 230:1350-1354.
51
82. Saint-Dic, D., B. P. Frushour, J. H. Kehrl, and L. S. Kahng. 2006. A parA homolog selectively influences positioning of the large chromosome origin in Vibrio cholerae. J. Bacteriol. 188:5626-5631.
83. Schaechter, M., O. Maaloe, and N. O. Kjeldgaard. 1958. Dependency on medium and temperature of cell size and chemical composition during balanced grown of Salmonella typhimurium. J. Gen. Microbiol. 19:592-606.
84. Skarstad, K., E. Boye, and H. B. Steen. 1986. Timing of initiation of chromosome replication in individual E. coli cells. EMBO J. 5:1711-1717.
85. Srivastava, P., R. A. Fekete, and D. K. Chattoraj. 2006. Segregation of the replication terminus of the two Vibrio cholerae chromosomes. J. Bacteriol. 188:1060-1070.
86. Sugimoto, K., A. Oka, H. Sugisaki, M. Takanami, A. Nishimura, Y. Yasuda, and Y. Hirota. 1979. Nucleotide sequence of Escherichia coli K-12 replication origin. Proc. Natl. Acad. Sci. USA 76:575-579.
87. Suwanto, A. and S. Kaplan. 1989. Physical and genetic mapping of the Rhodobacter sphaeroides 2.4.1 genome: presence of two unique circular chromosomes. J. Bacteriol. 171:5850-5859.
88. Trucksis, M., J. Michalski, Y. K. Deng, and J. B. Kaper. 1998. The Vibrio cholerae genome contains two unique circular chromosomes. Proc. Natl. Acad. Sci. U. S. A 95:14464-14469.
89. Venkova-Canova, T., P. Srivastava, and D. K. Chattoraj. 2006. Transcriptional inactivation of a regulatory site for replication of Vibrio cholerae chromosome II. Proc. Natl. Acad. Sci. U. S. A 103:12051-12056.
90. von Freiesleben, U., K. V. Rasmussen, and M. Schaechter. 1994. SeqA limits DnaA activity in replication from oriC in Escherichia coli. Mol. Microbiol. 14:763-772.
91. von Freiesleben, U., M. A. Krekling, F. G. Hansen, and A. Løbner-Olesen. 2000. The eclipse period of Escherichia coli. EMBO J. 19:6240-6248.
92. Waldor, M. K. and J. J. Mekalanos. 1994. Emergence of a new cholera pandemic: molecular analysis of virulence determinants in Vibrio cholerae O139 and development of a live vaccine prototype. J. Infect. Dis. 170:278-283.
93. Wickner, S., J. Hoskins, and K. McKenney. 1991. Monomerization of RepA dimers by heat shock proteins activates binding to DNA replication origin. Proc. Natl. Acad. Sci. U. S. A 88:7903-7907.
94. Wickner, S. H. and D. K. Chattoraj. 1987. Replication of mini-P1 plasmid DNA in vitro requires two initiation proteins, encoded by the repA gene of phage P1 and the dnaA gene of Escherichia coli. Proc. Natl. Acad. Sci. USA 84:3668-3672.
95. Wold, S., K. Skarstad, H. B. Steen, T. Stokke, and E. Boye. 1994. The initiation mass for DNA replication in Escherichia coli K-12 is dependent on growth rate. EMBO J. 13:2097-2102.
96. Xu, Q., M. Dziejman, and J. J. Mekalanos. 2003. Determination of the transcriptome of Vibrio cholerae during intraintestinal growth and midexponential phase in vitro. Proc. Natl. Acad. Sci. U. S. A 100:1286-1291.
97. Yarmolinsky, M. and N. Sternberg. 1988. p. 291. In The Bacteriophages. Plenum, New York.
52
98. Zyskind, J. W., L. T. Deen, and D. W. Smith. 1977. Temporal sequence of events during the initiation process in Escherichia coli deoxyribonucleic acid replication: roles of the dnaA and dnaC gene products and ribonucleic acid polymerase. J. Bacteriol. 129:1466-1475.
53