ICM Project Network Infrastructure and Equipment · ICM Project – Network Infrastructure and...
28
Toronto Hydro‐Electric System Limited EB‐2012‐0064 Tab 4 Schedule B11 ORIGINAL (28 pages) ICM Project – Network Infrastructure and Equipment Automatic Transfer Switches (ATS) and Reverse Power Breakers (RPB) Segment Toronto Hydro‐Electric System Limited (THESL)
-
Upload
phungthien -
Category
Documents
-
view
219 -
download
3
Transcript of ICM Project Network Infrastructure and Equipment · ICM Project – Network Infrastructure and...

Toronto Hydro‐Electric System Limited EB‐2012‐0064
Tab 4 Schedule B11
ORIGINAL (28 pages)
ICM Project – Network Infrastructure
and Equipment
Automatic Transfer Switches (ATS) and Reverse Power
Breakers (RPB) Segment
Toronto Hydro‐Electric System Limited (THESL)

Toronto Hydro‐Electric System Limited EB‐2012‐0064
Tab 4 Schedule B11
ORIGINAL
ICM Project ATS and RPB Segment
1
I EXECUTIVE SUMMARY 1
2
1. Project Description 3
Automatic Transfer Switches (ATS) automatically switch a customer to a designated standby 4
feeder in the event the normal primary feeder fails. Reverse Power Breakers (RPB) 5
automatically open primary feeder supplies to customers in the event of feeder outages to 6
prevent dangerous backfeed conditions. ATS and RPB assets are generally used to supply 7
medium size customers that require a reliable supply, such as schools, supermarkets, seniors’ 8
homes, and other mid‐ sized buildings (See Section II, 1). 9
10
Both ATS and RPB assets have degraded rapidly in 2010 and 2011. THESL’s Asset Condition 11
Assessment (ACA) results indicate that approximately 30 ATS assets will need to be replaced 12
over the next three years (See Section III, 1 and Appendix 1). In addition, based on physical 13
inspection data, a further six RPB assets have been identified as requiring immediate 14
replacement. The proposed ATS and RPB Segment will replace these assets with Stand Alone 15
Network Protectors or Standard Network Equipment at a total cost of $9.8 M. 16
17
Table 1: ATS and RPB Segment Capital Cost 18
Description Year Design Estimate
($M)
Estimated Total Cost
($M)
Replace 10 ATS Locations 2012 $2.57
$7.68 Replace 10 ATS Locations 2013 $2.59
Replace 10 ATS Locations 2014 $2.52
Replace 2 RPB Locations 2012 $0.71
$2.12 Replace 2 RPB Locations 2013 $0.71
Replace 2 RPB Locations 2014 $0.71
Total: $9.80 $9.80

Toronto Hydro‐Electric System Limited EB‐2012‐0064
Tab 4 Schedule B11
ORIGINAL
ICM Project ATS and RPB Segment
2
2. Why the Project is Non‐Discretionary 1
The impact that failing ATS and RPB assets have on the reliability of the system and the general 2
public can be extensive (See Section III, 2). For example, an ATS vault fire incident at 33 Princess 3
Street (January 16, 2012) affected a daycare centre, a seniors’ home, and the St. James Campus 4
of George Brown College. Similarly, an RPB failure at 50 Marlborough (January 10, 2010) 5
resulted in an explosion and damage to equipment in other locations, and an extended 6
interruption to the entire neighbouring grid network. Replacing ATS and RPB units is needed for 7
the following reasons: 8
• Unrepairable – ATS and RPB assets were purchased from many different manufacturers 9
and over many different vintages, which makes each unit unique. Manufacturer 10
support and spare parts are unavailable for these assets, so continuing ongoing 11
maintenance is not a viable option. Upon failure, they need to be replaced with new 12
equipment. 13
• Asset Condition – There are many ATS assets which have degraded to poor and very 14
poor condition (based on the ACA categorization). In addition to the ACA, recent field 15
inspections have also identified additional RPB assets in deteriorating condition 16
requiring immediate replacement. Failing to make immediate replacements will likely 17
result in accelerated reliability issues. Based on recent ACA data, 10% of ATS assets can 18
be expected to fail within the next year, and a comparable percentage of RPB assets 19
would also be expected to fail. The customers supplied by these assets would 20
experience loss of supply incidents following unplanned feeder outages. 21
Public Safety Risks – ATS and RPB assets can ignite a vault fire when they fail. As these 22
assets are located in densely populated downtown areas, there is a potential risk to 23
public safety. 24
25
The table below provides details on the expected failure rates of the ATS and RPB assets and the 26
likely impact of failure on THESL’s reliability in the affected areas. 27

Toronto Hydro‐Electric System Limited EB‐2012‐0064
Tab 4 Schedule B11
ORIGINAL
ICM Project ATS and RPB Segment
3
Table 2: ATS and RPB Failure Impacts 1
Asset Number of Assets to be Replaced
Expected Failure Rate in 2013
Average consequences of failure (CI and CHI)
ATS 30 10% 1 and 4.5
RPB 6 10% 1 and 4.5
0
5
10
15
20
25
30
35
2012 2013 2014 2015
Run to Failure
ProactiveReplacement
Figure 1: Predicted ATS Failures 2
3
4
3. Why the Proposed Project is the Preferred Alternative 5
Many options were evaluated to address the failing ATS and RPB units, as follows: 6
a) Like‐for‐Like Replacement with new ATS and/or RPB 7
b) Decommission the Vault 8
c) Modular Switchgear 9
d) Compact Radial Switchgear 10
e) Modified TTC Design Switchgear 11
f) Stand‐Alone Network Protectors 12
g) Standard Network Equipment 13

Toronto Hydro‐Electric System Limited EB‐2012‐0064
Tab 4 Schedule B11
ORIGINAL
ICM Project ATS and RPB Segment
4
Option (a) was not considered viable, due to the fact that the ATS and RPB assets both are 1
obsolete. They are no longer being manufactured or supported by the original suppliers, and 2
spare stock is not available. Option (b) would involve connecting the customers to an existing 3
secondary network grid, but this option is typically more costly than other alternatives because 4
of the conversion costs to connect to the network and is not feasible in many areas. Options (c), 5
(d) and (e) would result in the installation of new switchgear to connect to the pre‐existing 6
distribution transformer assets. Each of these three options, however, would produce an 7
inferior supply of electricity to the customer in terms of reliability, when compared to the 8
existing ATS and/or RPB installation, as manual switching is required to transfer to the standby 9
supply. The ATS and RPB units typically supply medium‐sized customers that require high 10
reliability, such as schools and senior housing. 11
12
As a result of the limitations of the above options, THESL has concluded that in cases where 13
existing transformers and adequate space exists can be reused it is preferable to install new 14
Stand‐Alone Network Protectors (SANP) as per Option (f). Alternatively, if there isn’t enough 15
room to accommodate SANPs, or the transformer units also need to be replaced, it is preferable 16
for the ATS and RPB assets to be replaced by Standard Network Equipment as per Option (g). 17
These two solutions are the preferred alternatives with the one chosen depending on the 18
specific circumstances as outlined above. They both re‐use the existing civil infrastructure, 19
maintain high levels of reliability, and represent cost‐effective approaches. 20
21
Should this segment be deferred, THESL would only replace equipment that fails 22
catastrophically. Where equipment is not destroyed by the failure, THESL would attempt to 23
repair it, and if not successful, would manually transfer the customers’ supply cables as 24
necessary following feeder outages. 25

Toronto Hydro‐Electric System Limited EB‐2012‐0064
Tab 4 Schedule B11
ORIGINAL
ICM Project ATS and RPB Segment
5
II DETAILED PROJECT INFORMATION 1
2
1. Project Details 3
4
Automatic Transfer Switches (ATS) are designed to automatically switch from the normal supply 5
to the Standby supply in the case of an interruption on the normal supply feed. Reverse Power 6
Breaker (RPB) assets normally supply customers from two primary supplies, and automatically 7
open one of these supplies in the event of feeder outages in order to prevent dangerous 8
backfeed conditions. ATS and RPB assets are generally used to supply medium size customers 9
that require a reliable supply, such as schools, supermarkets, seniors’ homes, and other mid‐ 10
sized buildings. 11
12
The purpose of this segment is to replace end‐of‐life, very poor condition ATSs and RPBs. In 13
total there are 30 ATS locations and six RPB locations that have been identified as requiring 14
immediate equipment replacement. THESL’s proposed ATS and RPB Segment will replace these 15
assets with either new Stand‐Alone Network Protectors or Standard Network Equipment at a 16
total cost of $9.8M, as summarized in Table 2 and Table 3 below. 17
18
Each asset location will be assessed on a case by case basis to determine the best replacement 19
solution. In cases where the transformer is salvageable it is reused and a Stand Alone Network 20
Protector (SANP) is installed to replace the obsolete and failing equipment at an approximate 21
average cost of $145,000. If the transformer also requires replacement then the equipment will 22
be replaced with standard network equipment, at an approximate average cost of $325,000. 23
24
Given workforce constraints, THESL proposes to replace the equipment at a rate of ten ATS 25
locations and two RPB locations a year in each of 2012, 2013 and 2014. Jobs have been 26
prioritized based on addressing the very poor condition units first, followed by units that are 27
currently in poor condition, but expected to degrade to very poor condition at the time of 28
replacement. 29
Toronto Hydro‐Electric System Limited EB‐2012‐0064
Tab 4 Schedule B11
ORIGINAL
ICM Project ATS and RPB Segment
6
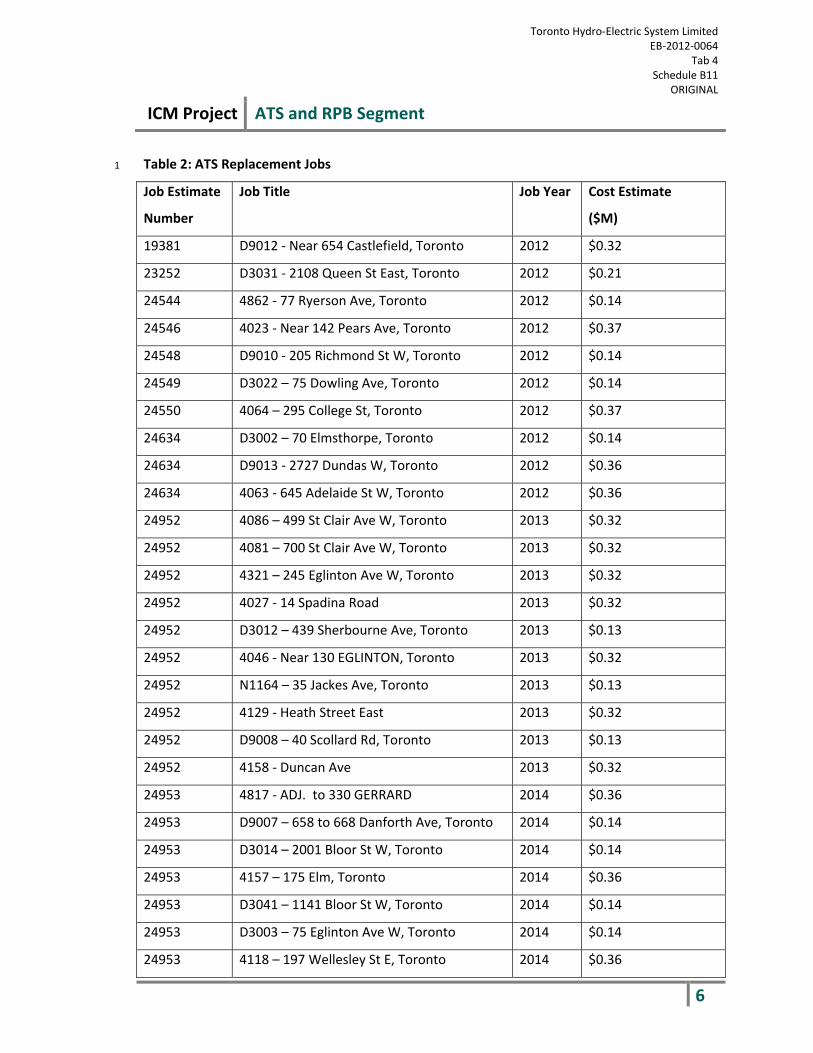
Table 2: ATS Replacement Jobs 1
Job Estimate
Number
Job Title Job Year Cost Estimate
($M)
19381 D9012 ‐ Near 654 Castlefield, Toronto 2012 $0.32
23252 D3031 ‐ 2108 Queen St East, Toronto 2012 $0.21
24544 4862 ‐ 77 Ryerson Ave, Toronto 2012 $0.14
24546 4023 ‐ Near 142 Pears Ave, Toronto 2012 $0.37
24548 D9010 ‐ 205 Richmond St W, Toronto 2012 $0.14
24549 D3022 – 75 Dowling Ave, Toronto 2012 $0.14
24550 4064 – 295 College St, Toronto 2012 $0.37
24634 D3002 – 70 Elmsthorpe, Toronto 2012 $0.14
24634 D9013 ‐ 2727 Dundas W, Toronto 2012 $0.36
24634 4063 ‐ 645 Adelaide St W, Toronto 2012 $0.36
24952 4086 – 499 St Clair Ave W, Toronto 2013 $0.32
24952 4081 – 700 St Clair Ave W, Toronto 2013 $0.32
24952 4321 – 245 Eglinton Ave W, Toronto 2013 $0.32
24952 4027 ‐ 14 Spadina Road 2013 $0.32
24952 D3012 – 439 Sherbourne Ave, Toronto 2013 $0.13
24952 4046 ‐ Near 130 EGLINTON, Toronto 2013 $0.32
24952 N1164 – 35 Jackes Ave, Toronto 2013 $0.13
24952 4129 ‐ Heath Street East 2013 $0.32
24952 D9008 – 40 Scollard Rd, Toronto 2013 $0.13
24952 4158 ‐ Duncan Ave 2013 $0.32
24953 4817 ‐ ADJ. to 330 GERRARD 2014 $0.36
24953 D9007 – 658 to 668 Danforth Ave, Toronto 2014 $0.14
24953 D3014 – 2001 Bloor St W, Toronto 2014 $0.14
24953 4157 – 175 Elm, Toronto 2014 $0.36
24953 D3041 – 1141 Bloor St W, Toronto 2014 $0.14
24953 D3003 – 75 Eglinton Ave W, Toronto 2014 $0.14
24953 4118 – 197 Wellesley St E, Toronto 2014 $0.36

Toronto Hydro‐Electric System Limited EB‐2012‐0064
Tab 4 Schedule B11
ORIGINAL
ICM Project ATS and RPB Segment
7
Job Estimate
Number
Job Title Job Year Cost Estimate
($M)
24953 4763 – 700 Ontario St, Toronto 2014 $0.14
24953 4121 – 36 Earl, Toronto 2014 $0.36
24953 4861 – 165 Grange Ave, Toronto 2014 $0.36
1
2
Table 3: RPB Replacement Jobs 3
Job
Estimate
Number
Job Title Job
Year
Cost Estimate
($M)
24905 4515 ‐ 25 Lascelles Blvd, Toronto 2012 $0.35
24905 D3039 – 186 Cowan, Toronto 2012 $0.35
24954 4662 – 245 Dunn Ave, Toronto 2013 $0.35
24954 4476 – Bloor opposite Mossom, Toronto 2013 $0.35
24955 4175 – 160 John St, Toronto 2014 $0.35
24955 4669 – 200 Balliol, Toronto 2014 $0.35
Toronto Hydro‐Electric System Limited EB‐2012‐0064
Tab 4 Schedule B11
ORIGINAL
ICM Project ATS and RPB Segment
8
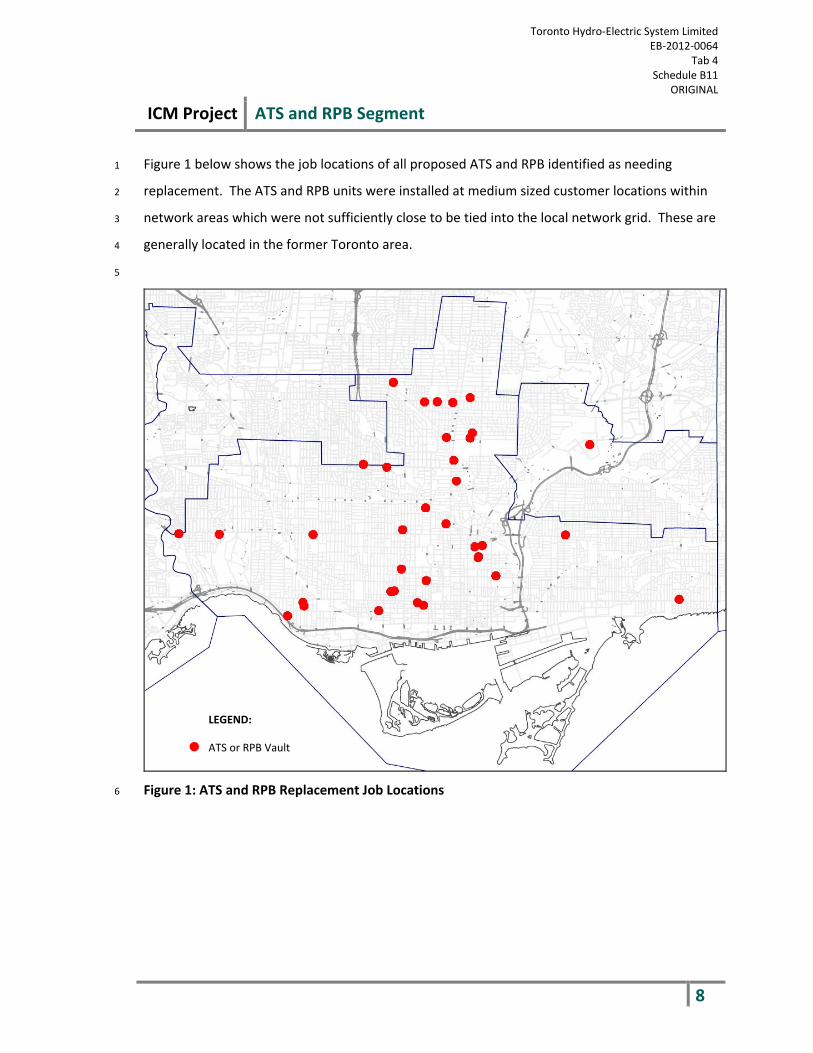
Figure 1 below shows the job locations of all proposed ATS and RPB identified as needing 1
replacement. The ATS and RPB units were installed at medium sized customer locations within 2
network areas which were not sufficiently close to be tied into the local network grid. These are 3
generally located in the former Toronto area. 4
5
Figure 1: ATS and RPB Replacement Job Locations6
LEGEND:
ATS or RPB Vault

Toronto Hydro‐Electric System Limited EB‐2012‐0064
Tab 4 Schedule B11
ORIGINAL
ICM Project ATS and RPB Segment
9
III NEED 1
2
1. Asset Condition 3
4
THESL’s 2011 Asset Condition Assessment (ACA) shows that for ATS assets there has been a 5
22.28% increase in the poor asset category and a 10.17% increase in the very poor asset 6
category between 2010 and 2011. This trend shows that an increasingly large percentage of 7
ATSs are near imminent failure. RPB assets were not assessed in the 2010 and 2011 ACA 8
program. However, RPBs are of similar vintage to ATSs and placed in similar operating 9
environments, and their equally poor condition has also been confirmed by physical inspections 10
by THESL crew. 11
12
In general, there were 30 identified ATS assets that degraded from a condition of fair to poor or 13
very poor status between 2010 and 2011, which represents 32.45% of the total asset population 14
(see Appendix 1 for further details). The very poor status indicates that the units need to be 15
replaced immediately within one year; the poor assets need to be replaced within three years. 16
Figure 1 below illustrates that the ATS assets have moved dramatically from each condition 17
category to worse categories in the past year. These statistics suggest that the assets, which are 18
past their end of life, and have been fully utilized and depreciated, are deteriorating rapidly. 19
The ACA identifies the useful life of ATSs as 25 to 30 years. The ATSs proposed for replacement 20
are as old as 49 years of age and generally well past typical useful life. Only three units have 21
deteriorated to poor condition before having reached their expected useful life. 22

Toronto Hydro‐Electric System Limited EB‐2012‐0064
Tab 4 Schedule B11
ORIGINAL
ICM Project ATS and RPB Segment
10
0.00%
5.00%
10.00%
15.00%
20.00%
25.00%
30.00%
35.00%
40.00%
45.00%
Very Good Good Fair Poor Very Poor
ATS Pop
ulation (%
)
2010
2011
Figure 2: Asset Condition for ATS units 1
2
Table 4: Asset Condition Assessment for ATS units 3
Very Poor Poor Fair Good Very Good
Year % Sample % Change % Sample % Change % Sample % Change % Sample % Change % Sample % Change
ATS 2010 0.00%
10.17% 4.84%
22.28% 37.10%
‐26.93% 16.13%
14.38% 41.94%
‐19.91% 2011 10.17% 27.12% 10.17% 30.51% 22.03%
4
The dramatic increase of “poor” and “very poor” ATSs in the past year is characteristic of assets 5
well past normal useful life. Although 14 units were replaced in the last year, new failures are 6
occurring at an increasing rate. 7
8
Due to manufacturing design changes applied over the years to ATSs and RPBs, and the different 9
manufacturers of these assets, many require unique and specialized spare parts. In the majority 10
of cases these replacement parts are no longer available and these units must be replaced with 11
an entirely new set of assets as part of a new configuration. 12
13
Without proactive investment into replacing these units and approval for this segment, failures 14
will continue and escalate in frequency, each time impacting THESL customers. 15

Toronto Hydro‐Electric System Limited EB‐2012‐0064
Tab 4 Schedule B11
ORIGINAL
ICM Project ATS and RPB Segment
11
If this segment is deferred, THESL would place the failing units into its Defective Equipment 1
Tracking System (DETS), which is used to track equipment that has failed when found during 2
operational procedures or scheduled maintained tasks were being performed. These units 3
would be replaced only when new units become available. The impact of this inaction is a one‐ 4
to 4.5 hour interruption to all customers supplied by the ATS and RPB units following each 5
unplanned feeder outage. In some cases, a catastrophic failure may occur which could result in 6
property damage and serious risks to public safety. 7
8
2. Current Status and Recent Failures 9
10
There are approximately 90 ATS units and 130 RPB units operational in THESL’s distribution 11
system, which includes four ATSs already on the DETS List. 12
13
Two examples of recent ATS and RPB failure incidents are discussed below. 14
15
2.1. 33 Princess Street 16
On January 16, 2012 at approximately 13:25 a vault fire began at 33 Princess Street (near Front 17
and Sherbourne), tripping two back to back feeders (A15GD and A14GD). This fire was 18
contained to the defective ATS that switches between feeders A14GD and A15GD. However, 19
the fire damaged the primary cables on both feeders as well as the two distribution 20
transformers supplying 33 Princess Street. The back to back feeders were sectionalised at the 21
station and power was promptly restored to most customers. However, two locations 22
(Esplanade Development Corp, 109 Front Street East and King James Place, 151 King Street East) 23
which were supplied only from feeders A14GD and A15GD experienced extended outages. 24
Some customers were without power until approximately 14:00 the following day. 25
26
This fire affected about 40 properties, including a nearby daycare and community center, a 27
number of condominiums and business towers, as well as the George Brown College St. James 28
campus. In total about 460 students and 50 seniors in a nearby seniors’ home were affected, 29
and 50 children from the daycare were evacuated. 30

Toronto Hydro‐Electric System Limited EB‐2012‐0064
Tab 4 Schedule B11
ORIGINAL
ICM Project ATS and RPB Segment
12
Although no injuries resulted from this incident, the risk of injury and extensive property 1
damage was notable. 2
3
Figure 3: LEFT: Photo of a typical ATS unit. RIGHT: The fire department putting out the fire at 4
33 Princess Street. PHOTO TAKEN January 16, 2012 5
Figure 4: The figures above show the damaged equipment from the failure at 33 Princess 6
Street. The fire destroyed the ATS unit (right). PHOTO TAKEN January 17, 2012 7

Toronto Hydro‐Electric System Limited EB‐2012‐0064
Tab 4 Schedule B11
ORIGINAL
ICM Project ATS and RPB Segment
13
Figure 5: The transformers and ATS unit were replaced after the fire. PHOTO TAKEN January 1
23, 2012 2
3
4
2.2. 50 Marlborough Avenue 5
On January 10, 2010 a defective RPB at 50 Marlborough Avenue (near Yonge and Davenport) 6
failed to open. This allowed a backfeed into a primary fault, resulting in an explosion and 7
damage to equipment in other nearby vaults, as well as damage to the two transformers within 8
this RPB vault. Figure 7 below shows the damaged transformers with overheated neutrals and 9
burned oil discharge from the pressure relief valves. This incident resulted in almost ten hours 10
of interruption to the associated network grid and over 26 hours of interruption to 50 11
Marlborough Avenue. 12
13
In addition, two THESL crew workers were affected by the explosion that took place; one crew 14
worker suffered injuries, while the other case was identified as a near miss. 15

Toronto Hydro‐Electric System Limited EB‐2012‐0064
Tab 4 Schedule B11
ORIGINAL
ICM Project ATS and RPB Segment
14
Figure 6: RPB units following failure at 50 Marlborough. PHOTOS from January 10, 2010 1
2
Figure 7: Damaged transformers at 50 Marlborough. PHOTOS from January 10, 2010 3
4
RPBs are particularly prone to such extensive external damage upon failure. Replacing the RPBs 5
is expected to result in improved safety and reliability, and reduced risks to both the directly 6
supplied customers, as well as all customers on the associated network grid. 7

Toronto Hydro‐Electric System Limited EB‐2012‐0064
Tab 4 Schedule B11
ORIGINAL
ICM Project ATS and RPB Segment
15
IV PREFERRED ALTERNATIVE 1
2
1. Available Alternatives 3
4
ATS and RPB assets were purchased from many different manufacturers and over many 5
different vintages, which make each unit unique. Manufacturer support and spare parts are 6
unavailable for these assets, so continuing ongoing maintenance is not a viable option. As 7
inaction under a work‐to‐failure approach will result in unmitigated risk to customers supplied 8
by the ATS and RFB assets, many options were evaluated as a solution to remedy these failing 9
units: 10
(a) Like‐for‐Like Replacement with new ATS and/or RPB 11
(b) Eliminate the Vault 12
(c) Modular Switchgear 13
(d) Compact Radial Switchgear 14
(e) Modified TTC Design Switchgear 15
(f) Stand Alone Network Protectors 16
(g) Standard Network Equipment 17
18
Option (a), to replace on a like for like basis is not feasible. In order to replace ATS and RPB units 19
with like for like equipment, custom made units are required. Custom manufacturing this 20
equipment is a very expensive option and would provide less continuity of service to customers 21
than other alternatives considered. In addition, when custom equipment is purchased, 22
availability of spare parts and support is limited. Figure 8 below shows an existing ATS unit and 23
schematic. Figure 9 below shows an existing RPB unit and schematic. 24

Toronto Hydro‐Electric System Limited EB‐2012‐0064
Tab 4 Schedule B11
ORIGINAL
ICM Project ATS and RPB Segment
16
Figure 8: ATS vault (existing non‐submersible equipment) 1
Figure 9: RPB vault (existing non‐submersible equipment) 2

Toronto Hydro‐Electric System Limited EB‐2012‐0064
Tab 4 Schedule B11
ORIGINAL
ICM Project ATS and RPB Segment
17
Option (b) is to eliminate the ATS or RPB vault and feed the customer directly from the street (as 1
shown in Figure 10 below). This option is generally only practical in areas that already possess 2
nearby network grid facilities with available growth capacity to pick up the decommissioned ATS 3
or RPB vault load. As such, this option is only applicable to 120/208V ATS and RPB customers 4
which match the 120/208V network distribution voltage. Those customers that can convert to a 5
secondary network grid supply option could be expected to experience improved operating 6
characteristics, as no momentary interruptions result from unplanned feeder outages. RPB 7
customers would experience unchanged reliability. The cost of this option is extremely variable 8
and depends on available infrastructure to support it. In many cases customers were supplied 9
with ATS or RPB units because they were isolated from the grid, and therefore this option would 10
not be feasible. In addition, the cost of this option is extremely variable, ranging from $50k in 11
some rare circumstances, to as much as $1M per location. This solution is typically not cost 12
effective compared with other options. 13
14
Figure 10: Network grid supply from street 15

Toronto Hydro‐Electric System Limited EB‐2012‐0064
Tab 4 Schedule B11
ORIGINAL
ICM Project ATS and RPB Segment
18
Option (c) is to replace the ATS with modular switchgear equipment and retain one existing 1
distribution transformer (as shown in Figure 11 below). This design replaces the secondary ATS 2
with primary switching equipment, and as such is applicable at 120/208V, 240/416V and 3
347/600V (i.e., all three ATS voltages). Customers could be expected to experience inferior 4
operating characteristics with this option, as restoration of service is delayed following 5
unplanned feeder interruptions, due to the requirement to send crews to manually operate the 6
switches. The time required to perform switching would typically take between one to 4.5 7
hours. Modular switching equipment also requires unusually large vaults, and would therefore 8
only be applicable to a small percentage of ATS locations. It is not applicable to RPB locations. 9
10
Figure 11: Modular switchgear (submersible equipment) 11
12
Option (d) is to replace the ATS or RPBs with compact radial (CR) equipment and retain one 13
existing distribution transformer (as shown in Figure 12 below). This design replaces the 14
secondary ATS or RPBs with primary switching equipment, and as such is applicable at 15
120/208V, 240/416V and 347/600V (i.e., all three ATS voltages). Customers could be expected 16
to experience inferior operating characteristics with this option, as restoration of service is 17
delayed following unplanned feeder interruptions, due to the requirement to send crews to 18
manually operate the CR switches. This switching would typically take between one to 4.5 19
hours. CR switches have also proven to be operationally problematic and require higher 20
maintenance than other options. 21

Toronto Hydro‐Electric System Limited EB‐2012‐0064
Tab 4 Schedule B11
ORIGINAL
ICM Project ATS and RPB Segment
19
Figure 12: Compact radial (submersible equipment) 1
2
3
Option (e) is to replace the ATS or RPBs with modified TTC vault switchgear and retain the two 4
existing distribution transformers (as shown in Figure 13 below). This option is applicable 5
120/208V, 240/416V and 347/600V (i.e., all three ATS voltages). Customers could experience 6
inferior operating characteristics with this option, as restoration of service is delayed following 7
unplanned feeder interruptions, due to the requirement to send crews to manually operate the 8
switches. This switching typically takes between one to 4.5 hours. The switching equipment is 9
very compact and can fit into virtually all existing customer vaults, but is limited to smaller 10
customers with no more than a 600A service size. 11

Toronto Hydro‐Electric System Limited EB‐2012‐0064
Tab 4 Schedule B11
ORIGINAL
ICM Project ATS and RPB Segment
20
Figure 13: Modified TTC vault (non‐submersible equipment) 1
2
3
Option (f) is to replace the ATS or RPBs with two Stand Alone Network Protectors (SANPs) (as 4
shown in Figure 14 below) and retain the two existing distribution transformers. This option is 5
applicable to 120/208V and 240/416V ATS vaults (i.e., two of the three ATS voltages). ATS 6
customers experience improved service characteristics, as no momentary interruptions result 7
from unplanned feeder outages and RPB customers experience unchanged reliability. Although 8
SANPs have a slightly larger footprint than ATSs, they can generally fit into most existing 9
customer vaults. Installing two SANPs and removing the ATS or RPBs while reusing the existing 10
transformers would typically cost approximately $145,000 per location. In situations in which 11
full replacement of aged vault equipment is required but other alternatives do not offer the 12
required capacity, the cost to install both an SANP and the vault equipment is typically $0.33M 13
per location. In applicable situations, THESL submits that the installation of SANPs is the 14
preferred approach due to the combination of reliability and cost, but is conditional on the 15
availability of suitable existing civil infrastructure and in most situations, transformers that are in 16
good working condition. 17

Toronto Hydro‐Electric System Limited EB‐2012‐0064
Tab 4 Schedule B11
ORIGINAL
ICM Project ATS and RPB Segment
21
Figure 14: Stand alone network protector (submersible equipment) 1
2
Option (g) is to replace the ATS or RPBs and two distribution transformers with two standard 3
network units (as shown in Figure 15 below). This option is only applicable at 120/208V, and for 4
customers with loads of approximately 500kVA or greater. ATS customers experience improved 5
service characteristics, as no momentary interruptions result from unplanned feeder outages. 6
RPB customers experience unchanged reliability. The average cost of this option is $0.15M per 7
location. The reliability of this option is expected to be the same as Option (f). Network 8
equipment can fit into almost all existing customer vaults. 9
10
Option (f) and option (g) are both viable options and each ATS and RPB to be replaced will be 11
evaluated on a case by case basis. If there is available space and a reusable transformer Option 12
(f) will most likely be employed. However, if the transformer also needs to be replaced or there 13
isn’t enough room for a SANP, then Option (g), a standard network transformer and protector, 14
will be used. 15

Toronto Hydro‐Electric System Limited EB‐2012‐0064
Tab 4 Schedule B11
ORIGINAL
ICM Project ATS and RPB Segment
22
Figure 15: Network vault (submersible or non‐submersible equipment) 1
2
3
Both options (f) and (g) are expected to provide superior reliability due to the interconnection of 4
multiple transformers and supply feeders. The main advantage of installing either SANPs or 5
network equipment is the ability to utilize available civil infrastructure to supply THESL’s 6
customers with a highly reliable system that normally would be cost prohibitive due the need to 7
construct additional civil infrastructure. Replacing the obsolete ATS and RPB equipment is 8
expected to lead to higher reliability for customers and a safer environment for THESL 9
employees and the general public. Installing Option (f), and Option (g) where required, is the 10
preferred alternative because this approach provides the best combination of reliability, safety 11
and cost. 12
13
2. Economic Benefits of the Preferred Alternative 14
THESL has calculated the economic benefits of undertaking this segment, by taking into account 15
outage costs and the costs of emergency repairs and replacement. If no proactive replacements 16
were to occur and equipment was run to failure, then the resulting NPV of this strategy would 17
be $12.67M. This accounts for the replacement cost and an average outage cost for each 18
outage of $0.06M per failure (with outage cost based on $30 per customer per interruption and 19

Toronto Hydro‐Electric System Limited EB‐2012‐0064
Tab 4 Schedule B11
ORIGINAL
ICM Project ATS and RPB Segment
23
$15 per kWh interrupted). The alternative proposed replacement strategy would yield an NPV 1
of $10.41M, resulting in a savings of $2.26M. 2
3
The applied outage costs represent indirect cost attributes associated with in‐service asset 4
failures, including the costs of customer interruptions, emergency repairs and replacement. The 5
calculations for this analysis can be found below: 6
8
ATS & RPB Program Analysis A) Base Case Year 1 Year 2 Year 3 ATS Replacement $3,250,000 $6,500,000 RPB Replacement $650,000 $1,300,000 Outage $756,000 $1,512,000 Total $4,656,000 $9,312,000 STRATEGY NPV $12,668,241 B) Proactive Replace
Year 1 Year 2 Year 3
ATS Replacement $3,250,000 $3,250,000 $3,250,000 RPB Replacement $650,000 $650,000 $650,000 Total $3,900,000 $3,900,000 $3,900,000 STRATEGY NPV $10,413,185 9
A) Scenario A: Under this scenario the assets are run to failure with no proactive 10
intervention. 11
12
In Year 1, THESL assumes the ten units identified in THESL’s ACA to be in very poor condition 13
will fail. Each of these failures is accompanied by a four‐hour outage that impacts on 14
average 700kVA of load. This outage includes time for switching as well as isolation to 15
remove the failed piece of equipment. In many instances emergency work occurs at a 16
higher labour cost due to overtime but the overtime cost has been omitted to employ a 17
conservative analysis. The interruption cost to THESL is $63,000 per incident. In addition, 18
after these loads are brought back online the equipment needs to be replaced at a cost of 19
$325,000 per unit. The total cost in Year 1 is $4,656,000 which takes into account 10 ATS 20
replacements and 2 RPB replacements following 12 outages. 21
22

Toronto Hydro‐Electric System Limited EB‐2012‐0064
Tab 4 Schedule B11
ORIGINAL
ICM Project ATS and RPB Segment
24
By Year 3, the ACA suggests that 24 more ATS & RPB failures should be expected. The 1
resulting total cost in Year 3 is $9,312,000. Taking the present value for all costs in Scenario 2
A, the total cost would be $12,668,241. 3
4
B) Scenario B: Under this scenario proactive investment is employed. 5
6
In this case replacements are made in each year as proposed under this segment, to 7
mitigate potential failures and the outages that would occur by letting assets run to fail. 8
Replacement of assets is performed proactively and it is assumed that no outages will occur 9
under this scenario. Taking the net present value of this strategy, the total cost is 10
$10,413,185. 11
12
Evaluating both scenarios leads to the conclusion that proactive replacement of ATS & RPB 13
assets is the more cost‐effective approach. 14
Toronto Hydro‐Electric System Limited EB‐2012‐0064
Tab 4 Schedule B11
ORIGINAL
ICM Project ATS and RPB Segment
25
APPENDIX 1 1
HEALTH INDEX METHODOLOGY 2
3
4
Health indexing quantifies equipment condition based on numerous condition criteria that are 5
related to the long‐term degradation factors that cumulatively lead to an asset’s end‐of‐life. 6
Health indexing differs from maintenance testing, which emphasizes finding defects and 7
deficiencies that need correction or remediation to keep the asset operating during some time 8
period. 9
10
The Health Index formulation developed for Station Transformers is provided as an example of 11
the method. 12
13
The condition criteria shown in Table 1 are weighted based on their importance in determining 14
the transformer’s end‐of‐life. For example, those that relate to primary functions of the asset 15
receive higher weights than those that relate to more ancillary features and functions. 16
17
For purposes of formulating the Health Index, a particular piece of equipment is assessed and 18
assigned a numeric vale for each of the condition criteria. This value was based on reviews of 19
inspection records and diagnostic test reports extracted from THESL’s databases. In assessing 20
the information available against end‐of‐life criteria, condition values of 0 to 4 were assigned 21
with the following general meanings: 22
• “4” means the component is in “as new” condition; 23
• “3” means the component has some minor problems or evidence of aging; 24
• “2” means the component has many minor problems or a major problem that 25
requires attention; 26
• “1” means the component has many problems and the potential for major failure; 27
and 28
• “0” means the component has completely failed or is damaged/degraded beyond 29
repair. 30

Toronto Hydro‐Electric System Limited EB‐2012‐0064
Tab 4 Schedule B11
ORIGINAL
ICM Project ATS and RPB Segment
26
1
These condition rating numbers (i.e., 4, 3, etc.) are multiplied by the assigned weights to 2
compute weighted scores for each condition criteria. The weighted scores are totalled for each 3
transformer. Because of the importance of the DGA tests, if any of the tests scored a “0”, then 4
the Health Index was divided by 2. 5
6
Totalled scores are used in calculating final Health Indices for each transformer. For each 7
component, the Health Index calculation involves dividing its total condition score by its 8
maximum condition score, then multiplying by 100. This step normalizes scores by producing a 9
number from 0‐100 for each transformer. For example, a transformer in perfect condition 10
would have a Health Index of 100 while a completely degraded transformer would have a Health 11
Index of 0. 12
13
Table 1 shows the condition criteria, weightings, condition ratings, plus the total possible 14
maximum score for each member of this asset class. 15
16
Table 1: Transformer Health Index Formulation 17
# Transformer
Condition Criteria
Weight Factors Maximum
Score
1 Bushing Condition 1 4,3,2,1,0 4
2 Oil Leaks 1 4,3,2,1,0 4
3 Main Tank/Cabinets and Controls 1 4,3,2,1,0 4
5 Radiators/Cooling System 1 4,3,2,1,0 4
6 Foundation/Support Steel/Ground 1 4,3,2,1,0 4
7 Overall Power Transformer 2 4,3,2,1,0 8
8 DGA Oil Analysis* 4 4,3,2,1,0 16
11 Oil Quality Test 3 4,3,2,1,0 12
12 Thermograph (IR) 2 4,3,2,1,0 8
Max Score= 64, HI = 100*Score/Max. 18
*In the case of a score of “0”, overall Health Index is divided by 2 19

Toronto Hydro‐Electric System Limited EB‐2012‐0064
Tab 4 Schedule B11
ORIGINAL
ICM Project ATS and RPB Segment
27
1
After performing the steps described above, the Health Index scale shown below was used to 2
determine the overall condition of the transformer asset class. 3
4
Table 2: Health Index Scale for Transformers 5
Health
Index
Condition Description Requirements
85 ‐ 100 Very Good Some ageing or minor
deterioration of a limited
number of components
Normal maintenance
70 – 85 Good Significant deterioration of
some components
Normal maintenance
50 – 70 Fair Widespread significant
deterioration or serious
deterioration of specific
components
Increase diagnostic testing, possible
remedial work or replacement
needed depending on criticality
30 – 50 Poor Widespread serious
deterioration
Start planning process to replace or
rebuild considering risk and
consequences of failure
0 – 30 Very Poor Extensive serious deterioration At end‐of‐life, immediately assess
risk; replace or rebuild based on
assessment


![MfE ICM Final Report 2010 06 28 Appendices[1] · Appendix A Project scope, ... reviewing unpublished ICM plans and projects 2. prioritising information for review 3. considering recent](https://static.fdocuments.in/doc/165x107/5e8926d2ede34906a9212db6/mfe-icm-final-report-2010-06-28-appendices1-appendix-a-project-scope-reviewing.jpg)