Hydrogeology, Hydraulic Properties, and Water Quality of ...
9
Hydrogeology, Hydraulic Properties, and Water Quality of the Surficial and Brunswick Aquifer Systems, Northern Camden County, Georgia, October– December 2003 By Sherlyn Priest INTRODUCTION The Upper Floridan aquifer is the principal source of water in the coastal area of Georgia. Declining water levels and local - ized occurrences of saltwater contamination have resulted in regulators restricting withdrawals from the aquifer in portions of the coastal area, and have prompted interest in developing supplemental sources of ground-water supply. These supple - mental sources of water include the surficial aquifer system, the Brunswick aquifer system, and the Lower Floridan aquifer. T he U.S. Geological Survey (USGS) — in cooperation with Camden County and the Georgia Department of Natural Resources, Environmental Protection Division (GaEPD) — conducted an evaluation of the potential for alternative sources of ground water at a site located near Waverly in the northern part of Camden County. The purpose of this study was to cal - culate the hydraulic properties and collect water-quality data for the confined zone of the surficial aquifer system (confined surficial aquifer) and for the upper Brunswick aquifer of the Brunswick aquifer system. The scope of this study included construction of test wells, collection of lithologic cuttings, borehole geophysical logging, aquifer testing and subsequent analyses, and water-quality sampling and analysis. These data are important for the successful development and management of ground-water resources in the county. Description of Study Area The site is located in northern Camden County, Georgia, in the Coastal Plain physiographic province, and is about 13 miles southwest of the city of Brunswick and 1 mile east of the city of Waverly (maps at right and facing page). Land use in the area primarily is forest. Topographic relief across the area is low, with approximate land-surface altitude of 20 feet (ft) above North American Vertical Datum of 1988 (NAVD 88). The climate in the area is mild with a mean annual temper- ature of 69.5 degrees Fahrenheit at Brunswick National Weather Station (National Oceanic Atmospheric Adminis - tration, 2002). For the 30-year period 1971– 2000, average monthly precipitation ranged from 2.49 inches per month during November to 6.50 inches per month during August, and annual precipitation averaged 49.42 inches (National Oceanic Atmospheric Administration, 2002). Method of Study To better identify the water-bearing capability and lithology of the surficial and Brunswick aquifer systems, three wells were drilled. One well was completed in the confined surficial aquifer (32G048), and a second well was completed in the upper Brunswick aquifer (32G047). A third well (32G046) was drilled in the lower Brunswick aquifer; how- ever, this well was not completed nor tested because of an obstruction in the well. Lithologic cuttings and borehole geophysical logs were collected from well 32G046. In the other two wells, background water-level monitoring and aqui - fer testing were performed and water-quality samples were collected and analyzed. The wells completed in the confined surficial and upper Brunswick aquifers partially penetrate the aquifer. Wells 32G048, 32G047, and 32G046 were drilled Waverly B runswick Test s ite 25 MILE S 0 12.5 25 KILOMETERS 0 12.5 Base modified from U.S . Geological S urvey 1:2,000,000-scale Digital Line Graph data Savannah N A t l a n t i c O c e a n CHATHAM BRYAN LIBERTY LONG MCINTOSH WAYNE GLYNN BRANTLEY CAMDEN Map area GEORGIA 94 Ground-Water Conditions and Studies in Georgia, 2002– 03 Waverly test site, northern Camden County, Georgia. Any use of trade, product, or firm names in this publication is for descriptive purposes only and does not imply endorsement by the U.S. Government.
Transcript of Hydrogeology, Hydraulic Properties, and Water Quality of ...

Hydrogeology, Hydraulic Properties, and Water Quality of the Surficial and Brunswick Aquifer Systems, Northern Camden County, Georgia, October– December 2003
By Sherlyn Priest
INTRODUCTIONThe Upper Floridan aquifer is the principal source of water in the coastal area of Georgia. Declining water levels and local-ized occurrences of saltwater contamination have resulted in regulators restricting withdrawals from the aquifer in portions of the coastal area, and have prompted interest in developing supplemental sources of ground-water supply. These supple-mental sources of water include the sur�cial aquifer system, the Brunswick aquifer system, and the Lower Floridan aquifer.
T he U.S. Geological Survey (USGS) — in cooperation with Camden County and the Georgia Department of Natural Resources, Environmental Protection Division (GaEPD) — conducted an evaluation of the potential for alternative sources of ground water at a site located near Waverly in the northern part of Camden County. The purpose of this study was to cal-culate the hydraulic properties and collect water-quality data for the con�ned zone of the sur�cial aquifer system (con�ned sur�cial aquifer) and for the upper Brunswick aquifer of the Brunswick aquifer system. The scope of this study included construction of test wells, collection of lithologic cuttings, borehole geophysical logging, aquifer testing and subsequent analyses, and water-quality sampling and analysis. These data are important for the successful development and management of ground-water resources in the county.
Description of Study Area
The site is located in northern Camden County, Georgia, in the Coastal Plain physiographic province, and is about 13 miles southwest of the city of Brunswick and 1 mile east of the city of Waverly (maps at right and facing page). Land use in the area primarily is forest. Topographic relief across the area is low, with approximate land-surface altitude of 20 feet (ft) above North American Vertical Datum of 1988 (NAVD 88). The climate in the area is mild with a mean annual temper- ature of 69.5 degrees Fahrenheit at Brunswick National Weather Station (National Oceanic Atmospheric Adminis-tration, 2002). For the 30-year period 1971– 2000, average monthly precipitation ranged from 2.49 inches per month during November to 6.50 inches per month during August, and annual precipitation averaged 49.42 inches (National Oceanic Atmospheric Administration, 2002).
Method of Study
To better identify the water-bearing capability and lithology of the sur�cial and Brunswick aquifer systems, three wells
were drilled. One well was completed in the con�ned sur�cial aquifer (32G048), and a second well was completed in the upper Brunswick aquifer (32G047). A third well (32G046) was drilled in the lower Brunswick aquifer; how-ever, this well was not completed nor tested because of an obstruction in the well. Lithologic cuttings and borehole geophysical logs were collected from well 32G046. In the other two wells, background water-level monitoring and aqui-fer testing were performed and water-quality samples were collected and analyzed. The wells completed in the con�ned sur�cial and upper Brunswick aquifers partially penetrate the aquifer. Wells 32G048, 32G047, and 32G046 were drilled
Waverly
B runswick
Tests ite
25 MILE S0 12.5
25 K ILOME T E R S0 12.5
B ase modified from U.S . G eological S urvey1:2,000,000-scale Digital Line G raph data
Savannah
N
Atlan
ticOcean
CHATHAMBRYAN
LIBERTY
LONG
MCINTOSHWAYNE
GLYNN
BRANTLEY
CAMDEN
Maparea
G E OR G IA
94 Ground-Water Conditions and Studies in Georgia, 2002– 03
Waverly test site, northern Camden County, Georgia.
Any use of trade, product, or �rm names in this publication is for descriptive purposes only and does not imply endorsement by the U.S. Government.

during November 2002 – February 2003 using standard mud-rotary techniques. The table below presents the well construc-tion information.
On completion of the deepest hole (well 32G046), borehole geophysical logs were collected that included natural-gamma radiation, spontaneous potential, lateral resistivity, short- and long-normal resistivity, and caliper. The borehole geophysical
logs and lithologic cuttings were used to select casing depth and screened intervals for each well. Natural-gamma radiation and electric logs were used to support correlation of strati-graphic units and identify water-bearing zones. Lithologic cuttings were collected throughout the drilling of well 32G046 and used to help determine the location of the A-, B-, and C-marker horizons. These markers are distinct stratigraphic horizons that are used to identify the tops of the upper Bruns-wick, lower Brunswick, and Upper Floridan aquifers, respec-tively, and are identi�ed by a sharp change in radiation in the natural-gamma logs (Clarke and others, 1990). Lithologic and hydrogeologic descriptions for well 32G046 derived from lithologic cuttings and borehole geophysical logs were related to the stratigraphic descripton of a well drilled at St. Marys, Camden County, Georgia (Weems and Edwards, 2001).
Pretest ground-water levels were monitored before the start of each aquifer test using pressure transducers and data loggers. Ground-water levels in well 32G048 were monitored prior to the aquifer test in the con�ned sur�cial aquifer. Additionally, ground-water levels in wells 32G048 and 32G047 were moni-tored prior to the upper Brunswick aquifer test.
Pretest pumping was performed to verify that wells 32G048 and 32G047 were fully developed and to determine the opti-mum pumping rate for the 24-hour pumping phase of the aqui-fer tests. This pumping also ensured that the drawdown in the wells would not exceed the depth of the pressure transducer or induce cavitation (bubbling). During the pretest pumping and subsequent aquifer test, ground-water levels were measured and recorded using an In-Situ, Inc. Hermit 3000™ data log-ger with 100-pound-per-square-inch (psi) pressure transduc-ers in wells 32G047 and 32G048 and with a 20-psi pressure transducer con�ned sur�cial aquifer well 32G048 during the upper Brunswick aquifer test. Veri�cation measurements were made using dedicated electric tapes to con�rm proper opera-tion of the pressure transducers and data logger. Atmospheric pressure was measured with an internal pressure sensor in the data logger. Starting at time equals 0, a sampling interval was programmed into the data logger to facilitate the rapid col-lection of early time data, using a logarithmic scale that was decreased to a 1-minute interval.
Technical Highlights 95
Spr ing Blu� Rd
Stat
e Hw
y 17 Brunswick
Waverly
NO T TO SCALE
NO T TO SCALE
Test site
Wa verly FireStationNo. 17
noitatsbuS
Pumphouse
We ll 32G046We ll 32G047We ll 32G048
A.
B.
N
Inte
rsta
te 9
5
(A) Generalized location of test site, and (B) test site showing relative locations of wells, Waverly test site, Camden County, Georgia.
Well location and construction for aquifer test at Waverly test site, Camden County, Georgia [bls, below land surface; PW, pumping well; —, not applicable]
Well name Other identifier
Land surface
elevation(feet)
Well depth
(feet bls)
Casing depth
(feet bls)
Casingdiameter(inches)
Top of screen or open interval
(feet bls)
Bottom of screen or
open interval(feet bls)
Type of opening
Screen-diameter Aquifer
32G048 Waverly Fire Station PW-2
20 195 110 6 110 190 Screened 4 Con�ned sur�cial
32G047 Waverly Fire Station PW-1
20 295 240 6 250 290 Screened 4 Upper Brunswick
32G046 Waverly Fire Station 20 455* 370 6 — — Open 6 Lower Brunswick
* Well collapsed at 430 feet
96 Ground-Water Conditions and Studies in Georgia, 2002– 03
A 2½-horsepower submersible pump was used for constant ground-water withdrawals for wells 32G048 and 32G047. Approximately 60 ft of 4-inch-diameter hose was used to transport water away from the wells. Ground-water discharge was measured using a Model FL-30005 Closed Pipe System Water Measurement Flowmeter. An appropriate discharge was determined during pretest pumping and was constantly main-tained throughout the duration of the aquifer tests.
An aquifer test was performed in the con�ned sur�cial aquifer using well 32G048 and in the upper Brunswick aquifer using well 32G047. Data from aquifer tests were analyzed to calcu-late transmissivity and hydraulic conductivity for the afore-mentioned water-bearing units.
During the aquifer tests, the magnitude of water-level �uc-tuation produced by changes in atmospheric pressure, local pumping, or tidal oscillations was minor in comparison to the amount of drawdown induced by the pump. Therefore, the data used in the analysis of the aquifer tests were not corrected for atmospheric pressure, local pumping, or tidal e�ects.
Drawdown and recovery data were analyzed using the non-equilibrium method of Theis (1935), the modi�ed nonequi-librium analytical model of Cooper and Jacob (1946), and the Hantush and Jacob (1955) analytical model for nonsteady radial �ow in an in�nite leaky aquifer. The Hantush and Jacob (1955) method accounts for leakage, but does not di�erentiate between leakage from above or below the aquifer.
Water samples were collected after several hours of pumping when �eld properties were stable. Field properties were mea-sured in a �ow-through chamber using DataSonde® Hydrolab® 4 Water Quality multiprobe following USGS protocols (Wilde and Radtke, 1999). Whole-water samples were preserved and stored in polyethylene or acid-rinsed bottles and sent by over-night carrier to the USGS National Water Quality Laboratory, Denver, Colorado (NWQL). Water samples were collected from wells 32G048 and 32G047 and analyzed for major ions, nutrients, metals, and radionuclides. Based on major ionic composition, results from the chemical analyses were used to describe the ground-water quality and to di�erentiate the chemical quality between the water-bearing units.
Previous Investigations
Clarke and others (1990) de�ned the sur�cial and upper and lower Brunswick aquifers and described their water-bearing characteristics. Sharpe and others (1998) described the results of an aquifer test in the Miocene-aged sediments in Camden
County, Georgia. Steele and McDowell (1998) mapped the permeable thickness and areal distribution of the upper and lower Brunswick aquifers. Leeth (1999) described the hydrogeology of the sur�cial aquifer at Naval Submarine Base Kings Bay in Camden County, Georgia. More recent investi-gations include Gill (2001), who described the development potential of the upper and lower Brunswick aquifers in Glynn and Bryan Counties, Georgia; Radtke and others (2001), who described the results of an engineering assessment of the “Mio-cene” aquifer system in coastal Georgia; Weems and Edwards (2001), who described the geology of Oligocene and younger deposits in coastal Georgia; and Clarke (2003), who described the sur�cial and Brunswick aquifer systems as alternative sources of ground water.
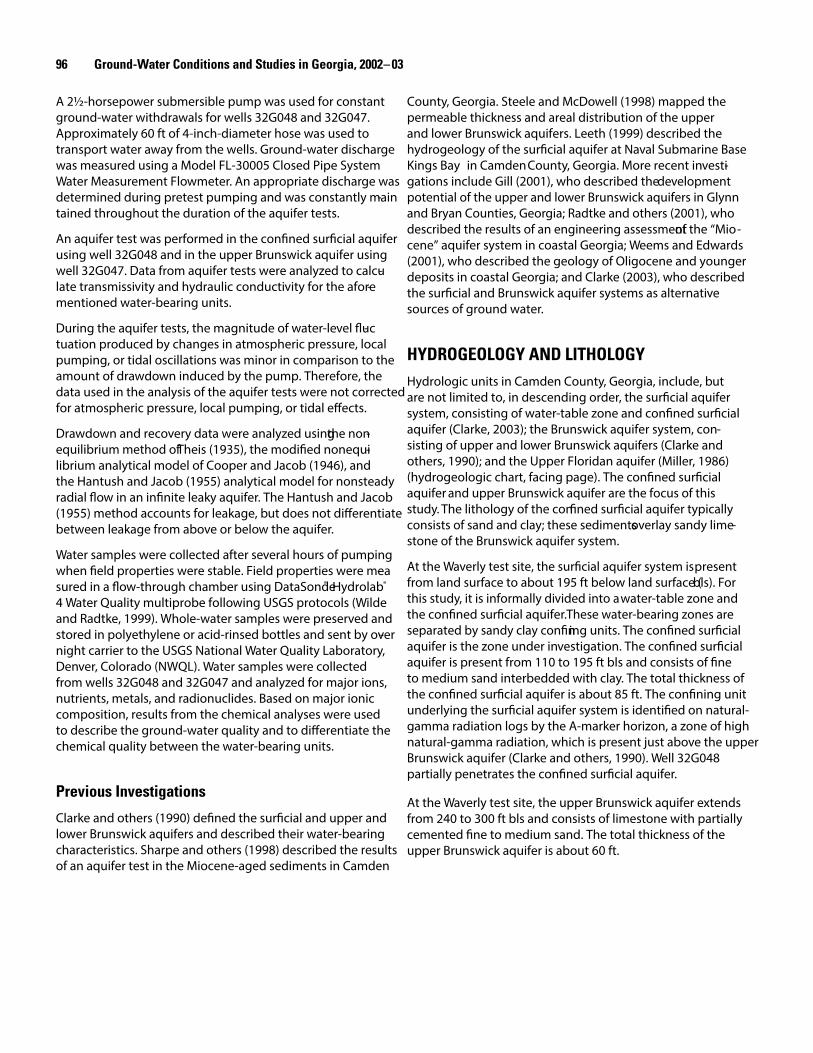
HYDROGEOLOGY AND LITHOLOGYHydrologic units in Camden County, Georgia, include, but are not limited to, in descending order, the sur�cial aquifer system, consisting of water-table zone and con�ned sur�cial aquifer (Clarke, 2003); the Brunswick aquifer system, con-sisting of upper and lower Brunswick aquifers (Clarke and others, 1990); and the Upper Floridan aquifer (Miller, 1986) (hydrogeologic chart, facing page). The con�ned sur�cial aquifer and upper Brunswick aquifer are the focus of this study. The lithology of the con�ned sur�cial aquifer typically consists of sand and clay; these sediments overlay sandy lime-stone of the Brunswick aquifer system.
At the Waverly test site, the sur�cial aquifer system is present from land surface to about 195 ft below land surface (bls). For this study, it is informally divided into a water-table zone and the con�ned sur�cial aquifer. These water-bearing zones are separated by sandy clay con�ning units. The con�ned sur�cial aquifer is the zone under investigation. The con�ned sur�cial aquifer is present from 110 to 195 ft bls and consists of �ne to medium sand interbedded with clay. The total thickness of the con�ned sur�cial aquifer is about 85 ft. The con�ning unit underlying the sur�cial aquifer system is identi�ed on natural-gamma radiation logs by the A-marker horizon, a zone of high natural-gamma radiation, which is present just above the upper Brunswick aquifer (Clarke and others, 1990). Well 32G048 partially penetrates the con�ned sur�cial aquifer.
At the Waverly test site, the upper Brunswick aquifer extends from 240 to 300 ft bls and consists of limestone with partially cemented �ne to medium sand. The total thickness of the upper Brunswick aquifer is about 60 ft.

–50
–100
0
50
100
150
0
50
100
150
–50–100
050
100150
�ne
sand
Lim
esto
ne w
ithph
osph
atic
sand
Sand
y lim
esto
ne
Lim
esto
ne
Con�
ning
unit
Upp
er
Brun
swic
kaq
uife
r
Con�
ning
unit
Low
erBr
unsw
ick
aqui
fer
Upp
erFl
orid
anaq
uife
r
Mar
ksH
ead
Suw
anne
eLi
mes
tone
Oca
la
Para
chuc
la
Tige
r Le
ap
Eben
ezer
Satil
laPl
ioce
nean
d yo
unge
r
Mio
cene
Olig
ocen
e
Eoce
ne
500
450
400
350
300
250
200
150
10050
Phos
phat
ic
0
100
200
300
400
500600100
150
200
Sand
y cl
ay
Clay
ey
�ne
tom
ediu
msa
nd
Sand
ylim
esto
ne
Phos
phat
icsa
ndy
clay
Wat
er-
tabl
ezo
ne
Con�
ned
su�c
ial
aqui
fer
SURFICIAL AQUIFER SYSTEM
Con�
ning
unit
Sand
y cl
ay
Sand
y cl
ay
Con�
ning
uni
t
Wel
l 32G
047
Wel
l 32G
048
Nat
ural
Gam
ma,
in A
mer
ican
Pet
role
um
Inst
itute
Uni
ts
Calip
er,
in in
ches
Spon
tane
ous
pote
nita
l, in
mill
ivol
ts
Late
ral r
esis
tivity
, in
ohm
-met
er
Shor
t nor
mal
resi
stiv
ity,
in o
hm-m
eter
Long
nor
mal
resi
stiv
ity,
in o
hm-m
eter
Hyd
roge
olog
ic u
nits
Dep
th,
in fe
etFo
rmat
ion
Lith
olog
yW
ell 3
2G04
6Se
ries
GEO
LOG
Y1G
EOPH
YSIC
AL
LOG
SH
YDRO
GEO
LOG
Y
1M
odi�
ed fr
om W
eem
s an
d Ed
war
ds, 2
001
C-m
arke
r (??
)
B-m
arke
r
A-m
arke
r
Scal
eab
ove
Scal
ebe
low
Scal
eab
ove
Scal
ebe
low
050
911
13
100
–50
6
7
8
Coo
saw
atch
ie
Screen
BRUNSWICK AQUIFER SYSTEM
Gen
eral
ized
lith
olog
ic, g
eolo
gic,
and
hyd
rolo
gic
desc
riptio
ns o
f stu
dy a
rea,
Wav
erly
test
site
, Cam
den
Coun
ty, G
eorg
ia.
Technical Highlights 97
HYDRAULIC PROPERTIESEach single-well aquifer test was designed to provide data to calculate the hydraulic properties of the con�ned sur�cial and upper Brunswick aquifers. The aquifer tests consisted of a pretest step-drawdown test, background ground-water level monitoring prior to the test, constant discharge pumping test, and post-test water-level monitoring.
Analysis of drawdown data using graphs aid in the determina-tion of the accuracy of estimated hydraulic properties. Typically, the early part of a drawdown curve is steep showing well-storage e�ects, the middle part follows a straight line as water enters the well from the aquifer, the latter part continues along a straight line until the aquifer reaches steady-state conditions. A change in the slope in the latter part of the curve represents either recharge (leakage) to the aquifer or contact with an imperme-able boundary. Leakage or recharge would cause drawdown to decrease, while contact with an impermeable boundary would cause drawdown to increase. Early termination of a test would result in an underestimation of hydraulic properties.
Confined Surficial Aquifer
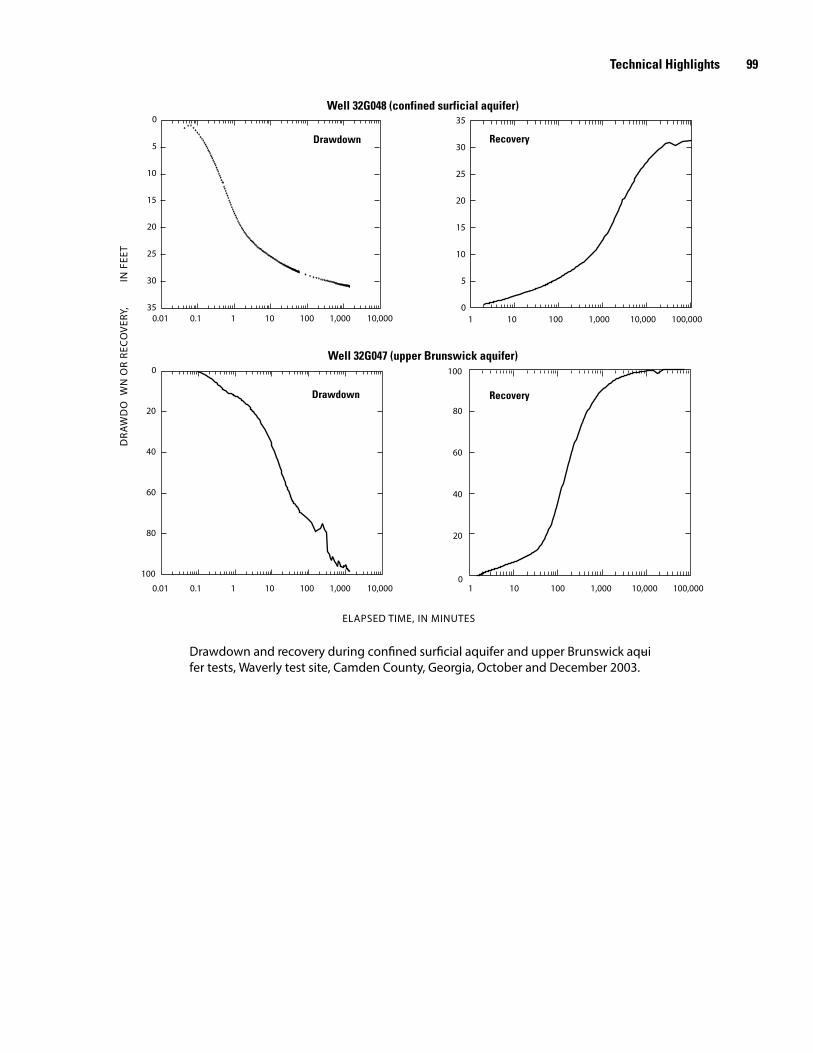
The con�ned sur�cial aquifer single-well aquifer test con-sisted of pumping and monitoring well 32G048. Prior to the con�ned sur�cial aquifer test, ground-water levels were monitored for 62 days. The test was conducted December 9 –11, 2003, and consisted of 24 hours of constant pumping and about 26 hours of ground-water-level recovery. During the pretest period (October 7– December 7, 2003), the water-level ranged from 9.48 to 10.5 ft bls. Average discharge during the test was 47.5 gallons per minute (gal/min), with a total drawdown of 30.8 ft bls after 24 hours of pumping (con�ned sur�cial aquifer graphs, facing page).
98 Ground-Water Conditions and Studies in Georgia, 2002– 03
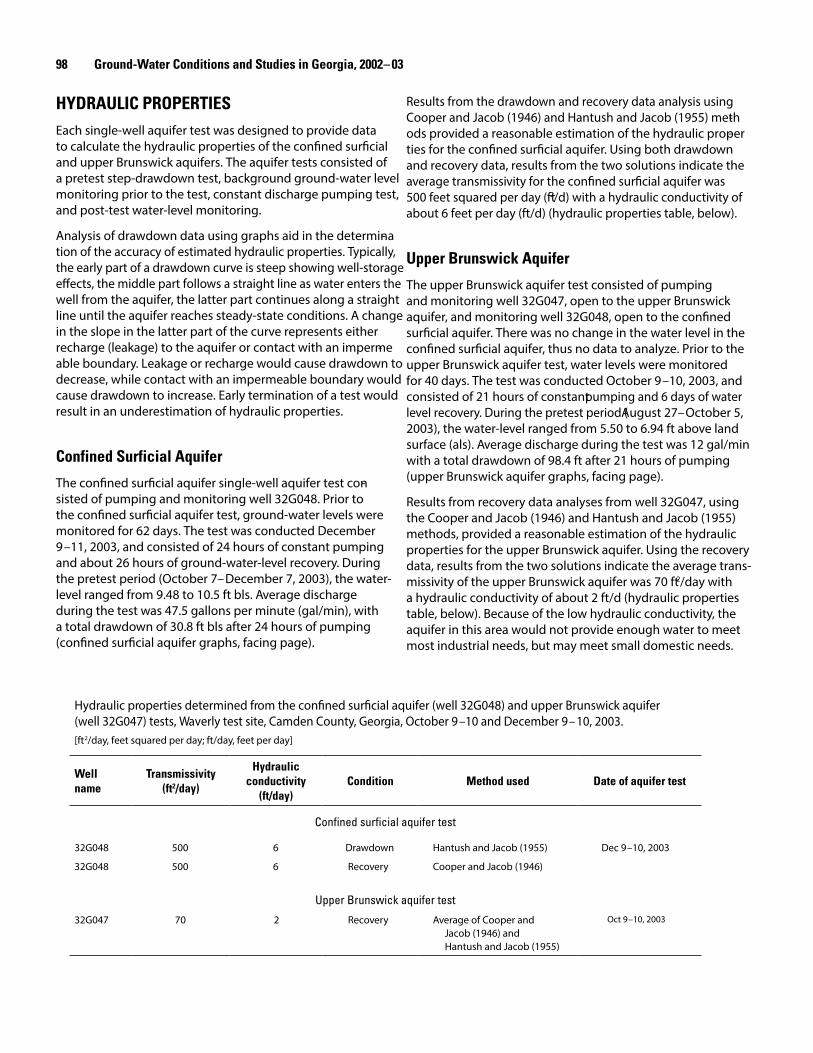
Results from the drawdown and recovery data analysis using Cooper and Jacob (1946) and Hantush and Jacob (1955) meth-ods provided a reasonable estimation of the hydraulic proper-ties for the con�ned sur�cial aquifer. Using both drawdown and recovery data, results from the two solutions indicate the average transmissivity for the con�ned sur�cial aquifer was 500 feet squared per day (ft2/d) with a hydraulic conductivity of about 6 feet per day (ft/d) (hydraulic properties table, below).
Upper Brunswick Aquifer
The upper Brunswick aquifer test consisted of pumping and monitoring well 32G047, open to the upper Brunswick aquifer, and monitoring well 32G048, open to the con�ned sur�cial aquifer. There was no change in the water level in the con�ned sur�cial aquifer, thus no data to analyze. Prior to the upper Brunswick aquifer test, water levels were monitored for 40 days. The test was conducted October 9 –10, 2003, and consisted of 21 hours of constant pumping and 6 days of water level recovery. During the pretest period (August 27– October 5, 2003), the water-level ranged from 5.50 to 6.94 ft above land surface (als). Average discharge during the test was 12 gal/min with a total drawdown of 98.4 ft after 21 hours of pumping (upper Brunswick aquifer graphs, facing page).
Results from recovery data analyses from well 32G047, using the Cooper and Jacob (1946) and Hantush and Jacob (1955) methods, provided a reasonable estimation of the hydraulic properties for the upper Brunswick aquifer. Using the recovery data, results from the two solutions indicate the average trans-missivity of the upper Brunswick aquifer was 70 ft2/day with a hydraulic conductivity of about 2 ft/d (hydraulic properties table, below). Because of the low hydraulic conductivity, the aquifer in this area would not provide enough water to meet most industrial needs, but may meet small domestic needs.
Hydraulic properties determined from the con�ned sur�cial aquifer (well 32G048) and upper Brunswick aquifer (well 32G047) tests, Waverly test site, Camden County, Georgia, October 9 –10 and December 9 – 10, 2003. [ft2/day, feet squared per day; ft/day, feet per day]
Well name
Transmissivity (ft2/day)
Hydraulic conductivity
(ft/day)Condition Method used Date of aquifer test
Confined surficial aquifer test
32G048 500 6 Drawdown Hantush and Jacob (1955) Dec 9 –10, 2003
32G048 500 6 Recovery Cooper and Jacob (1946)
Upper Brunswick aquifer test
32G047 70 2 Recovery Average of Cooper and Jacob (1946) and Hantush and Jacob (1955)
Oct 9 –10, 2003
DRA
WD
OW
N O
R RE
CO
VER
Y, I
N F
EET
0
20
40
60
80
100
100
80
60
40
20
0Well 32G047 (upper Brunswick aquifer)
Well 32G048 (confined surficial aquifer)
35
30
25
20
15
10
5
0
0.10.01 100 1,000 10,0000
5
10
15
20
25
30
35
101
0.10.01 100 1,000 10,000101 100 1,000 10,000 100,000101
100 1,000 10,000 100,000101
ELAPSED TIME, IN MINUTES
Drawdown Recovery
RecoveryDrawdown
Drawdown and recovery during con�ned sur�cial aquifer and upper Brunswick aqui-fer tests, Waverly test site, Camden County, Georgia, October and December 2003.
Technical Highlights 99

GROUND-WATER QUALITY
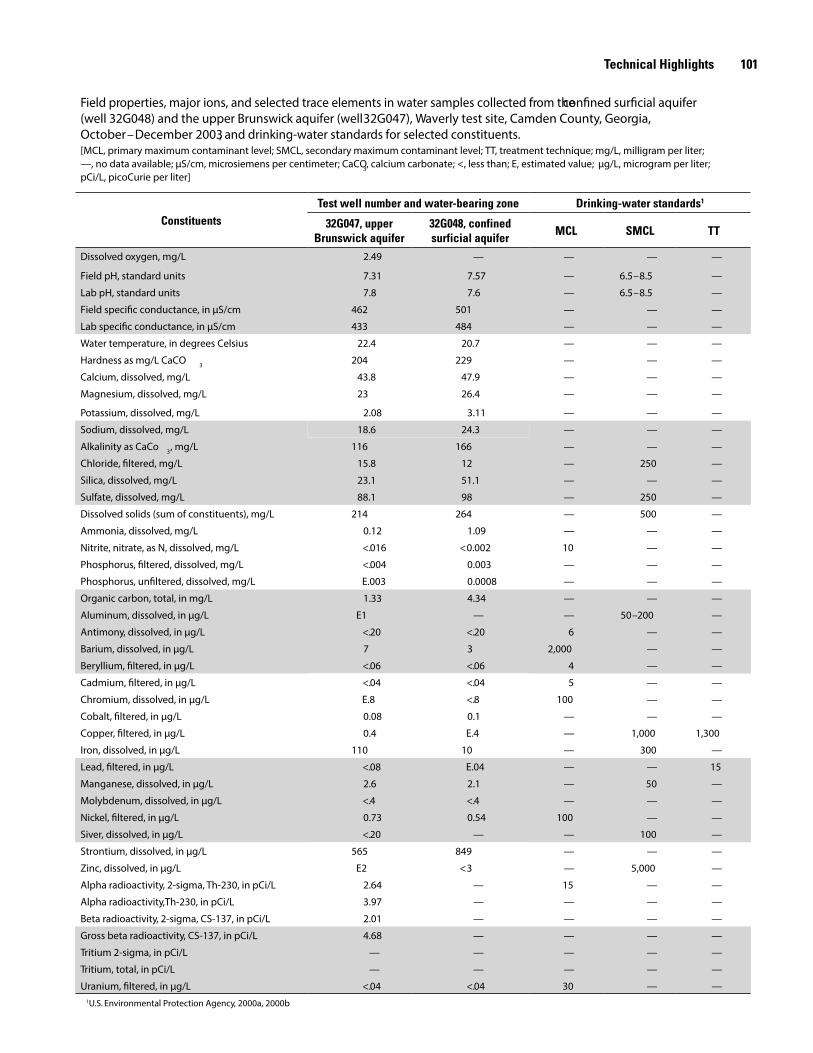
Results of the chemical analysis of ground-water samples obtained from wells completed in the con�ned sur�cial and upper Brunswick aquifers were used to compare the geo-chemical variability of ground water in the two aquifers. Water samples from wells 32G048 (con�ned sur�cial aqui-fer) and 32G047 (upper Brunswick aquifer) were analyzed for major ions, metals, total organic carbon, nutrients, and radionuclide material (water-quality table, facing page). Field properties including pH, speci�c conductance, and water temperature were measured onsite prior to sample collection. Concentrations of constituents were compared to the U.S. Environmental Protection Agency (USEPA) (2000a, 2000b) maximum contaminant levels (formerly known as primary maximum contaminant level) and secondary standards (for-merly known as secondary maximum contaminant level) for drinking water. Additionally, these data were compared to the GaEPD (1997a, 1997b) regulations for drinking water.
Graphical methods for the presentation of water-quality data provide a means of distinguishing the chemical properties of ground water from di�erent water-bearing zones. A trilinear diagram showing the percent composition of selected major cations and anions, as well as dissolved solid concentrations of those constituents for the con�ned sur�cial and upper Brunswick aquifers is shown at right. As the diagram shows, water from both aquifers is a magnesium-carbonate-bicarbon-ate type with water from the con�ned sur�cial aquifer having a higher dissolved solids concentration. Hardness of water in both aquifers is more than 200 milligrams per liter (mg/L) of calcium carbonate (CaCO3) (based on the sum of milliequiva-lent of calcium, magnesium, barium, and strontium), and is categorized as very hard (Durfor and Becker 1964).
Water from the con�ned sur�cial aquifer has no major ionic concentrations that exceed drinking-water standards and the pH value of 7.6 is within the range of 6.5 – 8.5 for second-ary drinking-water standards. Tritium was analyzed in water samples from the con�ned sur�cial aquifer to determine if water was entering the aquifer from surface recharge. Tritium in the water is less than the reporting limit of 5.7 picoCu-ries per liter, indicating no leakage. Water from the con�ned
sur�cial aquifer has a dissolved chloride concentration of 12.0 mg/L, speci�c conductance of 484 microsiemens per centimeter (µS/cm), and total organic carbon concentration of 4.34 mg/L.
Water from the upper Brunswick aquifer has no major ionic concentrations exceeding drinking-water standards, and the pH value of 7.8 is within the range of 6.5 – 8.5 for secondary drinking-water standards. Water from the upper Brunswick aquifer has a dissolved chloride concentration of 15.8 mg/L, speci�c conductance of 433 µS/cm, and total organic carbon concentration of 1.33 mg/L.
C ALC IUM
100
80 60 40 20 00
20
40
60
80
100
MAG
NE S IU
M
0
2040
6080
100
SOD
IUM
PLUS
POTAS S IU
M
C HLOR IDE0 20 40 60 80 100
10080
6040
200
CAR
BON
ATEPLU
SB IC
ARBO
NATE
100
80
60
40
20
0
SULFATE
0
2040
6080
100
S ULF
ATEPLU
SC
HLO
RID
E
020
4060
80100
CALC
IUM
PLUS
MAG
NE S IU
M
100
8060
4020
0
10080
6040
200
C A T IONS A NIONS
PE RC
ENT
PE RC
ENT
32G 047 (upper B runswick aquifer)
32G 048 (confined zone)
P E R C E NT OF T OT A L MIL L IE QUIV A L E NT S P E R L IT E R
Tes t well and s ite name Dis s olved s olids , inmilligrams per liter
E XP L A NAT ION
100 150
100 Ground-Water Conditions and Studies in Georgia, 2002 – 03
Percent composition of major ionic constituents and dis-solved solids in water from the con�ned sur�cial and the upper Brunswick aquifers, Waverly test site, Camden County, Georgia, October 2003.
Field properties, major ions, and selected trace elements in water samples collected from the con�ned sur�cial aquifer (well 32G048) and the upper Brunswick aquifer (well 32G047), Waverly test site, Camden County, Georgia, October – December 2003, and drinking-water standards for selected constituents.[MCL, primary maximum contaminant level; SMCL, secondary maximum contaminant level; TT, treatment technique; mg/L, milligram per liter; —, no data available; µS/cm, microsiemens per centimeter; CaCO3, calcium carbonate; <, less than; E, estimated value; µg/L, microgram per liter; pCi/L, picoCurie per liter]
ConstituentsTest well number and water-bearing zone Drinking-water standards1
32G047, upper Brunswick aquifer
32G048, confined surficial aquifer
MCL SMCL TT
Dissolved oxygen, mg/L 2.49 — — — —
Field pH, standard units 7.31 7.57 — 6.5 – 8.5 —
Lab pH, standard units 7.8 7.6 — 6.5 – 8.5 —
Field speci�c conductance, in µS/cm 462 501 — — —
Lab speci�c conductance, in µS/cm 433 484 — — —
Water temperature, in degrees Celsius 22.4 20.7 — — —
Hardness as mg/L CaCO 3 204 229 — — —
Calcium, dissolved, mg/L 43.8 47.9 — — —
Magnesium, dissolved, mg/L 23 26.4 — — —
Potassium, dissolved, mg/L 2.08 3.11 — — —
Sodium, dissolved, mg/L 18.6 24.3 — — —
Alkalinity as CaCo 3, mg/L 116 166 — — —
Chloride, �ltered, mg/L 15.8 12 — 250 —
Silica, dissolved, mg/L 23.1 51.1 — — —
Sulfate, dissolved, mg/L 88.1 98 — 250 —
Dissolved solids (sum of constituents), mg/L 214 264 — 500 —
Ammonia, dissolved, mg/L 0.12 1.09 — — —
Nitrite, nitrate, as N, dissolved, mg/L < . 016 < 0.002 10 — —
Phosphorus, �ltered, dissolved, mg/L < . 004 0.003 — — —
Phosphorus, un�ltered, dissolved, mg/L E.003 0.0008 — — —
Organic carbon, total, in mg/L 1.33 4.34 — — —
Aluminum, dissolved, in µg/L E1 — — 50 – 200 —
Antimony, dissolved, in µg/L < . 20 < . 20 6 — —
Barium, dissolved, in µg/L 7 3 2,000 — —
Beryllium, �ltered, in µg/L < . 06 < . 06 4 — —
Cadmium, �ltered, in µg/L < . 04 < . 04 5 — —
Chromium, dissolved, in µg/L E.8 < . 8 100 — —
Cobalt, �ltered, in µg/L 0.08 0.1 — — —
Copper, �ltered, in µg/L 0.4 E.4 — 1,000 1,300
Iron, dissolved, in µg/L 110 10 — 300 —
Lead, �ltered, in µg/L < . 08 E.04 — — 15
Manganese, dissolved, in µg/L 2.6 2.1 — 50 —
Molybdenum, dissolved, in µg/L < . 4 < . 4 — — —
Nickel, �ltered, in µg/L 0.73 0.54 100 — —
Siver, dissolved, in µg/L < . 20 — — 100 —
Strontium, dissolved, in µg/L 565 849 — — —
Zinc, dissolved, in µg/L E2 < 3 — 5,000 —
Alpha radioactivity, 2-sigma, Th-230, in pCi/L 2.64 — 15 — —
Alpha radioactivity,Th-230, in pCi/L 3.97 — — — —
Beta radioactivity, 2-sigma, CS-137, in pCi/L 2.01 — — — —
Gross beta radioactivity, CS-137, in pCi/L 4.68 — — — —
Tritium 2-sigma, in pCi/L — — — — —
Tritium, total, in pCi/L — — — — —
Uranium, �ltered, in µg/L < . 04 < . 04 30 — —1U.S. Environmental Protection Agency, 2000a, 2000b
Technical Highlights 101

102 Ground-Water Conditions and Studies in Georgia, 2002 – 03
REFERENCES CITED
Clarke, J.S., 2003, The sur�cial and Brunswick aquifer systems —Alternative ground-water resources for Coastal Georgia, in Proceedings of the 2003 Georgia Water Re-sources Conference held April 23 –23, 2003, at The Uni-versity of Georgia, K.J. Hatcher (ed), Institute of Ecology, The University of Georgia, Athens, Ga., CD – ROM.
Clarke, J.S., Hacke, C.M., and Peck, M.F., 1990, Geology and ground-water resources of the coastal area of Georgia: Georgia Geologic Survey Bulletin 113, 106 p.
Cooper, H.H., Jr., and Jacob, C.E., 1946, A generalized graphical method for evaluating formation constants and summarizing well-�eld history: Transactions, American Geophysical Union, 27, p. 526 – 534.
Durfor, C.N., and Becker, Edith, 1964, Public water supplies of the 100 largest cities in the United States, 1962: U.S. Geological Survey Water-Supply Paper 1812, 364 p.
Georgia Environmental Protection Division, 1997a, Primary maximum contaminant levels for drinking water: Environ-mental Rule 391-3-5-18, revised October 1997: O�cial Code of Georgia Annotated Statutes, Statue 12-5-170 (Georgia Safe Drinking Water Act), variously paginated.
Georgia Environmental Protection Division, 1997b, Secondary maximum contaminant levels for drinking water: Environ-mental Rule 391-3-5-19, revised October 1997: O�cial Code of Georgia Annotated Statutes, Statue 12-5-170 (Georgia Safe Drinking Water Act), variously paginated.
Gill, H.E., 2001, Development of long-term sustainable water supplies from the Miocene upper and lower Brunswick aquifers, Glynn and Bryan Counties, Georgia, in Proceed-ings of the 2001 Georgia Water Resources Conference, March 26 – 27, 2001, K.J. Hatcher (ed.), Institute of Ecol -ogy, The University of Georgia, Athens, Ga., p. 660 – 664.
Hantush, M.S., and Jacob, C.E, 1955, Non-steady radial �ow in an in�nite leaky aquifer: Transactions of the American Geophysical Union, v. 36, no. 1, p. 95–100.
Leeth, D.C., 1999, Hydrogeology of the sur�cial aquifer in the vicinity of a former land�ll, Naval Submarine Base Kings Bay, Camden County, Georgia: U.S. Geological Survey Water-Resources Investigations Report 98-4246, 28 p.
Miller, J.A., 1986, Hydrogeologic framework of the Floridan aquifer system in Florida and in parts of Georgia, Alabama, and South Carolina: U.S. Geological Survey Professional Paper 1403-B, 91 p.
National Oceanic and Atmospheric Administration, 2002, National Environmental Satellite, Data and Information Service, National Climatic Data Center, Monthly station normals of temperature, precipitation, and heating and cool-ing degree days 1971–2000: Asheville, N.C., no. 81, 28 p.
Radtke, J.S., Hemingway, C.D., and Humphries, Robert, 2001, Engineering assessment of the Miocene aquifer system in coastal Georgia, in Proceedings of the 2001 Georgia Water Resources Conference, March 26–27, 2001, K.J. Hatcher ed., Institute of Ecology, The University of Georgia, Athens, Ga., p. 665 – 668.
Sharpe, Bill, Watson, Sam, and Hodges, R.A., 1998, Aqui -fer performance test report: St. Marys Miocene aquifer, Camden County, Georgia: September 30 – October 6, 1997: Georgia Geologic Survey Project Report 34, 54 p.
Steele, W.M., and McDowell, R.J., 1998, Permeable thickness of the upper and lower Brunswick aquifers, coastal area, Georgia: Georgia Geologic Survey Information Circular 103, 34 p.
Theis, C.V., 1935, The relation between the lowering of the piezometric surface and the rate and duration of discharge of a well using ground-water storage: Transactions of the American Geophysical Union, v. 16, p. 519 – 524.
U.S. Environmental Protection Agency, 2000a, Maximum contaminant levels (Subpart B of part 141, National Primary Drinking-Water Regulations): U.S. Code of Federal Regu-lations, Title 40, parts 100 –149, revised as of July 1, 2000, p. 334 – 560.
U.S. Environmental Protection Agency, 2000b, Maximum contaminant levels (Subpart B of part 143, National Second-ary Drinking-Water Regulations): U.S. Code of Federal Regulations, Title 40, parts 100 –149, revised as of July 1, 2000, p. 612 – 614.
Weems, R.E., and Edwards, L.E., 2001, Geology of Oligo -cene, Miocene, and younger deposits in the coastal area of Georgia: Georgia Geologic Survey Bulletin 131, 124 p.
Wilde, F.D., and Radtke, D.B., 1999, Field measurements, in Wilde, F.D., Radtke, D.B., Gibs, Jacob, and Iwatsubo, R.T., eds., National �eld manual for the collection of water- quality data: Handbooks for the water-resources investi-gations, U.S. Geological Survey, p. 31.