Hydrogeology Laboratory Semester Project: Hydrogeologic ...€¦ · Hydrogeology Laboratory...
10
Hydrogeology Laboratory Semester Project: Hydrogeologic Assessment for CenTex Water Supply, Inc. Matthew M. Uliana, Ph.D. Department of Biology – Geology Program and Aquatic Resources • Texas State University 601 University Drive • San Marcos, TX 78666 • 512-245-7751 • [email protected] Introduction A typical undergraduate hydrogeology class has an associated lab section that covers basic hydrogeology concepts, such as porosity, permeability, aquifer testing, hydrogeologic maps, and groundwater modeling. These concepts are generally presented as a series of independent exercises, with one week devoted to porosity, one to permeability, one to hydraulic gradient, etc. The problem with this mode of presentation is that most students fail to see the connections between the concepts, the applied use of the skills related to the concepts, and the general reason for leaning the material at all. The result is that students generally walk away from the course with little retention of the concepts and associated skills and little appreciation for how the material may be useful to them in their careers. A way to address this problem is through the use of a semester-long project that is presented to the students in the lab sections as a series of exercises that are all applied towards a single project similar to a major project that a hydrogeologist might undertake as a private consultant. Using this format, the individual lab exercises are all presented within the context of a larger project, and the students benefit by seeing how each concept and the skills associated with that concept are used in a real-world setting. In addition, students get an idea of what the consulting world is like, and they receive important experience with technical writing and preparing technical reports. The project presented here is based on a real project performed by the author for a private consulting firm; however, the project location, company names, maps of property boundaries, and some of the data were changed or fabricated for this exercise. This project involves a hydrogeologic assessment of a property for the purpose of determining potential water well yields for future development. The steps incorporated in the project include determination of basic parameters (porosity, storage, permeability), development of a groundwater map, analysis of aquifer test data, development of an analytical model for estimating drawdowns, and preparation of a technical report. This project can be modified in many ways to enhance the experience of the students. Other steps can be added to the project to cover other concepts, such as contaminant transport, numerical groundwater modeling, aquifer recharge, and subsidence. In addition, although all data is provided for the students, actual hand-on laboratory exercises (grain size analysis, permeameter measurements) can be used so that the students can collect their own data. Please note that this exercise does not necessarily reflect the true groundwater or geologic conditions in the study area, and the data included here should not be used to actually evaluate groundwater resources in Central Texas.
-
Upload
truongkien -
Category
Documents
-
view
222 -
download
1
Transcript of Hydrogeology Laboratory Semester Project: Hydrogeologic ...€¦ · Hydrogeology Laboratory...

Hydrogeology Laboratory Semester Project: Hydrogeologic Assessment for CenTex Water Supply, Inc.
Matthew M. Uliana, Ph.D. Department of Biology – Geology Program and Aquatic Resources • Texas State University
601 University Drive • San Marcos, TX 78666 • 512-245-7751 • [email protected]
Introduction A typical undergraduate hydrogeology class has an associated lab section that covers basic hydrogeology concepts, such as porosity, permeability, aquifer testing, hydrogeologic maps, and groundwater modeling. These concepts are generally presented as a series of independent exercises, with one week devoted to porosity, one to permeability, one to hydraulic gradient, etc. The problem with this mode of presentation is that most students fail to see the connections between the concepts, the applied use of the skills related to the concepts, and the general reason for leaning the material at all. The result is that students generally walk away from the course with little retention of the concepts and associated skills and little appreciation for how the material may be useful to them in their careers.
A way to address this problem is through the use of a semester-long project that is presented to the students in the lab sections as a series of exercises that are all applied towards a single project similar to a major project that a hydrogeologist might undertake as a private consultant. Using this format, the individual lab exercises are all presented within the context of a larger project, and the students benefit by seeing how each concept and the skills associated with that concept are used in a real-world setting. In addition, students get an idea of what the consulting world is like, and they receive important experience with technical writing and preparing technical reports.
The project presented here is based on a real project performed by the author for a private consulting firm; however, the project location, company names, maps of property boundaries, and some of the data were changed or fabricated for this exercise. This project involves a hydrogeologic assessment of a property for the purpose of determining potential water well yields for future development. The steps incorporated in the project include determination of basic parameters (porosity, storage, permeability), development of a groundwater map, analysis of aquifer test data, development of an analytical model for estimating drawdowns, and preparation of a technical report.
This project can be modified in many ways to enhance the experience of the students. Other steps can be added to the project to cover other concepts, such as contaminant transport, numerical groundwater modeling, aquifer recharge, and subsidence. In addition, although all data is provided for the students, actual hand-on laboratory exercises (grain size analysis, permeameter measurements) can be used so that the students can collect their own data.
Please note that this exercise does not necessarily reflect the true groundwater or geologic conditions in the study area, and the data included here should not be used to actually evaluate groundwater resources in Central Texas.

2
Project Description and Background Information
CenTex Water Supply, Inc. is a privately owned water supply company in Atascosa County, Texas, that supplies water to several small municipalities near the city of San Antonio. They currently get their water from a reservoir on a local river; however, demand on their supply system is increasing rapidly, and they need to investigate other sources of water, including groundwater.
CenTex currently owns a tract of ranch land in Atascosa County. They would like to put wells on the land and use the well water to supplement their surface water supply. However, before they invest in wells and a delivery system, they want to have some idea of how much water the property will yield. They have contracted you assess the property and give them some idea of the potential yield of their wells. So the basic problem that you, the hydrogeologist, has to solve is this:
How much water can be pumped out of the ground, on this property, at a sustained rate, over the next 50 years without causing an adverse impact on the aquifer surrounding the property?
Throughout the semester, the students are given a series of problem sets that contain some part of this project. For example, the first problem set provides sediment and grain size data from the project area, which will be used to calculate porosities, densities, and grain-size distributions. Later problems sets will involve determination of other hydraulic parameters, development of maps, etc.
Each student will start an on-going file of all information related to the project, including the results of the individual problem sets. Problem set results and data will, in some cases, be incorporated into later labs and will end up being a part of the final hydrogeologic assessment report. Copies of all digital files should be placed on some on-line system (Blackboard site, website, etc.) for distribution to the students. Each student will obtain these files and use them to develop an Excel workbook that contains all of the data and calculation results. This workbook will be submitted to the professor via email for grading whenever individual problem sets are due. The final steps in the project will involve the development of an analytical groundwater model, using Excel, that will simulate pumping rates and water levels at the end of the 50-year period. “Adverse impact” to surrounding properties will be defined as 10 meters of drawdown at the property boundary and 2.5 meters of drawdown at any off-site well. This model will be used to determine the pumping rate that will not cause an adverse impact after 50 years.
At the end of the semester, each student will prepare a technical report, complete with figures and tables of data, which summarizes their results and gives their recommendation concerning the 50-year groundwater yield.
Schedule of Problem Sets Associated with the CenTex Project The following is a list of the problem sets that apply to the CenTex Project. More information on each problem set is included in the supplemental file called < CenTex_LabProject(Uliana) Methods&Appendix.pdf >.
Part 1: Porosity and Grain Size Analysis Project introduction and basic background information. Grain size analysis from project samples; estimate porosity of samples and determine grain size distributions.
Part 2: Permeability Analysis Using the grain size data, estimate permeability of the sediments. Also, calculate permeabilities from permeameter data.
3
Part 3: Groundwater Map
Plot groundwater elevations on a base map of the site. Use these data to construct a groundwater contour map.
Part 4: Aquifer Tests Data from multi-well pump tests will be used to calculate transmissivity (T) and storativity (S) for the study area, as well as K and specific storage (Ss) (using the saturated thickness of the aquifer).
Part 5: Analytical Modeling Develop an analytical model using a spreadsheet program (e.g. MS Excel) and the Theis equation. Calculate drawdowns at various distances from the property, and use the model to answer the primary question.
Part 6: Preparation of Final Report Put results together into a final report that includes maps, figures, background information, and tables of results.
A site map, cross-section, and basic instructions for each part are given on the following pages. Format instructions for the final report, and a grading form, are also included. Maps, figures, data, procedures, and methods for all assignments are described in a separate file called < CenTex_LabProject(Uliana) Methods&Appendix.pdf >. An optional MS Excel tutorial exercise is also included in this file.
References Domenico, P.A., and Schwartz, F.W., 1998 Physical and Chemical Hydrogeology, 2nd Ed., New York, John
Wiley & Sons, 506 pp.
Fetter, C.W., 2001. Applied Hydrogeology, 4th Ed., Upper Saddle River, New Jersey; Prentice Hall, 598 pp.

4

5

6
Part 1: Geotechnical Analysis of Aquifer Samples Four test holes were bored in the project area and samples of the aquifer sediments were taken from each. The samples were taken from the saturated part of the aquifer. The saturated samples were weighed, allowed to drain by gravity, weighed again, dried in the oven overnight, then weighed a third time. The dried samples were sieved through #4, 10, 20, 60, 100, and 200 sieves.
The sample weights and volumes, and the grain size analysis data, are on the attached pages. The sample weights include the sample can, so you will have to subtract the can weight before doing any further calculations. Then, use the data, and the worksheets associated, to calculate the following parameters…
• Saturated bulk density
• Dry bulk density
• Porosity
• Gravity drained moisture content (gravimetric and volumetric)
• Degree of saturation (gravity drained sample)
• Specific Yield and Specific Retention
… and develop grain-size distribution curves based on the sieve analysis.
Part 2: Aquifer Permeability Estimation Permeability is an important parameter that you will need to construct a model of the study area and calculate well yields for the final parts of the project. In this part of the project, we will estimate hydraulic conductivities of the sediments that make up the aquifer. We will use two basic methods for calculating hydraulic conductivity:
- empirical equations based on the grain size distribution of samples of the aquifer materials
- data from constant or falling head permeameter tests
Your assignment is as follows:
1. Use the porosity and grain-size distribution data from the four samples (B-1, B-2, B-3, and B-4) from the porosity lab for the empirical equations. Calculate K using the methods of
Hazen (1911)
Shepherd (1989)
The methods are described in the separate Methods section. Be sure to show your work.
2. Use the constant and falling head permeameter test data on the attached sheets to calculate K (in m/sec) for each sample. Two tests were run for each of the samples. Calculation methods are described in the separate Methods section.
7
Part 3: Groundwater Maps The objective of this exercise is to develop a contour map of the potentiometric surface of the groundwater in the Carrizo-Wilcox aquifer. You are given the following:
- A base map showing the property, the locations of the test borings, and the locations of nine wells located around the property
- A spreadsheet with water level data Using the base map and these data you will calculate hydraulic heads, plot those values on the map, and use those values to draw a contour map of the hydraulic heads in the aquifer. Finally, you will use the contour map to estimate the overall flow directions in the aquifer and to qualitatively determine if there are any variations in permeability throughout the aquifer.
Part 4: Aquifer Tests and Transmissivity/Storativity Calculations The objective of this exercise is to use data from a multi-well aquifer test to determine transmissivity, storativity, and hydraulic conductivity for the aquifer. You are given a set of time-drawdown data from two multi-well aquifer tests; these data include the pump rates and distances to the observation wells. You will graph these data on log-log paper and use the Theis curve-matching method to determine transmissivity, storativity, and hydraulic conductivity.
Part 5: Analytical Model and Drawdown Calculations The objective of this part of the project is to develop an analytical model that will use data and information from the previous parts of the project, and the Theis equation, to simulate the effects of a hypothetical well on water levels in the aquifer surrounding the property. The model will be put together in MS Excel, and it will be constructed in such a way that it could be used in the future with different input values to calculate drawdowns under different conditions. This is the final step in the assessment of the property, and this model will give you the answer to the main question posed in the introduction to the project.
Part 6: Final CenTex Report The results of the work that you do must be clearly documented and submitted in a way which will allow me to see what you did, how you did your calculations/diagrams/analyses, how you came to your conclusions, and how well your work and your conclusions satisfy the assignment. It is also important that I get a sense that you understood what you were doing, rather than simply following a set of instructions and spitting out a bunch of numbers or diagrams. Therefore, the final part of the project will be the preparation of a technical report outlining the procedures, methods, results and interpretations that resulted from the project. The report must follow the format described below.
Please read and adhere to this format. If you fail to include any of the components described below, or if you fail to follow the format in any way, you will lose points. This report will make up of the final lab grade, so please don’t take it lightly.

8
Part 6: Final CenTex Report Format The final report that you submit must have the following parts:
- A cover page - Section 1: Text - Section 2: Illustrations (maps, etc.) - Section 3: Tables of data, calculations, and results
Each of the three sections must be separated, placed in the order given here, and clearly indicated with a label – do not mix your tables and illustrations in with the text, and do not put your tables before your illustrations.
Cover Page The cover page must have the following information:
PROJECT 4421-01: HYDROGEOLOGIC ASSESSMENT FOR CENTEX WATER SUPPLY Course Number – Course Name, University Name
Your Name Date
Section 1: Text The text of your report must be typewritten/word processed; I will not accept handwritten reports. Text must be 12-point font, double-spaced with 1 inch margins around the page, and each page should be numbered. Use a simple, standard font (Times New Roman, Arial, Helvetica, Geneva, or Courier; avoid fancy fonts). The text of your report must be a maximum of 3000 words; there is no minimum number of words or pages. I’m not interested in reading reports that are full of unnecessary BS – the idea is to communicate, as clearly and succinctly, the procedures you followed and the results that you received from your work. Your final report should be written in such a way that another hydrogeologist, who has not previous knowledge about the project or the study area, will be able to read it and understand everything that you did.
The text should contain the following sub-sections.
Introduction
State the objective of the project here in a few sentences. Also give a brief summary of the steps that you took in addressing that objective (3 or 4 sentences), and in a final sentence presenting the results.
Background Information
Present all the background information about the project. In this section, give the location and describe the field area, and refer to any maps or other materials that I handed out associated with the project. Make sure that each of your maps or other illustrations are labeled and numbered in the order to which they are referred (i.e., the first map referred to in the text should be Figure 1; the next one Figure 2, etc.) You will also need to include some information about the aquifer and the local geology; to do so you will need to look up a few references on the Carrizo-Wilcox aquifer, and cite those references at the end of your report. I will have information on proper protocol for citing references in class.

9
Procedures
Describe the procedure used to complete each step of the assignment. Write clearly and simply, and be sure to describe things in the order that they were done. Include sample calculations if necessary (these can be in with the text or on a separate sheet, like an appendix). Do not use bullets or lists; write out the procedures in prose. Be complete, but don’t try to fill up extra space with anything unnecessary. Don’t think that this section has to be a certain length – if you can describe the procedure in a couple of sentences, please do. People are not impressed by length and lots of big words – they are impressed by clear communication. However, don’t think that you have a license to do a half-assed job – the objective is to communicate and to let someone who has no knowledge of the project understand everything that you did.
Results
Present in written form the results of each step of the project. Refer to your tables and maps as necessary. Be sure to put in the results from each step of the project, and then give the final result of the project.
Conclusions
Sum up all your results in a single paragraph. Each of these subsections must be clearly indicated with headers; in other words, don’t just write out all of the text of your report on a few pages; put the word…
Introduction
…before the introduction section, put the word…
Procedures
…before the procedures section, etc.
Section 2: Illustrations Place all of your maps and other illustrations in this section. Label each in the order that you refer to them in the text (e.g., “Figure 1”; “Figure 2”…), and make sure that they are placed in order (i.e., don’t put figure 3 before figure 1). When you discuss a map in the text, be sure to refer to it by its label; for example, when discussing the preparation of a cross-section in the Procedures section, write something like this:
Ground surface elevations from the topographic map were used to construct the surface profile in the cross section (see Figure 4).
Section 3: Tables of data, calculations, and results Place copies of any tables of data (both tables handed out by me and data that you generate) in this section in the order that you did them. Refer to each sheet as “Table 1”, “Table 2”, etc. in the order that you did them. When you present the results of your projects in the Results section, be sure to refer to your tables; for example:
Values of t, s, u, and W(u), as well as the final transmissivity and storativity values, are presented in Table 4.
All tables must be typed or otherwise prepared on a computer; handwritten tables are unacceptable.
10
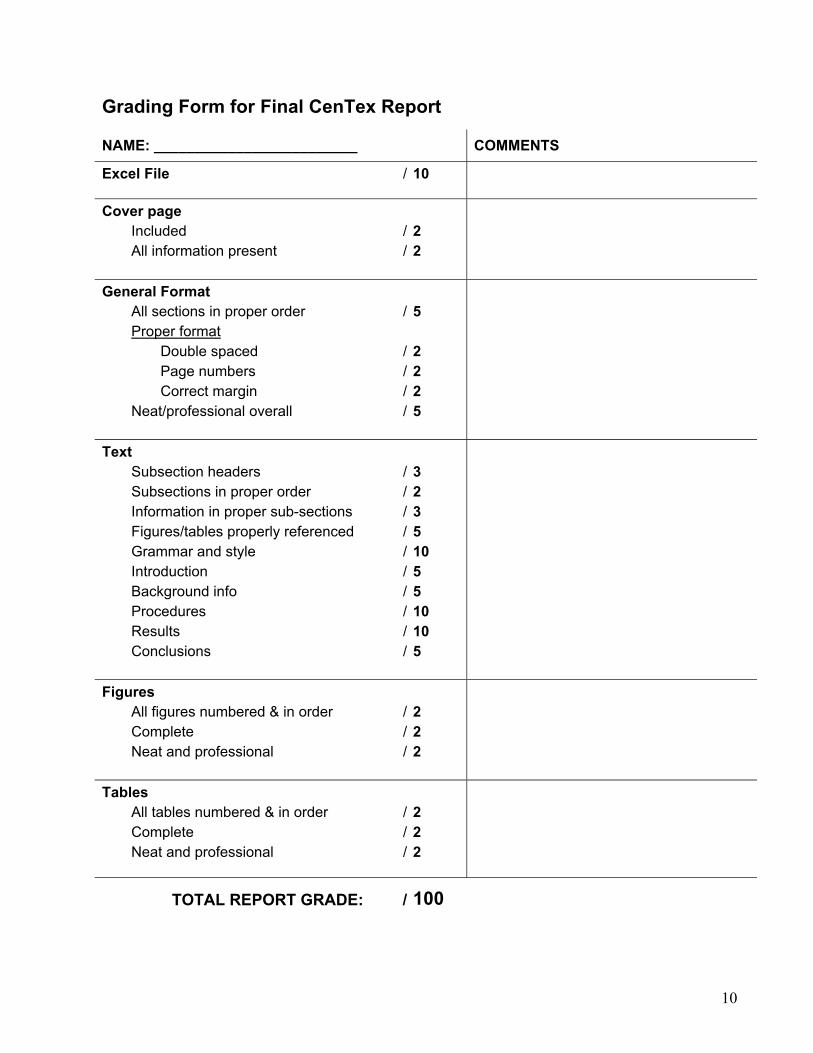
Grading Form for Final CenTex Report
NAME: _________________________ COMMENTS
Excel File / 10 Cover page
Included / 2 All information present / 2
General Format All sections in proper order / 5 Proper format
Double spaced / 2 Page numbers / 2 Correct margin / 2
Neat/professional overall / 5 Text
Subsection headers / 3 Subsections in proper order / 2 Information in proper sub-sections / 3 Figures/tables properly referenced / 5 Grammar and style / 10 Introduction / 5 Background info / 5 Procedures / 10 Results / 10 Conclusions / 5
Figures
All figures numbered & in order / 2 Complete / 2 Neat and professional / 2
Tables
All tables numbered & in order / 2 Complete / 2 Neat and professional / 2
TOTAL REPORT GRADE: / 100