HUNGRY CITIES PARTNERSHIP€¦ · Figure 30: Entrance to the Buenavista CETRAM with No Vendors...
58
T he U rban Food S ystem of Mexico City , Mexico HUNGRY CITIES REPORT NO. 7 HUNGRY CITIES PARTNERSHIP
Transcript of HUNGRY CITIES PARTNERSHIP€¦ · Figure 30: Entrance to the Buenavista CETRAM with No Vendors...

The Urban Food System of Mexico City, Mexico
HUNGRY CITIES REPORT NO. 7
HUNGRY CITIES PARTNERSHIP
THE URBAN FOOD SYSTEM OF MEXICO CITY, MEXICO
GUÉNOLA CAPRON, SALOMÓN GONZALEZ ARELLANO, JILL WIGLE, ANA LUISA DIEZ,
ANAVEL MONTERRUBIO, HÉCTOR HIDALGO, JESÚS MORALES, JOSÉ CASTRO, MA. CRISTINA
SÁNCHEZ-MEJORADA, MARÍA CONCEPCIÓN HUARTE T., MARÍA TERESA ESQUIVEL,
RENÉ FLORES
SERIES EDITOR: PROF. JONATHAN CRUSH
HUNGRY CITIES PARTNERSHIP
HUNGRY CITIES REPORT NO. 7

ACKNOWLEDGEMENTS
The research and publication of this report was funded by the Social Sciences and Humanities Research Council (SSHRC) and the Interna-tional Development Research Centre (IDRC) under the International Partnerships for Sustainable Societies (IPaSS) Program. Thanks are due to the following for their assistance in the preparation of this report: Bronwen Dachs, Maria Salamone, Cameron McCordic and David Celis Parra.
© HUNGRY CITIES PARTNERSHIP 2017
Published by the Hungry Cities Partnership African Centre for Cities, University of Cape Town, South Africa, and Wilfrid Laurier University/Balsillie School of International Affairs, Waterloo, Canada hungrycities.net
First published 2017
ISBN 978-1-920597-29-0
Production by Bronwen Dachs Muller, Cape Town
All rights reserved. No part of this publication may be reproduced or transmitted, in any form or by any means, without prior permission from the publishers.

AUTHORS
Guénola Capron, Department of Sociology, Metropolitan Autonomous University (UAM)-Azcapotzalco
Salomón Gonzalez Arellano, Department of Social Sciences UAM-Cuajimalpa
Jill Wigle, Department of Geography, Carleton University
Ana Luisa Diez, PhD candidate in Sociology UAM-Azcapotzalco
Anavel Monterrubio, Department of Sociology UAM-Azcapotzalco
Héctor Hidalgo, PhD candidate in Sociology, UAM-Azcapotzalco
Jesús Morales, Department of Sociology, UAM-Azcapotzalco
José Castro, Department of Sociology, UAM-Azcapotzalco
Ma. Cristina Sánchez-Mejorada, Department of Sociology, UAM-Azcapotzalco
María Concepción Huarte T., Department of Sociology, UAM Azcapotzalco
María Teresa Esquivel, Department of Sociology, UAM-Azcapotzalco
René Flores, Autonomous National University of Mexico (UNAM)
Previous Publications in the Hungry Cities Report Series
No 1 The Urban Food System of Nanjing, China No 2 The Urban Food System of Maputo, Mozambique No 3 The Urban Food System of Cape Town, South Africa No 4 The Urban Food System of Kingston, Jamaica No 5 The Urban Food System of Bangalore, India No 6 The Urban Food System of Nairobi, Kenya

CONTENTS PAGE
1. Introduction 1
2. Demographic Characteristics 2
2.1 Population Size 2
2.2 Age Structure 7
3. Geography of the Mexico City Metropolitan Area 9
3.1 Patterns of Land Use 9
3.2 Residential Land Use 11
4. Economy of the Mexico City Metropolitan Area 14
4.1 Employment 14
4.2 Income Distribution 15
4.3 Poverty and Marginalization 16
5. The Informal Economy 19
5.1 Size of Informal Economy 19
5.2 Informal Sector Policies 20
6. Urban Food System 21
6.1 Food Sources 21
6.2 Food Distribution 22
6.3 Formal Food Retail 27
6.4 Informal Food Retail 31
6.5 Urban Agricultural Production 34
7. Urban Food Security 36
7.1 Food Insecurity in Mexico 36
7.2 Food Expenditure Patterns 39
7.3 Variations in Food Prices 40
7.4 Policies to Combat Hunger and Food Insecurity 43
8. Conclusion 46
9. References 47

LIST OF TABLES
Table 1: Population of the MCMA and Federal District, 1950-2005 6
Table 2: Types of Settlement in MCMA, 2010 12
Table 3: Employment in Major Economic Sectors, 2010 14
Table 4: Employment by Economic Sector in Federal District, 2015 14
Table 5: Economically Active Population in MCMA, 2010 15
Table 6: Population by Income Level in MCMA, 2014 15
Table 7: Poverty Indicators in the MCMA 17
Table 8: Dimensions and Indicators of Mexico’s Urban Marginalization 18 Index, 2010
Table 9: Breakdown of Employed Workforce in Federal District, 2015 19
Table 10: Major Commercial Food Companies in Mexico City 27
Table 11: Food Retail Units in MCMA, 2016 28
Table 12: Public Markets in Mexico City 28
Table 13: Urban Agricultural Production in the MCMA 35
Table 14: Levels of Food Insecurity and Income Quintiles in Mexico, 2014 37
Table 15: Rural and Urban Food Insecurity in Mexico, 2014 37
Table 16: Food Insecurity in Mexico City 37
Table 17: Food Insecurity among Elderly Residents 38
Table 18: Average Quarterly Household Expenditure on Food by Income 40 Deciles, 2014
Table 19: Household Expenditure by Food Item, 2014 41
Table 20: Comparative Prices of Food Items by Source, April 2016 42
Table 21: Social Programs in Mexico City 45
Table 22: Food Assistance for Elderly Residents 46
LIST OF FIGURES
Figure 1: Spatial Expansion of Mexico City, 1700-2000 3
Figure 2: Political-Administrative Divisions of the MCMA 4
Figure 3: Mexico City Skyline 4
Figure 4: Aerial View of the Mexico City Metropolitan Area 5
Figure 5: Historic Centre of the Federal District 5

Figure 6: Santa Fe, Mexico City’s New CBD 6
Figure 7: Proportion of Population in Federal District and Rest of 6 MCMA, 2000-2030
Figure 8: Population Pyramid of MCMA, 2010 7
Figure 9: Population Pyramid for Federal District, 2010 8
Figure 10: Spatial Distribution of Population under 15 and over 65, 2000 8
Figure 11: Land Use in the MCMA 10
Figure 12: Location of the Conservation Zone 10
Figure 13: Spatial Distribution of Settlement Types in MCMA, 2010 12
Figure 14: Population Density of MCMA, 2005 13
Figure 15: Comparison of Income Distribution 16
Figure 16: Marginalization in the MCMA, 2010 17
Figure 17: Urban Marginalization Index of MCMA, 2010 18
Figure 18: Entrance to Central de Abasto 23
Figure 19: Food Distribution System in Mexico City 24
Figure 20: Grocery Store in Central de Abasto 24
Figure 21: Wholesaler in Central de Abasto 25
Figure 22: Vegetable Wholesaler in Central de Abasto 25
Figure 23: Chicken Wholesaler in Central de Abasto 26
Figure 24: Migrant Workers in Central de Abasto 26
Figure 25: Spatial Distribution of Public Markets, Tianguis and 29 “Concentrations”
Figure 26: Map of La Merced 30
Figure 27: Nopales Vendor in La Merced 30
Figure 28: Peppers for Sale in La Merced 31
Figure 29: Vendor in La Merced 31
Figure 30: Entrance to the Buenavista CETRAM with No Vendors Present 33
Figure 31: Street Food Vendor 33
Figure 32: Food Vendor at Market on Wheels 34
Figure 33: Distribution of Peri-Urban and Suburban Agriculture in 35 Mexico City
Figure 34: Actively Farmed Part of the Chinampas in Xochimilco 36 (within the Area Natural Protegida)
Figure 35: Annual Increase in Cost of Food Basket in Federal District, 41 2004-2014

HUNGRY CITIES REPORT NO. 7 1
1. INTRODUCTION
Mexico City’s origins date back to the early 16th century. The Aztec capital of Tenochtitlan became the Spanish capital of New Spain in 1521 with the con-quest of the Aztec empire. During the subsequent 300-year colonial period, Mexico City was the centre of Spanish colonial socio-political and economic power and led a system of cities oriented towards mining and export to Spain. During the 1810-1821 War of Independence, large numbers joined the inde-pendence forces, diminishing the workforce available for agriculture, the min-ing industry and other activities in Mexico. Safety concerns during the conflict also generated migration flows from smaller urban centres to larger cities. In just one year, 1810-1811, the population of Mexico City increased from 150,000 to 170,000. Although the hegemony of Mexico City has always been a typical feature of the urban history of the country, it was not until the middle of the 19th century that the city assumed a fundamental role in national demographic and urban dynamics.
Porfirio Díaz, president of Mexico from 1876 to 1911, facilitated the territo-rial integration of the country and its economic insertion into world markets. Railway development, and the routes established towards the north and the Gulf of Mexico, led to the interconnection of the cities in the north of the country with the cities on the Central Mexican Plateau. At the same time, large areas and numerous settlements in the south of the country and along the Pacific Ocean were disconnected from the transportation system. This process further central-ized national power in Mexico City and cemented the demographic momentum that would help turn it into the dominant city.
During the 20th century, economic growth and demographic changes turned Mexico from an essentially rural to a fundamentally urban nation. Of the 13.6 million people in Mexico at the beginning of the 20th century, only 1.4 million were living in urban settlements. In the national urban national system, small cities predominated. Half the population lived in larger cities, with Mexico City and Guadalajara most prominent with 345,000 and 101,000 inhabitants, respec-tively (Garza 2002:8). During the revolutionary period (1910-1921), rural-urban migration intensified, particularly towards Mexico City. By 1921, the city had a population of 317,000 (MacGregor 2003). Throughout the first four decades of the century, Mexico City grew at a rate of 3.8% per annum, well in excess of the national rate of increase of 0.9 % per annum.
The 1940s and 1950s constituted the first stage of the so-called Mexican eco-nomic miracle, when the process of Import Substitution Industrialization (ISI) accelerated economic growth and stimulated urban development. These trends continued until the 1980s, the decade in which the country’s population became

2 HUNGRY CITIES PARTNERSHIP
THE URBAN FOOD SYSTEM OF MEXICO CITY, MEXICO
predominantly urban. Mexico’s main cities – Mexico City, Guadalajara, Mon-terrey and Puebla – experienced explosive growth with Mexico City becoming an increasingly primate city. In 1950, Mexico City’s population reached 3 mil-lion. Between 1951 and 1960, its average annual population growth rate was 8.1%, with a national figure of 5.2%. With ISI, the Mexico City Metropolitan Area (MCMA) became the epicentre of the national economy (Ángeles-Castro 2013).
By 1980, nearly 40% of national GDP originated in the MCMA. However, between 1980 and 1998, its contribution to national GDP fell to 32%, primar-ily because of a decline in the city’s manufacturing sector. New industrial cit-ies were created as a result of the reorientation of Mexican production towards external markets. Mexico City’s share of national urban employment declined from 40% to 20% between 1980 and 1998. The collapse of the model of ISI “was more than anything, the result of the collapse of industrial base.” Because this base was highly concentrated in the MCMA, it is not surprising that the city was the most affected (Parnreiter 2002). In parallel, the advanced services sec-tor became more important in Mexico City, concentrating key activities there as part of the liberalization and globalization of the Mexican economy. In the last decade, the demographic and spatial dynamics of the MCMA have brought important changes. On the one hand, increased urban expansion has generated a heterogeneous and fragmented periphery. On the other, the central areas have lost population, and attempts to re-densify and “rescue” these central zones have not always been successful. Figure 1 shows the spatial expansion of the city over time from 1700 to 2000.
2. DEMOGRAPHIC CHARACTERISTICS
2.1 Population Size
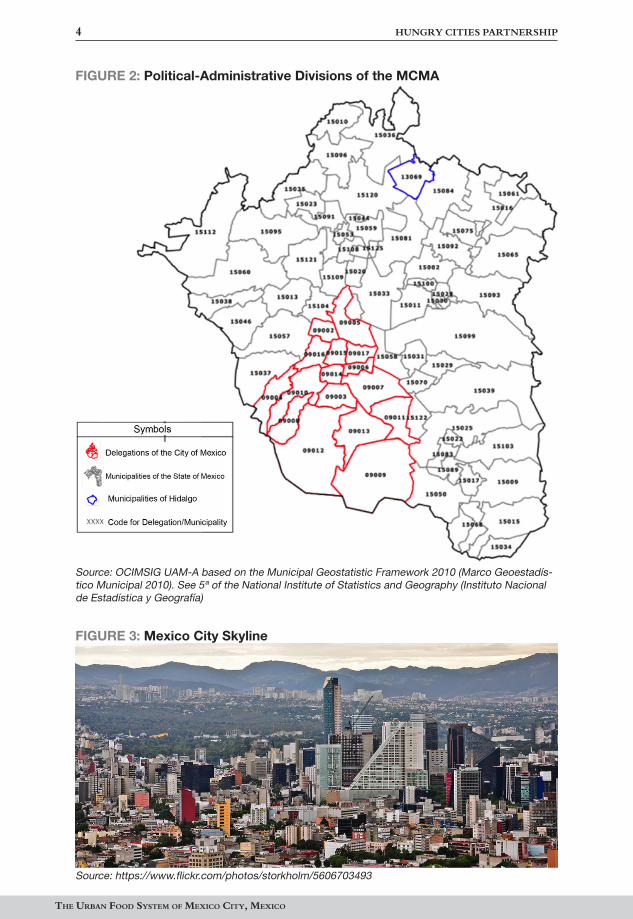
The estimated population of the Federal District of Mexico City is 8.9 mil-lion. The Federal District was granted political autonomy in 2016 and is now generally referred to as Mexico City, although this report uses the two terms inter-changeably. The broader metropolitan area is sometimes referred to as Greater Mexico City. In this report, we use the term Mexico City Metropolitan Area (MCMA) to refer to the entire metropolitan area. The MCMA comprises the 16 municipalities of the Federal District, 59 municipalities in the State of Mexico and one municipality in the State of Hidalgo (Titayuca) (Figure 2). The MCMA is one of the five largest population and labour force concentrations in the world, and one of the two largest in Latin America. The MCMA covers over 200,000 square hectares, is home to about 21 million people and includes three

HUNGRY CITIES REPORT NO. 7 3
political-administrative entities, each with distinct authorities, management and planning, but with economic, political, social and territorial processes that are in many cases both common and complementary (Figure 2).
FIGURE 1: Spatial Expansion of Mexico City, 1700-2000
Source: http://geo-mexico.com/?tag=mexico-city
4 HUNGRY CITIES PARTNERSHIP
THE URBAN FOOD SYSTEM OF MEXICO CITY, MEXICO
FIGURE 2: Political-Administrative Divisions of the MCMA
Source: OCIMSIG UAM-A based on the Municipal Geostatistic Framework 2010 (Marco Geoestadís-tico Municipal 2010). See 5ª of the National Institute of Statistics and Geography (Instituto Nacional de Estadística y Geografía)
FIGURE 3: Mexico City Skyline
Source: https://www.flickr.com/photos/storkholm/5606703493
HUNGRY CITIES REPORT NO. 7 5
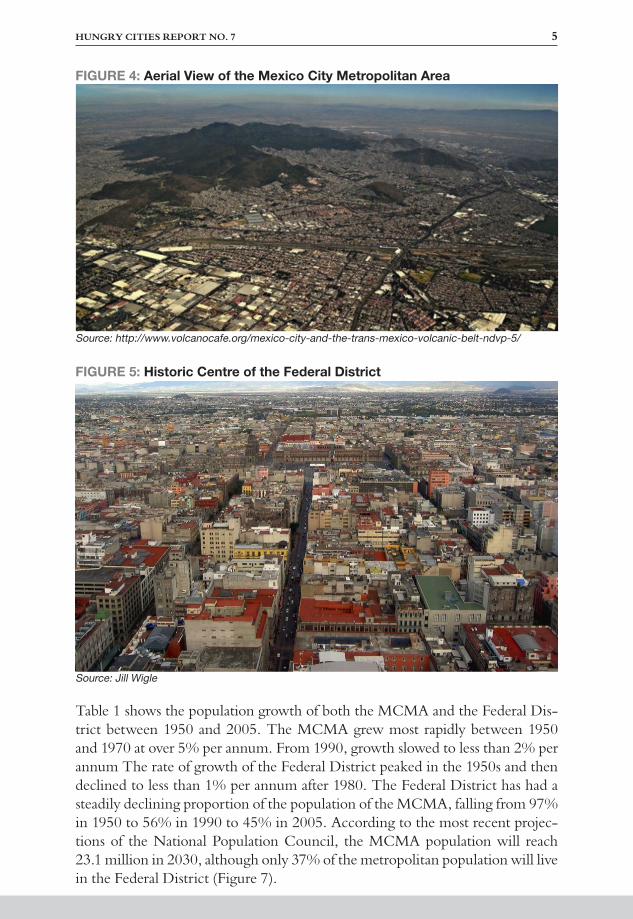
FIGURE 4: Aerial View of the Mexico City Metropolitan Area
Source: http://www.volcanocafe.org/mexico-city-and-the-trans-mexico-volcanic-belt-ndvp-5/
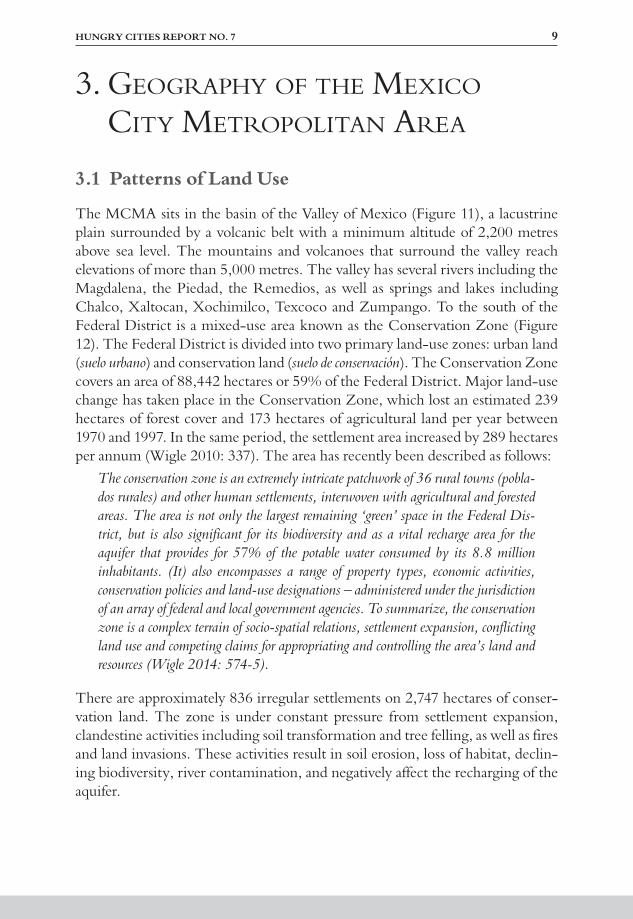
FIGURE 5: Historic Centre of the Federal District
Source: Jill Wigle
Table 1 shows the population growth of both the MCMA and the Federal Dis-trict between 1950 and 2005. The MCMA grew most rapidly between 1950 and 1970 at over 5% per annum. From 1990, growth slowed to less than 2% per annum The rate of growth of the Federal District peaked in the 1950s and then declined to less than 1% per annum after 1980. The Federal District has had a steadily declining proportion of the population of the MCMA, falling from 97% in 1950 to 56% in 1990 to 45% in 2005. According to the most recent projec-tions of the National Population Council, the MCMA population will reach 23.1 million in 2030, although only 37% of the metropolitan population will live in the Federal District (Figure 7).

6 HUNGRY CITIES PARTNERSHIP
THE URBAN FOOD SYSTEM OF MEXICO CITY, MEXICO
FIGURE 6: Santa Fe, Mexico City’s New CBD
Source: http://raredelights.com/top-20-worlds-largest-cities-proper-population/mexico-city/
TABLE 1: Population of the MCMA and Federal District, 1950-2005
Year MCMA population
Federal District population
Federal District population as % of MCMA population
MCMA annual growth rate (%)
Federal District annual growth
rate (%)
1950 3,137,553 3,050,442 97.2
1960 5,231,643 4,870,876 93.1 5.24 4.78
1970 8,656,704 6,874,120 79.4 5.36 3.64
1980 12,994,450 8,362,711 64.4 4.00 1.91
1990 15,054,006 8,350,595 55.5 1.67 -0.01
2000 17,968,895 8,605,239 47.9 1.80 0.30
2005 19,239,916 8,720,916 45.3 0.80 0.80
Source: Adapted from Wigle (2010a: 338)
FIGURE 7: Proportion of Population in Federal District and Rest of MCMA, 2000-2030
Sources: INEGI. Censos de población y Vivienda, 2000 y 2030 y CONAPO. Proyecciones de población

HUNGRY CITIES REPORT NO. 7 7
2.2 Age Structure
A reduction in fertility that began in the 1970s, and a decrease in the rate of in-migration, has led to a gradual aging of the city’s population. This is reflected in the contemporary population pyramid, which shows that the greater proportion of the population are adults (Figure 8). The average age of the population in the MCMA was 31 years in 2010. One-quarter are minors under 15 years of age, 68% are aged 15 to 64 years, and 6% are 65 and over. The working-age adult bias in the MCMA as a whole is even more pronounced in the Federal District (Figure 9). The difference between the MCMA and the Federal District can also be seen in the spatial distribution of people aged 15 and under and 65 and over. As Figure 10 shows, the elderly tend to be concentrated in the Federal District, while minors are located more in the rest of the MCMA. Intra-metropolitan migration is an important determinant of these patterns, with younger people who seek to own their own homes moving out of the Federal District to other municipalities in the MCMA.
FIGURE 8: Population Pyramid of MCMA, 2010

8 HUNGRY CITIES PARTNERSHIP
THE URBAN FOOD SYSTEM OF MEXICO CITY, MEXICO
FIGURE 9: Population Pyramid for Federal District, 2010
FIGURE 10: Spatial Distribution of Population Under 15 and Over 65, 2000
HUNGRY CITIES REPORT NO. 7 9
3. GEOGRAPHY OF THE MEXICO CITY METROPOLITAN AREA
3.1 Patterns of Land Use
The MCMA sits in the basin of the Valley of Mexico (Figure 11), a lacustrine plain surrounded by a volcanic belt with a minimum altitude of 2,200 metres above sea level. The mountains and volcanoes that surround the valley reach elevations of more than 5,000 metres. The valley has several rivers including the Magdalena, the Piedad, the Remedios, as well as springs and lakes including Chalco, Xaltocan, Xochimilco, Texcoco and Zumpango. To the south of the Federal District is a mixed-use area known as the Conservation Zone (Figure 12). The Federal District is divided into two primary land-use zones: urban land (suelo urbano) and conservation land (suelo de conservación). The Conservation Zone covers an area of 88,442 hectares or 59% of the Federal District. Major land-use change has taken place in the Conservation Zone, which lost an estimated 239 hectares of forest cover and 173 hectares of agricultural land per year between 1970 and 1997. In the same period, the settlement area increased by 289 hectares per annum (Wigle 2010: 337). The area has recently been described as follows:
The conservation zone is an extremely intricate patchwork of 36 rural towns (pobla-dos rurales) and other human settlements, interwoven with agricultural and forested areas. The area is not only the largest remaining ‘green’ space in the Federal Dis-trict, but is also significant for its biodiversity and as a vital recharge area for the aquifer that provides for 57% of the potable water consumed by its 8.8 million inhabitants. (It) also encompasses a range of property types, economic activities, conservation policies and land-use designations – administered under the jurisdiction of an array of federal and local government agencies. To summarize, the conservation zone is a complex terrain of socio-spatial relations, settlement expansion, conflicting land use and competing claims for appropriating and controlling the area’s land and resources (Wigle 2014: 574-5).
There are approximately 836 irregular settlements on 2,747 hectares of conser-vation land. The zone is under constant pressure from settlement expansion, clandestine activities including soil transformation and tree felling, as well as fires and land invasions. These activities result in soil erosion, loss of habitat, declin-ing biodiversity, river contamination, and negatively affect the recharging of the aquifer.

10 HUNGRY CITIES PARTNERSHIP
THE URBAN FOOD SYSTEM OF MEXICO CITY, MEXICO
FIGURE 11: Land Use in the MCMA
Source: OCIMSIG UAM-A con base en Conjuntos de Datos Vectoriales de Uso del Suelo y Vegetación, Escala 1:250,000 - Serie V, INEGI 2012,2013
FIGURE 12: Location of the Conservation Zone
Source: Wigle (2010)

HUNGRY CITIES REPORT NO. 7 11
Almost a million people live in the Conservation Zone and more than 10% of its surface is dedicated to urban uses. Thirty five percent is forested and 16% consists of bush and pasture for cattle and sheep (POZMVM 2011:155). The agricultural sector has very low productivity. Traditional smallholder agricul-ture (97% of the production units are less than five hectares each) is expanding into wooded zones and people often cultivate on the hillsides. Only 28% of the production is marketed in the city, which speaks to the weak links between the agricultural activities and the enormous market potential of the metropolis.
Several changes in land use pattern were observed between 1973 and 2000 in a study of the south-west area of the MCMA using GIS land use images (Torres-Vera et al 2009). High-density residential and commercial areas significantly increased in size, while vegetated and sparsely populated land changed to high-density residential and commercial buildings (Torres-Vera et al 2009: 135).
3.2 Residential Land Use
The urbanization of the MCMA in recent decades has been characterized by the loss or stagnation of the population in the central city and growth in periph-eral municipalities. Between 2005 and 2010, the urban localities of the MCMA grew by almost 18,800 hectares, reaching a total surface area of 146,032 hectares. Two-thirds of this growth took place in the municipalities of the State of Mexi-co, 31% in Hidalgo State and only 1% in the Federal District (POZMVM 2011: 142). In 2010, the MCMA had a total of 6,510,353 dwellings of which 52% were in the municipalities of the State of Mexico, 42% in the Federal District and only 6% in Hidalgo State. Between 2005 and 2010, the number of homes increased by 1.7 million and, of these, almost 60% were based in the municipali-ties of the State of Mexico, 31% in the Federal District, and the rest in the State of Hidalgo (POZMVM 2012). Of the 18,800 hectares of urbanized land added between 2005 and 2010, 88% was the result of the creation of new residential areas, including both formal and informal settlements. The remaining 12% was a result of the incorporation of rural settlements into the urban fabric.
The residential areas of the MCMA are characterized by different types of settle-ment that reflect different forms of land occupation. Wigle (2010b: 416) observes that the outward spread of the city’s population and economic activities pro-duced “a polycentric urban form incorporating existing towns and rural areas in a complex metropolitan structure expanding along major transport corridors towards nearby secondary cities.” The MCMA consists of “an intricate amalgam of incipient, consolidating and consolidated informal settlements/communities woven together with formally planned residential and non-residential areas and colonial and outlying pre-Hispanic towns” (Wigle, 2010b: 416). Connolly (2005, 2010) classifies these settlements according to the date of urban development, the type of settlement or urbanization process, and spatial form. Table 2 shows

12 HUNGRY CITIES PARTNERSHIP
THE URBAN FOOD SYSTEM OF MEXICO CITY, MEXICO
that almost half of the population and housing of the MCMA are classified as “popular” or working-class neighbourhoods (colonias populares), followed by hous-ing complexes (18%) and conurbated villages (9%). The fastest growing areas are the conurbated towns and high-density residential areas (POZMVM 2012: 143). Figure 13 shows the spatial distribution of the different settlement types.
TABLE 2: Types of Settlement in MCMA, 2010Type of Settlement Total population % Inhabited housing %
Popular neighbourhood 48.2 46.5
Housing complex 18.1 18.8
Conurbated village 9.5 9.0
Non-conurbated village 7.0 6.3
Medium-density residential areas 6.7 7.6
Central city 6.0 7.5
Cabecera conurbada 1.9 1.9
High-density residential areas 1.5 1.6
Predominantly non-residential 0.8 0.7
Colonial city 0.2 0.2
Source: OCIMSIG UAM-A, base de Ageb´s y manzanas. Censo de Población y Vivienda 2010, Instituto Nacional de Estadística y Geografía
FIGURE 13: Spatial Distribution of Settlement Types in MCMA, 2010

HUNGRY CITIES REPORT NO. 7 13
Over half of the population of the MCMA can access housing only through informal or irregular settlement processes and are therefore housed through informal processes (Connolly and Wigle 2017: 185). The different types of settle-ment involve different forms of land occupation and, as a consequence, different population densities. The mass-produced, high-density residential subdivisions have the highest population densities (at 206 people per hectare in 2005), fol-lowed by the historic centre (which declined from 209 to 151 people per hect-are between 1990 and 2005) and the popular neighbourhoods (157 people per hectare in 2005). The most densely populated areas of the MCMA are located towards the centre and east (Figure 14). The average density of the MCMA was 130 people per hectare in 2005. The Federal District has the highest density (166 per hectare), followed by the State of Mexico (116 per hectare) and Hidalgo (38 per hectare). Between 1990 and 2005, the population density of the Federal Dis-trict increased by 34%, compared to only 18% in the State of Mexico as a whole.
FIGURE 14: Population Density of MCMA, 2005
Source: OCIMSIG UAM-A con base en el Censo General de Población y Vivienda, 2010. INEGI

14 HUNGRY CITIES PARTNERSHIP
THE URBAN FOOD SYSTEM OF MEXICO CITY, MEXICO
4. ECONOMY OF THE MEXICO CITY METROPOLITAN AREA
4.1 Employment
Table 3 provides an overall picture of the relative share by economic sector of activity in the Federal District and the State of Mexico. In 2014, there were over 4 million people employed in the MCMA: 2.3 million (55%) in the Federal District and 1.9 million (45%) in the State of Mexico. However, the sectoral distribution varied considerably with 60% of manufacturing jobs located in the State of Mexico and 65% of services jobs located in the Federal District. Another source provides a more detailed breakdown for the Federal District for 2015. The data suggests an increase in the numbers employed in trade and services. As regards the gender breakdown, many more men than women are employed in agriculture/fishing, manufacturing, extractive industries and electricity, construction, and transportation and communications. Trade has a more even breakdown with 54% male and 46% female. “Other services” is the only cat-egory with more women (54%) than men (46%).
TABLE 3: Employment in Major Economic Sectors, 2010Federal District State of Mexico Total
No. % No. % No.
Trade 788,728 51.3 749,096 48.7 1,537,824
Manufacturing 361,110 40.4 532,845 59.6 893,955
Services 1,161,500 65.0 626,083 35.0 1,787,583
Total 2,311,338 54.8 1,908,024 45.2 4,219,362
Source: INEGI, Censos Económicos, 2014
TABLE 4: Employment by Economic Sector in Federal District, 2015No. Men (%) Women(%)
Agriculture/fishing 42,171 74.4 25.6
Manufacturing 399,814 64.3 35.7
Extractive industries and electricity 14,985 79.4 20.6
Construction 202,877 92.5 7.5
Trade 888,218 53.8 46.2
Transportation and communications 357,510 82.2 17.8
Other services 2,059,525 45.8 54.2
Government and international organizations 294,245 55.4 44.6
Not specified 33,971 52.3 47.7
Total 4,293,316 55.5 44.5
Source: STPS (2016: 5)

HUNGRY CITIES REPORT NO. 7 15
The total economically active population of the MCMA in 2010 was 8.3 million, of whom 62% were male and 38% female (Table 5). There were around 430,000 unemployed residents, of whom 72% were male and 28% were female. About 6.9 million people were not economically active (29% male and 71% female).
TABLE 5: Economically Active Population in MCMA, 2010Economically active Not economically
active Not specifiedEmployed Unemployed
Male 5,135,233 309,505 1,982,140 70,500
Female 3,142,763 120,762 4,922,112 35,352
Total 8,277,996 430,267 6,904,252 105,852
Source: INEGI. Dirección General de Estadísticas Sociodemográficas. Censo de Población y Vivienda 2010
4.2 Income Distribution
Table 6 compares the distribution of income in the Federal District and the State of Mexico in 2014. In the Federal District, the percentage of the population with no income was half that in the State of Mexico. On the other hand, the propor-tion with the highest salaries was greater in the Federal District (9% versus 4%). Figure 15 shows that there is greater income polarization in the Federal District.
TABLE 6: Population by Income Level in MCMA, 2014Federal District State of Mexico
No. % No. %
Total employed 4,032,035 100.0 6,864,982 100.0
Below minimum salary 343,878 8.5 739,408 10.8
1-2 times minimum salary 886,069 22.0 2,005,438 29.2
2-3 times minimum salary 788,210 19.5 1,832,983 26.7
3-5 times minimum salary 603,569 15.0 1,010,314 14.7
More than 5 times minimum salary 345,982 8.6 256,906 3.7
No income 103,780 2.6 310,029 4.5
Unspecified 960,547 23.8 709,904 10.3
Source: National Survey of Occupation and Employment

16 HUNGRY CITIES PARTNERSHIP
THE URBAN FOOD SYSTEM OF MEXICO CITY, MEXICO
FIGURE 15: Comparison of Income Distribution
Source: National Survey of Occupation and Employment
4.3 Poverty and Marginalization
Poverty and marginalization in the MCMA have a centre-periphery pattern where the municipalities of the Federal District (with the exception of Milpa Alta) are better off and less marginalized, while the municipalities further from the core in the State of Mexico are worse off. This pattern of inequality extends to the north of the MCMA and into the State of Hidalgo. According to data from the National Council for the Evaluation of Social Policy in Mexico, 34% of the MCMA population (or 6,966,610 people) lived in poverty in 2010. The areas with the highest number of urban poor were on the periphery of the MCMA in the States of Mexico and Hidalgo, especially in the municipalities of Ecatepec de Morelos, Nezahualcoyotl (State of Mexico) and Iztapalapa (in the Federal District). These three municipalities also had the highest share of the 875,823 people living in extreme poverty. The lowest percentages of extreme poor were in Benito Juarez and Milpa Alta in the Federal District. A total of 27% of the population of the Federal District were living in moderate poverty, compared to 42% in the State of Mexico (Table 7). The figures for extreme poverty were 2% and 7% respectively. Rates of social deprivation were consistently lower in the Federal District than in the State of Mexico. Figure 14 shows spatial variations in the degree of marginalization by municipality in the MCMA.

HUNGRY CITIES REPORT NO. 7 17
TABLE 7: Poverty Indicators in the MCMA Federal District State of Mexico
No. % No. %
Poverty
Population in poverty 2,502,200 28.4 8,269,200 49.6
Population in moderate poverty 2,351,900 26.7 7,063,000 42.4
Population in extreme poverty 150,500 1.7 1,206,900 7.2
Social deprivation
Education 779,500 8.8 2,550,600 15.3
Health services 1,759,100 19.9 3,280,300 19.7
Social security 4,081,800 46.3 10,108,600 60.6
Lack of quality housing 480,200 5.4 1,715,800 10.3
Lack of basic housing 145,700 1.7 2,061,000 12.4
Access to food 1,031,500 11.7 3,550,300 21.3
Source: CONEVAL estimates based on the MCS-ENIGH 2010, 2012 and 2014
FIGURE 16: Marginalization in the MCMA, 2010
Source: POZMVM (2011: 122)

18 HUNGRY CITIES PARTNERSHIP
THE URBAN FOOD SYSTEM OF MEXICO CITY, MEXICO
Another way to approach the study of poverty is that proposed by the National Population Council, which has developed an urban marginalization index that classifies the basic urban geostatistical areas of the country in terms of their over-all well-being as determined by access to education, health services, housing and goods. The Urban Marginalization Index is made up of 10 indicators and four dimensions (Table 8). Figure 17 shows the spatial distribution of poverty in MCMA using this index, which is again consistent with the general centre-periphery pattern of marginalization.
TABLE 8: Dimensions and Indicators of Mexico’s Urban Marginalization Index, 2010Dimension Indicator
Education% of population of 6-14 years who do not attend school
% of population aged 15+ years without complete basic education
Health
% of population without coverage in health services
% of deceased children of women aged 15-49 years
% of private dwellings without drainage to public network or septic tank
% of private dwellings without toilet with water connection
% of private dwellings with dirt floors
% of private dwellings with some level of overcrowding
Goods % of private dwellings without refrigerator
Source: CONAPO Índice de Marginación Urbana (2012)
FIGURE 17: Urban Marginalization Index of MCMA, 2010
Source: National Population Council

HUNGRY CITIES REPORT NO. 7 19
5. THE INFORMAL ECONOMY
5.1 Size of Informal Economy
In Mexico, the national statistics agency defines the informal economy as “the set of economic activities carried out by individuals who, because of the con-text in which they work, cannot call upon the legal or institutional framework required for their economic integration” (INEGI 2015: 14). The informal sec-tor is defined as “all those economic market activities operating from house-hold resources, without being a business that is identifiable or independent of the household. The operational criterion for determining the non-independence of production units with regard to households are: the absence of conventional accounting practices, the improbability of balanced assets and liabilities, and the lack of a distinction between household and business assets or the lack of a dis-tinction between business and household expenses (e.g. electricity and telephone costs, vehicle use, etc)” (INEGI 2015: 15).
According to INEGI, there were 1,238,243 people over the age of 15 employed in the informal sector in the third quarter of 2015 in the Federal District. Infor-mal sector employment therefore represents approximately 29% of the 4.3 mil-lion employed. Of these, 768,980 (62%) were men and 469,263 (38%) women. However, total informal employment is more extensive than employment in the informal sector per se, given that informal employment exists outside the informal sector. In urban Mexico in 2009, for example, 32% of employment was based in the informal sector while 58% of people working were informally employed. Another study found that approximately 51% of total employment in the Federal District is informal, with men and women participating in almost equal numbers (STPS 2016). This figure is slightly lower than the national aver-age of 59%. Table 9 provides a breakdown of the employed workforce in the Federal District by type of worker. A total of 844,000 were own-account work-ers, with 58% men and 42% women. A further 117,000 were unpaid workers of whom 60% were women.
TABLE 9: Breakdown of Employed Workforce in Federal District, 2015Type of worker No. Male (%) Female (%)
Salaried employees 3,142,815 54.4 45.6
Own-account workers 844,196 58.1 41.9
Employers 189,034 73.1 26.9
Unpaid workers 117,271 39.4 60.6
Total 4,293,316 55.5 44.5
Source: STPS (2016: 3)

20 HUNGRY CITIES PARTNERSHIP
THE URBAN FOOD SYSTEM OF MEXICO CITY, MEXICO
5.2 Informal Sector Policies
The geography of informal markets and selling activities in Mexico City is both complex and dynamic, with particular spatial patterns and temporal logics that are increasingly subject to both (a) restrictive state policies related to public space, streets, plazas and parks, as well as (b) permissive state-led, market-oriented poli-cies towards the redevelopment of specific commercial, residential and tourist zones in downtown Mexico City through upzoning, changes to land-use regula-tions and area-specific plans. Together, these policies have restricted or displaced the activities of informal vendors, especially in higher-income and central areas of the city. Some of the most notable policies are:
-duct for civilians in public places and spaces. Police officers can impose sanc-tions on citizens who contravene acceptable civic conduct specified by law, including the sale of products without proper authorizations. This policy has been linked to New York City’s “broken windows” policy and is also linked to the securitization of real estate investments to encourage higher-end urban redevelopment in select downtown areas (Becker and Muller 2013).
initiatives intended to redevelop the historic centre as a more densely popu-lated, mixed-use district. A major thrust includes the Reordenamiento de la Vía Pública del Centro Histórico, which is targeted at restricting the activi-ties of informal vendors. Over the past 10-15 years, hundreds of informal vendors have been evicted from pavements, streets and parks in the historic centre. Some groups of vendors were moved to fixed market stalls, but many did not stay because of high costs and poor locational attributes of the new sites. Many of these initiatives are aimed at attracting tourists, including the development of pedestrian streets with bilingual signage (English/Spanish). This plan has unfolded in phases and through different but inter-connected projects, moving outwards from the Zócalo to zones such as La Merced, overseen by a special authority (Autoridad de Centro Historico).
also been displaced by the redevelopment of the Alameda Park and Garibaldi Plaza in downtown Mexico City, and by the make-over of the central plaza in Coyoacan. The activities of informal vendors are also restricted on the metro. A police presence in all these spaces ensures that the displacement of informal vendors is enforced. Moreover, many of the urban redevelopment projects are designed to connect physically with one another (e.g. historic centre-Alameda-Paseo de la Reforma corridor), limiting the access of infor-mal vendors to increasingly large swaths of the downtown area where there is easier access to people with disposable incomes than in the poorer periphery of the city.

HUNGRY CITIES REPORT NO. 7 21
6. URBAN FOOD SYSTEM
6.1 Food Sources
Meeting the daily food demands of the over 20 million inhabitants of the Mexico City Metropolitan Area requires the agricultural production of the country’s rural areas, its fishing industry and food imports. The city’s population growth and physical expansion also require infrastructure capable of meeting its food needs. In 2003, the demand for food was estimated at 226 tonnes per day, equiv-alent to 30% of the country’s total food consumption (Torres 2003: 40).
A large proportion of the food consumed in the Metropolitan Zone is produced in different regions of the country. Food sources vary according to the type of product or time of year. According to the reports issued by the Ministry of Agriculture, Livestock, Rural Development, Fisheries and Food (SAGARPA), all 32 states of Mexico participate in agricultural production for the MCMA. For example, 29 states participate in livestock production, 25 produce corn, 23 produce green chillies and eight produce rice (Infosiap 2016). These products arrive in various forms, in a combination of traditional and highly sophisticated modern systems of food supply and distribution. Structural changes in recent decades towards an open economy have led to modifications in the systems of supply, distribution and food consumption. In the case of Mexico City, the road and rail systems are of vital importance to the city’s supply of food.
With regard to the foods that make up the basic basket of the national diet, verti-cally integrated companies now control different aspects of the food chain. The production of basic grains such as maize – used in the preparation of the staple tortilla – is dominated by two large national companies with a longstanding pres-ence in Mexico and internationally: Gruma and Minsa. Both are oligopolistic groups that set grain prices. Gruma is a world leader in the production of maize with a presence in 100 countries on five continents. Its activities include the production and processing of maize, the processing of a diverse range of prod-ucts, distribution and marketing, and the sale of machinery for the high-volume production of tortillas. Gruma is listed on the Mexican Stock Exchange and recorded a stock price increase of 152% in 2013 and 59% in 2014 with net sales of MXN49 billion and a profit margin of 30%. It has 20 processing plants in the country. Minsa, which controls 24% of national production, has six plants in Mexico and another two in the United States. Minsa operates 51 stores in Mex-ico and distributes its products to tortillerías, to the Mexican government’s Red de Abasto Social (Diconsa) and National System for the Integral Development of the Family, to merchants, wholesalers, and to supermarket chains. Maize flour is delivered by independent transportation contractors.

22 HUNGRY CITIES PARTNERSHIP
THE URBAN FOOD SYSTEM OF MEXICO CITY, MEXICO
Nationally, milk and its derivatives are handled by 310 companies, among them Lala and Alpura. Lala operates in 12 states, as well as in countries such as Gua-temala, Nicaragua and the United States. It supplies milk through agreements with farm owners in the northern region of the Comarca Lagunera. Lala is involved in the processing of dairy products (such as yoghurt, cheese, cream and butter), distribution, marketing and sales. It has 17 plants and 161 distribution centres throughout the country, supplying corner shops, mini-supermarkets, large stores, price clubs, bakeries, government branches and restaurants. Its main customers are Walmart, Sams Soriana, Comercial Mexicana, Bodega Aurrera and Oxxo. Unlike Lala, Alpura is a company comprising 254 cattle-breeding members with 180 farms. It processes more than 2 million litres of milk per day in its two pasteurizing plants. The company has 15 distribution centres and its 60 distributors take its products to supermarkets, convenience stores and grocery stores around the country
More eggs are consumed in Mexico than anywhere else in the world and the country’s chicken consumption rate is also high. Several companies participate with different levels of invested capital. Bachoco is the leading company in the production and marketing of chicken and eggs and competes with US compa-nies Pilgrims Pride and Tyson Food. Bachoco participates in the production and distribution of live and processed chickens, the marketing of live pigs and the production of white eggs, coffee and feed for farm and domestic animals. The company has an extensive refrigerated distribution network that starts at its nine processing plants and goes to the 64 distribution and sale points owned by the company. It has its own transportation fleet and its main customers are wholesal-ers, self-service stores, retailers and institutional chains.
Beef has increased in importance in the daily consumption of the inhabitants of Mexican cities. Ten companies have a strong presence in 100 processing and marketing centres. The activities of the largest, SuKarne, include the purchase from producers of young livestock for breeding and fattening, support of grain farmers for the purchase of feed, and the running of technologically advanced plants for slaughter, cutting and processing as well as packing, shipping, distribu-tion and marketing. SuKarne has the biggest distribution network in the country with more than 140,000 sales and consumption centres. In the MCMA, it has six centres. In 2011, it had a 16% share of national production and 76% of national meat exports.
6.2 Food Distribution
A proportion of the food that arrives in the city is for processing and the man-ufacture of industrial products destined for national consumption and export. “Food products, beverages and tobacco” is an increasingly important subsector of the manufacturing sector in the Federal District. With an average growth of

HUNGRY CITIES REPORT NO. 7 23
2.2% per year, this subsector was one of only two manufacturing subsectors with positive growth rates between 2000 and 2006. Another study showed that between 1999 and 2006, this subsector increased its share of the manufacturing sector’s contribution to the Federal District’s GDP from 21% to 27%, even as the overall contribution of the manufacturing sector to the Federal District’s GDP declined (CEFP 2009).
A significant focus of food distribution in Mexico City is its food terminal, the Central de Abasto (Supply Centre of Mexico City), which was founded in 1982. This 327-hectare terminal is the largest of its kind in the world, with 5,000 businesses and over 300,000 visitors per day. Food arrives at the terminal on a daily basis by truck from other states in Mexico. The Central de Abasto buys and distributes 30% of national fruit and vegetable production and the value of the products for purchase and sale is around USD9 billion per year. The food terminal provides approximately 70,000 jobs directly related to its activities, and represents a central hub in the extensive network of formal and informal food-related activities in Mexico City, with vendors of all scales and types purchasing wholesale supplies for sale or processing elsewhere in the city.
FIGURE 18: Entrance to Central de Abasto
Source: Maria Salamone
According to Torres Salcido (2010: 59), the Central de Abasto plays a critical role in the city’s food distribution system, linking agricultural producers to com-mercial food channels (Figure 19). The food distribution model is changing as wholesale markets are being displaced by companies pursuing vertical integration of tasks and shortening distribution channels. This is the result of the deregula-tion of the commercial sector through the adoption of neoliberal policies, the deregulation of foreign direct investment in the sector, and the incorporation of logistical, organizational and technological innovations to facilitate the high-vol-ume movement of food along supply chains from producer to consumer (Gasca and Torres 2014: 5).

24 HUNGRY CITIES PARTNERSHIP
THE URBAN FOOD SYSTEM OF MEXICO CITY, MEXICO
FIGURE 19: Food Distribution System in Mexico City
Source: Torres Salcido Gerardo (2010: 59)
FIGURE 20: Grocery Store in Central de Abasto
Source: Maria Salamone

HUNGRY CITIES REPORT NO. 7 25
FIGURE 21: Wholesaler in Central de Abasto
Source: Maria Salamone
FIGURE 22: Vegetable Wholesaler in Central de Abasto
Source: Maria Salamone

26 HUNGRY CITIES PARTNERSHIP
THE URBAN FOOD SYSTEM OF MEXICO CITY, MEXICO
FIGURE 23: Chicken Wholesaler in Central de Abasto
Source: Maria Salamone
FIGURE 24: Migrant Workers in Central de Abasto
Source: Maria Salamone

HUNGRY CITIES REPORT NO. 7 27
6.3 Formal Food Retail
The system of supply and marketing of food products is characterized by con-stant competition between public markets, large wholesale and retail compa-nies, grocery stores, and neighbourhood convenience and corner stores. Retail units range from the very basic (neighbourhood shops) to the most sophisticated such as large supermarkets and membership stores (Table 10). According to the National Statistics Directory of Economic Units (DENUE 2016), supermarkets, grocers and corner stores control 52% of food sales in the MCMA. In addition to the stores and supermarkets, Walmart manages restaurants such as Vips, Porton and Toks, which offer cooked food and beverages near their shops and on vari-ous routes into the city. Grocery stores offer basic consumer products such as milk, eggs, oil, beans, rice, bread, sugar, canned food, sausages, snacks, alcoholic and non-alcoholic beverages, flour, biscuits and manufactured pastries, articles of personal hygiene, and cleaning products. Corner stores stock a smaller range of manufactured products such as snacks, mass-produced box bread, sweets and bottled drinks. Neighbourhood restaurants selling food prepared for immediate consumption include snack bars, cafes, taquerias, fondas, torterías and pizzerias.
TABLE 10: Major Commercial Food Companies in Mexico City
Hypermarkets Mega Comercial Mexicana, Walmart Supercenter, Soriana Hiper Mercados, Tiendras Chedrahui
Price clubs City Club, Sams Club, Jointventure, Comercial Mexicana Cotsco
Supermarkets and self-service stores Walmart Vips, Porton, Comercial Mexicana, Sumesa, Soriana, Superama, Chedraui
Warehouses Bodega Comercial Mexicana
Neighbourhood supermarket Bodega Aurrera
Convenience stores Oxxo, 7 eleven Super City, City Market, K extra
Source: http://www.antad.net/asociados/autoservicios
There are many different kinds of retail outlets in the MCMA (Table 11). The city has over 300 public markets (Table 12). At the neighbourhood scale, many older communities have traditional public food markets where both domestic and imported foodstuffs are sold. Although they are considered to be formal markets regulated by the local state, these markets also attract informal vendors of all kinds. One of the largest public markets is in the historic centre of Xochimilco. It serves as a regional food hub for both sellers and vendors in the southern part of the city and sustains a vibrant informal market surrounding the formal market area. Other large informal market areas include those in Tepito and La Merced in the central MCMA. Figure 24 shows the spatial distribution of public markets, tianguis (mobile street markets that move among different city neighbourhoods) and “concentrations” (concentraciones). Although it is likely that most “concentra-tions” are informal, the map does not distinguish between formal and informal.

28 HUNGRY CITIES PARTNERSHIP
THE URBAN FOOD SYSTEM OF MEXICO CITY, MEXICO
TABLE 11: Food Retail Units in MCMA, 2016Type of retail No. of units
Groceries and variety stores 107,088
Fruit and vegetables 23,684
Birds/chicken 14,231
Sweets and confectionery 13,836
Butchers 13,493
Milk and dairy products 5,634
Seeds, food grains, dried chillies, spices 5,233
Mini supermarkets 5,099
Ice cream and popsicles 4,184
Non-alcoholic beverages 2,324
Fish and seafood 987
Supermarket 922
Other 8,895
Source: DENUE INEGI 2016
TABLE 12: Public Markets in Mexico CityDelegation No. of markets No. of premises Surface area % of markets
Álvaro Obregón 16 1,876 31, 893 4.9
Azcapotzalco 19 3,537 62, 321 5.8
Benito Juárez 16 3,723 61,842 4.9
Coyoacán 22 3,542 66, 635 6.7
Cuajimalpa 5 405 15,032 1.5
Cuauhtémoc 39 14,248 217, 308 11.9
Gustavo A Madero 51 1,994 202,549 15.5
Iztacalco 16 3,145 49,554 4.9
Iztapalapa 20 3,027 76,443 6.1
Magdalena C. 5 354 7,339 1.5
Miguel Hidalgo 19 6,671 93,851 5.8
Milpa Alta 9 743 18,814 2.7
Tláhuac 19 1,463 35,252 5.8
Tlalpan 20 1,483 48,702 6.1
Venustiano C. 42 15,501 226,431 12.8
Xochimilco 11 2,298 30,654 3.3
Total 329 72,011 1,244,620 100
Source: SEDECO 2016
The public markets play an important role in neighbourhood food supply, par-ticularly in low and middle-income areas. Markets such as La Merced, Sonora and Jamaica have a long history of satisfying the consumption demands of com-munities in different parts of the city and are great attractions during festivals and cultural celebrations. The San Juan market offers a wide variety of perishable products rarely found in other markets, including Asian seafood popular in city

HUNGRY CITIES REPORT NO. 7 29
restaurants. The Hidalgo market offers culinary products typically consumed by workers in the area.
Extended hours of service (for example, some Superama stores and convenience stores are open 24 hours a day) mean that the working population can make their store purchases at the end of the working day. Supermarkets cater to different cultural habits and diets, and especially to people concerned with health and product variety. The public markets handle low volume supply of products, lack modern management systems, and are unhygienic. Tenants in the public markets are very disadvantaged compared to large companies with the capacity to invest in promotions and advertising through radio, television, informational flyers and the like.
FIGURE 25: Spatial Distribution of Public Markets, Tianguis and “Concentrations”
Source: Hector Hernan Hidalgo

30 HUNGRY CITIES PARTNERSHIP
THE URBAN FOOD SYSTEM OF MEXICO CITY, MEXICO
FIGURE 26: Map of La Merced
Source: Maria Salamone
FIGURE 27: Nopales Vendor in La Merced
Source: Maria Salamone

HUNGRY CITIES REPORT NO. 7 31
FIGURE 28: Peppers for Sale in La Merced
Source: Maria Salamone
FIGURE 29: Vendor in La Merced
Source: Maria Salamone
6.4 Informal Food Retail
Informal street commerce has spread throughout the city in recent decades (Duhau and Giglia 2007). Street food stalls can be found at strategic points of constant foot traffic. Outside metro stations, informal activities cluster around entrances and exits to take advantage of the millions of residents using the met-ro on a daily basis. Access to public selling space and high-foot traffic areas in and around some of the city’s new inter-modal transit stations (CETRAM) is

32 HUNGRY CITIES PARTNERSHIP
THE URBAN FOOD SYSTEM OF MEXICO CITY, MEXICO
becoming increasingly limited, especially around stations developed in conjunc-tion with the private developers of upmarket shopping malls, such as Buenavista (Figure 30). In addition, some downtown municipalities, such as Cuauhtémoc and Benito Juarez, have adopted programmes to regulate and restrict informal vending in public spaces. Still, informal vendors work at thousands of street cor-ners and busy intersections across the city, or sell to car drivers as they wait at traffic lights or are stalled in the city’s notorious traffic jams. Informal vendors can also be found at bus and minibus stations, on pavement benches, outside hospitals, schools, markets, churches, and close to employment sites. Food sold by informal vendors often lacks minimum standards of hygiene and freshness because the merchants do not have their own infrastructure to maintain fresh food, or enough drinking water for food preparation. Although these foods are therefore considered unhealthy, they are consumed by clerical workers and other low-income residents.
In mixed-use residential areas such as the Condesa or Roma, a network of infor-mal and mobile food vendors on bicycles serve those working in low-wage jobs in construction, valet parking services, and private security for restaurants and bars. Also, on weekends, fresh produce is sold directly by producers from the back of their trucks to local residents in many different neighbourhoods. These kinds of informal and highly mobile food-vending activities are difficult to map. In addition, mapping exercises are challenged as many vendors who previously worked in fixed stalls now move constantly to avoid detection by police, espe-cially in the historic centre and public parks and plazas targeted by the local state’s crackdown on informal vending in public spaces (Crossa 2009). While informal food vending in the MCMA has always been a mobile activity, these activities are now more clandestine because of higher levels of surveillance by transit police and municipal officials.
Food vendors also work in temporary open-air (periodic) markets or tianguis. These date back to the pre-Hispanic period and are found throughout rural and urban Mexico. The oldest continuously operating tianguis has operated every Tuesday for over 500 years. In Cuautitlán, just outside Mexico City, this mar-ket has 7,500 vendors and covers 250,000 square metres. There are over 1,000 tianguis in Mexico City. Items sold include groceries, cosmetics, clothing, appli-ances, electronics, prepared foods, tools and used goods. Most tianguis have an administrator or administration committee to interact with the local authori-ties, allocate trading spaces and collect rental fees. Mexico City’s tianguis employ about 130,000 people and are controlled by 600 associations, each with up to 600 members. The largest tianguis in Mexico City is San Felipe de Jesus, which has 17,000 merchants and operates from Tuesdays to Saturdays. There are also many mobile markets on wheels with itinerant routes in different neighbour-hoods of the city.

HUNGRY CITIES REPORT NO. 7 33
FIGURE 30: Entrance to the Buenavista CETRAM with No Vendors Present
Source: Jill Wigle
FIGURE 31: Street Food Vendor
Source: Maria Salamone

34 HUNGRY CITIES PARTNERSHIP
THE URBAN FOOD SYSTEM OF MEXICO CITY, MEXICO
FIGURE 32: Food Vendor at Market on Wheels
Source: Maria Salamone
6.5 Urban Agricultural Production
There are three main types of agricultural production in the MCMA: urban, suburban and peri-urban (Table 13). The distribution of suburban and peri-urban agriculture is shown in Figure 33. Peri-urban agriculture is mainly prac-tised in the southwestern MCMA where 16,000 people are employed on 11,500 family farms (FAO 2014a). These farms produce maize, fruit, vegetables and animals for local consumption and sale. There is also larger-scale production of nopal, amaranth and vegetables for city markets. In 2012, the annual harvest included 336,000 tonnes of nopal, 147,000 tonnes of forage oats, 12,500 tonnes of potatoes and 15,000 tonnes of other vegetables and herbs. The crop was val-ued at USD100 million. The animal population is estimated at 7,000 head of cattle, 30,000 pigs, 10,000 sheep and 220,000 chickens (FAO 2014a). In gen-eral, as noted above, the area used for farming has been declining for several decades. Key factors in the abandonment of agriculture include urban sprawl, US-subsidized corn flooding Mexico, and “the weak development of group or individual distribution systems that go outside the local area” (Torres-Lima and Rodríguez-Sánchez 2008: 201). Closer to the city centre, suburban agriculture is practised in medium-density suburbs on smallholdings of 1 hectare or less. The main products are horticulture and floriculture, with some maize.

HUNGRY CITIES REPORT NO. 7 35
TABLE 13: Urban Agricultural Production in the MCMA
Space Production model
Systems of farm production
Systems of animal production
Urban New Home garden Beef and milk cattle, backyard poultry, pork and rabbits
Sub-urban Chinampa Vegetables and flowers, home garden, greenhouses
Beef and milk cattle, backyard poultry, pork and rabbits, traction animals
Peri-urban Terraces Nopal-vegetable, home garden, maize
Beef and milk cattle, backyard poultry, pork and rabbits, traction animals, bees
Source: Losada et al (2000)
FIGURE 33: Distribution of Peri-Urban and Suburban Agriculture in Mexico City
Source: FAO (2014a: 22)
Urban agriculture is in its infancy in Mexico City. The idea of cultivating within urban areas is not widespread and the high population density means that green spaces are scarce. In addition, the system of collection and distribution of sub-sidized food, together with the rapid growth of the informal food sector and supermarkets, have guaranteed a constant flow of food to all social classes. Buy-ing instead of producing food continues to be the most attractive option for most inhabitants of the capital.

36 HUNGRY CITIES PARTNERSHIP
THE URBAN FOOD SYSTEM OF MEXICO CITY, MEXICO
Despite low household participation rates in agriculture in the Federal District, urban agriculture has come to occupy a prominent place in the political agenda of the government of the Federal District through the efforts of its Secretariat for Rural Development and Equity for Communities and initiatives of NGOs, neighbourhood organizations and youth groups. The strategy focuses on provid-ing resources for organic production in community gardens, plots or backyards, both for self-consumption and as a source of income. Between 2007 and 2012, the secretariat invested USD6 million in 2,800 urban agriculture projects which directly benefited 15,700 inhabitants of the city. Another urban agriculture programme supported by the University of Chapingo cleans up garbage from ravines in marginalized areas of the city and plants gardens there (Dubois 2015).
FIGURE 34: Actively Farmed Part of the Chinampas in Xochimilco (within the Area Natural Protegida)
Source: Jill Wigle
7. URBAN FOOD SECURITY
7.1 Food Insecurity in Mexico
The Mexican Food Security Scale identifies four categories of food security: food secure, mildly food insecure, moderately food insecure and severely food insecure. Table 14 provides a breakdown of food security status by income quin-tiles in 2014 and shows a direct relationship between income and household food security status. In the lowest income quintile, 40% of the population are food secure, compared to 58% in the middle income quintile and 83% in the upper quintile. The figures are reversed for severe food insecurity at 19%, 10% and

HUNGRY CITIES REPORT NO. 7 37
3% respectively. Of the total population, only 59% are food secure, while the remaining 41% show some degree of food insecurity (with 10% severely food insecure). Table 15 indicates that levels of food insecurity are higher in rural than urban areas of the country.
TABLE 14: Levels of Food Insecurity and Income Quintiles in Mexico, 2014
Income quintilesLevel of food insecurity
Food secure
Mild food insecurity
Moderate food insecurity
Severe food insecurity
1 39.9 23.6 17.8 18.8
2 49.3 22.1 15.9 12.7
3 57.6 19.0 13.5 10.0
4 66.3 16.6 10.2 7.0
5 82.6 9.9 4.7 2.9
Total 59.2 18.2 12.4 10.3
Source: http://economia.nexos.com.mx/?p=101
TABLE 15: Rural and Urban Food Insecurity in Mexico, 2014
Location Level of food insecurity
Food secure Mild food insecurity
Moderate food insecurity
Severe food insecurity
Urban 63.4 16.5 11.0 9.2
Rural 45.9 23.6 16.8 13.6
Total 59.2 18.2 12.4 10.3
Source: http://economia.nexos.com.mx/?p=101
The food security of households in Mexico City was calculated from ENGAS-TO 2013 data.
Table 16 presents the results of the analysis of a sample of 1,785 households (rep-resenting 2,542,000 households) in Mexico City. A total of 71% of households were food secure, while 9% were moderately food insecure and 3% were severely food insecure. This means that 326,000 households were moderately or severely food insecure.
TABLE 16: Food Insecurity in Mexico City%
Food secure 70.6
Mildly food insecure 16.5
Moderately food insecure 9.3
Severely food insecure 2.6
Source: Data from ENGASTO 2013

38 HUNGRY CITIES PARTNERSHIP
THE URBAN FOOD SYSTEM OF MEXICO CITY, MEXICO
The National Institute of Public Health implemented a National Health and Nutrition Survey in the metropolitan zone of Mexico City in 1995, 2002 and 2007. The 2002 survey showed that the prevalence of child malnutrition was low (around 4%) in Mexico City and had declined since 1995. Undernutrition was concentrated in families with the highest levels of urban poverty. The study did not include undernourished children in rural areas of the Federal District and those living on the streets or in marginalized areas that were not part of the sam-pling frame. Ensanut data on children under 5 years of age showed that between 2006 and 2012, the prevalence of underweight increased from 9.7% to 10.2% (Encuesta Nacional de Salud y Nutrición 2006 y 2012).
A study of the links between malnutrition, food insecurity and poverty in a sample of 1,263 older residents (over 70 years old) living in poor areas in the MCMA found that 32% of households had run out of money to buy food in the previous year; 20% had eaten less than they thought they should because there was not enough food; 19% had reduced the size of meals; and 4% had not eaten for a whole day (Rivera-Marquez 2005). There was a clear relationship between income and the severity of each experience with frequency of food deprivation much higher in the lowest-income quintile and improving as income increased. The difference between the lowest and highest income quintiles was 17%, 22%, 6% and 9% respectively for the four questions (Table 17).
TABLE 17: Food Insecurity Among Elderly ResidentsIncome quintile 1 2 3 4 5 Total
In the past year did you or your household ever:
a. Run out of money to buy food? 39.5 34.8 30.2 30.8 22.6 31.6
b. Cut the size of meals because there was not enough food in the house? 31.2 20.9 15.9 19.4 9.1 19.3
c. Not eat for a whole day because there was no food or money to buy food? 7.5 5.9 2.0 3.6 1.6 4.1
d. Eat less than you thought you should because there was not enough food? 28.1 25.7 17.9 16.6 10.3 19.7
Source: Rivera-Marquez (2008: 250)
The nutrition transition in Mexico City, like the rest of the country, has meant that problems associated with food insecurity are not limited to the lack of food intake, but include more complex problems associated with poor diet such as being overweight and obese (Rivera et al 2002). The 2012 National Survey of Health and Nutrition (http://ensanut.insp.mx) found that in the MCMA, almost seven million people were overweight and five million were clinically obese – a total of 56% of the city’s population. Between 2000 and 2012, adult obesity increased from 16% to 26% of the city’s population. More women (28%) than men (24%) were obese, while 35% of children aged 5-11 were either overweight or obese. Overweight and obesity rates also increased with age. According to

HUNGRY CITIES REPORT NO. 7 39
2012 Ensanut data, 8% of children under five, 35% of primary school children (5-11 years old), 39% of adolescents (12-19 years old) and 74% of adults (20-65 years old) were overweight or obese.
The high prevalence of overweight and obesity is associated with high rates of non-communicable diseases such as diabetes, hypertension and cardiovascular disease. There is a very high prevalence (15%) of diabetes mellitus among the population over 30 years of age in Mexico City and after the age of 50, preva-lence rises to 20%. One-third of diabetics are unaware that they have this dis-ease. Five percent of the population over 20 years of age are glycaemic and this percentage doubles for those over 60 years old. Pre-diabetic glycaemia is more common in those with obesity. Anaemia is another important health problem in the population, especially among preschool children. The Esanut results showed that the prevalence of anaemia in children from 1 to 4 years of age in 2012 was 23%; in primary-school-age children it was 10%; in adolescents 6%; in adults 7%; and in those over 60 years old 15%.
The majority of the population are unaware of the relationship between eating habits and the risk of chronic disease. Their access to nutritional knowledge and information about balanced food consumption is very limited. Diets are char-acterized by low consumption of fruit and vegetables, limited consumption of dietary fibre and antioxidants, and consumption of processed and animal prod-ucts, sugars, refined flour and saturated fats. Tortilla, oil and sugar are among the foods most frequently consumed by all socioeconomic groups. The biennial household income-expenditure surveys of the National Institute of Statistics and Geography (INEGI) show that diet is related to family income. Higher-income rural and urban households have more diverse and energy-dense diets. Urban diets include higher consumption of cheese, bread, meat, fish and milk than rural diets. Sugary drinks, whether beverages prepared from fruit or bottled soft drinks, contribute significantly to sugar consumption.
7.2 Food Expenditure Patterns
Table 18 presents information on the average quarterly expenditure on food per household by income deciles. Households in the highest decile have the great-est expenditure on food and the lowest proportion of income spent on food (at MXN27,100 and 23%). Households in the three lowest income deciles have the lowest food expenditure and highest proportion spent on food (MXN7,800-MXN9,700 and 40%-42%). In general, the greater the household income, the more money spent on food and the less the proportion of household income spent on food.

40 HUNGRY CITIES PARTNERSHIP
THE URBAN FOOD SYSTEM OF MEXICO CITY, MEXICO
TABLE 18: Average Quarterly Household Expenditure on Food by Income Deciles, 2014
Income deciles Average total expenditure (MXN)
Average expenditure on food (MXN)
Food as proportion of total expenditure (%)
1 26,063 7,810 39.6
2 21,901 8,736 41.0
3 23,986 9,743 41.5
4 29,092 11,427 41.5
5 31,745 12,236 40.3
6 38,264 12,889 35.8
7 41,954 14,606 36.1
8 55,348 15,964 31.9
9 73,186 21,721 31.6
10 142,364 27,099 22.5
Source: Data from Household Income and Expenditure Survey (ENIGH), 2014
Table 19 shows the average household expenditure by type of food. A total of 34% of food expenditure goes on foods consumed outside the home, followed by meat (17%), cereals (9%) and milk and milk products (8%). Only 6% is spent on vegetables and 4% on fruit. Expenditure on other, less healthy, foods is lower including sugar and honey (0.3%); coffee, tea and chocolate (0.5%); oils and fats (0.6%); and spices and dressings (0.6%).
7.3 Variations in Food Prices
The National Consumer Price Index (INPC) is an economic indicator that measures variation over time in the price of a fixed basket of goods and services representative of household consumption. The basic Mexican basket includes about 80 food items (Banxico 2012, INEGI 2011a). Figure 35 shows the annual increase in the price of the basket in the Federal District between 2004 and 2014.
Table 20 provides a price comparison for various edible processed products at four different points of sale in April 2016 (grocery store, public market, market on wheels and tianguis). Six of the 32 products were cheapest in grocery stores (including oil, baby food and bread rolls), seven were cheapest in public markets, four items were cheapest at markets on wheels and the remaining 15 products were cheapest in the tianguis. Overall, the tianguis were the cheapest source of food on the list (at MXN843.93), while the most expensive is grocery stores (at MXN889.70).

HUNGRY CITIES REPORT NO. 7 41
TABLE 19: Household Expenditure by Food Item, 2014Average quarterly expenditure (MXN) % of total
Food consumed outside household 5,083 34.3
Meat 2,536 17.1
Cereals 1,388 9.4
Milk and milk products 1,226 8.3
Vegetables and legumes 984 6.0
Alcoholic and non-alcoholic beverages 707 4.8
Fruit 656 4.4
Eggs 297 2.0
Fish and seafood 273 1.8
Grain and seeds 139 0.9
Tubers 123 0.8
Spices and seasonings 82 0.6
Oils and fats 82 0.6
Coffee, tea and chocolate 71 0.5
Sugar and honey 51 0.3
Other 1,056 7.1
Source: Data from Household Income and Expenditure Survey (ENIGH), 2014
FIGURE 35: Annual Increase in Cost of Food Basket in Federal District, 2004-2014
Source: Secretariat of Economic Development of the Federal District

42 HUNGRY CITIES PARTNERSHIP
THE URBAN FOOD SYSTEM OF MEXICO CITY, MEXICO
TABLE 20: Comparative Prices of Food Items by Source, April 2016
Product Grocery stores
Public market
Market on wheels Tianguis
Coffee beans, Internacional/Portales (908g) 148.85 148.50 130.92 142.92
Honey, Carlota (500g) 57.97 56.75 52.88 55.87
Powdered chocolate, Choco Milk (800g) 57.28 49.50 50.75 45.75
Powdered milk, Nido (360g) 56.16 57.38 54.71 51.36
Coronado Caramel (550g) 56.08 60.88 56.25 53.13
Chocolate bar, Ibarra (540g) 52.88 55.92 53.25 53.25
Chicken concentrate, Knorr Suiza (450g) 42.57 45.38 39.75 39.54
Instant coffee, Nescafé (95g) 42.97 40.67 42.29 39.69
Cookies, María Gamesa (850g) 34.80 32.75 37.25 34.93
White eggs 30.46 26.08 26.25 25.75
Big box bread, Bimbo Grande (680g) 27.45 27.31 27.38 27.38
Mayonnaise, McCormick (390g) 22.90 20.67 24.25 21.21
Sardines, Calmex (425g) 22.24 24.50 22.42 22.13
Tomato purée, La Costeña (800g) 22.04 20.00 22.25 20.42
Oil (1-2-3) 20.64 21.50 23.63 22.17
Tea bags, McCormick (250g) 19.16 18.25 15.00 14.63
Sugar 18.12 13.50 13.83 13.33
Marmalade, McCormick (350g) 17.38 21.00 19.88 17.08
Condensed milk, Nestlé (397g) 17.06 16.35 16.00 15.90
Wheat flour, Tres Estrellas 14.86 14.25 13.17 14.44
Mustard, McCormick (210g) 14.47 14.00 16.25 16.15
Cornflour, Minsa 12.36 12.25 14.75 12.88
Leche Evaporada Carnation Clavel (470g) 12.21 12.79 12.04 11.25
Tuna in oil, Dolores/Nair (140g) 11.91 12.04 12.17 11.08
Corn tortillas 10.14 11.50 10.82 10.82
Baby food, Gerber 1st stage 9.16 9.25 11.38 11.71
Jelly, D’gari (140g) 8.46 8.92 8.54 8.50
Refined salt, La Fina 8.79 8.25 8.17 9.75
Jalapeño chillies, La Costeña (220g) 7.57 7.19 8.29 8.83
Sweet bread 5.82 5.50 5.66 5.66
Pasta for soup, La Moderna (200g) 5.50 5.13 5.58 4.96
Bread roll 1.47 1.50 1.48 1.48
Total 889.70 879.44 857.22 843.93
Source: http://elinpc.com.mx/canasta-basica-mexicana/Note: Cheapest location of each product italicized

HUNGRY CITIES REPORT NO. 7 43
7.4 Policies to Combat Hunger and Food Insecurity
7.4.1 Federal Government
Under Enrique Peña Nieto’s presidency, which began in 2012, a social poli-cy to combat poverty, malnutrition and social marginalization, known as the “National Crusade against Hunger”, was implemented. This intends to put into effect new public policy in matters of food, health, education and housing. The National System against Hunger (SinHambre), created in 2013, joins this cause with five instruments and basic applications:
mechanism of coordination between dependencies of the federal govern-ment for the implementation, operation, supervision and evaluation of public policy actions. It is headed by the Secretariat of Social Development.
-tive entities and municipalities, with the objective of coordinating with local governments actions and investments at the territorial level.
-logue between the public, private and social sectors.
-cialists.
in the crusade and to collaborate actively in the identification of needs, defi-nition of local priorities and also actions (Social 2016).
There are five main goals:
in extreme multidimensional poverty [with] lack of access to food.
and height.
-bution and marketing.
According to a report on an investigation published by national newspaper Milenio, the government’s strategy has “half fulfilled” its purpose and left sta-tistical holes that point to the falsification of data. The probe was carried out through the processing of 300,000 official and public independent databases of social strategy beneficiaries at the local level. Among the criticisms of public policy during Peña Nieto’s presidency are that the crusade has been flawed since its inception, partly because of a lack of a methodology to identify people in con-

44 HUNGRY CITIES PARTNERSHIP
THE URBAN FOOD SYSTEM OF MEXICO CITY, MEXICO
ditions of true extreme poverty or food shortage. It is also claimed that coverage is unequal because it is less than 40% in states where poverty is extreme, exten-sive and systemic. At the municipal level, Milenio states that of the 150 poorest municipalities in the country (where more than a third of the population lives in extreme poverty), coverage is only 41%. In the 150 municipalities with the low-est level of extreme poverty, average coverage is 137%. A report from the Audi-toria Superior de la Federación indicates that the crusade has not fought hunger sufficiently. The strategy planned to cover 5.3 million people in 2014 and 7.1 million people in 2015; however, only 4.5 million were covered in 2015 (Datalab 2016). There is still insufficient information, diversion of resources, operational inefficiency and a lack of planning to achieve long-term goals and objectives.
7.4.2 Federal District
The right to food was recognized in the Constitution by a decree published in the Official Gazette of the Federation dated October 13, 2011. Article Four states that “everyone has the right to adequate, nutritious and quality food. The State will guarantee it.” The Law on Food Security and Nutrition for the Federal District, which was published on September 17, 2009, aims to establish priority strategic activities and guarantees the universal right to food and food security for all the inhabitants of the Federal District. The law institutionalizes policy by mandating the creation and implementation of the Federal District System for Food and Nutrition Security (SDFSAN) and the elaboration of the Food and Nutrition Security Programme as the planning instrument of the system. It defines responsibilities and estimates the budgetary resources needed for the activities, actions and goals for achieving food security and adequate nutrition.
The agreement mandating the creation of the SDFSAN established the Social Development Secretariat of the Federal District, the System for the Integral Development of the Family of the Federal District, and the Trust for the Con-struction and Operation of the Food Supply Centre of Mexico City. The SDF-SAN led to the creation of a new social programme, Aliméntate, whose rules of operation were published in March 2015. This added to other programmes and actions to ensure the food security of the population, and included the school breakfast and the community, public and popular soup kitchen programmes, the food pension for adults over 68 years of age (PRAAPAM), and support for single mothers. A study of older residents in poor areas of the city in 2002 found that 51% were receiving food pensions and 36% received free milk (Rivera-Mar-quez 2005). Less than 1% patronized community kitchens. The main impact of PRAAPAM was to increase dietary diversity among the elderly. A more recent study of the elderly found that cash transfers were significantly associated with a lower probability of being moderately to severely food insecure (Vilar-Compte et al 2016).

HUNGRY CITIES REPORT NO. 7 45
TABLE 21: Social Programs in Mexico CityAspect of food security addressed:
Availability Accessibility Consumption Utilization
Aliméntate program * * *
Food pension for adults over 68 years (PRAAPAM) *
Public soup kitchens * * *
Community soup kitchens * * *
Small-scale sustainable agricul-ture program *
Food culture, artisanal culture, commercial linking and promo-tion of interculturality and rurality in Mexico City
*
Agricultural and rural develop-ment program *
SaludArte program of services * * *
Popular soup kitchens * * *
School breakfast program * * *
Program of delivery of food vouchers to population in condi-tions of vulnerability
* * *
Programs of support and feeding at the CENDI’S * * *
Program for Your Family: Let’s Weigh Less, Live More * * *
Program for the delivery of nutri-tional bars to elementary school children
* *
Social development and support program * * *
Program to support priority and vulnerable groups *
Development and social assis-tance program * *
Nutrition for Your Family Program * * *
Healthy Baby: Happy Mom Program * * *
Improving Food for Older Adults Program * * *
Support Program for Childhood Development PADI * *
Nutrition program * * *
Support program for people with disabilities * * *
Elderly support program * * *
Social development program “La Protectora” * * *
Integral Program to support producers of nopal 2015 *
“Huehuetlatoli” Program * * *

46 HUNGRY CITIES PARTNERSHIP
THE URBAN FOOD SYSTEM OF MEXICO CITY, MEXICO
Program for sustainable rural development of Milpa Alta 2015 *
Social Assistance program * * *
Program for edible forests and urban orchards *
Delegation program for rural development 2015 *
Food Program to Centres of Child Development * * *
Comprehensive care for female heads of household in social vulnerability
* *
Basic food pantries for vulner-able population * * *
Source: Based on 2015 Rules of Operation
TABLE 22: Food Assistance for Elderly ResidentsFood Programmes %
PRAAPAM 51.2
Milk 36.3
Free food baskets, meals, food items, food banks 7.7
Food vouchers (from job) 4.2
Discount card from INAPAM 3.6
School breakfast 3.2
Subsidized foods 1.4
Community kitchens, prepared meals 0.8
Other cash transfers 0.2
Food assistance other than PRAAPAM 46.0
Source: Rivera-Marquez (2005: 175)
8. CONCLUSION
The Hungry Cities Partnership conducted a city-wide survey of household food security and food sourcing patterns in Mexico City in 2016. The results, which will be published in a forthcoming HCP Report, will add considerably to the picture painted in this report and provide a city-wide picture of food insecurity and the governance challenges it poses.

HUNGRY CITIES REPORT NO. 7 47
9. REFERENCES
1. Ángeles-Castro, G. (2013). “Crecimiento económico y desarrollo humano en la ciudad de México con respecto a un entorno nacional: una perspectiva neoclásica y dualista”. Economía, sociedad y territorio,13(42), 431-457.
2. Arroyo, P., Loria, A. and Méndez, O. (2004). “Changes in the Household Calories Supply during the 1994 Economic Crisis in Mexico and its Impli-cations on the Obesity Epidemic” Nutrition Reviews 62: 163-168.
3. Bargueño, M. (2014). Comer sano es de ricos? At: http://afaramos.blogspot.ca/2014/11/comer-sano-es-de-ricos.html
4. Becker, A. and Muller, M-M. (2013). “The Securitization of Urban Space and the ‘Rescue’ of Downtown Mexico City: Vision and Practice” Latin American Perspectives 189: 77-94.
5. Bertran, M. (2015). Incertidumbre y vida cotidiana. Alimentación y salud en la Ciudad de México (UAM, ed. UOC).
6. Boltvinik, J. (1994). El Colegio de la Frontera Norte. At: http://www.colef.mx/fronteranorte/articulos/FNE1/2-fe1.pdf
7. CEFP (2009). Perfil Socioeconómico del Distrito Federal. (Mexico City: Centro de Estudios de las Finanzas Públicas, Palacio Legislativo de San Lázaro).
8. CONAPO (2012), Índice de marginación Urbana 2010. At: http://www.conapo.gob.mx/en/CONAPO/Indice_de_marginacion_urbana_2010
10. Connolly P. (2005). “Tipos de poblamiento en la Ciudad de México” At: http://www.ocim.azc.uam.mx/OCIM-SIG%20ABRIL/poblamiento.pdf
11. Connolly, P. (2010). “Observing the Evolution of Irregular Settlements: Mexico City’s Colonias Populares, 1990 to 2005” International Development Planning Review 31: 1-35.
12. Connolly, P and Wigle, J. (2017). “(Re)constructing Informality and “Doing Regularization” in the Conservation Zone of Mexico City” Plan-ning Theory and Practice 18: 183-201.
13. Crossa, V. (2009). “Resisting the Entrepreneurial City: Street Vendors’ Struggle in Mexico City’s Historic Center” International Journal of Urban and Regional Research 33: 43-63.
14. Damián, A. (2015). Julio Boltvinik.org. At: http://www.julioboltvinik.org/images/stories/pobreza%20presentacin%20de%20resultados%202014%20conferencia%20de%20prensa.pdf

48 HUNGRY CITIES PARTNERSHIP
THE URBAN FOOD SYSTEM OF MEXICO CITY, MEXICO
15. Dubois, E. (2015). “From Garbage to Gardens: Urban Agriculture in Mex-ico City” Master of Community and Regional Planning Thesis, University of New Mexico, Albuquerque, New Mexico.
16. Duhau E. and Giglia A. (2007). “Nuevas centralidades y prácticas de con-sumo en la Ciudad de México: del micro comercio al hipermercado” En Revista Eure 33(98): 77-95.
17. Esquivel, V. (2010). The Informal Economy in Greater Buenos Aires: A Statistical Profile. Cambridge, MA: WIEGO.
18. FAO (n.d.). Una introducción a los conceptos básicos de la seguridad alimentaria. At: http://www.fao.org/docrep/014/al936s/al936s00.pdf
19. FAO (2014a). “Mexico City”. In Growing Greener Cities in Latin America and the Caribbean (Rome FAO), pp. 21-29.
20. FAO (2014b). Panorama de la Seguridad Alimentaria y Nutricional en América Latina y el Caribe. At: http://www.fao.org/docrep/019/i3520s/i3520s.pdf
21. Gasca, J. and Torres T. (2014). “El control corporativo de la distribución de alimentos en México” Revista Problemas del Desarrollo 176(45): 133-155.
22. Gutiérrez, A. (2016). “Cuál es el estado de la seguridad alimentaria en México?” Nexos 2 June. At: http://economia.nexos.com.mx/?p=101
23. Herrera, J., Kuepie, M., Nordman, C., Oudin, X. and Roubaud, F. (2012). Informal Sector and Informal Employment: Overview of Data for 11 Cities in 10 Developing Countries (Cambridge, MA: WIEGO).
24. INCAP (2006). “Alternativas para desarrollar la producción agrícola en áreas urbana y peri-urbana” At: www.incap.int/portaleducativo/index.php/es/recursos/reservorio-san/doc_view/421-ficha-tecnologica-3-alternativas-de-produccion-urbana
25. INEGI (2015). Sistema de Cuentas Nacionales de México, Medición de la Economía Informal: Fuentes y Metodología (Mexico City: Instituto Nacional de Estadística y Geografía).
26. Janssen, W. (2012). Banco Mundial. At: http://www.bancomundial.org/es/news/feature/2012/09/13/america_latina_crisis_precio_alimentos
27. Losada, H., R. Bennett, J. Vieyra, R. Soriano, J. Cortes and S. Billling (2000). “Recycling of Organic Wastes in the East of Mexico City by Agri-cultural and Livestock Production Systems”. At: http://www.ias.unu.edu/proceedings/icibs/ic-mfa/losada/paper.html
28. Monterrubio, A. (2013). Estado actual del régimen de planeación y ordenamiento

HUNGRY CITIES REPORT NO. 7 49
territorial metropolitano en México. Documento de trabajo no. 151, Centro de Estudios Sociales y de Opinión Pública, XVII Legislatura, Cámara de Diputados, México.
29. Organización Internacional de Trabajo (OIT). 2014. El empleo informal en México: Situación actual, políticas y desafíos. Oficina Regional para América Latina y Caribe.
30. Parnreiter, C. (2002). “Ciudad de México: el camino hacia una ciudad global” EURE (Santiago), 28(85), 89-119.
31. Programa de Ordenación de la Zona Metropolitana del Valle de México (2012), PUEC, UNAM.
32. Rello F. (1989) “El abasto de frutas y legumbres en México” en Revista Comercio Exterior, vol. 39, núm. 9, México. pp.791-798.
33. Rivera-Marquez, J. (2005). “Malnutrition, Food Insecurity and Poverty in Older Persons from Mexico City” PhD Thesis, London School of Hygiene and Tropical Medicine, London.
34. Rivera, J., Barquera, S., Campirano, F. and Campos, I. (2002). “Epide-miological and Nutritional Transition in Mexico: Rapid Increase of Non-Communicable Chronic Diseases and Obesity” Public Health Nutrition 5: 113-22.
35. Roldán, N. (2015). México, el país de la OCDE con el mayor aumento de precios de alimentos. At: http://afaramos.blogspot.ca/2014/11/comer-sano-es-de-ricos.html
36. Social, Secretaría de Desarrollo (2016). “Cruzada Nacional Contra el Hambre” At: http://www.gob.mx/sedesol/acciones-y-programas/cruzada-nacional-contra-el-hambre-18938
37. STPS (Subsecretaría de Empleo y Productividad Laboral) (2016). Distrito Federal: Información Laboral (Mexico City: Secretaría del Trabajo y Pre-visión Social).
38. Torres T. (2003). “Los limites de la globalización en el sistema de abasto alimentario de la ciudad de México” en El abasto alimentario en la Ciudad de México y su zona metropolitana retos y perspectivas en el siglo XXI. Cámara de Comercio de la Ciudad de México, Central de Abasto de la Ciudad de México, Programa Universitario de Alimentos UNAM, Central de Abas-tos de la Ciudad de México, A.C. pp.19-55.
39. Torres, F. (2007). Cambios en el patron alimentario. Problemas de Desarrollo, 38(151).

50 HUNGRY CITIES PARTNERSHIP
THE URBAN FOOD SYSTEM OF MEXICO CITY, MEXICO
40. Torres Salcido G. (2010). Distribución de alimentos. Mercados y políticas Sociales. Centro de Investigaciones Interdisciplinarias en Ciencias y Humanidades, Universidad Nacional Autónoma de México, México.
41. Torres-Vera, M.., Prol-Ledesma, R., and Garcia-Lopez, D. (2009). “Three Decades of Land Use Variations in Mexico City” International Journal of Remote Sensing 30: 117-138.
42. Torres-Lima, P. and Rodríguez-Sánchez, L. (2008). “Farming Dynamics and Social Capital: A Case Study in the Urban Fringe of Mexico City” Environment, Development and Sustainability 10: 193-208.
43. Vilar-Compte, M., Martínez-Martínez, O., Orta-Alemán, D. and Perez-Escamilla, R. (2016). “Functional Limitations, Depression, and Cash Assis-tance are Associated with Food Insecurity among Older Urban Adults in Mexico City” Journal of Health Care for the Poor and Underserved 27: 1537-1554.
44. Wigle, J. (2010a). “The ‘Xochimilco Model” for Managing Irregular Set-tlements in Conservation Land in Mexico City” Cities 27: 337-47.
45. Wigle, J. (2010b). “Social Relations, Property and ‘Peripheral’ Informal Settlement: The Case of Ampliación San Marcos, Mexico City” Urban Studies 47(2): 411-36.
46. Wigle, J. (2014). “The ‘Graying’ of ‘Green’ Zones: Spatial Governance and Irregular Settlement in Xochimilco, Mexico City” International Journal of Urban and Regional Research 38: 573-589.

This report provides an overview of Greater Mexico City and its food system. The city’s history, demographic characteristics, geography and economy are first discussed. The city’s urban food system and urban food security are then examined with a particular focus on formal and informal food retail, food expenditure patterns, and policies to combat hunger and food insecurity. Meeting the daily food demands of Mexico City’s over 20 million inhabitants requires the agricultural production of Mexico’s rural areas, its fishing industry and food imports. Food products arrive in the city from around the country in a combination of traditional and highly sophisticated modern systems of food supply and distribu-tion. Structural changes in recent decades have led to modifications in the systems of supply, distribution and food consumption with vertically integrated companies now controlling aspects of the food chain. The system of supply and marketing of food products is also character-ized by competition between public markets, large wholesale and retail companies, and neighbourhood convenience stores. While levels of household food insecurity (undernutrition) are lower than in other global cities of the South, Mexico City faces an epidemic of overnutrition, obesity and non-communicable diseases.
HUNGRY CITIES PARTNERSHIP