Hornsea Offshore Wind Farm Project One List of Tables Table 1: Areas of physical disturbance...
58
S5810.2 18923112 1 GMM Hornsea Offshore Wind Farm Project One Clarification Note relating to the In-combination impacts of the onshore cable connection on the features of the Humber Estuary SPA and Ramsar site Appendix V to the Response submitted for Deadline IV Application Reference: EN010033 22 April 2014
Transcript of Hornsea Offshore Wind Farm Project One List of Tables Table 1: Areas of physical disturbance...
S5810.2 18923112 1 GMM
Hornsea Offshore Wind Farm
Project One
Clarification Note relating to the In-combination impacts of the
onshore cable connection on the features of the Humber Estuary
SPA and Ramsar site
Appendix V to the Response submitted for Deadline IV
Application Reference: EN010033
22 April 2014
1
Hornsea Offshore Wind Farm
Project One
Clarification note relating to the in-combination impacts of the onshore cable connection on the
features of the Humber Estuary SPA and Ramsar site
March 2014

2
SMart Wind Limited
11th Floor
140 London Wall
London
EC2Y 5DN
Tel 02077765500
Email [email protected]
Document title Clarification note relating to the in-combination impacts of the
onshore cable connection the features of the Humber Estuary
SPA and Ramsar site
Document Reference UK04-050209-CLR-0001
Status FINAL
Version 0.4
Date 21/03/2014
Project name Hornsea Offshore Wind Farm, Project One
Client SMart Wind Ltd. on behalf of Heron Wind Limited, Njord Limited and Vi
Aura Limited (together the ‘Applicant’)
Authorisation
Signed Chris Jenner
For SMart Wind Ltd on behalf of Heron Wind Limited, Njord Limited and Vi
Aura Limited (together the ‘Applicant’)
Date/Print Name 21/03/2014
Position Consents Manager

3
Table of Contents
1 CLARIFICATION NOTE relating the in-combination impacts of the onshore cable connection the features of the Humber Estuary SPA and Ramsar site ......................................................................................................... 5
1.1 Introduction ............................................................................................ 5
1.2 In-combination assessment with Tetney Sea Line Replacement Project 5
1.3 Intertidal Construction Activities ............................................................ 6
1.4 In-combination construction scenarios .................................................. 7
1.5 In-combination assessment ................................................................. 13
1.6 Conclusions ......................................................................................... 37
1.7 References .......................................................................................... 37

4
List of Tables
Table 1: Areas of physical disturbance associated with construction activities for Project One and Project Two ............................................................................................. 8
Table 2: Construction schedules for possible in-combination scenarios for the installation of the Project One and Project Two export cables. .............................................. 10
Table 3: Assessment of effects from in-combination construction scenarios on dunlin ............ 15
Table 4: Assessment of effects from in-combination construction scenarios on grey plover .... 18
Table 5: Assessment of effects from in-combination construction scenarios on ringed plover ................................................................................................................... 20
Table 6: Assessment of effects from in-combination construction scenarios on oystercatcher ....................................................................................................... 23
Table 7: Assessment of effects from in-combination construction scenarios on knot ............... 25
Table 8: Assessment of effects from in-combination construction scenarios on sanderling ..... 28
Table 9: Assessment of effects from in-combination construction scenarios on curlew ............ 30
Table 10: Assessment of effects from in-combination construction scenarios on bar-tailed godwit .................................................................................................................. 32
Table 11: Assessment of effects from in-combination construction scenarios on common tern ...................................................................................................................... 36

5
1 CLARIFICATION NOTE RELATING THE IN-COMBINATION IMPACTS OF THE ONSHORE CABLE CONNECTION THE FEATURES OF THE HUMBER ESTUARY SPA AND RAMSAR SITE
1.1 Introduction
1.1.1 This clarification note has been prepared in respect of the application for a
development consent order (DCO) to the Secretary of State under the Planning
Act 2008 (‘the Application’) by SMart Wind Ltd on behalf of Heron Wind Limited,
Njord Limited and Vi Aura Limited (the ‘Applicant’) for the Hornsea Project One
Offshore Wind Farm (‘Project One’).
1.1.2 Natural England submitted a relevant representation to the Planning Inspectorate
(PINS) on 24th October 2013. They raised a number of points relating to impacts
of construction activities in the intertidal area on the Humber Estuary SPA and
Ramsar site in the Habitat Regulations Assessment (HRA) Report (Section 6).
The Applicant met with Natural England for discussions on these issues on 5th
November and 2nd December 2013.
1.1.3 The Royal Society for the Protection of Birds (RSPB) also raised issues in
relation to the impacts of construction activities on the Humber Estuary SPA and
Ramsar site (email from RSPB, dated 12th September 2013). The Applicant met
with RSPB, to discuss these issues, on 11th September, 7th November and 4
December 2013.
1.1.4 A clarification note was produced by the Applicant in response to Natural
England’s and RSPB’s concerns and submitted in the Applicant’s response to
Deadline 2 on the 20th January 2014 (Appendix T). The note addresses the
effects of Project One alone on the features of the Humber Estuary SPA and
Ramsar site.
1.1.5 Natural England raised concerns within their written representation received by
the Applicant on the 20th January 2014 regarding the potential for in-combination
effects on the features of the Humber Estuary SPA and Ramsar site from Project
One and Hornsea Project Two.
1.1.6 This clarification note provides further information on the potential in-combination
effects that may occur as result of the installation of the export cables for Project
One and Hornsea Project Two and the Philips Tetney Sea line replacement
project on the features of the Humber Estuary SPA and Ramsar site.
1.2 In-combination assessment with Tetney Sea Line Replacement Project
1.2.7 The potential effects of the intertidal construction works associated with Project
One have been assessed in combination with those predicted to arise from
Tetney Sea Line Replacement Project. Phillips 66 Ltd proposes to replace a 4.5

6
km section of the onshore crude oil pipeline from an offshore buoy to Tetney
Tank Farm (RPS 2014). The landfall for the Phillips 66 pipeline is at Northcoates
Point to the north of Horseshoe Point. The intertidal works for the Phillips 66
pipeline will be within 1 km of those for Project One export cable.
1.2.8 Due to the proximity of the Phillips 66 pipeline to the landfall site of Project One,
works are likely to affect many of the same bird species using the intertidal area
as Project One. There is potential for an in-combination effect as a result of
habitat disturbance and loss, and species disturbance and displacement.
1.2.9 The construction works for the Phillips 66 pipeline are programmed to take place
between June 2014 and September 2015 (RPS 2014), although this is subject to
consent. If this timetable were to be followed for the Phillips 66 pipeline and
intertidal works on Hornsea Project One began at the earliest likely timescale of
April 2016, then there would be no overlap in construction activities.
1.2.10 There is no predicted overlap in construction timescales between the Phillips 66
pipeline and the cable landfall for Project One, so there will be no cumulative
disturbance impacts with respect to those birds using intertidal habitat.
1.2.11 Intertidal works for the Phillips 66 pipeline will result in temporary disturbance to
intertidal habitats. These habitats have been assessed as having low sensitivity
to the impacts of pipeline construction, with their infaunal and epifaunal species
having high rates of recovery i.e. recovery within months of disturbance (RPS
2014). Given the intertidal habitats temporarily disturbed by Phillips 66 pipeline
works are expected to recovery prior to the intertidal construction works of
Project One export cable, no cumulative impact of habitat loss for intertidal is
predicted.
1.3 Intertidal Construction Activities
1.3.12 Details of the intertidal construction work for Project One have previously been
described in the following documents:
• The Project Description; Volume 1, Chapter 3, PINS Doc ref No (7.1.3);
• The Habitats Regulation Assessment (HRA) Report (PINS Doc ref No 12.6); and
• The Clarification Note Relating to the Impacts of the Export Cable Installation on Intertidal Birds and the Humber Estuary SPA and Ramsar Site’ (Appendix T of the Applicant’s response to Deadline 2).
1.3.13 Of particular relevance was the clarification note, which contained more detailed
information on proposed construction methodologies and timings associated with
the installation of the export cable.
1.3.14 At this stage, there is no detailed information (i.e., preliminary environmental
information or formal application) publicly available in relation to Project Two. In
order to undertake a meaningful in-combination assessment, information is
required on the sequence of construction work and the nature of the works
7
themselves. Given that no such information is available, for the purposes of this
assessment it has been assumed that the intertidal construction works of Project
One and Project Two will use similar techniques and that the potential effects of
each project will be the same. The Project Two cable corridor is proposed to run
just to the north of Project One cable corridor (see Vol. 1 Chapter 3, Figure 3.14
of the Project One ES (PINS Doc ref No 7.1.3)). As both projects progress, an
increasing level of detail is being made available, although the key remaining
uncertainty is timing. In both cases, the detailed design and implementation of
the construction work will still be dependent on design finalisation by the
appointed contractor.
1.4 In-combination construction scenarios
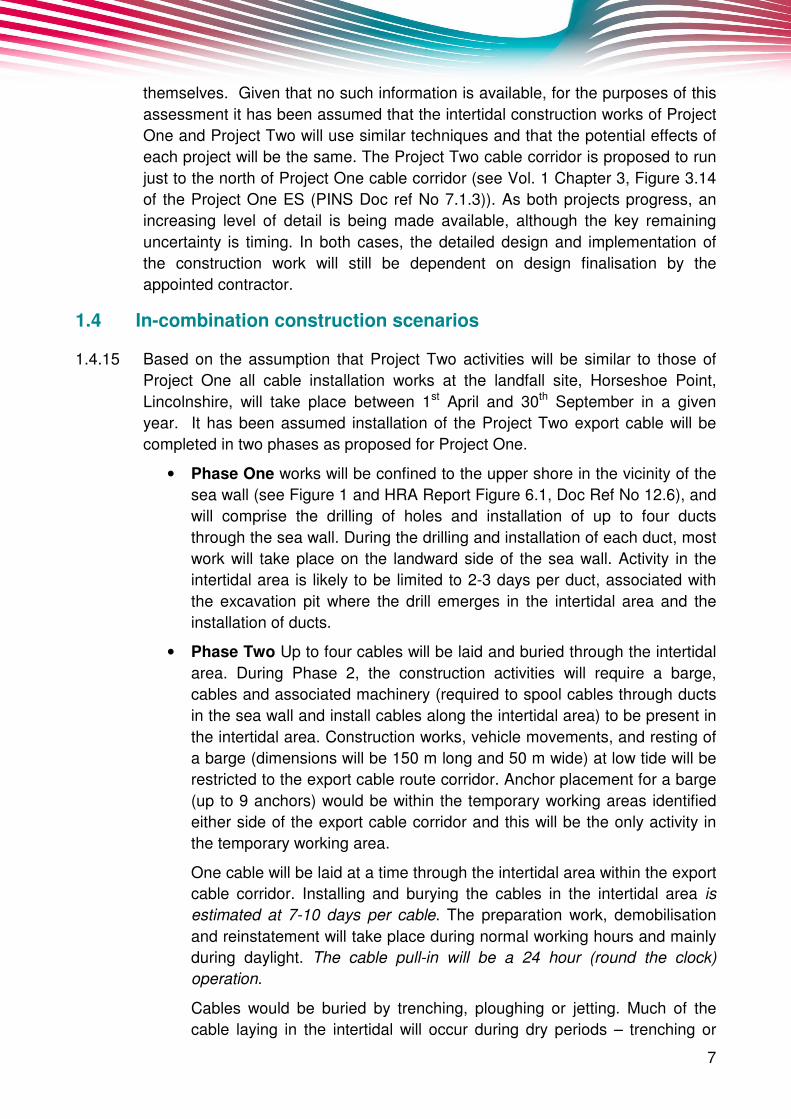
1.4.15 Based on the assumption that Project Two activities will be similar to those of
Project One all cable installation works at the landfall site, Horseshoe Point,
Lincolnshire, will take place between 1st April and 30th September in a given
year. It has been assumed installation of the Project Two export cable will be
completed in two phases as proposed for Project One.
• Phase One works will be confined to the upper shore in the vicinity of the
sea wall (see Figure 1 and HRA Report Figure 6.1, Doc Ref No 12.6), and
will comprise the drilling of holes and installation of up to four ducts
through the sea wall. During the drilling and installation of each duct, most
work will take place on the landward side of the sea wall. Activity in the
intertidal area is likely to be limited to 2-3 days per duct, associated with
the excavation pit where the drill emerges in the intertidal area and the
installation of ducts.
• Phase Two Up to four cables will be laid and buried through the intertidal
area. During Phase 2, the construction activities will require a barge,
cables and associated machinery (required to spool cables through ducts
in the sea wall and install cables along the intertidal area) to be present in
the intertidal area. Construction works, vehicle movements, and resting of
a barge (dimensions will be 150 m long and 50 m wide) at low tide will be
restricted to the export cable route corridor. Anchor placement for a barge
(up to 9 anchors) would be within the temporary working areas identified
either side of the export cable corridor and this will be the only activity in
the temporary working area.
One cable will be laid at a time through the intertidal area within the export
cable corridor. Installing and burying the cables in the intertidal area is
estimated at 7-10 days per cable. The preparation work, demobilisation
and reinstatement will take place during normal working hours and mainly
during daylight. The cable pull-in will be a 24 hour (round the clock)
operation.
Cables would be buried by trenching, ploughing or jetting. Much of the
cable laying in the intertidal will occur during dry periods – trenching or

8
ploughing during low tide. Trenching and ploughing may temporarily affect
a corridor of up to 40 m width. Jetting will take place in water depths >3 m
and not at other tidal states; it will only occur in the lower shore
(approximately one quarter of the intertidal route) due to shallow water
depths in the remainder of the intertidal even at high water. The indicative
working area for laying one cable through the intertidal area, a strip of
40m width
Table 1: Areas of physical disturbance associated with construction activities for Project One and Project Two
Physical area of disturbance
Project One Project Two
HDD exit pit
(Phase 1 only)
HDD exit pit= 30m x 30m
= 900m2
4 HDD pits = 3600m2
0.36ha
HDD exit pit=30m x 30m =
900m2
Up to 6 HDD pits (SMart
Wind, 2012) = 5400m2
0.54ha
Export cable corridor 2.34km of cable in the
intertidal in a 40m corridor
= 93600m2
9.36 ha
2.56km of cable in the
intertidal in a 40m corridor
= 102400m2
10.24ha
Temporary working
corridor (for placement
of anchors and
movement of personnel)
Approximately 58.86 ha
(588,604 m2)
Approximately 58.86 ha
(588,604 m2)
1.4.16 The potential impacts arising from construction in each phase are identified
below:
Noise and visual disturbance from construction activities
• Phase One The main source of noise disturbance during Phase 1 of the
works will be the drilling of ducts under the seawall (drill rig and diesel
generator). Predicted noise disturbance from Phase 1 works in relation to
birds is described in HRA Report paragraph 6.3.39 (Doc Ref No 12.6).
Noise levels are predicted to be of an acceptable level (i.e., one that is not
predicted to cause displacement of birds) at a maximum range of 250 m
from the works. Any potential noise associated with HDD works on the
landward side of the sea defences will be screened by the sea defences
which is likely to reduce the potential impact distance on birds using

9
intertidal areas so any potential noise disturbance will be confined to less
than 250 m
• Phase Two Disturbance to the intertidal corridor will not be continuous
through the period April to September, there will be gaps of several weeks
with no or minimal disturbance. Evidence presented by Cutts et al. (2009)
from repair work to a pipeline in the Humber Estuary has shown that
disturbed birds (within 100 m) are likely to return within a short time frame
once disturbance ceases, potentially within 30 minutes, and with no
evidence of effects on numbers during surveys the following week,
emphasising the short-term nature of any impacts.
Worst-case estimates of construction noise associated with Phase 2 cable
installation (tracked excavators deployed in the intertidal area) indicate
that levels would fall to levels which would not be predicted to displace
birds at just over 100 m from operations (see paragraphs 6.3.37 to 6.3.52
of the HRA Report).
Potential indirect impacts of construction activity on prey availability
1.4.17 Owing to winter storms, and therefore a periodically high energy environment,
intertidal sediments in the study area are liable to be mobile and therefore the
main intertidal biotopes recorded in this area tend to be reasonably resilient
following physical disturbance (Volume 2 Chapter 2 of the ES: Benthic subtidal
and intertidal ecology, Doc Ref No 7.2.2).
1.4.18 The maximum adverse scenario from any construction activity is that impacted
sediments along each export cable corridor are expected to return to original
condition within approximately 3 months post-construction (Volume 2 Chapter 2
of the ES: Benthic subtidal and intertidal ecology, Doc Ref No 7.2.2).
1.4.19 Given the uncertainty in the construction programme for Project Two and how
this may interact with Project One, the following scenarios have been envisaged
for the purposes of this assessment:
A. Concurrent construction: Project One and Project Two are constructed simultaneously;
B. Overlapping construction: The construction of Project Two overlaps with the construction of Project One construction (i.e., it is staggered), but based on the consenting schedule, the overlap is limited to a one season (April to September), during which there will be work on both projects;
C. Sequential construction: Project Two is constructed following construction of Project One, which in practice means there would be a 6 month break in construction, over the intervening winter period; and
D. Independent construction: Project Two is constructed after the construction of Project One, with an interval of between one and several years.

10
1.4.20 Based on the scenarios identified above and considering the phased construction of each project, approximate construction schedules have been summarised in Table 2.
Table 2: Construction schedules for possible in-combination scenarios for the installation of the Project One and Project Two export cables.
Year 1 Year 2 Year 3 Year 4 … Year X Year Y Year Z
Scenario A Project 1 Phase 1 Phase 2
Project 2 Phase 1 Phase 2
Scenario B Project 1 Phase 1 Phase 2
Project 2 Phase 1 Phase 2
Scenario C Project 1 Phase 1 Phase 2
Project 2 Phase 1 Phase 2
Scenario D Project 1 Phase 1 Phase 2
Project 2 Phase 1 Phase 2
Scenario A
1.4.21 It is assumed in this scenario that the Project Two export cable corridor runs to
the north of the Project One cable corridor (within the temporary working corridor
shown in Figure 1 of Appendix T). Scenario A assumes that the cable installation
for both projects occurs simultaneously with both phases occurring at the same
time over a two year period.
1.4.22 In this scenario there will be two lots of adjacent Phase 1 works carried out
(establishment of the site compounds and exit pits and the drilling and
installation of cable ducts from construction compounds underneath the seawall
up to 700 m out from the seawall), followed by two adjacent cable laying
operations across the intertidal area in the subsequent year, with cables being
laid alternately through the April to September.
1.4.23 A separate cable laying barge is identified for each development and it would not
be possible for both ships to operate safely in close proximity. Therefore only one
cable could be laid through the intertidal area at a time. In practical terms, in
order that Phase 2 cable laying for both Projects could be carried out over the
same summer period, it is assumed that each Project would alternate, although it
follows that disturbance from cable laying would be more continuous in nature

11
than for Project One alone. The 30 to 45 day intervals between the laying of
successive cables envisaged for Project One would not apply.
1.4.24 The maximum area of physical disturbance at any one time during Phase 1 and
2 of this scenario are shown in Table 1.
Scenario B
1.4.25 The location of the Project Two export cable remains unchanged. For Scenario B
it has been assumed that Project Two cable installation will follow Project One
and begin in year two so there will be one year of overlap. In this scenario Phase
One of Project Two may overlap with Phase Two of Project One (see Scenario B
row in Table 2). Phase 1 of Project Two being carried out over the same April to
September period as Phase 2 of Project One (i.e. the temporary compound and
drilling of ducts under the seawall to 100m-700 m works for Project Two being
done during the same period as the cable laying across the lower intertidal for
Project One).
1.4.26 Following the completion of Project One, Phase Two of Project Two would occur,
during this time there would be no works being carried out for Project One.
1.4.27 During Year 1 of this scenario the spatial extent of physical disturbance would be
no greater than for Project One alone. During Year Two, Phase 2 of Project One
would occur at the same time as Phase 1 of Project Two increasing the spatial
extent of disturbance. During Year 3, Phase Two of Project Two will be occurring
alone and therefore the spatial extent will be no greater than for Project One
alone.
1.4.28 The total duration of these works is greater than for Scenario A and are likely to
take place over a 3 year period (3 years of working between April and
September in each year).
1.4.29 As there is only potential for the Phase Two works of Project One to overlap with
the Phase One works of Project Two the spatial extent of disturbance will not be
double that of the Project One cable corridor, rather it will be equal to the
physical disturbance resulting from Phase Two of Project One (68.22ha) and
Phase One of Project Two (0.54ha).
Scenario C
1.4.30 Under this scenario there would be no overlapping works for Project One and
Project Two. Project Two would immediately follow the completion of Project One
with no gap (i.e Project One would complete in September and Project Two
would commence works the following April). Thus, the total duration of the works
would be increased to 4 years (i.e. Project One Phase One in Year 1, Project
One Phase 2 in Year 2, Project Two Phase One in Year 3 and Project Two
Phase 2 in Year 4).

12
1.4.31 The total area of habitat affected by the works at any one time is to be no greater
than for Project One alone. As the two projects will not be constructed
concurrently, there would be no simultaneous disturbance to birds within the
intertidal area from Project One and Project Two.
1.4.32 The total duration of these works is greater than both Scenario A and B and may
occur for up to 4 years (4 years of working between April and September).
Scenario D
1.4.33 Under this scenario there would be no overlapping works for Project One and
Project Two. It is assumed, however, that there will be a gap of some years
between the completion of Project One works and the commencement of Project
Two. The total duration of works would be similar to that of Scenario C but with a
larger period of inactivity between the two projects.
1.4.34 The in combination effects of habitat loss and disturbance under Scenario D are
likely to be similar to those under Scenario C with the only difference being that
the disturbance associated with Projects One and Two may be separated by
more than one year. Nonetheless the works would occur over a maximum period
of 4 years (four April to September working periods).

13
1.5 In-combination assessment
1.5.35 Assessment of the Project One on the features of Humber Estuary SPA and
Ramsar alone can be found in the HRA report with further information in
Appendix T of the Applicant’s response to Deadline 2. Figures 1 to 14 of
Appendix T show the distribution of key species within the intertidal area in
relation to the Project One export cable route.
1.5.36 The following section details the spatial distribution extent of each of the species
described in Appendix T and identified by Natural England in their Relevant
Representation. Based on the assumptions detailed in Tables 1 and 2, an
assessment of each scenario has been completed for each species.
Dunlin
1.5.37 Peak numbers of Dunlin within the cable route survey area were recorded in late
October (2,050 birds), outside the proposed working period for cable installation
(See Figure 2 of Appendix T). Within the working period (April to September), the
peak count was 1,300 birds at high tide (about 6 % of the SPA population based
on the most recent WeBS counts) in early April during the spring passage period.
1.5.38 The overall distribution of dunlin (Figure 2 of Appendix T) indicates that birds use
an extensive area of mudflats within the study area, with no indication of
concentrations at a particular area. The areas used by dunlin overlap with the
export cable corridor and the temporary working area for both Projects One and
Two but also include areas outside these zones.
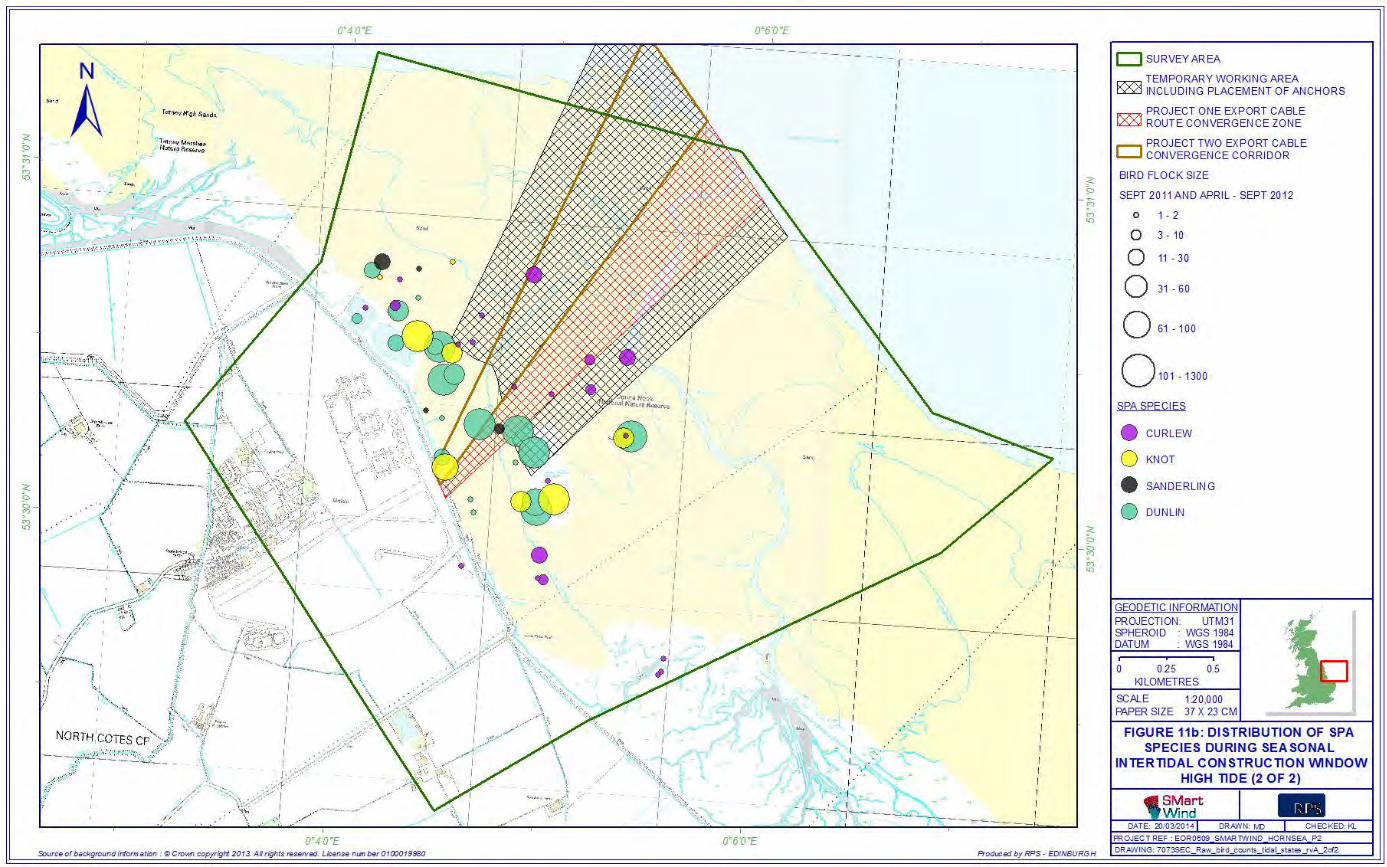
1.5.39 Dunlin were recorded on the upper shore at high tide (Figure 11b of Appendix T),
the distribution data indicate that extensive areas of the upper shore are used
(Figure 2 and Figure 11b of Appendix T).
1.5.40 Dunlin are likely to avoid or be displaced from areas that are within 75 m of
intertidal construction activity (Cutts et al. 2009). Goss-Custard (2007) provides
flight distance maxima for (the distance at which birds take flight to a disturber, a
human intruder) dunlin of 163m.
Studies of the movements of wintering waders indicate that dunlin is one of the
species which show more extensive within-year movements within estuarine
systems (Rehfisch et al. 2003, Symonds et al. 1984). Mean recorded distances
for within-year movements between roosts are about 2-5 km, with a maximum of
about 24 km (Rehfisch et al. 2003). This suggests that dunlin recorded within the
study area during passage periods are capable of moving to alternative sites
including areas within the Tetney Marshes Nature Reserve and Donna Nook
Nature Reserve (situated respectively about 2 km to the northeast and 2 km
southwest of the intertidal cable construction areas). Both of these Nature
Reserves are managed to provide habitat and low levels of disturbance for
estuarine birds. Thus, should dunlin be displaced from the vicinity of the onshore

14
cable construction works area at high spring tides, it is predicted that they can
find alternative areas nearby.

15
Table 3: Assessment of effects from in-combination construction scenarios on dunlin
Scenario A Scenario B Scenario C Scenario D
Dunlin The spatial extent of disturbance is
greater for this scenario than the
effects of disturbance from Project
One alone. Given disturbance of
dunlin is likely to occur out to
maximum of 75m from Project One
alone the additional loss of available
habitat and disturbance that may
occur from Project Two occurring at
the same time is unlikely to result in a
greater effect.
Given the relatively limited extent of
habitat dunlin are predicted to be
disturbed or displaced from, the
‘recovery’ time for the return to the
habitat once the disturbance
mechanism is removed, is predicted to
be minimal. A study of curlew by
Zegers (1973, cited in Smit and Visser
1993) found that roost size returned to
normal 2-3 weeks after disturbance
from cannon netting at the same site
on two nights with a nine day interval.
Curlew is considered to be more
sensitive to disturbance by Cutts and
Allen (1999) and Smit and Visser
(1993). Cannon netting is likely to be a
more intensive disturbance event
(taken in isolation) than construction
disturbance from the Project. It is
therefore reasonable to assume that
The spatial extent of disturbance is
greater during Year 2 for this scenario,
where Phase 2 of Project One may
overlap with Phase One of Project Two.
Given disturbance of dunlin is likely to
occur out to maximum of 75m from
Project One alone the additional loss of
available habitat and disturbance that
may occur from Phase One of Project
Two (HDD exit pits) occurring at the
same time is unlikely to result in a
greater effect.
The duration of disturbance is 3 years
for this scenario. The increase in
duration will lead to disturbance to dunlin
occurring for an additional year (April-
September). This increase in duration is
unlikely to result in a greater effect,
phase 2 works for Project Two are
located away from the large
concentrations of dunlin on the intertidal
(Figure 2 Appendix T). As stated under
scenario A dunlin would be expected to
return to the area following cessation of
activities.
The spatial extent of this
scenario is no greater than for
Project One alone as works for
both Projects will not occur at
the same time.
The duration of disturbance is 4
years where Project Two follows
immediately after Project One.
As stated under Scenario B, the
main concentrations of dunlin
recorded during site surveys
were to the south of the Project 2 cable corridor. As stated
under scenario A dunlin would
be expected to return to the
area following cessation of
activities.
The spatial extent of this
scenario is no greater than
for Project One alone as
works for both Projects will
not occur at the same time.
The duration of disturbance
is unknown where Project
Two follows X years after
Project One. However, for
the purposes of this
assessment we can assume
as a worst case there is only
a one year break between
the two projects.
As stated under scenario A
dunlin would be expected to
return to the area following
cessation of activities.

16
dunlin numbers will return to the
construction corridor in a similar or
reduced timescale.
Conclusions No adverse effect from Scenario A No adverse effect from Scenario B No adverse effect from Scenario
C
No adverse effect from
Scenario D

17
Grey plover
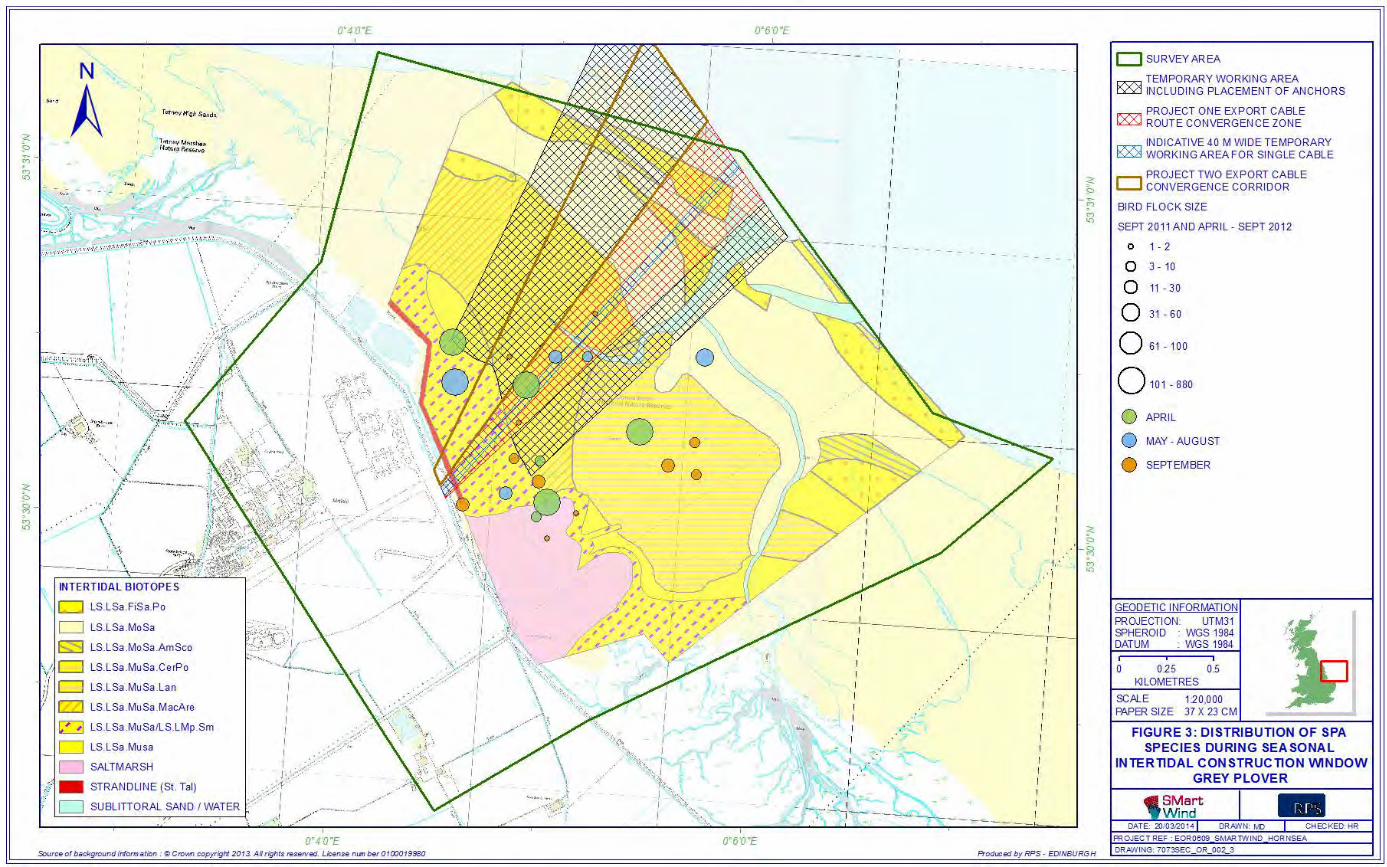
1.5.41 Surveys of the cable landfall area recorded a peak of 885 birds on spring
passage in April (31% of the current SPA population, HRA Report (PINS
Document Reference 12.6) Figure F.67). The species was absent during surveys
from mid-June until September, with a smaller autumn passage (peak of 231
birds in October). Mean count data for grey plover in the Humber Estuary, 1999-
2009, presented in Cruikshanks et al. (2010), indicate that the pattern of peak
numbers in April and May is typical of this species in the Humber.
1.5.42 Within the Humber Estuary, grey plover has been identified as being particularly
sensitive to roosting disturbance, with the WeBS sectors overlapping the survey
area at Horseshoe Point being important within the estuary (Cutts et al., 2009).
The nearby saltmarshes may provide an important communal roost site in the
wider Tetney Marshes area (Cruickshanks et al. 2010).
1.5.43 Grey plover are likely to avoid or be displaced from areas that are within 124 m
of construction activity (Cutts et al. 2009), the flight distance threshold (the
distance at which birds take flight to a disturber, a human intruder) stated by
Goss-Custard (2007). A more recent review by Cutts et al. (2013), states that
efforts should be made to avoid high level disturbance closer than 200m to grey
plover, especially if it includes workers on the intertidal. Most studies of winter
movements have indicated that grey plover are not very mobile within estuaries
(Rehfisch et al. 2003, Symonds et al. 1984), although large itinerant flocks may
occur occasionally on British estuaries (Rehfisch et al. 1993) and a study of
radio-tagged grey plover wintering on the Tees Estuary found that some birds
frequently changed feeding sites at night, moving across the estuary from their
daytime feeding areas to mudflats not used during the day (Dugan 1981, cited
from Rehfisch et al. 1993). The mean within-year distances moved by adult grey
plovers on the Wash was 2.34 km for adults and 0.82 for juveniles (Rehfisch et
al. 1993).

18
Table 4: Assessment of effects from in-combination construction scenarios on grey plover
Scenario A Scenario B Scenario C Scenario D
Grey plover The physical area disturbance will be
greatest during Year Two for this
scenario, when Phase Two for both
projects is occurring simultaneously
(137.32ha). Within the cable landfall
survey area, birds were mainly located
on the muddy substrates at some
distance from the sea wall and the
Phase 1 working area (Figure 3 of
Appendix T) and thus unlikely to be
affected by Phase 1 works. Most
records were also outside the export
cable convergence zone, suggesting
that disturbance from Phase 2
construction activities will not affect key
areas.
None of the grey plover records at high
tide overlapped with the export cable
convergence zone (Figure 11a of
Appendix T) During Phase 2, it is
predicted that any birds disturbed while
cable laying is ongoing in the intertidal
area could readily relocate within the
cable landfall study area, or move to
foraging and roosting areas nearby,
beyond disturbance distance from the
cable corridor.
The spatial extent of
disturbance is greater during
Year 2 for this scenario,
where Phase 2 of Project
One may overlap with Phase
One of Project Two
Given the majority of records
of grey plover were to the
south of Project One cable
corridor and beyond
disturbance distance of 200m advised by Cutts et al.
(2013), it’s unlikely there will
be any greater effect from
overlap of Project Two Phase
One works.
The increased duration of
disturbance to 3 years will
lead to an additional year of
disturbance on grey plover.
The additional year of works
will be located beyond 500m
from the majority of survey
records of grey plover.
The spatial extent of this scenario
is no greater than for Project One
alone as works for both Projects
will not occur at the same time.
The duration of disturbance is 4
years where Project Two follows
immediately after Project One.
As stated under scenario B the
majority of grey plover records are
located beyond the predicted
disturbance distance.
The increased duration of
disturbance is unlikely to have an
greater effect, evidence suggests
birds will return to the area 2-3
weeks following cessation of
activity and benthic communities
will recover after 3 months
following completion if activity. In all
cases recovery is expected over
the wintering period (October-
March).
The spatial extent of this scenario
is no greater than for Project One
alone as works for both Projects
will not occur at the same time.
The duration of disturbance is
unknown where Project Two
follows X years after Project One.
The increased duration of
disturbance is unlikely to have an
greater effect, evidence suggests
birds will return to the area 2-3
weeks following cessation of
activity and benthic communities
will recover 3 months following
completion if activity. In all cases
recovery is expected over the
wintering period (October- March).
Conclusions No adverse effect predicted from
Scenario A
No adverse effect predicted
from Scenario B
No adverse effect predicted from
Scenario C
No adverse effect predicted from
Scenario D

19
Ringed plover
1.5.44 Ringed plover were recorded in the cable landfall study area throughout the year
(See Figures 4 of Appendix T), less regularly during surveys in spring and
summer, with peaks in September (120 birds, 7% of cited SPA population) and
December (100 birds). The September peak occurred during autumn migration,
which takes place from mid-July to early October; spring migration is from late
April to early June. With limitations to the spatial and temporal extent of
construction activities, as described in section 1.2 above, far fewer birds than the
peak population estimates are likely to be affected by disturbance.
1.5.45 Responses of ringed plover to disturbance are reported as similar to those of
dunlin, with displacement likely within distances of 100-200 m from construction
activities (Cutts and Allen 1999, Goss-Custard 2007, Cutts et al. 2009). At
distances of over 100m from activity birds however rarely show signs of a
behavioural response, with avoidance of high level disturbance from construction
works advised from within 50m of ringed plover (Cutts et al. 2013).
1.5.46 Surveys of the cable landfall indicate that at all tidal states (Figure 4, Figures 11-
14 of Appendix T) ringed plovers were mainly recorded on the upper shore, with
most records outside and to the north and west of the export cable for both
Projects One and Two. Thus there is no indication from the survey data that the
area where construction activities will take place overlaps with preferred foraging
or roosting habitats for this species.

20
Table 5: Assessment of effects from in-combination construction scenarios on ringed plover
Scenario A Scenario B Scenario C Scenario D
Ringed
Plover
The area of physical disturbance is
greatest for this scenario totalling
0.9ha in year one and 137.32ha in
year.
Construction activities during Phase
1 may effectively exclude birds from
areas of the upper shore or inland
within about 250 m of the drilling
works associated with the sea wall,
during the short (7 day) periods that
drilling and duct installation is
ongoing but the distribution of this
species at high tide suggests there
are alternative areas which can be
used (Figure 11a of Appendix T).
During Phase 2, ringed plovers may
avoid areas in the export cable route
convergence zone within about 100
m of works while cable laying is
ongoing through the intertidal area.
However, the distribution of this
species recorded during surveys
(Figure 3 of Appendix T) suggests
that alternative areas are available
for feeding and roosting within the
cable landfall survey area. During
the short and spatially limited
periods of disturbance which will be
associated with construction
activities, it is most likely that any
displaced birds will be able to move
to nearby areas rather than being
The spatial extent of disturbance is
greater during Year 2 for this
scenario, where Phase 2 of Project
One may overlap with Phase One of
Project Two. During Year two the
total physical area of disturbance
equals 70.36ha.
There were a number of records of
ringed plover recorded in the upper
intertidal close to the location of the
Phase 1 works for Project Two.
However, as stated in scenario A
distribution of this species at high
tide suggests there are alternative
areas which can be used (Figure
11a of Appendix T).
Ringed plover are likely to be
foraging on the more abundant and
smaller age/size classes of the
invertebrate communities represented e.g. Hydrobia ulvae,
small polychaetes and amphipods.
For this suite of waterbird species,
the duration of ‘habitat loss’ as an
indirect result of construction works
is suggested to be much less than 3
months post-construction, during
which the extent of loss will be ever
diminishing
The spatial extent of this scenario
is no greater than for Project One
alone as works for both Projects
will not occur at the same time.
The duration of disturbance is 4
years where Project Two follows
immediately after Project One.
The increased duration of
disturbance is unlikely to have a
greater effect, evidence suggests
birds will return to the area 2-3
weeks following cessation of
activity and benthic communities
will recover 3 months following
completion of activity. In all cases
recovery is expected over the
wintering period (October-
March).
The spatial extent of this scenario
is no greater than for Project One
alone as works for both Projects
will not occur at the same time.
The duration of disturbance is
unknown where Project Two
follows X years after Project One.
The increased duration of
disturbance is unlikely to have a
greater effect, evidence suggests
birds will return to the area 2-3
weeks following cessation of
activity and benthic communities
will recover 3 months following
completion of activity. In all cases
recovery is expected over the
wintering period (October-
March).

21
displaced further afield.
Conclusion No adverse effect predicted from
Scenario A
No adverse effect predicted from
Scenario B
No adverse effect predicted from
Scenario C
No adverse effect predicted from
Scenario D

22
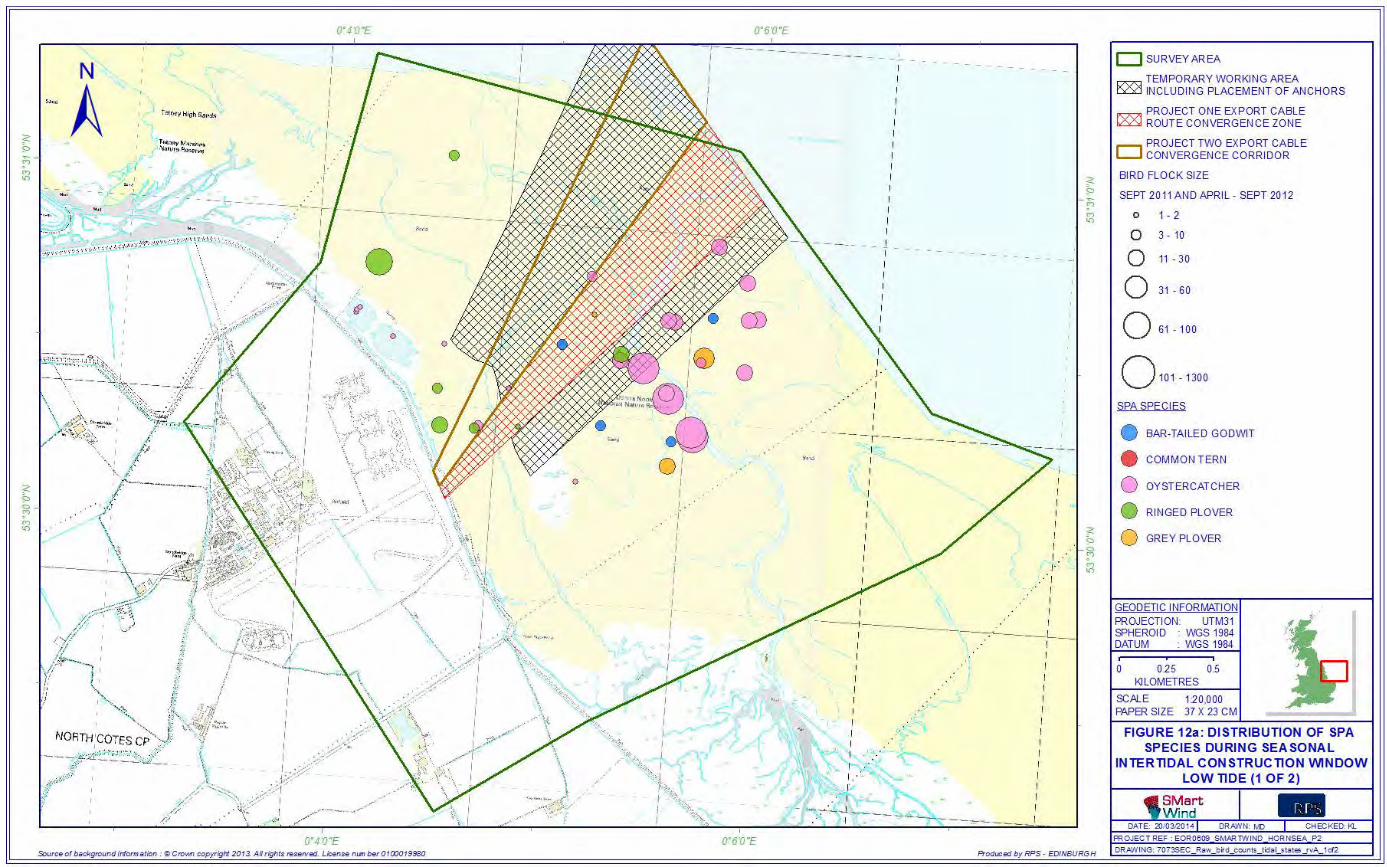
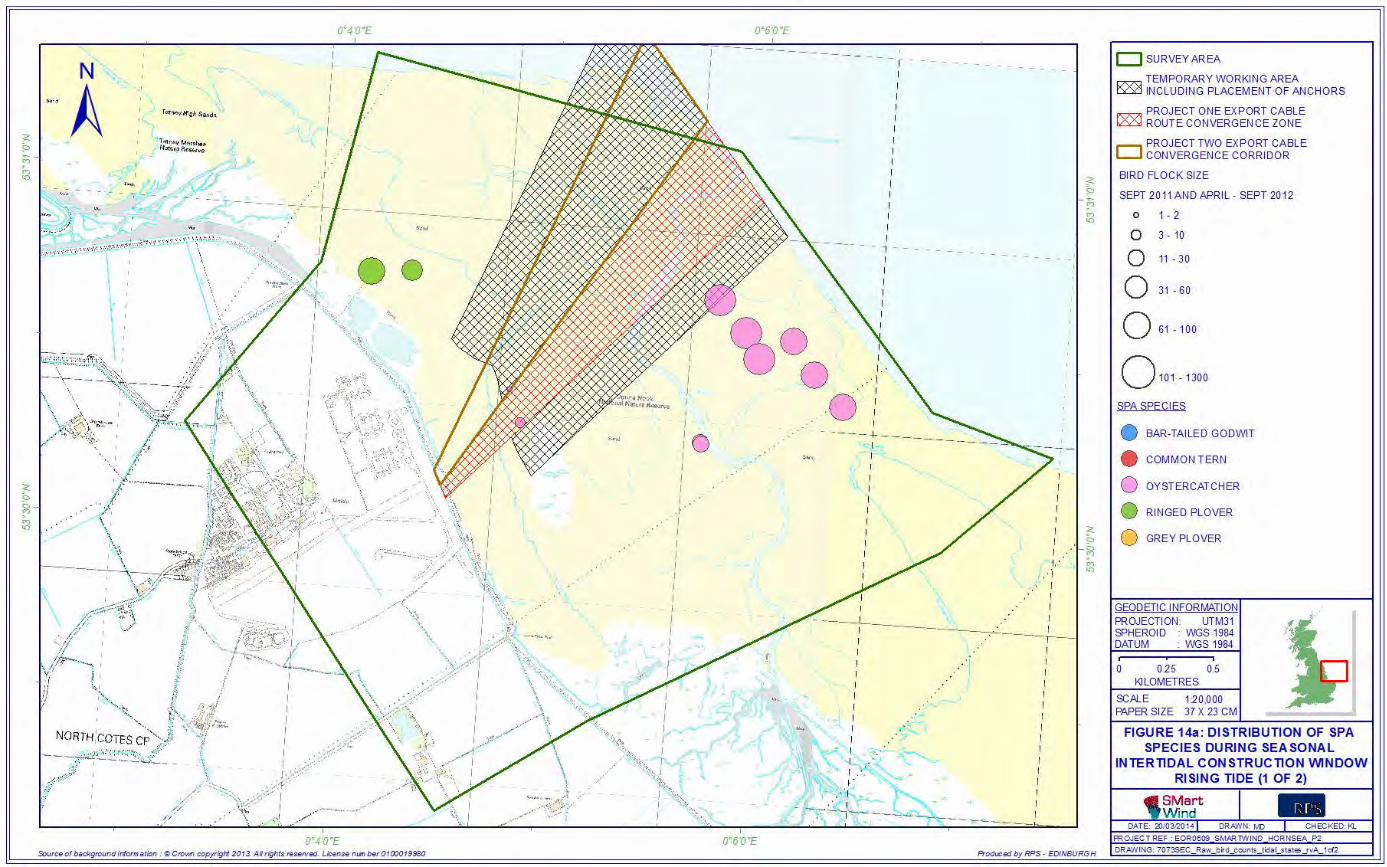
Oystercatcher
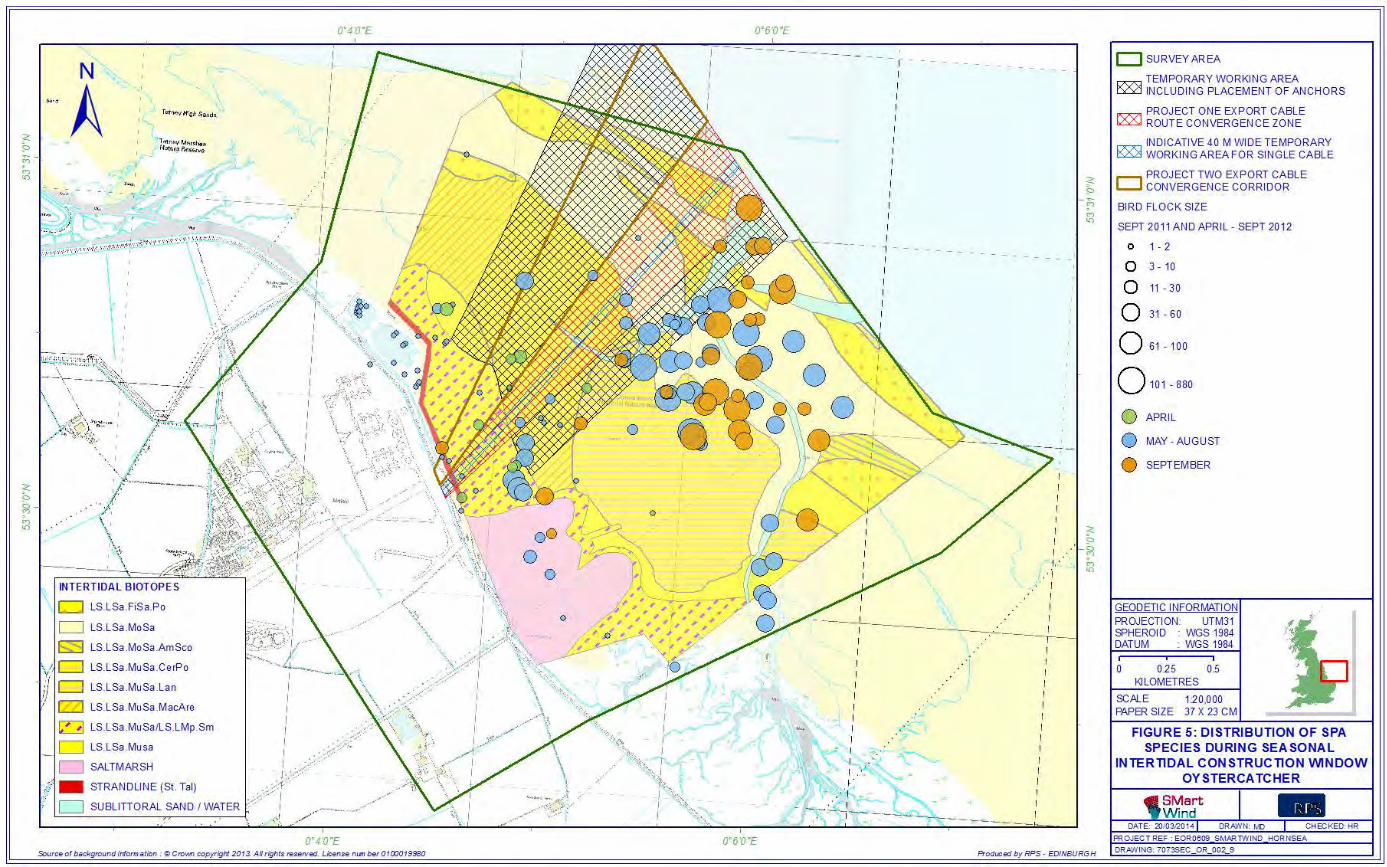
1.5.47 Surveys of the cable landfall area in 2011/12 show that, compared with the
winter period, generally low numbers of oystercatchers were present between
April and September, the proposed period for intertidal works (HRA Report
Figure F.54, Doc Ref No 12.6). Between April and September, peak numbers
were 436 individuals (during a lowering tide) in early July (around 12% of the
cited and current SPA populations), and 850 in mid-September (24% of the SPA
population).
1.5.48 The proposed cable landfall lies between Horseshoe Point and Grainthorpe,
which has been identified as an important feeding area during much of the year
within the context of the Humber Estuary SPA. Birds tend to establish high tide
roosts close to key feeding areas (Catley, 2000).
1.5.49 The literature review by Goss-Custard (2007) reports for oystercatcher a
maximum flight distance threshold of 250m in response to a human intruder. Of
more pertinence is Cutts et al. (2013) review of the literature and field
observations, much relating to the Humber Estuary, which advises a potential
zone of influence from high level disturbance construction works of up to 200m.
1.5.50 Distribution data (Figure 5 of Appendix T) indicate that the preferred habitats for
oystercatcher within the survey area were creeks and cockle beds to the south
and east of the export cable routes from Projects One and Two. The distribution
data suggests these preferred areas are largely outside the area affected by
construction activities associated with cable laying operations..

23
Table 6: Assessment of effects from in-combination construction scenarios on oystercatcher
Scenario A Scenario B Scenario C Scenario D
Oystercatcher The area of physical disturbance is
greatest for this scenario totalling 0.9ha in
year one and 137.32ha in year.
There are few records from the upper
shore in the vicinity of Phase 1 works and
the majority of records are 100 to 200 m
distant from the cable export corridor
(Figure 5 of Appendix T) so that limited
displacement of feeding birds would be
predicted due to construction disturbance.
Given the majority of records of
oystercatcher were to the
south of Project One cable
corridor there is unlikely to be
any greater effect from the
overlap of Project Two
activities.
The majority of oystercatcher
records were on the creeks to
the south Project One,
disturbance effects from Project
Two are likely to be less than
from Project One on this
species.
The increased duration of
disturbance under this scenario
is unlikely to cause any greater
disturbance due to the location
of Project Two works away from
preferred habitat for this
species.
Conclusions No adverse effect predicted from Scenario
A No adverse effect predicted
from Scenario B No adverse effect predicted
from Scenario C No adverse effect predicted
from Scenario D

24
Knot
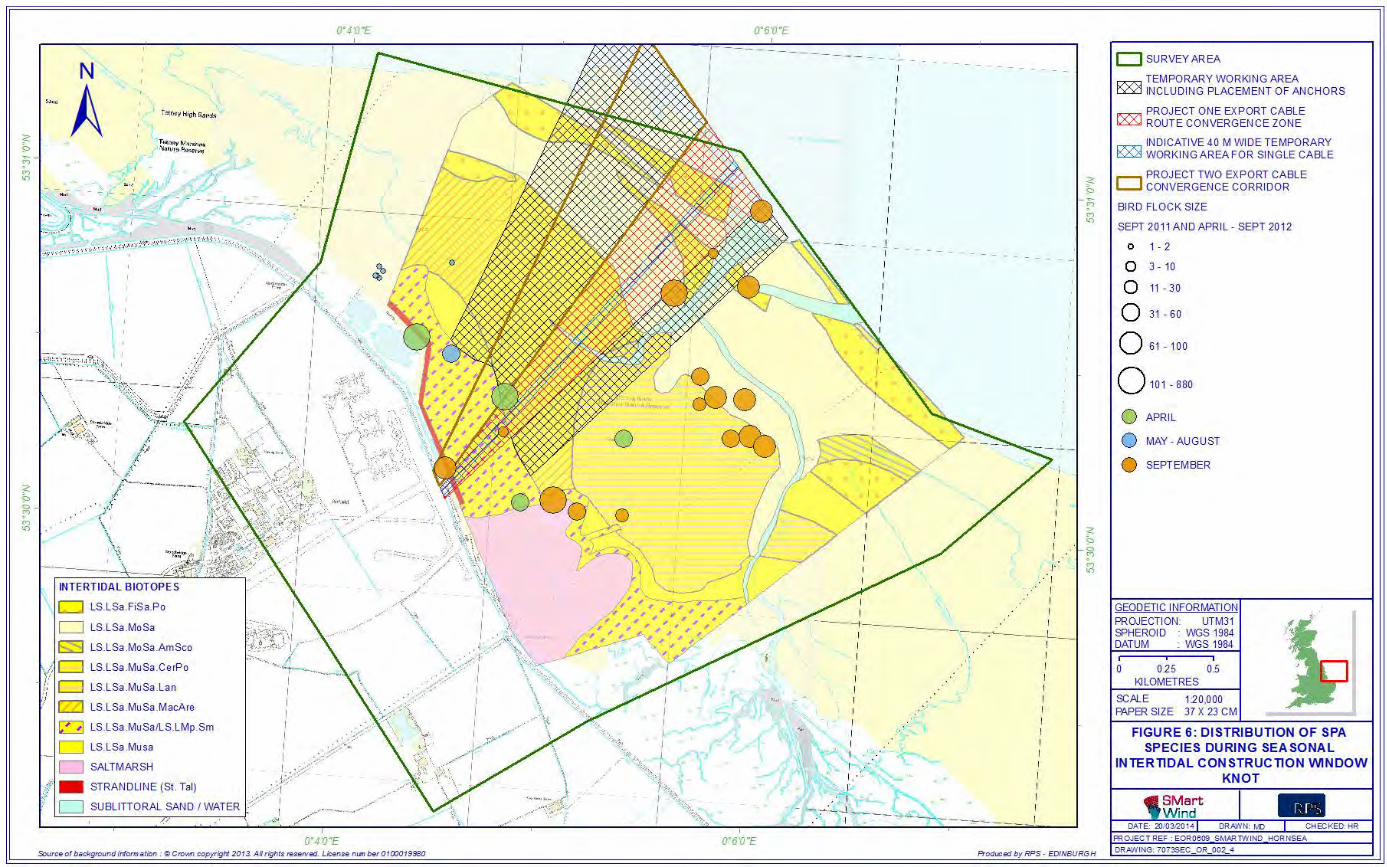
1.5.51 During surveys of the cable landfall area, peak numbers of knot were recorded in
in November (HRA Report, Figure F.21), outside the proposed working period.
Between April and September, the peak count of knot was 420 in mid-September
(autumn passage, lowering tide) representing 2% of the Humber SPA population.
With limitations to the spatial and temporal extent of construction activities, as
described in section 1.2 above, far fewer birds than the peak population
estimates are likely to be affected by disturbance.
1.5.52 Birds were located widely within the survey area (Figure 6 of Appendix T), with
some of the largest flocks were found well below mean high water mark at low
tide (Figure 13b of Appendix T). At high tide, knot were recorded using the upper
shore, probably roosting (Figure 11b of Appendix T).
1.5.53 Noise modelling predicts that knot (and other estuarine birds) may avoid or be
displaced from areas within approximately 250 m of the construction activities
associated with drilling of ducts through the sea wall (HRA Report, section
6.3.39). At other times and locations during the working period, noise modelling
predicts knot may avoid or be displaced from areas within approximately 100 m
of the construction activities, This is also the minimum distance at which Cutts et
al. 2013 advises intertidal construction work with high level visual disturbance to
be from Knot.
1.5.54 Wintering knot are highly mobile between feeding and roosting areas on the
Humber, in response to weather conditions, tidal conditions or disturbance (Allen
et al., 2003) and in the outer estuary large intertidal movements occur between
feeding and roosting areas on the north and south shores (Catley, 2000). Studies
of the movements of overwintering waders on estuaries found that knot was the
most mobile species, with mean between roost movements of 15.4-17.7 km and
a maximum of 35 km in the Moray Basin (Rehfisch et al. 2003). It has been
suggested that the mobility of knot within and between estuaries may be a
strategy to identify several potentially suitable feeding sites, in case food sources
from one site are reduced (Rehfisch et al. 1993).

25
Table 7: Assessment of effects from in-combination construction scenarios on knot
Scenario A Scenario B Scenario C Scenario D
Knot A relatively small area of the upper
shore will be affected with no works
elsewhere in the intertidal area. While
knot have been recorded close to the
Phase 1 works area, and may roost in
this area at high tide (Figure 11b of
Appendix T), the distribution data
indicate that birds also use several
areas of the upper shore (Figure 6 and
Figure 11b of Appendix T) and could
occupy areas beyond disturbance
distance from construction activities
without being displaced from the area.
In relation to Phase 2 works for both
Projects in the intertidal area, there is
some overlap between the distribution
of knot and the export cable
convergence corridor but also an
indication that this species makes use
of areas to the south and east of the
working area (Figure 6 of Appendix T).
Given the limited temporal and spatial
extent of works associated with cable
laying, it is likely that any disturbed
birds can relocate within the local area.
In the absence of disturbance, knot are
expected to re-occupy areas in between
periods of construction activity
The overlap of works in Year 2 may
cause increased disturbance to knot
using the upper intertidal, although the
distribution data indicate that birds also
use several areas of the upper shore
predominantly away from where Phase 2
works will be occurring for Project One
and could occupy areas beyond
disturbance distance from construction
activities without being displaced from
the area.
In relation to Phase 2 works for Project
2, the Project 2 cable corridor is located
beyond the likely disturbance distance of
100m for knot and so disturbance effects
are likely to be less than for Project One
alone.
Given the limited temporal and spatial
extent of works associated with cable
laying, it is likely that any disturbed birds
can relocate within the local area. In the
absence of disturbance, knot are
expected to re-occupy areas in between
periods of construction activity
The majority of knot records
were to the south of the
Project 1 cable corridor and
beyond the disturbance
distance of likely effect from
Project 2 cable corridor. The
effect of Project Two cable
activities is likely to cause less
disturbance than Project One.
The increased duration of
disturbance under this
scenario is unlikely to cause
any greater disturbance due to
the location of Project Two
works away from preferred
habitat for this species
As for scenario C the
disturbance effect from
Project Two alone is likely to
be less than for Project One.
The increased gap between
the two projects compared to
scenario C will further
enhance the recoverability of
benthic communities and
ensure birds return to the
area following the cessation
of Project One activities.

26
Conclusions No adverse effect predicted from
Scenario A No adverse effect predicted from
Scenario B No adverse effect predicted
from Scenario C No adverse effect predicted
from Scenario D

27
Sanderling
1.5.55 Sanderling were recorded sporadically within the cable landfall area during
surveys in 2011/12 (HRA Report, Figure F.46 Doc Ref No 12.6). Peak numbers
were present in January (150 birds, 15% of the most recent WeBS count for the
Humber Estuary), outside the proposed working period. Between April and
September the highest count was 21 birds in late August, 2% of the most recent
WeBS count for the Humber Estuary. With limitations to the spatial and temporal
extent of construction activities, as described in section 1.2 above, far fewer birds
than the peak population estimates are likely to be affected by disturbance.
1.5.56 All sanderling records within the cable landfall survey area between April and
September were on the upper shore to the northwest of the cable route
convergence zone (Figure 7 of Appendix T). The Tetney to Horseshoe Point
WeBS core count sector (which overlaps with the cable landfall survey area)
recorded a peak of 158 birds in May 2010 although the location of these birds is
unknown.
1.5.57 Potential disturbance distances for roosting birds have not been found although
sanderling will show 100% response to people approaching relatively close,
within 30m (Cutts et al. 2009). As a species tolerant of moderate and high level
visual disturbance, Cutts et al. (2013) advises the potential zone of influence
from visual construction works to be up to 50m.

28
Table 8: Assessment of effects from in-combination construction scenarios on sanderling
Scenario A Scenario B Scenario C Scenario D
Sanderling The distribution of sanderling records
within the cable landfall study area,
mainly on the upper shore to the north
and east of the cable route (Figure 7 of
Appendix T), indicates that birds are
using areas several hundred metres
from Phase 1 drilling activities.
Assuming the distribution reflects the
favoured areas of the birds at
Horseshoe Point in the vicinity of the
sea wall, then little or no disturbance to
sanderling is predicted during Phase 1
of construction works. A few of the
sanderling records overlap with the
cable route convergence zone (Figure
7), suggesting some displacement of
sanderling from this area may occur
during Phase 2 for Project One. Given
the limited temporal and spatial extent
of works associated with cable laying, it
is likely that any disturbed birds can
relocate within the local area while
construction is ongoing in the intertidal
area
As stated in scenario A sanderling
records were mainly on the upper
shore closer to the seawall. Phase 1
works for both projects are likely to
cause limited disturbance to this
species.
Year 2 of works under this scenario is
unlikely to cause any greater
disturbance as the Project one cable
corridor is located away from the
majority of sanderling records. Some
displacement may occur during the
Phase 2 works for Project Two but
this is likely to be minor given the
limited number of records on the
lower intertidal.
The duration of disturbance under
this scenario maybe up to 4 years.
Assuming the distribution reflects
the favoured areas of the birds at
Horseshoe Point in the vicinity of
the sea wall, then little or no
disturbance to sanderling is
predicted during Phase 1 of
construction works for either
Projects.
A few of the sanderling records
overlap with the cable route
convergence zone for Project One
but there were no records in the
Project Two cable route indicating
minimal disturbance during Phase
2 of Project 2.
As under scenario C
disturbance will be minimal
on this species.
The increased recovery
period between projects
will ensure recoverability of
benthic communities and
the long term effects on
sanderling populations will
be no greater than for
Project One alone.
Conclusions No adverse effect predicted from
Scenario A
No adverse effect predicted from
Scenario B
No adverse effect predicted from
Scenario C
No adverse effect predicted
from Scenario D

29
Curlew
1.5.58 Surveys at the cable landfall site recorded curlew in most months in 2011/12,
with a peak flock size of 74 birds in late September 2011, about 2% of the cited
and current SPA populations (HRA Report, Figure F.60). Birds were recorded
throughout the intertidal part of the survey area with no suggestion of preference
for particular areas (Figure 8 of Appendix T).
1.5.59 The peak count recorded in the cable landfall survey area coincides with autumn
curlew passage. This commences in mid-June with peak counts later in the
month and throughout July (Allen et al. 2003). Numbers on the Humber Estuary
continue to build-up to peaks in August or September, with smaller numbers of
birds remaining on the site to over-winter. Spring migration is reported from early
March to late May, although numbers recorded are far smaller than in autumn.
Small numbers of curlew remain on the Humber during mid-summer and these
birds may be young, non-breeding adults (Catley, 2000).
1.5.60 Cutts et al. (2009) study reported unhabituated birds behaviourally responding to
third party disturbance e.g. taking flight, from a distance of up to 275 m, whilst
the literature review by Goss-Custard (2007) provides a range from an outlying
lower limit of 38 m to an upper limit of 339 m. However of the twenty studies
reviewed by Goss-Custard (2007), only one recorded a flight distance greater
than 213 m. As a species considered to be wary of moderate and high level
visual disturbance, Cutts et al. (2013) advises the potential zone of influence
from visual construction works to be up to 300m.
1.5.61 Within the cable landfall survey area, there are no records of curlew on the
upper-shore close to the proposed working area for Phase 1 of cable
construction activities (Figure 8 of Appendix T). Thus there is no indication that
this part of the shore is important for curlew or that disturbance from Phase 1
construction activities will displace individuals of this species.
1.5.62 Curlew were recorded using intertidal areas which overlap with the export cable
route convergence zone so Phase 2 activities could displace some birds. The
wide distribution of curlew over the intertidal mudflats within the survey area
suggests that birds could relocate within the study area.

30
Table 9: Assessment of effects from in-combination construction scenarios on curlew
Scenario A Scenario B Scenario C Scenario D
Curlew Curlew is probably one of the most
sensitive of all waterbirds to
disturbance. For the purposes of
assessment, a precautionary potential
disturbance zone of up to 300m has
been assumed for this. This is based on the findings of Cutts et al. (2013), for
which much of the literature and field
observations reviewed were from the
Humber Estuary. Curlew are widely and
comparatively evenly distributed in the
study area.
A maximum of 137.32ha of physical
disturbance will occur at any one time
under scenario A between April and
September. However extensive areas
of similar habitat exists in which to
forage outwith of the disturbed area,
therefore an adverse effect on this
species is not predicted.
Curlew were recorded using
intertidal areas which overlap with
the export cable route
convergence zone so Phase 2
activities could displace some
birds. The wide distribution of
curlew over the intertidal mudflats
within the survey area suggests
that birds could relocate within
the study area.
A maximum of 70.36ha of
physical disturbance will occur in
Year 2 when Phase 1 works from
Project Two will overlap with
Phase 2 works for Project One.
The increase duration of disturbance is
unlikely to lead to an adverse effect on
curlew. A study of curlew by Zegers
(1973, cited in Smit and Visser 1993)
found that roost size returned to
normal 2-3 weeks after disturbance
from cannon netting at the same site
on two nights with a nine day interval. .
Curlew are predators of the larger
size/age classes of invertebrate prey.
The recovery in prey availability in
impacted areas is likely to be slower as
a consequence of the larger size class
and/or restrictive prey species. The
export cable corridor for both Projects
will bisect foraging areas frequented by
highly mobile foraging flocks. The
duration of ‘habitat loss’ indirectly from
cable-laying activity in the study area
can be expected to last as much as
three months post-construction of an
export cable during which time the
extent of loss will be ever diminishing.
The habitat would be expected to
recover after each working period and
curlew return to the area.
The recovery period
following cessation of works
on Project One as worst
case could be one year.
This will enable full
recovery of benthic
communities and no long
term effects on the curlew
population are predicted.
Conclusions No adverse effect predicted from
Scenario A
No adverse effect predicted from
Scenario B
No adverse effect predicted from
Scenario C
No adverse effect predicted
from Scenario D

31
Bar-tailed godwit
1.5.63 During surveys of the cable landfall area, peak numbers of bar-tailed godwits
were recorded between October and March, outside the proposed working
period. The peak count was nearly 800 birds in late November (HRA Report
12.6, Figure F.6), representing 29% of the cited Humber Estuary SPA population,
or 13% of the most recent WeBS core count population for the Humber Estuary.
These numbers are consistent with advice from Natural England that there is a
low tide roost of 400-600 bar-tailed godwits on the upper-shore overlapping with
the cable export route convergence zone.
1.5.64 Within the period April to September, bar-tailed godwits were recorded in smaller
numbers (less than 100 birds) in April and early May and in September, but were
absent between late May and August. The peak count was close to 100 birds in
late September, representing about 2% of the most recent WeBS count for the
Humber Estuary. This indicates the presence of spring and autumn passage
birds in the area. The largest numbers of birds were recorded on the upper-shore
with a small number of records overlapping with the export cable route
convergence zone (Figure 9) but also many records at distances of several
hundred metres from this area.
1.5.65 For bar-tailed godwit, Cutts et al. (2009) study reported unhabituated birds
behaviourally responding to third party disturbance e.g. taking flight, from a
distance of up to 163 m, whilst Goss-Custard (2007) review found the maxima
flight distance threshold (the distance at which birds take flight to a disturber, a
human intruder) to be 219m. As a species considered tolerant of moderate and
high level visual disturbance, Cutts et al. (2013) advises the potential zone of
influence from visual construction works to be up to 200m.
1.5.66 Based on predictions in Smit and Visser (1993), bar-tailed godwits may be
displaced at distances of about 100m from human movements. In the Firth of
Forth and the Moray Basin, studies have shown that bar-tailed godwits ranged
more widely than most other species (Rehfisch et al. 2003, Symonds et al.
1984), reflecting flexibility in habitat choice (within estuarine mudflats). A model
of the quality of the Humber Estuary for shorebirds (Stillman et al. 2005)
predicted that a 2-8% reduction in intertidal area would reduce survival rates in
bar-tailed godwit – indicating a sensitivity of this species to habitat loss. Thus for
this species, the availability of suitable alternative habitat nearby for any
disturbed birds to move to is important.

32
Table 10: Assessment of effects from in-combination construction scenarios on bar-tailed godwit
Scenario A Scenario B Scenario C Scenario D
Bar-tailed
godwit None of the birds recorded during
cable landfall surveys are close
enough to the works area for Phase 1
of cable installation to indicate that
drilling and associated activities will
not cause significant disturbance
(Figure 9 of Appendix T). There is
the potential for Phase 2 activities
within the cable export convergence
corridor to displace some bar-tailed
godwits from possible roosting (and
foraging) areas. However it is most
likely that any disturbed birds could
relocate within a few hundred metres
of the construction activities
The Project Two export cable corridor
is located to the north of the main
areas of usage of bar-tailed godwit. The overlap of Phase 1 works for
Project two and Phase 2 works for
Project two are unlikely to cause
increased disturbance given the
distribution of birds within the
intertidal away from the location of
Phase 1 works.
Bar-tailed godwit are specialist
feeders. The recovery in prey
availability in impacted areas is likely
to be slower as a consequence of the
restrictive prey species. The duration
of ‘habitat loss’ indirectly from cable-
laying activity in the study area can be
expected to last as much as three
months post-construction of an export
cable during which time the extent of
loss will be ever diminishing. The
increase duration of works under this
scenario are unlikely to affect the
recoverability of benthic habitats in
the long term.
As stated under scenario A Phase 1
works are unlikely to cause significant
disturbance. The Phase 2 works of
Project One may displace birds from
possible roosting and foraging sites
however its like birds could relocated
within a few hundred metres of
activities.
The extended duration of works under
this scenario is unlikely to prevent
birds returning to the area. A study of
curlew by Zegers (1973, cited in Smit
and Visser 1993) found that roost size
returned to normal 2-3 weeks after
disturbance from cannon netting at
the same site on two nights with a
nine day interval. Curlew is
considered to be more sensitive to
disturbance by Cutts and Allen (1999)
and Smit and Visser (1993). It is
therefore reasonable to assume that
bar-tailed godwit numbers will return
to the construction corridor in a
similar or reduced timescale.
As stated under scenario B bar-tailed
godwit are specialist feeders,
however the increase duration of
works under this scenario are unlikely
to affect the recoverability of benthic
habitats in the long term, especially
given each phase of each project will
Similar to scenario C but
with a longer recovery
period between cessation
of Project One activities.
The increased time
between each project will
be beneficial to the
recoverability of benthic
habitats.
33
disturb different areas of the intertidal
at different times.
Conclusions No adverse effect predicted from
Scenario A
No adverse effect predicted from
Scenario B
No adverse effect predicted from
Scenario C
No adverse effect
predicted from Scenario D

34
Common tern
1.5.67 The Horseshoe Point area has been identified by Natural England to be a
common tern roost site in late summer, likely coinciding with birds on southward
migration. There are two SPAs further north on the east coast of England which
have the greatest likelihood of hosting common terns that may roost in the
vicinity of the cable landfall site. The two sites considered in the current
assessment are the Coquet Island SPA and Farne Islands SPA. Common tern is
not a qualifying feature of the Humber SPA.
1.5.68 The potential for LSE in relation to disturbance during cable installation has been
identified for common tern, based on advice from Natural England that the
species was found roosting on passage (in late summer, between July and
September) near the cable landfall site in numbers that are potentially significant
in the context of the Coquet Island and Farne Islands SPA populations.
1.5.69 Information provided by Natural England indicates that the roosting area used by
terns is to the north and east of the cable landfall export zone, with some overlap
with the temporary working area to the north of the cable zone but extending into
the intertidal area north of the temporary working area. The availability of this
area will be dependent on tide state as it includes parts of the shore below mean
high water, indicating that common terns must also have alternative roost sites.
1.5.70 Common terns were recorded infrequently during surveys of the cable landfall
area, with all records on the upper shore north of the export cable route
convergence zone (Figure 10 of Appendix T). However the numbers of roosting
terns would be expected to be highest at dusk, whereas estuarine surveys were
carried out at varying times throughout daylight hours. The use of the intertidal
area by terns between July and September may be sporadic, and often most
frequent in congregations from dusk onwards, which may be missed by surveys.
1.5.71 Most scientific studies of disturbance to terns have concentrated on breeding
colonies, so the translation of results to roosting birds on passage may be
limited. Terns can be relatively resistant to human activity in close proximity (for
example a large breeding colony persists within the Imperial Lock Dock SPA,
Edinburgh) within the busy port of Leith. Studies of disturbance to breeding
colonies suggest that buffer zones of 100-200m would minimise any negative
impacts of human activities and prevent displacement of common terns (Camey
and Sydeman, 1999, Rodgers and Smith 1995, Erwin 1989).
1.5.72 Phase 1 of the works, in the vicinity of the sea wall, is at least 500m distant from
the areas used by roosting terns (e.g. see tern records on Figure 10) so no
disturbance is predicted.
1.5.73 Common tern roosts in the vicinity of the cable landfall will occur around low tide
and at dusk and into the night during late summer. This will be outside the
daylight working hours of Phase 2 works (except for a short (c. 12 hours) period
of cable pull-in across the intertidal area, see section 1.2 above). Thus
disturbance to the intertidal area will be negligible during the time that common

35
terns are likely to be present. In addition all information on the location on tern
roosts indicates that these are to the northwest of the cable export convergence
zone and that roosting terns can be accommodated within areas beyond the
likely disturbance distance of 100-200m. Further, roosting terns are most likely to
be post-breeding adults, likely accompanied by fledged juveniles, so no impacts
on the productivity of SPA populations at Coquet Island or the Farne Islands are
not predicted.

36
Table 11: Assessment of effects from in-combination construction scenarios on common tern
Scenario A Scenario B Scenario C Scenario D
Common
tern
Most scientific studies of disturbance to terns have concentrated on breeding colonies, so the translation of results to roosting birds on passage may
be limited. Terns can be relatively resistant to human activity in close proximity (for example a large breeding colony persists within the Imperial
Lock Dock SPA, Edinburgh) within the busy port of Leith. Studies of disturbance to breeding colonies suggest that buffer zones of 100-200m would
minimise any negative impacts of human activities and prevent displacement of common terns (Camey and Sydeman, 1999, Rodgers and Smith
1995, Erwin 1989).
Phase 1 of the works for both Projects, in the vicinity of the sea wall, is at least 500m distant from the areas used by roosting terns (e.g. see tern
records on Figure 10) so no disturbance is predicted.
Common tern roosts in the vicinity of the cable landfall will occur around low tide and at dusk and into the night during late summer. This will be
outside the daylight working hours of Phase 2 works for both Projects (except for a short (c. 12 hours) period of cable pull-in across the intertidal
area, see section 1.2 above). Thus disturbance to the intertidal area will be negligible during the time that common terns are likely to be present. In
addition all information on the location on tern roosts indicates that these are to the northwest of the cable export convergence zone and that
roosting terns can be accommodated within areas beyond the likely disturbance distance of 100-200m.
As common tern roosts will not be affected by construction works from either project the timescales associated with each scenario are irrelevant and
no effect is predicted.
Conclusions No adverse effect predicted from
Scenario A
No adverse effect predicted from
Scenario B
No adverse effect predicted from
Scenario C
No adverse effect predicted from
Scenario D

37
1.6 Conclusions
1.6.74 The potential effects of the intertidal construction works associated with Project
One have been assessed in combination with those predicted to arise from
Project Two. There is uncertainty about the timing of the works associated with
Project Two so different scenarios have been assessed to consider the full range
of potential interaction between the two projects.
1.6.75 In Scenario A it is assumed that the works will occur concurrently and, as a
consequence, the duration of works will be no longer than that predicted for
Project One alone. The extent of disturbance arising from the works will be
greater though due to the larger working area and greater level of activity
expected. In Scenarios C and D the works are sequential and so the level of
disturbance in any year is no greater than that for Project One alone. The
duration of works will be longer (4 years in each case, compared to 2 years for
Project One alone), the difference in these scenarios being the length of time
between the conclusion of Project One and the commencement of Project Two.
Scenario B assumes some overlap of the works in the two projects. The duration
of works is longer than for Project One alone (3 years) but less than that for
sequential construction scenarios. The level of disturbance assumed in this
scenario is variable. In years 1 and 3 it is the same as that for Project One alone,
in year 2 it will be greater reflecting a larger working area and greater level of
activity arising from the concurrent construction of Project One and Two.
1.6.76 The effects of these scenarios on bird species that are features of the Humber
Estuary SPA and that have a reliance on the intertidal habitats potentially
affected by these works have been systematically assessed. There is no
indication that an adverse effect on any of these features is likely to arise as a
consequence of the construction of Project One together with Project Two under
any of the scenarios considered. In all cases the extent of disturbance is
relatively low and temporary in nature. There is evidence to suggest that
intertidal birds recover quickly from disturbance and are likely to return to areas
shortly after any activity causing disturbance ceases. There will be gaps in
activity that will allow birds to continue to make use of habitats once construction
works cease. In some scenarios these gaps will comprise months or even years
without any construction activity. In none of the scenarios is any permanent loss
of habitat predicted.
1.6.77 On this basis it is concluded that there will be no adverse effect on the intertidal
bird interest features of the Humber SPA arising from Project One alone or in
combination with any other plan or project (including Project Two).
1.7 References
Allen, J. Boyes, S. Burdon, D. Cutts, N. Hawthorne, E. Hemingway, K. Jarvis, S. Jennings,
K. Mander, L. Murby, P. Proctor, N. Thomson, S. and Waters, R. (2003) The Humber

38
Estuary: A comprehensive review of its nature conservation interest. English Nature
Report Number 547, Peterborough.
Burger, J. & Gochfeld, M. (1991). Human activity influence and diurnal and nocturnal
foraging of Sanderlings Calidris alba. Condor 93: 259–265.
Carney, K.M. & Sydeman, W.J. (1999) A review of human disturbance effects on nesting
colonial waterbirds. Waterbirds, 22, 68–79.
Catley, G. (2000) Humber Estuary wetland bird survey. Twelve months of high and low
tide counts September 1998 to August 1999. Peterborough: English Nature Research
Reports, No. 339.
Cruikshanks, K., Liley, D., Fearnley, H., Stillman, R., Harvell, p., Hoskin, R. & Underhill-
Day, J. (2010). Desk Based Study on Recreational Disturbance to birds on the Humber
Estuary. Footprint Ecology / Humber Management Scheme.
Cutts, N. and Allen (1999). Avifaunal Disturbance Assessment: lood Defence Work,
Saltend. Institute of Estuarine and Coastal Studies, University of Hull. Report to
Environment Agency.
Cutts, N., Phelps, A. and Burdon, D.. (2009). Construction and Waterfowl: Defining
Sensitivity, Response, Impacts and Guidance. University of Hull report to Humber INCA.
Report ZBB710-F-2009.
Cutts, N. Hemingway & Spencer, J. (2013). Waterbird Disturbance Mitigation Toolkit
Informing Estuarine Planning & Construction Projects. Institute of Estruarine & Coastal
Studies, University of Hull, Hull.
Dugan, P.J. 1981. The importance of nocturnal foraging in shorebirds: a consequence of
increased invertebrate prey activity. In: N.V. Jones & W.J. Wolff (eds) Feeding and
Survival Strategies of Estuarine Organisms. (Cited from Rehfisch et al. 2003).
Erwin, R.M. (1989) Responses to human intruders by birds nesting in colonies:
experimental results and management guidelines. Colonial Waterbirds, 12, No. 1: 104-
108.
Goss-Custard, J. D. & Verboven, N. (1993) Disturbance and feeding shorebirds on the Exe
estuary. Wader Study Group Bulletin, 68, 59–66.
Goss-Custard, J.D. (2007). National Cycle Network – Exe Estuary Proposal. Assessment
of the anticipated effects on the Exe Estuary Special Protection Area. A report to Devon
County Council.
IECS. (2008). Construction and Waterfowl: Defining Sensitivity, Response, Impacts and
Guidance. University of Hull report to Humber INCA.
Rodgers, Jr. J.A. and Smith, H.T. (1995) Set-back distances to protect nesting bird
colonies from human disturbance in Florida. Conservation Biology 9: 89-99.

39
Rehfisch M.M., H. Insley & B. Swann (2003). Fidelity of overwintering shorebirds to roosts
on the Moray Basin, Scotland: implications for predicting impacts of habitat loss. Ardea
91(1): 53-70.
Rehfisch, M.M., Langston, R.H.W., Clark, N.A. and Forrest, C. (1993). A guide to the
provision of refuges for roosting waders. Report by the British Trust for Ornithology under
contract to English Nature. BTO Research Report No. 120.
RPS (2014) Tetney Sea Line Replacement Project Environment Statement. A report to
ConocoPhillips Ltd..
SMart Wind (2012). Hornsea Project Two Environmental Impact Assessment Scoping
Report. October 2012.
Smit,C .J. & Visser,G .J.M. 1993. Effects of disturbance on shorebirds a: summary of
existing knowledge from the Dutch Wadden Sea and Delta area. Wader Study Group Bull.
68: 6-19.
Stillman, R.A. West, A.D. Goss-Custard, J. McGrorty, S. Frost, N. Morrisey, D.J. Kenny,
A.J. & Drewitt, A.L. (2005) Predicting site quality for shorebird communities: a case study
on the Humber estuary, UK. Marine Ecology Progress Series 305: 203-217.
Symonds F.L., D. Langslow & M.W. Pienkowski 1984. Movements of wintering shorebirds
within the Firth of Forth: species differences in usage of an intertidal complex. Biological
Conservation 28: 187-215.
Zegers, P.M. 1973. Invloed van verstoring op het gedrag van wadvo- gels. Waddenbull.
8(3): 3-7