HOLD - Ascendas REIT - Investor Relations: IR Homeir.ascendas-reit.com/misc/Ascendas...
30
MITA No. 013/06/2009 Please refer to the important disclosures at the back of this document. Ascendas REIT Strong asset portfolio. Ascendas REIT (A-REIT) is Singapore's first and largest business space and industrial REIT, with a portfolio of 90 properties and book value of about S$4.7 billion. The key strength of A-REIT lies in its strong asset portfolio. We like A-REIT for its balance exposure to different groups of industrial properties, balance mix of single and multi-tenanted properties and diversified base of quality tenants. Growth via property development. A-REIT's expertise and engagement in industrial property development can also enhance shareholder value and further strengthen its asset portfolio. With just one ongoing development project at the moment, this leaves A-REIT with significant headroom of S$280.6m for new development projects. Limited impact from negative rental reversions. Even though some of A- REIT's assets could face negative rental reversions going forward, we believe that the impact on its portfolio as a whole would not be significant because the NLA of expiring leases is small compared to the total NLA of A-REIT's portfolio and the average existing rents of these expiring leases are not significantly higher than current market rents. Gearing level remains comfortable. Its balance sheet has been strengthened after two fund raising exercises this year. A-REIT successfully lowered its gearing level to 30.5% at the end of Sep 2009. The current gearing ratio provides a comfortable buffer from management's target gearing ratio of 40%. DPU to fall due to placement dilution. We expect A-REIT to deliver DPU of 12.86 S-cents for FY09/10. This is 15.3% lower than the FY08/09 DPU due to the dilution impact from the two placement exercises in 2009. For FY10/11, we expect DPU to remain steady and turn in marginal growth of 0.3% YoY to 12.9 S-cents. These translate to DPU yields of 6.84% and 6.86% for FY09/10 and FY10/11, respectively. Re-initiate A-REIT with HOLD; fair value estimate of S$1.76. We derive a fair value estimate of S$1.76 for A-REIT, which is pegged at par to our RNAV estimate. We like A-REIT for its stable dividend yield, diversified tenant base, long term leases and property development capability. Nevertheless, we re- initiate coverage on A-REIT with a HOLD rating on valuation ground. We advise investors to accumulate A-REIT at more attractive price levels around the range of S$1.60 to S$1.70. An undeniable leader in industrial space SINGAPORE Company Report 24 November 2009 Re-initiating Coverage HOLD S$1.88 Fair Value: S$1.76 Stock Code: Reuters: AEMN.SI ISIN Code A17U Bloomberg: AREIT SP Event: Re-initiate Coverage General Data Issued Capital (m) 1,870 Mkt Cap (S$m/US$m) 3515 / 2538 Major Shareholder Ascendas Land (19.23%) Free Float (%) 71.73 NTA per share (S$) 1.60 Daily Vol 3-mth (‘000) 7,523 52Wk High (S$) 1.950 52Wk Low (S$) 1.008 Foo Sze Ming (65) 6531 9810 e-mail: [email protected] Year to Gross Revenue Net Pty Income Distri Income DPU NAV Price/NAV Net Div Yield 31 Mar (S$m) (S$m) (S$m) (cents) (S$) (x) (%) FY 08 322.3 243.5 187.3 14.1 1.8 1.0 7.5 FY 09 396.5 296.6 210.9 15.2 1.6 1.2 8.1 FY 10F 413.4 322.5 240.4 12.9 1.6 1.2 6.8 FY 11F 416.4 324.8 241.1 12.9 1.6 1.2 6.9
Transcript of HOLD - Ascendas REIT - Investor Relations: IR Homeir.ascendas-reit.com/misc/Ascendas...

MITA No. 013/06/2009
Please refer to the important disclosures at the back of this document.
Ascendas REIT
Strong asset portfolio. Ascendas REIT (A-REIT) is Singapore's first and
largest business space and industrial REIT, with a portfolio of 90 properties
and book value of about S$4.7 billion. The key strength of A-REIT lies in its
strong asset portfolio. We like A-REIT for its balance exposure to different
groups of industrial properties, balance mix of single and multi-tenanted
properties and diversified base of quality tenants.
Growth via property development. A-REIT's expertise and engagement in
industrial property development can also enhance shareholder value and further
strengthen its asset portfolio. With just one ongoing development project at
the moment, this leaves A-REIT with significant headroom of S$280.6m for
new development projects.
Limited impact from negative rental reversions. Even though some of A-
REIT's assets could face negative rental reversions going forward, we believe
that the impact on its portfolio as a whole would not be significant because
the NLA of expiring leases is small compared to the total NLA of A-REIT's
portfolio and the average existing rents of these expiring leases are not
significantly higher than current market rents.
Gearing level remains comfortable. Its balance sheet has been
strengthened after two fund raising exercises this year. A-REIT successfully
lowered its gearing level to 30.5% at the end of Sep 2009. The current gearing
ratio provides a comfortable buffer from management's target gearing ratio of
40%.
DPU to fall due to placement dilution. We expect A-REIT to deliver DPU of
12.86 S-cents for FY09/10. This is 15.3% lower than the FY08/09 DPU due to
the dilution impact from the two placement exercises in 2009. For FY10/11,
we expect DPU to remain steady and turn in marginal growth of 0.3% YoY to
12.9 S-cents. These translate to DPU yields of 6.84% and 6.86% for FY09/10
and FY10/11, respectively.
Re-initiate A-REIT with HOLD; fair value estimate of S$1.76. We derive a
fair value estimate of S$1.76 for A-REIT, which is pegged at par to our RNAV
estimate. We like A-REIT for its stable dividend yield, diversified tenant base,
long term leases and property development capability. Nevertheless, we re-
initiate coverage on A-REIT with a HOLD rating on valuation ground. We advise
investors to accumulate A-REIT at more attractive price levels around the
range of S$1.60 to S$1.70.
An undeniable leader in industrial space
SINGAPORE Company Report
24 November 2009
Re-initiating Coverage
HOLD
S$1.88
Fair Value: S$1.76
Stock Code:Reuters: AEMN.SIISIN Code A17UBloomberg: AREIT SP
Event: Re-initiate Coverage
General Data
Issued Capital (m) 1,870
Mkt Cap (S$m/US$m) 3515 / 2538
Major Shareholder
Ascendas Land (19.23%)
Free Float (%) 71.73
NTA per share (S$) 1.60
Daily Vol 3-mth (‘000) 7,523
52Wk High (S$) 1.950
52Wk Low (S$) 1.008
Foo Sze Ming(65) 6531 9810e-mail: [email protected]
Year to Gross Revenue Net Pty Income Distri Income DPU NAV Price/NAV Net Div Yield
31 Mar (S$m) (S$m) (S$m) (cents) (S$) (x) (%)
FY 08 322.3 243.5 187.3 14.1 1.8 1.0 7.5
FY 09 396.5 296.6 210.9 15.2 1.6 1.2 8.1
FY 10F 413.4 322.5 240.4 12.9 1.6 1.2 6.8
FY 11F 416.4 324.8 241.1 12.9 1.6 1.2 6.9

Page 2 24 November 2009
Ascendas REIT
Section A Investment Highlights 3
Section B Sector Outlook 5
Section C Asset Portfolio Analysis 8
Section D Capital Management 14
Section E Financials 16
Section F Peers Comparison 18
Section G Valuation 20
Section H Risk factors 23
Appendix 1 Background on A-REIT 24
Appendix 2 Trust Structure 25
Appendix 3 Asset Portfolio Summary 26
Table of Content

Page 3 24 November 2009
Ascendas REIT
Section A: Investment Highlights
Re-initiate A-REIT with HOLD; fair value estimate of S$1.76. We are
re-initiating coverage on A-REIT with a HOLD rating and fair value estimate
of S$1.76, which is pegged at par to our RNAV estimate. We like A-REIT
for its stable dividend yield, diversified tenant base, long term leases and
property development capability. Nevertheless, we re-initiate coverage on
A-REIT with a HOLD rating on valuation ground. We advise investors to
accumulate A-REIT at more attractive price levels around the range of S$1.60
to S$1.70.
Strong asset portfolio. One of the key strengths of A-REIT is its strong
asset portfolio. We like A-REIT for its balance exposure to different groups
of industrial properties, balance mix of single and multi-tenanted properties
and diversified base of quality tenants. A-REIT also holds security deposits
from tenants. On a portfolio basis, the weighted average security deposit
is 7 months of A-REIT's gross rental income. This protects A-REIT from
any defaults or early lease termination by tenants.
Growth via property development. A-REIT's expertise and engagement
in industrial property development can also enhance shareholder value and
further strengthen its asset portfolio. With just one ongoing development
project at the moment - the Built-to-Suit (BTS) for SingTel with an expected
development cost of S$175.4m, this leaves A-REIT with significant headroom
of S$280.6m for new development projects.
Limited impact from negative rental reversions in FY09/10 and FY10/
11. Even though negative rental reversions could affect A-REIT's portfolio of
flatted factories and logistics and distribution centres in FY09/10 and FY10/
11, we believe that the impact on A-REIT's portfolio as a whole would not
be significant because the NLA of expiring leases is small when compared
to the total NLA of A-REIT's portfolio and the average existing rents of
these expiring leases are not significantly higher than the current market
rents.
Gearing level remains comfortable. With the two fund raising exercises,
A-REIT has successfully lowered its gearing level from 42.2% at the end of
2008 to 30.5% at the end of Sep 2009. The current gearing ratio also
provides a comfortable buffer from management's target gearing ratio of
40%. A-REIT is able to tolerate a further 23.9% decline (S$1,120m) in the
valuation of its property portfolio before breaching its target gearing level.
This provides a very comfortable buffer, in our view.
DPU to fall due to placement dilution. We expect A-REIT to deliver
DPU of 12.86 S-cents for FY09/10. This is 15.3% lower than the FY08/09
DPU and is due to the dilution impact from the two placement exercises in
2009. For FY10/11, we expect DPU to remain steady and turn in marginal
growth of 0.3% YoY to 12.9 S-cents. These translate to DPU yields of
6.84% and 6.86% for FY09/10 and FY10/11, respectively.

Page 4 24 November 2009
Ascendas REIT
Key risk factors. Some of the key risk factors in investing in A-REIT include
its exposure to the economic conditions and government policy in Singapore,
competition in a highly fragmented industrial property market and potential
conflict of interests between A-REIT and the Ascendas Group.

Page 5 24 November 2009
Ascendas REIT
Section B: Sector Outlook
Industrial property prices had fallen 15%-24% from peak. According
to URA data, median prices and rents of multiple user factories had already
fallen sharply by 21.2% and 15.3% respectively since peaking in 3Q08.
For multiple user warehouses, prices and rents had also fallen by 24.3%
and 20.6% respectively over the same period. The credit crisis and slowdown
in economic activities had resulted in the decline in demand for industrial
space, which fell to the lowest since 2007, as corporates scaled back on
expansion plans in light of the uncertain outlook. However, as global
economies emerged out of the crisis, the pace of decline in industrial property
prices and rents had slowed down since 1Q09.
Exhibit 2: Median price and median rent for warehousing space
Source: URA
350
370
390
410
430
450
470
490
510
530
550
19
99
20
00
20
01
20
02
20
03
20
04
20
05
20
06
20
07
20
08
20
09
3Q
Pri
ce
(S
$ p
sf)
1.10
1.20
1.30
1.40
1.50
1.60
1.70
1.80
Re
nta
l (S
$ p
sf
pm
)
Median price (LHS) Median rent (RHS)
Exhibit 1: Median price and median rent for factory space
Source: URA
250
270
290
310
330
350
370
390
19
99
20
00
20
01
20
02
20
03
20
04
20
05
20
06
20
07
20
08
20
09
3Q
Pri
ce
(S
$ p
sf)
1.00
1.10
1.20
1.30
1.40
1.50
1.60
1.70
1.80
Re
nta
l (S
$ p
sf
pm
)
Median price (LHS) Median rent (RHS)

Page 6 24 November 2009
Ascendas REIT
Supply outlook for factory space remains a concern. According to
URA, there will be 24.9m sq ft of factory space completing between 2010
and 2013, out of which 13.3m sq ft will be entering the market in 2010.
Although the oncoming supply of factory in 2010 will be lower than that in
2009, this figure is still significantly higher in comparison to the annual
supply of factory space between 2003 and 2008. On a positive note, as
much as 43% and 84% of the new supply of business and science park
space and industrial space have already been pre-committed. However,
the take-up rate of the remaining uncommitted space could still remain
slow unless there is a sustainable recovery in the global economy. We
estimate that vacancy rate for factory space could reach a peak of 9.2% in
2010, after which we expect to see a decline in vacancy rate on the back of
the decline in the pipeline of new factory space. For warehousing space,
we are more optimistic on this sector as the oncoming supply of new
warehousing space is expected to decline sharply in 2010 and 2011.
Exhibit 3: Supply and demand outlook for factory space
Source: URA, OIR estimates
0.0
2.0
4.0
6.0
8.0
10.0
12.0
14.0
16.0
18.0
20.0
19
96
19
97
19
98
19
99
20
00
20
01
20
02
20
03
20
04
20
05
20
06
20
07
20
08
20
09
F
20
10
F
20
11
F
20
12
F
20
13
F
GF
A (
mil
lio
n s
q f
t)
0.0%
2.0%
4.0%
6.0%
8.0%
10.0%
12.0%
14.0%
Va
ca
nc
y r
ate
(%
)Supply Demand Vacancy rate

Page 7 24 November 2009
Ascendas REIT
Exhibit 4: Supply and demand outlook for warehousing space
Source: URA, OIR estimates
0.0
1.0
2.0
3.0
4.0
5.0
6.0
19
96
19
97
19
98
19
99
20
00
20
01
20
02
20
03
20
04
20
05
20
06
20
07
20
08
20
09
F
20
10
F
20
11
F
20
12
F
20
13
F
GF
A (
mil
lio
n s
q f
t)
0.0%
2.0%
4.0%
6.0%
8.0%
10.0%
12.0%
14.0%
16.0%
Va
ca
nc
y r
ate
(%
)
Supply Demand Vacancy rate

Page 8 24 November 2009
Ascendas REIT
Exhibit 5: A-REIT's exposure to different groups of industrial properties
Source: Company, OIR
Valuation as
at 31 Mar 09
(S$m)
% of total
portfolio Description
Business & Science Park* 1,441.6 31.7 Suburban office, corporate HQ buildings and R&D space
Hi-tech Industrial 946.7 20.8 High office content combined with high specifications industrial mixed-use space
Light Industrial & Flatted Factories 830.6 18.3 Low office content combined with manufacturing space
Logistics & Distribution Centres* 1,193.5 26.2 Warehousing and distribution centres
Warehouse Retail Facilities 137.0 3.0 Single-user retail and warehouse space
4,549.4 100.0
* Includes the development costs for the newly completed Expeditors Building and Plaza 8
Section C: Asset Portfolio Analysis
Balance exposure within different groups of industrial properties.
Within the industrial property group, there are different groups of industrial
properties that cater to different needs of the users (refer to Exhibit 5).
While the conventional industrial space is usually related to manufacturing
and storage uses, there are also industrial spaces that cater to research
and development purposes and also some with high office content that
acts as a substitute to the conventional office space. A-REIT's portfolio of
assets is well-diversified among the different groups of industrial properties
and this mitigates the risk of a slowdown in demand for any particular
group of industrial properties.
Balance mix of single and multi-tenanted properties improves
income stability. Single-tenanted buildings typically have long term leases
with stepped rental increases which provide greater income stability to A-
REIT. On the other hand, multi-tenanted buildings have shorter lease terms
and have more volatile income streams due to rental reversions which are
largely dependent on the economic cycle. Within A-REIT's asset portfolio,
46% of its portfolio value is attributable to single-tenanted sale-&-leaseback
buildings while the remaining 54% is attributable to multi-tenanted buildings.
This balance provides A-REIT with a component of income stability and
also a component of potential income growth from rental reversions.

Page 9 24 November 2009
Ascendas REIT
Exhibit 6: Balance mix of single and multi-tenanted properties
Source: Company
Mix of Sale-&-Leaseback vs Multi-tenanted Buildings
(% of total portfolio value)
Sale-&-
Leaseback, 46%Multi-tenanted
Buildings, 54%
Diversified base of strong tenants mitigates tenancy risk. A-REIT has
a diversified tenant base with about 900 tenants that include well-established
companies such as SingTel, Siemens, Hewlett Packard and Toll Asia. With
the exception of SingTel which contributes 5.9% of A-REIT's portfolio income,
no other single tenant account for more than 5% of A-REIT's total portfolio
income and the top 10 tenants account for about 26.5% of A-REIT's total
portfolio income. While tenancy risk for industrial landlord has heightened
in light of the weak manufacturing and global trade, A-REIT's strong tenant
base, coupled with its limited rental exposure to a single tenant, should
help to mitigate its tenancy risk profile.
Exhibit 7: Top 10 tenants
Source: Company
Sector % of portfolio income
Singtel Telecommunication 5.9
C&P Logistics 4.5
Creative Electronics 3.6
Cold Storage Retail 2.0
Siemens Multi-industry 2.0
SenKee Logistics Logistics 2.0
TT International Electronics, Logistics 1.8
Hewlett Packard Electronics 1.6
Toll Asia Logistics 1.6
Courts Megastore Retail 1.5
26.5

Page 10 24 November 2009
Ascendas REIT
Exhibit 8: Security deposit for sale & leaseback (SLB) properties
Source: Company
No of SLB properties
Weighted average no of
months rent as security
deposit*
Business & Science Parks 3 14
Hi-Tech Properties 7 7
Light Industrial 26 11
Logistics & Distribution Centres 14 9
Warehouse Retail Facilities 2 11
52 9.4
* Excluding cases where rental is paid upfront
Security deposits provide cushion against tenants default. For its sale-
&-leaseback properties, A-REIT holds security deposits ranging from 7 to
14 months (weighted average: 10 months). On a portfolio basis, the weighted
average security deposit is 7 months of A-REIT's gross rental income. The
higher amount of security deposits held for sale-&-leaseback properties
could protect A-REIT from any potential default by its sale-&-leaseback
tenants, which will have a greater impact on A-REIT's income (due to its
larger quantum) than a potential default by a tenant in a multi-tenanted
property. In the event of a default, rental income can be sustained by the
security deposit over the short term as A-REIT seeks new tenants for its
property.
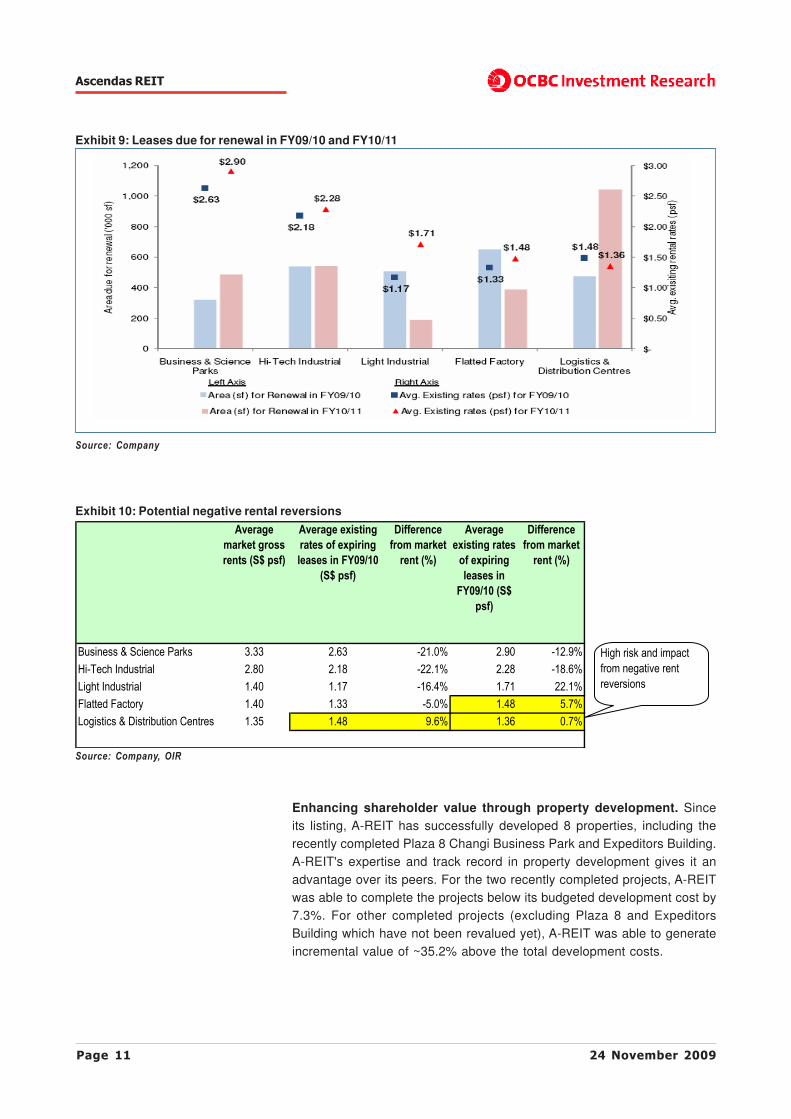
Limited impact from negative rental reversions in FY09/10 and FY10/
11. For the leases expiring in FY09/10 and FY10/11, we do not foresee
significant impact from negative rental reversions on A-REIT. The average
existing rents of expiring leases in its business and science parks and hi-
tech industrial properties are still 12.9% to 22.1% below the current market
asking rents, which provide a comfortable margin of safety to accommodate
any further decline in market rents. For the light industrial properties, expiring
leases in FY10/11 could face significant negative rental reversion as average
existing rent of expiring leases is currently 22.1% higher than market asking
rents but the overall impact on A-REIT's portfolio income will be limited as
the area is just ~1% of the total NLA of A-REIT's portfolio. Negative rental
reversion could also affect A-REIT's flatted factories in FY10/11 and logistics
and distribution centres in FY09/10 and FY10/11 but the impact should be
manageable as average existing rents of these expiring leases are not
significantly higher than the current market rents.
Page 11 24 November 2009
Ascendas REIT
Exhibit 9: Leases due for renewal in FY09/10 and FY10/11
Source: Company
Average
market gross
rents (S$ psf)
Average existing
rates of expiring
leases in FY09/10
(S$ psf)
Difference
from market
rent (%)
Average
existing rates
of expiring
leases in
FY09/10 (S$
psf)
Difference
from market
rent (%)
Business & Science Parks 3.33 2.63 -21.0% 2.90 -12.9%
Hi-Tech Industrial 2.80 2.18 -22.1% 2.28 -18.6%
Light Industrial 1.40 1.17 -16.4% 1.71 22.1%
Flatted Factory 1.40 1.33 -5.0% 1.48 5.7%
Logistics & Distribution Centres 1.35 1.48 9.6% 1.36 0.7%
High risk and impact
from negative rent
reversions
Exhibit 10: Potential negative rental reversions
Source: Company, OIR
Enhancing shareholder value through property development. Since
its listing, A-REIT has successfully developed 8 properties, including the
recently completed Plaza 8 Changi Business Park and Expeditors Building.
A-REIT's expertise and track record in property development gives it an
advantage over its peers. For the two recently completed projects, A-REIT
was able to complete the projects below its budgeted development cost by
7.3%. For other completed projects (excluding Plaza 8 and Expeditors
Building which have not been revalued yet), A-REIT was able to generate
incremental value of ~35.2% above the total development costs.

Page 12 24 November 2009
Ascendas REIT
Exhibit 11: Completed development projects
Source: Company
Completed Development
Development
Cost (S$m)
Book value as at
31 Mar 09 (S$m) Value-add (%)
Courts Megastore 46.0 60.9 32.4
Giant Hypermart 65.4 76.1 16.4
HansaPoint@CBP* 26.1 80.9 210.0
15 Changi North Way 36.2 40.9 13.0
Pioneer Hub 79.3 90.0 13.5
3 Changi Business Park Crescent 59.0 72.9 23.6
Plaza 8 Changi Business Park# 98.8 98.8 NA
Expeditors Building# 24.2 24.2 NA
Total 435.0 421.7 35.2
* CBP - Changi Business Park
computation of the value-add %
# Revaluations of Plaza 8 and Expeditors Building have not been done yet; Excluded in the
Source: Company
Exhibit 12: Development projects in progress
Development-in-progress
Expected
Development
Cost (S$m)
Expected
Completion Date
BTS Hi-Tech Industrial building for Singtel 175.4 4Q FY09/10
Total 175.4
Amount funded 100.5
Development cost to be funded 74.9
Appetite for more development projects. Based on A-REIT's deposited
property value of S$4,559.7m, it has the capacity to take on as much as
S$456m worth of development projects in accordance to the maximum
10% exposure limit of the property fund's deposited property to property
development under the MAS guidelines for property fund. With just one
ongoing development project at the moment - Built-to-Suit (BTS) for SingTel
with an expected development cost of S$175.4m, this leaves A-REIT with
significant headroom of S$280.6m for new development projects.

Page 13 24 November 2009
Ascendas REIT
Backing from a strong sponsor - Ascendas. A-REIT is sponsored by the
Ascendas Group, which holds a deemed interest of 20.66% through
Ascendas Land and Ascendas Funds Management. Ascendas, a subsidiary
of JTC Corporation, has an excellent track record as Asia's premier developer
and manager of business space. It manages S$9b of assets, with presence
in more than 30 cities in 10 countries. We believe that having a strong
sponsor in Ascendas could provide financial support and instill greater investor
confidence in A-REIT, especially during challenging times. Even though A-
REIT's right of first refusal on its sponsor's assets have expired, it is still
able to leverage on its sponsor's portfolio of assets for acquisition, as
demonstrated in its acquisitions of the Science Hub & Rutherford and CGG
Veritas Hub.

Page 14 24 November 2009
Ascendas REIT
Exhibit 13: Significant buffer to breach target gearing level
Source: Company, OIR
in S$ m
Total assets 4,695
Aggregate leverage (include deferred payments) 1,430
Gearing 30.50%
Target gearing (a) 40.00%
Aggregate leverage (include deferred payments) (b) 1,430
Total assets (=b/a) 3,575
Buffer to asset devaluation 1,120
- % of current asset value 23.90%
Section D: Capital Management
Completed two fund raising exercises in CY09. For the year to date,
A-REIT had successfully raised a total of S$709.6m from two fund raising
exercises. Gross proceeds of S$408m were raised from a private placement
and preferential offering exercise in January and another S$301.6m were
raised from a private placement exercise in August. The successful book
closure of its private placement in January that came within a day of launch
amid the challenging market condition was a good demonstration of A-
REIT's capability in the capital market.
Gearing level remains comfortable. With the two fund raising exercises,
A-REIT successfully lowered its gearing level from 42.2% at the end of
2008 to 30.5% at the end of Sep 2009. The current gearing ratio provides a
comfortable buffer from management's target gearing ratio of 40%. A-REIT
is able to tolerate a further 23.9% decline (S$1,120m) in the valuation of its
property portfolio before breaching its target gearing level. This provides a
very comfortable buffer, in our view.
Well spread out debt maturity profile eases refinancing strain. Near
term refinancing risk for A-REIT is limited as it has already completed its
refinancing exercise for 2009. For the S$300m term loan facility due in
2010, A-REIT has already received offer to extend the loan. The maturity
profile of A-REIT's borrowings is also well spread out, with less than 30% of
total borrowings due for refinancing in each of the next 5 years. Its diversified
funding sources from untapped portion of its Multicurrency Medium Term
Note (MTN) programme (~S$725m) and various bilateral banking credit
facilities also provide financial flexibility for A-REIT's refinancing needs.

Page 15 24 November 2009
Ascendas REIT
Exhibit 14: Debt maturity profile
Source: Company
350395
300
150 125
87
0
50
100
150
200
250
300
350
400
450
2010 2011 2012 2013 2014
in S
$m
CMBS Term loan MTN Revolving credit facilities
% of total
borrowings 21.3% 16.8% 24.9% 8.9% 28.1%

Page 16 24 November 2009
Ascendas REIT
Section E: Financials
Key revenue driver coming from development projects. We expect
A-REIT to deliver revenue growth of 4.3% YoY to S$413.4m in FY09/10 as
newly completed projects such as Plaza 8 (CBP Phase 2) and Expeditors
Building will contribute positively from 3Q FY09/10 onwards. Other completed
development projects such as 3 Changi Business Park Crescent (CBP
Phase 1), Pioneer Hub and 15 Changi North Way will also make their
maiden full year contribution in FY09/10. For FY10/11, we expect revenue
growth to slow down to 0.7% YoY as we expect negative rental reversions
to offset the incremental revenue growth from new development projects.
The BTS for SingTel at Kim Chuan will start contributing to A-REIT's top-
line from FY10/11 onwards.
Exhibit 15: Revenue forecasts
Source: Company, OIR estimates
413.4 416.4
396.5
322.3
300
320
340
360
380
400
420
440
FY2007/08 FY2008/09 FY2009/10F FY2010/11F
in S$m
Additional
income from
CBP Phase
1& 2,
Pioneer
Hub, 15
Changi
North Way
&
Ex peditors
Building
Full y ear
contribution
from
Ex peditors
Building,
CBP Phase
2 and
Singtel BTS.
Lower property expenses drive NPI growth rate higher. For FY09/10,
we expect A-REIT to deliver stronger NPI growth rate of 8.7% relative to its
revenue growth, with an expected NPI of S$322.5m. Stronger NPI growth is
aided by property tax rebate and lower utilities charges. For FY10/11, we
expect A-REIT to deliver NPI of S$324.8m and NPI growth is expected to
slow down to 0.7% YoY, which is in line with A-REIT's revenue growth.

Page 17 24 November 2009
Ascendas REIT
Exhibit 17: DPU forecasts and yields
Source: Company, OIR estimates
12.9012.86
15.18
14.13
8.21
6.976.95
7.64
10.00
11.00
12.00
13.00
14.00
15.00
16.00
FY2007/08 FY2008/09 FY2009/10F FY2010/11F
in S-cents
5.00
5.50
6.00
6.50
7.00
7.50
8.00
8.50
in %
DPU (LHS) Yield (RHS)
Exhibit 16: NPI forecasts
Source: Company, OIR estimates
324.8322.5
296.6
243.5
200
220
240
260
280
300
320
340
FY2007/08 FY2008/09 FY2009/10F FY2010/11F
in S$m
Higher
rev enue,
Property
tax rebate
and lower
utilities
charges
Higher
rev enue
DPU to fall due to placement dilution. We expect A-REIT to deliver
DPU of 12.86 S-cents for FY09/10. This is 15.3% lower than FY08/09 DPU
and is attributable to the dilution impact from the two placement exercises
in 2009. Putting aside the dilution impact, we expect A-REIT's distributable
income to grow by 14% YoY in FY09/10. For FY10/11, we expect DPU to
remain steady and turn in marginal growth of 0.3% YoY to 12.9 S-cents.
These translate to DPU yields of 6.84% and 6.86% for FY09/10 and FY10/
11, respectively.

Page 18 24 November 2009
Ascendas REIT
Source: Bloomberg, OIR
Section F: Peers Comparison
Exhibit 18: Comparables Table
Bloomberg
TickerLast Price
OIR/ Cons
FY09 DPU
(in S$)
OIR/ Cons
FY10 DPU
(in S$)
FY09
Yield
(%)
FY10
Yield
(%)
Gearing
ratio (%)
Bk value
per share
(in S$)
Price-to-
book (x)
Office
Frasers Commercial Trust FCOT SP 0.145 SGD 439.9 0.015 0.011 10.3 7.6 38.9 0.27 0.54
CapitaCommercial Trust* CCT SP 1.110 SGD 3,123.4 0.067 0.064 6.0 5.8 30.9 1.51 0.73
K-REIT Asia KREIT SP 0.995 SGD 1,329.3 0.078 0.070 7.8 7.0 9.1 1.48 0.67
Suntec REIT* SUN SP 1.280 SGD 2,091.9 0.113 0.091 8.8 7.1 34.3 1.97 0.65
Office Average 8.3 6.9 28.3 1.31 0.65
Retail
CapitaMall Trust* CT SP 1.730 SGD 5,500.1 0.090 0.093 5.2 5.4 29.5 1.57 1.10
Frasers Centerpoint Trust* FCT SP 1.200 SGD 751.9 0.081 0.081 6.8 6.8 29.9 1.22 0.98
Starhill Global REIT SGREIT SP 0.530 SGD 1,024.2 0.054 0.039 10.2 7.4 27.1 0.81 0.65
Retail Average 7.4 6.5 28.8 1.20 0.91
Healthcare
Parkway Life REIT PREIT SP 1.190 SGD 718.4 0.076 0.083 6.4 7.0 28.7 1.34 0.89
Healthcare Average 6.4 7.0 28.7 1.34 0.89
Hospitality
Ascott Residence Trust* ART SP 1.050 SGD 646.3 0.074 0.072 7.0 6.9 39.7 1.32 0.79
CDL Hospitality REIT CDREIT SP 1.480 SGD 1,238.1 0.078 0.091 5.3 6.1 20.2 1.41 1.05
Hospitality Average 6.2 6.5 29.9 1.36 0.92
Industrial
Ascendas REIT* AREIT SP 1.880 SGD 3,515.5 0.129 0.129 6.8 6.9 30.5 1.60 1.18
Cambridge Industrial Trust CREIT SP 0.415 SGD 360.0 0.052 0.050 12.5 12.0 40.7 0.60 0.69
Macarthurcook Industrial REIT MIREIT SP 0.350 SGD 93.2 0.049 0.019 14.0 5.4 44.6 0.94 0.37
Mapletree Logistics Trust* MLT SP 0.700 SGD 1,438.0 0.059 0.055 8.4 7.9 38.7 0.88 0.80
Industrial Average 10.4 8.0 38.6 1.00 0.76
Overseas
Ascendas India Trust AIT SP 0.860 SGD 654.8 0.068 0.073 7.9 8.5 10.9 0.84 1.02
CapitaRetail China Trust CRCT SP 1.150 SGD 716.3 0.082 0.085 7.1 7.4 33.5 1.12 1.03
First REIT FIRT SP 0.755 SGD 208.0 NA NA NA NA 14.8 0.93 0.81
Fortune REIT (in HK$) FRT SP 2.850 HKD 4,727.5 0.315 0.293 11.1 10.3 25.7 4.88 0.58
Lippo-Mapletree Indonesia* LMRT SP 0.470 SGD 506.5 0.050 0.052 10.6 11.1 11.1 0.74 0.63
Saizen REIT SZREIT SP 0.150 SGD 142.9 NA NA NA NA 44.4 0.41 0.37
Overseas Average 9.2 9.3 23.4 1.49 0.74
S-REITs Average 8.5 7.6 29.2 1.29 0.78
* DPU and Yields are based on OIR forecast
Updated as at 23rd Nov 09
Market Cap (in
S$m)

Page 19 24 November 2009
Ascendas REIT
Highest Price/Book valuation within S-REITs universe. A-REIT is
currently trading at Price/Book of 1.18x and this is the highest within the
S-REITs universe. On average, S-REITs are trading at an average Price/
Book of 0.78x. Industrial REITs are trading at Price/Book of 0.76x and its
closest peer (base on sector and market cap), Mapletree Logistics Trust,
is currently priced at Price/Book of 0.8x. Among the large-cap S-REITs,
peers such as CapitaMall Trust, CapitaCommercial Trust and Suntec REIT
are trading at Price/Book of 1.1x, 0.73x and 0.65x, respectively.
Lowest gearing among industrial peers. A-REIT has gearing ratio of
30.5% as at the end of September and this is the lowest among other
REITs in the industry property market. As a whole, industrial REITs have
an average gearing level of 38.6%, which is higher than the 29.2% gearing
level of the S-REITs universe.

Page 20 24 November 2009
Ascendas REIT
Section G: Valuation
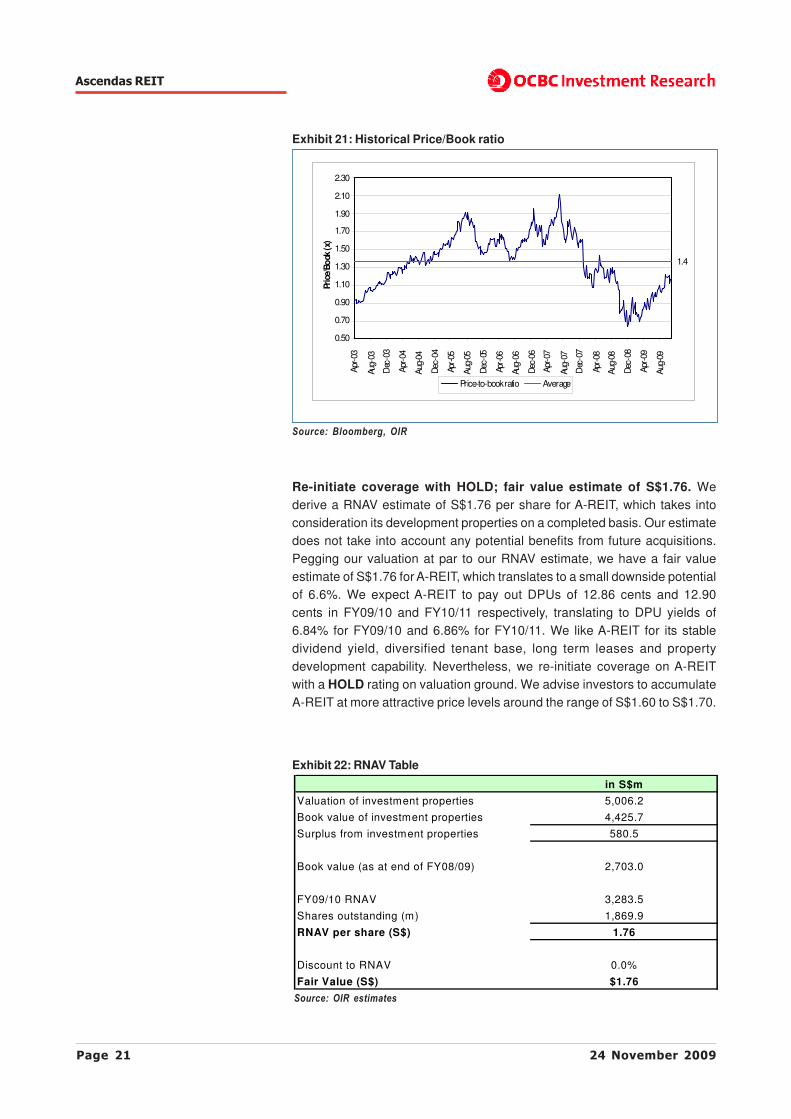
Valuation back to normalize range. Since bottoming in March, A-REIT's
share price had recovered from the low of S$1.05 (after adjusting for
placement dilution) and gained 79% to close at S$1.88 (yesterday's closing).
Despite the surge in share price, valuation has not reached a demanding
level yet. The current valuation of A-REIT is still within the normalized
historical valuation range. Several key valuation matrices such as yield
spread over SGS 10-yr bond yield, forward DPU yield and Price/Book ratio
are now close to the historical average (refer to Exhibits 19 to 21).
Exhibit 19: Historical DPU yield vs SGS 10-yr bond yield
Source: Bloomberg, OIR
0.00
2.00
4.00
6.00
8.00
10.00
12.00
14.00
16.00
Apr-
03
Aug-0
3
De
c-0
3
Ap
r-0
4
Aug-0
4
De
c-0
4
Ap
r-05
Aug-
05
Dec-0
5
Ap
r-0
6
Aug-0
6
De
c-0
6
Ap
r-07
Aug-0
7
Dec-0
7
Apr-
08
Aug-0
8
De
c-0
8
Ap
r-0
9
Aug-0
9
in %
A-REIT's DPU yield SGS 10yr bond yield
Exhibit 20: Historical yield spread
Source: Bloomberg, OIR
3.8
0.00
2.00
4.00
6.00
8.00
10.00
12.00
14.00
Apr-
03
Aug-
03
Dec
-03
Apr
-04
Aug
-04
Dec
-04
Apr
-05
Aug
-05
Dec
-05
Apr
-06
Aug
-06
Dec
-06
Apr-
07
Aug-
07
Dec
-07
Apr-
08
Aug-
08
Dec
-08
Apr
-09
Aug
-09
in %
Yield spread Average
Page 21 24 November 2009
Ascendas REIT
Exhibit 21: Historical Price/Book ratio
Source: Bloomberg, OIR
1.4
0.50
0.70
0.90
1.10
1.30
1.50
1.70
1.90
2.10
2.30
Apr
-03
Aug-
03
Dec
-03
Apr
-04
Aug
-04
Dec
-04
Apr-
05
Aug
-05
Dec
-05
Apr-
06
Aug-
06
Dec
-06
Apr
-07
Aug-
07
Dec
-07
Apr-
08
Aug
-08
Dec
-08
Apr
-09
Aug
-09
Pric
e/Bo
ok (x)
Price-to-book ratio Average
Re-initiate coverage with HOLD; fair value estimate of S$1.76. We
derive a RNAV estimate of S$1.76 per share for A-REIT, which takes into
consideration its development properties on a completed basis. Our estimate
does not take into account any potential benefits from future acquisitions.
Pegging our valuation at par to our RNAV estimate, we have a fair value
estimate of S$1.76 for A-REIT, which translates to a small downside potential
of 6.6%. We expect A-REIT to pay out DPUs of 12.86 cents and 12.90
cents in FY09/10 and FY10/11 respectively, translating to DPU yields of
6.84% for FY09/10 and 6.86% for FY10/11. We like A-REIT for its stable
dividend yield, diversified tenant base, long term leases and property
development capability. Nevertheless, we re-initiate coverage on A-REIT
with a HOLD rating on valuation ground. We advise investors to accumulate
A-REIT at more attractive price levels around the range of S$1.60 to S$1.70.
Exhibit 22: RNAV Table
Source: OIR estimates
in S$m
Valuation of investment properties 5,006.2
Book value of investment properties 4,425.7
Surplus from investment properties 580.5
Book value (as at end of FY08/09) 2,703.0
FY09/10 RNAV 3,283.5
Shares outstanding (m) 1,869.9
RNAV per share (S$) 1.76
Discount to RNAV 0.0%
Fair Value (S$) $1.76

Page 22 24 November 2009
Ascendas REIT
Exhibit 23: Key valuation assumptions
Source: OIR estimates
Risk-free rate 2.40%
Beta 1
Market risk premium 6.50%
Cost of debt 4.20%
Cap rate 6.16%
Terminal growth rate 3.00%

Page 23 24 November 2009
Ascendas REIT
Section H: Risk Factors
Some of the key risk factors in investing in A-REIT include:
1) Highly exposed to the economic conditions and government policy
in Singapore. A-REIT's property assets are all located in Singapore and
its performance is highly reliant on the economic conditions and government
policy in Singapore. In the event where Singapore's economy deteriorates,
vacancy rates and rents could be adversely affected. In addition, any
unfavorable change in government policy towards businesses could also
affect foreign investments and reduce the demand for industrial space in
Singapore.
2) Competition in a highly fragmented industrial property market.
The industry property market in Singapore is highly fragmented and
competition among industrial landlords for tenants could depress the rents
in the industrial property market and thus adversely affect A-REIT's financial
performance.
3) Potential conflict of interests between A-REIT and the Ascendas
Group. The Ascendas Group holds a deemed interest of 20.66% in A-REIT
and the manager and the property manager of A-REIT are 100% directly
owned by the Ascendas Group. The Ascendas Group is involved in a similar
scope of business as A-REIT which includes investing, acquiring, developing
and managing of industrial properties in Singapore. A-REIT may have to
compete with the Ascendas Group for tenants in the Singapore market.

Page 24 24 November 2009
Ascendas REIT
Appendix 1: Background on A-REIT
A-REIT, Singapore's first and largest business space and industrial REIT,
was listed on 19 November 2002 with a portfolio of 8 properties worth S$545
million. It has since increased its properties to 90 with a book value of
about S$4.7 billion.
It owns a diversified property portfolio in Singapore comprising business
and science parks, hi-tech industrial properties, light industrial properties,
logistics and distribution centres as well as warehouse retail facilities. These
properties house a tenant base of over 900 international and local companies
from a wide range of industries and activities, including research and
development, life sciences, information technology, electronics, engineering,
light manufacturing, telecommunications, logistics service providers,
manufacturing services and back-room office support in service industries.
A-REIT is listed in several indices including the Morgan Stanley Capital
International, Inc (MSCI) Index, the European Public Real Estate Association
/ National Association of Real Estate Investment Trusts (EPRA/NAREIT)
Global Real Estate Index and Global Property Research (GPR) Asia 250. A
corporate family credit rating of "Baa1" was assigned to A-REIT by Moody's
Investors Service.
A-REIT's objective is to achieve income stability and long-term growth in
the portfolio. Potential growth in the existing portfolio would be through a
proactive approach to fund and asset management, and acquisition of
strategically located premium properties to deliver consistent returns to
unitholders.

Page 25 24 November 2009
Ascendas REIT
Source: Company
Appendix 2: Trust Structure

Page 26 24 November 2009
Ascendas REIT
Appendix 3: Asset Portfolio Summary
Source: Company

Page 27 24 November 2009
Ascendas REIT
Ascendas Real Estate Investment Trust's Key Financial Data
EARNINGS FORECAST
Year Ended 31 Mar (S$m) FY08 FY09 FY010F FY11F
Gross revenue 322.3 396.5 413.4 416.4
Property service fees -9.7 -12.1 -12.4 -12.5
Property tax -18.8 -26.4 -24.8 -24.4
Other property operating expenses -50.3 -61.4 -53.7 -54.7
Property operating expenses -78.8 -99.9 -91.0 -91.6
Net property income 243.5 296.6 322.5 324.8
Interest income 0.1 0.0 0.0 0.0
Manager's fee -17.2 -22.6 -23.5 -23.6
Performance fee -8.4 -9.1 -4.7 -4.7
Trust expenses -2.5 -4.7 -3.7 -3.7
Borrowing costs -40.5 -59.5 -60.7 -62.2
Non property expenses -68.5 -95.9 -92.6 -94.3
Net income 175.0 200.7 229.9 230.5
Net change on revaluation of investment properties 494.1 -115.4 0.0 0.0
Total return for the period 669.1 85.3 229.9 230.5
Non-tax deductible expenses 12.3 10.2 10.5 10.7
Net change on revaluation of investment properties -494.1 115.4 0.0 0.0
Income available for distribution 187.3 210.9 240.4 241.1
DPU (S cents) 14.1 15.2 12.9 12.9
Page 28 24 November 2009
Ascendas REIT
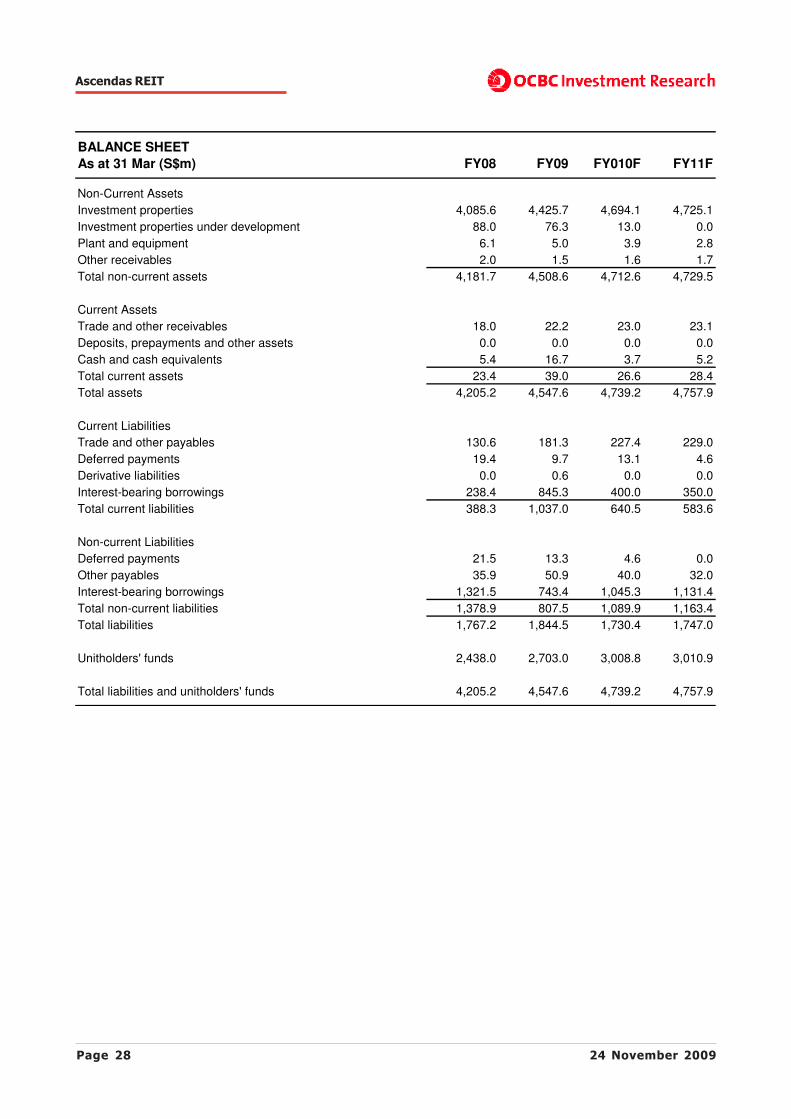
BALANCE SHEET
As at 31 Mar (S$m) FY08 FY09 FY010F FY11F
Non-Current Assets
Investment properties 4,085.6 4,425.7 4,694.1 4,725.1
Investment properties under development 88.0 76.3 13.0 0.0
Plant and equipment 6.1 5.0 3.9 2.8
Other receivables 2.0 1.5 1.6 1.7
Total non-current assets 4,181.7 4,508.6 4,712.6 4,729.5
Current Assets
Trade and other receivables 18.0 22.2 23.0 23.1
Deposits, prepayments and other assets 0.0 0.0 0.0 0.0
Cash and cash equivalents 5.4 16.7 3.7 5.2
Total current assets 23.4 39.0 26.6 28.4
Total assets 4,205.2 4,547.6 4,739.2 4,757.9
Current Liabilities
Trade and other payables 130.6 181.3 227.4 229.0
Deferred payments 19.4 9.7 13.1 4.6
Derivative liabilities 0.0 0.6 0.0 0.0
Interest-bearing borrowings 238.4 845.3 400.0 350.0
Total current liabilities 388.3 1,037.0 640.5 583.6
Non-current Liabilities
Deferred payments 21.5 13.3 4.6 0.0
Other payables 35.9 50.9 40.0 32.0
Interest-bearing borrowings 1,321.5 743.4 1,045.3 1,131.4
Total non-current liabilities 1,378.9 807.5 1,089.9 1,163.4
Total liabilities 1,767.2 1,844.5 1,730.4 1,747.0
Unitholders' funds 2,438.0 2,703.0 3,008.8 3,010.9
Total liabilities and unitholders' funds 4,205.2 4,547.6 4,739.2 4,757.9
Page 29 24 November 2009
Ascendas REIT
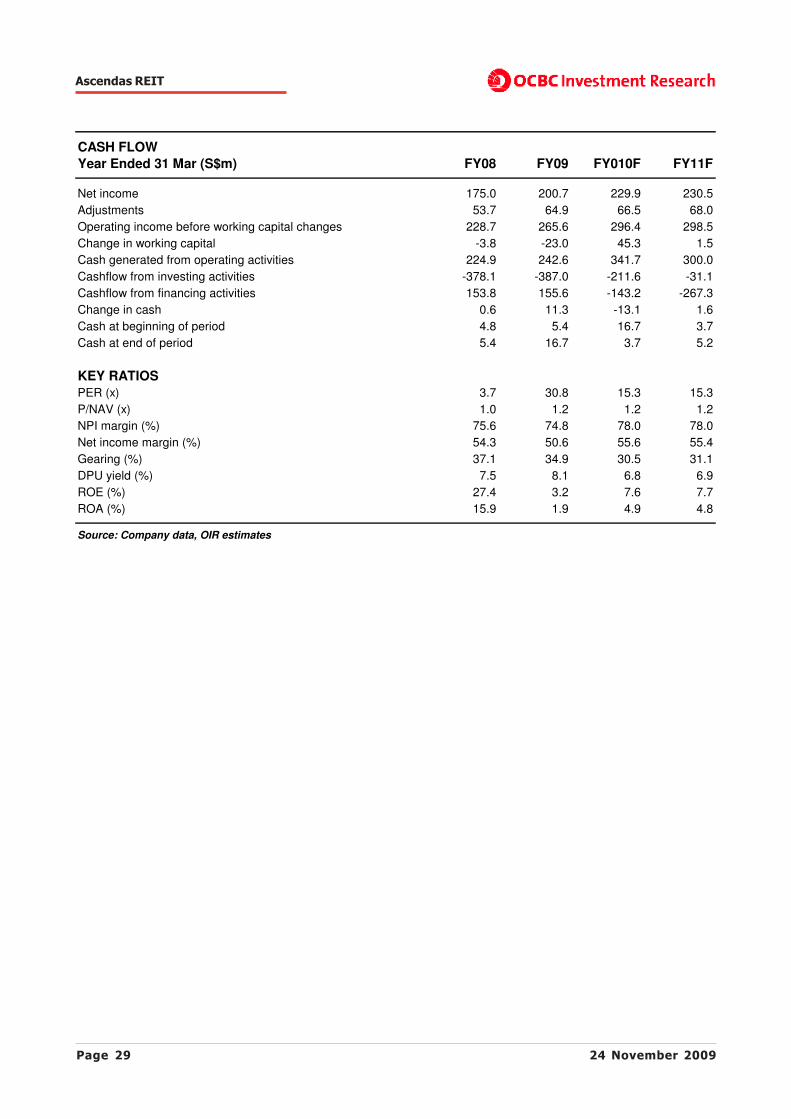
CASH FLOW
Year Ended 31 Mar (S$m) FY08 FY09 FY010F FY11F
Net income 175.0 200.7 229.9 230.5
Adjustments 53.7 64.9 66.5 68.0
Operating income before working capital changes 228.7 265.6 296.4 298.5
Change in working capital -3.8 -23.0 45.3 1.5
Cash generated from operating activities 224.9 242.6 341.7 300.0
Cashflow from investing activities -378.1 -387.0 -211.6 -31.1
Cashflow from financing activities 153.8 155.6 -143.2 -267.3
Change in cash 0.6 11.3 -13.1 1.6
Cash at beginning of period 4.8 5.4 16.7 3.7
Cash at end of period 5.4 16.7 3.7 5.2
KEY RATIOS
PER (x) 3.7 30.8 15.3 15.3
P/NAV (x) 1.0 1.2 1.2 1.2
NPI margin (%) 75.6 74.8 78.0 78.0
Net income margin (%) 54.3 50.6 55.6 55.4
Gearing (%) 37.1 34.9 30.5 31.1
DPU yield (%) 7.5 8.1 6.8 6.9
ROE (%) 27.4 3.2 7.6 7.7
ROA (%) 15.9 1.9 4.9 4.8
Source: Company data, OIR estimates

Page 30 24 November 2009
Ascendas REIT
SHAREHOLDING DECLARATION:The analyst/analysts who wrote this report holds NIL shares in the above security.
RATINGS AND RECOMMENDATIONS:OCBC Investment Research’s (OIR) technical comments and recommendations are short-term and tradingoriented.- However, OIR’s fundamental views and ratings (Buy, Hold, Sell) are medium-term calls within a 12-monthinvestment horizon. OIR’s Buy = More than 10% upside from the current price; Hold = Trade within +/-10%from the current price; Sell = More than 10% downside from the current price.- For companies with less than S$150m market capitalization, OIR’s Buy = More than 30% upside from thecurrent price; Hold = Trade within +/- 30% from the current price; Sell = More than 30% downside from thecurrent price.
DISCLAIMER FOR RESEARCH REPORTThis report is solely for information and general circulation only and may not be published, circulated,reproduced or distributed in whole or in part to any other person without our written consent. This reportshould not be construed as an offer or solicitation for the subscription, purchase or sale of the securitiesmentioned herein. Whilst we have taken all reasonable care to ensure that the information contained in thispublication is not untrue or misleading at the time of publication, we cannot guarantee its accuracy orcompleteness, and you should not act on it without first independently verifying its contents. Any opinion orestimate contained in this report is subject to change without notice. We have not given any considerationto and we have not made any investigation of the investment objectives, financial situation or particularneeds of the recipient or any class of persons, and accordingly, no warranty whatsoever is given and noliability whatsoever is accepted for any loss arising whether directly or indirectly as a result of the recipientor any class of persons acting on such information or opinion or estimate. You may wish to seek advicefrom a financial adviser regarding the suitability of the securities mentioned herein, taking into considerationyour investment objectives, financial situation or particular needs, before making a commitment to invest inthe securities. OCBC Investment Research Pte Ltd, OCBC Securities Pte Ltd and their respective connectedand associated corporations together with their respective directors and officers may have or take positionsin the securities mentioned in this report and may also perform or seek to perform broking and otherinvestment or securities related services for the corporations whose securities are mentioned in this reportas well as other parties generally.
Privileged/Confidential information may be contained in this message. If you are not the addressee indicatedin this message (or responsible for delivery of this message to such person), you may not copy or deliverthis message to anyone. Opinions, conclusions and other information in this message that do not relate tothe official business of my company shall not be understood as neither given nor endorsed by it.
Co.Reg.no.: 198301152E For OCBC Investment Research Pte Ltd
Carmen LeeHead of ResearchPublished by OCBC Investment Research Pte Ltd