ABOUT ASCENDAS INDIA TRUST -...
26
a-iTrust Announcement of Results for the Third Financial Quarter Ended 31 December 2009 1 ABOUT ASCENDAS INDIA TRUST Ascendas India Trust (“a-iTrust” ) is a Singapore-listed Business Trust (“BT”) established with the principal objective of owning income-producing real estate used primarily as business space in India. a-iTrust may also acquire, own and develop land or uncompleted developments to be used primarily as business space with the objective of holding the properties upon completion. Although a-iTrust is a BT, it has adopted certain characteristics of a Real Estate Investment Trust (“REIT”) to enhance the stability of its distributions to Unitholders. a-iTrust was originally constituted as a private trust on 7 December 2004. On 1 August 2007, a-iTrust became the first Indian Property Trust to be listed on the main board of Singapore Exchange Securities Trading Limited (“SGX-ST”). a-iTrust has a market capitalisation of about S$ 1 0.7 billion as at 31 December 2009, and a broad base of investors, including some of the world‟s leading institutional investors. As at 31 December 2009, a-iTrust has a diversified portfolio of four IT Parks (“Properties”) across the primary IT centres of India, comprising : 1. International Tech Park, Bangalore (“ITPB”); 2. International Tech Park, Chennai (“ITPC”); 3. The V, Hyderabad (“The V”); and 4. CyberPearl, Hyderabad (“CyberPearl”). a-iTrust is managed by Ascendas Property Fund Trustee Pte Ltd (“the Trustee-Manager”), part of the Ascendas group, which manages a portfolio of more than 42 million sq ft of business space across Asia. EXECUTIVE SUMMARY Total property income for the quarter ended 31 December 2009 at S$ 29.9 million was 4% higher than the corresponding quarter last year. Net property income rose by 13% to S$ 19.3 million. Distributable income was S$ 14.1 million, and distribution per unit (“DPU”) 1.85 Singapore cents, which was 8% lower than the corresponding quarter last year. The DPU for the nine months ended 31 December 2009 of 5.76 cents was 5% higher than the same period last year. The DPU represents an annualised yield of 7.8% over the closing price of S$ 0.98 per unit on 31 December 2009 and 7.4% over the price of $1.03 per unit on 22 January 2010. The portfolio average occupancy was 97%. High occupancy levels were sustained, as the trust‟s properties continued to attract and retain high quality tenants, including leading multinational corporations that have stood up well against the economic difficulties. Property expenses declined by 10% to S$ 10.6 million, as a result of the lower cost of utilities and the cost control measures put in place. Hence, net property income grew 13% to S$ 19.3 million. While operating profits registered robust growth, net financing costs increased, and losses were incurred on forward foreign exchange contracts 2 (as INR 3 at settlement of the contracts was stronger than the contracted forward rates), resulting in distributable income being S$ 14.1 million, which is S$ 1.2 million or 8% lower. 1 S$ or SGD means Singapore Dollar. 2 Forward foreign exchange contracts are entered into hedge INR repatriation to Singapore. Gains or losses are realised during settlement of the contracts, when the actual currency rate is different from the contracted forward rates. 3 INR or Rs means Indian Rupee.
Transcript of ABOUT ASCENDAS INDIA TRUST -...

a-iTrust Announcement of Results for the Third Financial Quarter Ended 31 December 2009
1
ABOUT ASCENDAS INDIA TRUST
Ascendas India Trust (“a-iTrust” ) is a Singapore-listed Business Trust (“BT”) established with the principal
objective of owning income-producing real estate used primarily as business space in India. a-iTrust may
also acquire, own and develop land or uncompleted developments to be used primarily as business space
with the objective of holding the properties upon completion. Although a-iTrust is a BT, it has adopted
certain characteristics of a Real Estate Investment Trust (“REIT”) to enhance the stability of its distributions
to Unitholders.
a-iTrust was originally constituted as a private trust on 7 December 2004.
On 1 August 2007, a-iTrust became the first Indian Property Trust to be listed on the main board of
Singapore Exchange Securities Trading Limited (“SGX-ST”). a-iTrust has a market capitalisation of about
S$1 0.7 billion as at 31 December 2009, and a broad base of investors, including some of the world‟s
leading institutional investors.
As at 31 December 2009, a-iTrust has a diversified portfolio of four IT Parks (“Properties”) across the
primary IT centres of India, comprising :
1. International Tech Park, Bangalore (“ITPB”);
2. International Tech Park, Chennai (“ITPC”);
3. The V, Hyderabad (“The V”); and
4. CyberPearl, Hyderabad (“CyberPearl”).
a-iTrust is managed by Ascendas Property Fund Trustee Pte Ltd (“the Trustee-Manager”), part of the
Ascendas group, which manages a portfolio of more than 42 million sq ft of business space across Asia.
EXECUTIVE SUMMARY
Total property income for the quarter ended 31 December 2009 at S$ 29.9 million was 4% higher than the
corresponding quarter last year. Net property income rose by 13% to S$ 19.3 million.
Distributable income was S$ 14.1 million, and distribution per unit (“DPU”) 1.85 Singapore cents, which was
8% lower than the corresponding quarter last year. The DPU for the nine months ended 31 December 2009
of 5.76 cents was 5% higher than the same period last year. The DPU represents an annualised yield of
7.8% over the closing price of S$ 0.98 per unit on 31 December 2009 and 7.4% over the price of $1.03 per
unit on 22 January 2010.
The portfolio average occupancy was 97%. High occupancy levels were sustained, as the trust‟s properties
continued to attract and retain high quality tenants, including leading multinational corporations that have
stood up well against the economic difficulties. Property expenses declined by 10% to S$ 10.6 million, as a
result of the lower cost of utilities and the cost control measures put in place. Hence, net property income
grew 13% to S$ 19.3 million. While operating profits registered robust growth, net financing costs
increased, and losses were incurred on forward foreign exchange contracts2 (as INR
3 at settlement of the
contracts was stronger than the contracted forward rates), resulting in distributable income being S$ 14.1
million, which is S$ 1.2 million or 8% lower.
1 S$ or SGD means Singapore Dollar.
2 Forward foreign exchange contracts are entered into hedge INR repatriation to Singapore. Gains or losses are realised during
settlement of the contracts, when the actual currency rate is different from the contracted forward rates. 3 INR or Rs means Indian Rupee.

a-iTrust Announcement of Results for the Third Financial Quarter Ended 31 December 2009
2
During the current financial year to date, leases for about 462,500 sq ft of space expired, out of which 79%
was renewed. Over the balance of the financial year, leases for less than 4% of space are due for renewal.
The largest tenant accounted for about 4.6%, and the top ten tenants accounted for about 30%, of the
portfolio base rent as at 31 December 2009.
Gearing was 18.7% as at 31 December 2009, compared with 9% as at 31 March 2009. The increase was
due to the additional borrowings taken to fund development projects. The trust has further borrowing
capacity of S$ 140 million or S$ 350 million, before gearing reaches 35% or 60% (loan to value)
respectively4.
Net Asset Value (“NAV”) per unit as at 31 December 2009 was S$ 0.85.
The Trustee-Manager will continue to focus on growing the operating earnings of its assets, optimising its
capital structure, and growing the portfolio through its in-built development pipeline and acquisition.
4 a-iTrust has voluntarily adopted, and incorporated in its Trust Deed, the gearing limit of 35%, or 60% if a credit rating or Unitholders‟
approval is obtained.
Geographical Diversification of Operating Buildings
(as at 31 Dec 09)
IT63.3%
R&D5.3%
F&B1.0%
Others3.3%
ITES15.4%
IT/ITES11.6%
Tenant Sectors by Base Rent(As at 31 Dec 2009)
ITPB ITPC The V CyberPearl Portfolio
98% 96%
94%
100%97%
1%
Occupancy Rate(as at 31 Dec 09)
95%
-
500,000
1,000,000
1,500,000
2,000,000
FY 2010 FY 2011 FY 2012 FY 2013 FY 2014 FY 2015 &
Beyond
Portfolio Lease Expiry Profile(as at 31 Dec 09)
Bangalore
37.5%
Hyderabad
35.5%
Chennai 27.0%
IT – Information Technology ITES – IT Enabled Services F&B – Food and Beverage R&D – Research and Development
3.4%
34.7%
24.5% 21.3%
7.3% 8.8%
*Committed area
a-iTrust Announcement of Results for the Third Financial Quarter Ended 31 December 2009
3
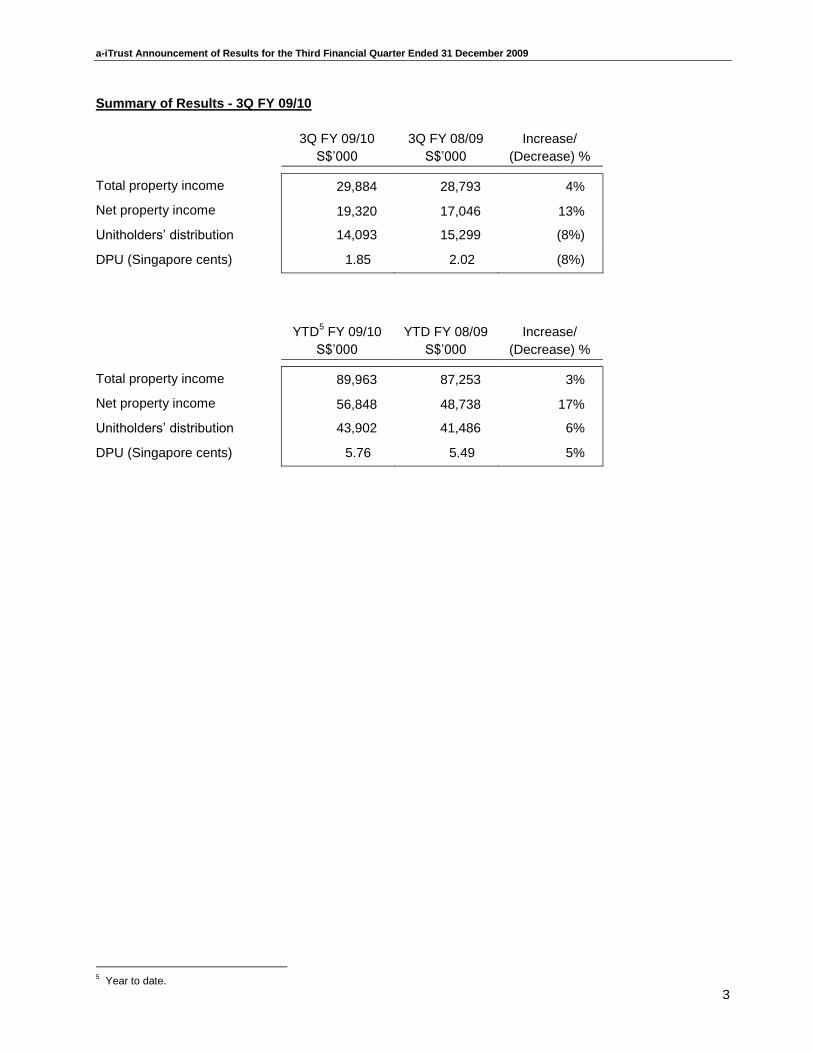
Summary of Results - 3Q FY 09/10
3Q FY 09/10
S$‟000
3Q FY 08/09
S$‟000
Increase/
(Decrease) %
Total property income 29,884 28,793 4%
Net property income 19,320 17,046 13%
Unitholders‟ distribution 14,093 15,299 (8%)
DPU (Singapore cents) 1.85 2.02 (8%)
YTD
5 FY 09/10
S$‟000
YTD FY 08/09
S$‟000
Increase/
(Decrease) %
Total property income 89,963 87,253 3%
Net property income 56,848 48,738 17%
Unitholders‟ distribution 43,902 41,486 6%
DPU (Singapore cents) 5.76 5.49 5%
5 Year to date.

a-iTrust Announcement of Results for the Third Financial Quarter Ended 31 December 2009
4
FINANCIAL REVIEW OF A-ITRUST FOR THE THIRD QUARTER ENDED 31 DECEMBER 2010
1(a)(i) Consolidated Income Statement (3Q FY 09/10 vs 3Q FY 08/09)
3Q FY09/10 3Q FY08/09 Increase/
S$‟000 S$‟000 (Decrease)
Property Income Gross rent 17,857 17,551 2%
Amenities income 604 641 (6%)
Fit-out rental income 1,050 1,153 (9%)
Operations and maintenance income 9,232 8,410 10%
Car park and other income 1,141 1,038 10%
Total property income 29,884 28,793 4%
Property Expenses Operating, maintenance and security (2,169) (2,294) (5%)
Service and property taxes (419) (302) 39%
Property management fees (1,536) (1,443) 6%
Utilities expenses (5,541) (5,786) (4%)
Other property operating expenses (899) (1,922) (53%)
Total property expenses (10,564) (11,747) (10%)
Net Property Income 19,320 17,046 13%
Trustee-Manager‟s fees (1,803) (1,765) 2%
Other trust operating expense (403) (298) 35%
(Losses)/gains on derivative financial instruments (2,927) 6,397 (146%)
Finance cost (1,328) (685) 94%
Exchange gains/(losses) 5,208 (6,002) (187%)
Interest income 528 754 (30%)
(725) (1,599) (55%)
Profit before tax 18,595 15,447 20%
Income tax expense (2,660) (3,148) (16%)
Net profit 15,935 12,299 30%
Attributable to: Unitholders of the Trust 14,922 11,458 30%
Minority interests 1,013 841 20%

a-iTrust Announcement of Results for the Third Financial Quarter Ended 31 December 2009
5
Analysis of performance (3Q FY 09/10 vs 3Q FY 08/09)
Total property income rose by 4% to S$ 29.9 million, due to 1) higher base rent resulting from
higher average rental rates, 2) higher operations and maintenance income resulting from an
increase in energy billings at ITPB where there is a dedicated power plant and an increase in
maintenance fee at ITPC, and 3) higher car park income resulting from additional income from the
new multi-level car park in ITPB. Fit-out income was lower due to the expiry of two fit-out leases.
Total property expenses was S$ 10.6 million or 10% lower due to 1) lower operating, maintenance
and security charges resulting from cost management measures, 2) lower utilities expenses as
diesel cost remained lower than a year ago, and 3) lower other operating expenses due to the
reversal of provision for doubtful debt which has been collected.
As a result, net property income was S$ 19.3 million, up 13%.
Trustee-Manager‟s fees were stable at S$1.8 million.
The losses on derivative financial instruments of S$ 2.9 million included 1) S$ 1.3 million of realised
losses and S$ 0.3 million of unrealised gains from forward foreign exchange contracts entered into
to hedge INR repatriation to Singapore, and 2) S$ 1.9 million of unrealised fair value losses from a
cross currency swap entered into to hedge ITPL‟s6 foreign currency loan into fixed INR obligation.
In comparison, the fair value gains on derivatives of S$ 6.4 million last year included 1) S$ 6.1
million of unrealised fair value gains from the cross currency interest rate swap, and 2) S$ 3.0
million of unrealised fair value losses and S$ 3.3 million of realised gains from the forward foreign
exchange contracts. Before the settlement of the contracts, derivatives are marked to market at the
end of every reporting period, and any unrealised gains or losses have no impact on the distribution
of the trust. Upon settlement, gains or losses would be realised, if there is a difference between the
contracted rates and actual rates at the time of settlement, as in the case of the forward foreign
exchange contracts. The forward foreign exchange contract settled in 3Q last year was entered into
2 years earlier at a favourable rate (INR 28.6 : SGD1). As INR depreciated, the contracted rate was
more favourable than the actual rate of INR 32.2 : SGD1 at the time of contract settlement. Hence,
gains were realised. On the other hand, the contract settled in 3Q this year was entered into a year
ago. As INR was depreciating, the forward rate at that point reflected an even weaker INR (INR
34.6 : SGD1). At the time of settlement this year, the contracted rate was less favourable than the
actual rate of INR 33.0 : SGD1, hence losses were realised.
Foreign exchange gains of S$ 5.2 million included 1) S$ 3.4 million of unrealised gains from the
restatement of the carrying value of the JPY7/INR loan
8 in India, and 2) S$ 1.7 million of unrealised
gains from the restatement of the carrying value of the SGD loan.
Finance cost was S$1.3 million or 94% higher, due to an increase in borrowings to fund
construction of 1.7 million sq ft of space and higher interest rates.
Income tax expense was S$ 2.7 million or 16% lower due to the reversal of provision for distribution
tax which was not incurred. The tax expense included deferred tax expense of S$ 1.2 million, which
had no impact on the distribution of the trust.
As a result, net profit was S$ 15.9 million or 30% higher.
6 Information Technology Park Limited, the Indian SPV holding IT Park Bangalore.
7 JPY means Japanese Yen.
8 The loan was taken in 2006, and will mature in 2011. As at 31 December 2009, the loan amount was Rs 525 million (S$ 20.8 million)
FRS 21 requires the loan to be translated at spot rates at each reporting date. However, gains or losses recognised during the term of the loan are unrealised and have no impact on the distribution of the trust. At maturity, due to the cross currency interest rate swap, the loan principal repayable would be same as the amount drawn down in INR.

a-iTrust Announcement of Results for the Third Financial Quarter Ended 31 December 2009
6
1(a)(ii) Statement of Comprehensive Income (3Q FY 09/10 vs 3Q FY 08/09)9
3Q FY09/10
S$‟000 3Q FY08/09
S$‟000
Profit for the quarter 15,935 12,299
Translation differences arising from the conversion of functional currency into presentation currency 23,349 (25,491)
Total comprehensive income/(expenses) for the period 39,284 (13,192)
Total comprehensive income/(expenses) attributable to:
Unitholders of the Trust 36,995 (12,779)
Minority interests 2,289 (413)
39,284 (13,192)
1(a)(iii) Distribution Statement (3Q FY 09/10 vs 3Q FY 08/09)
3Q FY 09/10 3Q FY 08/09 S$'000 S$'000
Net profit attributable to Unitholders of the Trust 14,922 11,458
Distribution adjustments10
(829) 3,841
Total Unitholders distribution 14,093 15,299
Distribution adjustments comprise the items below :
3Q FY 09/10 3Q FY 08/09
S$'000 S$'000
50% Trustee-Manager's base fee in units 495 530
50% Trustee-Manager's performance fee in units 386 331
Unrealised exchange (gains)/losses (4,814) 6,182
Unrealised fair value losses/(gains) on derivatives 1,462 (2,613)
Deferred taxation 1,107 625
Others11
535 (1,214)
Net effect of distribution adjustments (829) 3,841
Distributable income to Unitholders was S$ 14.1 million or 8% lower than 3Q last year. Higher net
financing costs and losses realised on forward foreign exchange contracts contributed to the
decrease in income, hence distribution. Although distributable income was lower, the operating
performance of the properties remained strong, with net property income being 13% higher than 3Q
last year.
9 This is in compliance with the new Financial Reporting Standard (FRS) 1(R). See details in note 5 on page 19.
10 Distribution adjustments, net of tax and minority interests, are made to arrive at total Unitholders distribution, which is substantially based on the cash flow generated from the operations of Venture Capital Undertakings (“VCU”, Indian investment holding companies), in accordance with the distribution policy set out in the prospectus. The adjustment items include non-cash items in the income statement which are accounted for in accordance with applicable accounting standards, in particular, FRS 39 and FRS 40. The management policies for such items, which may have an impact on distribution, are under the purview of the Trustee-Manager‟s Board and management, and which may be reviewed from time to time.
11 For 3Q FY09/10 - Includes marketing services commission amortisation adjustment of S$ 0.3 million and depreciation on plant and equipment of S$ 0.2 million. For 3Q FY08/09 - Includes marketing services commission amortisation adjustment of S$ 0.1 million and depreciation on plant and equipment of S$ 0.2 million and S$1.5 million retained to fund asset enhancement projects.

a-iTrust Announcement of Results for the Third Financial Quarter Ended 31 December 2009
7
1(a)(iv) Consolidated Income Statement (3Q FY 09/10 vs 2Q FY 09/10)
3Q FY09/10 2Q FY09/10 Increase/
S$‟000 S$'000 (Decrease)
Property Income Gross rent 17,857 17,407 3%
Amenities income 604 613 (1%)
Fit-out rental income 1,050 1,026 2%
Operations and maintenance income 9,232 10,111 (9%)
Car park and other income 1,141 1,270 (10%)
29,884 30,427 (2%)
Property Expenses Operating, maintenance and security (2,169) (2,087) 4%
Service and property taxes (419) (423) (1%)
Property management fees (1,536) (1,538) (0%)
Utilities expenses (5,541) (5,847) (5%)
Other property operating expenses (899) (1,347) (33%)
(10,564) (11,242) (6%)
Net Property Income 19,320 19,185 1%
Trustee-Manager‟s fees (1,803) (1,788) 1%
Other trust operating expense (403) (416) (3%)
Gains/(losses) on derivative financial instruments (2,927) 1,640 (278%)
Finance cost (1,328) (1,239) 7%
Exchange gains/(losses) 5,208 (2,963) (276%)
Interest income 528 420 26%
(725) (4,346) (83%)
Profit before tax 18,595 14,839 25%
Income tax expense (2,660) (5,395) (51%)
Net profit 15,935 9,444 69%
Attributable to: Unitholders of the Trust 14,922 8,731 71%
Minority interests 1,013 713 42%

a-iTrust Announcement of Results for the Third Financial Quarter Ended 31 December 2009
8
Analysis of performance (3Q FY 09/10 vs 2Q FY 09/10)
Total property income was S$ 29.9 million or 2% lower than the preceding quarter, due primarily to
lower operations and maintenance income, as a result of lower energy billing at ITPB. ITPB has a
dedicated power plant, and an energy fee is levied on tenants, calculated based on the cost of
diesel procured.
Total property expenses was S$ 10.6 million or 6% lower, due primarily to lower utilities expenses,
and lower other operating expenses arising from the reversal of provision for doubtful debt which
has been collected.
As a result, net property income was S$ 19.3 million, up 1%.
The losses on derivative financial instruments of S$ 2.9 million included 1) S$ 1.3 million of realised
losses and S$ 0.3 million of unrealised gains from forward foreign exchange contracts entered into
to hedge INR repatriation to Singapore, and 2) S$ 1.9 million of unrealised fair value losses from a
cross currency swap entered into to hedge ITPL‟s foreign currency loan into fixed INR obligation. In
comparison, there was S$ 1.6 million of unrealised fair value gains in the previous quarter. Before
the settlement of the contracts, derivatives are marked to market at the end of every reporting
period, and any unrealised gains or losses have no impact on the distribution of the trust.
Foreign exchange gains of S$ 5.2 million included 1) S$ 3.4 million of unrealised gains from the
restatement of the carrying value of the JPY/INR loan in India, and 2) S$ 1.7 million of unrealised
gains from the restatement of the carrying value of the SGD loan.
Finance cost was S$ 1.3 million or 7% higher, due to an increase in borrowings to fund
construction.
Income tax expense was S$ 2.7 million or 51% lower due to the reversal of provision for distribution
tax which was not incurred. Deferred tax expense was also lower at S$ 1.2 million, and it has no
impact on the distribution of the trust.
As a result, net profit was S$ 15.9 million or 69% higher.
1(a)(v) Distribution Statement (3Q FY 09/10 vs 2Q FY 09/10)
3Q FY 09/10 2Q FY 09/10 S$'000 S$'000
Net profit attributable to Unitholders of the Trust 14,922 8,731
Distribution adjustments (829) 5,379
Total Unitholders distribution 14,093 14,110
Distribution adjustments comprise the items below :
3Q FY 09/10 2Q FY 09/10
S$'000 S$'000
50% Trustee-Manager's base fee in units 495 490
50% Trustee-Manager's performance fee in units 386 385
Unrealised exchange (gains)/losses (4,814) 3,093
Unrealised fair value losses/(gains) on derivatives 1,462 (1,547)
Deferred taxation 1,107 1,537

a-iTrust Announcement of Results for the Third Financial Quarter Ended 31 December 2009
9
3Q FY 09/10 2Q FY 09/10
S$'000 S$'000
Provision for increase in MAT12
- 600
Others13
535 821
Net effect of distribution adjustments (829) 5,379
Distributable income to Unitholders was S$ 14.1 million and DPU was 1.85 cents, unchanged from
the previous quarter.
12
On 6 July 2009, the Finance Minister of India proposed that the MAT rate be increased from 10% to 15% with effect from 1 April 2009. The Group did not adjust the financial statements for 1Q FY09/10 in respect of the increase, as the proposal was announced after 30 June 2009, and the change was yet to be adopted by the government then. As an act of prudence, Management withheld S$ 0.6 million, which was the impact of the increase in MAT for 1Q FY09/10, from distribution. The change has been adopted by the government during 2Q FY09/10, and the additional tax expense with retrospective effect from 1 April 2009 had been recognised in the financial statements for 2Q FY09/10. Hence, the provision is reversed.
13 For 3Q FY09/10 - Includes marketing services commission amortisation adjustment of S$ 0.3 million and depreciation on plant and equipment of S$ 0.2 million. For 2Q FY09/10 - Includes marketing services commission amortisation adjustment of S$ 0.5 million and depreciation on plant and equipment of S$ 0.4 million.

a-iTrust Announcement of Results for the Third Financial Quarter Ended 31 December 2009
10
1(a)(vi) Consolidated Income Statement (YTD FY 09/10 vs YTD FY 08/09)
YTD FY09/10
YTD FY08/09 Increase/
S$‟000 S$‟000 (Decrease)
Property Income Gross rent 53,225 53,610 (1%)
Amenities income 1,818 1,886 (4%)
Fit-out rental income 3,168 3,661 (13%)
Operations and maintenance income 28,049 25,133 12%
Car park and other income 3,703 2,963 25%
Total property income 89,963 87,253 3%
Property Expenses Operating, maintenance and security (6,595) (8,238) (20%)
Service and property taxes (1,411) (992) 42%
Property management fees (4,610) (4,425) 4%
Utilities expenses (16,335) (19,902) (18%)
Other property operating expenses (4,164) (4,958) (16%)
Total property expenses (33,115) (38,515) (14%)
Net Property Income 56,848 48,738 17%
Trustee-Manager‟s fees (5,354) (5,368) (0%)
Other trust operating expense (1,271) (1,095) 16%
(Losses)/gains on derivative financial instruments (4,114) 15,260 (127%)
Finance cost (3,784) (1,954) 94%
Exchange gains/(losses) 3,070 (9,561) (132%)
Interest income 1,536 2,861 (46%)
(9,917) 143 (7035%)
Profit before tax 46,931 48,881 (4%)
Income tax expense (13,088) (7,460) 75%
Net profit 33,843 41,421 (18%)
Attributable to: Unitholders of the Trust 31,329 39,447 (21%)
Minority interests 2,514 1,974 27% 1(a)(vii) Statement of Comprehensive Income (YTD FY 09/10 vs YTD FY 08/09)
YTD FY09/10
S$‟000 YTD FY08/09
S$‟000
Profit for the period 33,843 41,421
Translation differences arising from the conversion of functional currency into presentation currency (97) (101,810)
Total comprehensive income/(expenses) for the period 33,746 (60,389)
Total comprehensive income/(expenses) attributable to:
Unitholders of the Trust 31,238 (51,207)
Minority interests 2,508 (9,182)
33,746 (60,389)

a-iTrust Announcement of Results for the Third Financial Quarter Ended 31 December 2009
11
Analysis of performance (YTD FY 09/10 vs YTD FY 08/09)
Total property income was S$ 90.0 million or 3% higher, due primarily to 1) higher operations and
maintenance income resulting from an increase in energy billings at ITPB where there is a
dedicated power plant and an increase in maintenance fee at ITPC, and 2) higher car park income
resulting from additional income from the new multi-level car park in ITPB. Gross rent and
amenities income were 4% and 1% higher in INR terms, but lower by 1% and 4% respectively
when translated to SGD terms, because of the weaker INR. Fit-out income was lower due to the
expiry of two fit-out leases.
Total property expenses was S$ 33.1 million or 14% lower due to 1) lower operating, maintenance
and security charges resulting from cost management measures, 2) lower utilities expenses as
diesel cost remained lower than a year ago, and 3) lower other operating expenses due to the
reversal of provision for doubtful debt which has been collected. Services and property taxes
increased due to higher property tax for ITPB arising from an increase in assessment value.
Net property income was S$ 56.8 million, up 17%.
The losses on fair value of derivatives of S$ 4.1 million in YTD FY 09/10 included 1) S$ 4.3 million
of unrealised losses and S$ 2.8 million of realised gains from forward foreign exchange contracts
entered into to hedge INR repatriation to Singapore, and 2) S$ 2.6 million of unrealised losses from
a cross currency swap contract entered into to hedge ITPL‟s foreign currency loan into fixed INR
obligation. In comparison, there were gains of S$ 15.3 million last year, out of which S$ 3.8 million
was realised.
Foreign exchange gains of S$ 3.1 million were primarily a result of unrealised gains from the
restatement of the carrying value of the JPY/INR loan in India.
Finance cost was S$3.8 million or 94% higher, due to an increase in borrowings to fund
development and higher interest rates.
Income tax expense was S$ 13.1 million or 75% higher due to higher taxable profits, the increase in
the rate of MAT8 from 10% to 15% and higher deferred tax expense. The deferred tax expense of
S$ 4.3 million had no impact on the distribution of the trust.
Net profit was S$ 33.8 million or 18% lower, due mainly to fair value gains on derivative instruments
of S$ 15.3 million last year (out of which there were net realised gains of S$ 3.8 million), as
opposed to fair value losses on the instruments of S$ 4.1 million this year (out of which there were
net realised gains of S$ 2.8 million).
1(a)(viii)Distribution Statement (YTD FY 09/10 vs YTD FY 08/09)
YTD FY 09/10 YTD FY 08/09 S$'000 S$'000
Net profit attributable to Unitholders of the Trust 31,329 39,447
Distribution adjustments 12,573 2,039
Total Unitholders distribution 43,902 41,486

a-iTrust Announcement of Results for the Third Financial Quarter Ended 31 December 2009
12
Distribution adjustments comprise the items below :
YTD FY 09/10 YTD FY 08/09
S$'000 S$'000
50% Trustee-Manager's base fee in units 1,480 1,652
50% Trustee-Manager's performance fee in units 1,137 967
Unrealised foreign exchange (gains)/losses (2,869) 9,293
Unrealised fair value losses/(gains) on derivatives 6,724 (10,834)
Deferred taxation 3,954 1,929
Others14
2,147 (968)
Net effect of distribution adjustments 12,573 2,039
Distributable income to Unitholders was S$ 43.9 million or 6% higher, and DPU was 5.76
Singapore cents, representing an increase of 5% from 5.49 Singapore cents for the same period
last year.
14
For YTD FY09/10 - Includes marketing services commission amortisation adjustment of S$ 1.2 million and depreciation on plant and equipment of S$ 1.1 million. For YTD FY08/09 - Includes marketing services commission amortisation adjustment of S$ 0.04 million and depreciation on plant and equipment of S$ 0.6 million and S$1.5 million retained to fund asset enhancement projects.

a-iTrust Announcement of Results for the Third Financial Quarter Ended 31 December 2009
13
1(b)(i) Consolidated Statement of Financial Position (Group)15
31 Dec 2009 31 Mar 2009
ASSETS
Current assets
Cash and cash equivalents 82,351 59,662
Inventories 1,112 1,120
Other assets 2,471 947
Trade and other receivables 17,248 17,925
Derivative financial instruments 5,065 14,800
Current income tax recoverable 18,320 16,485
Total current assets 126,567 110,939
Non-current assets
Other assets 6,239 7,216
Equipment 1,767 2,502
Investment properties under construction 121,866 103,534
Investment properties 793,598 763,271
Goodwill 22,962 22,962
Finance lease receivables 843 1,370
Deferred income tax assets 13,618 16,723
Total non-current assets 960,893 917,578
Total assets 1,087,460 1,028,517
LIABILITIES
Current liabilities
Trade and other payables 44,546 44,057
Borrowings 67,420 7,341
Derivative financial instruments 143 3,323
Total current liabilities 112,109 54,721
Non-current liabilities
Trade and other payables 40,124 41,605
Borrowings 97,853 72,024
Deferred income tax liabilities 150,740 149,479
Total non-current liabilities 288,717 263,108
Total liabilities 400,826 317,829
NET ASSETS 686,634 710,688
UNITHOLDERS‟ FUNDS
Units on issue 590,101 587,298
Foreign currency translation reserves (155,698) (155,607)
Other reserves 16,654 4,865
Revenue reserves 196,309 237,372
Net assets attributable to unitholders 647,366 673,928
Minority interests 39,268 36,760
686,634 710,688
15
Ascendas India Trust and its subsidiaries together referred to as the “Group”

a-iTrust Announcement of Results for the Third Financial Quarter Ended 31 December 2009
14
Notes:
Increase in cash was due to cash generated from operations and inflow from borrowings, offset
by distributions in May 2009 and November 2009 and payment of construction cost.
Increase in investment properties under construction reflected the construction cost
paid/accrued to-date of S$ 44.7 million, less the transfer of the cost of multi-level car park to
investment properties upon its completion in September 09 (S$ 24.8 million).
Increase in investment properties was due mainly to 1) capitalisation of multi-level car park
upon completion in September 09 of S$ 24.8 million, 2) tenant fit-out of S$ 1.8 million, and 3)
purchase of diesel generators, dedicated power plants parts and explosive/remote substance
detector of S$ 2.0 million at ITPB.
Increase in borrowings was due to additional debt to finance the construction of Zenith in ITPC,
Park Square (retail mall) and multi-tenanted building in ITPB. These included S$ 35 million
drawn down from the INR loan facilities and S$ 60 million received from the issuance of
Medium Term Notes; offset by the repayment of S$ 5.2 million of borrowings in India.
Movement in derivative financial instruments (assets and liabilities) relates to fair value change
on re-measurement of cross currency swap and forward foreign exchange contracts.
Increase in other reserves was due to profit being statutorily transferred to the dividend
distribution reserves of the Indian subsidiary companies under Indian regulatory provisions.
These are not available for dividend distribution.

a-iTrust Announcement of Results for the Third Financial Quarter Ended 31 December 2009
15
1(b)(ii) Gross Borrowings (Group)
1(b)(iii) Statement of Financial Position (a-iTrust)
31 Dec 2009 31 Mar 2009
S$‟000 S$‟000
ASSETS
Current assets
Cash and cash equivalents 56,816 12,006
Other assets 382 813
Trade and other receivables 118 538
Loan to a subsidiary company 465,414 516,671
Total current assets 522,730 530,028
Non-current assets
Investment in subsidiary company 15,450 15,450
Total non-current assets 15,450 15,450
Total assets 538,180 545,478
LIABILITIES
Current liabilities
Trade and other payables 4,508 4,222
Borrowings 50,000 -
Derivative financial instruments 143 3,323
Total current liabilities 54,651 7,545
Non-current liabilities
Borrowings 59,666 50,000
Total non-current liabilities 59,666 50,000
Total liabilities 114,317 57,545
NET ASSETS 423,863 487,933
UNITHOLDERS‟ FUNDS
Units on issue 590,101 587,298
Foreign currency translation reserve (114,301) (114,527)
Revenue reserves (51,937) 15,162
Net assets attributable to unitholders 423,863 487,933
31 Dec 2009 31 Mar 2009 S$‟000 S$‟000
Amount payable within one year Secured bank loans 67,420 7,341 Amount payable after one year
Secured bank loans 38,187 72,024 Unsecured 3-year medium term notes 59,666 -
97,853 72,024 Total 165,273 79,365

a-iTrust Announcement of Results for the Third Financial Quarter Ended 31 December 2009
16
1(c) Consolidated Statement of Cash Flows (3Q FY 09/10 and 3Q FY 08/09)
3Q FY09/10 3Q FY08/09
S$‟000 S$'000
Cash flows from operating activities:
Net profit 15,935 12,299
Adjustments for:
Income tax 2,660 3,148
Depreciation of equipment 245 185
Gain on disposal of equipment (1) -
Interest income (528) (754)
Finance cost 1,328 685
(Writeback)/Allowance for impairment of trade receivables (995) 712
Loss/(Gain) on derivative financial instruments 1,599 (3,041)
Trustee-Manager‟s fees paid/payable in units 882 553
Unrealised exchange (gain)/loss (5,076) 6,590
Currency realignment (130) (134)
Operating cash flow before working capital changes 15,919 20,243 Changes in operating assets and liabilities, net of effects from acquisitions and disposals of subsidiary companies:
Consumables (46) 362
Other current assets (238) (67)
Trade and other receivables 3,624 (1,370)
Trade and other payables 3,818 1,928
Cash generated from operations 23,077 21,096
Interest received 495 800
Income tax paid (net) (1,973) (2,209)
Net cash provided by operating activities 21,599 19,687
Cash flows from investing activities:
Purchase of equipment (24) (27)
Construction of development properties (17,893) (5,991)
Capital expenditure on investment properties (1,445) (2,487)
Proceed from disposal of equipment 1 -
Net cash used in investing activities (19,361) (8,505)
Cash flows from financing activities:
Interest paid (3,575) (936)
Repayment of borrowings (5,250) -
Proceeds from borrowings 3,000 11,500
Proceeds from issue of medium term notes 59,650 -
Distribution to unitholders (29,769) (26,217)
Net cash provided by/(used in) financing activities 24,056 (15,653)
Net increase/(decrease) in cash and cash equivalents 26,294 (4,471)
Cash and cash equivalents at beginning of financial period 54,068 41,722
Effects of currency translation on cash and cash equivalents 1,989 (1,863)
Cash and cash equivalents at end of financial period 82,351 35,388

a-iTrust Announcement of Results for the Third Financial Quarter Ended 31 December 2009
17
1(c) Consolidated Cash Flow (YTD FY 09/10 and YTD FY 08/09)
YTD FY09/10 YTD FY08/09
S$‟000 S$‟000
Cash flows from operating activities:
Net profit 33,843 41,421
Adjustments for:
Income tax 13,088 7,460
Depreciation of equipment 1,070 573
Investment properties written-off 99 -
Gain on disposal equipment (1) -
Interest income (1,536) (2,861)
Finance cost 3,784 1,954
(Writeback)/Allowance for impairment of trade receivables (564) 712
Gain on derivative financial instruments 6,914 (11,904)
Trustee-Manager‟s fees paid/payable in units 2,618 2,010
Unrealised exchange (gain)/loss (3,302) 9,869
Currency realignment 656 1,848
Operating cash flow before working capital changes 56,669 51,082
Changes in operating assets and liabilities, net of effects from acquisitions and disposals of subsidiary companies:
Consumables 8 182
Other current assets (547) (44)
Trade and other receivables 3,851 (3,654)
Trade and other payables 3,927 (4,182)
Cash generated from operations 63,908 43,384
Interest received 1,395 3,400
Income tax (paid) (net) (10,643) (9,054)
Net cash provided by operating activities 54,660 37,730
Cash flows from investing activities:
Purchase of equipment (388) (79)
Construction of development properties (49,489) (14,975)
Capital expenditure on investment properties (3,785) (7,637)
Proceed from disposal of equipment 1 -
Net cash used in investing activities (53,661) (22,691)
Cash flows from financing activities:
Repayment of borrowings (5,250) (5,100)
Interest paid (5,026) (2,081)
Proceeds from borrowings 32,919 21,500
Proceeds from issue of medium term notes 59,650 -
Dividends paid to unit holders (60,603) (49,850)
Net cash provided by/(used in) financing activities 21,690 (35,531)
Net increase/(decrease) in cash and cash equivalents 22,689 (20,492)
Cash and cash equivalents at beginning of financial period 59,662 63,331
Effects of currency translation on cash and cash equivalents - (7,451)
Cash and cash equivalents at end of financial period 82,351 35,388

a-iTrust Announcement of Results for the Third Financial Quarter Ended 31 December 2009
18
Notes:
On 9 November 2009, a-iTrust, pursuant to its S$ 500 million Multicurrency Medium Term
Notes programme, issued two series of 3-year senior unsecured fixed rate notes (the “Notes”)
bearing a coupon rate of 5.255% per annum amounting to an aggregate of S$ 60 million. The
net proceeds were intended to fully fund the development of a proposed and to be named
Multi-Tenanted Building within the Special Economic Zone of ITPB, as well as to meet working
capital requirements. The Notes are carried at amortised cost using effective interest method.
Each of ITPL and Ascendas IT Park (Chennai) Ltd (“AITPCL”) has accepted a bilateral INR
denominated term loan facility from DBS India amounting to Rs 1.0 billion (S$ 30 million) and
Rs 1.5 billion (S$ 45 million) respectively. The INR facilities, both of which mature in December
2015, carry an interest rate of 10% per annum for first year, may be reset annually. The loans
will be drawn down against construction payments for the projects. As at 31 December 2009,
each of ITPL and AITPCL has drawn down S$ 14.8 million and S$ 20.6 million respectively,
and the proceeds were applied towards construction payment for Park Square in ITPL and
Zenith in AITPCL.
Distributions for 2H FY08/09 of S$ 30.8 million and 1H FY09/10 of S$ 29.8 million were paid in
May 2009 and November 2009 respectively.

a-iTrust Announcement of Results for the Third Financial Quarter Ended 31 December 2009
19
1(d)(i) Consolidated Statements of Changes in Unitholders‟ Funds (Group)
<----Attributable to unitholders of the Trust (S$‟000)----->
Units on
issue
Foreign currency
translation reserve
Other reserves
Revenue reserve
Minority interests Total
2009
Balance at 1 April 2009 587,298 (155,607) 4,865 237,372 36,760 710,688
Total comprehensive income / (expenses) for the period - (22,164) - 16,407 219 (5,538)
Transfer to other reserves - - 3,435 (3,435) - -
Issue of new units 2,313 - - - - 2,313
Distribution to unitholders - - - (30,834) - (30,834)
Balance at 30 September 2009 589,611 (177,771) 8,300 219,510 36,979 676,629
Total comprehensive income for the period - 22,073 - 14,922 2,289 39,284
Transfer to other reserves - - 8,354 (8,354) - -
Issue of new units 490 - - - - 490
Distribution to unitholders - - - (29,769) - (29,769)
Balance at 31 December 2009 590,101 (155,698) 16,654 196,309 39,268 686,634
2008
Balance at 1 April 2008 583,834 (64,659) 253 289,998 47,375 856,801
Total comprehensive income / (expenses) for the period - (66,416) - 27,988 (8,769) (47,197)
Transfer to other reserves - - 2,116 (2,116) - -
Issue of new units 2,380 - - - - 2,380
Distribution to unitholders - - - (23,633) - (23,633)
Balance at 30 September 2008 586,214 (131,075) 2,369 292,237 38,606 788,351
Total comprehensive income / (expenses) for the period - (24,237) - 11,458 (413) (13,192)
Transfer to other reserves - - 2,496 (2,496) - -
Issue of new units 554 - - - - 554
Distribution to unitholders - - - (26,217) - (26,217)
Balance at 31 December 2008 586,768 (155,312) 4,865 274,982 38,193 749,496

a-iTrust Announcement of Results for the Third Financial Quarter Ended 31 December 2009
20
1(d)(ii) Statements of Changes in Unitholders‟ Funds (a-iTrust)
<----Attributable to unitholders of the Trust (S$‟000)------>
Units on
issue
Foreign currency
translation reserve
Revenue reserve Total
2009
Balance at 1 April 2009 587,298 (114,527) 15,162 487,933 Total comprehensive expenses for the period - (14,951) (4,840) (19,791) Issue of new units 2,313 - - 2,313 Distribution to unitholders - - (30,834) (30,834)
Balance at 30 September 2009 589,611 (129,478) (20,512) 439,621 Total comprehensive income / (expenses) for the period - 15,177 (1,656) 13,521 Issue of new units 490 - - 490 Distribution to unitholders - - (29,769) (29,769)
Balance at 31 December 2009 590,101 (114,301) (51,937) 423,863
2008 Balance at 1 April 2008 583,834 (52,235) 23,663 555,262 Total comprehensive income / (expenses) for the period - (46,469) 37,287 (9,182) Issue of new units 2,380 - - 2,380 Distribution to unitholders - - (23,633) (23,633)
Balance at 30 September 2008 586,214 (98,704) 37,317 524,827 Total comprehensive income / (expenses) for the period - (16,357) 12,167 (4,190) Issue of new units 554 - - 554 Distribution to unitholders - - (26,217) (26,217)
Balance at 31 December 2008 586,768 (115,061) 23,267 494,974
a-iTrust Announcement of Results for the Third Financial Quarter Ended 31 December 2009
21
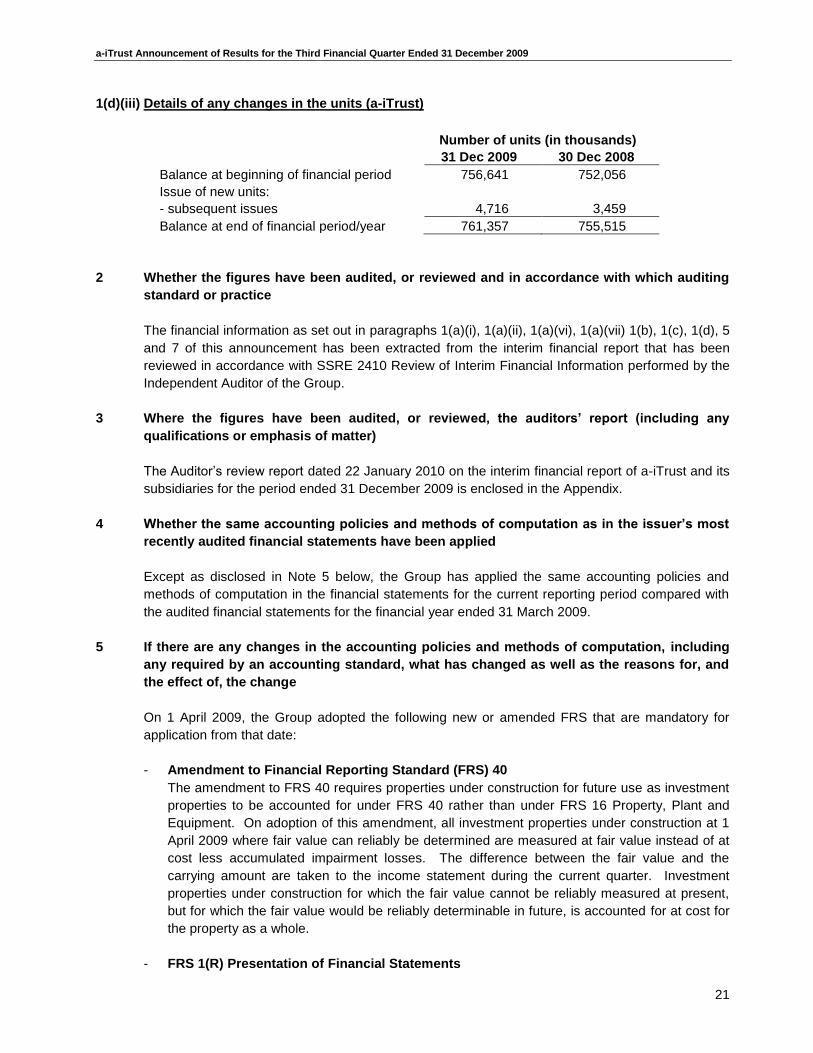
1(d)(iii) Details of any changes in the units (a-iTrust)
Number of units (in thousands)
31 Dec 2009 30 Dec 2008
Balance at beginning of financial period 756,641 752,056
Issue of new units:
- subsequent issues 4,716 3,459
Balance at end of financial period/year 761,357 755,515
2 Whether the figures have been audited, or reviewed and in accordance with which auditing
standard or practice
The financial information as set out in paragraphs 1(a)(i), 1(a)(ii), 1(a)(vi), 1(a)(vii) 1(b), 1(c), 1(d), 5
and 7 of this announcement has been extracted from the interim financial report that has been
reviewed in accordance with SSRE 2410 Review of Interim Financial Information performed by the
Independent Auditor of the Group.
3 Where the figures have been audited, or reviewed, the auditors‟ report (including any
qualifications or emphasis of matter)
The Auditor‟s review report dated 22 January 2010 on the interim financial report of a-iTrust and its
subsidiaries for the period ended 31 December 2009 is enclosed in the Appendix.
4 Whether the same accounting policies and methods of computation as in the issuer‟s most
recently audited financial statements have been applied
Except as disclosed in Note 5 below, the Group has applied the same accounting policies and
methods of computation in the financial statements for the current reporting period compared with
the audited financial statements for the financial year ended 31 March 2009.
5 If there are any changes in the accounting policies and methods of computation, including
any required by an accounting standard, what has changed as well as the reasons for, and
the effect of, the change
On 1 April 2009, the Group adopted the following new or amended FRS that are mandatory for
application from that date:
- Amendment to Financial Reporting Standard (FRS) 40
The amendment to FRS 40 requires properties under construction for future use as investment
properties to be accounted for under FRS 40 rather than under FRS 16 Property, Plant and
Equipment. On adoption of this amendment, all investment properties under construction at 1
April 2009 where fair value can reliably be determined are measured at fair value instead of at
cost less accumulated impairment losses. The difference between the fair value and the
carrying amount are taken to the income statement during the current quarter. Investment
properties under construction for which the fair value cannot be reliably measured at present,
but for which the fair value would be reliably determinable in future, is accounted for at cost for
the property as a whole.
- FRS 1(R) Presentation of Financial Statements

a-iTrust Announcement of Results for the Third Financial Quarter Ended 31 December 2009
22
FRS 1R requires all changes in equity arising from transactions with owners, in their capacity
as owners, to be presented separately from the non-owner changes in equity. Non-owner
changes in equity are presented in a separate Statement of Comprehensive Income.
Entities can choose whether to present one statement of financial performance (the statement
of comprehensive income) or two statements (a separate income statement and a statement of
comprehensive income). The group has elected to present two statements: an income
statement (a statement displaying components of profit or loss) and a statement of
comprehensive income (a second statement beginning with profit or loss and displaying
components of other non-owner changes in equity). The interim financial statements have been
prepared under the revised disclosure requirements.
The „Balance Sheets‟ and „Cash Flow Statements‟ have been re-titled to „Statements of
Financial Position‟ and „Statements of Cash Flows‟ respectively. Comparatives for 2008 have
been restated to conform to the requirements of the revised standard.
- FRS 108 „Operating segments‟
FRS 108 replaces FRS 14, „Segment Reporting‟. It requires a „management approach‟ under
which segment information is presented on the same basis as that used for internal reporting
purposes. The Group has a single reportable operating segment as „Rental from Investment
Properties‟. Operating segments are reported in a manner consistent with the internal reporting
provided to the chief operating decision-maker. The chief operating decision-maker has been
identified as the Chief Executive Officer (CEO) who makes the strategic resource allocation and
assesses performance of the operating segment.
6 Earnings per unit (“EPU”) and distribution per unit (“DPU”) for the financial period (Group)
3Q FY09/10 3Q FY08/09
Weighted average number of units for calculation of EPU („000) 761,187 755,189
Applicable number of units for calculation of DPU („000) 761,357 755,515
EPU (cents) 1.96 1.52
DPU (cents) 1.85 2.02
7 Net asset value (“NAV”) backing per unit based on existing units in issue as at the end of
the period
31 Dec 2009 31 Mar 2009
No of units on issue at end of period („000) 761,357 756,641
NAV per unit of Group (S$) 0.85 0.89
NAV per unit of the Trust (S$) 0.56 0.64
8 Review of performance
Please refer to the analysis of performance under item 1(a).
9 Variance between forecast and the actual results (Group)
No forecast has been disclosed.
a-iTrust Announcement of Results for the Third Financial Quarter Ended 31 December 2009
23
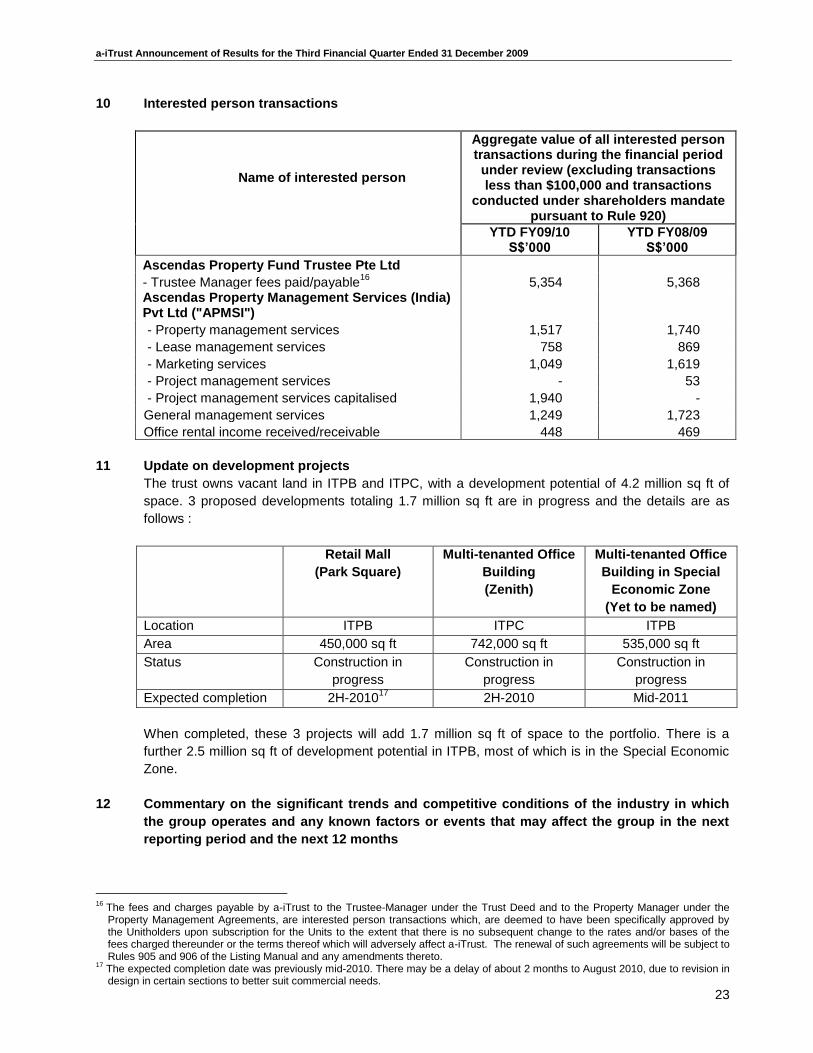
10 Interested person transactions
Name of interested person
Aggregate value of all interested person transactions during the financial period under review (excluding transactions less than $100,000 and transactions
conducted under shareholders mandate pursuant to Rule 920)
YTD FY09/10 S$‟000
YTD FY08/09 S$‟000
Ascendas Property Fund Trustee Pte Ltd
- Trustee Manager fees paid/payable16
5,354 5,368 Ascendas Property Management Services (India) Pvt Ltd ("APMSI")
- Property management services 1,517 1,740
- Lease management services 758 869
- Marketing services 1,049 1,619
- Project management services - 53
- Project management services capitalised 1,940 -
General management services 1,249 1,723
Office rental income received/receivable 448 469
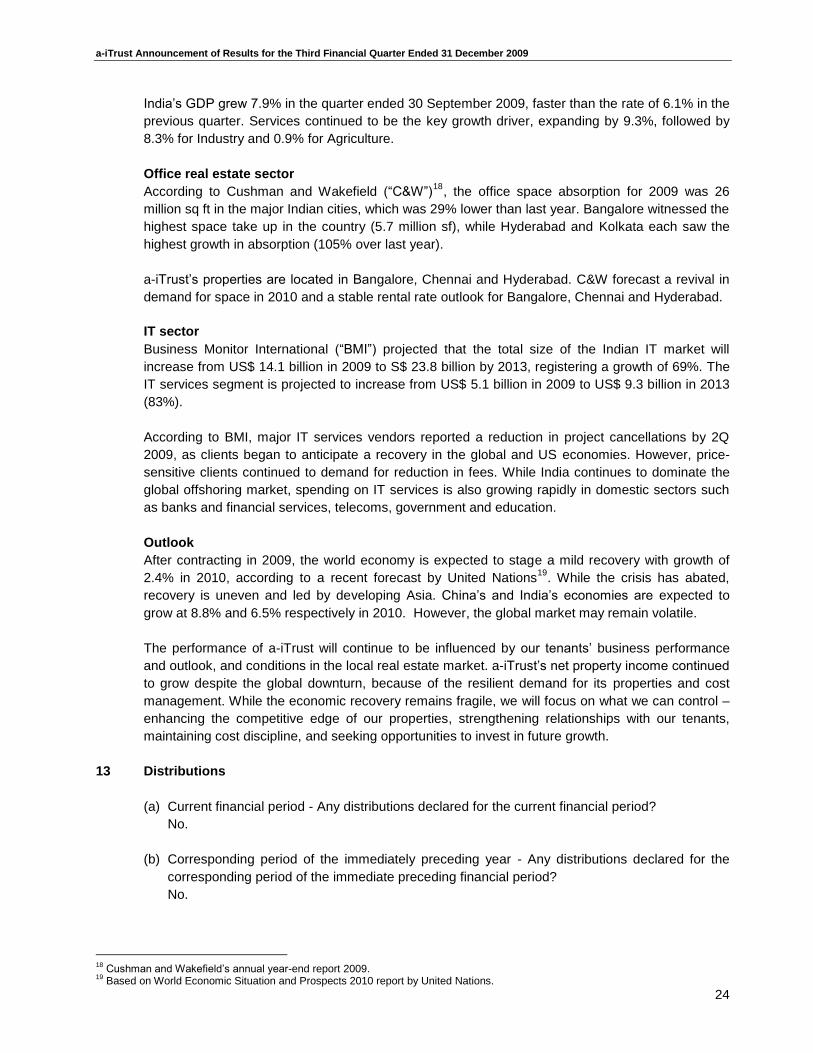
11 Update on development projects
The trust owns vacant land in ITPB and ITPC, with a development potential of 4.2 million sq ft of
space. 3 proposed developments totaling 1.7 million sq ft are in progress and the details are as
follows :
Retail Mall
(Park Square)
Multi-tenanted Office
Building
(Zenith)
Multi-tenanted Office
Building in Special
Economic Zone
(Yet to be named)
Location ITPB ITPC ITPB
Area 450,000 sq ft 742,000 sq ft 535,000 sq ft
Status Construction in
progress
Construction in
progress
Construction in
progress
Expected completion 2H-201017
2H-2010 Mid-2011
When completed, these 3 projects will add 1.7 million sq ft of space to the portfolio. There is a
further 2.5 million sq ft of development potential in ITPB, most of which is in the Special Economic
Zone.
12 Commentary on the significant trends and competitive conditions of the industry in which
the group operates and any known factors or events that may affect the group in the next
reporting period and the next 12 months
16
The fees and charges payable by a-iTrust to the Trustee-Manager under the Trust Deed and to the Property Manager under the Property Management Agreements, are interested person transactions which, are deemed to have been specifically approved by the Unitholders upon subscription for the Units to the extent that there is no subsequent change to the rates and/or bases of the fees charged thereunder or the terms thereof which will adversely affect a-iTrust. The renewal of such agreements will be subject to Rules 905 and 906 of the Listing Manual and any amendments thereto.
17 The expected completion date was previously mid-2010. There may be a delay of about 2 months to August 2010, due to revision in design in certain sections to better suit commercial needs.
a-iTrust Announcement of Results for the Third Financial Quarter Ended 31 December 2009
24
India‟s GDP grew 7.9% in the quarter ended 30 September 2009, faster than the rate of 6.1% in the
previous quarter. Services continued to be the key growth driver, expanding by 9.3%, followed by
8.3% for Industry and 0.9% for Agriculture.
Office real estate sector
According to Cushman and Wakefield (“C&W”)18
, the office space absorption for 2009 was 26
million sq ft in the major Indian cities, which was 29% lower than last year. Bangalore witnessed the
highest space take up in the country (5.7 million sf), while Hyderabad and Kolkata each saw the
highest growth in absorption (105% over last year).
a-iTrust‟s properties are located in Bangalore, Chennai and Hyderabad. C&W forecast a revival in
demand for space in 2010 and a stable rental rate outlook for Bangalore, Chennai and Hyderabad.
IT sector
Business Monitor International (“BMI”) projected that the total size of the Indian IT market will
increase from US$ 14.1 billion in 2009 to S$ 23.8 billion by 2013, registering a growth of 69%. The
IT services segment is projected to increase from US$ 5.1 billion in 2009 to US$ 9.3 billion in 2013
(83%).
According to BMI, major IT services vendors reported a reduction in project cancellations by 2Q
2009, as clients began to anticipate a recovery in the global and US economies. However, price-
sensitive clients continued to demand for reduction in fees. While India continues to dominate the
global offshoring market, spending on IT services is also growing rapidly in domestic sectors such
as banks and financial services, telecoms, government and education.
Outlook
After contracting in 2009, the world economy is expected to stage a mild recovery with growth of
2.4% in 2010, according to a recent forecast by United Nations19
. While the crisis has abated,
recovery is uneven and led by developing Asia. China‟s and India‟s economies are expected to
grow at 8.8% and 6.5% respectively in 2010. However, the global market may remain volatile.
The performance of a-iTrust will continue to be influenced by our tenants‟ business performance
and outlook, and conditions in the local real estate market. a-iTrust‟s net property income continued
to grow despite the global downturn, because of the resilient demand for its properties and cost
management. While the economic recovery remains fragile, we will focus on what we can control –
enhancing the competitive edge of our properties, strengthening relationships with our tenants,
maintaining cost discipline, and seeking opportunities to invest in future growth.
13 Distributions
(a) Current financial period - Any distributions declared for the current financial period?
No.
(b) Corresponding period of the immediately preceding year - Any distributions declared for the
corresponding period of the immediate preceding financial period?
No.
18
Cushman and Wakefield‟s annual year-end report 2009. 19
Based on World Economic Situation and Prospects 2010 report by United Nations.

a-iTrust Announcement of Results for the Third Financial Quarter Ended 31 December 2009
25
14 If no distribution has been declared / recommended, a statement to the effect
Refer to paragraph 13.
15 Directors‟ confirmation pursuant to Rule 705(5) of the Listing Manual
The Board of Directors has confirmed that, to the best of their knowledge, nothing has come to their
attention which may render these interim financial results to be false or misleading in any material
aspect.
This release may contain forward-looking statements that involve risks and uncertainties. Actual future
performance, outcomes and results may differ materially from those expressed in forward-looking statements as
a result of a number of risks, uncertainties and assumptions. Representative examples of these factors include
(without limitation) general industry and economic conditions, interest rate trends, cost of capital and capital
availability, competition from similar developments, shifts in expected levels of property rental income, changes in
operating expenses, including employee wages, benefits and training, property expenses and governmental and
public policy changes and the continued availability of financing in the amounts and the terms necessary to
support future business. You are cautioned not to place undue reliance on these forward looking statements,
which are based on current view of management on future events.
By order of the Board
Ascendas Property Fund Trustee Pte. Ltd.
Mary De Souza
Company Secretary
22 January 2010