A FINE BALANCE - Ascendas REIT
152
A FINE BALANCE A-REIT 7TH ANNUAL REPORT FY2008/09
Transcript of A FINE BALANCE - Ascendas REIT

A FINE BALANCE
A-REIT 7TH ANNUAL REPORT FY2008/09
04 About A-REIT
06 A-REIT Structure
08 Significant Events
10 Financial Highlights
16 Chairman’s Statement
20 Manager’s Report
36 Board of Directors
38 The A-REIT Team
42 The Property Manager
48 Investment Property Portfolio
54 Business & Science Park Properties
58 Hi-Tech Industrial Properties
62 Light Industrial/
Flatted Factories Properties
68 Logistics & Distribution Centres
72 Warehouse Retail Facilities
74 Enhancing Corporate
Social Responsibilities
76 Investor Relations
77 CBRE Market Study
84 Corporate Governance
94 Financial Statements
144 Statistics of Unitholdings
146 Additional Information
149 Glossary
CONTENTS
A-REIT was voted as Singapore’s 7th best
managed company (after SingTel, SIA, OCBC,
Capitaland, DBS and UOB) in FinanceAsia’s 2009
annual poll of Asia’s best managed companies.
Any discrepancies in the tables and charts between the listed figures and totals thereof are due to rounding.Where applicable, figures and percentages are rounded to one decimal place.
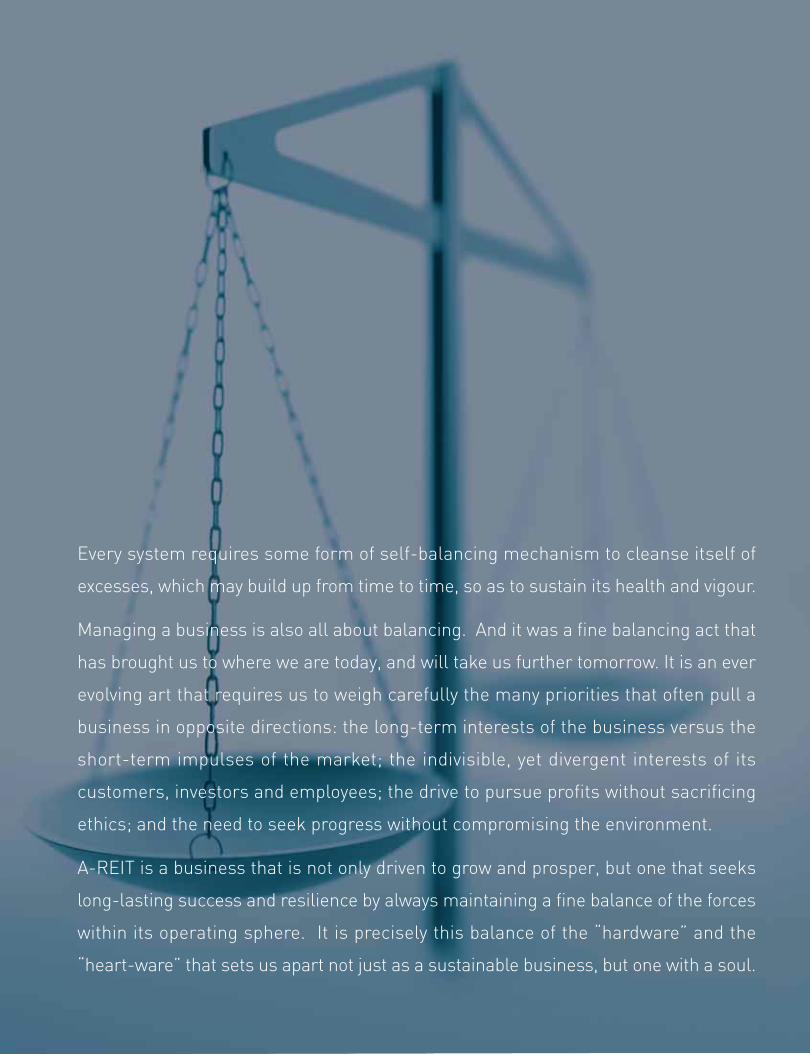
Every system requires some form of self-balancing mechanism to cleanse itself of
excesses, which may build up from time to time, so as to sustain its health and vigour.
Managing a business is also all about balancing. And it was a fine balancing act that
has brought us to where we are today, and will take us further tomorrow. It is an ever
evolving art that requires us to weigh carefully the many priorities that often pull a
business in opposite directions: the long-term interests of the business versus the
short-term impulses of the market; the indivisible, yet divergent interests of its
customers, investors and employees; the drive to pursue profits without sacrificing
ethics; and the need to seek progress without compromising the environment.
A-REIT is a business that is not only driven to grow and prosper, but one that seeks
long-lasting success and resilience by always maintaining a fine balance of the forces
within its operating sphere. It is precisely this balance of the “hardware” and the
“heart-ware” that sets us apart not just as a sustainable business, but one with a soul.
To deliver predictable distributionsand achieve long term
capital stability for unitholders.
A-REIT’s Mission
About A-REIT
A-REIT owns a diversified portfolio of properties in Singapore comprising:
• Business & Science Parks
Suburban office, corporate HQ buildings and R&D space.
• Hi-Tech Industrial
High office content combined with high specifications mixed-use
industrial space.
• Light Industrial / Flatted Factories
Low office content combined with manufacturing space.
• Logistics & Distribution Centres
Warehousing and distribution centres.
• Warehouse Retail Facilities
Single-user retail and warehouse space.
These properties house a tenant base of about 900 international and
local companies from a range of industries and activities, including
research and development, life sciences, information technology,
engineering, light manufacturing, logistics service providers, electronics,
telecommunications, manufacturing services and back-room office
support in service industries.
Ascendas Funds Management (S) Limited (“AFM”) is the manager of
A-REIT (the “Manager”).
The Manager is committed to delivering long-term sustainable
distributions and capital stability to unitholders through a three-pronged
strategy of:
• Yield accretive investments comprising developments as well as
acquisitions of income-producing properties with strong underlying
real estate fundamentals
• Organic portfolio growth through proactive asset management
• Prudent capital & risk management
Ascendas Real Estate Investment Trust (“A-REIT”) is the first and largest
business space and industrial Real Estate Investment Trust (“REIT”)
listed on Singapore Exchange Securities Trading Limited (“SGX-ST”).
0405
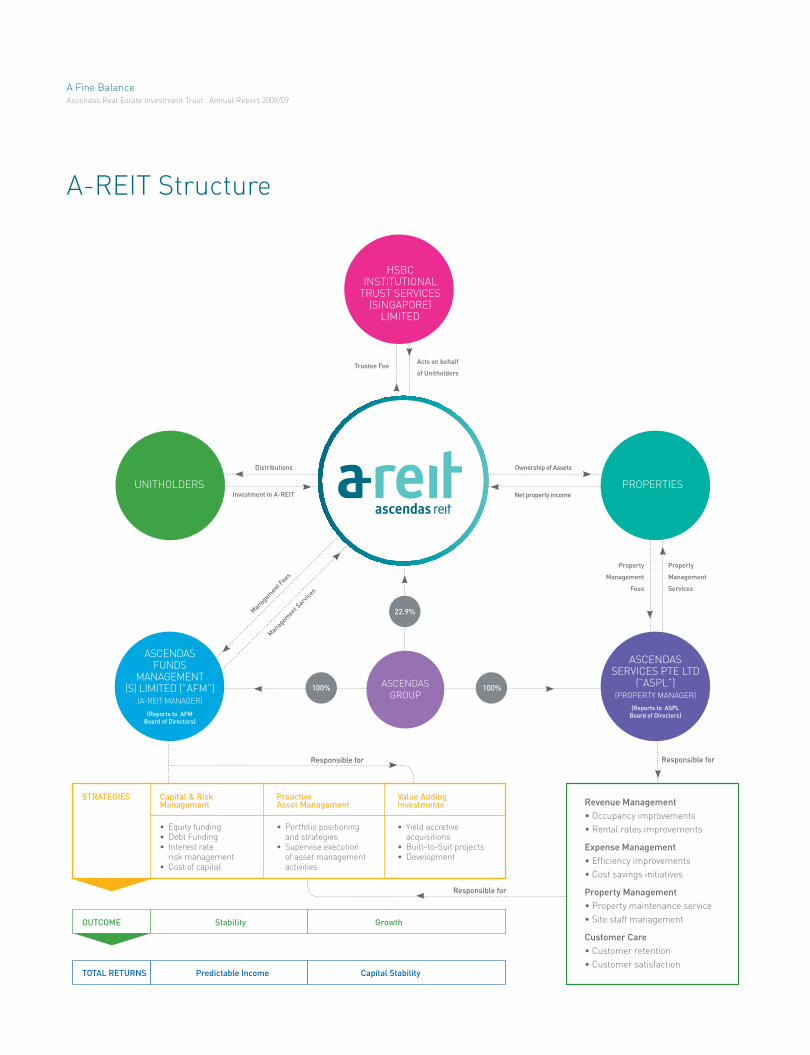
A-REIT Structure
22.9%
100% 100%
Distributions
Investment in A-REIT
Ownership of Assets
Net property income
Acts on behalf
of UnitholdersTrustee Fee
Managem
ent Fees
Managem
ent Serv
ices
Property
Management
Fees
Property
Management
Services
STRATEGIES Capital & RiskManagement
ProactiveAsset Management
Value AddingInvestments
• Equity funding• Debt Funding• Interest rate
risk management• Cost of capital
• Portfolio positioning and strategies
• Supervise execution of asset managementactivities
• Yield accretive acquisitions
• Built-to-Suit projects• Development
OUTCOME Stability Growth
TOTAL RETURNS Predictable Income Capital Stability
Revenue Management
• Occupancy improvements
• Rental rates improvements
Expense Management
• Efficiency improvements
• Cost savings initiatives
Property Management
• Property maintenance service
• Site staff management
Customer Care
• Customer retention
• Customer satisfaction
Responsible for Responsible for
Responsible for
HSBCINSTITUTIONAL
TRUST SERVICES(SINGAPORE)
LIMITED
PROPERTIESUNITHOLDERS
ASCENDASSERVICES PTE LTD
(”ASPL”)(PROPERTY MANAGER)
(Reports to ASPL
Board of Directors)
ASCENDASFUNDS
MANAGEMENT(S) LIMITED (”AFM”)
(A-REIT MANAGER)
(Reports to AFM
Board of Directors)
ASCENDAS
GROUP
A Fine BalanceAscendas Real Estate Investment Trust . Annual Report 2008/09
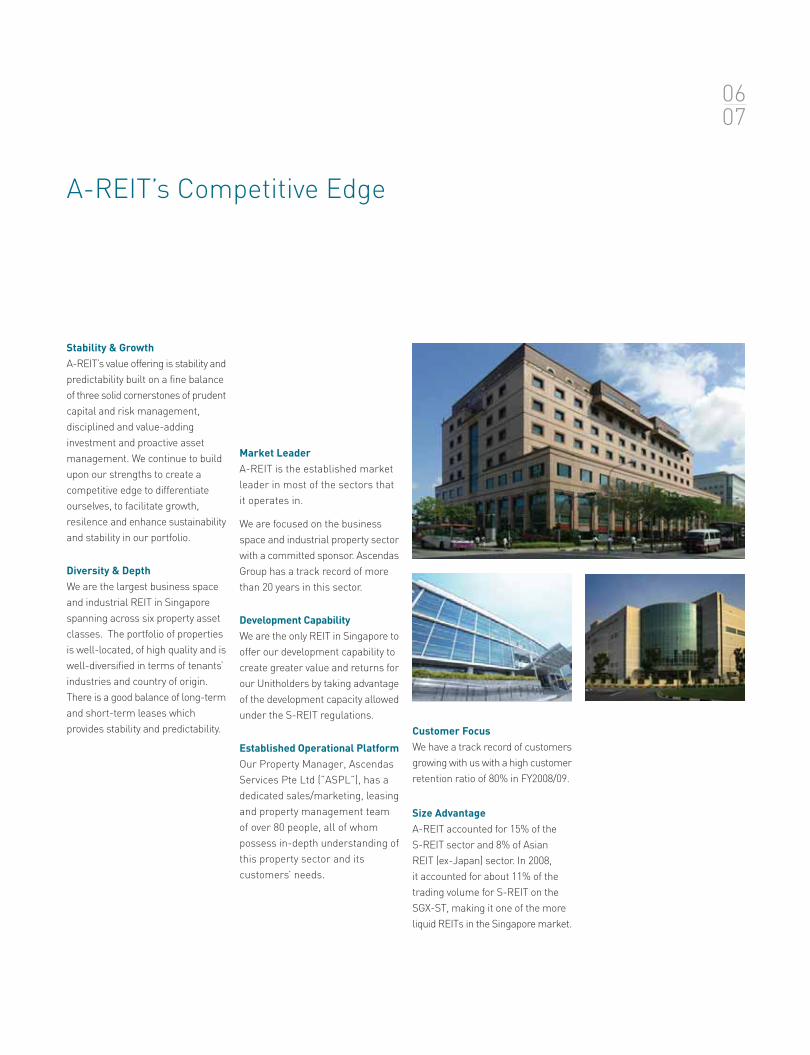
A-REIT’s Competitive Edge
Stability & Growth
A-REIT’s value offering is stability and
predictability built on a fine balance
of three solid cornerstones of prudent
capital and risk management,
disciplined and value-adding
investment and proactive asset
management. We continue to build
upon our strengths to create a
competitive edge to differentiate
ourselves, to facilitate growth,
resilence and enhance sustainability
and stability in our portfolio.
Diversity & Depth
We are the largest business space
and industrial REIT in Singapore
spanning across six property asset
classes. The portfolio of properties
is well-located, of high quality and is
well-diversified in terms of tenants’
industries and country of origin.
There is a good balance of long-term
and short-term leases which
provides stability and predictability. Customer Focus
We have a track record of customers
growing with us with a high customer
retention ratio of 80% in FY2008/09.
Size Advantage
A-REIT accounted for 15% of the
S-REIT sector and 8% of Asian
REIT (ex-Japan) sector. In 2008,
it accounted for about 11% of the
trading volume for S-REIT on the
SGX-ST, making it one of the more
liquid REITs in the Singapore market.
Market Leader
A-REIT is the established market
leader in most of the sectors that
it operates in.
We are focused on the business
space and industrial property sector
with a committed sponsor. Ascendas
Group has a track record of more
than 20 years in this sector.
Development Capability
We are the only REIT in Singapore to
offer our development capability to
create greater value and returns for
our Unitholders by taking advantage
of the development capacity allowed
under the S-REIT regulations.
Established Operational Platform
Our Property Manager, Ascendas
Services Pte Ltd (”ASPL”), has a
dedicated sales/marketing, leasing
and property management team
of over 80 people, all of whom
possess in-depth understanding of
this property sector and its
customers’ needs.
0607
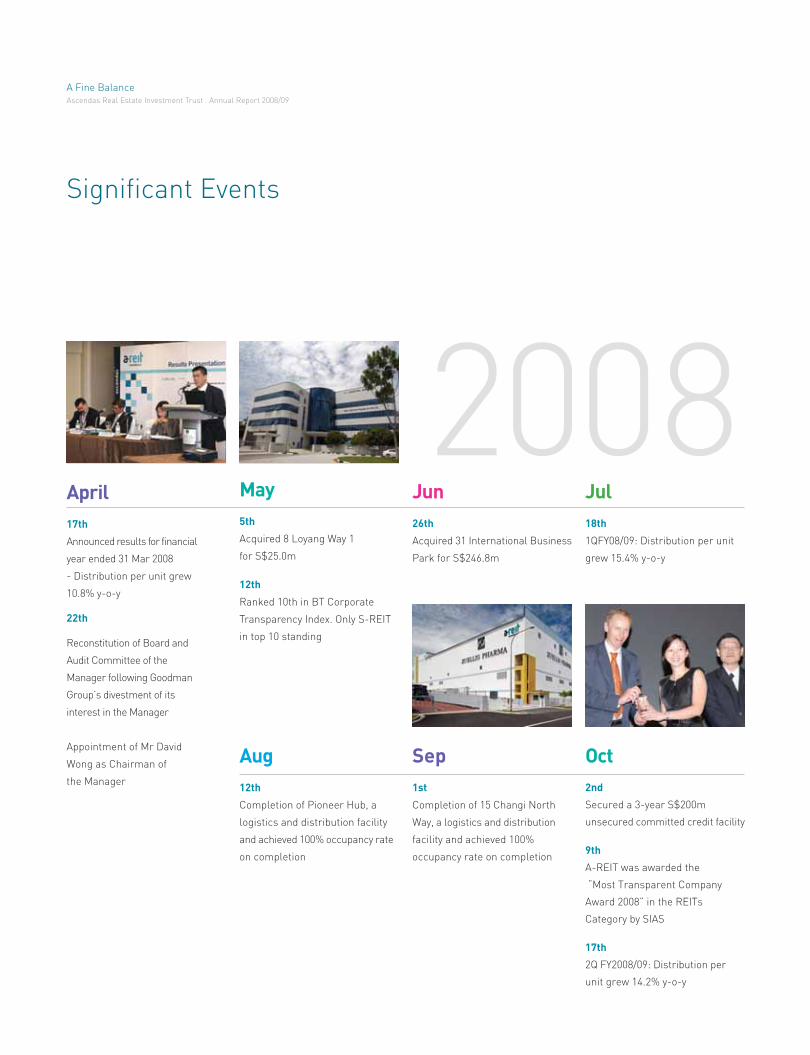
2008
Significant Events
April
17th
Announced results for financial
year ended 31 Mar 2008
- Distribution per unit grew
10.8% y-o-y
22th
Reconstitution of Board and
Audit Committee of the
Manager following Goodman
Group’s divestment of its
interest in the Manager
Appointment of Mr David
Wong as Chairman of
the Manager
May
5th
Acquired 8 Loyang Way 1
for S$25.0m
12th
Ranked 10th in BT Corporate
Transparency Index. Only S-REIT
in top 10 standing
Jun
26th
Acquired 31 International Business
Park for S$246.8m
Jul
18th
1QFY08/09: Distribution per unit
grew 15.4% y-o-y
Aug
12th
Completion of Pioneer Hub, a
logistics and distribution facility
and achieved 100% occupancy rate
on completion
Sep
1st
Completion of 15 Changi North
Way, a logistics and distribution
facility and achieved 100%
occupancy rate on completion
Oct
2nd
Secured a 3-year S$200m
unsecured committed credit facility
9th
A-REIT was awarded the
“Most Transparent Company
Award 2008” in the REITs
Category by SIAS
17th
2Q FY2008/09: Distribution per
unit grew 14.2% y-o-y
A Fine BalanceAscendas Real Estate Investment Trust . Annual Report 2008/09
Jan
15th
3Q FY2008/09: Distribution per unit
grew 13.8% y-o-y
Launched a private placement of
258,000,000 new units at S$1.16 per
unit (which represents a 7% discount
to the adjusted volume weighted
average price at the day of the launch)
to raise approximately S$300m and
a 1-for-15 preferential offering to
raise approximately S$108m. The
net proceeds from the equity fund
raising exercise were used to fund
committed development projects and
to reduce borrowings
Feb
16th
Completion of 3 Changi Business
Park Crescent, a pre-committed
business park development for
Citibank N.A.
Mar
20th
Established a S$1 bn
Multicurrency Medium Term
Note (MTN) program to diversify
sources of funds for A-REIT.
The program has been
assigned a Baa2 rating
April
17th
Financial Year ended 31 March
2009: Distribution per unit grew
7.4% y-o-y
23rd
A-REIT’s development project, a
business park property at
3 Changi Business Park Crescent,
was awarded the BCA Green
Mark Platinum Award, the
highest accolade in Singapore for
environmental sustainability.
30th
First issuance of S$110m fixed
rate notes due 2011 as part of
the newly establish MTN program
2009
0809
Financial Highlights
FY 08/0907/0806/0705/0604/0503/0402/03FY 08/0907/0806/0705/0604/0503/0402/03
FY 08/0907/0806/0705/0604/0503/0402/03 FY 08/0907/0806/0705/0604/0503/0402/03
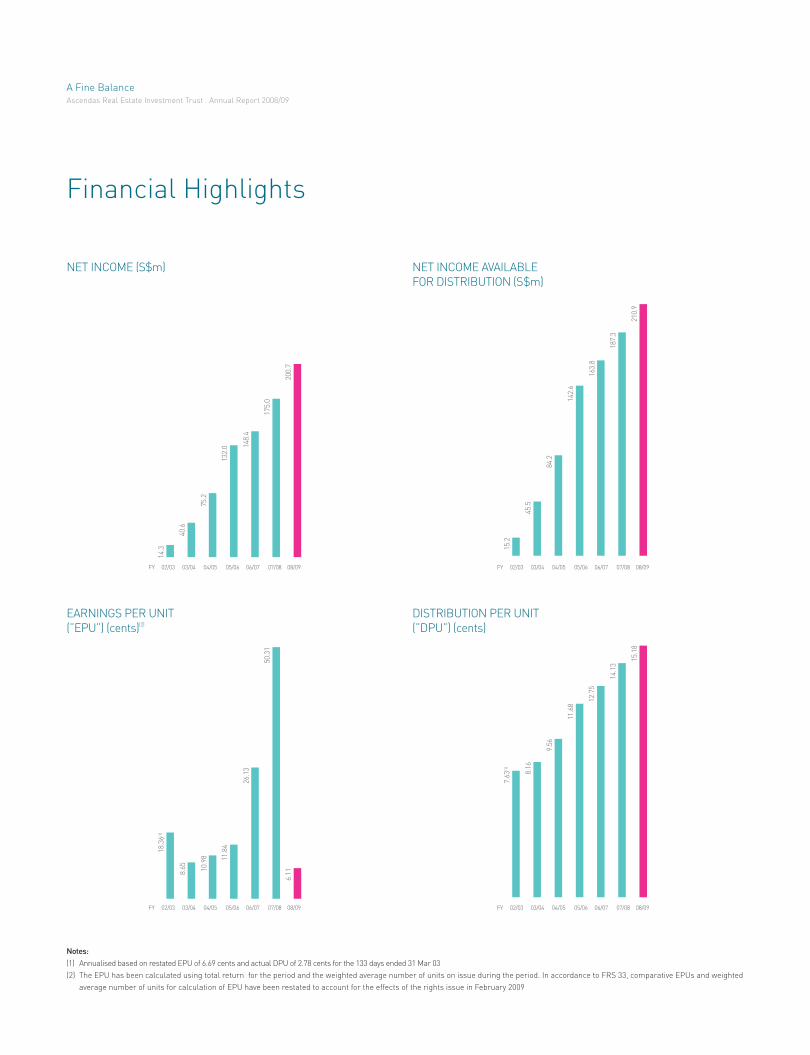
NET INCOME (S$m) NET INCOME AVAILABLE
FOR DISTRIBUTION (S$m)
EARNINGS PER UNIT
(”EPU”) (cents)(2)
DISTRIBUTION PER UNIT
(”DPU”) (cents)
200.7
175.0
148.4
132.0
75.2
40.6
14.3
210.9
187.3
163.8
142.6
84.2
45.5
15.2
15.1
8
14.1
3
12.7
5
11.6
8
9.5
6
8.1
6
7.6
3(1
)
6.1
1
18.3
6(1
)
50.3
1
26.1
3
11.8
4
10.9
8
8.6
5
Notes:
(1) Annualised based on restated EPU of 6.69 cents and actual DPU of 2.78 cents for the 133 days ended 31 Mar 03
(2) The EPU has been calculated using total return for the period and the weighted average number of units on issue during the period. In accordance to FRS 33, comparative EPUs and weighted
average number of units for calculation of EPU have been restated to account for the effects of the rights issue in February 2009
A Fine BalanceAscendas Real Estate Investment Trust . Annual Report 2008/09
As at
31 March 09080706050403 09080706050403 09080706050403
89
84
77
64
36
16
8
4,5
47.6
4,2
05.2
3,3
07.0
2,8
07.5
2112.3
1,0
20.7
636.4
1.6
1
1.8
4
1.4
9
1.3
4
1.2
3
0.9
8
0.9
1
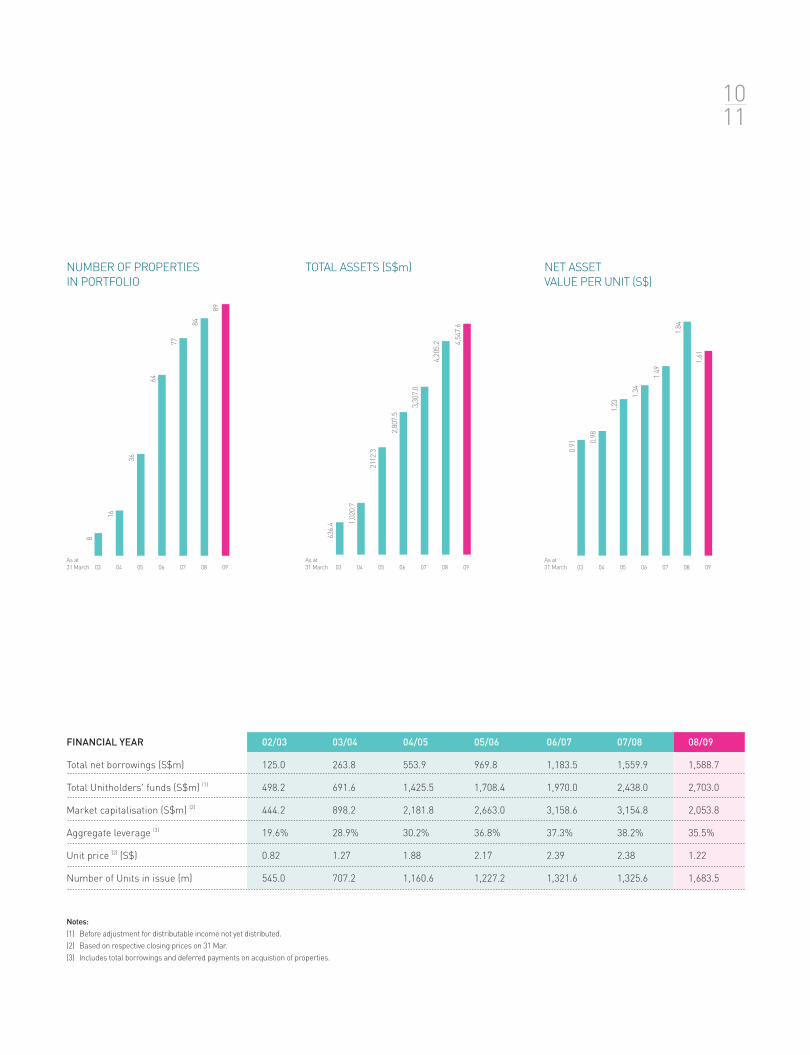
NUMBER OF PROPERTIES
IN PORTFOLIO
TOTAL ASSETS (S$m) NET ASSET
VALUE PER UNIT (S$)
Notes:
(1) Before adjustment for distributable income not yet distributed.
(2) Based on respective closing prices on 31 Mar.
(3) Includes total borrowings and deferred payments on acquistion of properties.
As at
31 March
As at
31 March
FINANCIAL YEAR 02/03 03/04 04/05 05/06 06/07 07/08 08/09
Total net borrowings (S$m) 125.0 263.8 553.9 969.8 1,183.5 1,559.9 1,588.7
Total Unitholders' funds (S$m) (1) 498.2 691.6 1,425.5 1,708.4 1,970.0 2,438.0 2,703.0
Market capitalisation (S$m) (2) 444.2 898.2 2,181.8 2,663.0 3,158.6 3,154.8 2,053.8
Aggregate leverage (3) 19.6% 28.9% 30.2% 36.8% 37.3% 38.2% 35.5%
Unit price (2) (S$) 0.82 1.27 1.88 2.17 2.39 2.38 1.22
Number of Units in issue (m) 545.0 707.2 1,160.6 1,227.2 1,321.6 1,325.6 1,683.5
1011
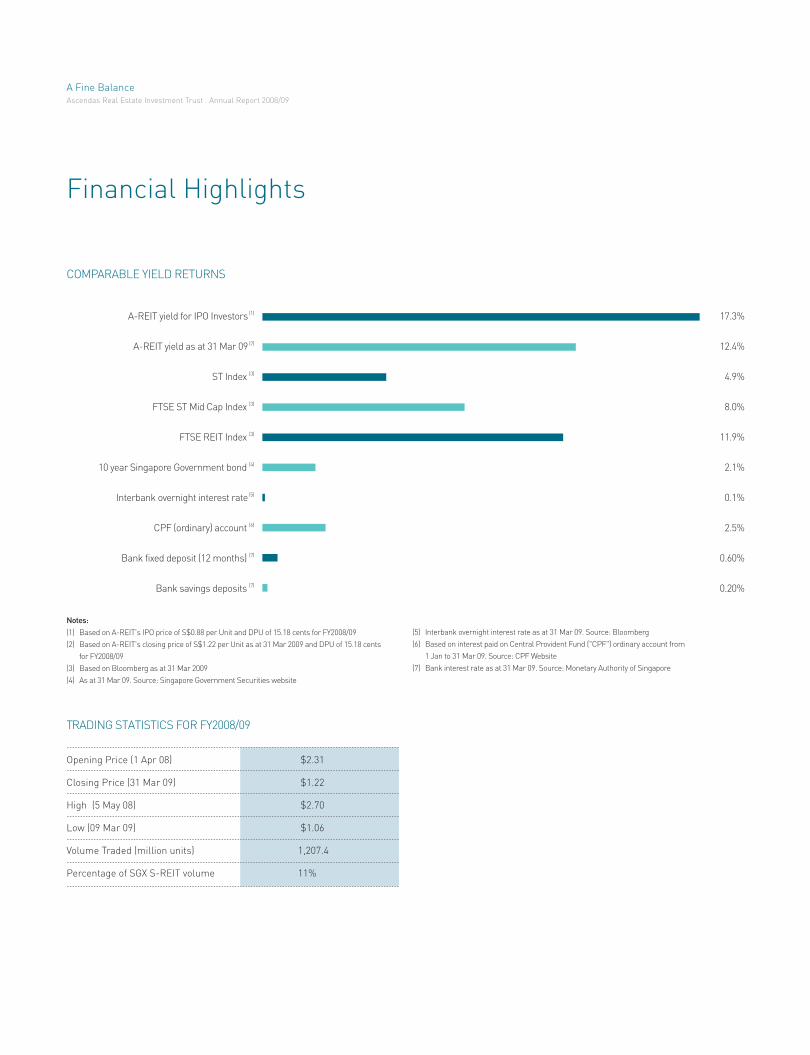
17.3%
12.4%
4.9%
8.0%
11.9%
2.1%
0.1%
2.5%
0.60%
0.20%
A-REIT yield for IPO Investors (1)
A-REIT yield as at 31 Mar 09 (2)
ST Index (3)
FTSE ST Mid Cap Index (3)
FTSE REIT Index (3)
10 year Singapore Government bond (4)
Interbank overnight interest rate (5)
CPF (ordinary) account (6)
Bank fixed deposit (12 months) (7)
Bank savings deposits (7)
Notes:
(1) Based on A-REIT's IPO price of S$0.88 per Unit and DPU of 15.18 cents for FY2008/09
(2) Based on A-REIT's closing price of S$1.22 per Unit as at 31 Mar 2009 and DPU of 15.18 cents
for FY2008/09
(3) Based on Bloomberg as at 31 Mar 2009
(4) As at 31 Mar 09. Source: Singapore Government Securities website
COMPARABLE YIELD RETURNS
(5) Interbank overnight interest rate as at 31 Mar 09. Source: Bloomberg
(6) Based on interest paid on Central Provident Fund ("CPF") ordinary account from
1 Jan to 31 Mar 09. Source: CPF Website
(7) Bank interest rate as at 31 Mar 09. Source: Monetary Authority of Singapore
TRADING STATISTICS FOR FY2008/09
Opening Price (1 Apr 08) $2.31
Closing Price (31 Mar 09) $1.22
High (5 May 08) $2.70
Low (09 Mar 09) $1.06
Volume Traded (million units) 1,207.4
Percentage of SGX S-REIT volume 11%
Financial Highlights
A Fine BalanceAscendas Real Estate Investment Trust . Annual Report 2008/09
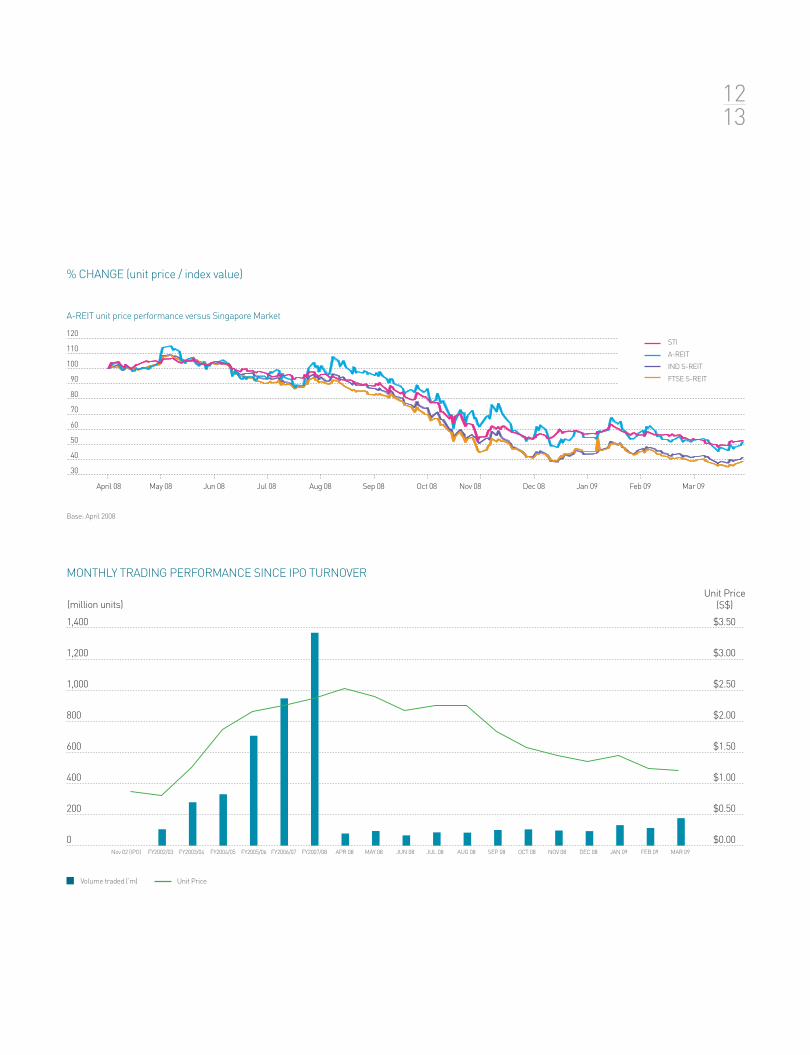
% CHANGE (unit price / index value)
1,400
1,200
1,000
800
600
400
200
0
$3.50
$3.00
$2.50
$2.00
$1.50
$1.00
$0.50
$0.00
MONTHLY TRADING PERFORMANCE SINCE IPO TURNOVER
Nov 02 (IPO) FY2002/03 FY2003/04 FY2004/05 FY2005/06 FY2006/07 FY2007/08 APR 08 MAY 08 JUN 08 JUL 08 AUG 08 SEP 08 OCT 08 NOV 08 DEC 08 JAN 09 FEB 09 MAR 09
Volume traded (’m) Unit Price
1213
120
110
100
90
80
70
60
50
40
30
April 08 May 08 Jun 08 Jul 08 Aug 08 Sep 08 Oct 08 Nov 08 Dec 08 Jan 09 Feb 09 Mar 09
STI
A-REIT
IND S-REIT
FTSE S-REIT
A-REIT unit price performance versus Singapore Market
Base: April 2008
(million units)Unit Price
(S$)


DONG
moveto advance or progress
MOVING BOLDLY, TREADING WISELY.
Taking quick and big strides doesn’t necessarily get you to your desired destination,
unless you are moving in the right direction. Corporate moves should not be made
just to be the biggest or fastest. Strategic decisions should always be well contemplated
and evaluated to ensure that they are made in a wise and sensible manner.
JING
reposedignified calmness;
composure
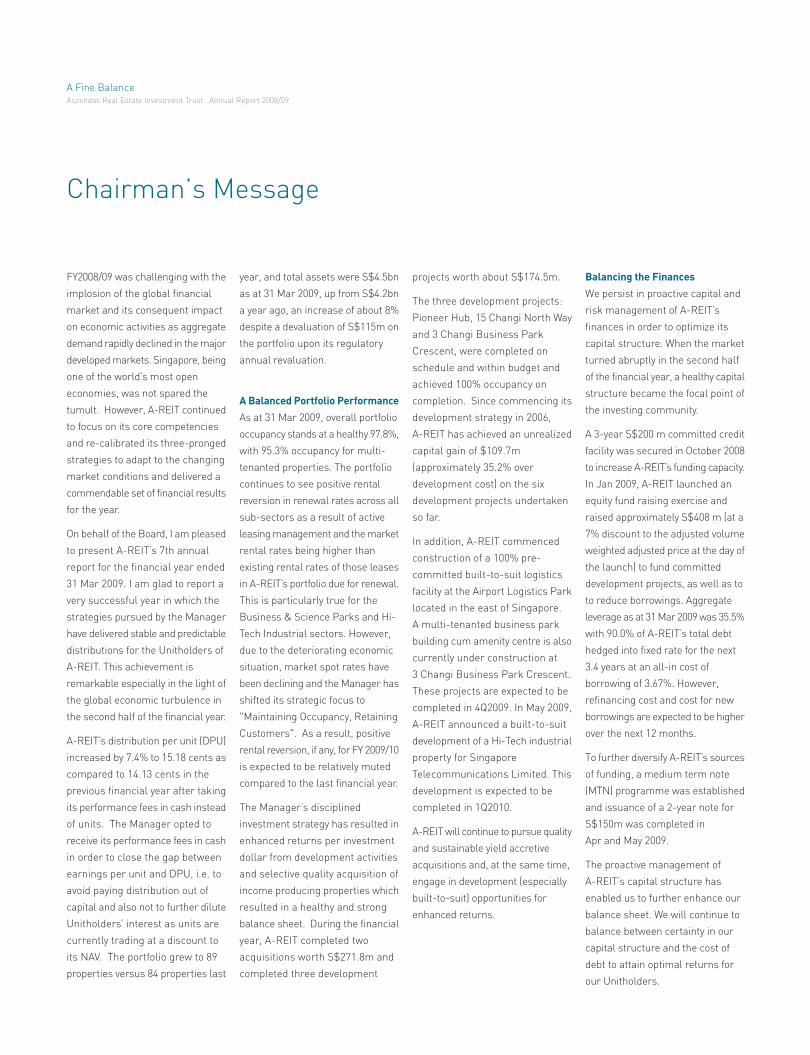
Chairman’s Message
FY2008/09 was challenging with the
implosion of the global financial
market and its consequent impact
on economic activities as aggregate
demand rapidly declined in the major
developed markets. Singapore, being
one of the world’s most open
economies, was not spared the
tumult. However, A-REIT continued
to focus on its core competencies
and re-calibrated its three-pronged
strategies to adapt to the changing
market conditions and delivered a
commendable set of financial results
for the year.
On behalf of the Board, I am pleased
to present A-REIT’s 7th annual
report for the financial year ended
31 Mar 2009. I am glad to report a
very successful year in which the
strategies pursued by the Manager
have delivered stable and predictable
distributions for the Unitholders of
A-REIT. This achievement is
remarkable especially in the light of
the global economic turbulence in
the second half of the financial year.
A-REIT’s distribution per unit (DPU)
increased by 7.4% to 15.18 cents as
compared to 14.13 cents in the
previous financial year after taking
its performance fees in cash instead
of units. The Manager opted to
receive its performance fees in cash
in order to close the gap between
earnings per unit and DPU, i.e. to
avoid paying distribution out of
capital and also not to further dilute
Unitholders’ interest as units are
currently trading at a discount to
its NAV. The portfolio grew to 89
properties versus 84 properties last
year, and total assets were S$4.5bn
as at 31 Mar 2009, up from S$4.2bn
a year ago, an increase of about 8%
despite a devaluation of S$115m on
the portfolio upon its regulatory
annual revaluation.
A Balanced Portfolio Performance
As at 31 Mar 2009, overall portfolio
occupancy stands at a healthy 97.8%,
with 95.3% occupancy for multi-
tenanted properties. The portfolio
continues to see positive rental
reversion in renewal rates across all
sub-sectors as a result of active
leasing management and the market
rental rates being higher than
existing rental rates of those leases
in A-REIT’s portfolio due for renewal.
This is particularly true for the
Business & Science Parks and Hi-
Tech Industrial sectors. However,
due to the deteriorating economic
situation, market spot rates have
been declining and the Manager has
shifted its strategic focus to
"Maintaining Occupancy, Retaining
Customers". As a result, positive
rental reversion, if any, for FY 2009/10
is expected to be relatively muted
compared to the last financial year.
The Manager’s disciplined
investment strategy has resulted in
enhanced returns per investment
dollar from development activities
and selective quality acquisition of
income producing properties which
resulted in a healthy and strong
balance sheet. During the financial
year, A-REIT completed two
acquisitions worth S$271.8m and
completed three development
projects worth about S$174.5m.
The three development projects:
Pioneer Hub, 15 Changi North Way
and 3 Changi Business Park
Crescent, were completed on
schedule and within budget and
achieved 100% occupancy on
completion. Since commencing its
development strategy in 2006,
A-REIT has achieved an unrealized
capital gain of $109.7m
(approximately 35.2% over
development cost) on the six
development projects undertaken
so far.
In addition, A-REIT commenced
construction of a 100% pre-
committed built-to-suit logistics
facility at the Airport Logistics Park
located in the east of Singapore.
A multi-tenanted business park
building cum amenity centre is also
currently under construction at
3 Changi Business Park Crescent.
These projects are expected to be
completed in 4Q2009. In May 2009,
A-REIT announced a built-to-suit
development of a Hi-Tech industrial
property for Singapore
Telecommunications Limited. This
development is expected to be
completed in 1Q2010.
A-REIT will continue to pursue quality
and sustainable yield accretive
acquisitions and, at the same time,
engage in development (especially
built-to-suit) opportunities for
enhanced returns.
Balancing the Finances
We persist in proactive capital and
risk management of A-REIT’s
finances in order to optimize its
capital structure. When the market
turned abruptly in the second half
of the financial year, a healthy capital
structure became the focal point of
the investing community.
A 3-year S$200 m committed credit
facility was secured in October 2008
to increase A-REIT’s funding capacity.
In Jan 2009, A-REIT launched an
equity fund raising exercise and
raised approximately S$408 m (at a
7% discount to the adjusted volume
weighted adjusted price at the day of
the launch) to fund committed
development projects, as well as to
to reduce borrowings. Aggregate
leverage as at 31 Mar 2009 was 35.5%
with 90.0% of A-REIT’s total debt
hedged into fixed rate for the next
3.4 years at an all-in cost of
borrowing of 3.67%. However,
refinancing cost and cost for new
borrowings are expected to be higher
over the next 12 months.
To further diversify A-REIT’s sources
of funding, a medium term note
(MTN) programme was established
and issuance of a 2-year note for
S$150m was completed in
Apr and May 2009.
The proactive management of
A-REIT’s capital structure has
enabled us to further enhance our
balance sheet. We will continue to
balance between certainty in our
capital structure and the cost of
debt to attain optimal returns for
our Unitholders.
A Fine BalanceAscendas Real Estate Investment Trust . Annual Report 2008/09
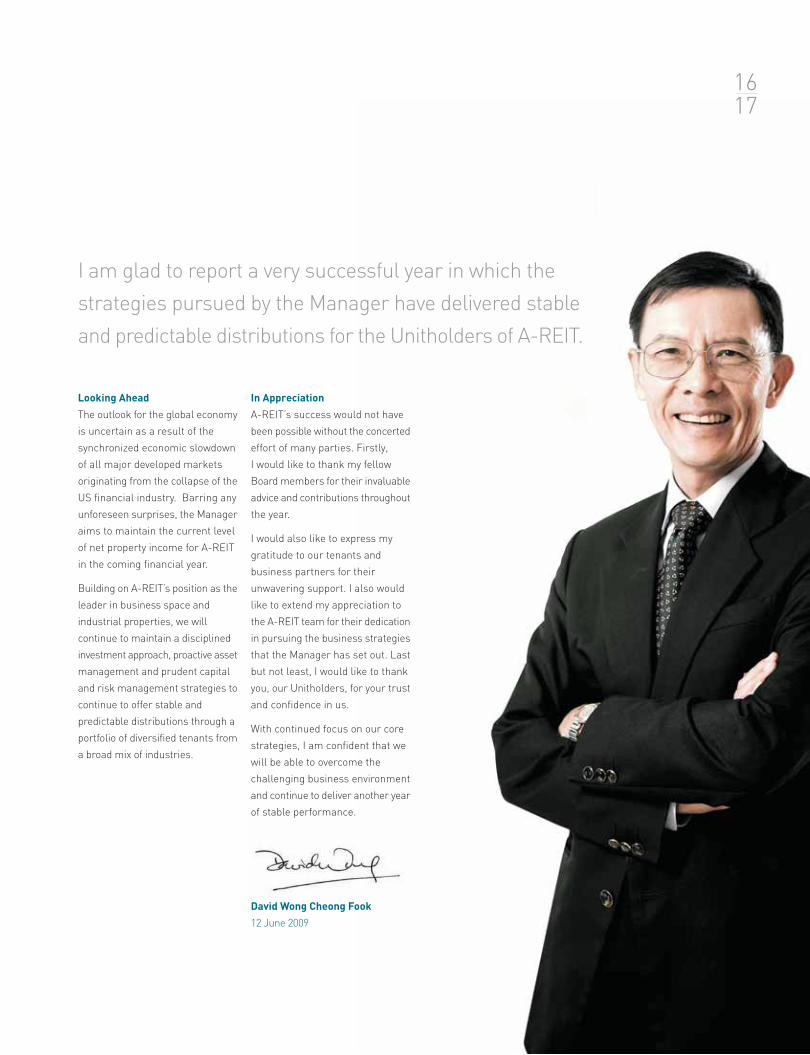
I am glad to report a very successful year in which the
strategies pursued by the Manager have delivered stable
and predictable distributions for the Unitholders of A-REIT.
1617
Looking Ahead
The outlook for the global economy
is uncertain as a result of the
synchronized economic slowdown
of all major developed markets
originating from the collapse of the
US financial industry. Barring any
unforeseen surprises, the Manager
aims to maintain the current level
of net property income for A-REIT
in the coming financial year.
Building on A-REIT’s position as the
leader in business space and
industrial properties, we will
continue to maintain a disciplined
investment approach, proactive asset
management and prudent capital
and risk management strategies to
continue to offer stable and
predictable distributions through a
portfolio of diversified tenants from
a broad mix of industries.
In Appreciation
A-REIT’s success would not have
been possible without the concerted
effort of many parties. Firstly,
I would like to thank my fellow
Board members for their invaluable
advice and contributions throughout
the year.
I would also like to express my
gratitude to our tenants and
business partners for their
unwavering support. I also would
like to extend my appreciation to
the A-REIT team for their dedication
in pursuing the business strategies
that the Manager has set out. Last
but not least, I would like to thank
you, our Unitholders, for your trust
and confidence in us.
With continued focus on our core
strategies, I am confident that we
will be able to overcome the
challenging business environment
and continue to deliver another year
of stable performance.
David Wong Cheong Fook
12 June 2009
A Fine BalanceAscendas Real Estate Investment Trust . Annual Report 2008/09
1819
Manager’s Report
Highlights
The highlights of FY 2008/09 for A-REIT are:
• Gross revenue of S$396.5m, increase of 23.0% y-o-y
• Net property income of S$296.6m, increase of 21.8% y-o-y
• Distributable income of S$210.9m, increase of 12.6% y-o-y
• Manager has opted to receive performance fees in cash instead of
Units in order to minimize the gap between earnings per Unit (”EPU”)
and distributions per Unit (”DPU”), ie to avoid paying out of capital
and to avoid diluting Unitholders as current unit price is below NAV
• Raised new equity of S$408m in 1Q 2009 to strengthen balance sheet
and fund committed development projects
• Secured new 3-year credit facility of S$200m and established an S$1
billion Medium Term Note (MTN) program to diversify sources of
funding. Maiden issue of S$150m fixed rate notes due Apr 2011 was
completed in Apr and May 2009
• 90.0% of interest rate exposure is hedged into fixed rate over an
weighted average duration of 3.4 years with an weighted average
all-in funding cost of 3.67%
• Diversified portfolio of properties with a good balance between long
and short term leases; portfolio weighted average lease to expiry is
5.1 years; 14.1% of portfolio gross rental income due for renewal in
FY2009/10
• Completed three development projects (S$174.5m) and two
acquisitions (S$271.8m)
A Fine BalanceAscendas Real Estate Investment Trust . Annual Report 2008/09
Business & Hi-Tech Light Logistics & Warehouse
Science Parks Industrial Industrial Distribution Centres Retail Facilities
FY FY FY FY FY
S$’m 08/09 07/08 08/09 07/08 08/09 07/08 08/09 07/08 08/09 07/08
Gross Revenue 103.1 62.3 106.2 94.5 78.0 72.7 96.0 79.8 13.2 12.9
Operating Expenses 28.5 16.9 36.6 32.8 16.2 15.0 16.7 12.2 1.9 1.8
Net Property Income 74.6 45.4 69.6 61.7 61.8 57.7 79.3 67.6 11.3 11.1
Net Property Income 11.4 - - - 1.5 - 3.4 - - -
-Investment in FY2008/09
Net Property Income 13.0 1.0 1.6 0.03 0.8 0.7 3.7 1.4 - -
- Investments made
in FY2007/08
Net Property Income 2.7 1.9 5.7 5.3 11.1
- Investments made
in FY2006/07
Net Property Income 41.7 59.8 51.3 60.9 -
- Properties held
> 1 year
Organic growth (%) 13.1% 10.2% 4.4% 9.1% 1.8%
50.2 68.0 59.5 72.2 11.3
Portfolio organic growth of 8.7% achieved in FY2008/09.
2021
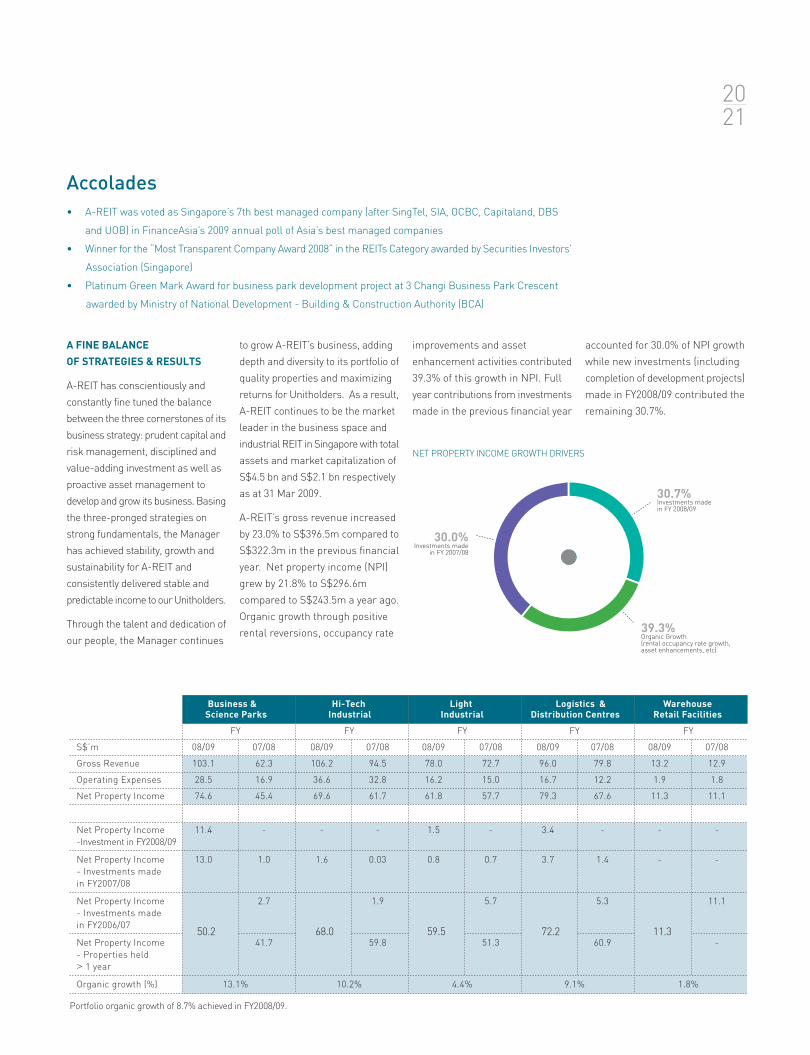
30.7%Investments madein FY 2008/09
39.3%Organic Growth(rental occupancy rate growth,asset enhancements, etc)
30.0%Investments made
in FY 2007/08
NET PROPERTY INCOME GROWTH DRIVERS
A FINE BALANCE
OF STRATEGIES & RESULTS
A-REIT has conscientiously and
constantly fine tuned the balance
between the three cornerstones of its
business strategy: prudent capital and
risk management, disciplined and
value-adding investment as well as
proactive asset management to
develop and grow its business. Basing
the three-pronged strategies on
strong fundamentals, the Manager
has achieved stability, growth and
sustainability for A-REIT and
consistently delivered stable and
predictable income to our Unitholders.
Through the talent and dedication of
our people, the Manager continues
to grow A-REIT’s business, adding
depth and diversity to its portfolio of
quality properties and maximizing
returns for Unitholders. As a result,
A-REIT continues to be the market
leader in the business space and
industrial REIT in Singapore with total
assets and market capitalization of
S$4.5 bn and S$2.1 bn respectively
as at 31 Mar 2009.
A-REIT’s gross revenue increased
by 23.0% to S$396.5m compared to
S$322.3m in the previous financial
year. Net property income (NPI)
grew by 21.8% to S$296.6m
compared to S$243.5m a year ago.
Organic growth through positive
rental reversions, occupancy rate
Accolades
• A-REIT was voted as Singapore’s 7th best managed company (after SingTel, SIA, OCBC, Capitaland, DBS
and UOB) in FinanceAsia’s 2009 annual poll of Asia’s best managed companies
• Winner for the “Most Transparent Company Award 2008” in the REITs Category awarded by Securities Investors’
Association (Singapore)
• Platinum Green Mark Award for business park development project at 3 Changi Business Park Crescent
awarded by Ministry of National Development - Building & Construction Authority (BCA)
improvements and asset
enhancement activities contributed
39.3% of this growth in NPI. Full
year contributions from investments
made in the previous financial year
accounted for 30.0% of NPI growth
while new investments (including
completion of development projects)
made in FY2008/09 contributed the
remaining 30.7%.
Manager’s Report
April 08 May 08 Jun 08 Jul 08 Aug 08 Sep 08 Oct 08 Nov 08 Dec 08 Jan 09 Feb 09 Mar 09
140
120
100
80
60
40
20
0
-20
A-REIT
AMB Property
Prologis
Goodman Group
Brixton PLC
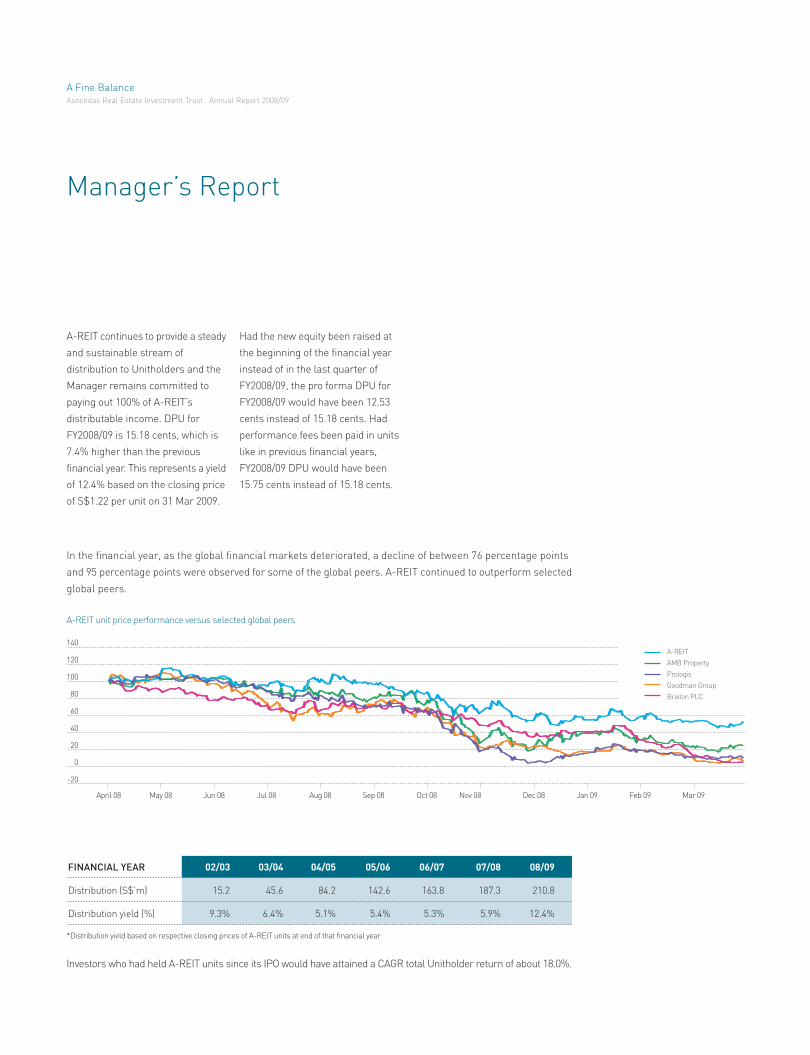
A-REIT unit price performance versus selected global peers
In the financial year, as the global financial markets deteriorated, a decline of between 76 percentage points
and 95 percentage points were observed for some of the global peers. A-REIT continued to outperform selected
global peers.
FINANCIAL YEAR 02/03 03/04 04/05 05/06 06/07 07/08 08/09
Distribution (S$’m) 15.2 45.6 84.2 142.6 163.8 187.3 210.8
Distribution yield (%) 9.3% 6.4% 5.1% 5.4% 5.3% 5.9% 12.4%
Investors who had held A-REIT units since its IPO would have attained a CAGR total Unitholder return of about 18.0%.
A-REIT continues to provide a steady
and sustainable stream of
distribution to Unitholders and the
Manager remains committed to
paying out 100% of A-REIT’s
distributable income. DPU for
FY2008/09 is 15.18 cents, which is
7.4% higher than the previous
financial year. This represents a yield
of 12.4% based on the closing price
of S$1.22 per unit on 31 Mar 2009.
Had the new equity been raised at
the beginning of the financial year
instead of in the last quarter of
FY2008/09, the pro forma DPU for
FY2008/09 would have been 12.53
cents instead of 15.18 cents. Had
performance fees been paid in units
like in previous financial years,
FY2008/09 DPU would have been
15.75 cents instead of 15.18 cents.
*Distribution yield based on respective closing prices of A-REIT units at end of that financial year
A Fine BalanceAscendas Real Estate Investment Trust . Annual Report 2008/09
DEBT MATURITY PROFILE
AS AT 31 MAR 2009 (S$m)
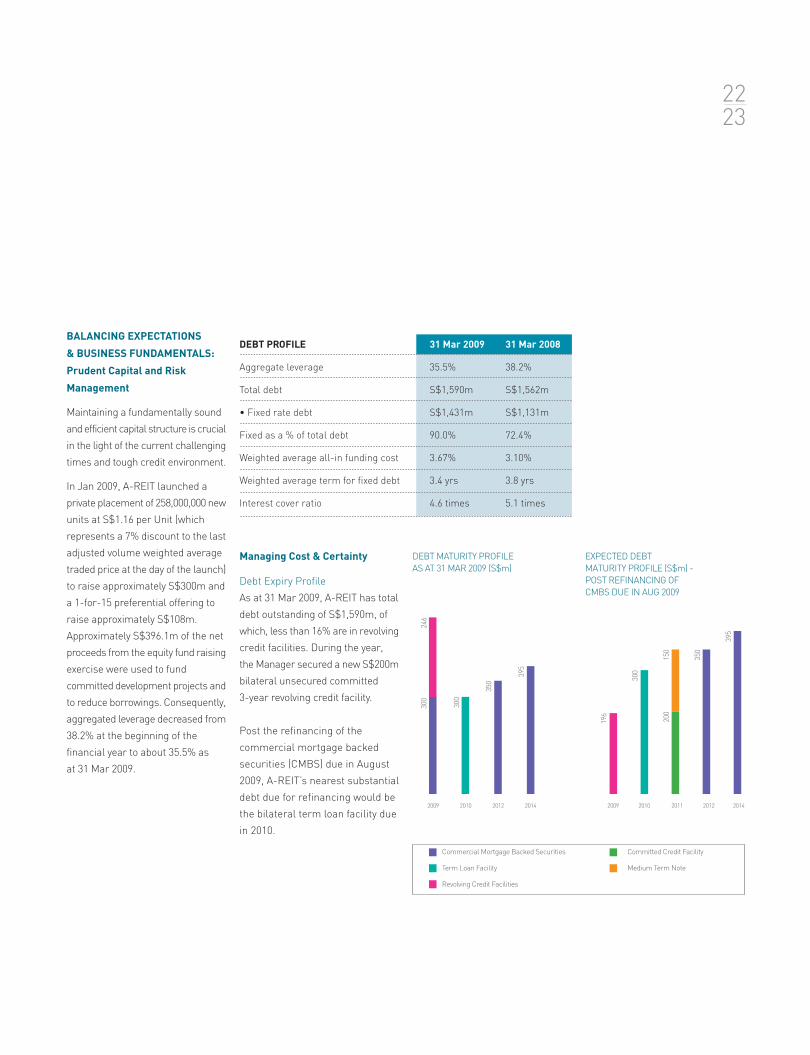
BALANCING EXPECTATIONS
& BUSINESS FUNDAMENTALS:
Prudent Capital and Risk
Management
Maintaining a fundamentally sound
and efficient capital structure is crucial
in the light of the current challenging
times and tough credit environment.
In Jan 2009, A-REIT launched a
private placement of 258,000,000 new
units at S$1.16 per Unit (which
represents a 7% discount to the last
adjusted volume weighted average
traded price at the day of the launch)
to raise approximately S$300m and
a 1-for-15 preferential offering to
raise approximately S$108m.
Approximately S$396.1m of the net
proceeds from the equity fund raising
exercise were used to fund
committed development projects and
to reduce borrowings. Consequently,
aggregated leverage decreased from
38.2% at the beginning of the
financial year to about 35.5% as
at 31 Mar 2009.
Managing Cost & Certainty
Debt Expiry Profile
As at 31 Mar 2009, A-REIT has total
debt outstanding of S$1,590m, of
which, less than 16% are in revolving
credit facilities. During the year,
the Manager secured a new S$200m
bilateral unsecured committed
3-year revolving credit facility.
Post the refinancing of the
commercial mortgage backed
securities (CMBS) due in August
2009, A-REIT’s nearest substantial
debt due for refinancing would be
the bilateral term loan facility due
in 2010.
EXPECTED DEBT
MATURITY PROFILE (S$m) -
POST REFINANCING OF
CMBS DUE IN AUG 2009
2014201220102009
300
300
350
395
246
2009 2010 2011 2012 2014
Commercial Mortgage Backed Securities
Term Loan Facility
Revolving Credit Facilities
196
300
150
350
395
200
DEBT PROFILE 31 Mar 2009 31 Mar 2008
Aggregate leverage 35.5% 38.2%
Total debt S$1,590m S$1,562m
• Fixed rate debt S$1,431m S$1,131m
Fixed as a % of total debt 90.0% 72.4%
Weighted average all-in funding cost 3.67% 3.10%
Weighted average term for fixed debt 3.4 yrs 3.8 yrs
Interest cover ratio 4.6 times 5.1 times
2223
Committed Credit Facility
Medium Term Note
Liquidity Risk
To address the tight credit market
environment, the Manager has
diversified A-REIT’s sources of debt
funding by establishing an S$1bn
multi-currency Medium Term Note
(”MTN”) program on 20 Mar 2009.
The issues of 2-year fixed rate
notes for S$150m was completed
in April and May 2009. The Manager
will continue to explore various
funding options and tenure whilst
balancing them with an acceptable
cost of interest to ensure a
sustainable stream of distributions
to Unitholders.
Interest Rate Risk
Adopting a prudent stance on
interest rate exposure management,
the Manager has established a policy
to hedge at least 50% of A-REIT’s
interest rate risk exposure using
interest rate swaps. As of
31 Mar 2009, A-REIT maintained
about 90% of its interest rate
exposure in fixed rates over a
weighted average duration of 3.4
years. The overall portfolio weighted
average cost of borrowings is 3.67%.
The overall portfolio weighted
average cost of borrowings is
expected to increase to about 4%
post refinancing of the CMBS due
in Aug 2009 as cost of new
borrowings is expected to be higher.
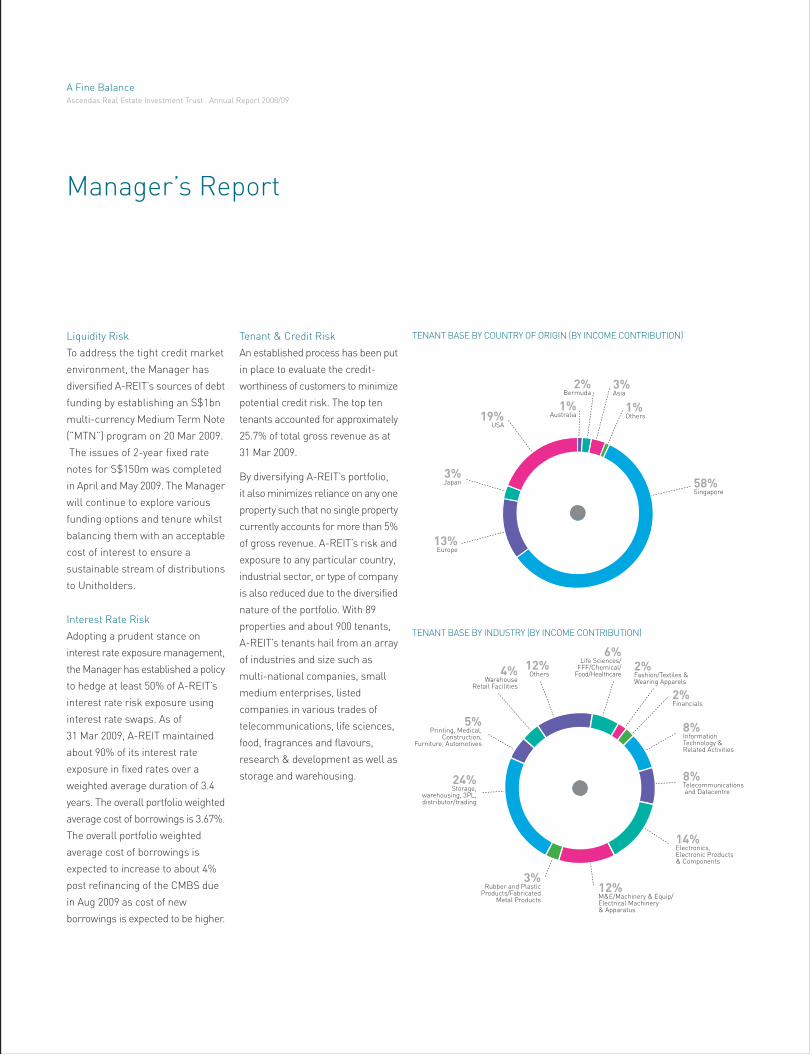
Tenant & Credit Risk
An established process has been put
in place to evaluate the credit-
worthiness of customers to minimize
potential credit risk. The top ten
tenants accounted for approximately
25.7% of total gross revenue as at
31 Mar 2009.
By diversifying A-REIT’s portfolio,
it also minimizes reliance on any one
property such that no single property
currently accounts for more than 5%
of gross revenue. A-REIT’s risk and
exposure to any particular country,
industrial sector, or type of company
is also reduced due to the diversified
nature of the portfolio. With 89
properties and about 900 tenants,
A-REIT’s tenants hail from an array
of industries and size such as
multi-national companies, small
medium enterprises, listed
companies in various trades of
telecommunications, life sciences,
food, fragrances and flavours,
research & development as well as
storage and warehousing.
19%USA
1%Australia
2%Bermuda
3%Asia
1%Others
58%Singapore
13%Europe
3%Japan
TENANT BASE BY COUNTRY OF ORIGIN (BY INCOME CONTRIBUTION)
TENANT BASE BY INDUSTRY (BY INCOME CONTRIBUTION)
12%Others
6%Life Sciences/
FFF/Chemical/Food/Healthcare
2%Fashion/Textiles &Wearing Apparels
2%Financials
8%InformationTechnology &Related Activities
8%Telecommunications and Datacentre
14%Electronics,Electronic Products& Components
12%M&E/Machinery & Equip/Electrical Machinery& Apparatus
3%Rubber and Plastic
Products/FabricatedMetal Products
24%Storage,
warehousing, 3PL,distributor/trading
5%Printing, Medical,
Construction,Furniture, Automotives
4%Warehouse
Retail Facilities
Manager’s Report
A Fine BalanceAscendas Real Estate Investment Trust . Annual Report 2008/09
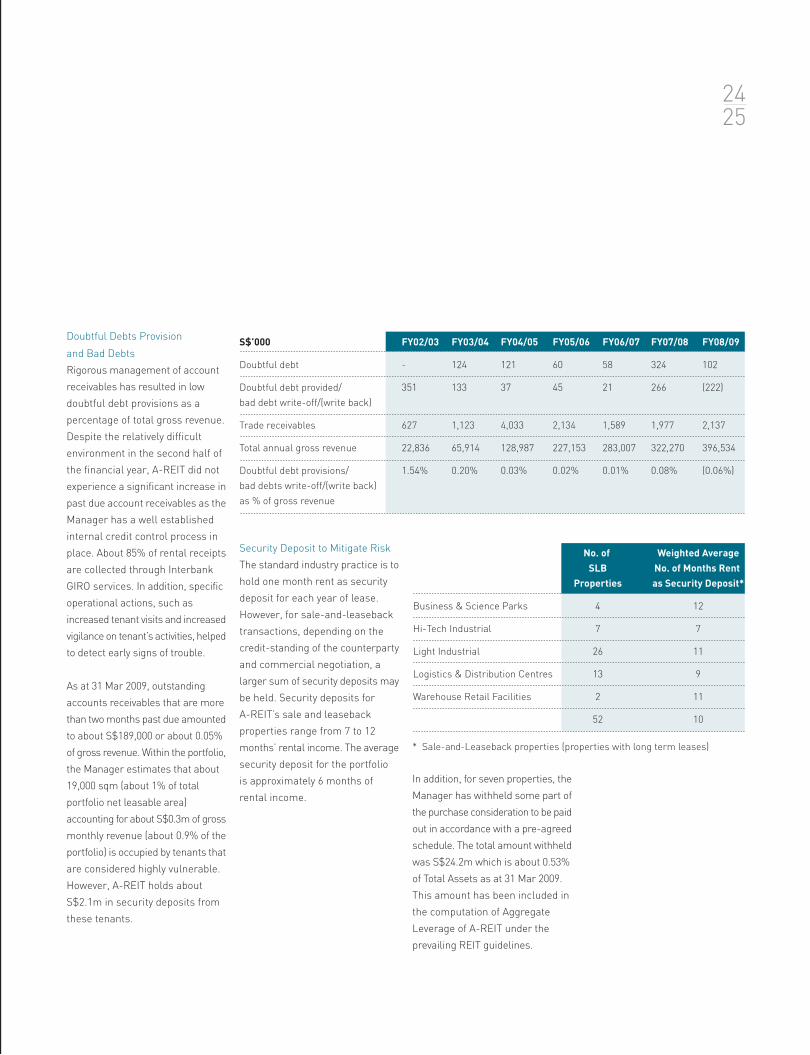
Doubtful Debts Provision
and Bad Debts
Rigorous management of account
receivables has resulted in low
doubtful debt provisions as a
percentage of total gross revenue.
Despite the relatively difficult
environment in the second half of
the financial year, A-REIT did not
experience a significant increase in
past due account receivables as the
Manager has a well established
internal credit control process in
place. About 85% of rental receipts
are collected through Interbank
GIRO services. In addition, specific
operational actions, such as
increased tenant visits and increased
vigilance on tenant’s activities, helped
to detect early signs of trouble.
As at 31 Mar 2009, outstanding
accounts receivables that are more
than two months past due amounted
to about S$189,000 or about 0.05%
of gross revenue. Within the portfolio,
the Manager estimates that about
19,000 sqm (about 1% of total
portfolio net leasable area)
accounting for about S$0.3m of gross
monthly revenue (about 0.9% of the
portfolio) is occupied by tenants that
are considered highly vulnerable.
However, A-REIT holds about
S$2.1m in security deposits from
these tenants.
S$’000 FY02/03 FY03/04 FY04/05 FY05/06 FY06/07 FY07/08 FY08/09
Doubtful debt - 124 121 60 58 324 102
Doubtful debt provided/ 351 133 37 45 21 266 (222)
bad debt write-off/(write back)
Trade receivables 627 1,123 4,033 2,134 1,589 1,977 2,137
Total annual gross revenue 22,836 65,914 128,987 227,153 283,007 322,270 396,534
Doubtful debt provisions/ 1.54% 0.20% 0.03% 0.02% 0.01% 0.08% (0.06%)
bad debts write-off/(write back)
as % of gross revenue
Security Deposit to Mitigate Risk
The standard industry practice is to
hold one month rent as security
deposit for each year of lease.
However, for sale-and-leaseback
transactions, depending on the
credit-standing of the counterparty
and commercial negotiation, a
larger sum of security deposits may
be held. Security deposits for
A-REIT’s sale and leaseback
properties range from 7 to 12
months’ rental income. The average
security deposit for the portfolio
is approximately 6 months of
rental income.
No. of Weighted Average
SLB No. of Months Rent
Properties as Security Deposit*
Business & Science Parks 4 12
Hi-Tech Industrial 7 7
Light Industrial 26 11
Logistics & Distribution Centres 13 9
Warehouse Retail Facilities 2 11
52 10
* Sale-and-Leaseback properties (properties with long term leases)
In addition, for seven properties, the
Manager has withheld some part of
the purchase consideration to be paid
out in accordance with a pre-agreed
schedule. The total amount withheld
was S$24.2m which is about 0.53%
of Total Assets as at 31 Mar 2009.
This amount has been included in
the computation of Aggregate
Leverage of A-REIT under the
prevailing REIT guidelines.
2425
Manager’s Report
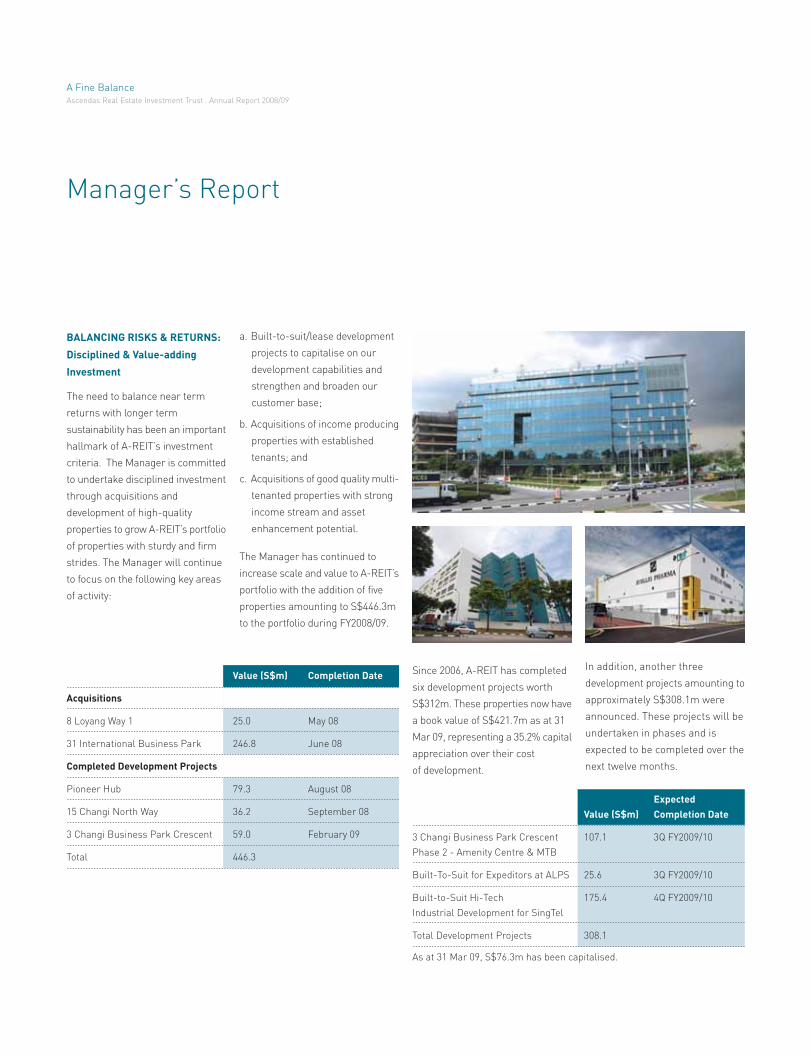
BALANCING RISKS & RETURNS:
Disciplined & Value-adding
Investment
The need to balance near term
returns with longer term
sustainability has been an important
hallmark of A-REIT’s investment
criteria. The Manager is committed
to undertake disciplined investment
through acquisitions and
development of high-quality
properties to grow A-REIT’s portfolio
of properties with sturdy and firm
strides. The Manager will continue
to focus on the following key areas
of activity:
Value (S$m) Completion Date
Acquisitions
8 Loyang Way 1 25.0 May 08
31 International Business Park 246.8 June 08
Completed Development Projects
Pioneer Hub 79.3 August 08
15 Changi North Way 36.2 September 08
3 Changi Business Park Crescent 59.0 February 09
Total 446.3
a. Built-to-suit/lease development
projects to capitalise on our
development capabilities and
strengthen and broaden our
customer base;
b. Acquisitions of income producing
properties with established
tenants; and
c. Acquisitions of good quality multi-
tenanted properties with strong
income stream and asset
enhancement potential.
The Manager has continued to
increase scale and value to A-REIT’s
portfolio with the addition of five
properties amounting to S$446.3m
to the portfolio during FY2008/09.
Since 2006, A-REIT has completed
six development projects worth
S$312m. These properties now have
a book value of S$421.7m as at 31
Mar 09, representing a 35.2% capital
appreciation over their cost
of development.
In addition, another three
development projects amounting to
approximately S$308.1m were
announced. These projects will be
undertaken in phases and is
expected to be completed over the
next twelve months.
Expected
Value (S$m) Completion Date
3 Changi Business Park Crescent 107.1 3Q FY2009/10
Phase 2 - Amenity Centre & MTB
Built-To-Suit for Expeditors at ALPS 25.6 3Q FY2009/10
Built-to-Suit Hi-Tech 175.4 4Q FY2009/10
Industrial Development for SingTel
Total Development Projects 308.1
As at 31 Mar 09, S$76.3m has been capitalised.
A Fine BalanceAscendas Real Estate Investment Trust . Annual Report 2008/09
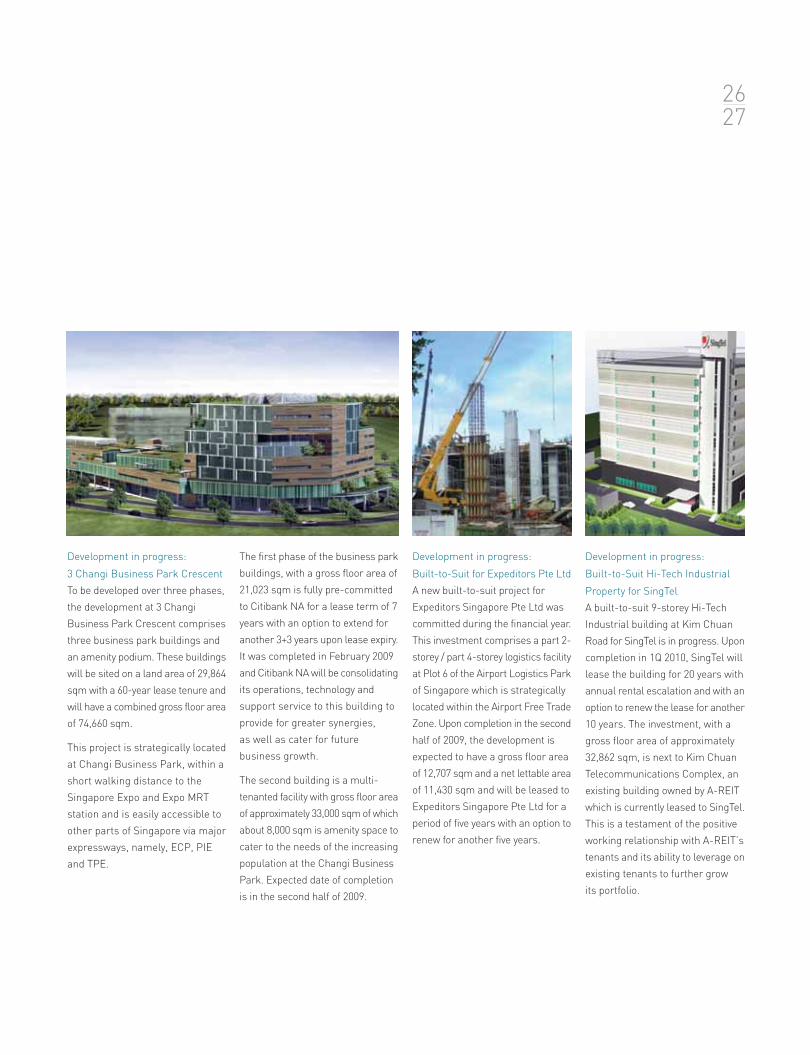
Development in progress:
3 Changi Business Park Crescent
To be developed over three phases,
the development at 3 Changi
Business Park Crescent comprises
three business park buildings and
an amenity podium. These buildings
will be sited on a land area of 29,864
sqm with a 60-year lease tenure and
will have a combined gross floor area
of 74,660 sqm.
This project is strategically located
at Changi Business Park, within a
short walking distance to the
Singapore Expo and Expo MRT
station and is easily accessible to
other parts of Singapore via major
expressways, namely, ECP, PIE
and TPE.
The first phase of the business park
buildings, with a gross floor area of
21,023 sqm is fully pre-committed
to Citibank NA for a lease term of 7
years with an option to extend for
another 3+3 years upon lease expiry.
It was completed in February 2009
and Citibank NA will be consolidating
its operations, technology and
support service to this building to
provide for greater synergies,
as well as cater for future
business growth.
The second building is a multi-
tenanted facility with gross floor area
of approximately 33,000 sqm of which
about 8,000 sqm is amenity space to
cater to the needs of the increasing
population at the Changi Business
Park. Expected date of completion
is in the second half of 2009.
Development in progress:
Built-to-Suit for Expeditors Pte Ltd
A new built-to-suit project for
Expeditors Singapore Pte Ltd was
committed during the financial year.
This investment comprises a part 2-
storey / part 4-storey logistics facility
at Plot 6 of the Airport Logistics Park
of Singapore which is strategically
located within the Airport Free Trade
Zone. Upon completion in the second
half of 2009, the development is
expected to have a gross floor area
of 12,707 sqm and a net lettable area
of 11,430 sqm and will be leased to
Expeditors Singapore Pte Ltd for a
period of five years with an option to
renew for another five years.
Development in progress:
Built-to-Suit Hi-Tech Industrial
Property for SingTel
A built-to-suit 9-storey Hi-Tech
Industrial building at Kim Chuan
Road for SingTel is in progress. Upon
completion in 1Q 2010, SingTel will
lease the building for 20 years with
annual rental escalation and with an
option to renew the lease for another
10 years. The investment, with a
gross floor area of approximately
32,862 sqm, is next to Kim Chuan
Telecommunications Complex, an
existing building owned by A-REIT
which is currently leased to SingTel.
This is a testament of the positive
working relationship with A-REIT’s
tenants and its ability to leverage on
existing tenants to further grow
its portfolio.
2627
Manager’s Report
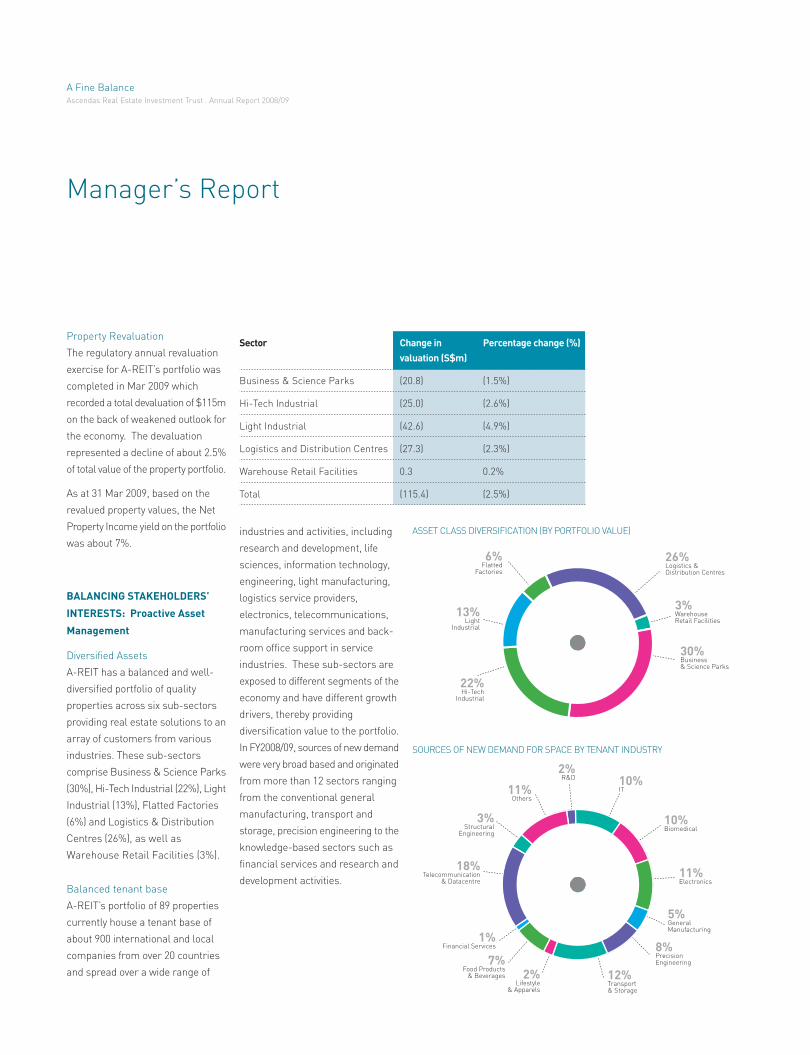
Property Revaluation
The regulatory annual revaluation
exercise for A-REIT’s portfolio was
completed in Mar 2009 which
recorded a total devaluation of $115m
on the back of weakened outlook for
the economy. The devaluation
represented a decline of about 2.5%
of total value of the property portfolio.
As at 31 Mar 2009, based on the
revalued property values, the Net
Property Income yield on the portfolio
was about 7%.
BALANCING STAKEHOLDERS’
INTERESTS: Proactive Asset
Management
Diversified Assets
A-REIT has a balanced and well-
diversified portfolio of quality
properties across six sub-sectors
providing real estate solutions to an
array of customers from various
industries. These sub-sectors
comprise Business & Science Parks
(30%), Hi-Tech Industrial (22%), Light
Industrial (13%), Flatted Factories
(6%) and Logistics & Distribution
Centres (26%), as well as
Warehouse Retail Facilities (3%).
Balanced tenant base
A-REIT’s portfolio of 89 properties
currently house a tenant base of
about 900 international and local
companies from over 20 countries
and spread over a wide range of
Sector Change in Percentage change (%)
valuation (S$m)
Business & Science Parks (20.8) (1.5%)
Hi-Tech Industrial (25.0) (2.6%)
Light Industrial (42.6) (4.9%)
Logistics and Distribution Centres (27.3) (2.3%)
Warehouse Retail Facilities 0.3 0.2%
Total (115.4) (2.5%)
industries and activities, including
research and development, life
sciences, information technology,
engineering, light manufacturing,
logistics service providers,
electronics, telecommunications,
manufacturing services and back-
room office support in service
industries. These sub-sectors are
exposed to different segments of the
economy and have different growth
drivers, thereby providing
diversification value to the portfolio.
In FY2008/09, sources of new demand
were very broad based and originated
from more than 12 sectors ranging
from the conventional general
manufacturing, transport and
storage, precision engineering to the
knowledge-based sectors such as
financial services and research and
development activities.
ASSET CLASS DIVERSIFICATION (BY PORTFOLIO VALUE)
SOURCES OF NEW DEMAND FOR SPACE BY TENANT INDUSTRY
3%Structural
Engineering
11%Others
2%R&D 10%
IT
10%Biomedical
11%Electronics
5%GeneralManufacturing
8%PrecisionEngineering
12%Transport& Storage
2%Lifestyle
& Apparels
7%Food Products
& Beverages
1%Financial Services
18%Telecommunication
& Datacentre
3%WarehouseRetail Facilities
13%Light
Industrial
30%Business& Science Parks
22%Hi-Tech
Industrial
6%Flatted
Factories
26%Logistics &Distribution Centres
A Fine BalanceAscendas Real Estate Investment Trust . Annual Report 2008/09
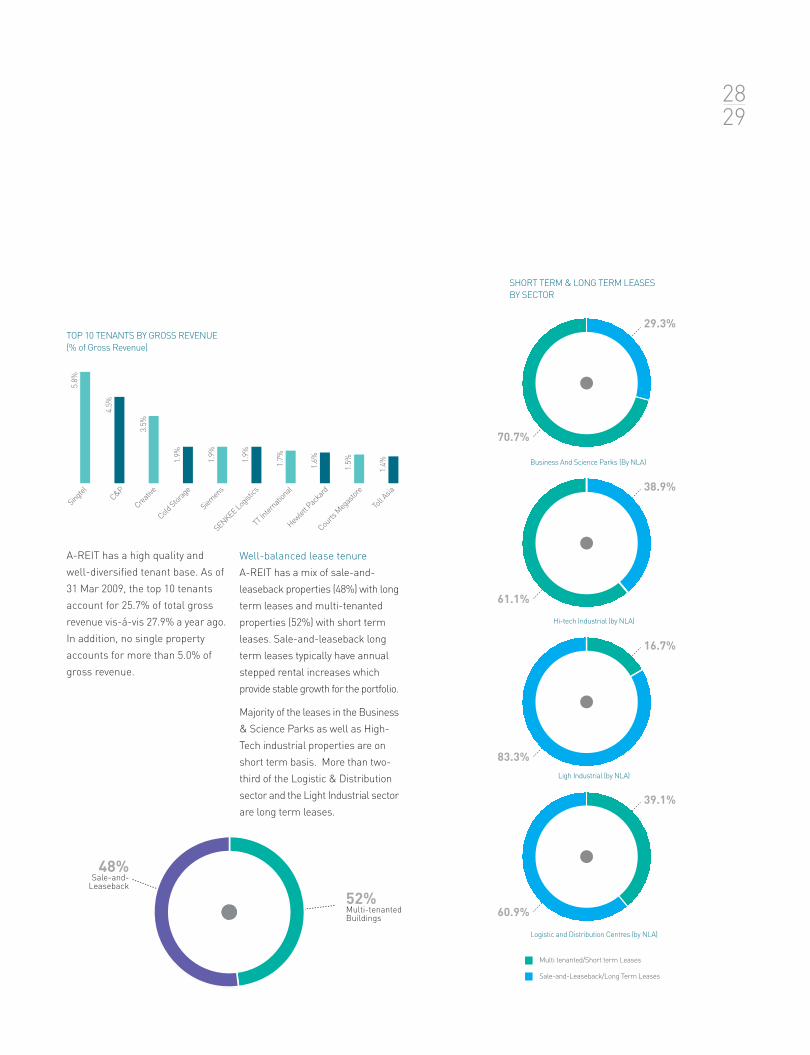
29.3%
70.7%
Business And Science Parks (By NLA)
SHORT TERM & LONG TERM LEASES
BY SECTOR
Multi tenanted/Short term Leases
Sale-and-Leaseback/Long Term Leases
A-REIT has a high quality and
well-diversified tenant base. As of
31 Mar 2009, the top 10 tenants
account for 25.7% of total gross
revenue vis-á-vis 27.9% a year ago.
In addition, no single property
accounts for more than 5.0% of
gross revenue.
Well-balanced lease tenure
A-REIT has a mix of sale-and-
leaseback properties (48%) with long
term leases and multi-tenanted
properties (52%) with short term
leases. Sale-and-leaseback long
term leases typically have annual
stepped rental increases which
provide stable growth for the portfolio.
Majority of the leases in the Business
& Science Parks as well as High-
Tech industrial properties are on
short term basis. More than two-
third of the Logistic & Distribution
sector and the Light Industrial sector
are long term leases.
Singt
el
TOP 10 TENANTS BY GROSS REVENUE
(% of Gross Revenue)
5.8
%
C&P
Creat
ive
Cold
Stora
ge
Siem
ens
SENKEE L
ogist
ics
TT In
tern
ationa
l
Hewle
tt Pac
kard
Courts M
egas
tore
Toll
Asia
4.5
%
3.5
%
1.9
%
1.9
%
1.9
%
1.7
%
1.6
%
1.5
%
1.4
%
48%Sale-and-
Leaseback
52%Multi-tenantedBuildings
2829
38.9%
61.1%
Hi-tech Industrial (by NLA)
16.7%
83.3%
Ligh Industrial (by NLA)
39.1%
60.9%
Logistic and Distribution Centres (by NLA)
Manager’s Report
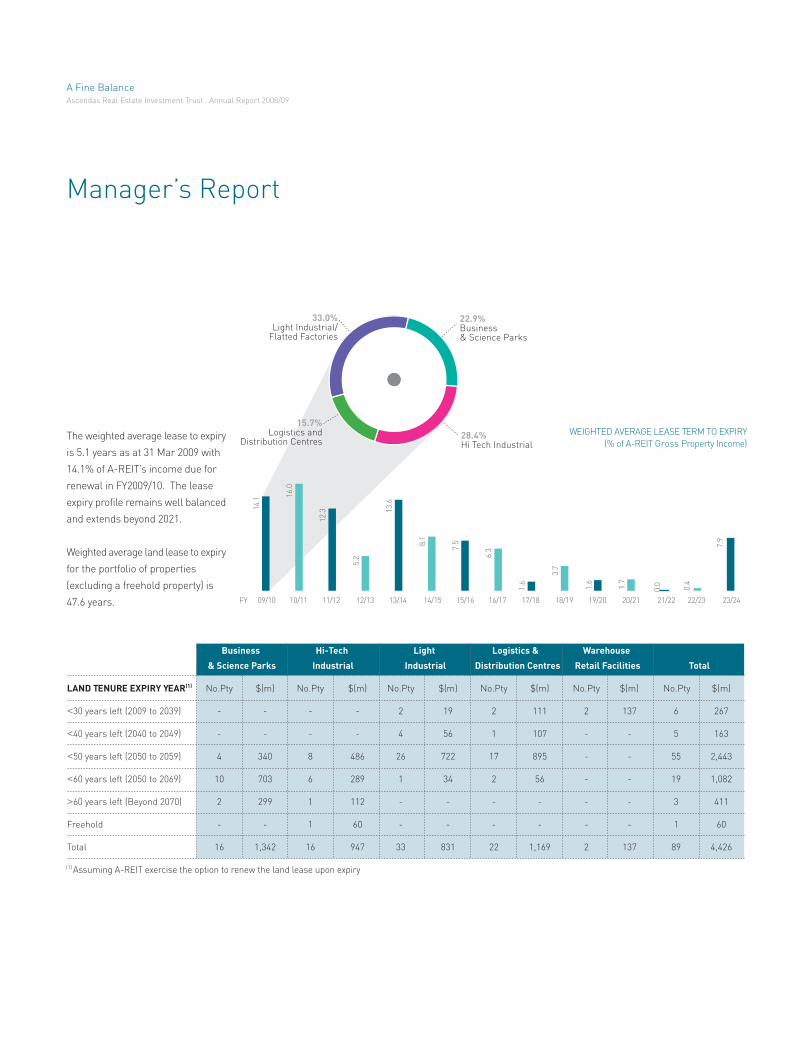
The weighted average lease to expiry
is 5.1 years as at 31 Mar 2009 with
14.1% of A-REIT’s income due for
renewal in FY2009/10. The lease
expiry profile remains well balanced
and extends beyond 2021.
Weighted average land lease to expiry
for the portfolio of properties
(excluding a freehold property) is
47.6 years.
Business Hi-Tech Light Logistics & Warehouse
& Science Parks Industrial Industrial Distribution Centres Retail Facilities Total
LAND TENURE EXPIRY YEAR(1) No.Pty $(m) No.Pty $(m) No.Pty $(m) No.Pty $(m) No.Pty $(m) No.Pty $(m)
<30 years left (2009 to 2039) - - - - 2 19 2 111 2 137 6 267
<40 years left (2040 to 2049) - - - - 4 56 1 107 - - 5 163
<50 years left (2050 to 2059) 4 340 8 486 26 722 17 895 - - 55 2,443
<60 years left (2050 to 2069) 10 703 6 289 1 34 2 56 - - 19 1,082
>60 years left (Beyond 2070) 2 299 1 112 - - - - - - 3 411
Freehold - - 1 60 - - - - - - 1 60
Total 16 1,342 16 947 33 831 22 1,169 2 137 89 4,426
(1) Assuming A-REIT exercise the option to renew the land lease upon expiry
WEIGHTED AVERAGE LEASE TERM TO EXPIRY
(% of A-REIT Gross Property Income)
FY 09/10 10/11 11/12 12/13 13/14 14/15 15/16 16/17 17/18 18/19 19/20 20/21 21/22 22/23 23/24
14.1
16.0
12.3
5.2
13.6
8.1
7.5
6.3
1.6
3.7
1.6 1.7
0.0 0.4
7.9
22.9%Business& Science Parks
28.4%Hi Tech Industrial
33.0%Light Industrial/
Flatted Factories
15.7%Logistics and
Distribution Centres
A Fine BalanceAscendas Real Estate Investment Trust . Annual Report 2008/09
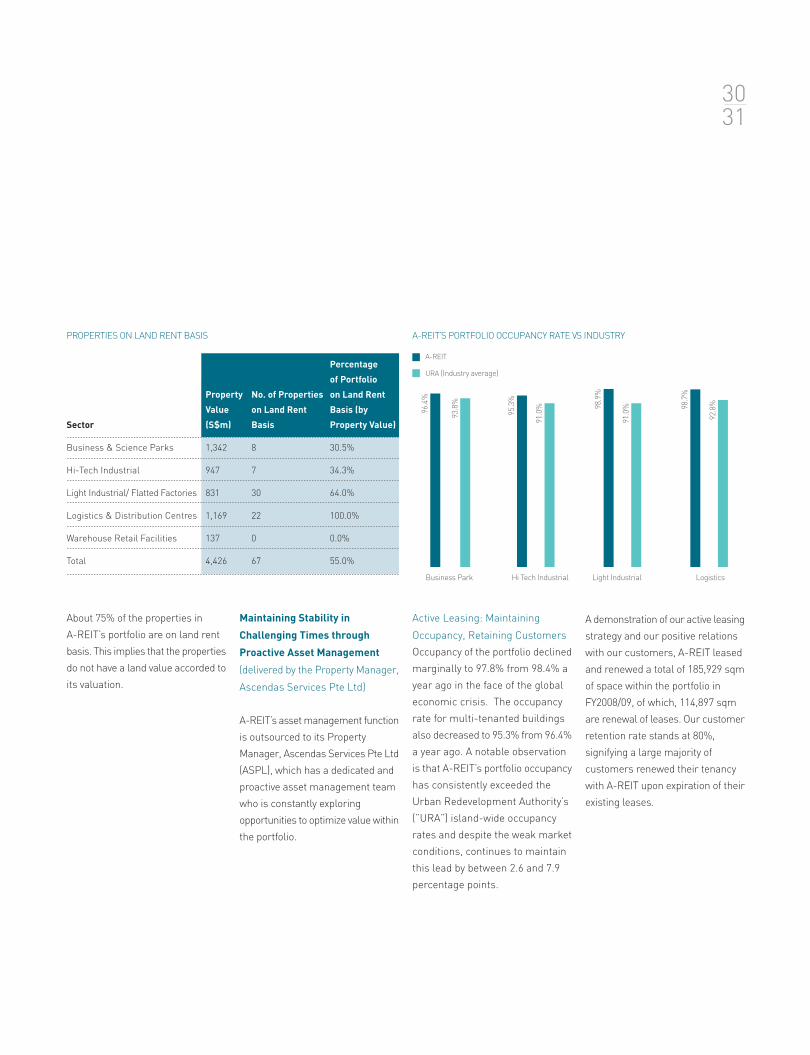
About 75% of the properties in
A-REIT’s portfolio are on land rent
basis. This implies that the properties
do not have a land value accorded to
its valuation.
Maintaining Stability in
Challenging Times through
Proactive Asset Management
(delivered by the Property Manager,
Ascendas Services Pte Ltd)
A-REIT’s asset management function
is outsourced to its Property
Manager, Ascendas Services Pte Ltd
(ASPL), which has a dedicated and
proactive asset management team
who is constantly exploring
opportunities to optimize value within
the portfolio.
A demonstration of our active leasing
strategy and our positive relations
with our customers, A-REIT leased
and renewed a total of 185,929 sqm
of space within the portfolio in
FY2008/09, of which, 114,897 sqm
are renewal of leases. Our customer
retention rate stands at 80%,
signifying a large majority of
customers renewed their tenancy
with A-REIT upon expiration of their
existing leases.
PROPERTIES ON LAND RENT BASIS A-REIT’S PORTFOLIO OCCUPANCY RATE VS INDUSTRY
Active Leasing: Maintaining
Occupancy, Retaining Customers
Occupancy of the portfolio declined
marginally to 97.8% from 98.4% a
year ago in the face of the global
economic crisis. The occupancy
rate for multi-tenanted buildings
also decreased to 95.3% from 96.4%
a year ago. A notable observation
is that A-REIT’s portfolio occupancy
has consistently exceeded the
Urban Redevelopment Authority’s
(”URA”) island-wide occupancy
rates and despite the weak market
conditions, continues to maintain
this lead by between 2.6 and 7.9
percentage points.
96.4
%
93.8
%
95.3
%
91.0
% 98.9
%
91.0
% 98.7
%
92.8
%
Business Park Hi Tech Industrial Light Industrial Logistics
A-REIT
URA (Industry average)
3031
Percentage
of Portfolio
Property No. of Properties on Land Rent
Value on Land Rent Basis (by
Sector (S$m) Basis Property Value)
Business & Science Parks 1,342 8 30.5%
Hi-Tech Industrial 947 7 34.3%
Light Industrial/ Flatted Factories 831 30 64.0%
Logistics & Distribution Centres 1,169 22 100.0%
Warehouse Retail Facilities 137 0 0.0%
Total 4,426 67 55.0%
Manager’s Report
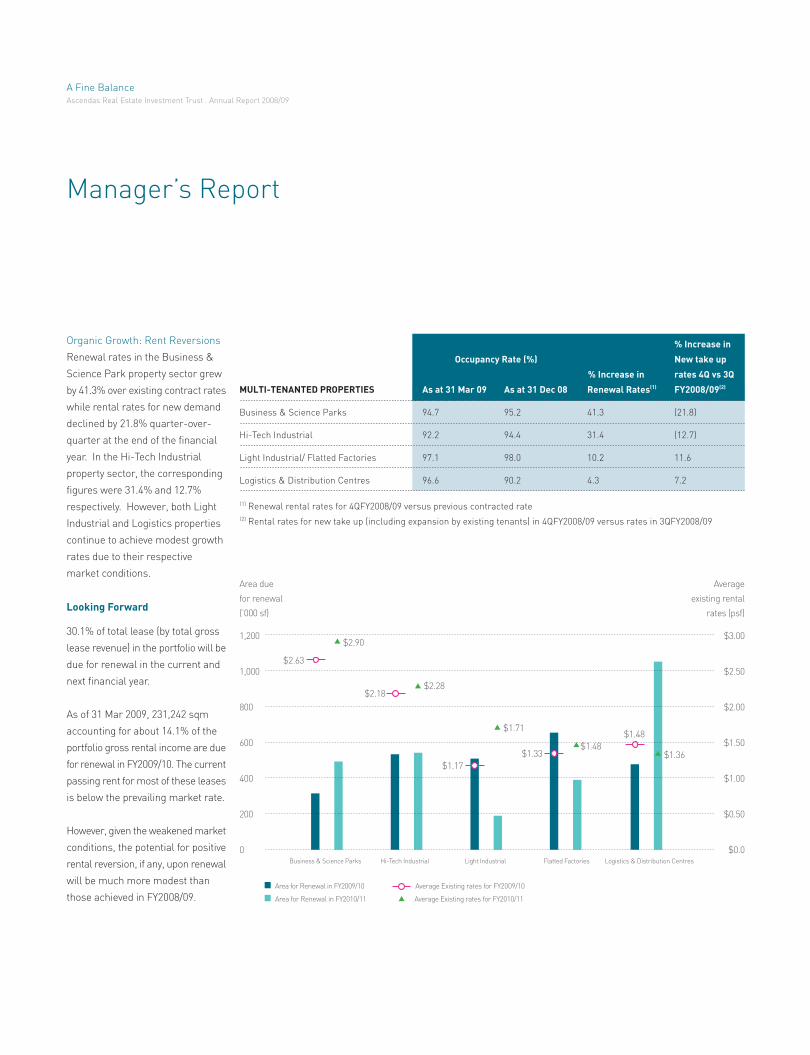
Organic Growth: Rent Reversions
Renewal rates in the Business &
Science Park property sector grew
by 41.3% over existing contract rates
while rental rates for new demand
declined by 21.8% quarter-over-
quarter at the end of the financial
year. In the Hi-Tech Industrial
property sector, the corresponding
figures were 31.4% and 12.7%
respectively. However, both Light
Industrial and Logistics properties
continue to achieve modest growth
rates due to their respective
market conditions.
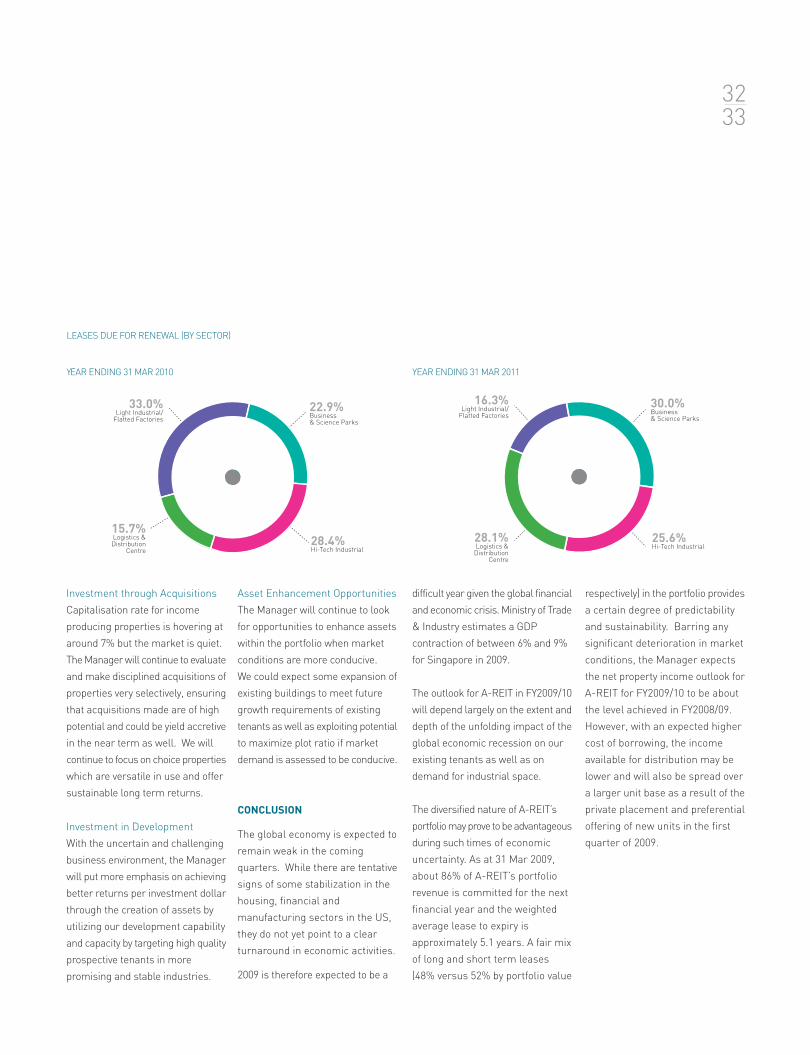
Looking Forward
30.1% of total lease (by total gross
lease revenue) in the portfolio will be
due for renewal in the current and
next financial year.
As of 31 Mar 2009, 231,242 sqm
accounting for about 14.1% of the
portfolio gross rental income are due
for renewal in FY2009/10. The current
passing rent for most of these leases
is below the prevailing market rate.
However, given the weakened market
conditions, the potential for positive
rental reversion, if any, upon renewal
will be much more modest than
those achieved in FY2008/09.
% Increase in
Occupancy Rate (%) New take up
% Increase in rates 4Q vs 3Q
MULTI-TENANTED PROPERTIES As at 31 Mar 09 As at 31 Dec 08 Renewal Rates(1) FY2008/09(2)
Business & Science Parks 94.7 95.2 41.3 (21.8)
Hi-Tech Industrial 92.2 94.4 31.4 (12.7)
Light Industrial/ Flatted Factories 97.1 98.0 10.2 11.6
Logistics & Distribution Centres 96.6 90.2 4.3 7.2
(1) Renewal rental rates for 4QFY2008/09 versus previous contracted rate
(2) Rental rates for new take up (including expansion by existing tenants) in 4QFY2008/09 versus rates in 3QFY2008/09
$2.63
$2.90
$2.18$2.28
$1.17
$1.71
$1.33$1.48
$1.48
$1.36
1,200
1,000
800
600
400
200
0
$3.00
$2.50
$2.00
$1.50
$1.00
$0.50
$0.0Business & Science Parks Hi-Tech Industrial Light Industrial Flatted Factories Logistics & Distribution Centres
Area due
for renewal
(’000 sf)
Average
existing rental
rates (psf)
Area for Renewal in FY2009/10
Area for Renewal in FY2010/11
Average Existing rates for FY2009/10
Average Existing rates for FY2010/11
A Fine BalanceAscendas Real Estate Investment Trust . Annual Report 2008/09
Investment through Acquisitions
Capitalisation rate for income
producing properties is hovering at
around 7% but the market is quiet.
The Manager will continue to evaluate
and make disciplined acquisitions of
properties very selectively, ensuring
that acquisitions made are of high
potential and could be yield accretive
in the near term as well. We will
continue to focus on choice properties
which are versatile in use and offer
sustainable long term returns.
Investment in Development
With the uncertain and challenging
business environment, the Manager
will put more emphasis on achieving
better returns per investment dollar
through the creation of assets by
utilizing our development capability
and capacity by targeting high quality
prospective tenants in more
promising and stable industries.
Asset Enhancement Opportunities
The Manager will continue to look
for opportunities to enhance assets
within the portfolio when market
conditions are more conducive.
We could expect some expansion of
existing buildings to meet future
growth requirements of existing
tenants as well as exploiting potential
to maximize plot ratio if market
demand is assessed to be conducive.
CONCLUSION
The global economy is expected to
remain weak in the coming
quarters. While there are tentative
signs of some stabilization in the
housing, financial and
manufacturing sectors in the US,
they do not yet point to a clear
turnaround in economic activities.
2009 is therefore expected to be a
difficult year given the global financial
and economic crisis. Ministry of Trade
& Industry estimates a GDP
contraction of between 6% and 9%
for Singapore in 2009.
The outlook for A-REIT in FY2009/10
will depend largely on the extent and
depth of the unfolding impact of the
global economic recession on our
existing tenants as well as on
demand for industrial space.
The diversified nature of A-REIT’s
portfolio may prove to be advantageous
during such times of economic
uncertainty. As at 31 Mar 2009,
about 86% of A-REIT’s portfolio
revenue is committed for the next
financial year and the weighted
average lease to expiry is
approximately 5.1 years. A fair mix
of long and short term leases
(48% versus 52% by portfolio value
respectively) in the portfolio provides
a certain degree of predictability
and sustainability. Barring any
significant deterioration in market
conditions, the Manager expects
the net property income outlook for
A-REIT for FY2009/10 to be about
the level achieved in FY2008/09.
However, with an expected higher
cost of borrowing, the income
available for distribution may be
lower and will also be spread over
a larger unit base as a result of the
private placement and preferential
offering of new units in the first
quarter of 2009.
22.9%Business& Science Parks
28.4%Hi-Tech Industrial
33.0%Light Industrial/
Flatted Factories
15.7%Logistics &Distribution
Centre
16.3%Light Industrial/
Flatted Factories
30.0%Business& Science Parks
25.6%Hi-Tech Industrial
28.1%Logistics &
DistributionCentre
YEAR ENDING 31 MAR 2010 YEAR ENDING 31 MAR 2011
3233
LEASES DUE FOR RENEWAL (BY SECTOR)
QUAN
authoritya power or right delegated or given
ZE
responsibiltya particular burden of obligation
upon one who is responsible;accountability
AUTHORITY TO EXECUTE, RESPONSIBILITIES TO ACCOUNT FOR.
Authority is the foundation to discharge responsibilities. Working towards a common goal,
the varied interests of various stakeholders: investors, customers and business partners
must be balanced. Responsibilities, Authority and Accountability are the three inseparable
legs of a balanced tripod upon which good execution is possible. People must be accountable
for the outcomes for which they have been empowered with the authority to deliver.

Board of Directors
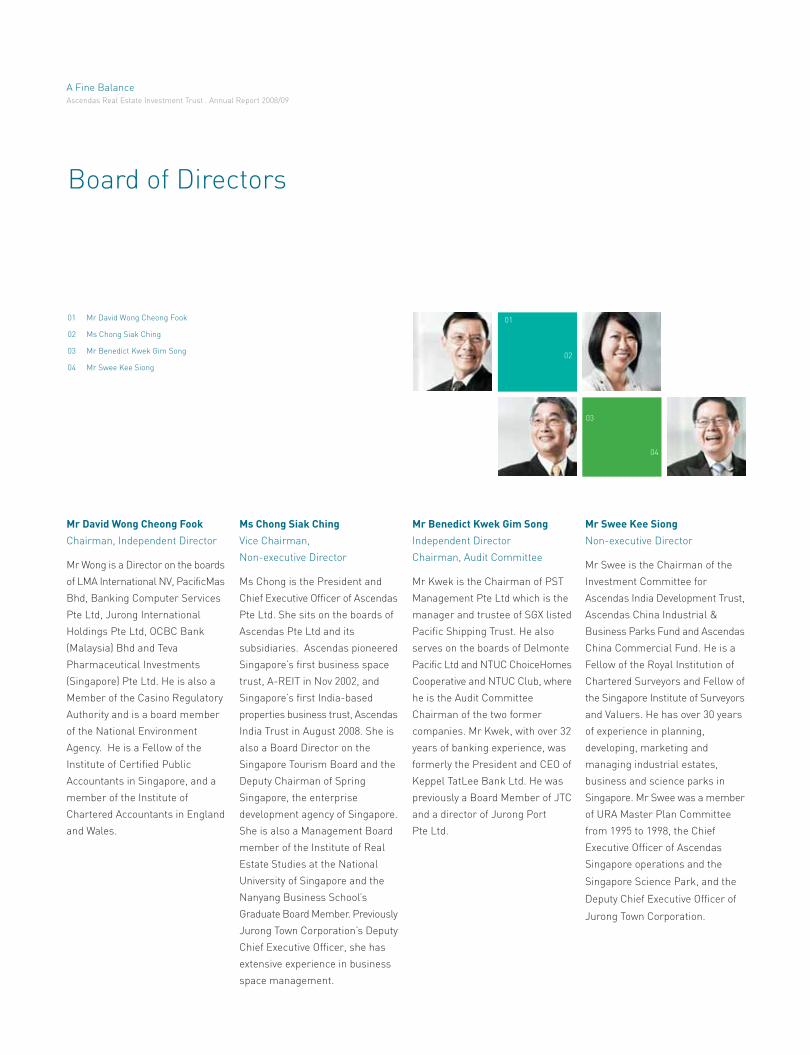
Mr David Wong Cheong Fook
Chairman, Independent Director
Mr Wong is a Director on the boards
of LMA International NV, PacificMas
Bhd, Banking Computer Services
Pte Ltd, Jurong International
Holdings Pte Ltd, OCBC Bank
(Malaysia) Bhd and Teva
Pharmaceutical Investments
(Singapore) Pte Ltd. He is also a
Member of the Casino Regulatory
Authority and is a board member
of the National Environment
Agency. He is a Fellow of the
Institute of Certified Public
Accountants in Singapore, and a
member of the Institute of
Chartered Accountants in England
and Wales.
Mr Swee Kee Siong
Non-executive Director
Mr Swee is the Chairman of the
Investment Committee for
Ascendas India Development Trust,
Ascendas China Industrial &
Business Parks Fund and Ascendas
China Commercial Fund. He is a
Fellow of the Royal Institution of
Chartered Surveyors and Fellow of
the Singapore Institute of Surveyors
and Valuers. He has over 30 years
of experience in planning,
developing, marketing and
managing industrial estates,
business and science parks in
Singapore. Mr Swee was a member
of URA Master Plan Committee
from 1995 to 1998, the Chief
Executive Officer of Ascendas
Singapore operations and the
Singapore Science Park, and the
Deputy Chief Executive Officer of
Jurong Town Corporation.
Ms Chong Siak Ching
Vice Chairman,
Non-executive Director
Ms Chong is the President and
Chief Executive Officer of Ascendas
Pte Ltd. She sits on the boards of
Ascendas Pte Ltd and its
subsidiaries. Ascendas pioneered
Singapore’s first business space
trust, A-REIT in Nov 2002, and
Singapore’s first India-based
properties business trust, Ascendas
India Trust in August 2008. She is
also a Board Director on the
Singapore Tourism Board and the
Deputy Chairman of Spring
Singapore, the enterprise
development agency of Singapore.
She is also a Management Board
member of the Institute of Real
Estate Studies at the National
University of Singapore and the
Nanyang Business School’s
Graduate Board Member. Previously
Jurong Town Corporation’s Deputy
Chief Executive Officer, she has
extensive experience in business
space management.
Mr Benedict Kwek Gim Song
Independent Director
Chairman, Audit Committee
Mr Kwek is the Chairman of PST
Management Pte Ltd which is the
manager and trustee of SGX listed
Pacific Shipping Trust. He also
serves on the boards of Delmonte
Pacific Ltd and NTUC ChoiceHomes
Cooperative and NTUC Club, where
he is the Audit Committee
Chairman of the two former
companies. Mr Kwek, with over 32
years of banking experience, was
formerly the President and CEO of
Keppel TatLee Bank Ltd. He was
previously a Board Member of JTC
and a director of Jurong Port
Pte Ltd.
01
02
03
04
01 Mr David Wong Cheong Fook
02 Ms Chong Siak Ching
03 Mr Benedict Kwek Gim Song
04 Mr Swee Kee Siong
A Fine BalanceAscendas Real Estate Investment Trust . Annual Report 2008/09
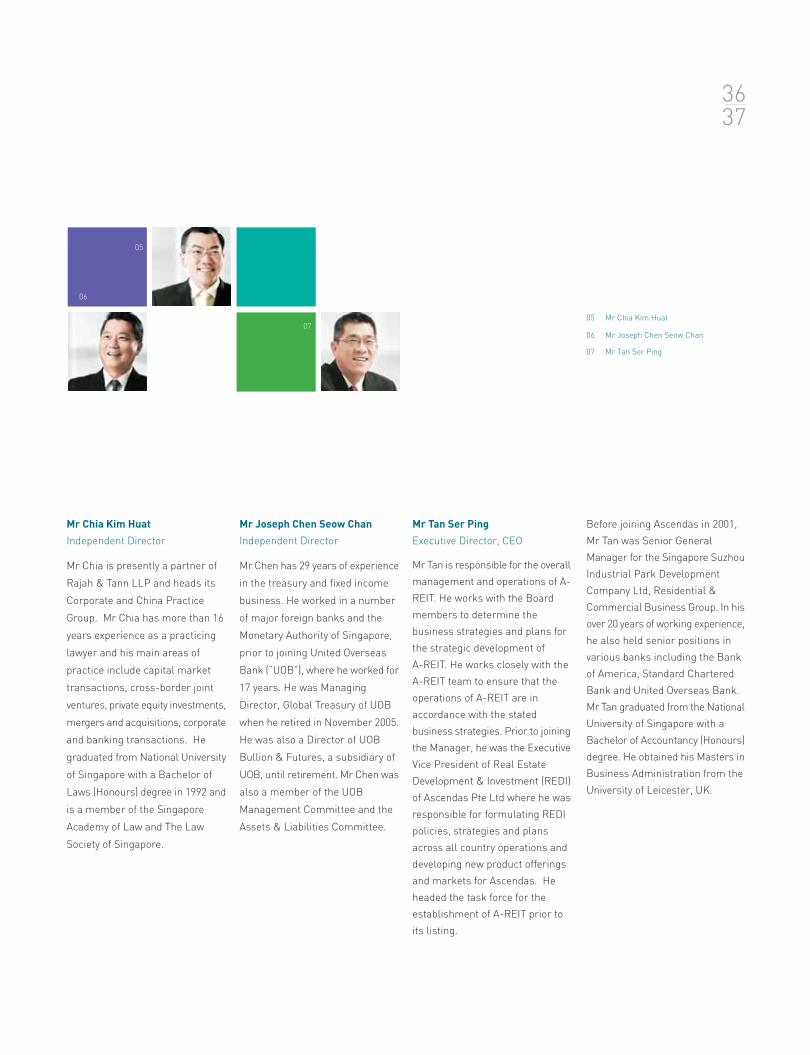
05 Mr Chia Kim Huat
06 Mr Joseph Chen Seow Chan
07 Mr Tan Ser Ping
Mr Chia Kim Huat
Independent Director
Mr Chia is presently a partner of
Rajah & Tann LLP and heads its
Corporate and China Practice
Group. Mr Chia has more than 16
years experience as a practicing
lawyer and his main areas of
practice include capital market
transactions, cross-border joint
ventures, private equity investments,
mergers and acquisitions, corporate
and banking transactions. He
graduated from National University
of Singapore with a Bachelor of
Laws (Honours) degree in 1992 and
is a member of the Singapore
Academy of Law and The Law
Society of Singapore.
Mr Tan Ser Ping
Executive Director, CEO
Mr Tan is responsible for the overall
management and operations of A-
REIT. He works with the Board
members to determine the
business strategies and plans for
the strategic development of
A-REIT. He works closely with the
A-REIT team to ensure that the
operations of A-REIT are in
accordance with the stated
business strategies. Prior to joining
the Manager, he was the Executive
Vice President of Real Estate
Development & Investment (REDI)
of Ascendas Pte Ltd where he was
responsible for formulating REDI
policies, strategies and plans
across all country operations and
developing new product offerings
and markets for Ascendas. He
headed the task force for the
establishment of A-REIT prior to
its listing.
Mr Joseph Chen Seow Chan
Independent Director
Mr Chen has 29 years of experience
in the treasury and fixed income
business. He worked in a number
of major foreign banks and the
Monetary Authority of Singapore,
prior to joining United Overseas
Bank (”UOB”), where he worked for
17 years. He was Managing
Director, Global Treasury of UOB
when he retired in November 2005.
He was also a Director of UOB
Bullion & Futures, a subsidiary of
UOB, until retirement. Mr Chen was
also a member of the UOB
Management Committee and the
Assets & Liabilities Committee.
Before joining Ascendas in 2001,
Mr Tan was Senior General
Manager for the Singapore Suzhou
Industrial Park Development
Company Ltd, Residential &
Commercial Business Group. In his
over 20 years of working experience,
he also held senior positions in
various banks including the Bank
of America, Standard Chartered
Bank and United Overseas Bank.
Mr Tan graduated from the National
University of Singapore with a
Bachelor of Accountancy (Honours)
degree. He obtained his Masters in
Business Administration from the
University of Leicester, UK.
05
06
07
3637
The A-REIT Team

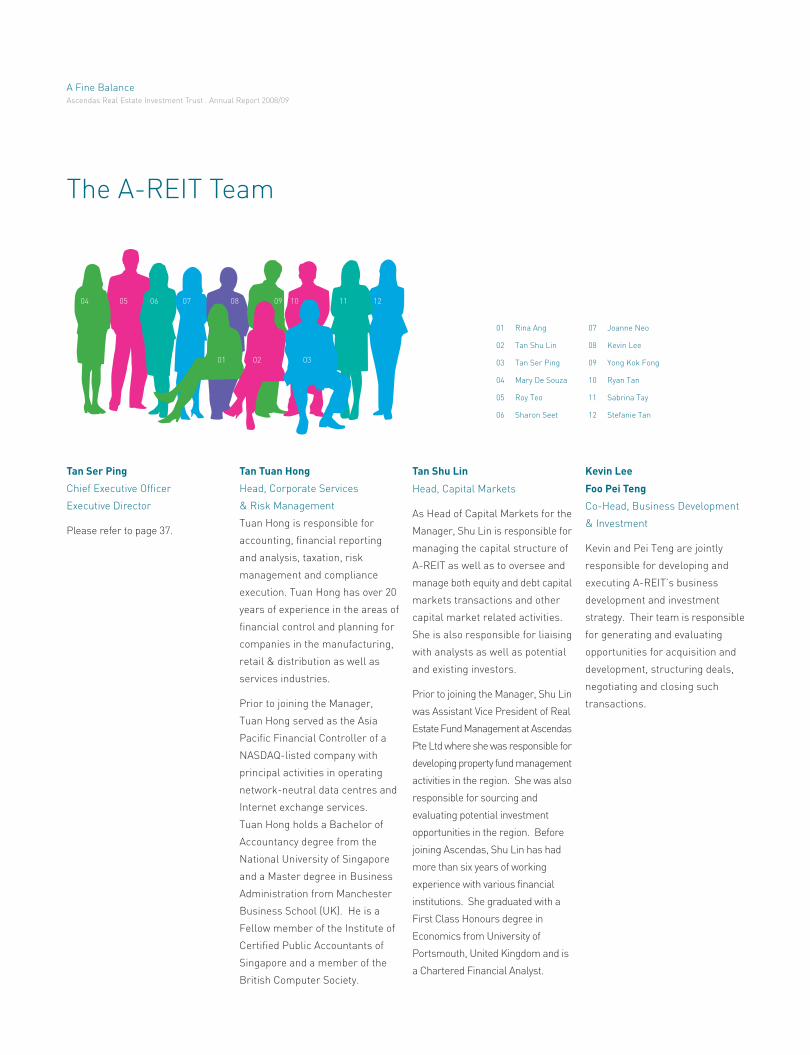
The A-REIT Team
01 02 03
04 05 06 07 08 09 10 11 12
Tan Ser Ping
Chief Executive Officer
Executive Director
Please refer to page 37.
Tan Shu Lin
Head, Capital Markets
As Head of Capital Markets for the
Manager, Shu Lin is responsible for
managing the capital structure of
A-REIT as well as to oversee and
manage both equity and debt capital
markets transactions and other
capital market related activities.
She is also responsible for liaising
with analysts as well as potential
and existing investors.
Prior to joining the Manager, Shu Lin
was Assistant Vice President of Real
Estate Fund Management at Ascendas
Pte Ltd where she was responsible for
developing property fund management
activities in the region. She was also
responsible for sourcing and
evaluating potential investment
opportunities in the region. Before
joining Ascendas, Shu Lin has had
more than six years of working
experience with various financial
institutions. She graduated with a
First Class Honours degree in
Economics from University of
Portsmouth, United Kingdom and is
a Chartered Financial Analyst.
Kevin Lee
Foo Pei Teng
Co-Head, Business Development
& Investment
Kevin and Pei Teng are jointly
responsible for developing and
executing A-REIT’s business
development and investment
strategy. Their team is responsible
for generating and evaluating
opportunities for acquisition and
development, structuring deals,
negotiating and closing such
transactions.
Tan Tuan Hong
Head, Corporate Services
& Risk Management
Tuan Hong is responsible for
accounting, financial reporting
and analysis, taxation, risk
management and compliance
execution. Tuan Hong has over 20
years of experience in the areas of
financial control and planning for
companies in the manufacturing,
retail & distribution as well as
services industries.
Prior to joining the Manager,
Tuan Hong served as the Asia
Pacific Financial Controller of a
NASDAQ-listed company with
principal activities in operating
network-neutral data centres and
Internet exchange services.
Tuan Hong holds a Bachelor of
Accountancy degree from the
National University of Singapore
and a Master degree in Business
Administration from Manchester
Business School (UK). He is a
Fellow member of the Institute of
Certified Public Accountants of
Singapore and a member of the
British Computer Society.
01 Rina Ang
02 Tan Shu Lin
03 Tan Ser Ping
04 Mary De Souza
05 Roy Teo
06 Sharon Seet
07 Joanne Neo
08 Kevin Lee
09 Yong Kok Fong
10 Ryan Tan
11 Sabrina Tay
12 Stefanie Tan
A Fine BalanceAscendas Real Estate Investment Trust . Annual Report 2008/09

13 14 15
16 17 18 19 20 21 22 23 24
Kevin Lee
Head, Industrial Properties Portfolio
As Portfolio Manager (Industrial
Properties), Kevin oversees the
Property Manager, ASPL, in its
asset management strategies and
execution for A-REIT’s portfolio of
Hi-Tech Industrial and Light
Industrial properties.
Prior to joining the Manager, Kevin
was Director at an international
property consultant where he has
served corporate clients and banks
involving assets appraisal and also
investment advisory. Kevin is a
licensed valuer and also a member
of the Royal Institution of Chartered
Surveyors. He holds a Bachelor of
Science degree in Land
Management from University of
Reading, United Kingdom.
Maria Theresa Belmonte
Legal Counsel
& Compliance Manager
Assistant Company Secretary
Theresa’s responsibilities include
providing legal advice in all areas
within A-REIT including legal
documentation for acquisitions.
She also serves as the Compliance
Manager for A-REIT and assists in
A-REIT’s corporate secretarial
matters. She was formerly an in-
house legal counsel in a SGX-listed
company and prior to that was a
practicing lawyer. She has previous
experience in the areas of real
property law, general corporate law
and corporate secretarial work.
Theresa was called to the Singapore
Bar after graduating with an LL.B
(Hons) from the National University
of Singapore.
Roy Teo
Head, Logistics Properties Portfolio
Coordinator, Asset Management
Roy oversees ASPL in its asset
management strategies and
execution for A-REIT’s portfolio of
logistics properties. As Coordinator
for the Asset Management function,
he is a crucial link between the
Manager (AFM) and the Property
Manager (ASPL) to ensure that the
optimal level of service and the best
possible outcome are delivered for
the A-REIT properties.
Prior to his current role with the
Manager, Roy was the Assistant
Manager for Business Development at
Keppel Logistics Pte Ltd. He has over
eight years of experience in the
logistics industry in areas including
finance, accounting, project
management and business
development in Singapore and
regionally. Roy holds a Bachelor of
Science (Honours) degree in Applied
Accountancy from Oxford Brookes
University and is an Affiliate
member of the Association of
Chartered Certified Accountants.
Foo Pei Teng
Head, Business & Science Park
and Warehouse Retail
Facilities Portfolio
As Portfolio Manager (Business &
Science Park and Warehouse Retail
Properties), Pei Teng oversees ASPL,
in its asset management strategies
and execution for A-REIT’s portfolio
of Business & Science Park and
Warehouse Retail properties.
Prior to joining the Manager, Pei
Teng was a Business Development
Manager with Ascendas Pte Ltd.
She was involved in the evaluation
of several regional real estate
development and investment deals
in Korea, Australia and the
Philippines. Pei Teng graduated
with a Bachelor of Business
(Honours) degree in Financial
Analysis from Nanyang Technological
University and a Master of Science
degree in Real Estate from
National University of Singapore.
19 Patricia Goh
20 Foo Pei Teng
21 Calvin Tay
22 Maria Theresa Belmonte
23 Ho Sok Teng
24 Crystal Koh
13 Chan Lai Kuan
14 Ng Kok Hua
15 Tan Tuan Hong
16 Carol Ng
17 Lee Yong Kian
18 Leong Sai Keong
Not in picture: Cassie Ang, Jeffrey Toh
4041
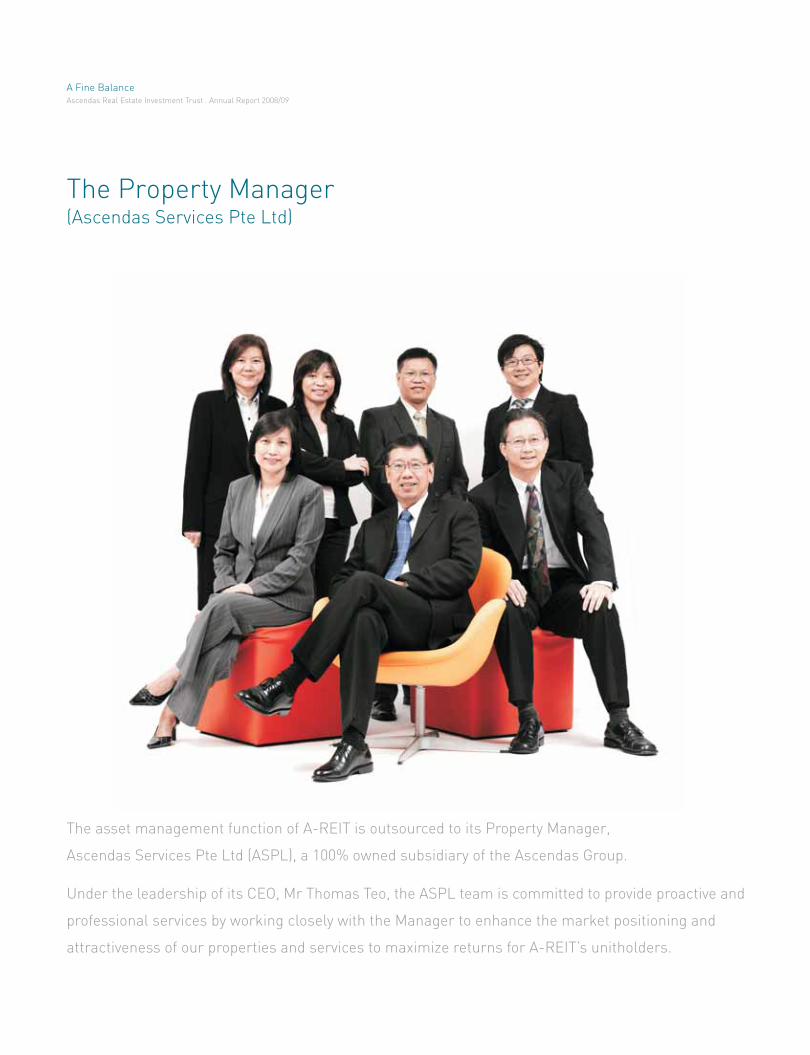
The Property Manager(Ascendas Services Pte Ltd)
The asset management function of A-REIT is outsourced to its Property Manager,
Ascendas Services Pte Ltd (ASPL), a 100% owned subsidiary of the Ascendas Group.
Under the leadership of its CEO, Mr Thomas Teo, the ASPL team is committed to provide proactive and
professional services by working closely with the Manager to enhance the market positioning and
attractiveness of our properties and services to maximize returns for A-REIT’s unitholders.
A Fine BalanceAscendas Real Estate Investment Trust . Annual Report 2008/09
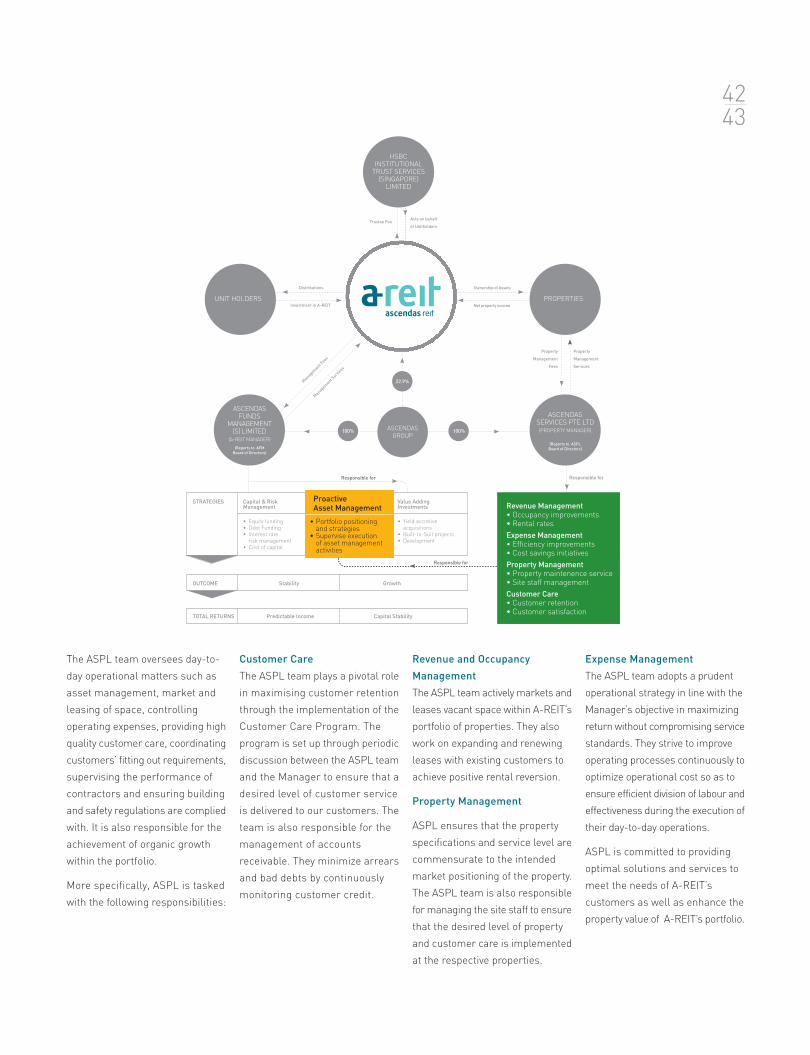
22.9%
100% 100%
Distributions
Investment in A-REIT
Ownership of Assets
Net property income
Acts on behalf
of UnitholdersTrustee Fee
Managem
ent Fees
Managem
ent Serv
ices
Property
Management
Fees
Property
Management
Services
STRATEGIES Capital & RiskManagement
ProactiveAsset Management
Value AddingInvestments
• Equity funding• Debt Funding• Interest rate
risk management• Cost of capital
• Portfolio positioning and strategies
• Supervise execution of asset managementactivities
• Yield accretive acquisitions
• Built-to-Suit projects• Development
OUTCOME Stability Growth
Revenue Management
• Occupancy improvements
• Rental rates
Expense Management
• Effi ciency improvements
• Cost savings initiatives
Property Management
• Property maintenence service
• Site staff management
Customer Care
• Customer retention
• Customer satisfaction
Responsible for Responsible for
Responsible for
HSBCINSTITUTIONAL
TRUST SERVICES(SINGAPORE)
LIMITED
PROPERTIESUNIT HOLDERS
ASCENDASSERVICES PTE LTD(PROPERTY MANAGER)
(Reports to ASPL
Board of Directors)
ASCENDASFUNDS
MANAGEMENT(S) LIMITED
(A-REIT MANAGER)
(Reports to AFM
Board of Directors)
ASCENDAS
GROUP
The ASPL team oversees day-to-
day operational matters such as
asset management, market and
leasing of space, controlling
operating expenses, providing high
quality customer care, coordinating
customers’ fitting out requirements,
supervising the performance of
contractors and ensuring building
and safety regulations are complied
with. It is also responsible for the
achievement of organic growth
within the portfolio.
More specifically, ASPL is tasked
with the following responsibilities:
Customer Care
The ASPL team plays a pivotal role
in maximising customer retention
through the implementation of the
Customer Care Program. The
program is set up through periodic
discussion between the ASPL team
and the Manager to ensure that a
desired level of customer service
is delivered to our customers. The
team is also responsible for the
management of accounts
receivable. They minimize arrears
and bad debts by continuously
monitoring customer credit.
Revenue and Occupancy
Management
The ASPL team actively markets and
leases vacant space within A-REIT’s
portfolio of properties. They also
work on expanding and renewing
leases with existing customers to
achieve positive rental reversion.
Property Management
ASPL ensures that the property
specifications and service level are
commensurate to the intended
market positioning of the property.
The ASPL team is also responsible
for managing the site staff to ensure
that the desired level of property
and customer care is implemented
at the respective properties.
Expense Management
The ASPL team adopts a prudent
operational strategy in line with the
Manager’s objective in maximizing
return without compromising service
standards. They strive to improve
operating processes continuously to
optimize operational cost so as to
ensure efficient division of labour and
effectiveness during the execution of
their day-to-day operations.
ASPL is committed to providing
optimal solutions and services to
meet the needs of A-REIT’s
customers as well as enhance the
property value of A-REIT’s portfolio.
ProactiveAsset Management
• Portfolio positioning and strategies
• Supervise execution of asset management activities
Revenue Management• Occupancy improvements• Rental rates
Expense Management• Efficiency improvements• Cost savings initiatives
Property Management• Property maintenence service• Site staff management
Customer Care• Customer retention• Customer satisfaction
TOTAL RETURNS Predictable Income Capital Stability
4243
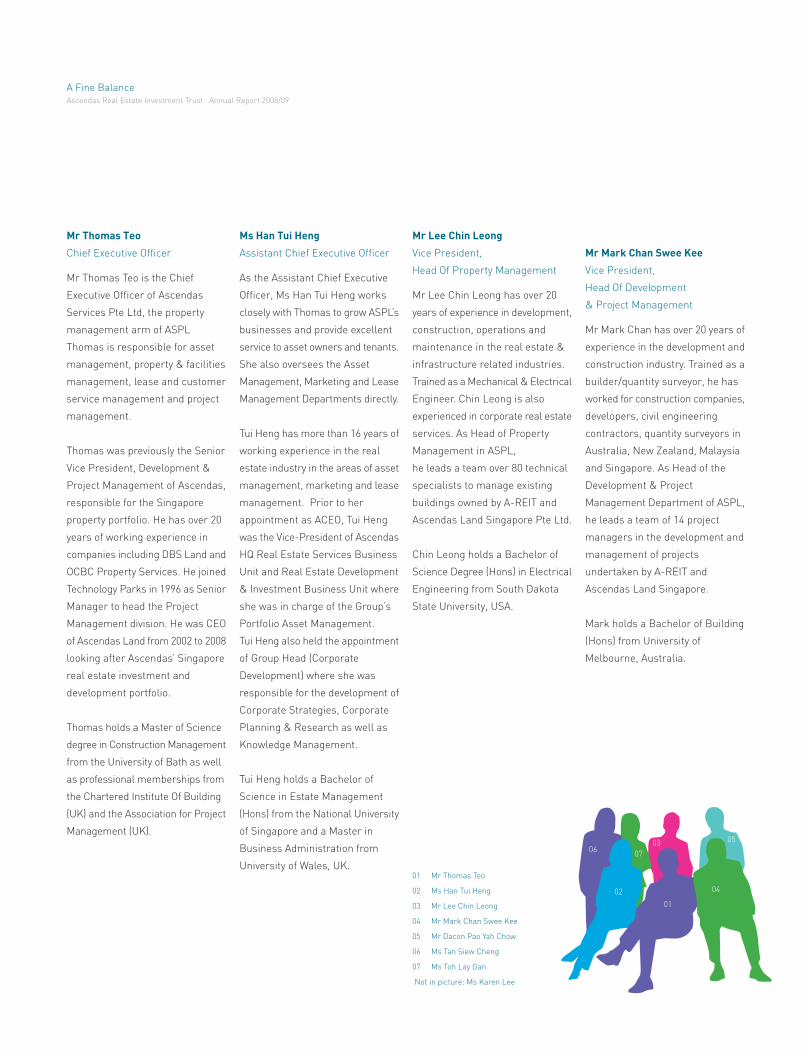
Mr Thomas Teo
Chief Executive Officer
Mr Thomas Teo is the Chief
Executive Officer of Ascendas
Services Pte Ltd, the property
management arm of ASPL
Thomas is responsible for asset
management, property & facilities
management, lease and customer
service management and project
management.
Thomas was previously the Senior
Vice President, Development &
Project Management of Ascendas,
responsible for the Singapore
property portfolio. He has over 20
years of working experience in
companies including DBS Land and
OCBC Property Services. He joined
Technology Parks in 1996 as Senior
Manager to head the Project
Management division. He was CEO
of Ascendas Land from 2002 to 2008
looking after Ascendas’ Singapore
real estate investment and
development portfolio.
Thomas holds a Master of Science
degree in Construction Management
from the University of Bath as well
as professional memberships from
the Chartered Institute Of Building
(UK) and the Association for Project
Management (UK).
Ms Han Tui Heng
Assistant Chief Executive Officer
As the Assistant Chief Executive
Officer, Ms Han Tui Heng works
closely with Thomas to grow ASPL’s
businesses and provide excellent
service to asset owners and tenants.
She also oversees the Asset
Management, Marketing and Lease
Management Departments directly.
Tui Heng has more than 16 years of
working experience in the real
estate industry in the areas of asset
management, marketing and lease
management. Prior to her
appointment as ACEO, Tui Heng
was the Vice-President of Ascendas
HQ Real Estate Services Business
Unit and Real Estate Development
& Investment Business Unit where
she was in charge of the Group’s
Portfolio Asset Management.
Tui Heng also held the appointment
of Group Head (Corporate
Development) where she was
responsible for the development of
Corporate Strategies, Corporate
Planning & Research as well as
Knowledge Management.
Tui Heng holds a Bachelor of
Science in Estate Management
(Hons) from the National University
of Singapore and a Master in
Business Administration from
University of Wales, UK.
Mr Lee Chin Leong
Vice President,
Head Of Property Management
Mr Lee Chin Leong has over 20
years of experience in development,
construction, operations and
maintenance in the real estate &
infrastructure related industries.
Trained as a Mechanical & Electrical
Engineer. Chin Leong is also
experienced in corporate real estate
services. As Head of Property
Management in ASPL,
he leads a team over 80 technical
specialists to manage existing
buildings owned by A-REIT and
Ascendas Land Singapore Pte Ltd.
Chin Leong holds a Bachelor of
Science Degree (Hons) in Electrical
Engineering from South Dakota
State University, USA.
Mr Mark Chan Swee Kee
Vice President,
Head Of Development
& Project Management
Mr Mark Chan has over 20 years of
experience in the development and
construction industry. Trained as a
builder/quantity surveyor, he has
worked for construction companies,
developers, civil engineering
contractors, quantity surveyors in
Australia, New Zealand, Malaysia
and Singapore. As Head of the
Development & Project
Management Department of ASPL,
he leads a team of 14 project
managers in the development and
management of projects
undertaken by A-REIT and
Ascendas Land Singapore.
Mark holds a Bachelor of Building
(Hons) from University of
Melbourne, Australia.
01
02 04
0607
03 05
01 Mr Thomas Teo
02 Ms Han Tui Heng
03 Mr Lee Chin Leong
04 Mr Mark Chan Swee Kee
05 Mr Dacon Pao Yah Chow
06 Ms Tan Siew Cheng
07 Ms Toh Lay Gan
Not in picture: Ms Karen Lee
A Fine BalanceAscendas Real Estate Investment Trust . Annual Report 2008/09
Mr Dacon Pao Yah Chow
Vice President,
Head Of Singapore Marketing
As Head of Singapore Marketing for
ASPL, Mr Dacon Pao leads the team
to formulate and implement
effective marketing strategies for
the leasing and sale of Ascendas
products and services in Singapore.
Prior to managing the Singapore
portfolio, Dacon was marketing the
Ascendas’ portfolio of Asia projects,
particularly in China, Philippines
and Thailand.
Dacon joined Ascendas Pte Ltd in
1997 where he garnered extensive
experience in the marketing of
business space to both multi-
national companies as well as small
and medium enterprises.
Dacon holds a Masters of Business
Administration from the University
of Warwick, UK and a Bachelor of
Engineering (Civil) from the
Nanyang Technological University.
Ms Tan Siew Cheng
Vice President,
Asset Management
(Business & Science Parks)
With over 16 years of experience in
the real estate industry. Ms Tan Siew
Cheng currently heads the Asset
Management Team for Business
& Science Park portfolio in ASPL.
She is in charge of the marketing,
leasing as well as asset
management of A-REIT’s Business
& Science park portfolio. Prior to
this appointment, Siew Cheng was
also involved in the marketing of
industrial space for Ascendas and
office space for Knight Frank
Cheong Hock Chye and Baillieu.
Siew Cheng holds a Bachelor of
Science (Estate Management)
(Hons) degree from National
University of Singapore and
a Masters in Business Administration
from the University of Bradford.
Ms Karen Lee
Assistant Vice President,
Asset Management
(Hi-tech & Light Industrial)
(Not in picture)
Ms Karen Lee heads the Asset
Management Team for Hi-Tech
& Light Industrial portfolio in ASPL.
Karen has over 10 years of
experience in the real estate
industry covering various areas of
industrial lease and property
management and marketing in
Singapore and Vietnam.
Prior to joining ASPL, Karen held
several positions in industrial real
estate companies
Karen holds a Bachelor of Science
(Economics) (Hons) degree and a
Masters of Science (Real Estate)
from the National University
of Singapore.
Ms Toh Lay Gan
Assistant Vice President,
Asset Management
(Logistics & Distribution Centres)
Ms Toh Lay Gan possesses over
13 years of experience in the real
estate industry and currently heads
the Asset Management Team for
Logistics & Distribution portfolio in
ASPL. She is in charge of the
marketing, leasing as well as asset
management of
A-REIT’s logistics portfolio. Prior to
joining ASPL, she was with DTZ
Leung and Far East Organization
where she specialized in valuation
and marketing of industrial
properties respectively.
Lay Gan holds a Bachelor of Science
(Estate Management) (Hons) degree
from National University
of Singapore.
4445
JIN
progressa movement toward a goalor to a further or higher stage
TUI
regressTaking a step backward to aprevious and especially worse ormore primitive state or condition
BUILDING RESPONSIBLY, GROWING STEADILY.
Enhancing A-REIT’s portfolio through a balance of development projects and acquisition
of income producing properties, each investment decision was deliberated and examined
to ensure value-add to the Trust and its sustainability. While growing our business and
enhancing the enjoyment for the present generation, we also seek to leave a clean
and green earth for future generations to inherit.

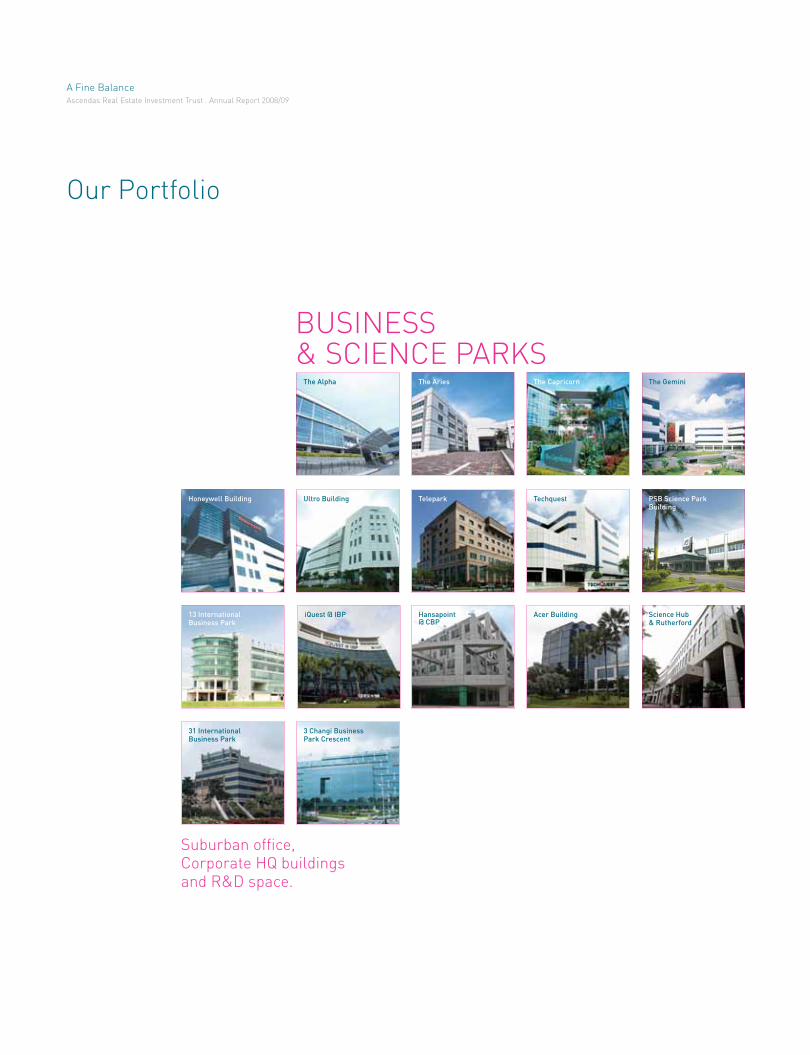
Our Portfolio
The Alpha The Aries The Capricorn The Gemini
13 InternationalBusiness Park
iQuest @ IBP Hansapoint@ CBP
Acer Building Science Hub& Rutherford
31 InternationalBusiness Park
3 Changi BusinessPark Crescent
Honeywell Building Ultro Building Telepark PSB Science ParkBuilding
Techquest
Suburban office,Corporate HQ buildingsand R&D space.
BUSINESS& SCIENCE PARKS
A Fine BalanceAscendas Real Estate Investment Trust . Annual Report 2008/09
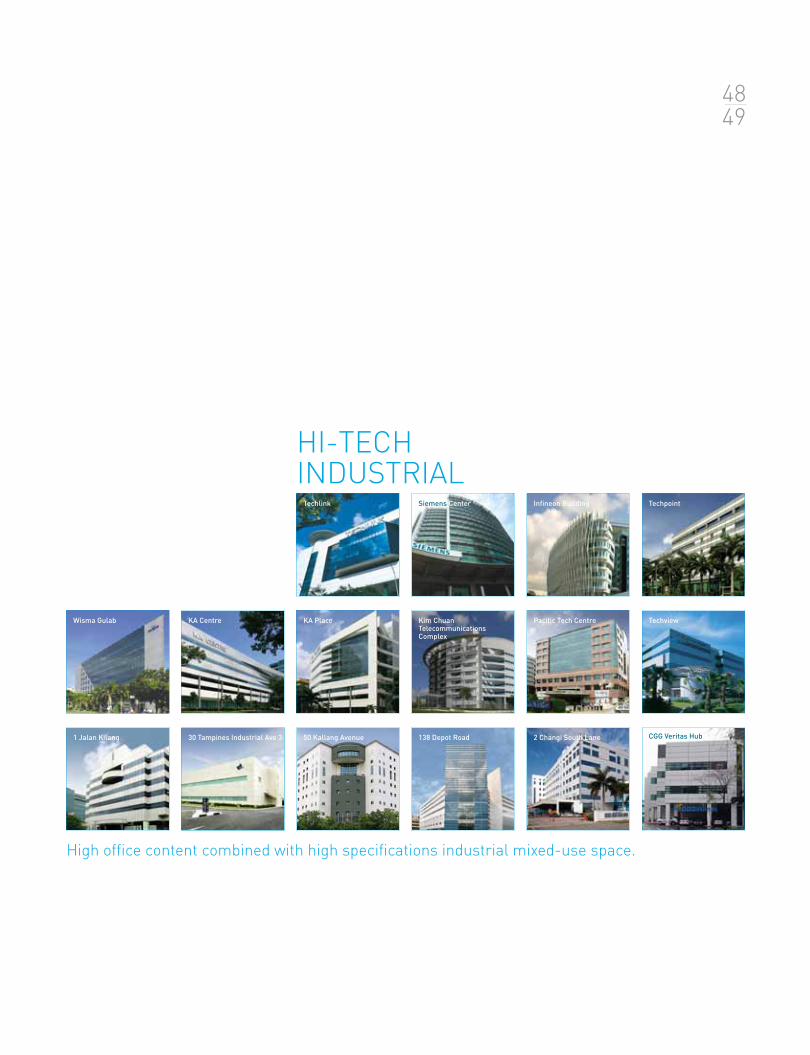
Wisma Gulab
1 Jalan Kilang 30 Tampines Industrial Ave 3 50 Kallang Avenue 138 Depot Road 2 Changi South Lane CGG Veritas Hub
Techlink Siemens Center Infineon Building Techpoint
KA Centre KA Place Kim ChuanTelecommunicationsComplex
Pacific Tech Centre Techview
HI-TECHINDUSTRIAL
High office content combined with high specifications industrial mixed-use space.
4849
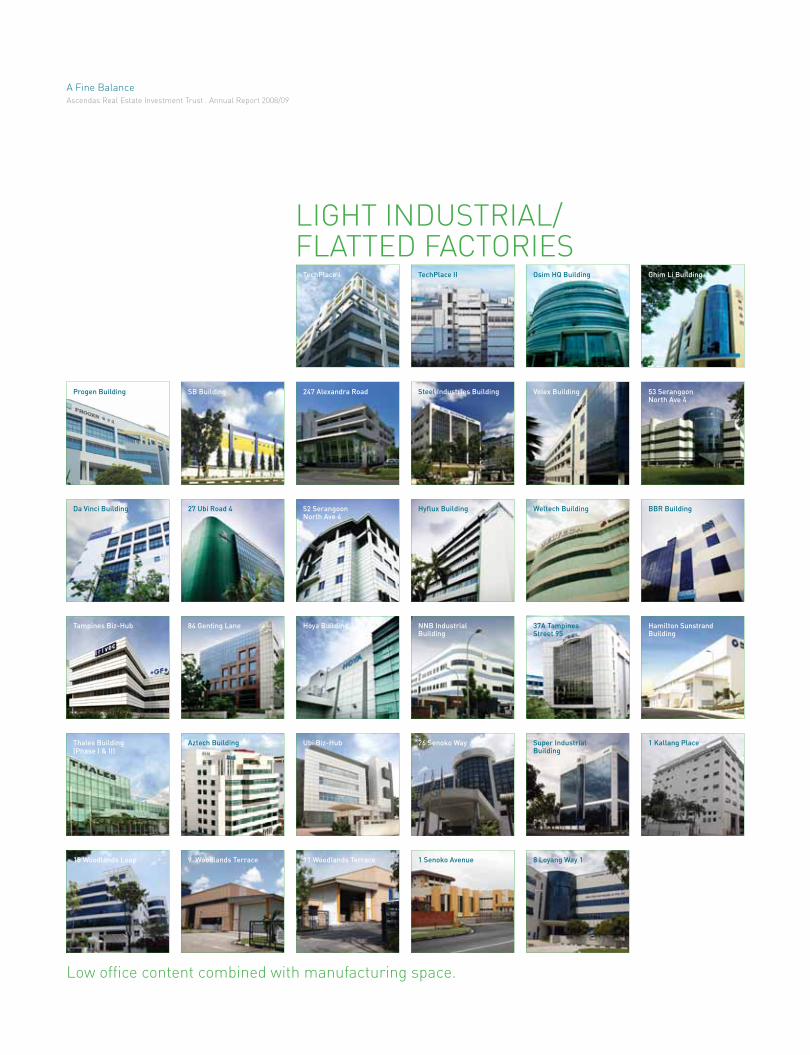
TechPlace I TechPlace II Osim HQ Building Ghim Li Building
SB Building 247 Alexandra Road Steel Industries Building Volex Building 53 SerangoonNorth Ave 4
27 Ubi Road 4 52 SerangoonNorth Ave 4
Hyflux Building Weltech Building BBR Building
84 Genting Lane Hoya Building NNB IndustrialBuilding
37A TampinesStreet 95
Hamilton SunstrandBuilding
Aztech Building Ubi Biz-Hub 26 Senoko Way Super IndustrialBuilding
1 Kallang Place
Progen Building
Da Vinci Building
Tampines Biz-Hub
Thales Building(Phase I & II)
18 Woodlands Loop
LIGHT INDUSTRIAL/FLATTED FACTORIES
9 Woodlands Terrace 11 Woodlands Terrace 1 Senoko Avenue 8 Loyang Way 1
Low office content combined with manufacturing space.
A Fine BalanceAscendas Real Estate Investment Trust . Annual Report 2008/09
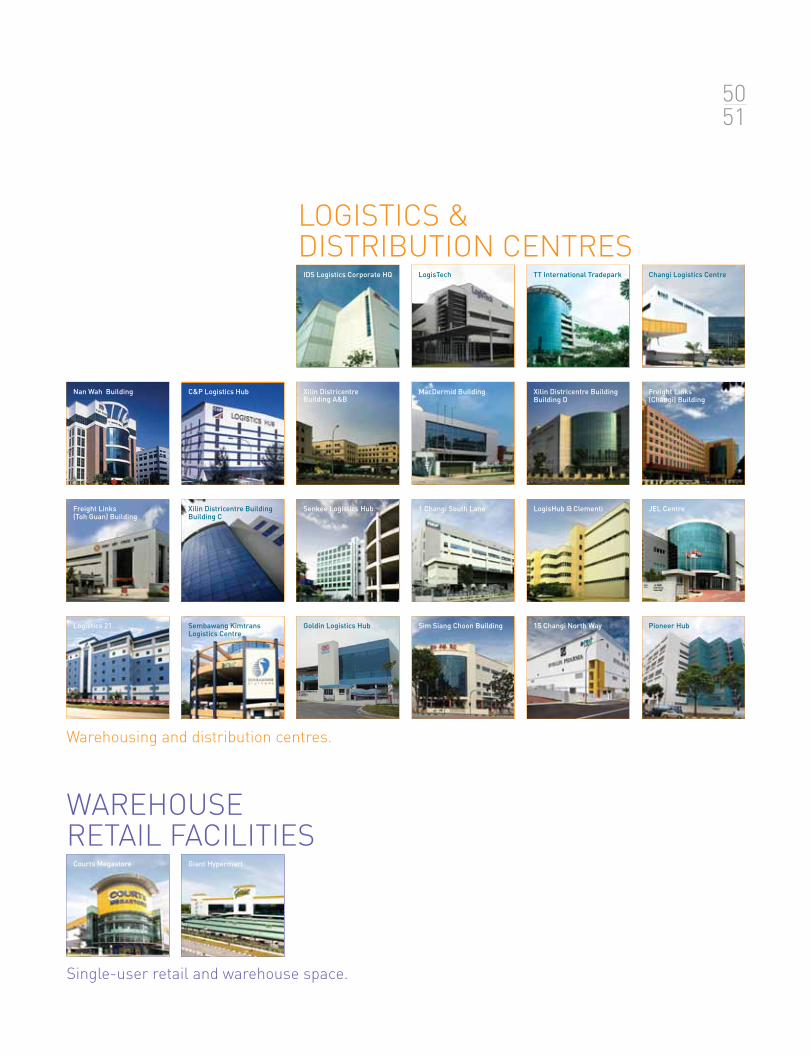
Nan Wah Building
Freight Links(Toh Guan) Building
Logistics 21
IDS Logistics Corporate HQ LogisTech TT International Tradepark Changi Logistics Centre
C&P Logistics Hub Xilin DistricentreBuilding A&B
MacDermid Building Xilin Districentre BuildingBuilding D
Freight Links(Changi) Building
Xilin Districentre BuildingBuilding C
Senkee Logistics Hub 1 Changi South Lane LogisHub @ Clementi JEL Centre
Sembawang KimtransLogistics Centre
Goldin Logistics Hub Sim Siang Choon Building 15 Changi North Way Pioneer Hub
Warehousing and distribution centres.
Courts Megastore Giant Hypermart
LOGISTICS &DISTRIBUTION CENTRES
WAREHOUSERETAIL FACILITIES
Single-user retail and warehouse space.
5051
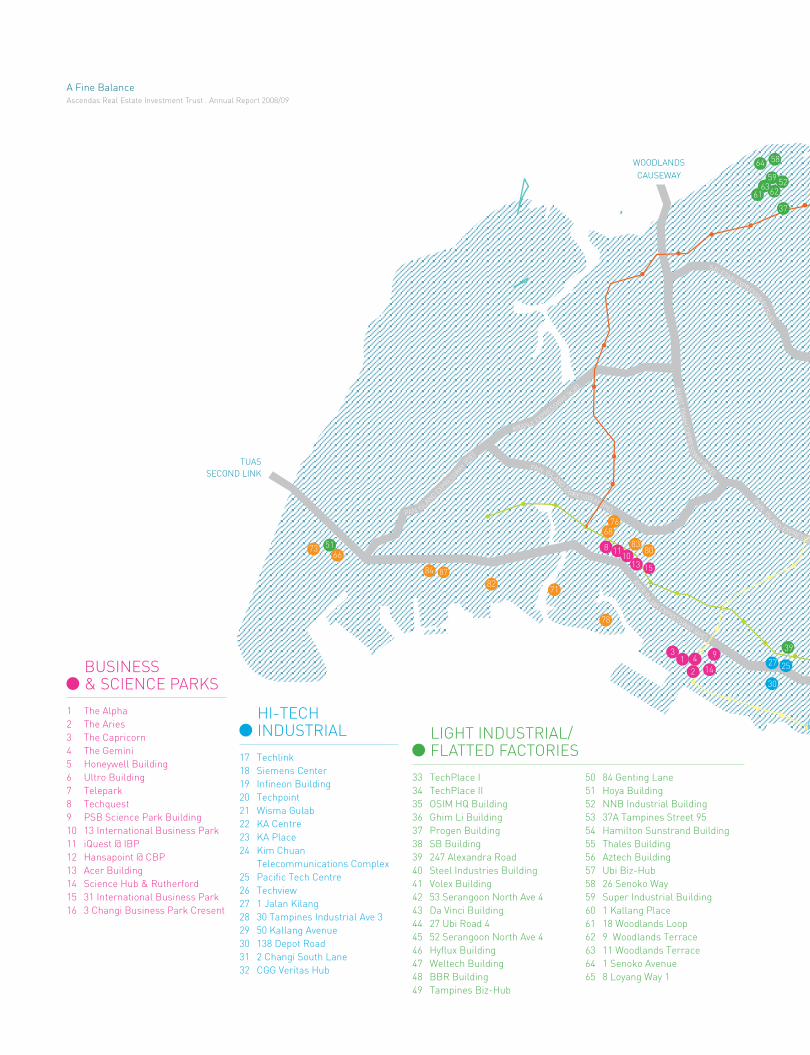
73 5166
84
8271
78
1310
118
6876
8380
1
2
34
14
927 25
30
39
64 58
5952
6361 62
37
TUAS
SECOND LINK
WOODLANDS
CAUSEWAY
PAN ISLAN
DEXP
RESSW
AY(P
IE)
KRANJI EXPRESSWAY (K
JE)
AYERRAJAH
EXPRESSWAY (AYE)
BU
KIT
TIM
AH
EXP
RE
SS
WAY
(BKE)
SELETAR EXPRESSW
AY
(SL
E)
PANISLAN
DEXPRESSWAY (PIE)
PANISLAN
D EXPRESSW
1587
33 TechPlace I
34 TechPlace II
35 OSIM HQ Building
36 Ghim Li Building
37 Progen Building
38 SB Building
39 247 Alexandra Road
40 Steel Industries Building
41 Volex Building
42 53 Serangoon North Ave 4
43 Da Vinci Building
44 27 Ubi Road 4
45 52 Serangoon North Ave 4
46 Hyflux Building
47 Weltech Building
48 BBR Building
49 Tampines Biz-Hub
50 84 Genting Lane
51 Hoya Building
52 NNB Industrial Building
53 37A Tampines Street 95
54 Hamilton Sunstrand Building
55 Thales Building
56 Aztech Building
57 Ubi Biz-Hub
58 26 Senoko Way
59 Super Industrial Building
60 1 Kallang Place
61 18 Woodlands Loop
62 9 Woodlands Terrace
63 11 Woodlands Terrace
64 1 Senoko Avenue
65 8 Loyang Way 1
LIGHT INDUSTRIAL/FLATTED FACTORIES
1 The Alpha
2 The Aries
3 The Capricorn
4 The Gemini
5 Honeywell Building
6 Ultro Building
7 Telepark
8 Techquest
9 PSB Science Park Building
10 13 International Business Park
11 iQuest @ IBP
12 Hansapoint @ CBP
13 Acer Building
14 Science Hub & Rutherford
15 31 International Business Park
16 3 Changi Business Park Cresent
BUSINESS& SCIENCE PARKS
17 Techlink
18 Siemens Center
19 Infineon Building
20 Techpoint
21 Wisma Gulab
22 KA Centre
23 KA Place
24 Kim Chuan
Telecommunications Complex
25 Pacific Tech Centre
26 Techview
27 1 Jalan Kilang
28 30 Tampines Industrial Ave 3
29 50 Kallang Avenue
30 138 Depot Road
31 2 Changi South Lane
32 CGG Veritas Hub
HI-TECHINDUSTRIAL
A Fine BalanceAscendas Real Estate Investment Trust . Annual Report 2008/09
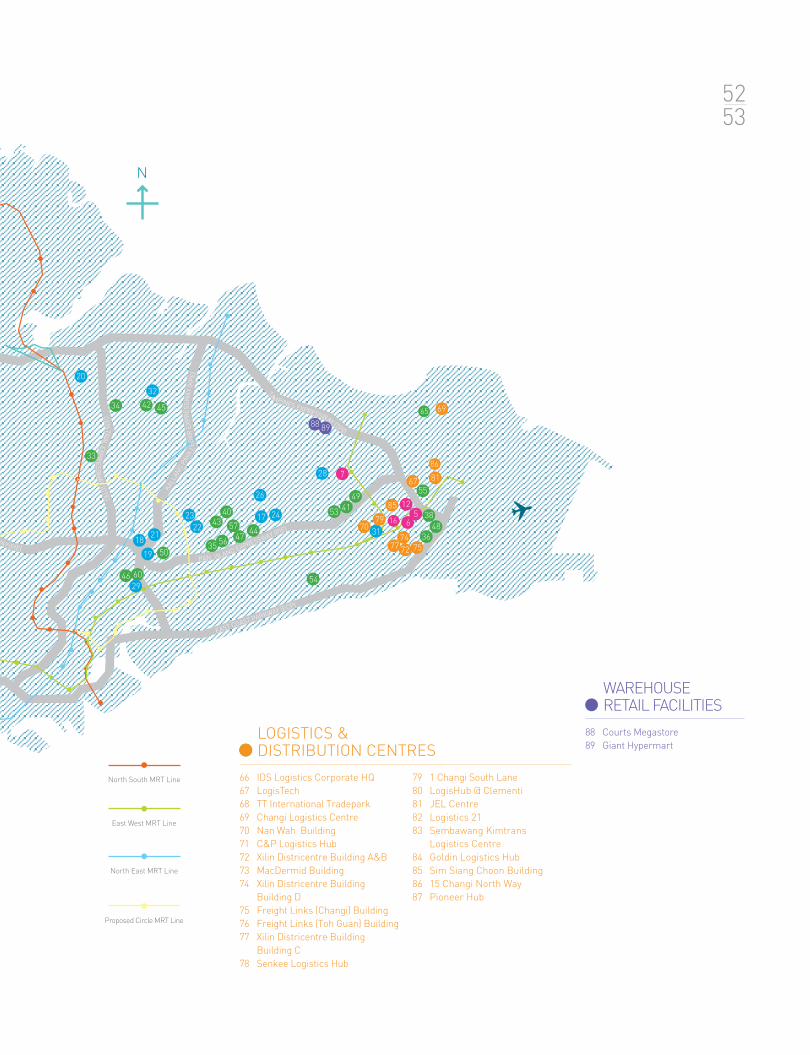
33
20
34
32
42 45
46 60
29
19
1821
50
23
2243
40
57
26
17 24
4447
5635
54
7772 7574 36
48
386
512
55
8167
85
7970
31
5341
49
728
8988
69
CE
NTR
AL
EXP
RE
SS
WA
Y(C
TE
)
KALLAN
GP
AYA
LE
BA
RE
XP
RE
SS
WA
Y(K
PE
)
EAST COAST PARKWAY (ECP)
TA
MPINES EXPRESSWAY (TPE)
WAY (PIE)
PAN ISLAND EXPRESSWAY (PIE)
North South MRT Line
East West MRT Line
North East MRT Line
Proposed Circle MRT Line
N
65
86
16
66 IDS Logistics Corporate HQ
67 LogisTech
68 TT International Tradepark
69 Changi Logistics Centre
70 Nan Wah Building
71 C&P Logistics Hub
72 Xilin Districentre Building A&B
73 MacDermid Building
74 Xilin Districentre Building
Building D
75 Freight Links (Changi) Building
76 Freight Links (Toh Guan) Building
77 Xilin Districentre Building
Building C
78 Senkee Logistics Hub
79 1 Changi South Lane
80 LogisHub @ Clementi
81 JEL Centre
82 Logistics 21
83 Sembawang Kimtrans
Logistics Centre
84 Goldin Logistics Hub
85 Sim Siang Choon Building
86 15 Changi North Way
87 Pioneer Hub
LOGISTICS &DISTRIBUTION CENTRES
88 Courts Megastore
89 Giant Hypermart
WAREHOUSERETAIL FACILITIES
5253
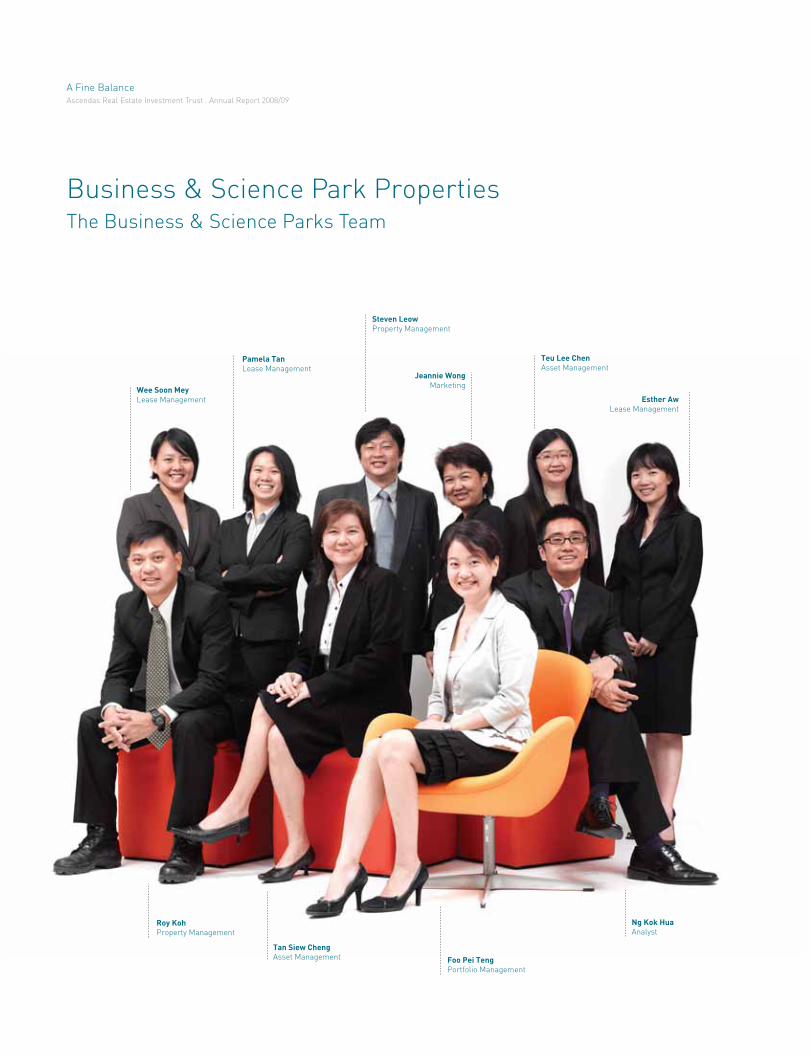
Business & Science Park Properties
Wee Soon Mey
Lease Management
Pamela Tan
Lease ManagementJeannie Wong
Marketing
Teu Lee Chen
Asset Management
Esther Aw
Lease Management
Roy Koh
Property Management
Tan Siew Cheng
Asset Management Foo Pei Teng
Portfolio Management
Steven Leow
Property Management
Ng Kok Hua
Analyst
The Business & Science Parks Team
A Fine BalanceAscendas Real Estate Investment Trust . Annual Report 2008/09
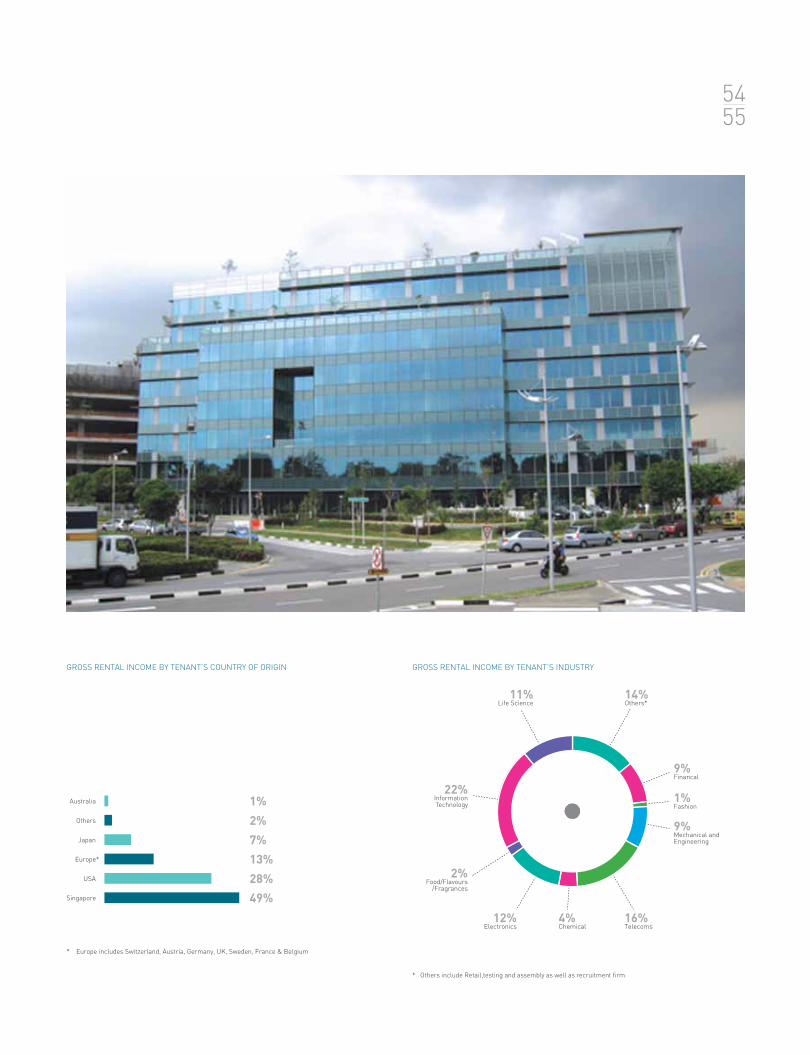
GROSS RENTAL INCOME BY TENANT’S INDUSTRY
1%Fashion
14%Others*
9%Mechanical andEngineering
9%Financal
16%Telecoms
4%Chemical
12%Electronics
2%Food/Flavours
/Fragrances
11%Life Science
GROSS RENTAL INCOME BY TENANT’S COUNTRY OF ORIGIN
* Europe includes Switzerland, Austria, Germany, UK, Sweden, France & Belgium
* Others include Retail,testing and assembly as well as recruitment firm
5455
Singapore 49%
Australia 1%
Europe* 13%
Japan 7%
USA 28%
Others 2%
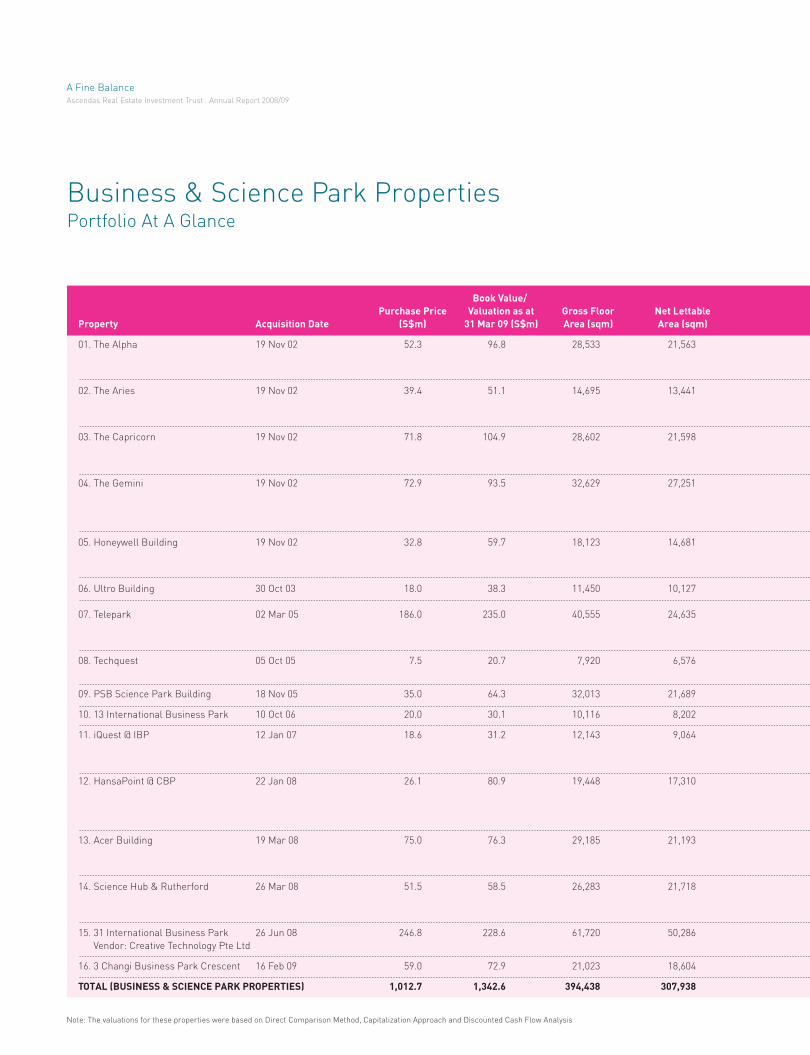
Business & Science Park PropertiesPortfolio At A Glance
Book Value/
Purchase Price Valuation as at Gross Floor Net Lettable
Property Acquisition Date (S$m) 31 Mar 09 (S$m) Area (sqm) Area (sqm)
01. The Alpha 19 Nov 02 52.3 96.8 28,533 21,563
02. The Aries 19 Nov 02 39.4 51.1 14,695 13,441
03. The Capricorn 19 Nov 02 71.8 104.9 28,602 21,598
04. The Gemini 19 Nov 02 72.9 93.5 32,629 27,251
05. Honeywell Building 19 Nov 02 32.8 59.7 18,123 14,681
06. Ultro Building 30 Oct 03 18.0 38.3 11,450 10,127
07. Telepark 02 Mar 05 186.0 235.0 40,555 24,635
08. Techquest 05 Oct 05 7.5 20.7 7,920 6,576
09. PSB Science Park Building 18 Nov 05 35.0 64.3 32,013 21,689
10. 13 International Business Park 10 Oct 06 20.0 30.1 10,116 8,202
11. iQuest @ IBP 12 Jan 07 18.6 31.2 12,143 9,064
12. HansaPoint @ CBP 22 Jan 08 26.1 80.9 19,448 17,310
13. Acer Building 19 Mar 08 75.0 76.3 29,185 21,193
14. Science Hub & Rutherford 26 Mar 08 51.5 58.5 26,283 21,718
15. 31 International Business Park 26 Jun 08 246.8 228.6 61,720 50,286
Vendor: Creative Technology Pte Ltd
16. 3 Changi Business Park Crescent 16 Feb 09 59.0 72.9 21,023 18,604
TOTAL (BUSINESS & SCIENCE PARK PROPERTIES) 1,012.7 1,342.6 394,438 307,938
Note: The valuations for these properties were based on Direct Comparison Method, Capitalization Approach and Discounted Cash Flow Analysis
A Fine BalanceAscendas Real Estate Investment Trust . Annual Report 2008/09
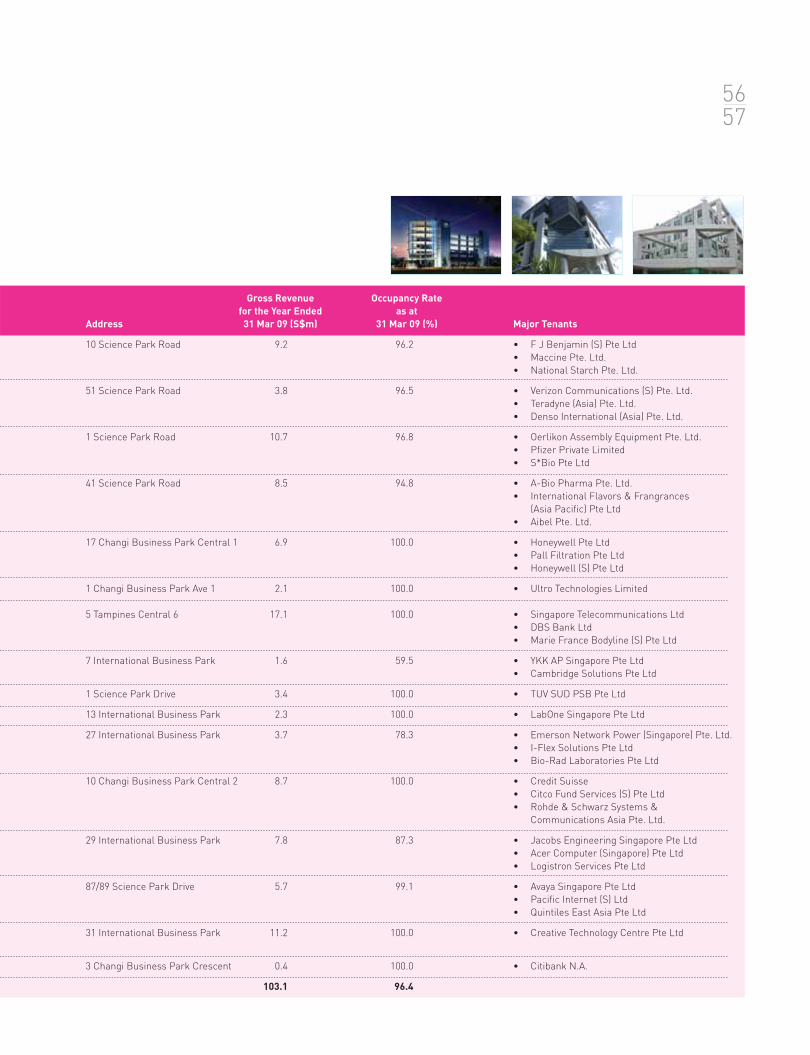
Gross Revenue Occupancy Rate
for the Year Ended as at
Address 31 Mar 09 (S$m) 31 Mar 09 (%) Major Tenants
10 Science Park Road 9.2 96.2 • F J Benjamin (S) Pte Ltd
• Maccine Pte. Ltd.
• National Starch Pte. Ltd.
51 Science Park Road 3.8 96.5 • Verizon Communications (S) Pte. Ltd.
• Teradyne (Asia) Pte. Ltd.
• Denso International (Asia) Pte. Ltd.
1 Science Park Road 10.7 96.8 • Oerlikon Assembly Equipment Pte. Ltd.
• Pfizer Private Limited
• S*Bio Pte Ltd
41 Science Park Road 8.5 94.8 • A-Bio Pharma Pte. Ltd.
• International Flavors & Frangrances
(Asia Pacific) Pte Ltd
• Aibel Pte. Ltd.
17 Changi Business Park Central 1 6.9 100.0 • Honeywell Pte Ltd
• Pall Filtration Pte Ltd
• Honeywell (S) Pte Ltd
1 Changi Business Park Ave 1 2.1 100.0 • Ultro Technologies Limited
5 Tampines Central 6 17.1 100.0 • Singapore Telecommunications Ltd
• DBS Bank Ltd
• Marie France Bodyline (S) Pte Ltd
7 International Business Park 1.6 59.5 • YKK AP Singapore Pte Ltd
• Cambridge Solutions Pte Ltd
1 Science Park Drive 3.4 100.0 • TUV SUD PSB Pte Ltd
13 International Business Park 2.3 100.0 • LabOne Singapore Pte Ltd
27 International Business Park 3.7 78.3 • Emerson Network Power (Singapore) Pte. Ltd.
• I-Flex Solutions Pte Ltd
• Bio-Rad Laboratories Pte Ltd
10 Changi Business Park Central 2 8.7 100.0 • Credit Suisse
• Citco Fund Services (S) Pte Ltd
• Rohde & Schwarz Systems &
Communications Asia Pte. Ltd.
29 International Business Park 7.8 87.3 • Jacobs Engineering Singapore Pte Ltd
• Acer Computer (Singapore) Pte Ltd
• Logistron Services Pte Ltd
87/89 Science Park Drive 5.7 99.1 • Avaya Singapore Pte Ltd
• Pacific Internet (S) Ltd
• Quintiles East Asia Pte Ltd
31 International Business Park 11.2 100.0 • Creative Technology Centre Pte Ltd
3 Changi Business Park Crescent 0.4 100.0 • Citibank N.A.
103.1 96.4
5657

Hi-Tech Industrial PropertiesThe Hi-Tech Industrial Team
Jean Lau
Lease Management
Wendy Tan
Lease Management
Steven Leow
Property Management
See Thoo Mei Ching
Lease Management
Tan Peng Guan
Property Management
Kevin Lee
Portfolio Management
Leong Sai Keong
Portfolio Operations
Doris Lim
Asset Management
Vivian Goi
Marketing
A Fine BalanceAscendas Real Estate Investment Trust . Annual Report 2008/09
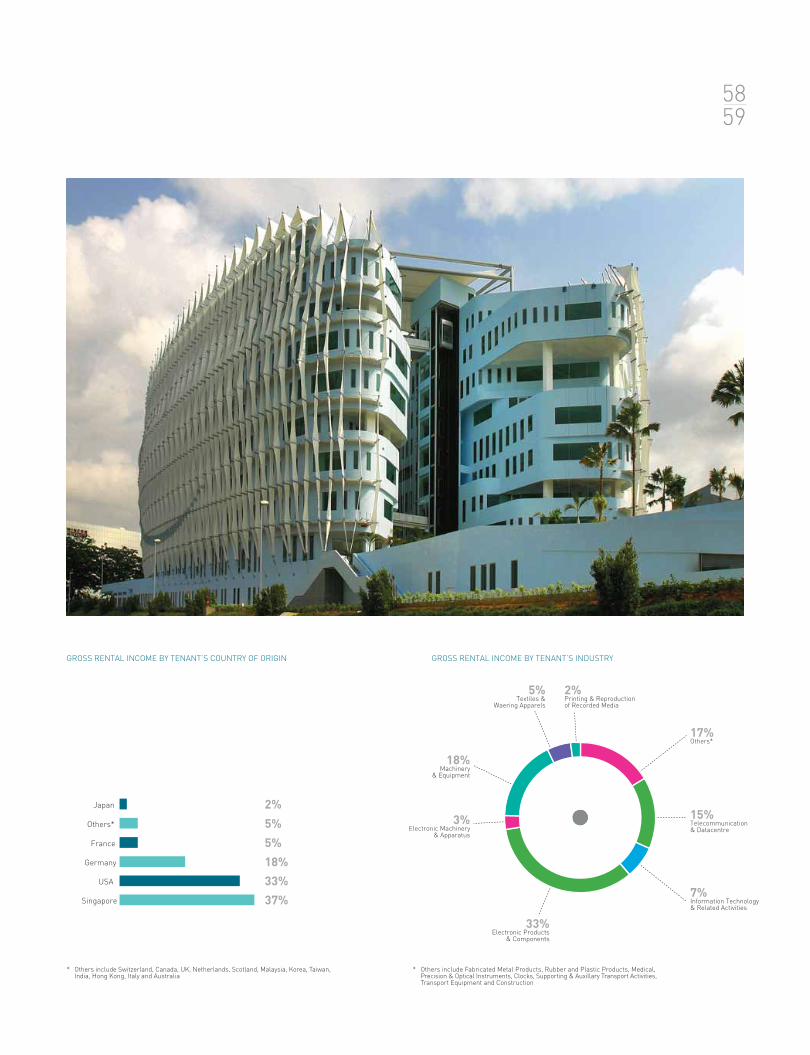
15%Telecommunication& Datacentre
7%Information Technology& Related Activities
33%Electronic Products
& Components
3%Electronic Machinery
& Apparatus
18%Machinery
& Equipment
17%Others*
5%Textiles &
Waering Apparels
2%Printing & Reproductionof Recorded Media
Singapore 37%
USA 33%
Germany 18%
France 5%
Japan 2%
Others* 5%
GROSS RENTAL INCOME BY TENANT’S INDUSTRYGROSS RENTAL INCOME BY TENANT’S COUNTRY OF ORIGIN
5859
* Others include Switzerland, Canada, UK, Netherlands, Scotland, Malaysia, Korea, Taiwan,India, Hong Kong, Italy and Australia
* Others include Fabricated Metal Products, Rubber and Plastic Products, Medical,Precision & Optical Instruments, Clocks, Supporting & Auxillary Transport Activities,Transport Equipment and Construction
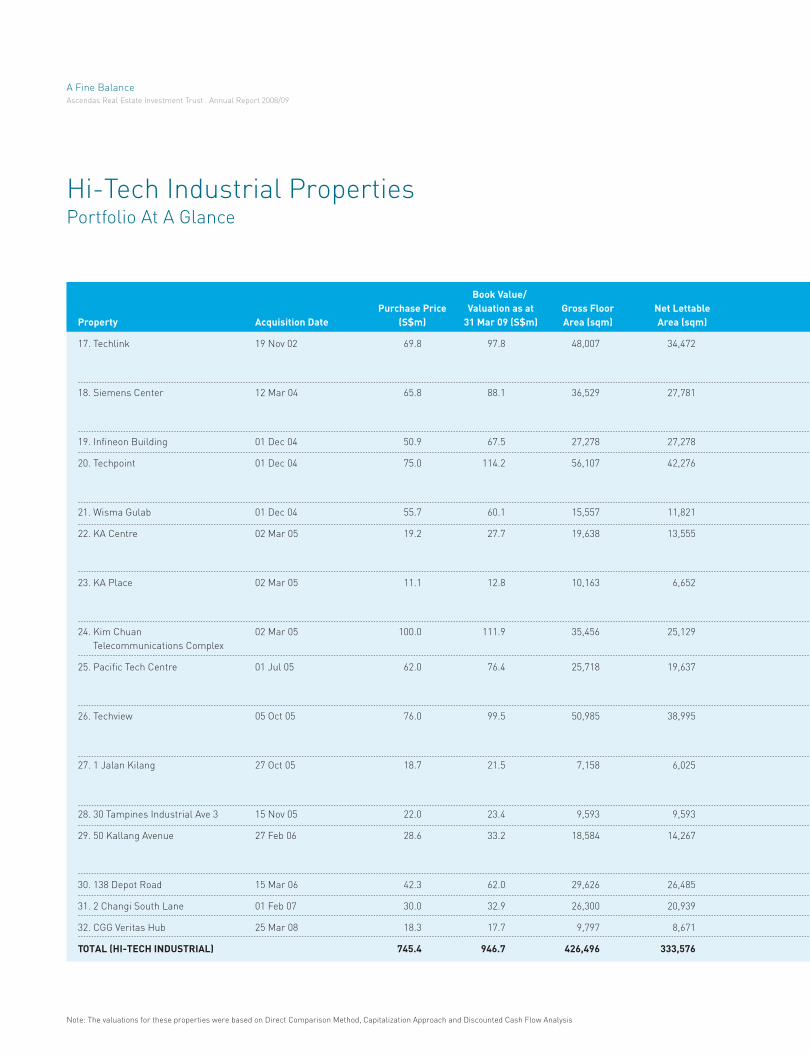
Hi-Tech Industrial PropertiesPortfolio At A Glance
Book Value/
Purchase Price Valuation as at Gross Floor Net Lettable
Property Acquisition Date (S$m) 31 Mar 09 (S$m) Area (sqm) Area (sqm)
17. Techlink 19 Nov 02 69.8 97.8 48,007 34,472
18. Siemens Center 12 Mar 04 65.8 88.1 36,529 27,781
19. Infineon Building 01 Dec 04 50.9 67.5 27,278 27,278
20. Techpoint 01 Dec 04 75.0 114.2 56,107 42,276
21. Wisma Gulab 01 Dec 04 55.7 60.1 15,557 11,821
22. KA Centre 02 Mar 05 19.2 27.7 19,638 13,555
23. KA Place 02 Mar 05 11.1 12.8 10,163 6,652
24. Kim Chuan 02 Mar 05 100.0 111.9 35,456 25,129
Telecommunications Complex
25. Pacific Tech Centre 01 Jul 05 62.0 76.4 25,718 19,637
26. Techview 05 Oct 05 76.0 99.5 50,985 38,995
27. 1 Jalan Kilang 27 Oct 05 18.7 21.5 7,158 6,025
28. 30 Tampines Industrial Ave 3 15 Nov 05 22.0 23.4 9,593 9,593
29. 50 Kallang Avenue 27 Feb 06 28.6 33.2 18,584 14,267
30. 138 Depot Road 15 Mar 06 42.3 62.0 29,626 26,485
31. 2 Changi South Lane 01 Feb 07 30.0 32.9 26,300 20,939
32. CGG Veritas Hub 25 Mar 08 18.3 17.7 9,797 8,671
TOTAL (HI-TECH INDUSTRIAL) 745.4 946.7 426,496 333,576
Note: The valuations for these properties were based on Direct Comparison Method, Capitalization Approach and Discounted Cash Flow Analysis
A Fine BalanceAscendas Real Estate Investment Trust . Annual Report 2008/09
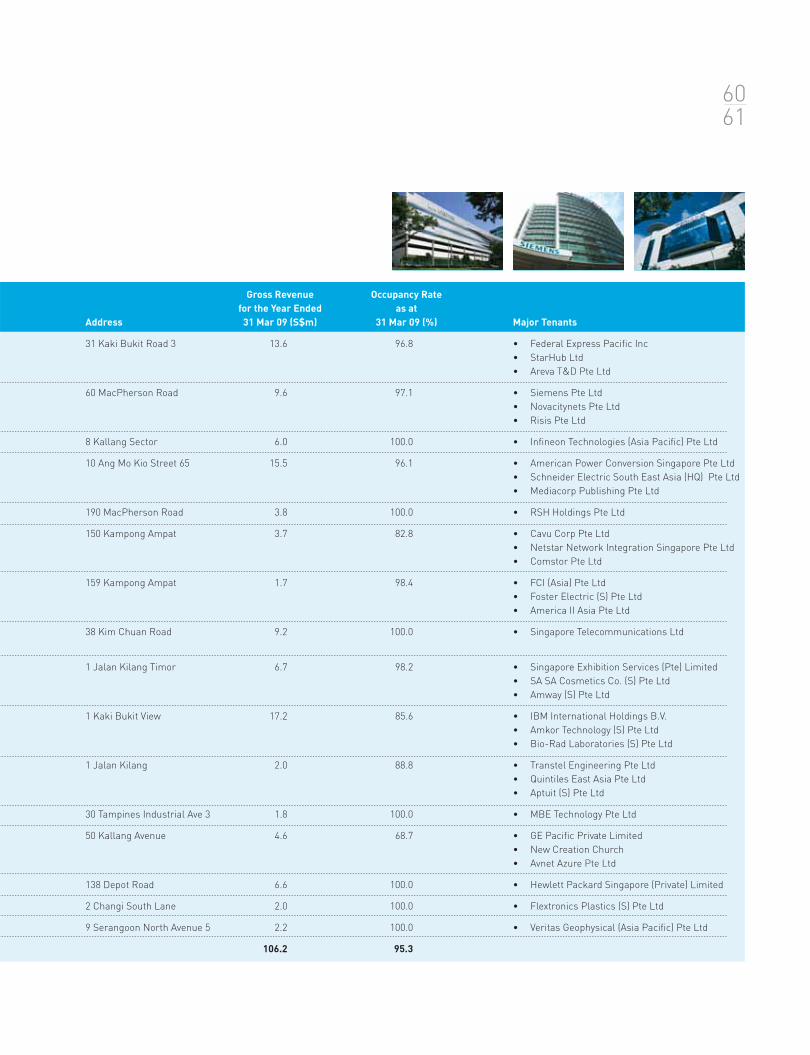
Gross Revenue Occupancy Rate
for the Year Ended as at
Address 31 Mar 09 (S$m) 31 Mar 09 (%) Major Tenants
31 Kaki Bukit Road 3 13.6 96.8 • Federal Express Pacific Inc
• StarHub Ltd
• Areva T&D Pte Ltd
60 MacPherson Road 9.6 97.1 • Siemens Pte Ltd
• Novacitynets Pte Ltd
• Risis Pte Ltd
8 Kallang Sector 6.0 100.0 • Infineon Technologies (Asia Pacific) Pte Ltd
10 Ang Mo Kio Street 65 15.5 96.1 • American Power Conversion Singapore Pte Ltd
• Schneider Electric South East Asia (HQ) Pte Ltd
• Mediacorp Publishing Pte Ltd
190 MacPherson Road 3.8 100.0 • RSH Holdings Pte Ltd
150 Kampong Ampat 3.7 82.8 • Cavu Corp Pte Ltd
• Netstar Network Integration Singapore Pte Ltd
• Comstor Pte Ltd
159 Kampong Ampat 1.7 98.4 • FCI (Asia) Pte Ltd
• Foster Electric (S) Pte Ltd
• America II Asia Pte Ltd
38 Kim Chuan Road 9.2 100.0 • Singapore Telecommunications Ltd
1 Jalan Kilang Timor 6.7 98.2 • Singapore Exhibition Services (Pte) Limited
• SA SA Cosmetics Co. (S) Pte Ltd
• Amway (S) Pte Ltd
1 Kaki Bukit View 17.2 85.6 • IBM International Holdings B.V.
• Amkor Technology (S) Pte Ltd
• Bio-Rad Laboratories (S) Pte Ltd
1 Jalan Kilang 2.0 88.8 • Transtel Engineering Pte Ltd
• Quintiles East Asia Pte Ltd
• Aptuit (S) Pte Ltd
30 Tampines Industrial Ave 3 1.8 100.0 • MBE Technology Pte Ltd
50 Kallang Avenue 4.6 68.7 • GE Pacific Private Limited
• New Creation Church
• Avnet Azure Pte Ltd
138 Depot Road 6.6 100.0 • Hewlett Packard Singapore (Private) Limited
2 Changi South Lane 2.0 100.0 • Flextronics Plastics (S) Pte Ltd
9 Serangoon North Avenue 5 2.2 100.0 • Veritas Geophysical (Asia Pacific) Pte Ltd
106.2 95.3
6061
Light Industrial / Flatted Factories PropertiesThe Light Industrial Team
Agnes Ong
Lease Management
Steven Leow
Property Management
Adam Wu
Property Management
Lee Fei Lan
Lease Management
Dennis Pee
Marketing
Jean Lau
Lease Management
Carrie Chua
Asset Management
Leong Sai Keong
Portfolio OperationsWendy Tan
Lease Management
Kevin Lee
Portfolio Management
A Fine BalanceAscendas Real Estate Investment Trust . Annual Report 2008/09
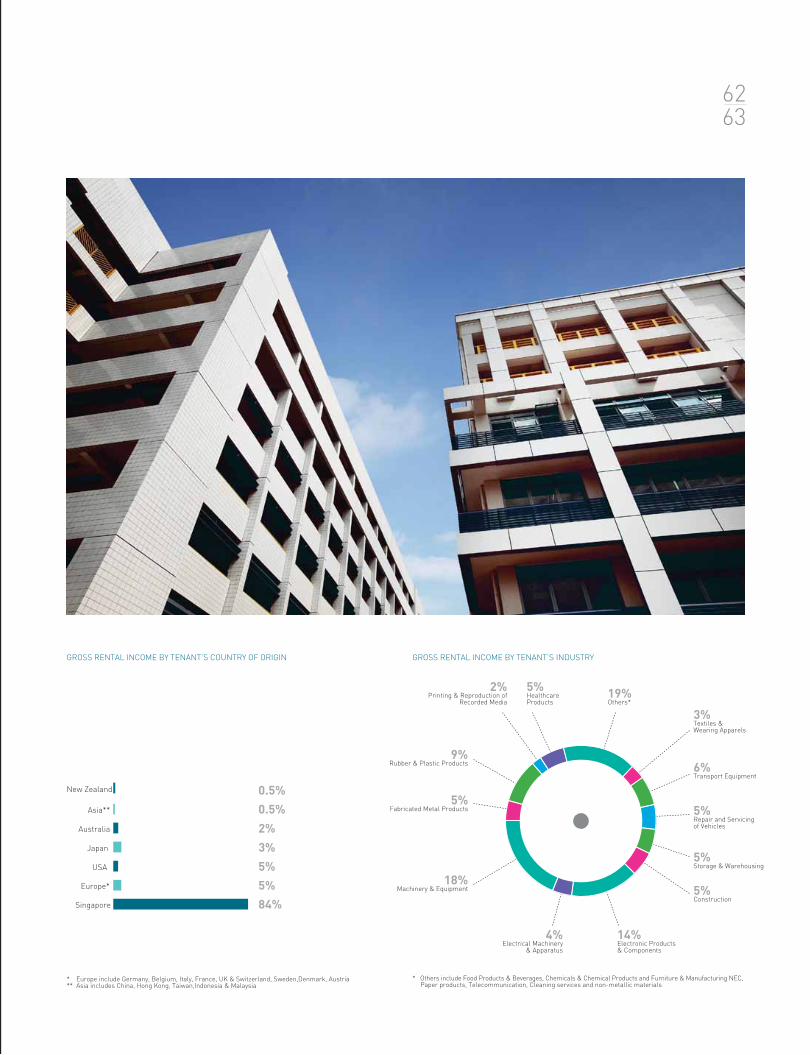
* Others include Food Products & Beverages, Chemicals & Chemical Products and Furniture & Manufacturing NEC, Paper products, Telecommunication, Cleaning services and non-metallic materials
* Europe include Germany, Belgium, Italy, France, UK & Switzerland, Sweden,Denmark, Austria** Asia includes China, Hong Kong, Taiwan,Indonesia & Malaysia
GROSS RENTAL INCOME BY TENANT’S INDUSTRYGROSS RENTAL INCOME BY TENANT’S COUNTRY OF ORIGIN
19%Others*
6%Transport Equipment
5%Repair and Servicingof Vehicles
5%Storage & Warehousing
5%Construction
14%Electronic Products& Components
5%HealthcareProducts
4%Electrical Machinery
& Apparatus
18%Machinery & Equipment
5%Fabricated Metal Products
9%Rubber & Plastic Products
2%Printing & Reproduction of
Recorded Media
3%Textiles &Wearing Apparels
6263
Australia 2%
USA 5%
Japan 3%
0.5%New Zealand
Singapore 84%
Europe* 5%
Asia** 0.5%
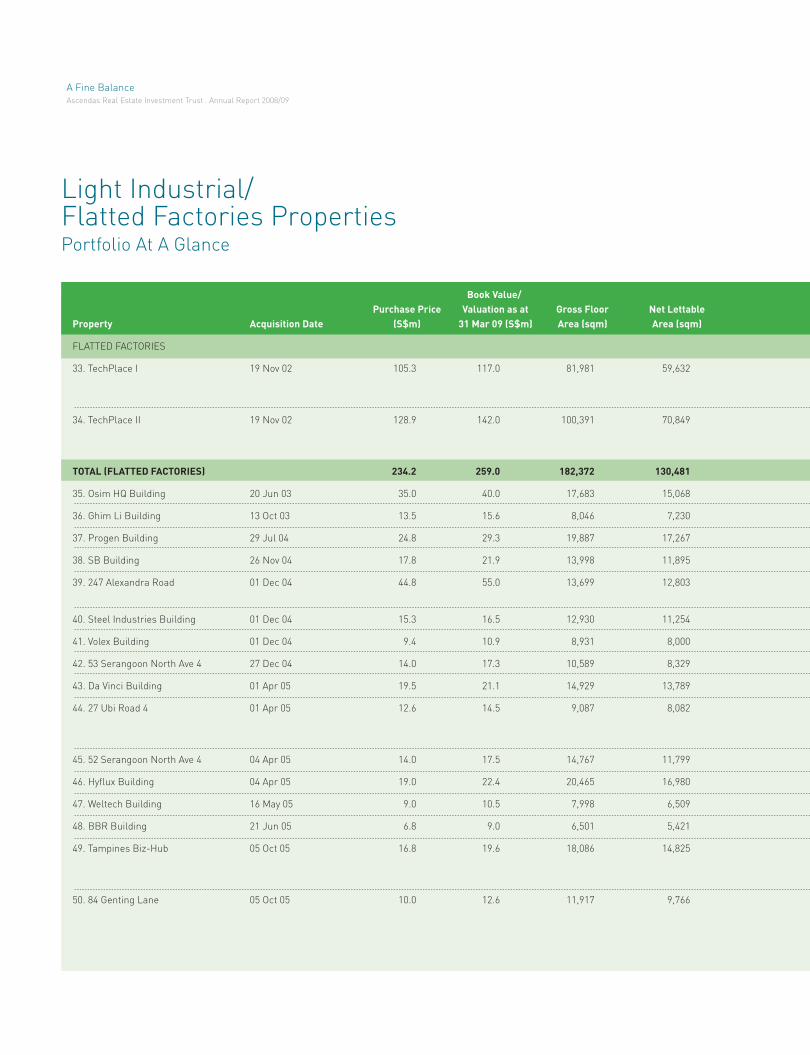
Light Industrial/Flatted Factories PropertiesPortfolio At A Glance
Book Value/
Purchase Price Valuation as at Gross Floor Net Lettable
Property Acquisition Date (S$m) 31 Mar 09 (S$m) Area (sqm) Area (sqm)
FLATTED FACTORIES
33. TechPlace I 19 Nov 02 105.3 117.0 81,981 59,632
34. TechPlace II 19 Nov 02 128.9 142.0 100,391 70,849
TOTAL (FLATTED FACTORIES) 234.2 259.0 182,372 130,481
35. Osim HQ Building 20 Jun 03 35.0 40.0 17,683 15,068
36. Ghim Li Building 13 Oct 03 13.5 15.6 8,046 7,230
37. Progen Building 29 Jul 04 24.8 29.3 19,887 17,267
38. SB Building 26 Nov 04 17.8 21.9 13,998 11,895
39. 247 Alexandra Road 01 Dec 04 44.8 55.0 13,699 12,803
40. Steel Industries Building 01 Dec 04 15.3 16.5 12,930 11,254
41. Volex Building 01 Dec 04 9.4 10.9 8,931 8,000
42. 53 Serangoon North Ave 4 27 Dec 04 14.0 17.3 10,589 8,329
43. Da Vinci Building 01 Apr 05 19.5 21.1 14,929 13,789
44. 27 Ubi Road 4 01 Apr 05 12.6 14.5 9,087 8,082
45. 52 Serangoon North Ave 4 04 Apr 05 14.0 17.5 14,767 11,799
46. Hyflux Building 04 Apr 05 19.0 22.4 20,465 16,980
47. Weltech Building 16 May 05 9.0 10.5 7,998 6,509
48. BBR Building 21 Jun 05 6.8 9.0 6,501 5,421
49. Tampines Biz-Hub 05 Oct 05 16.8 19.6 18,086 14,825
50. 84 Genting Lane 05 Oct 05 10.0 12.6 11,917 9,766
A Fine BalanceAscendas Real Estate Investment Trust . Annual Report 2008/09
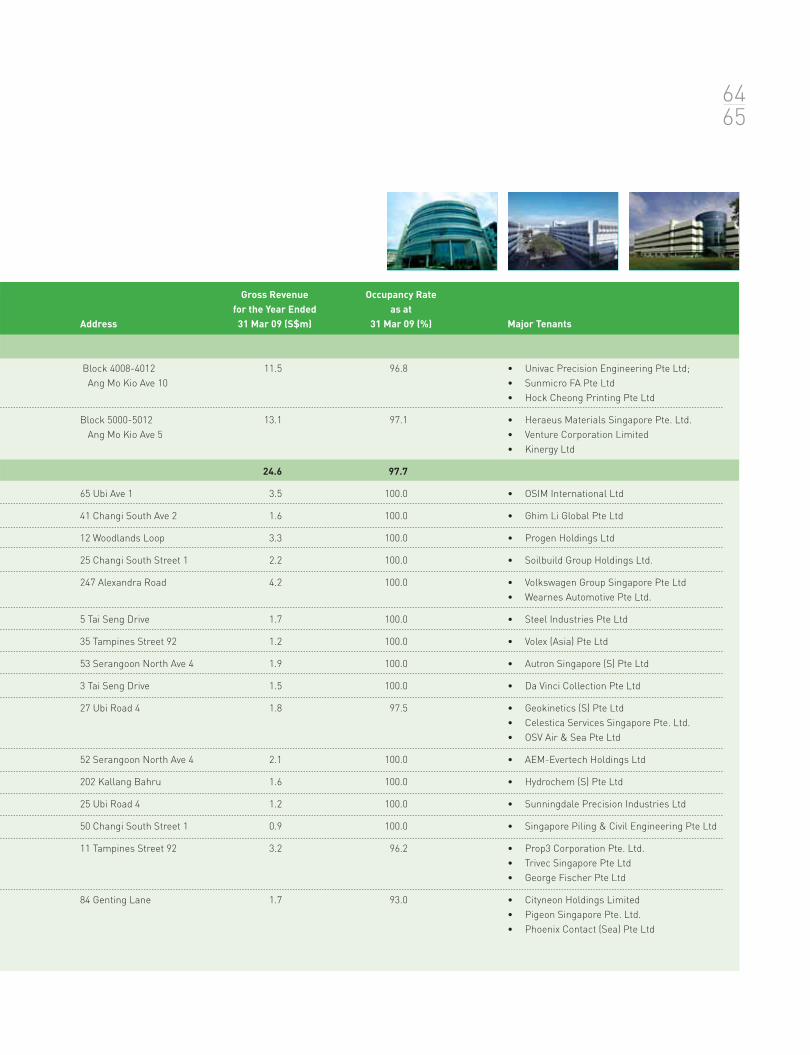
Gross Revenue Occupancy Rate
for the Year Ended as at
Address 31 Mar 09 (S$m) 31 Mar 09 (%) Major Tenants
Block 4008-4012 11.5 96.8 • Univac Precision Engineering Pte Ltd;
Ang Mo Kio Ave 10 • Sunmicro FA Pte Ltd
• Hock Cheong Printing Pte Ltd
Block 5000-5012 13.1 97.1 • Heraeus Materials Singapore Pte. Ltd.
Ang Mo Kio Ave 5 • Venture Corporation Limited
• Kinergy Ltd
24.6 97.7
65 Ubi Ave 1 3.5 100.0 • OSIM International Ltd
41 Changi South Ave 2 1.6 100.0 • Ghim Li Global Pte Ltd
12 Woodlands Loop 3.3 100.0 • Progen Holdings Ltd
25 Changi South Street 1 2.2 100.0 • Soilbuild Group Holdings Ltd.
247 Alexandra Road 4.2 100.0 • Volkswagen Group Singapore Pte Ltd
• Wearnes Automotive Pte Ltd.
5 Tai Seng Drive 1.7 100.0 • Steel Industries Pte Ltd
35 Tampines Street 92 1.2 100.0 • Volex (Asia) Pte Ltd
53 Serangoon North Ave 4 1.9 100.0 • Autron Singapore (S) Pte Ltd
3 Tai Seng Drive 1.5 100.0 • Da Vinci Collection Pte Ltd
27 Ubi Road 4 1.8 97.5 • Geokinetics (S) Pte Ltd
• Celestica Services Singapore Pte. Ltd.
• OSV Air & Sea Pte Ltd
52 Serangoon North Ave 4 2.1 100.0 • AEM-Evertech Holdings Ltd
202 Kallang Bahru 1.6 100.0 • Hydrochem (S) Pte Ltd
25 Ubi Road 4 1.2 100.0 • Sunningdale Precision Industries Ltd
50 Changi South Street 1 0.9 100.0 • Singapore Piling & Civil Engineering Pte Ltd
11 Tampines Street 92 3.2 96.2 • Prop3 Corporation Pte. Ltd.
• Trivec Singapore Pte Ltd
• George Fischer Pte Ltd
84 Genting Lane 1.7 93.0 • Cityneon Holdings Limited
• Pigeon Singapore Pte. Ltd.
• Phoenix Contact (Sea) Pte Ltd
6465
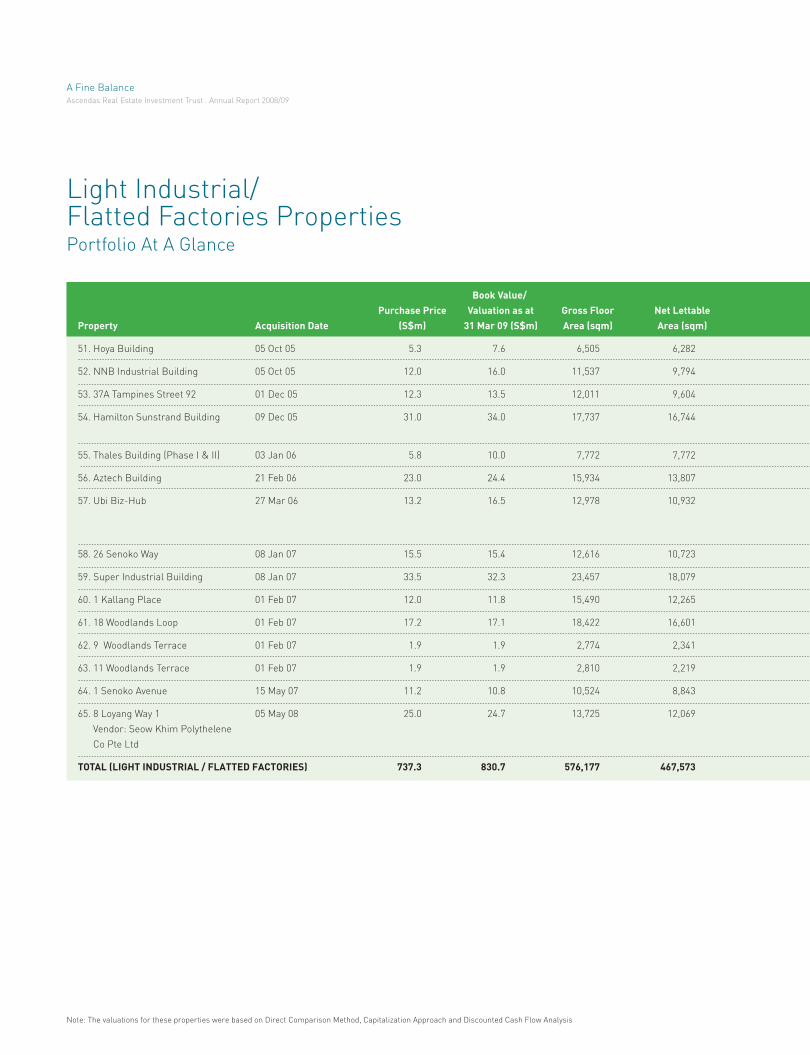
Note: The valuations for these properties were based on Direct Comparison Method, Capitalization Approach and Discounted Cash Flow Analysis
Light Industrial/Flatted Factories PropertiesPortfolio At A Glance
Book Value/
Purchase Price Valuation as at Gross Floor Net Lettable
Property Acquisition Date (S$m) 31 Mar 09 (S$m) Area (sqm) Area (sqm)
51. Hoya Building 05 Oct 05 5.3 7.6 6,505 6,282
52. NNB Industrial Building 05 Oct 05 12.0 16.0 11,537 9,794
53. 37A Tampines Street 92 01 Dec 05 12.3 13.5 12,011 9,604
54. Hamilton Sunstrand Building 09 Dec 05 31.0 34.0 17,737 16,744
55. Thales Building (Phase I & II) 03 Jan 06 5.8 10.0 7,772 7,772
56. Aztech Building 21 Feb 06 23.0 24.4 15,934 13,807
57. Ubi Biz-Hub 27 Mar 06 13.2 16.5 12,978 10,932
58. 26 Senoko Way 08 Jan 07 15.5 15.4 12,616 10,723
59. Super Industrial Building 08 Jan 07 33.5 32.3 23,457 18,079
60. 1 Kallang Place 01 Feb 07 12.0 11.8 15,490 12,265
61. 18 Woodlands Loop 01 Feb 07 17.2 17.1 18,422 16,601
62. 9 Woodlands Terrace 01 Feb 07 1.9 1.9 2,774 2,341
63. 11 Woodlands Terrace 01 Feb 07 1.9 1.9 2,810 2,219
64. 1 Senoko Avenue 15 May 07 11.2 10.8 10,524 8,843
65. 8 Loyang Way 1 05 May 08 25.0 24.7 13,725 12,069
Vendor: Seow Khim Polythelene
Co Pte Ltd
TOTAL (LIGHT INDUSTRIAL / FLATTED FACTORIES) 737.3 830.7 576,177 467,573
A Fine BalanceAscendas Real Estate Investment Trust . Annual Report 2008/09
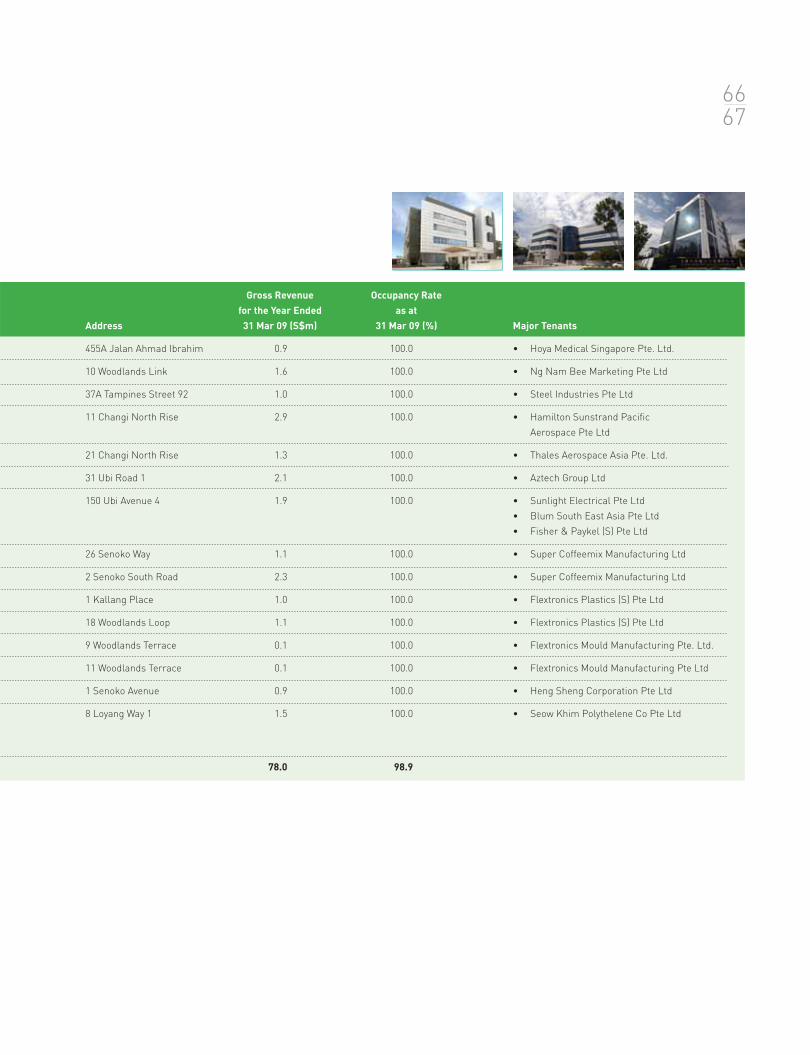
Gross Revenue Occupancy Rate
for the Year Ended as at
Address 31 Mar 09 (S$m) 31 Mar 09 (%) Major Tenants
455A Jalan Ahmad Ibrahim 0.9 100.0 • Hoya Medical Singapore Pte. Ltd.
10 Woodlands Link 1.6 100.0 • Ng Nam Bee Marketing Pte Ltd
37A Tampines Street 92 1.0 100.0 • Steel Industries Pte Ltd
11 Changi North Rise 2.9 100.0 • Hamilton Sunstrand Pacific
Aerospace Pte Ltd
21 Changi North Rise 1.3 100.0 • Thales Aerospace Asia Pte. Ltd.
31 Ubi Road 1 2.1 100.0 • Aztech Group Ltd
150 Ubi Avenue 4 1.9 100.0 • Sunlight Electrical Pte Ltd
• Blum South East Asia Pte Ltd
• Fisher & Paykel (S) Pte Ltd
26 Senoko Way 1.1 100.0 • Super Coffeemix Manufacturing Ltd
2 Senoko South Road 2.3 100.0 • Super Coffeemix Manufacturing Ltd
1 Kallang Place 1.0 100.0 • Flextronics Plastics (S) Pte Ltd
18 Woodlands Loop 1.1 100.0 • Flextronics Plastics (S) Pte Ltd
9 Woodlands Terrace 0.1 100.0 • Flextronics Mould Manufacturing Pte. Ltd.
11 Woodlands Terrace 0.1 100.0 • Flextronics Mould Manufacturing Pte Ltd
1 Senoko Avenue 0.9 100.0 • Heng Sheng Corporation Pte Ltd
8 Loyang Way 1 1.5 100.0 • Seow Khim Polythelene Co Pte Ltd
78.0 98.9
6667
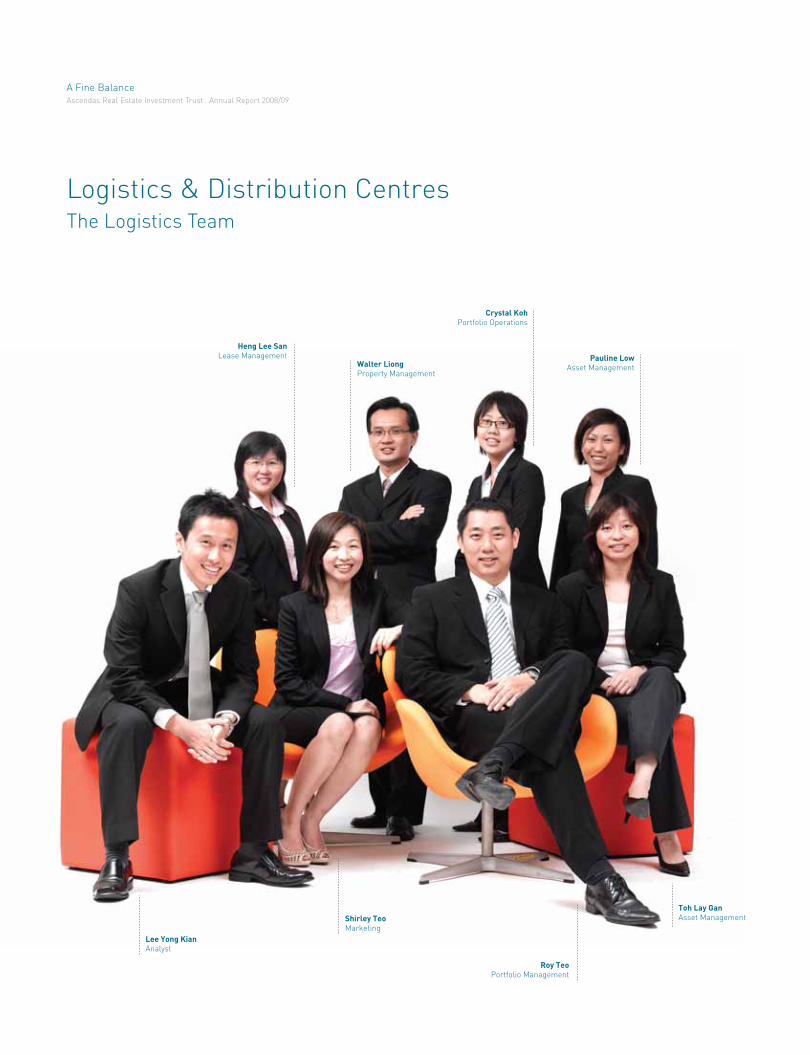
Logistics & Distribution CentresThe Logistics Team
Heng Lee San
Lease ManagementWalter Liong
Property Management
Crystal Koh
Portfolio Operations
Pauline Low
Asset Management
Lee Yong Kian
Analyst
Shirley Teo
Marketing
Roy Teo
Portfolio Management
Toh Lay Gan
Asset Management
A Fine BalanceAscendas Real Estate Investment Trust . Annual Report 2008/09

29%Distributors,Trading Company
10%Others
61%3rd Party Logistics,
Freight Forwarding, Shipping
76%Singapore
2%Europe*
9%Asia**
9%USA
3%Japan
Bermuda 1%
* Europe include Germany, Belgium, Italy, France, UK & Switzerland, Sweden,Denmark, Austria** Asia includes China, Hong Kong, Taiwan,Indonesia & Malaysia
GROSS RENTAL INCOME BY TENANT’S INDUSTRYGROSS RENTAL INCOME BY TENANT’S COUNTRY OF ORIGIN
6869
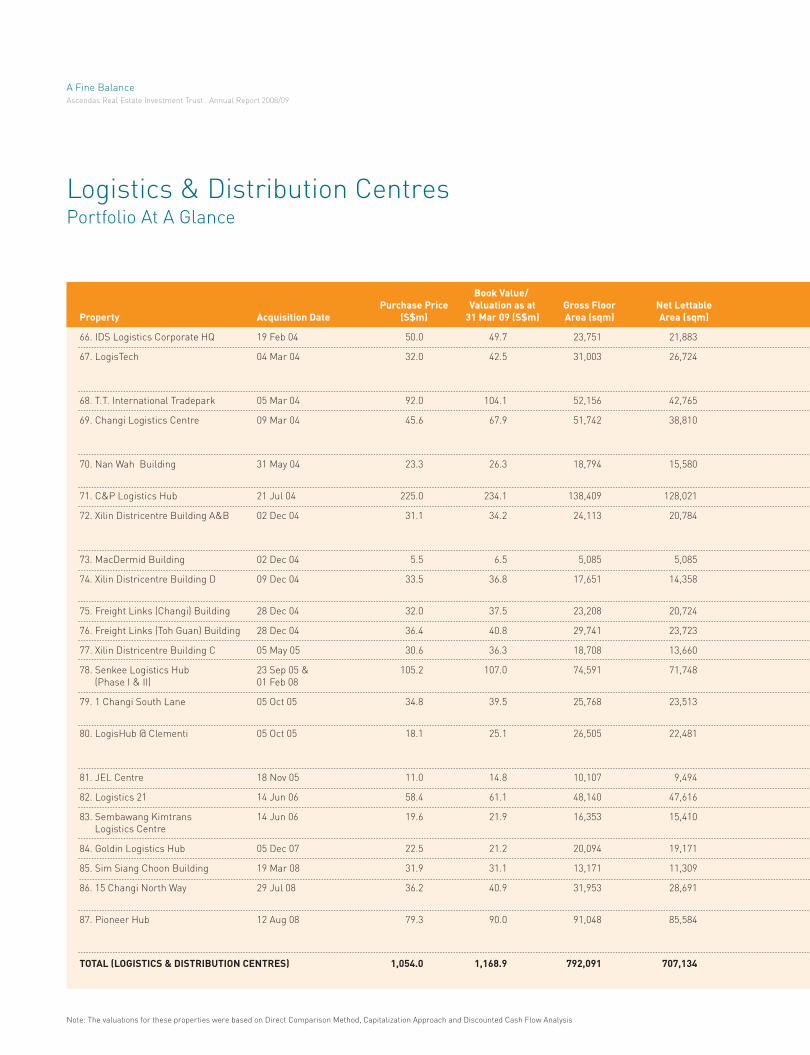
Note: The valuations for these properties were based on Direct Comparison Method, Capitalization Approach and Discounted Cash Flow Analysis
Logistics & Distribution CentresPortfolio At A Glance
Book Value/
Purchase Price Valuation as at Gross Floor Net Lettable
Property Acquisition Date (S$m) 31 Mar 09 (S$m) Area (sqm) Area (sqm)
66. IDS Logistics Corporate HQ 19 Feb 04 50.0 49.7 23,751 21,883
67. LogisTech 04 Mar 04 32.0 42.5 31,003 26,724
68. T.T. International Tradepark 05 Mar 04 92.0 104.1 52,156 42,765
69. Changi Logistics Centre 09 Mar 04 45.6 67.9 51,742 38,810
70. Nan Wah Building 31 May 04 23.3 26.3 18,794 15,580
71. C&P Logistics Hub 21 Jul 04 225.0 234.1 138,409 128,021
72. Xilin Districentre Building A&B 02 Dec 04 31.1 34.2 24,113 20,784
73. MacDermid Building 02 Dec 04 5.5 6.5 5,085 5,085
74. Xilin Districentre Building D 09 Dec 04 33.5 36.8 17,651 14,358
75. Freight Links (Changi) Building 28 Dec 04 32.0 37.5 23,208 20,724
76. Freight Links (Toh Guan) Building 28 Dec 04 36.4 40.8 29,741 23,723
77. Xilin Districentre Building C 05 May 05 30.6 36.3 18,708 13,660
78. Senkee Logistics Hub 23 Sep 05 & 105.2 107.0 74,591 71,748
(Phase I & II) 01 Feb 08
79. 1 Changi South Lane 05 Oct 05 34.8 39.5 25,768 23,513
80. LogisHub @ Clementi 05 Oct 05 18.1 25.1 26,505 22,481
81. JEL Centre 18 Nov 05 11.0 14.8 10,107 9,494
82. Logistics 21 14 Jun 06 58.4 61.1 48,140 47,616
83. Sembawang Kimtrans 14 Jun 06 19.6 21.9 16,353 15,410
Logistics Centre
84. Goldin Logistics Hub 05 Dec 07 22.5 21.2 20,094 19,171
85. Sim Siang Choon Building 19 Mar 08 31.9 31.1 13,171 11,309
86. 15 Changi North Way 29 Jul 08 36.2 40.9 31,953 28,691
87. Pioneer Hub 12 Aug 08 79.3 90.0 91,048 85,584
TOTAL (LOGISTICS & DISTRIBUTION CENTRES) 1,054.0 1,168.9 792,091 707,134
A Fine BalanceAscendas Real Estate Investment Trust . Annual Report 2008/09
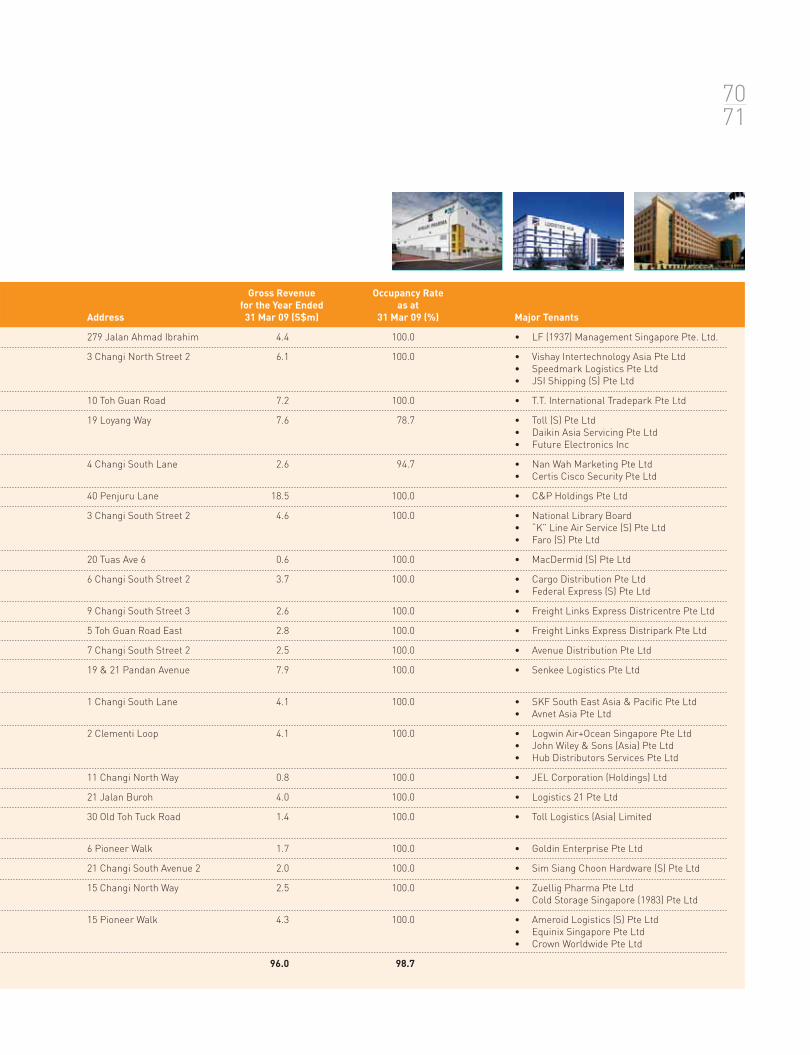
Gross Revenue Occupancy Rate
for the Year Ended as at
Address 31 Mar 09 (S$m) 31 Mar 09 (%) Major Tenants
279 Jalan Ahmad Ibrahim 4.4 100.0 • LF (1937) Management Singapore Pte. Ltd.
3 Changi North Street 2 6.1 100.0 • Vishay Intertechnology Asia Pte Ltd
• Speedmark Logistics Pte Ltd
• JSI Shipping (S) Pte Ltd
10 Toh Guan Road 7.2 100.0 • T.T. International Tradepark Pte Ltd
19 Loyang Way 7.6 78.7 • Toll (S) Pte Ltd
• Daikin Asia Servicing Pte Ltd
• Future Electronics Inc
4 Changi South Lane 2.6 94.7 • Nan Wah Marketing Pte Ltd
• Certis Cisco Security Pte Ltd
40 Penjuru Lane 18.5 100.0 • C&P Holdings Pte Ltd
3 Changi South Street 2 4.6 100.0 • National Library Board
• “K” Line Air Service (S) Pte Ltd
• Faro (S) Pte Ltd
20 Tuas Ave 6 0.6 100.0 • MacDermid (S) Pte Ltd
6 Changi South Street 2 3.7 100.0 • Cargo Distribution Pte Ltd
• Federal Express (S) Pte Ltd
9 Changi South Street 3 2.6 100.0 • Freight Links Express Districentre Pte Ltd
5 Toh Guan Road East 2.8 100.0 • Freight Links Express Distripark Pte Ltd
7 Changi South Street 2 2.5 100.0 • Avenue Distribution Pte Ltd
19 & 21 Pandan Avenue 7.9 100.0 • Senkee Logistics Pte Ltd
1 Changi South Lane 4.1 100.0 • SKF South East Asia & Pacific Pte Ltd
• Avnet Asia Pte Ltd
2 Clementi Loop 4.1 100.0 • Logwin Air+Ocean Singapore Pte Ltd
• John Wiley & Sons (Asia) Pte Ltd
• Hub Distributors Services Pte Ltd
11 Changi North Way 0.8 100.0 • JEL Corporation (Holdings) Ltd
21 Jalan Buroh 4.0 100.0 • Logistics 21 Pte Ltd
30 Old Toh Tuck Road 1.4 100.0 • Toll Logistics (Asia) Limited
6 Pioneer Walk 1.7 100.0 • Goldin Enterprise Pte Ltd
21 Changi South Avenue 2 2.0 100.0 • Sim Siang Choon Hardware (S) Pte Ltd
15 Changi North Way 2.5 100.0 • Zuellig Pharma Pte Ltd
• Cold Storage Singapore (1983) Pte Ltd
15 Pioneer Walk 4.3 100.0 • Ameroid Logistics (S) Pte Ltd
• Equinix Singapore Pte Ltd
• Crown Worldwide Pte Ltd
96.0 98.7
7071
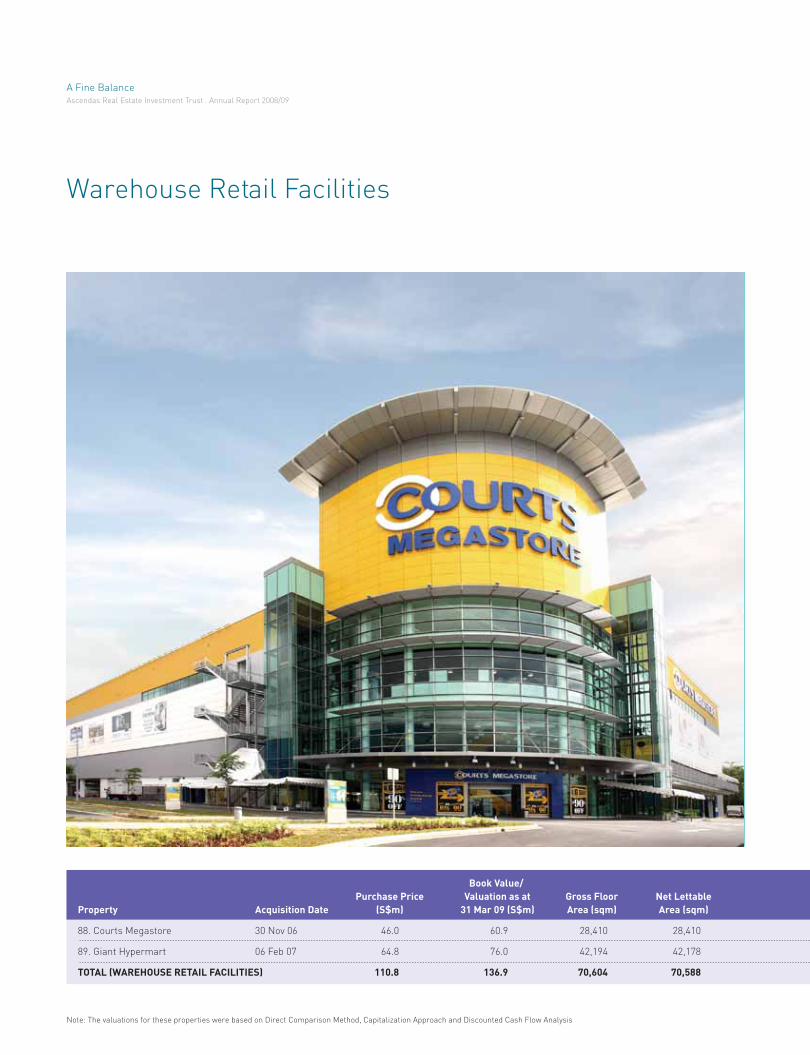
Note: The valuations for these properties were based on Direct Comparison Method, Capitalization Approach and Discounted Cash Flow Analysis
Warehouse Retail Facilities
Book Value/
Purchase Price Valuation as at Gross Floor Net Lettable
Property Acquisition Date (S$m) 31 Mar 09 (S$m) Area (sqm) Area (sqm)
88. Courts Megastore 30 Nov 06 46.0 60.9 28,410 28,410
89. Giant Hypermart 06 Feb 07 64.8 76.0 42,194 42,178
TOTAL (WAREHOUSE RETAIL FACILITIES) 110.8 136.9 70,604 70,588
A Fine BalanceAscendas Real Estate Investment Trust . Annual Report 2008/09
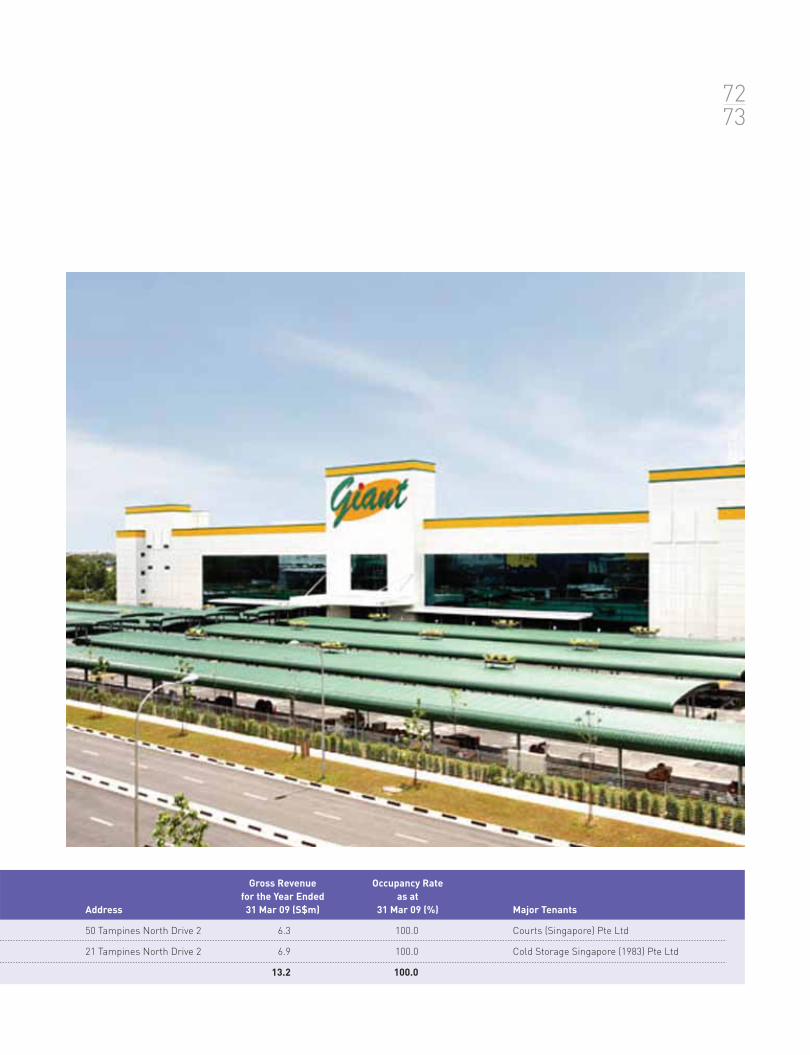
Gross Revenue Occupancy Rate
for the Year Ended as at
Address 31 Mar 09 (S$m) 31 Mar 09 (%) Major Tenants
50 Tampines North Drive 2 6.3 100.0 Courts (Singapore) Pte Ltd
21 Tampines North Drive 2 6.9 100.0 Cold Storage Singapore (1983) Pte Ltd
13.2 100.0
7273

Enhancing Corporate Social Responsibilities
Striking a balance between
hardware and “heart-ware” within
the business, the Manager
continues in its pursuit to build
strong partnerships with the
communities in which we serve.
Committed to manage all aspects
of our business in an ethical,
responsible and sustainable way,
we continue to show our
appreciation and do our part
through the support for the arts; to
continuously improve and sustain
the environment, and promote
initiatives that uphold health and
safety standards.
Together with the Ascendas Group,
the Manager is actively involved in
various community and customer care
programmes and activities to build
rapport with the community-at-large
as well as with our customers.
During the month, a roving
exhibition showcasing information
on global warming, climate issues,
green practices and a full-scale
eco-office cubicle made its rounds
at Ascendas’ properties in
Singapore. A dedicated website at
www.ascendas.com/greenmonth
was also published to facilitate
knowledge sharing on green
initiatives.
Healthy Lifestyle Week @
Singapore Science Park
All work and no play makes Jack a
dull boy! Promoting a healthy
lifestyle amongst people working
within the Singapore Science Park,
a series of competitive games and
lectures on healthy diet were
organized in the name of health,
fitness and fun in September 2008.
This is also in line with the objective
of providing a Live, Work and Play
lifestyle for tenants in the Singapore
Science Park. A series of bazaars was
also organised at the various buildings
located in the Singapore Science Park
to generate interest and vibrancy.
Ascendas Green Month
We recognise the impact our
business has on the environment.
In October 2008, the Ascendas
Green Movement, a month-long
campaign to promote green
practices and participation amongst
its tenants and employees in
Singapore was launched.
Tenants were treated to exciting
lunchtime entertainment, games
and bazaar featuring performances
and exhibits centred on the theme
of embracing green practices. Prior
to the launch, tenants were also
invited to participate in the
“Donate-a-Tree” programme, in
which companies and individuals
enthusiastically donated 76 tree
saplings to offset carbon dioxide
emissions. Ascendas matched the
donations one-for-one for a total of
152 trees that were planted at the
Kent Ridge Park.
In conjunction with the Healthy
Lifestyle week, the Ascendas
Charity Week was organized to
extend care and concern to those
in need. More than 65 Ascendas
staff and their children distributed
mooncakes and lanterns to senior
citizens registered with the Lions
Befrienders Association of
Singapore. Proceeds from the
bazaar were donated to the
President’s Challenge 2008.
Free health screening was
also provided at the Science Hub
in Singapore Science Park I over
a 4-day period. Over 150
participants received free health
examinations provided by the
Health Promotion Board.
A Fine BalanceAscendas Real Estate Investment Trust . Annual Report 2008/09

Platinum Green Mark Certification
In April 2009, A-REIT’s sixth
development project, a business
park development for Citibank N.A.,
at 3 Changi Business Park
Crescent was awarded the
Platinum Green Mark Certification
by Singapore’s Building &
Construction Authority. This
development obtained its
Temporary Occupation Permit on
16 February 2009.
The Platinum Green Mark
Certification is the highest accolade
in Singapore for environmental
sustainability. The development
incorporates environmental-friendly
features such as Rain Water and
Grey Water collection systems as
well as motion detectors that activate
lighting in the toilets and stairwells
only when needed. These
environmental and energy-saving
features are expected to reduce
building energy consumption by up
to 33% compared to a conventional
building with similar functionalities.
It also provide a healthier indoor
environment as well as minimise any
adverse impacts of the development
on the environment.
This award further demonstrates
A-REIT’s design and development
capabilities and affirms its strong
commitment to work closely with
the end-user to achieve common
goals of both parties.
Bollywood @ Science Park
Resonating rhythmic drum beats
and Indian fusion music by local
Indian bands, Bollywood@Science
Park attracted about 300 tenants
and their families on 14 August
2008. This event, aimed at
promoting interaction and
camaraderie amongst tenants of
Science Park, saw bhangra
dancers, a snake charmer, Indian
classical dancers as well as booths
offering henna drawing. Attendees
got a treat with a wide variety of
authentic Indian food served in the
buffet line.
Oktober Fest @ Swiss Club
Some tenants from A-REIT’s
Logistics sector joined in the annual
Oktober Festival at the Singapore
Swiss Club in celebrating the Festival
of Beer. It was an evening of fun and
dance as tenants mingled freely as
they cheered to another year of joy
and laughter ahead.
Lion Dance Performance
A symbol of good luck and fortune,
a series of lion dance performances
were organized during the Lunar
New Year period for A-REIT’s
tenants in its Hi-Tech Industrial
and Light Industrial properties.
Staff from the Property Manager
was also at site to distribute
mandarin oranges to the tenants
to bring good cheer and prosperity
to all.
Ascendas CEO Night with CATS
Connecting fellow CEOs from an array
of industries, Ascendas held its annual
CEO Night at the Esplanade in April
2009. This event provided an
opportunity to get to know other fellow
CEOs and renew contacts in an
entertaining environment. Besides
good food and drinks, tenants and
business associates were invited to an
enjoyable and fun evening at the
spectacular musical sensation – CATS.
Enhancing Corporate Social Responsibilities
7475
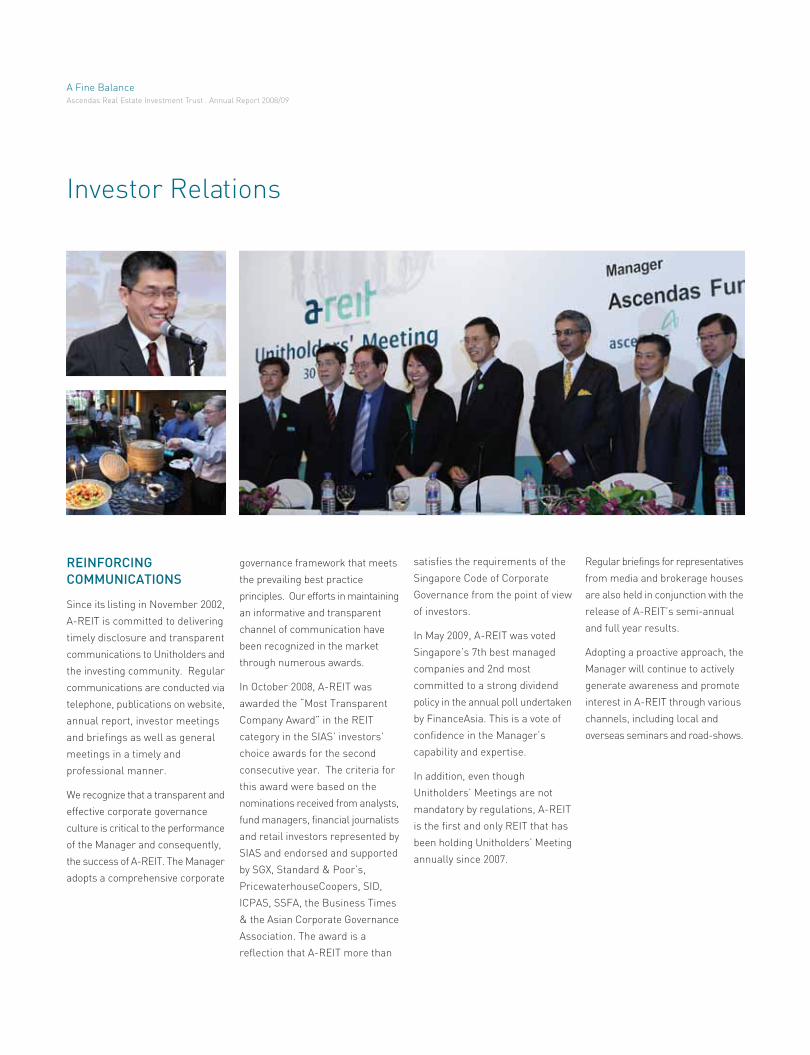
Investor Relations
REINFORCING
COMMUNICATIONS
Since its listing in November 2002,
A-REIT is committed to delivering
timely disclosure and transparent
communications to Unitholders and
the investing community. Regular
communications are conducted via
telephone, publications on website,
annual report, investor meetings
and briefings as well as general
meetings in a timely and
professional manner.
We recognize that a transparent and
effective corporate governance
culture is critical to the performance
of the Manager and consequently,
the success of A-REIT. The Manager
adopts a comprehensive corporate
governance framework that meets
the prevailing best practice
principles. Our efforts in maintaining
an informative and transparent
channel of communication have
been recognized in the market
through numerous awards.
In October 2008, A-REIT was
awarded the “Most Transparent
Company Award” in the REIT
category in the SIAS’ investors’
choice awards for the second
consecutive year. The criteria for
this award were based on the
nominations received from analysts,
fund managers, financial journalists
and retail investors represented by
SIAS and endorsed and supported
by SGX, Standard & Poor’s,
PricewaterhouseCoopers, SID,
ICPAS, SSFA, the Business Times
& the Asian Corporate Governance
Association. The award is a
reflection that A-REIT more than
satisfies the requirements of the
Singapore Code of Corporate
Governance from the point of view
of investors.
In May 2009, A-REIT was voted
Singapore’s 7th best managed
companies and 2nd most
committed to a strong dividend
policy in the annual poll undertaken
by FinanceAsia. This is a vote of
confidence in the Manager’s
capability and expertise.
In addition, even though
Unitholders’ Meetings are not
mandatory by regulations, A-REIT
is the first and only REIT that has
been holding Unitholders’ Meeting
annually since 2007.
Regular briefings for representatives
from media and brokerage houses
are also held in conjunction with the
release of A-REIT’s semi-annual
and full year results.
Adopting a proactive approach, the
Manager will continue to actively
generate awareness and promote
interest in A-REIT through various
channels, including local and
overseas seminars and road-shows.
A Fine BalanceAscendas Real Estate Investment Trust . Annual Report 2008/09
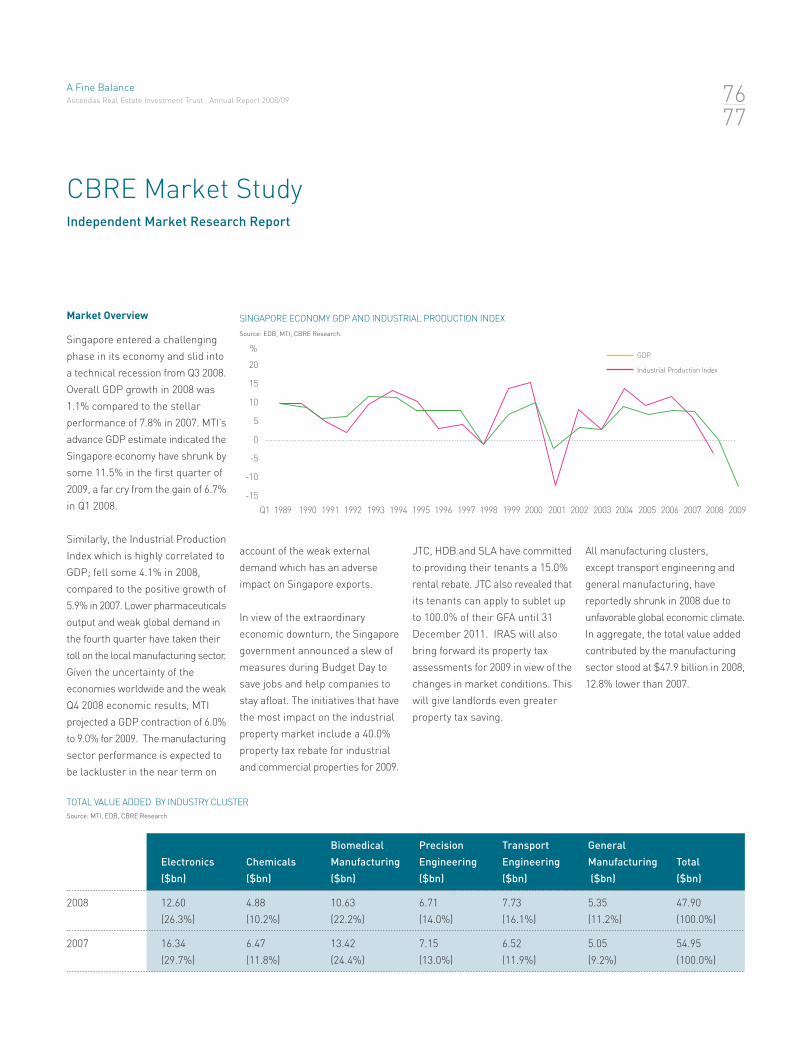
CBRE Market Study
Market Overview
Singapore entered a challenging
phase in its economy and slid into
a technical recession from Q3 2008.
Overall GDP growth in 2008 was
1.1% compared to the stellar
performance of 7.8% in 2007. MTI’s
advance GDP estimate indicated the
Singapore economy have shrunk by
some 11.5% in the first quarter of
2009, a far cry from the gain of 6.7%
in Q1 2008.
Similarly, the Industrial Production
Index which is highly correlated to
GDP; fell some 4.1% in 2008,
compared to the positive growth of
5.9% in 2007. Lower pharmaceuticals
output and weak global demand in
the fourth quarter have taken their
toll on the local manufacturing sector.
Given the uncertainty of the
economies worldwide and the weak
Q4 2008 economic results, MTI
projected a GDP contraction of 6.0%
to 9.0% for 2009. The manufacturing
sector performance is expected to
be lackluster in the near term on
Biomedical Precision Transport General
Electronics Chemicals Manufacturing Engineering Engineering Manufacturing Total
($bn) ($bn) ($bn) ($bn) ($bn) ($bn) ($bn)
2008 12.60 4.88 10.63 6.71 7.73 5.35 47.90
(26.3%) (10.2%) (22.2%) (14.0%) (16.1%) (11.2%) (100.0%)
2007 16.34 6.47 13.42 7.15 6.52 5.05 54.95
(29.7%) (11.8%) (24.4%) (13.0%) (11.9%) (9.2%) (100.0%)
account of the weak external
demand which has an adverse
impact on Singapore exports.
In view of the extraordinary
economic downturn, the Singapore
government announced a slew of
measures during Budget Day to
save jobs and help companies to
stay afloat. The initiatives that have
the most impact on the industrial
property market include a 40.0%
property tax rebate for industrial
and commercial properties for 2009.
JTC, HDB and SLA have committed
to providing their tenants a 15.0%
rental rebate. JTC also revealed that
its tenants can apply to sublet up
to 100.0% of their GFA until 31
December 2011. IRAS will also
bring forward its property tax
assessments for 2009 in view of the
changes in market conditions. This
will give landlords even greater
property tax saving.
Source: EDB, MTI, CBRE Research.
%
SINGAPORE ECONOMY GDP AND INDUSTRIAL PRODUCTION INDEX
20
15
10
5
0
-5
-10
-15
GDP
Industrial Production Index
Independent Market Research Report
All manufacturing clusters,
except transport engineering and
general manufacturing, have
reportedly shrunk in 2008 due to
unfavorable global economic climate.
In aggregate, the total value added
contributed by the manufacturing
sector stood at $47.9 billion in 2008,
12.8% lower than 2007.
1989 1990 1991 1992 1993 1994 1995 1996 1997 1998 1999 2000 2001 2002 2003 2004 2005 2006 2007 2008 2009Q1
TOTAL VALUE ADDED BY INDUSTRY CLUSTER
Source: MTI, EDB, CBRE Research
7677
A Fine BalanceAscendas Real Estate Investment Trust . Annual Report 2008/09
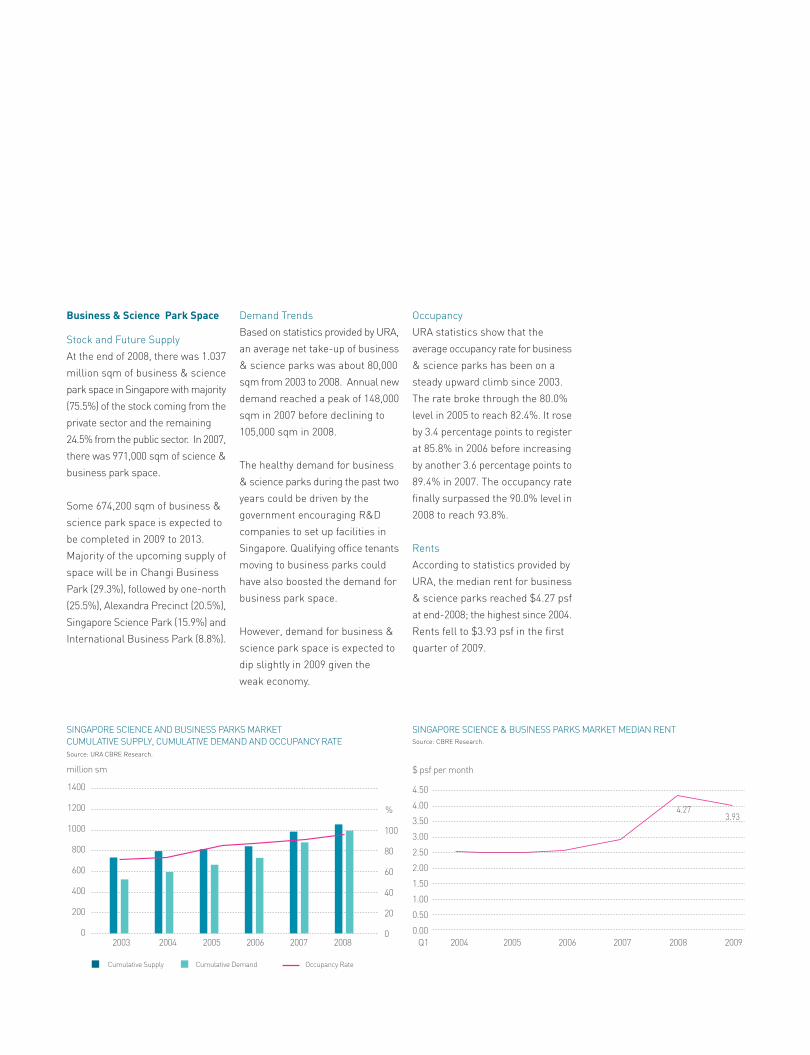
Business & Science Park Space
Stock and Future Supply
At the end of 2008, there was 1.037
million sqm of business & science
park space in Singapore with majority
(75.5%) of the stock coming from the
private sector and the remaining
24.5% from the public sector. In 2007,
there was 971,000 sqm of science &
business park space.
Some 674,200 sqm of business &
science park space is expected to
be completed in 2009 to 2013.
Majority of the upcoming supply of
space will be in Changi Business
Park (29.3%), followed by one-north
(25.5%), Alexandra Precinct (20.5%),
Singapore Science Park (15.9%) and
International Business Park (8.8%).
Demand Trends
Based on statistics provided by URA,
an average net take-up of business
& science parks was about 80,000
sqm from 2003 to 2008. Annual new
demand reached a peak of 148,000
sqm in 2007 before declining to
105,000 sqm in 2008.
The healthy demand for business
& science parks during the past two
years could be driven by the
government encouraging R&D
companies to set up facilities in
Singapore. Qualifying office tenants
moving to business parks could
have also boosted the demand for
business park space.
However, demand for business &
science park space is expected to
dip slightly in 2009 given the
weak economy.
Occupancy
URA statistics show that the
average occupancy rate for business
& science parks has been on a
steady upward climb since 2003.
The rate broke through the 80.0%
level in 2005 to reach 82.4%. It rose
by 3.4 percentage points to register
at 85.8% in 2006 before increasing
by another 3.6 percentage points to
89.4% in 2007. The occupancy rate
finally surpassed the 90.0% level in
2008 to reach 93.8%.
Rents
According to statistics provided by
URA, the median rent for business
& science parks reached $4.27 psf
at end-2008; the highest since 2004.
Rents fell to $3.93 psf in the first
quarter of 2009.
Source: CBRE Research.
SINGAPORE SCIENCE & BUSINESS PARKS MARKET MEDIAN RENT
4.50
4.00
3.50
3.00
2.50
2.00
1.50
1.00
0.50
0.00
4.273.93
$ psf per month
2004 2005 2006 2007 2008 2009Q1
SINGAPORE SCIENCE AND BUSINESS PARKS MARKET
CUMULATIVE SUPPLY, CUMULATIVE DEMAND AND OCCUPANCY RATE
Cumulative Supply
Source: URA CBRE Research.
million sm
1400
1200
1000
800
600
400
200
02003 2004 2005 2006 2007 2008
100
80
60
40
20
0
%
Cumulative Demand Occupancy Rate
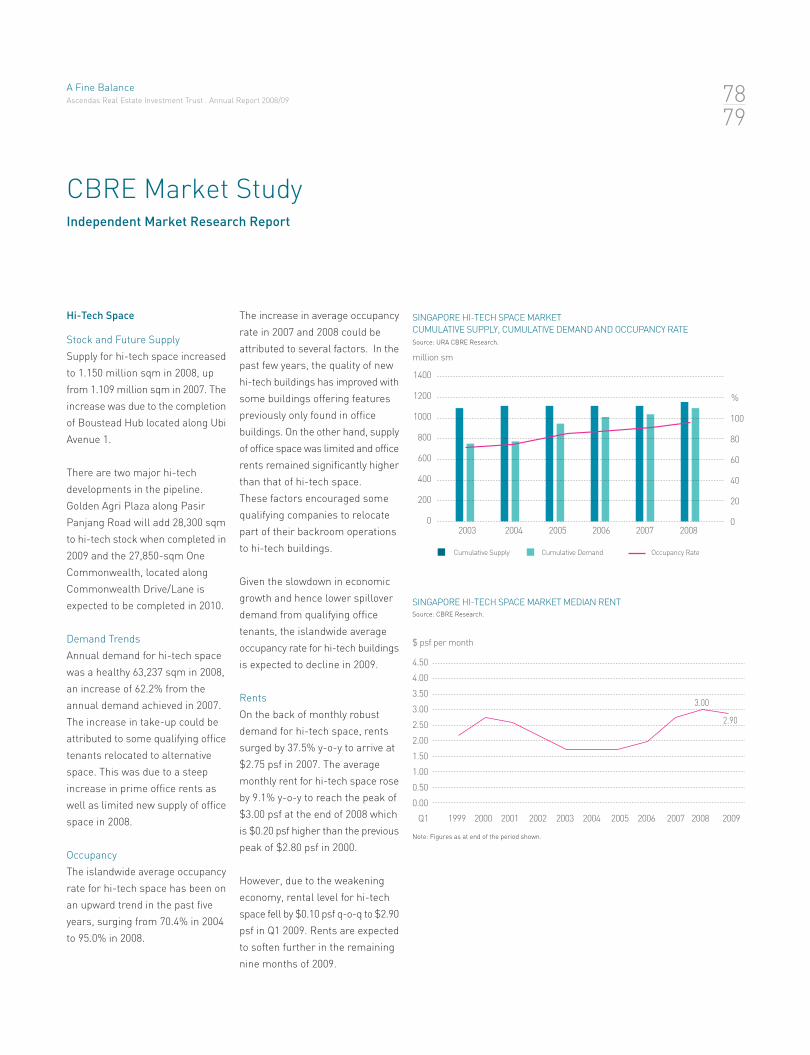
Hi-Tech Space
Stock and Future Supply
Supply for hi-tech space increased
to 1.150 million sqm in 2008, up
from 1.109 million sqm in 2007. The
increase was due to the completion
of Boustead Hub located along Ubi
Avenue 1.
There are two major hi-tech
developments in the pipeline.
Golden Agri Plaza along Pasir
Panjang Road will add 28,300 sqm
to hi-tech stock when completed in
2009 and the 27,850-sqm One
Commonwealth, located along
Commonwealth Drive/Lane is
expected to be completed in 2010.
Demand Trends
Annual demand for hi-tech space
was a healthy 63,237 sqm in 2008,
an increase of 62.2% from the
annual demand achieved in 2007.
The increase in take-up could be
attributed to some qualifying office
tenants relocated to alternative
space. This was due to a steep
increase in prime office rents as
well as limited new supply of office
space in 2008.
Occupancy
The islandwide average occupancy
rate for hi-tech space has been on
an upward trend in the past five
years, surging from 70.4% in 2004
to 95.0% in 2008.
CBRE Market Study
The increase in average occupancy
rate in 2007 and 2008 could be
attributed to several factors. In the
past few years, the quality of new
hi-tech buildings has improved with
some buildings offering features
previously only found in office
buildings. On the other hand, supply
of office space was limited and office
rents remained significantly higher
than that of hi-tech space.
These factors encouraged some
qualifying companies to relocate
part of their backroom operations
to hi-tech buildings.
Given the slowdown in economic
growth and hence lower spillover
demand from qualifying office
tenants, the islandwide average
occupancy rate for hi-tech buildings
is expected to decline in 2009.
Rents
On the back of monthly robust
demand for hi-tech space, rents
surged by 37.5% y-o-y to arrive at
$2.75 psf in 2007. The average
monthly rent for hi-tech space rose
by 9.1% y-o-y to reach the peak of
$3.00 psf at the end of 2008 which
is $0.20 psf higher than the previous
peak of $2.80 psf in 2000.
However, due to the weakening
economy, rental level for hi-tech
space fell by $0.10 psf q-o-q to $2.90
psf in Q1 2009. Rents are expected
to soften further in the remaining
nine months of 2009.
Source: CBRE Research.
SINGAPORE HI-TECH SPACE MARKET MEDIAN RENT
4.50
4.00
3.50
3.00
2.50
2.00
1.50
1.00
0.50
0.00
3.00
2.90
$ psf per month
1999 2000 2001 2002 2003 2004 2005 2006 2007 2008 2009Q1
SINGAPORE HI-TECH SPACE MARKET
CUMULATIVE SUPPLY, CUMULATIVE DEMAND AND OCCUPANCY RATE
Cumulative Supply
Source: URA CBRE Research.
million sm
1400
1200
1000
800
600
400
200
02003 2004 2005 2006 2007 2008
100
80
60
40
20
0
%
Cumulative Demand Occupancy Rate
Note: Figures as at end of the period shown.
Independent Market Research Report
A Fine BalanceAscendas Real Estate Investment Trust . Annual Report 2008/09 78
79
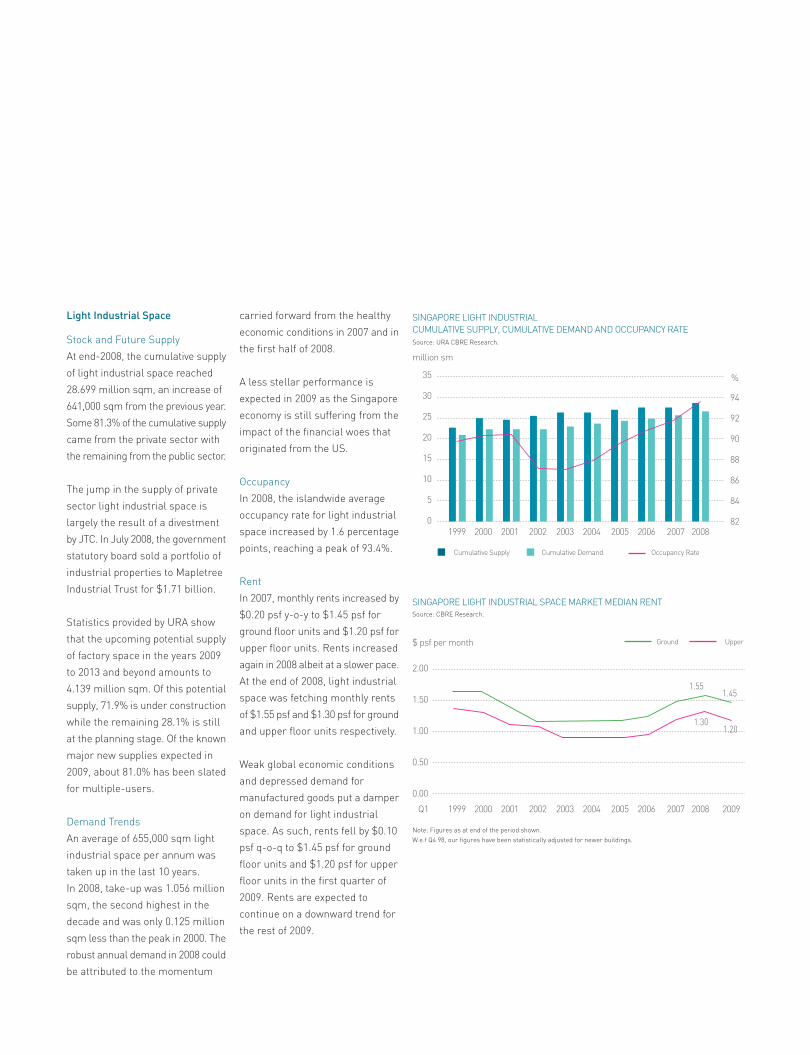
Light Industrial Space
Stock and Future Supply
At end-2008, the cumulative supply
of light industrial space reached
28.699 million sqm, an increase of
641,000 sqm from the previous year.
Some 81.3% of the cumulative supply
came from the private sector with
the remaining from the public sector.
The jump in the supply of private
sector light industrial space is
largely the result of a divestment
by JTC. In July 2008, the government
statutory board sold a portfolio of
industrial properties to Mapletree
Industrial Trust for $1.71 billion.
Statistics provided by URA show
that the upcoming potential supply
of factory space in the years 2009
to 2013 and beyond amounts to
4.139 million sqm. Of this potential
supply, 71.9% is under construction
while the remaining 28.1% is still
at the planning stage. Of the known
major new supplies expected in
2009, about 81.0% has been slated
for multiple-users.
Demand Trends
An average of 655,000 sqm light
industrial space per annum was
taken up in the last 10 years.
In 2008, take-up was 1.056 million
sqm, the second highest in the
decade and was only 0.125 million
sqm less than the peak in 2000. The
robust annual demand in 2008 could
be attributed to the momentum
carried forward from the healthy
economic conditions in 2007 and in
the first half of 2008.
A less stellar performance is
expected in 2009 as the Singapore
economy is still suffering from the
impact of the financial woes that
originated from the US.
Occupancy
In 2008, the islandwide average
occupancy rate for light industrial
space increased by 1.6 percentage
points, reaching a peak of 93.4%.
Rent
In 2007, monthly rents increased by
$0.20 psf y-o-y to $1.45 psf for
ground floor units and $1.20 psf for
upper floor units. Rents increased
again in 2008 albeit at a slower pace.
At the end of 2008, light industrial
space was fetching monthly rents
of $1.55 psf and $1.30 psf for ground
and upper floor units respectively.
Weak global economic conditions
and depressed demand for
manufactured goods put a damper
on demand for light industrial
space. As such, rents fell by $0.10
psf q-o-q to $1.45 psf for ground
floor units and $1.20 psf for upper
floor units in the first quarter of
2009. Rents are expected to
continue on a downward trend for
the rest of 2009.
Source: CBRE Research.
SINGAPORE LIGHT INDUSTRIAL SPACE MARKET MEDIAN RENT
2.00
1.50
1.00
0.50
0.00
$ psf per month
1999 2000 2001 2002 2003 2004 2005 2006 2007 2008 2009Q1
SINGAPORE LIGHT INDUSTRIAL
CUMULATIVE SUPPLY, CUMULATIVE DEMAND AND OCCUPANCY RATE
Cumulative Supply
Source: URA CBRE Research.
million sm
35
30
25
20
15
10
5
0
94
92
90
88
86
84
82
%
Cumulative Demand Occupancy Rate
1999 2000 2001 2002 2003 2004 2005 2006 2007 2008
1.551.45
1.301.20
Note: Figures as at end of the period shown.
W.e.f Q4 98, our figures have been statistically adjusted for newer buildings.
Ground Upper
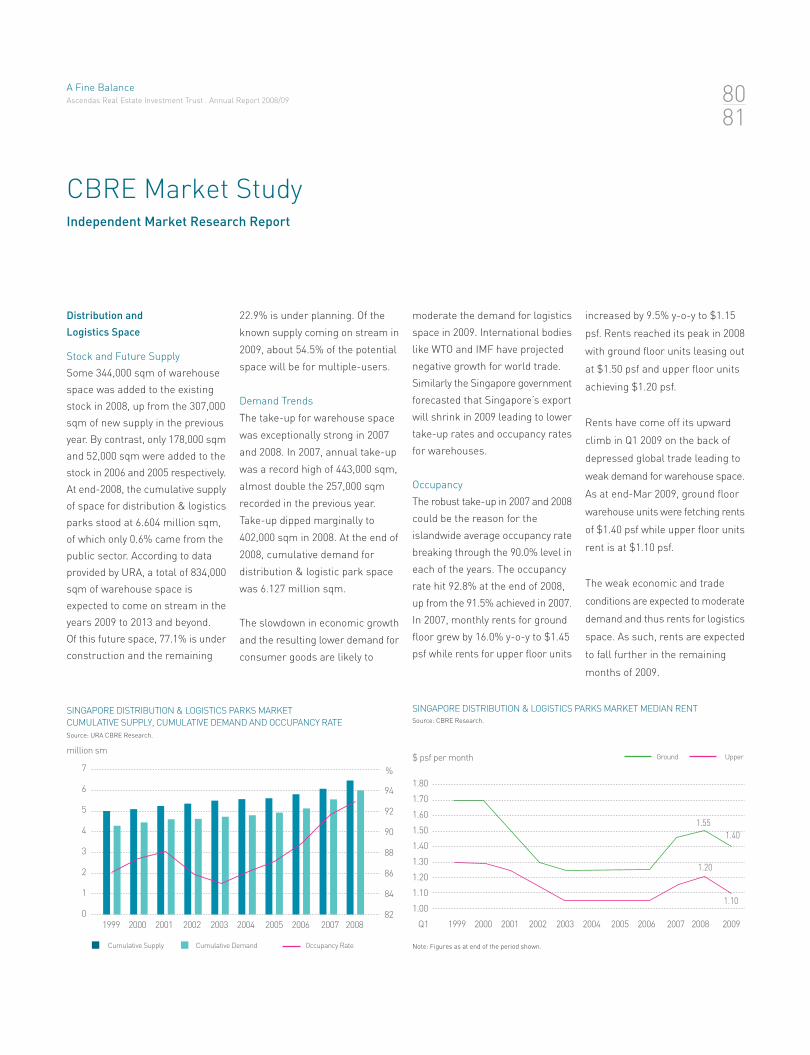
CBRE Market Study
Distribution and
Logistics Space
Stock and Future Supply
Some 344,000 sqm of warehouse
space was added to the existing
stock in 2008, up from the 307,000
sqm of new supply in the previous
year. By contrast, only 178,000 sqm
and 52,000 sqm were added to the
stock in 2006 and 2005 respectively.
At end-2008, the cumulative supply
of space for distribution & logistics
parks stood at 6.604 million sqm,
of which only 0.6% came from the
public sector. According to data
provided by URA, a total of 834,000
sqm of warehouse space is
expected to come on stream in the
years 2009 to 2013 and beyond.
Of this future space, 77.1% is under
construction and the remaining
22.9% is under planning. Of the
known supply coming on stream in
2009, about 54.5% of the potential
space will be for multiple-users.
Demand Trends
The take-up for warehouse space
was exceptionally strong in 2007
and 2008. In 2007, annual take-up
was a record high of 443,000 sqm,
almost double the 257,000 sqm
recorded in the previous year.
Take-up dipped marginally to
402,000 sqm in 2008. At the end of
2008, cumulative demand for
distribution & logistic park space
was 6.127 million sqm.
The slowdown in economic growth
and the resulting lower demand for
consumer goods are likely to
moderate the demand for logistics
space in 2009. International bodies
like WTO and IMF have projected
negative growth for world trade.
Similarly the Singapore government
forecasted that Singapore’s export
will shrink in 2009 leading to lower
take-up rates and occupancy rates
for warehouses.
Occupancy
The robust take-up in 2007 and 2008
could be the reason for the
islandwide average occupancy rate
breaking through the 90.0% level in
each of the years. The occupancy
rate hit 92.8% at the end of 2008,
up from the 91.5% achieved in 2007.
In 2007, monthly rents for ground
floor grew by 16.0% y-o-y to $1.45
psf while rents for upper floor units
increased by 9.5% y-o-y to $1.15
psf. Rents reached its peak in 2008
with ground floor units leasing out
at $1.50 psf and upper floor units
achieving $1.20 psf.
Rents have come off its upward
climb in Q1 2009 on the back of
depressed global trade leading to
weak demand for warehouse space.
As at end-Mar 2009, ground floor
warehouse units were fetching rents
of $1.40 psf while upper floor units
rent is at $1.10 psf.
The weak economic and trade
conditions are expected to moderate
demand and thus rents for logistics
space. As such, rents are expected
to fall further in the remaining
months of 2009.
SINGAPORE DISTRIBUTION & LOGISTICS PARKS MARKET
CUMULATIVE SUPPLY, CUMULATIVE DEMAND AND OCCUPANCY RATE
Cumulative Supply
Source: URA CBRE Research.
million sm
7
6
5
4
3
2
1
0
94
92
90
88
86
84
82
%
Cumulative Demand Occupancy Rate
1999 2000 2001 2002 2003 2004 2005 2006 2007 2008
Source: CBRE Research.
SINGAPORE DISTRIBUTION & LOGISTICS PARKS MARKET MEDIAN RENT
1.80
1.70
1.60
1.50
1.40
1.30
1.20
1.10
1.00
$ psf per month
1999 2000 2001 2002 2003 2004 2005 2006 2007 2008 2009Q1
1.55
1.40
1.20
1.10
Note: Figures as at end of the period shown.
Ground Upper
Independent Market Research Report
A Fine BalanceAscendas Real Estate Investment Trust . Annual Report 2008/09 80
81
Outlook
The economic crisis that started in
the US affected the rest of the world.
The global economy is said to be
now experiencing one of the
steepest economic downturn since
the World War II. Credit markets
are frozen and global trade and
manufacturing output has slowed
down greatly. Unemployment has
surged causing a plunge in
household consumption.
According to IMF, global recessions
associated with financial crises are
typically severe and protracted.
Recoveries from such recessions
are usually held back by weak
consumer demand and tight credit.
The international body emphasized
the importance of restoring the
health of the financial sector and
removing uncertainty about funding
before recovery is feasible.
In view of Singapore’s open
economy and heavy reliance on
trade, the city-state is not spared
the current financial turmoil. In Q1
2009, Singapore’ GDP shrank by an
estimated 11.5% and is expected to
contract by 6.0% to 9.0% for the
whole of 2009.
A survey conducted by EDB in
Dec 2008 and Jan 2009 showed that
more manufacturers expect
business conditions for the first half
of 2009 to be less favorable
compared to the earlier survey done
in the previous quarter. A net
weighted balance of 57% of
manufacturers expected business
conditions to be worse, a
deterioration from the previous
quarter when a net weighted
balance of 18% of manufacturers
expected business conditions to
become worse.
Occupancy rates and rents for
all industrial space are expected
to fall further in 2009 due to the
bearish economy and negative
business sentiment.
1 A “net weighted balance” refers to the difference between manufacturers who are upbeat and those who are not.


![tenacity - Ascendas REIT · 2014-01-30 · tenacity A DecADe of enAbling businesses tenacity [/tr næs t /] a firmness of purpose; an unrelenting persistence. listen. Where once there](https://static.fdocuments.in/doc/165x107/5ec51754bc3561407b1c7d68/tenacity-ascendas-reit-2014-01-30-tenacity-a-decade-of-enabling-businesses-tenacity.jpg)