High Speed Blanking: An Experimental Method to Measure Induced ...
12
HAL Id: hal-00986953 https://hal.archives-ouvertes.fr/hal-00986953 Submitted on 6 May 2014 HAL is a multi-disciplinary open access archive for the deposit and dissemination of sci- entific research documents, whether they are pub- lished or not. The documents may come from teaching and research institutions in France or abroad, or from public or private research centers. L’archive ouverte pluridisciplinaire HAL, est destinée au dépôt et à la diffusion de documents scientifiques de niveau recherche, publiés ou non, émanant des établissements d’enseignement et de recherche français ou étrangers, des laboratoires publics ou privés. High Speed Blanking: An Experimental Method to Measure Induced Cutting Forces Camille Gaudilliere, Nicolas Ranc, Arnaud Larue, A Maillard, Philippe Lorong To cite this version: Camille Gaudilliere, Nicolas Ranc, Arnaud Larue, A Maillard, Philippe Lorong. High Speed Blank- ing: An Experimental Method to Measure Induced Cutting Forces. Experimental Mechanics, Soci- ety for Experimental Mechanics, 2013, 53 (7), pp.1117-1126. <10.1007/s11340-013-9738-1>. <hal- 00986953>
Transcript of High Speed Blanking: An Experimental Method to Measure Induced ...
HAL Id: hal-00986953https://hal.archives-ouvertes.fr/hal-00986953
Submitted on 6 May 2014
HAL is a multi-disciplinary open accessarchive for the deposit and dissemination of sci-entific research documents, whether they are pub-lished or not. The documents may come fromteaching and research institutions in France orabroad, or from public or private research centers.
L’archive ouverte pluridisciplinaire HAL, estdestinée au dépôt et à la diffusion de documentsscientifiques de niveau recherche, publiés ou non,émanant des établissements d’enseignement et derecherche français ou étrangers, des laboratoirespublics ou privés.
High Speed Blanking: An Experimental Method toMeasure Induced Cutting Forces
Camille Gaudilliere, Nicolas Ranc, Arnaud Larue, A Maillard, Philippe Lorong
To cite this version:Camille Gaudilliere, Nicolas Ranc, Arnaud Larue, A Maillard, Philippe Lorong. High Speed Blank-ing: An Experimental Method to Measure Induced Cutting Forces. Experimental Mechanics, Soci-ety for Experimental Mechanics, 2013, 53 (7), pp.1117-1126. <10.1007/s11340-013-9738-1>. <hal-00986953>

Science Arts & Métiers (SAM)is an open access repository that collects the work of Arts et Métiers ParisTech
researchers and makes it freely available over the web where possible.
This is an author-deposited version published in: http://sam.ensam.euHandle ID: .http://hdl.handle.net/10985/8094
To cite this version :
Camille GAUDILLIERE, Nicolas RANC, Arnaud LARUE, A MAILLARD, Philippe LORONG - HighSpeed Blanking: An Experimental Method to Measure Induced Cutting Forces - ExperimentalMechanics - Vol. 53, n°7, p.1117–1126 - 2013
Any correspondence concerning this service should be sent to the repositoryAdministrator : [email protected]
High Speed Blanking: An Experimental Method to MeasureInduced Cutting Forces
C. Gaudilliere · N. Ranc · A. Larue · A. Maillard ·
P. Lorong
Abstract A new blanking process that involves punch
speed up to 10 ms−1 has obvious advantages in increased
productivity. However, the inherent dynamics of such a pro-
cess makes it difficult to develop a practical high speed
punch press. The fracture phenomenon governing the blank-
ing process has to be well understood to correctly design
the machine support and the tooling. To observe this phe-
nomenon at various controlled blanking speeds a specific
experimental device has been developed. The goal is to
measure accurately the shear blanking forces imposed on
the specimen during blanking. In this paper a new method
allowing the blanking forces to be measured and taking
into account the proposed test configuration is explained.
This technique has been used to determine the blanking
forces experienced when forming C40 steel and quantifies
the effect of process parameters such as punch die clearance,
punch speed, and sheet metal thickness on the blanking
force evolution.
Keywords High speed blanking · Blanking force
measurement · Hopkinson device
C. Gaudillieere · N. Ranc (�) · A. Larue · P. Lorong
Arts et Metiers ParisTech, PIMM, UMR CNRS 8006,
151 Boulevard de l’Hopital, 75013 Paris, France
e-mail: [email protected]
URL: http://pimm.paris.ensam.fr/en/user/9
Introduction
Blanking is a shearing process which is commonly used in
the metal forming industry [1–3]. Using this process, large
and very large production runs of thin parts can be manufac-
tured from sheet metal stock. Currently, two main blanking
technologies exist: traditional blanking and fine blanking. In
traditional blanking the sheet metal is located on the die and
the punch blanks it to obtain the desired workpiece geome-
try. The punch speed and the clearances between the punch
and the die are about 0.1 ms−1 and 10 % of the metal sheet
thickness. In the fine blanking process the metal sheet is
compressed between the die and a guide plate. An upper
and a lower punch extract the workpiece. In this technique,
the punch speed and the clearances between punch and die
are lower: about 0.01 ms−1 for the punch speed and 1 %
for the clearances. The main advantages of fine blanking
are the tight tolerances and also the elimination of finishing
machining operations . However, the tool costs are higher
than the conventional blanking technique.
The constant improvement of the technology of the
presses and particularly of hydraulic actuators allows an
increase in punch speed. It is thus possible to develop high
speed blanking with a punch speed of about 10 ms−1.
Research and industrial experiments show that high speed
blanking has many potential advantages, especially the pos-
sibility to obtain a high quality blanking edge geometry,
comparable to those obtained from the fine blanking tech-
nique. The new process also reduces the zone affected
by plastic strain. This allows a reduction in the distance
between each workpiece and a consequent saving in mate-
rials. With high speed blanking, unlike fine blanking, heat
treatments such as spheroidizing for carbon steel are not
necessary. Furthermore, the technique does not require the
use of lubricant.
Nevertheless, a general lack of experience with the pro-
cess tend to lead to short tool life and poor prediction of
the geometrical and dimensional quality of the product. The
tooling has to be better designed to produce parts in a way
that satisfies industrial requirements. Tooling design is a
crucial part of the development of such a process, and neces-
sitates a reliable estimation of the cutting forces. This study
aims to measure these forces.
The first attempt to increase punch speed to reduce the
blanking energy was undertaken by Zener and Hollomon in
1944 [4]. Many studies were carried out thereafter to deter-
mine the effect of the punch speed and punch die clearance
on blanking energy [5–9]. These different works established
the link between the reduction in blanking energy when
the punch speed is increased and the occurrence of adia-
batic shear bands [10] . Some of the studies focused on the
determination of the evolution of blanking forces during the
process [11–13]. Measurement of blanking forces was car-
ried out with the Hopkinson bar or tube system. However,
the effect of process parameters, materials choice and the
geometry of the tools on the history of the blanking force
are still not well described and the experimental methods
used are difficult. Knowledge of these blanking forces is
necessary to design tools and to identify and predict the
nature of the fracture mechanisms in a precise and useful
way.
The objective of this work is to propose and test an
experimental technique which enables the estimation of
the blanking forces by taking into account the dynamic
contribution of the three-dimensional geometry of the die.
These blanking forces data will allow the characterization
of the effect of parameters such as punch speed, blanking
sheet metal thickness and the clearance between punch and
die.
The second part of the paper describes the proposed
experimental device. The results of a typical test are pre-
sented. The third part of the paper discusses in detail the
method used to determine the blanking induced forces. The
last part shows and discusses the effects of punch speed
variation on blanking force.
High Speed Blanking Tests
The Loading Device and Measurement
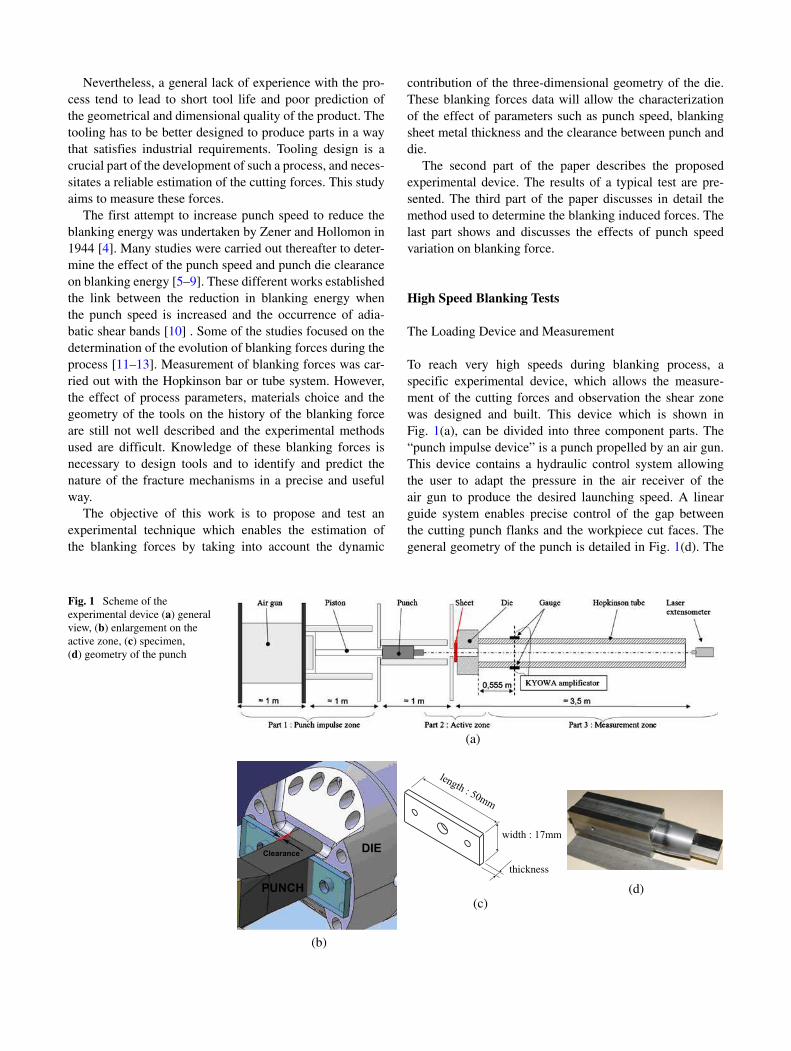
To reach very high speeds during blanking process, a
specific experimental device, which allows the measure-
ment of the cutting forces and observation the shear zone
was designed and built. This device which is shown in
Fig. 1(a), can be divided into three component parts. The
“punch impulse device” is a punch propelled by an air gun.
This device contains a hydraulic control system allowing
the user to adapt the pressure in the air receiver of the
air gun to produce the desired launching speed. A linear
guide system enables precise control of the gap between
the cutting punch flanks and the workpiece cut faces. The
general geometry of the punch is detailed in Fig. 1(d). The
Fig. 1 Scheme of the
experimental device (a) general
view, (b) enlargement on the
active zone, (c) specimen,
(d) geometry of the punch
(a)
(b)
thickness
(c)(d)
Clearance
PUNCH
DIE
second part is the “active zone” and is composed of a
die with a mass of 1.4 kg (Fig. 1(b)) which supports the
specimen before and during the blanking action. The test
specimens are rectangular milled sheets of metal with a
thickness of 2 mm, 3 mm or 4 mm with an accuracy to
within 0.02 mm. The general shape of the specimen is
shown in Fig. 1(c). The width is 17 mm and length is 50 mm.
By changing the die, the clearance can be set to 0.05 mm or
0.2 mm. A stop-system has been designed to stop the punch
just after blanking to avoid any direct interference between
the punch and the die. In the last part of the rig, the “the
measurement device”, the cutting forces are estimated using
a Hopkinson tube device. The section of the Hopkinson tube
noted Stube is about 6.28 × 10⁻⁴ m2 and length is 3.5 m.
The tube is made from 100C6 steel with a Young’s modulus
Etube = 206 MPa and a density ρtube = 7800 MPa. The
impedance of the tube defined as Ztube = Stube
√ρtubeEtube
is about 2.6 × 10⁴ Pa.s.m.
The strain wave generated in the Hopkinson tube by the
cutting process is measured using strain gages. The loca-
tion of the gages on the tube and the remaining length on
the tube allows measurement duration of 1.2 ms without
overlapping of the signal on the gages. The bandwidth of
the gage amplifier is about 500 kHz. A laser extensometer
with a bandwidth of 250kHz (manufacturer: Polytec; model:
HSV-2000 series) is located at the end of the tube targets
the front face of the punch through a hole drilled in the cen-
ter of the sample and measures the speed. The radius of the
hole is about 1 mm and the distance between the hole and
the shear zone is quite large (8 mm). Moreover the plas-
tic strain due to the punching process remains very close to
the shear zone. The punch speed and the Hopkinson tube
strain signals are recorded by a data acquisition system with
a sampling frequency of 1 MHz.
A high speed blanking test can be separated into different
steps. First, the pressure increases in the air gun compres-
sor tank (step 1). Then, when the test is activated, the air
tank is opened and propels the piston and the punch
(step 2). In the third step, the piston is stopped and
the punch flies freely along the punch guides. In the
step 4, the punch cuts the specimen. Finally, the punch is
stopped and the cut part of the specimen is ejected into the
Hopkinson tube.
Blanking Test Results
Tests were carried out with a fixed clearance between die
and punch equal to 0.05 mm and an initial punch speed
between 7 ms−1 and 18 ms−1. The punch mass is equal to
1.5 kg. The specimen has a parallelepipedal geometry with
dimensions: 17 mm width, 50 mm length and 2 mm, 3 mm
or 4 mm thickness (Fig. 1(c)). The specimen material is a
C40 steel with the composition given in Table 1.
Table 1 Metallurgical composition of the C40 steel
C Mn Si P S Mo
Weight % 0.35 ± 0.4 0.65 ± 0.15 0.4 0.035 0.035 0.10
Figure 2(a) shows the change in punch speed with
time during a blanking test on a specimen with a 2 mm
thickness. The first phase corresponds to the punch propul-
sion phase where the punch speed increases quasi linearly.
Then, when the piston is stopped, the punch slips freely
along the guide rails. The speed decreases slightly because
of friction. At the beginning of the cut, the punch strikes the
specimen front face and the speed decreases very quickly.
Just after the cut the punch moves again before finally
stopping. Then the punch speed oscillates around zero with
possibly a small negative mean speed due to punch rebound.
Figure 2(b) is an enlargement of Fig. 2(a) of the cut-
ting duration shows the decrease and the oscillation of
the punch front face during blanking. The oscillations of
the punch speed are strongly characterized by a dom-
inating harmonic frequency of about 20 kHz. This fre-
quency corresponds to the first longitudinal eigen fre-
quency of the punch. For the test shown in this Fig. 2(b),
the punch speed before the cut is equal to 11.5 ms−1 and
at the end of the cut, the punch speed oscillates around a
constant value which is estimated at 9.4 ms−1. It is also pos-
sible to calculate the cutting energy which is assumed to be
equal to the variation of the kinetic energy of the punch. In
the case of the test conducted at a punch speed of 11.5 ms−1
the calculated blanking energy is 33 J . It is possible from
Fig. 2(b) to estimate the cutting time which corresponds to
the duration of the speed decreasing phase, and the mean
blanking force can also be determined. The estimated blank-
ing time and the mean blanking force are equal to 220 μs
and 14 kN .
This method becomes difficult to apply when the blank-
ing duration is small i.e. when the punch speed is high
or when the thickness of the specimen is small. Moreover
this method only gives an estimate of the mean blanking
forces during the cut. The blanking forces are also deter-
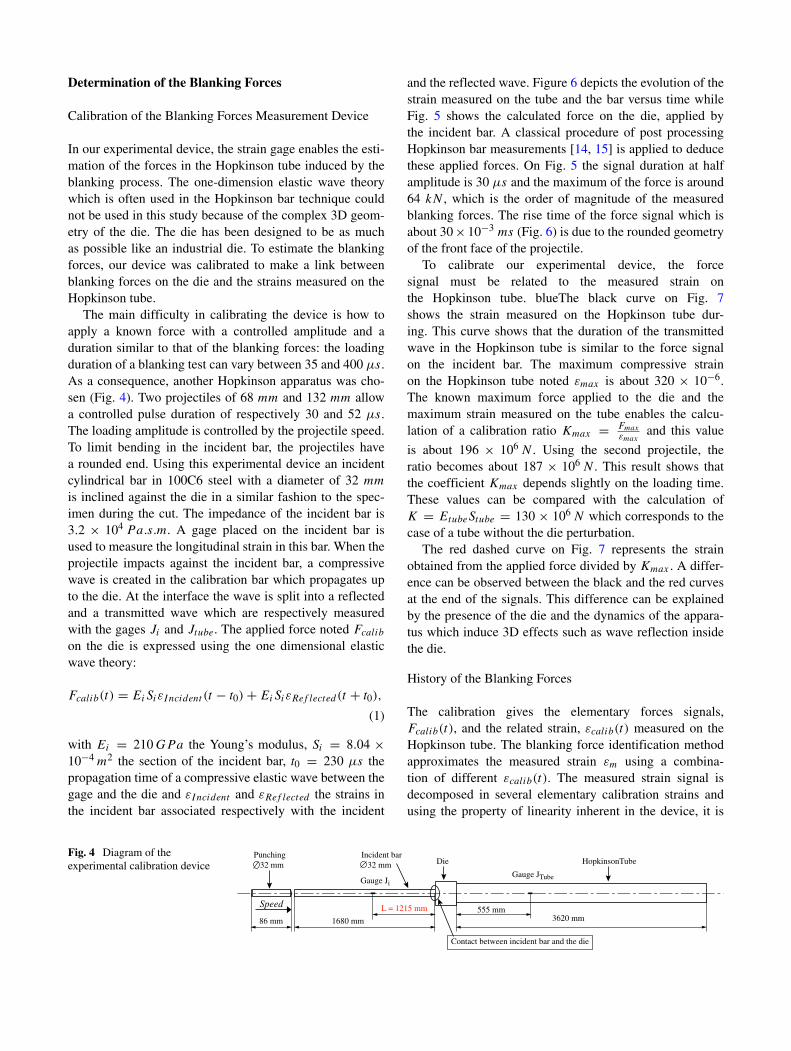
mined from the Hopkinson tube device. Figure 3 shows the
strain measurements from the Hopkinson tube gages dur-
ing the same test. This signal shows a compressive stress
in the tube resulting from the blanking forces on the die.
The origin of the timescale corresponds to the beginning
of the cut. The delay of 135 μs between the beginning of
the cut and the decrease of the strain is due to the wave
propagation between the die and the gages on the Hop-
kinson tube. The loading duration at the half amplitude is
about 79 μs and the maximum longitudinal strain in the
Hopkinson tube is about 240 × 10−6. For a tube section of
Stube = 6.28 × 10⁻⁴ m2 and a Young’s modulus for the
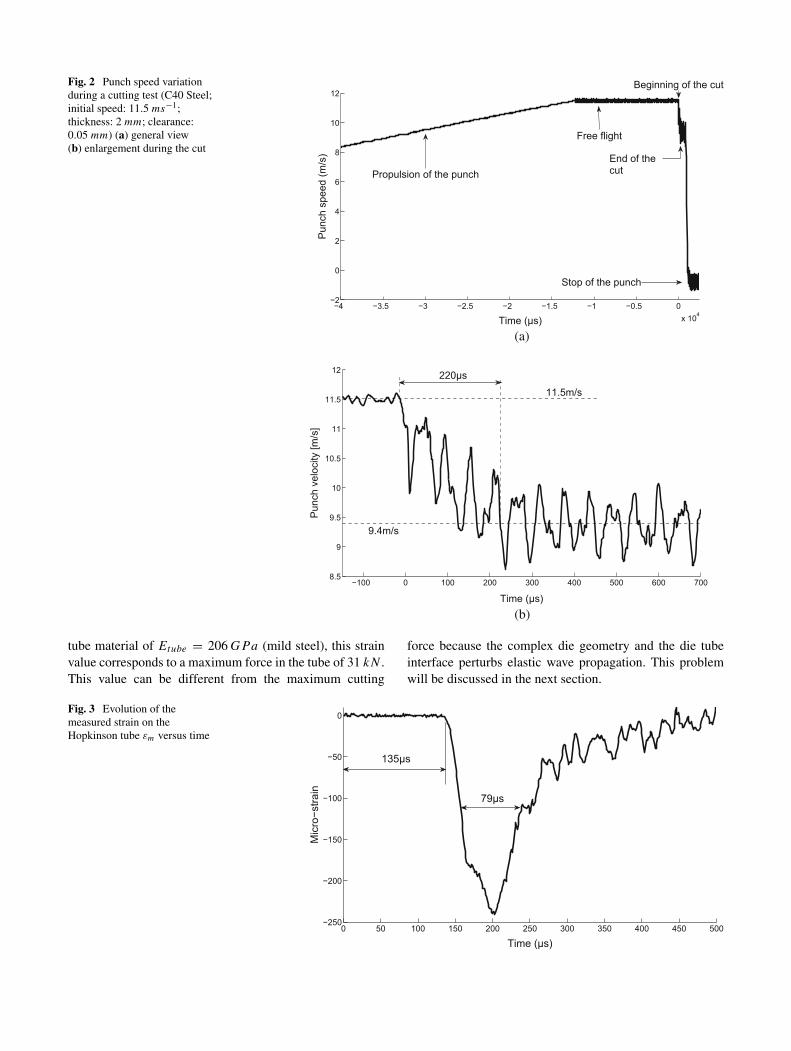
Fig. 2 Punch speed variation
during a cutting test (C40 Steel;
initial speed: 11.5 ms−1;
thickness: 2 mm; clearance:
0.05 mm) (a) general view
(b) enlargement during the cut
−4 −3.5 −3 −2.5 −2 −1.5 −1 −0.5 0x 104
−2
0
2
4
6
8
10
12
Pun
ch s
peed
(m/s
)Time (µs)
Free flight
End of thecut
Beginning of the cut
Stop of the punch
Propulsion of the punch
(a)
−100 0 100 200 300 400 500 600 7008.5
9
9.5
10
10.5
11
11.5
12
Time (µs)
Pun
ch v
eloc
ity [m
/s]
220µs
11.5m/s
9.4m/s
(b)
tube material of Etube = 206 GPa (mild steel), this strain
value corresponds to a maximum force in the tube of 31 kN .
This value can be different from the maximum cutting
force because the complex die geometry and the die tube
interface perturbs elastic wave propagation. This problem
will be discussed in the next section.
Fig. 3 Evolution of the
measured strain on the
Hopkinson tube εm versus time
0 50 100 150 200 250 300 350 400 450 500−250
−200
−150
−100
−50
0
Time (µs)
Mic
ro−s
train
79µs
135µs
Determination of the Blanking Forces
Calibration of the Blanking Forces Measurement Device
In our experimental device, the strain gage enables the esti-
mation of the forces in the Hopkinson tube induced by the
blanking process. The one-dimension elastic wave theory
which is often used in the Hopkinson bar technique could
not be used in this study because of the complex 3D geom-
etry of the die. The die has been designed to be as much
as possible like an industrial die. To estimate the blanking
forces, our device was calibrated to make a link between
blanking forces on the die and the strains measured on the
Hopkinson tube.
The main difficulty in calibrating the device is how to
apply a known force with a controlled amplitude and a
duration similar to that of the blanking forces: the loading
duration of a blanking test can vary between 35 and 400 μs.
As a consequence, another Hopkinson apparatus was cho-
sen (Fig. 4). Two projectiles of 68 mm and 132 mm allow
a controlled pulse duration of respectively 30 and 52 μs.
The loading amplitude is controlled by the projectile speed.
To limit bending in the incident bar, the projectiles have
a rounded end. Using this experimental device an incident
cylindrical bar in 100C6 steel with a diameter of 32 mm
is inclined against the die in a similar fashion to the spec-
imen during the cut. The impedance of the incident bar is
3.2 × 10⁴ Pa.s.m. A gage placed on the incident bar is
used to measure the longitudinal strain in this bar. When the
projectile impacts against the incident bar, a compressive
wave is created in the calibration bar which propagates up
to the die. At the interface the wave is split into a reflected
and a transmitted wave which are respectively measured
with the gages Ji and Jtube. The applied force noted Fcalib
on the die is expressed using the one dimensional elastic
wave theory:
Fcalib(t) = EiSiεIncident (t − t0) + EiSiεRef lected(t + t0),
(1)
with Ei = 210 GPa the Young’s modulus, Si = 8.04 ×10⁻⁴ m2 the section of the incident bar, t0 = 230 μs the
propagation time of a compressive elastic wave between the
gage and the die and εIncident and εRef lected the strains in
the incident bar associated respectively with the incident
and the reflected wave. Figure 6 depicts the evolution of the
strain measured on the tube and the bar versus time while
Fig. 5 shows the calculated force on the die, applied by
the incident bar. A classical procedure of post processing
Hopkinson bar measurements [14, 15] is applied to deduce
these applied forces. On Fig. 5 the signal duration at half
amplitude is 30 μs and the maximum of the force is around
64 kN , which is the order of magnitude of the measured
blanking forces. The rise time of the force signal which is
about 30 × 10−3 ms (Fig. 6) is due to the rounded geometry
of the front face of the projectile.
To calibrate our experimental device, the force
signal must be related to the measured strain on
the Hopkinson tube. blueThe black curve on Fig. 7
shows the strain measured on the Hopkinson tube dur-
ing. This curve shows that the duration of the transmitted
wave in the Hopkinson tube is similar to the force signal
on the incident bar. The maximum compressive strain
on the Hopkinson tube noted εmax is about 320 × 10−6.
The known maximum force applied to the die and the
maximum strain measured on the tube enables the calcu-
lation of a calibration ratio Kmax = Fmax
εmaxand this value
is about 196 × 106 N . Using the second projectile, the
ratio becomes about 187 × 106 N . This result shows that
the coefficient Kmax depends slightly on the loading time.
These values can be compared with the calculation of
K = EtubeStube = 130 × 106 N which corresponds to the
case of a tube without the die perturbation.
The red dashed curve on Fig. 7 represents the strain
obtained from the applied force divided by Kmax . A differ-
ence can be observed between the black and the red curves
at the end of the signals. This difference can be explained
by the presence of the die and the dynamics of the appara-
tus which induce 3D effects such as wave reflection inside
the die.
History of the Blanking Forces
The calibration gives the elementary forces signals,
Fcalib(t), and the related strain, εcalib(t) measured on the
Hopkinson tube. The blanking force identification method
approximates the measured strain εm using a combina-
tion of different εcalib(t). The measured strain signal is
decomposed in several elementary calibration strains and
using the property of linearity inherent in the device, it is
Fig. 4 Diagram of the
experimental calibration device
86 mm 1680 mm
Gauge Ji
L = 1215 mm 555 mm3620 mm
Gauge JTube
Die
Speed
HopkinsonTubePunching
32 mm
Incident bar
32 mm
Contact between incident bar and the die
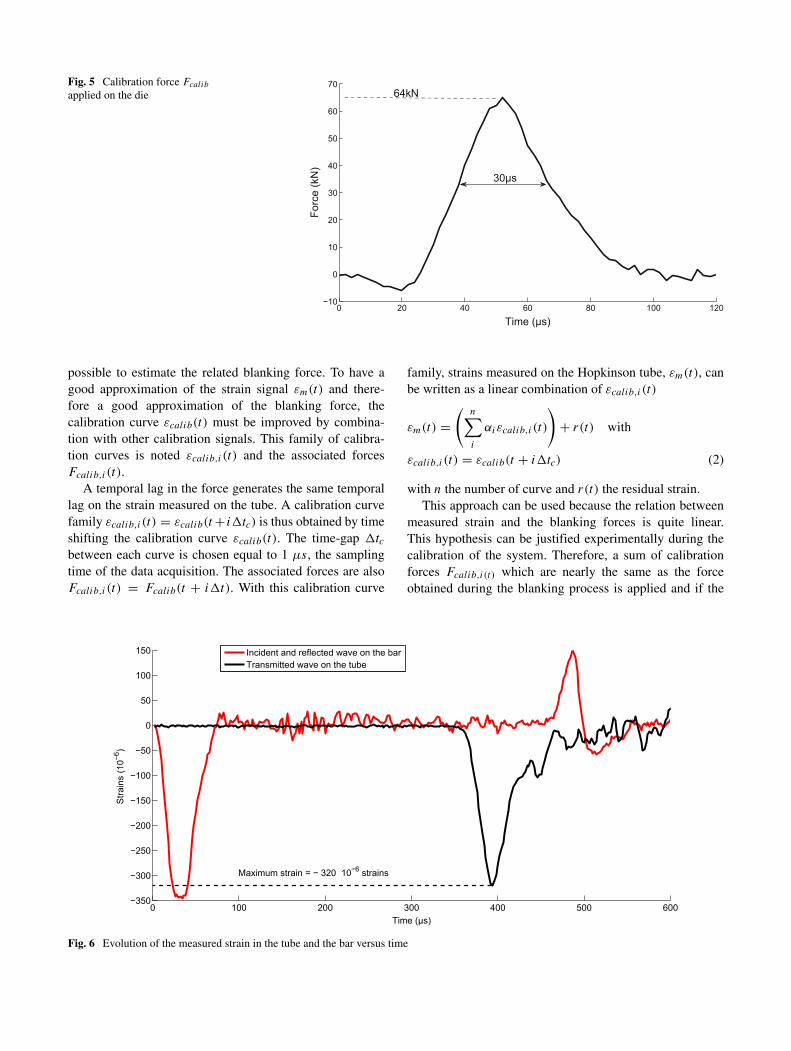
Fig. 5 Calibration force Fcalib
applied on the die
0 20 40 60 80 100 120−10
0
10
20
30
40
50
60
70
Time (µs)Fo
rce
(kN
)
30µs
64kN
possible to estimate the related blanking force. To have a
good approximation of the strain signal εm(t) and there-
fore a good approximation of the blanking force, the
calibration curve εcalib(t) must be improved by combina-
tion with other calibration signals. This family of calibra-
tion curves is noted εcalib,i(t) and the associated forces
Fcalib,i(t).
A temporal lag in the force generates the same temporal
lag on the strain measured on the tube. A calibration curve
family εcalib,i(t) = εcalib(t + i�tc) is thus obtained by time
shifting the calibration curve εcalib(t). The time-gap �tcbetween each curve is chosen equal to 1 μs, the sampling
time of the data acquisition. The associated forces are also
Fcalib,i(t) = Fcalib(t + i�t). With this calibration curve
family, strains measured on the Hopkinson tube, εm(t), can
be written as a linear combination of εcalib,i(t)
εm(t) =
(
n∑
i
αiεcalib,i(t)
)
+ r(t) with
εcalib,i(t) = εcalib(t + i�tc) (2)
with n the number of curve and r(t) the residual strain.
This approach can be used because the relation between
measured strain and the blanking forces is quite linear.
This hypothesis can be justified experimentally during the
calibration of the system. Therefore, a sum of calibration
forces Fcalib,i(t) which are nearly the same as the force
obtained during the blanking process is applied and if the
0 100 200 300 400 500 600−350
−300
−250
−200
−150
−100
−50
0
50
100
150
Time (µs)
Stra
ins
(10−6
)
Incident and reflected wave on the barTransmitted wave on the tube
Maximum strain = − 320 10−6 strains
Fig. 6 Evolution of the measured strain in the tube and the bar versus time
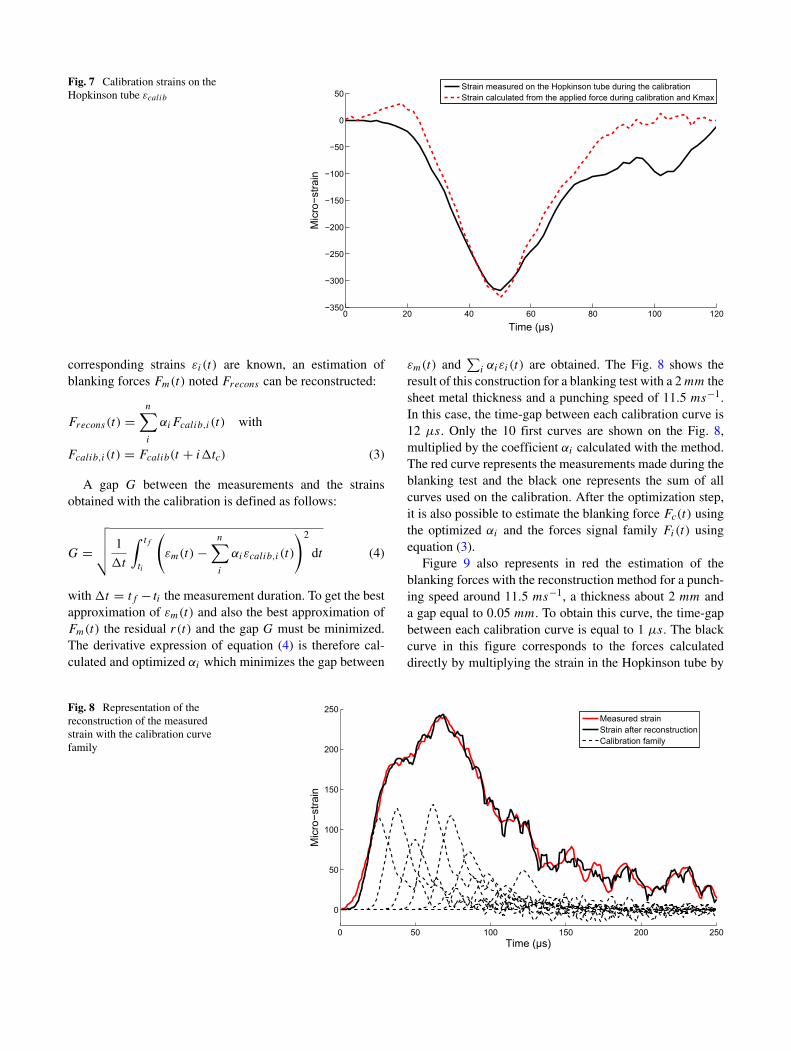
Fig. 7 Calibration strains on the
Hopkinson tube εcalib
0 20 40 60 80 100 120−350
−300
−250
−200
−150
−100
−50
0
50
Time (µs)M
icro
−stra
in
Strain measured on the Hopkinson tube during the calibrationStrain calculated from the applied force during calibration and Kmax
corresponding strains εi(t) are known, an estimation of
blanking forces Fm(t) noted Frecons can be reconstructed:
Frecons(t) =n
∑
i
αiFcalib,i(t) with
Fcalib,i(t) = Fcalib(t + i�tc) (3)
A gap G between the measurements and the strains
obtained with the calibration is defined as follows:
G =
√
√
√
√
1
�t
∫ tf
ti
(
εm(t) −n
∑
i
αiεcalib,i(t)
)2
dt (4)
with �t = tf − ti the measurement duration. To get the best
approximation of εm(t) and also the best approximation of
Fm(t) the residual r(t) and the gap G must be minimized.
The derivative expression of equation (4) is therefore cal-
culated and optimized αi which minimizes the gap between
εm(t) and∑
i αiεi(t) are obtained. The Fig. 8 shows the
result of this construction for a blanking test with a 2 mm the
sheet metal thickness and a punching speed of 11.5 ms−1.
In this case, the time-gap between each calibration curve is
12 μs. Only the 10 first curves are shown on the Fig. 8,
multiplied by the coefficient αi calculated with the method.
The red curve represents the measurements made during the
blanking test and the black one represents the sum of all
curves used on the calibration. After the optimization step,
it is also possible to estimate the blanking force Fc(t) using
the optimized αi and the forces signal family Fi(t) using
equation (3).
Figure 9 also represents in red the estimation of the
blanking forces with the reconstruction method for a punch-
ing speed around 11.5 ms−1, a thickness about 2 mm and
a gap equal to 0.05 mm. To obtain this curve, the time-gap
between each calibration curve is equal to 1 μs. The black
curve in this figure corresponds to the forces calculated
directly by multiplying the strain in the Hopkinson tube by
Fig. 8 Representation of the
reconstruction of the measured
strain with the calibration curve
family
0 50 100 150 200 250
0
50
100
150
200
250
Time (µs)
Mic
ro−s
train
Measured strainStrain after reconstructionCalibration family
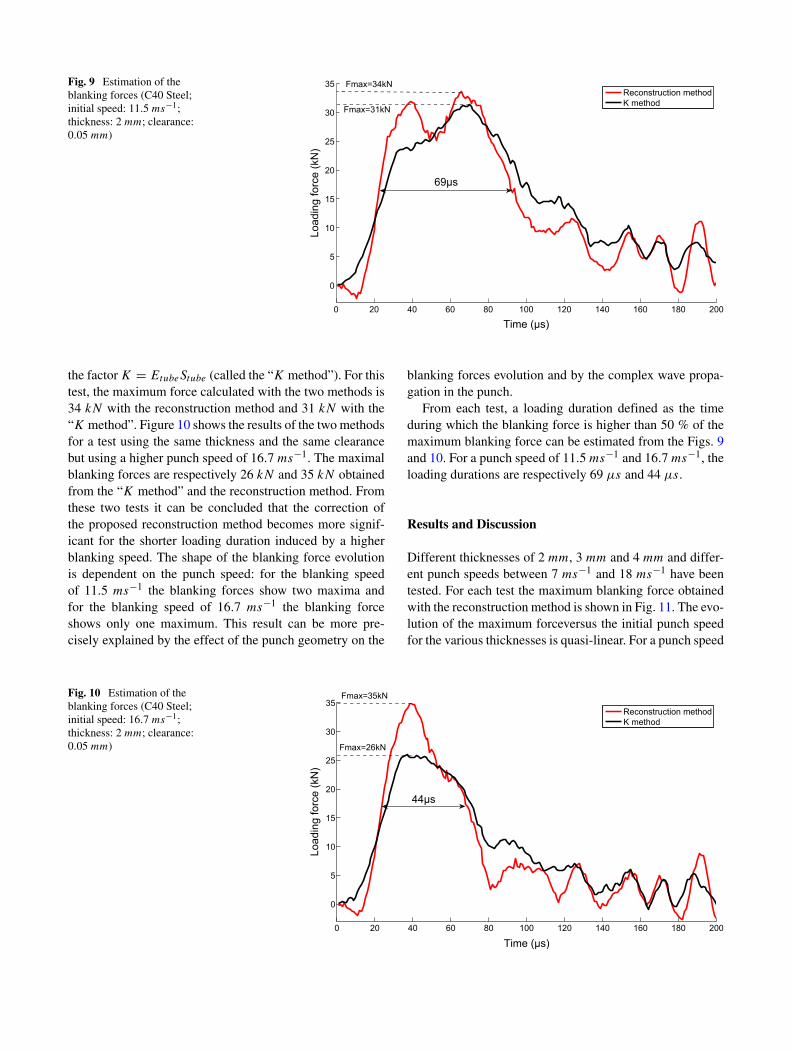
Fig. 9 Estimation of the
blanking forces (C40 Steel;
initial speed: 11.5 ms−1;
thickness: 2 mm; clearance:
0.05 mm)
0 20 40 60 80 100 120 140 160 180 200
0
5
10
15
20
25
30
35
Time (µs)Lo
adin
g fo
rce
(kN
)
Reconstruction methodK method
69µs
Fmax=31kN
Fmax=34kN
the factor K = EtubeStube (called the “K method”). For this
test, the maximum force calculated with the two methods is
34 kN with the reconstruction method and 31 kN with the
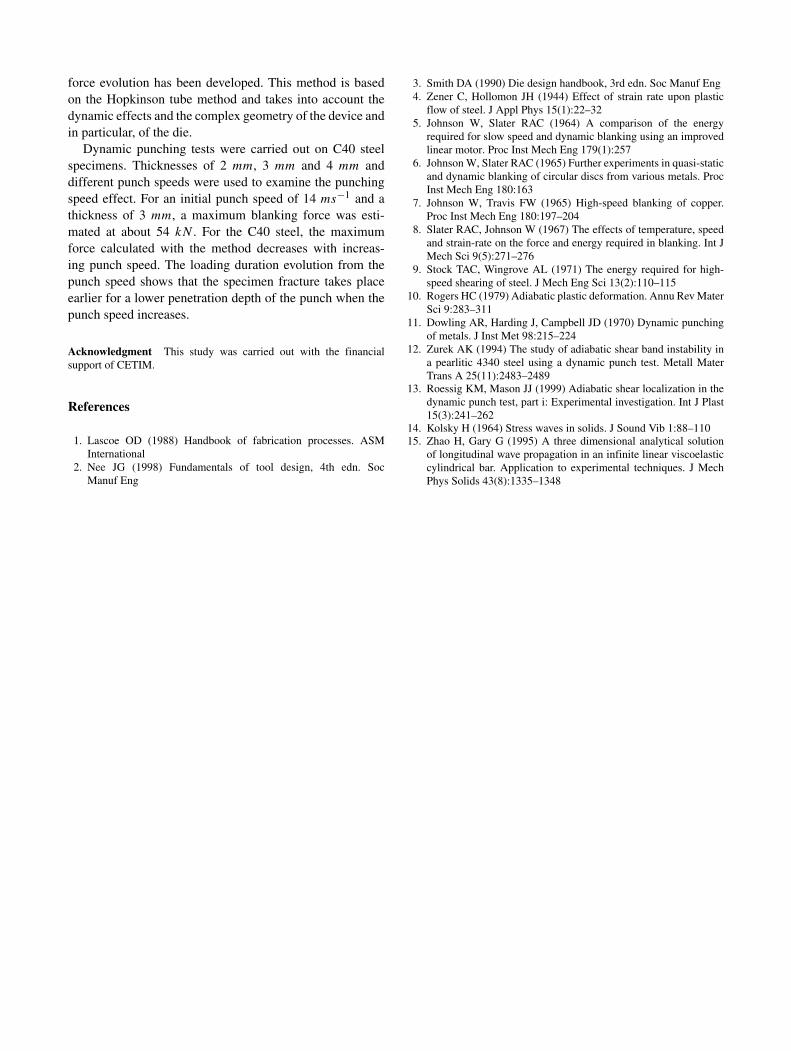
“K method”. Figure 10 shows the results of the two methods
for a test using the same thickness and the same clearance
but using a higher punch speed of 16.7 ms−1. The maximal
blanking forces are respectively 26 kN and 35 kN obtained
from the “K method” and the reconstruction method. From
these two tests it can be concluded that the correction of
the proposed reconstruction method becomes more signif-
icant for the shorter loading duration induced by a higher
blanking speed. The shape of the blanking force evolution
is dependent on the punch speed: for the blanking speed
of 11.5 ms−1 the blanking forces show two maxima and
for the blanking speed of 16.7 ms−1 the blanking force
shows only one maximum. This result can be more pre-
cisely explained by the effect of the punch geometry on the
blanking forces evolution and by the complex wave propa-
gation in the punch.
From each test, a loading duration defined as the time
during which the blanking force is higher than 50 % of the
maximum blanking force can be estimated from the Figs. 9
and 10. For a punch speed of 11.5 ms−1 and 16.7 ms−1, the
loading durations are respectively 69 μs and 44 μs.
Results and Discussion
Different thicknesses of 2 mm, 3 mm and 4 mm and differ-
ent punch speeds between 7 ms−1 and 18 ms−1 have been
tested. For each test the maximum blanking force obtained
with the reconstruction method is shown in Fig. 11. The evo-
lution of the maximum forceversus the initial punch speed
for the various thicknesses is quasi-linear. For a punch speed
Fig. 10 Estimation of the
blanking forces (C40 Steel;
initial speed: 16.7 ms−1;
thickness: 2 mm; clearance:
0.05 mm)
0 20 40 60 80 100 120 140 160 180 200
0
5
10
15
20
25
30
35
Time (µs)
Load
ing
forc
e (k
N)
Reconstruction methodK method
Fmax=35kN
Fmax=26kN
44µs

Fig. 11 Maximum loading
force evolution versus punch
speed
6 8 10 12 14 16 18 200
10
20
30
40
50
60
70
80
Punch speed [m/s]Fo
rce
[kN
]
2mm3mm4mm
of 14 ms−1 the maximum force is equal to 34 kN , 54 kN
and 76 kN respectively for the thickness of 2 mm, 3 mm and
4 mm. These blanking force values divided by two times the
cross section of the specimen give blanking stresses equal
to 500 MPa, 529 MPa and 558 MPa: these values are
very close. The evolution of the blanking forces according
to the punch speed seems to be constant for a thickness
of 2 mm and decreases with increasing thickness. This
thickness effect has not previously been described in the lit-
erature. The reduction of the blanking forces with the punch
speed is because for high punch speeds, the thermal soft-
ening of the materials plays a predominant role compared
with the strain and strain rate hardening [9]. The greater the
thickness of the specimen, the greater the decrease in the
blanking forces with speed. For thicknesses of 3 mm and
4 mm, the maximum blanking forces decrease by 0.6 kN
and 1.0 kN when the blanking speed increases of 1 ms−1.
For each test, a characteristic time denoted tc can be
defined as the ratio of the thickness and the initial punch
speed. The Fig. 12 represents the evolution of the ratio of
the loading duration and the characteristic time and shows
that this ratio is very close for the different thicknesses and
it slightly decreases when the blanking speed increases. So
when the blanking speed increases, the drop of the blanking
forces occurs earlier and therefore the fracture takes place
for a lower penetration depth of the punch. These results are
in agreement with work of Dowling et al. [11].
Conclusion
To better understand the high speed blanking process, an
experimental device has been designed and built to match
certain industrial characteristics such as punch-die clearance
or tool geometry. This device works at high punch speeds,
up to 25 ms−1 and allows the measurement of the punch
speed evolution and the blanking forces during the process.
In this study, a new method for measuring the blanking
Fig. 12 Ratio of the loading
time to the characteristic time
evolution versus punch speed
6 8 10 12 14 16 18 200
0.1
0.2
0.3
0.4
0.5
0.6
0.7
0.8
0.9
1
Punch speed [m/s]
Rat
io o
f the
load
ing
time
to th
e ch
arac
teris
tic ti
me
2mm3mm4mm
force evolution has been developed. This method is based
on the Hopkinson tube method and takes into account the
dynamic effects and the complex geometry of the device and
in particular, of the die.
Dynamic punching tests were carried out on C40 steel
specimens. Thicknesses of 2 mm, 3 mm and 4 mm and
different punch speeds were used to examine the punching
speed effect. For an initial punch speed of 14 ms−1 and a
thickness of 3 mm, a maximum blanking force was esti-
mated at about 54 kN . For the C40 steel, the maximum
force calculated with the method decreases with increas-
ing punch speed. The loading duration evolution from the
punch speed shows that the specimen fracture takes place
earlier for a lower penetration depth of the punch when the
punch speed increases.
Acknowledgment This study was carried out with the financial
support of CETIM.
References
1. Lascoe OD (1988) Handbook of fabrication processes. ASM
International
2. Nee JG (1998) Fundamentals of tool design, 4th edn. Soc
Manuf Eng
3. Smith DA (1990) Die design handbook, 3rd edn. Soc Manuf Eng
4. Zener C, Hollomon JH (1944) Effect of strain rate upon plastic
flow of steel. J Appl Phys 15(1):22–32
5. Johnson W, Slater RAC (1964) A comparison of the energy
required for slow speed and dynamic blanking using an improved
linear motor. Proc Inst Mech Eng 179(1):257
6. Johnson W, Slater RAC (1965) Further experiments in quasi-static
and dynamic blanking of circular discs from various metals. Proc
Inst Mech Eng 180:163
7. Johnson W, Travis FW (1965) High-speed blanking of copper.
Proc Inst Mech Eng 180:197–204
8. Slater RAC, Johnson W (1967) The effects of temperature, speed
and strain-rate on the force and energy required in blanking. Int J
Mech Sci 9(5):271–276
9. Stock TAC, Wingrove AL (1971) The energy required for high-
speed shearing of steel. J Mech Eng Sci 13(2):110–115
10. Rogers HC (1979) Adiabatic plastic deformation. Annu Rev Mater
Sci 9:283–311
11. Dowling AR, Harding J, Campbell JD (1970) Dynamic punching
of metals. J Inst Met 98:215–224
12. Zurek AK (1994) The study of adiabatic shear band instability in
a pearlitic 4340 steel using a dynamic punch test. Metall Mater
Trans A 25(11):2483–2489
13. Roessig KM, Mason JJ (1999) Adiabatic shear localization in the
dynamic punch test, part i: Experimental investigation. Int J Plast
15(3):241–262
14. Kolsky H (1964) Stress waves in solids. J Sound Vib 1:88–110
15. Zhao H, Gary G (1995) A three dimensional analytical solution
of longitudinal wave propagation in an infinite linear viscoelastic
cylindrical bar. Application to experimental techniques. J Mech
Phys Solids 43(8):1335–1348