Heat Transfer and Fluid Flow Characteristics Study for In-Line Tube ...
13
International Journal of Mechanical & Mechatronics Engineering IJMME-IJENS Vol:14 No:03 93 144303-8282-IJMME-IJENS © June 2014 IJENS I J E N S Heat Transfer and Fluid Flow Characteristics Study for In-Line Tube Bank in Cross-Flow Igbinosa Ikpotokin, Christian Okechukwu Osueke Department of Mechanical Engineering, Landmark University, Omu-Aran, Kwara State Nigeria Abstract-- This research investigates the heat transfer coefficient as a function of tube position and pressure drop, for in-line tube bank in cross-flow. Experimentation was essentially used to generate log-mean temperature curves and pressure heads upstream and down stream of the test section. The heat transfer and flow parameters such as Nusselt number, Reynolds number, and pressure drop across the bank were calculated. In addition, heat transfer correlations, Nusselt number (Nu) were obtained by power-law curve fitting for each position of the tube in the tube bank. FEMLAB 3.0 was use for numerical simulation and the results obtained compared favourably with that of the experimental results. Numerical results also reveal the important aspects of the local heat transfer and flow features within the tube bank. These characteristics include boundary layer developments between tubes, formation of vortices, local variations of the velocity and temperature distribution. Index Term-- In-line tube bank, cross-flow, flow characteristics. INTRODUCTION Tube bank is a very important heat transfer surface used in many heat exchangers such as boilers for steam generation, radiators in automotive, fuel assemblies in nuclear power plants, cooling coils in air conditioning system. It consists of parallel cylindrical tubes that are heated by the fluid flow normal to it. Thereby, simulating a typical cross flow heat exchanger used in many engineering fields. The tubes are usually arranged as in-line or staggered in the direction of fluid flow. In the former configuration, column of tubes is placed exactly behind the next adjacent column along the streamwise direction, without displacement in the cross-flow direction. For staggered tube configuration, every second column of tubes is displaced in the flow direction. For this study, in-line tube bank is investigated. It is made up of four columns of five parallel cylinders. The configuration is characterized by the tube diameter and longitudinal and transverse pitches. The heat transfer characteristics associated with a tube is dependent on its position in the bank. This is as a result of the need to save space or energy in many engineering applications of energy conversion systems. Thus, prediction of heat transfer and flow characteristics at every tube position is required for determining the optimal design, efficient performance and operating parameters of compact heat exchangers. Since changes in properties associated with fluid flow over tube surfaces can result in losses and poor device performance (Yukio et al, 2010). The fluid flow conditions within the bank are dominated by turbulence because of the high Reynolds numbers and induced vortex shedding which enhances the heat transfer process. The turbulence intensity and its generation are determined by the bank geometry and Reynolds number. It has been observed that with lower transverse pitches, the velocity fluctuations become more intensive (Yoo et al, 2007). Therefore, a tube bank acts as a turbulent grid and establishes a particular level of turbulence. The heat transfer condition stabilize, such that little change occurs in the convection coefficient for tube beyond the fifth row tube in staggered tube bank (Mehrabian, 2007). Although reasonable number of researches have been conducted on experiments and numerical studies on fluid flow and heat transfer for tube bank, but different correlation equations have been proposed to predict the heat transfer or the Nusselt number. Majority of the correlations were based on overall heat transfer in the tube bank. Žukauskas obtained an overall heat transfer correlation given as 5 . 0 Re 52 . 0 Nu 1 for in-line tube containing 16 number of tube rows (John et al, 2006). From the numerous literatures, little or no work has been conducted to develop heat transfer correlation as a function of tube position for in-line tube bank. Generally, a correction factor is always introduced in heat transfer coefficient correlation for number of tube rows because the shorter the bank, the lower the average heat transfer. The influence of the number of tube column becomes negligible only for N>16 (Incropera and Dewitt 2004). The pressure drop in tube-type heat exchanger is related to the drag coefficient according to the following equation. 2 2 1 V N C P column D 2 Chunlei et al (2009) carried out a numerical study to determine the effect of tube spacing on flow characteristics for a six-row inline tube bank under laminar flow conditions (Re < 100). Their findings show that increasing tube space induces vortex shedding beginning from the last cylinder upstream. The purpose of this study is to determine the pressure drop and average heat transfer characteristics at various tube positions and Reynolds number. Experiment was
Transcript of Heat Transfer and Fluid Flow Characteristics Study for In-Line Tube ...
International Journal of Mechanical & Mechatronics Engineering IJMME-IJENS Vol:14 No:03 93
144303-8282-IJMME-IJENS © June 2014 IJENS I J E N S
Heat Transfer and Fluid Flow Characteristics Study
for In-Line Tube Bank in Cross-Flow Igbinosa Ikpotokin, Christian Okechukwu Osueke
Department of Mechanical Engineering, Landmark University, Omu-Aran, Kwara State Nigeria
Abstract-- This research investigates the heat transfer
coefficient as a function of tube position and pressure
drop, for in-line tube bank in cross-flow. Experimentation
was essentially used to generate log-mean temperature
curves and pressure heads upstream and down stream of
the test section. The heat transfer and flow parameters
such as Nusselt number, Reynolds number, and pressure
drop across the bank were calculated. In addition, heat
transfer correlations, Nusselt number (Nu) were obtained
by power-law curve fitting for each position of the tube in
the tube bank. FEMLAB 3.0 was use for numerical
simulation and the results obtained compared favourably
with that of the experimental results. Numerical results
also reveal the important aspects of the local heat transfer
and flow features within the tube bank. These
characteristics include boundary layer developments
between tubes, formation of vortices, local variations of the
velocity and temperature distribution.
Index Term-- In-line tube bank, cross-flow, flow
characteristics.
INTRODUCTION
Tube bank is a very important heat transfer surface
used in many heat exchangers such as boilers for steam
generation, radiators in automotive, fuel assemblies in nuclear
power plants, cooling coils in air conditioning system. It
consists of parallel cylindrical tubes that are heated by the
fluid flow normal to it. Thereby, simulating a typical cross
flow heat exchanger used in many engineering fields.
The tubes are usually arranged as in-line or staggered
in the direction of fluid flow. In the former configuration,
column of tubes is placed exactly behind the next adjacent
column along the streamwise direction, without displacement
in the cross-flow direction. For staggered tube configuration,
every second column of tubes is displaced in the flow
direction.
For this study, in-line tube bank is investigated. It is
made up of four columns of five parallel cylinders. The
configuration is characterized by the tube diameter and
longitudinal and transverse pitches. The heat transfer
characteristics associated with a tube is dependent on its
position in the bank. This is as a result of the need to save
space or energy in many engineering applications of energy
conversion systems. Thus, prediction of heat transfer and flow
characteristics at every tube position is required for
determining the optimal design, efficient performance and
operating parameters of compact heat exchangers. Since
changes in properties associated with fluid flow over tube
surfaces can result in losses and poor device performance
(Yukio et al, 2010).
The fluid flow conditions within the bank are
dominated by turbulence because of the high Reynolds
numbers and induced vortex shedding which enhances the
heat transfer process. The turbulence intensity and its
generation are determined by the bank geometry and Reynolds
number. It has been observed that with lower transverse
pitches, the velocity fluctuations become more intensive (Yoo
et al, 2007). Therefore, a tube bank acts as a turbulent grid and
establishes a particular level of turbulence. The heat transfer
condition stabilize, such that little change occurs in the
convection coefficient for tube beyond the fifth row tube in
staggered tube bank (Mehrabian, 2007).
Although reasonable number of researches have been
conducted on experiments and numerical studies on fluid flow
and heat transfer for tube bank, but different correlation
equations have been proposed to predict the heat transfer or
the Nusselt number. Majority of the correlations were based
on overall heat transfer in the tube bank. Žukauskas obtained
an overall heat transfer correlation given as 5.0Re52.0Nu 1
for in-line tube containing 16 number of tube rows (John et al,
2006).
From the numerous literatures, little or no work has been
conducted to develop heat transfer correlation as a function of
tube position for in-line tube bank.
Generally, a correction factor is always introduced in
heat transfer coefficient correlation for number of tube rows
because the shorter the bank, the lower the average heat
transfer. The influence of the number of tube column becomes
negligible only for N>16 (Incropera and Dewitt 2004).
The pressure drop in tube-type heat exchanger is
related to the drag coefficient according to the following
equation.
2
2
1VNCP columnD 2
Chunlei et al (2009) carried out a numerical study to
determine the effect of tube spacing on flow characteristics for
a six-row inline tube bank under laminar flow conditions (Re
< 100). Their findings show that increasing tube space induces
vortex shedding beginning from the last cylinder upstream.
The purpose of this study is to determine the
pressure drop and average heat transfer characteristics at
various tube positions and Reynolds number. Experiment was
International Journal of Mechanical & Mechatronics Engineering IJMME-IJENS Vol:14 No:03 94
144303-8282-IJMME-IJENS © June 2014 IJENS I J E N S
conducted in cross-flow heat exchanger test apparatus. In
addition, numerical simulation of two-dimensional fluid flow
and heat transfer over the tube bank was performed and
compared with the experimental data.
MATERIALS AND METHODS
Experimental procedure
The experimental procedure was used to generate cooling
curves of the heated element for different flow conditions. The
primary component of the test apparatus is valve controlled air
flow duct with a perspex test section of 125mm x 125mm
(Fig. 2) through which air is drawn by a centrifugal fan, and
the heated element under investigation is inserted as shown in
Fig 1.
Air temperature upstream of the test section and
atmospheric pressure were measured by means of
thermocouple and mercury barometer respectively. Air
pressure differential across the test section were measured by
inclined water manometer connected to the head tube located
in the centre upstream position with the tube itself on the
horizontal centerline of the test section as shown in Fig 1. The
velocity upstream the test section was established from the
pressure drop between atmosphere and upstream static
pressure tapping (i.e depression of water column the
manometer) and it was recorded as H1 in meters. The sampled
result is as shown in Table III.
Heat transfer measurements were obtained by
replacing one of the Perspex rods with an externally identical
heated copper rod. The copper rod outer and inner diameter is
12.45mm and 11.5mm respectively and its length is 95mm. It
is carried between two extension rods of fabricated plastic
compound. The element temperature is measured by K-type
0.2 mm diameter thermocouple probe inserted at its centre.
The thermocouple output was connected to a digital
multimeter (MAS-34X model) which also was connected to a
Pentium 3 desktop computer as shown in Fig 1.
The test procedure involved heating the copper rod
with electrical heater to 700C above air flow temperature
outside the test section. Thereafter, it was inserted at different
desired positions in the test sections (i.e centre of 1st, 2
nd, 3
rd
and 4th
columns) under different flow conditions such as 10,
20, 30, 40, 50, 60, 70, 80, 90 and 100% throttle openings.
Then its temperature and time of cooling were recorded with
the thermocouple embedded at its centre. The heat transfer
coefficient is then deduced from logarithm plot (Fig 3.0).
3
1
2
5
4
6
7
9
10
11
12
13
8
International Journal of Mechanical & Mechatronics Engineering IJMME-IJENS Vol:14 No:03 95
144303-8282-IJMME-IJENS © June 2014 IJENS I J E N S
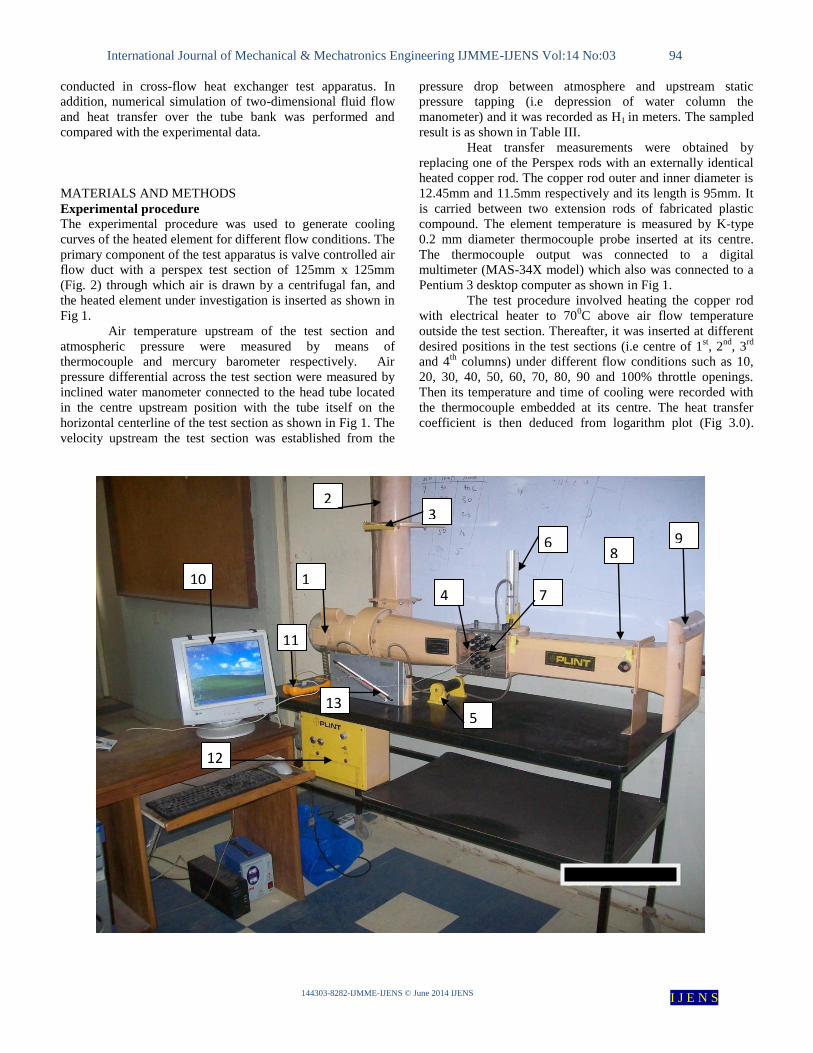
Fig.1. Cross flow experimental test apparatus.
The apparatus in Fig.1 are as identified by the numerals
1. Fan, 2. Air discharge tube, 3. Throttle valve, 4. Test
section, 5. Electric heater, 6. Total head tube, 7. Test
element, 8. Thermometer, 9. Bellmouth, 10.
Computer, 11. Digital multimeter, 12. Control panel
and 13. Inclined manometer.
Basic assumptions and problem formulation
It was assumed that the heat generated in the
cylindrical copper element was transferred to the air flowing
through it. However, a certain amount of heat was conducted
from the element into the plastic extension pieces. A
correction factor of 8.4mm was used to compensate for plastic
extension. Therefore:
L1 = L + 0.0084 3
It was further assumed that temperature gradients
within the element are negligible, so the thermocouple
embedded at the centre gives a true reading of the effective
surface temperature. The justification for this assumption is
that the Biot number is very small (Bi < 0.1).
The rate of heat transfer from the element to the air stream is
given by:
q = hA(T −Ta) 4
The temperature drop dT in a period of time dt is given by:
−qdt = mcdT 5
Combining Equations (4) and (5) gives:
dtmc
hA
TT
dT
a
1
)(
6
where A is replaced by A1 to allow for the tube plastic
extensions. Integrating equation (6), we obtain:
mc
thATTTT aoeae
1)(log)(log
7
Equation (7) suggests that a plot of )(log ae TT against t
yield a straight line slope
mc
hAM 1
8
and since we can obtained the other factors in this expression
from the geometrical properties of copper in Table I, the heat
transfer coefficient relates to the slope M of the line by the
following expression:
MA
mch
1
9
A plot of log10(T – Ta) against time (t) was used, since logeN =
2.3026 log10N.
The effective velocity of the air across the element
was determined by calculating the velocity V1 upstream. The
velocity V1 developed by gas of density ρ expanding freely
from rest under the influence of pressure difference P. When
P was sufficiently small for compressibility to be neglected,
then, applying Bernoulli’s equation gives:
PV
2
2
1 10a
the pressure head H1 was measured in centimeters of water.
Since
1cm H2O = 98.1 N/m2
equation (10a) becomes
1
2
1 1.982
HV
10b
The density of air under pressure Pa and at temperature Ta is
given by ideal gas equation.
Pa = RTa 11
where the gas constant R = 2875J/kmol.K
substituting equation (10) in (11) yields:
V1 = 237.3
A
A
P
TH1 12
Equation (12) is used for calculating local velocities upstream
of the test section.
The calculation of the effective velocity through bank
of tubes was based on the minimum flow area. When all the
tubes are in position, the minimum area occurs in a transverse
plane. Therefore,
12VV 13
Dimensional analysis shows that the relationship between h
and the independent variables is expressed as:
NuK
hD 14
VDRe 15
The pressure differential was express as a proportion
to the velocity head. It represents the pressure drop imposed
on the flow by each successive rank of tubes which is
represented as:
213 HHH 16
and the drag coefficient is calculated as:
13 4/
4H
HCD 17
Thus, pressure drop across the tube bank is
2
2VCP D
18
NUMERICAL MODELLING
Numerical simulation was essential for flow
visualization and temperature distribution in the tube bank.
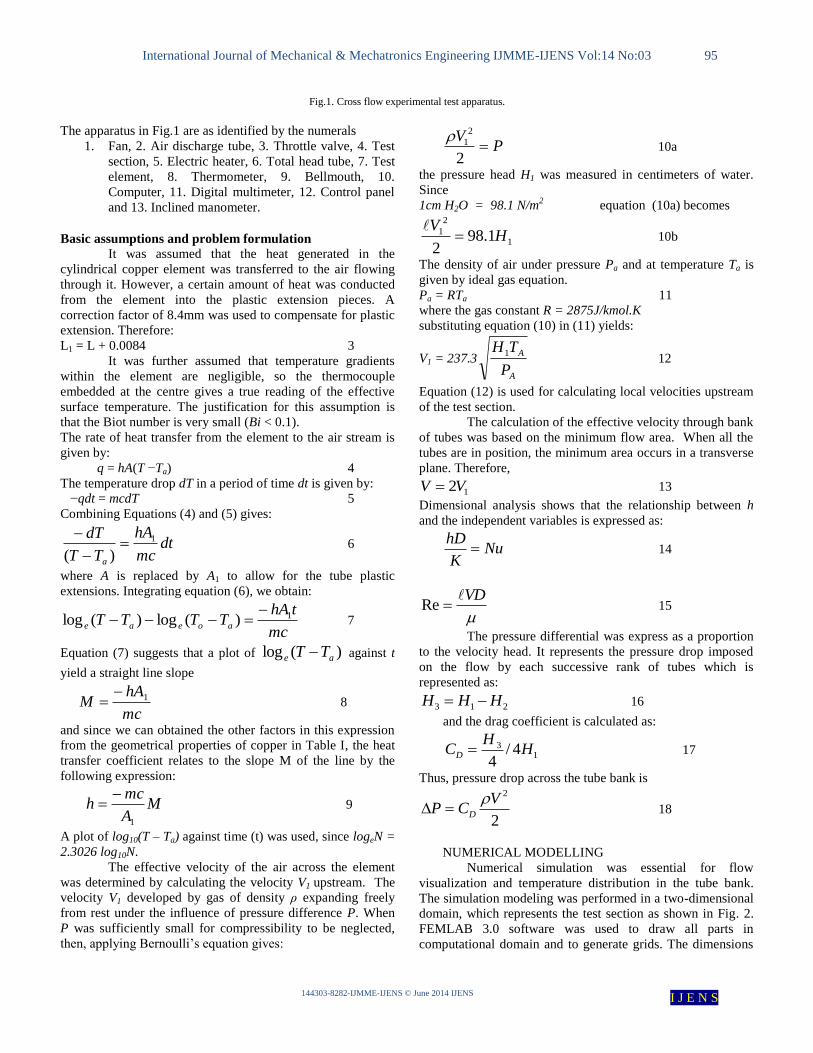
The simulation modeling was performed in a two-dimensional
domain, which represents the test section as shown in Fig. 2.
FEMLAB 3.0 software was used to draw all parts in
computational domain and to generate grids. The dimensions
International Journal of Mechanical & Mechatronics Engineering IJMME-IJENS Vol:14 No:03 96
144303-8282-IJMME-IJENS © June 2014 IJENS I J E N S
of computational domain were idealized to reveal the
fundamental issues and enable validation with the
experimental data that was the reason why this computational
domain only cover the test working section. This
computational domain has a length and width as same size
with the experimental test section.
Fig. 2. Schematic diagram of the in-line tube bank test section.
Since the governing equations are in spatial
coordinates, the boundary conditions were provided for all
boundaries of the computation domain. At the up-stream
boundary, uniform flow velocity Uin and temperature Tin were
assumed. At the down-stream end of the computational
domain, the Neumann boundary condition was applied. At the
solid cylinder surfaces represented by circles, no-slip
conditions and thermal insulation were applied, while constant
temperature Ttube was specified for the heated element. At the
symmetry plane, normal velocity and the temperature
variation along the normal direction were set to zero.
RESULTS AND DISCUSSION
Experimental and numerical simulations of heat
transfer and fluid flow characteristics of in-line tube bank are
presented.
For these studies, the following dimensions and fluid
properties used are presented in tables I and II respectively.
Table I
Geometrical properties of the copper rod.
Description Quantity Unit
External diameter (d) 12.45 mm
Internal diameter (di) 11.5 mm
Thickness of tube (t) 0.5 mm
Length of tube (l) 95 mm
Effective length (l1) 0.1304 m
Surface area (A) 0.00371 m2
Effective surface area (A1) 0.00404 m2
Specific heat (C) 380 J/kg.K
Mass (m) 0.0274 Kg
Table II
Properties of the fluid (air).
Description Quantity Unit
Ambient temperature (Ta) 300 oK
Barometric pressure (Pa) 99,042 N/m2
Density of air at Ta (ρ) 1.1614 kg/m3
Dynamic viscosity (µ) 1.846X10⁻⁵
kg/ms

International Journal of Mechanical & Mechatronics Engineering IJMME-IJENS Vol:14 No:03 97
144303-8282-IJMME-IJENS © June 2014 IJENS I J E N S
Thermal conductivity (K) 0.0263
J/msoC
Experimental test was used to generate cooling
curves. For example, the rate of cooling resulting from
minimum flow rate set at 100% when the heated element was
positioned in the center of the second column is shown in Fig
3. The slope obtained from the rate of cooling curve with the
knowledge of element properties in Table I were used in
equation 9 to calculate the convective heat transfer coefficient.
The above procedure was used to calculate the heat
transfer characteristics from the heated element at 1st, 2
nd, 3
rd
and 4th
positions of the tube columns. The results obtained for
different set flow rate in the ranges of 10 – 100% are
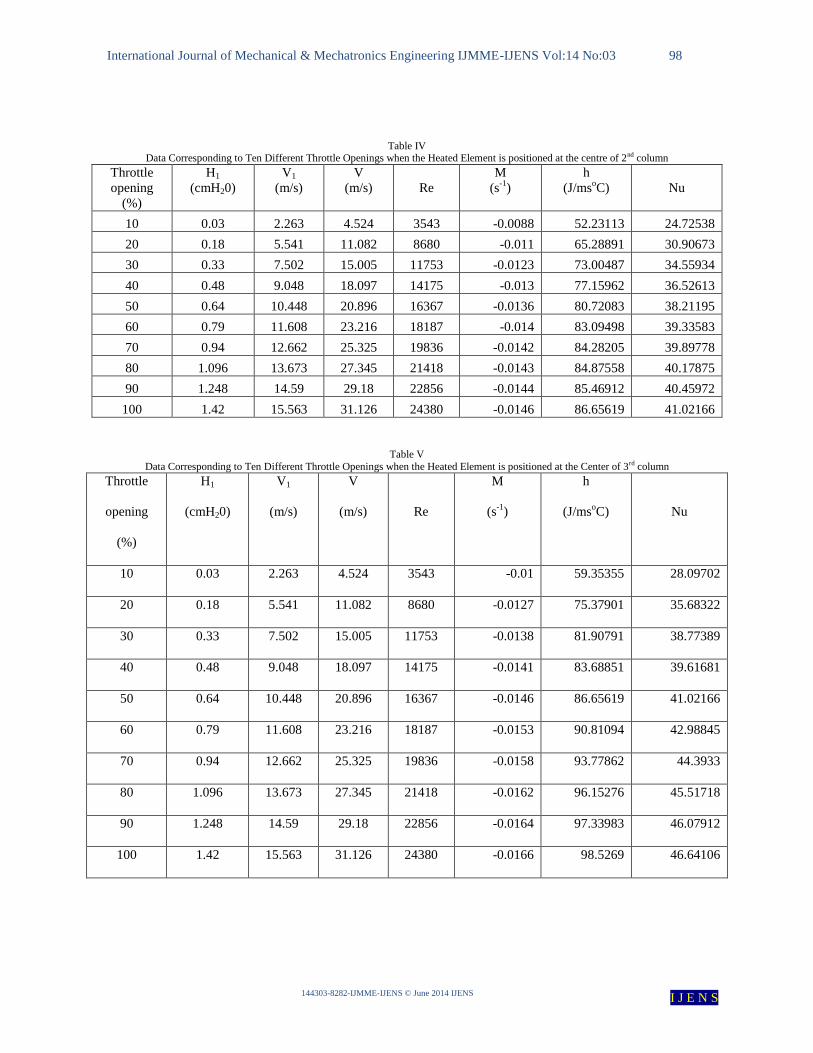
presented in tables III, IV, V and VI. The effective velocity, V
across the bank tube based on the minimum flow area was
obtained from equation 13 and thee result is shown in table III.
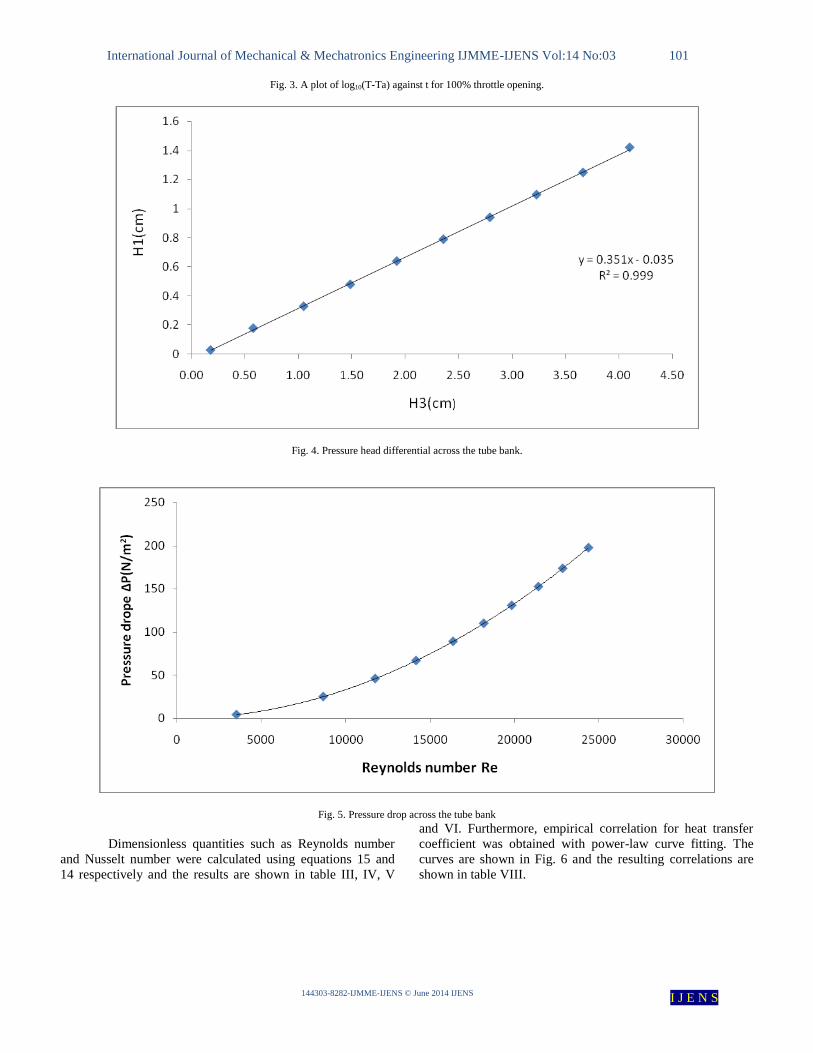
The pressure head differential, H3 in cmH2O imposed on the
flow by each successive column of tube across the exchanger
was obtained with all the tubes in position. The drag
coefficient which is represented by the slope of the plot of H1
against H3 shown in Fig 4 was used in equation 17 to calculate
the pressure drop across the tube bank and the result is
presented in table VII. Fig.5 depicts a parabolic increase of
pressure drop with increasing Reynolds number.
Table III
Data Corresponding to Ten Different Throttle Openings when the Heated Element is positioned at the Center of 1st column
Throttle
opening
(%)
H1
(cmH20)
V1
(m/s)
V
(m/s)
Re
M
(s-1
)
h
(J/ms2o
C)
Nu
10 0.03 2.263 4.524 3543 -0.008 47.48284 22.47762
20 0.18 5.541 11.082 8680 -0.0094 55.79234 26.4112
30 0.33 7.502 15.005 11753 -0.0106 62.91477 29.78285
40 0.48 9.048 18.097 14175 -0.0115 68.25659 32.31158
50 0.64 10.448 20.896 16367 -0.0119 70.63073 33.43546
60 0.79 11.608 23.216 18187 -0.0124 73.59841 34.84031
70 0.94 12.662 25.325 19836 -0.0126 74.78548 35.40225
80 1.096 13.673 27.345 21418 -0.0129 76.56609 36.24516
90 1.248 14.59 29.18 22856 -0.0132 78.34669 37.08807
100 1.42 15.563 31.126 24380 -0.0134 79.53376 37.65001
International Journal of Mechanical & Mechatronics Engineering IJMME-IJENS Vol:14 No:03 98
144303-8282-IJMME-IJENS © June 2014 IJENS I J E N S
Table IV
Data Corresponding to Ten Different Throttle Openings when the Heated Element is positioned at the centre of 2nd column
Throttle
opening
(%)
H1
(cmH20)
V1
(m/s)
V
(m/s)
Re
M
(s-1
)
h
(J/msoC)
Nu
10 0.03 2.263 4.524 3543 -0.0088 52.23113 24.72538
20 0.18 5.541 11.082 8680 -0.011 65.28891 30.90673
30 0.33 7.502 15.005 11753 -0.0123 73.00487 34.55934
40 0.48 9.048 18.097 14175 -0.013 77.15962 36.52613
50 0.64 10.448 20.896 16367 -0.0136 80.72083 38.21195
60 0.79 11.608 23.216 18187 -0.014 83.09498 39.33583
70 0.94 12.662 25.325 19836 -0.0142 84.28205 39.89778
80 1.096 13.673 27.345 21418 -0.0143 84.87558 40.17875
90 1.248 14.59 29.18 22856 -0.0144 85.46912 40.45972
100 1.42 15.563 31.126 24380 -0.0146 86.65619 41.02166
Table V
Data Corresponding to Ten Different Throttle Openings when the Heated Element is positioned at the Center of 3rd column
Throttle
opening
(%)
H1
(cmH20)
V1
(m/s)
V
(m/s)
Re
M
(s-1
)
h
(J/msoC)
Nu
10 0.03 2.263 4.524 3543 -0.01 59.35355 28.09702
20 0.18 5.541 11.082 8680 -0.0127 75.37901 35.68322
30 0.33 7.502 15.005 11753 -0.0138 81.90791 38.77389
40 0.48 9.048 18.097 14175 -0.0141 83.68851 39.61681
50 0.64 10.448 20.896 16367 -0.0146 86.65619 41.02166
60 0.79 11.608 23.216 18187 -0.0153 90.81094 42.98845
70 0.94 12.662 25.325 19836 -0.0158 93.77862 44.3933
80 1.096 13.673 27.345 21418 -0.0162 96.15276 45.51718
90 1.248 14.59 29.18 22856 -0.0164 97.33983 46.07912
100 1.42 15.563 31.126 24380 -0.0166 98.5269 46.64106

International Journal of Mechanical & Mechatronics Engineering IJMME-IJENS Vol:14 No:03 99
144303-8282-IJMME-IJENS © June 2014 IJENS I J E N S
Table VI
Data Corresponding to Ten Different Throttle Openings when the Heated Element is positioned at the Center of 4th column
Throttle
opening
(%)
H1
(cmH20)
V1
(m/s)
V
(m/s)
Re
M
(s-1
)
h
(J/msoC)
Nu
10 0.03 2.263 4.524 3543 -0.011 65.28891 30.90673
20 0.18 5.541 11.082 8680 -0.0132 78.34669 37.08807
30 0.33 7.502 15.005 11753 -0.0144 85.46912 40.45972
40 0.48 9.048 18.097 14175 -0.0149 88.4368 41.86457
50 0.64 10.448 20.896 16367 -0.0157 93.18508 44.11233
60 0.79 11.608 23.216 18187 -0.016 94.96569 44.95524
70 0.94 12.662 25.325 19836 -0.0166 98.5269 46.64106
80 1.096 13.673 27.345 21418 -0.0169 100.3075 47.48397
90 1.248 14.59 29.18 22856 -0.017 100.901 47.76494
100 1.42 15.563 31.126 24380 -0.0172 102.0881 48.32688

International Journal of Mechanical & Mechatronics Engineering IJMME-IJENS Vol:14 No:03 100
144303-8282-IJMME-IJENS © June 2014 IJENS I J E N S
Table VII
Pressure drop across the tube banks.
% throttle openings Reynolds number (Re) Pressure drop (ΔP) (N/m2)
10
3543 13.734
20
8680 35.316
30
11753 100.062
40
14175 122.625
50
16367 145.188
60
18184 216.801
70
19836 247.212
80
21418 296.262
90
22856 327.654
100
24380 361.989
International Journal of Mechanical & Mechatronics Engineering IJMME-IJENS Vol:14 No:03 101
144303-8282-IJMME-IJENS © June 2014 IJENS I J E N S
Fig. 3. A plot of log10(T-Ta) against t for 100% throttle opening.
Fig. 4. Pressure head differential across the tube bank.
Fig. 5. Pressure drop across the tube bank
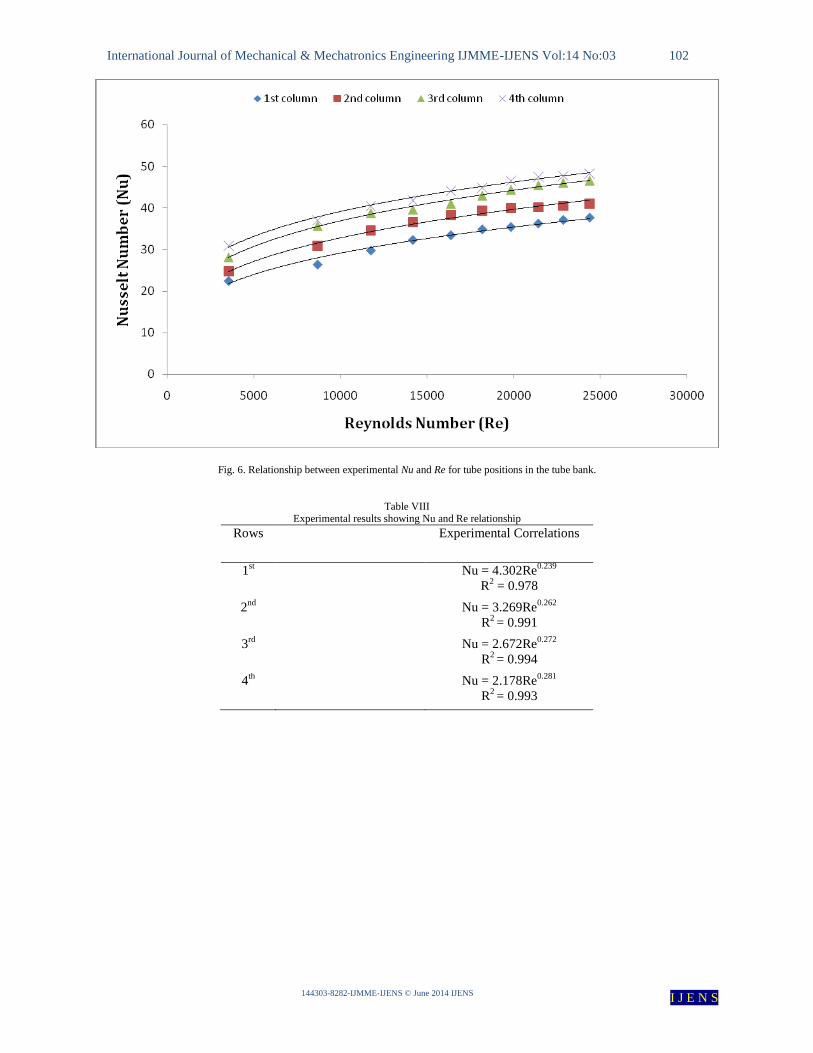
Dimensionless quantities such as Reynolds number
and Nusselt number were calculated using equations 15 and
14 respectively and the results are shown in table III, IV, V
and VI. Furthermore, empirical correlation for heat transfer
coefficient was obtained with power-law curve fitting. The
curves are shown in Fig. 6 and the resulting correlations are
shown in table VIII.
International Journal of Mechanical & Mechatronics Engineering IJMME-IJENS Vol:14 No:03 102
144303-8282-IJMME-IJENS © June 2014 IJENS I J E N S
Fig. 6. Relationship between experimental Nu and Re for tube positions in the tube bank.
Table VIII Experimental results showing Nu and Re relationship
Rows Experimental Correlations
1st Nu = 4.302Re
0.239
R2 = 0.978
2nd
Nu = 3.269Re0.262
R2 = 0.991
3rd
Nu = 2.672Re0.272
R2 = 0.994
4th
Nu = 2.178Re0.281
R2 = 0.993

International Journal of Mechanical & Mechatronics Engineering IJMME-IJENS Vol:14 No:03 103
144303-8282-IJMME-IJENS © June 2014 IJENS I J E N S
Numerical results Velocity Distribution
Fig. 7. Velocity distribution in the tube bank at Re = 24380
Velocity pattern in the bank is illustrated in Fig. 7.
Fluid velocity in the mid-plane of the tubes was observed to
be higher and weak near tube surface plane because of the
boundary layer development on the surface.
As shown in Fig.7, a large portion of the tube surface
area of only the first rank is exposed to the main flow. A
larger flow recirculation region or dead zone is formed
between the two adjacent tubes. It also proves clearly the
existence of reverse flow patterns upstream of deeper rows.
Furthermore, these velocity data confirm that a bypass stream
exists between the tubes. Moreover, the active heat transfer
surface area is small since the up and down stream parts of a
tube surface are in the low velocity region. The streamline plot
revealed that vortex formation occurs in the zones of
recirculation. Maximum velocity was seen to occur at the
minimum cross section.
Boundary Layer Separation
Fig. 8. The boundary layer separation point of first rank in tube bank at Re = 24380
Boundary layer separation occur at a point on the
tubes where the fluid momentum is too weak to overcome the
adverse pressure gradient and then detached from the tubes
surface as shown in figure 8. This separation was observed
shortly after (θ = 90°). By the nature of these flow separations,
local heat transfer and fluid mixing increase especially
upstream of the tubes and cause low performance at the wake
region located downstream of the tubes.
International Journal of Mechanical & Mechatronics Engineering IJMME-IJENS Vol:14 No:03 104
144303-8282-IJMME-IJENS © June 2014 IJENS I J E N S
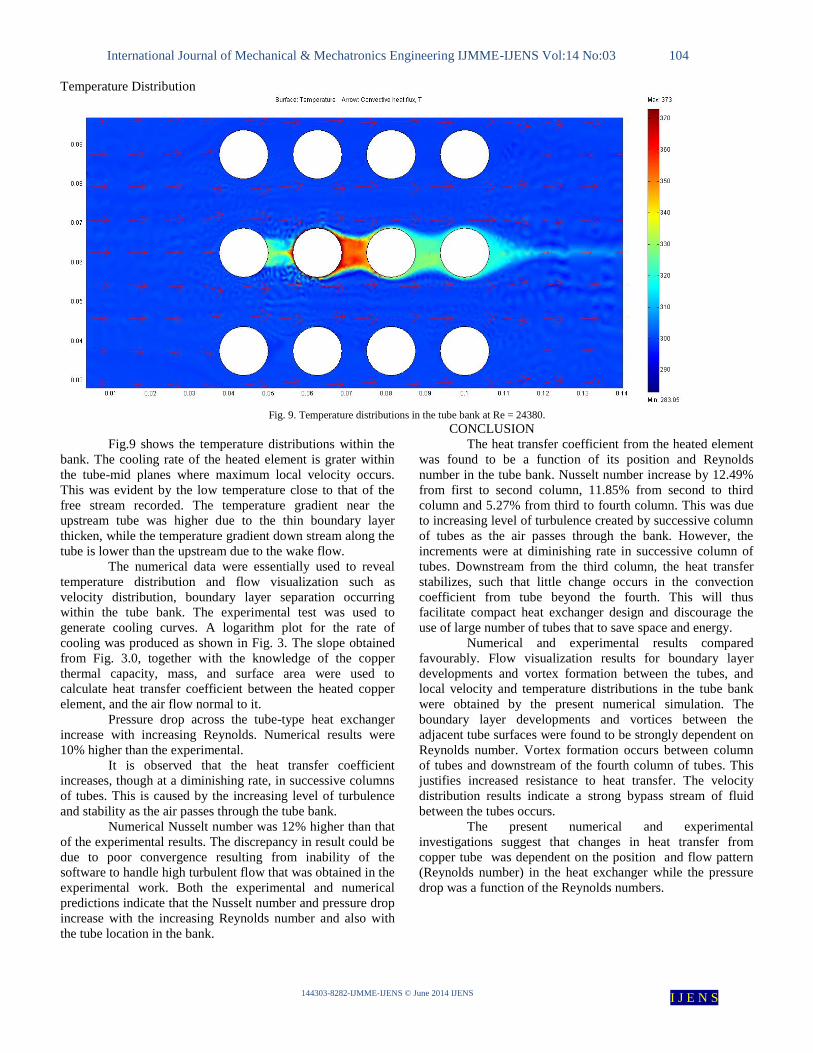
Temperature Distribution
Fig. 9. Temperature distributions in the tube bank at Re = 24380.
Fig.9 shows the temperature distributions within the
bank. The cooling rate of the heated element is grater within
the tube-mid planes where maximum local velocity occurs.
This was evident by the low temperature close to that of the
free stream recorded. The temperature gradient near the
upstream tube was higher due to the thin boundary layer
thicken, while the temperature gradient down stream along the
tube is lower than the upstream due to the wake flow.
The numerical data were essentially used to reveal
temperature distribution and flow visualization such as
velocity distribution, boundary layer separation occurring
within the tube bank. The experimental test was used to
generate cooling curves. A logarithm plot for the rate of
cooling was produced as shown in Fig. 3. The slope obtained
from Fig. 3.0, together with the knowledge of the copper
thermal capacity, mass, and surface area were used to
calculate heat transfer coefficient between the heated copper
element, and the air flow normal to it.
Pressure drop across the tube-type heat exchanger
increase with increasing Reynolds. Numerical results were
10% higher than the experimental.
It is observed that the heat transfer coefficient
increases, though at a diminishing rate, in successive columns
of tubes. This is caused by the increasing level of turbulence
and stability as the air passes through the tube bank.
Numerical Nusselt number was 12% higher than that
of the experimental results. The discrepancy in result could be
due to poor convergence resulting from inability of the
software to handle high turbulent flow that was obtained in the
experimental work. Both the experimental and numerical
predictions indicate that the Nusselt number and pressure drop
increase with the increasing Reynolds number and also with
the tube location in the bank.
CONCLUSION
The heat transfer coefficient from the heated element
was found to be a function of its position and Reynolds
number in the tube bank. Nusselt number increase by 12.49%
from first to second column, 11.85% from second to third
column and 5.27% from third to fourth column. This was due
to increasing level of turbulence created by successive column
of tubes as the air passes through the bank. However, the
increments were at diminishing rate in successive column of
tubes. Downstream from the third column, the heat transfer
stabilizes, such that little change occurs in the convection
coefficient from tube beyond the fourth. This will thus
facilitate compact heat exchanger design and discourage the
use of large number of tubes that to save space and energy.
Numerical and experimental results compared
favourably. Flow visualization results for boundary layer
developments and vortex formation between the tubes, and
local velocity and temperature distributions in the tube bank
were obtained by the present numerical simulation. The
boundary layer developments and vortices between the
adjacent tube surfaces were found to be strongly dependent on
Reynolds number. Vortex formation occurs between column
of tubes and downstream of the fourth column of tubes. This
justifies increased resistance to heat transfer. The velocity
distribution results indicate a strong bypass stream of fluid
between the tubes occurs.
The present numerical and experimental
investigations suggest that changes in heat transfer from
copper tube was dependent on the position and flow pattern
(Reynolds number) in the heat exchanger while the pressure
drop was a function of the Reynolds numbers.
International Journal of Mechanical & Mechatronics Engineering IJMME-IJENS Vol:14 No:03 105
144303-8282-IJMME-IJENS © June 2014 IJENS I J E N S
REFERENCES [1] M. A. Mehrabian, 2007, Heat Transfer and Pressure Drop
Characteristics Of Cross Flow Of Air Over An Circular Tube in
Isolation And/Or in a Tube Bank, The Arabian Journal for Science and Engineering, Volume 32.
[2] S.Y. Yoo, H.K. Kwon, J.H. Kim, 2007, A study on heat transfer
characteristics for staggered tube banks in cross-flow, J. Mech. Sci. Technol. Vol. 21 pp 505–512.
[3] Yukio Takemoto, Keiji Kawanishi, Jiro Mizushima, 2010, Heat
transfer in the flow through a bundle of tubes and transitions of the flow, International Journal of Heat and Mass Transfer, Vol. 53 pp
5411–5419.
[4] Incropera, F.P. and Dewitt, D.P.( 2004), Fundamental of Heat and Mass Transfer, 5th ed., John Wiley & Sons, Inc.
[5] John, H. Lienhard IV and John, H. Lienhard V (2006), A Heat
Transfer Textbook, 3rd ed., Phlogiston Press, Cambridge, Massachusetts, USA
[6] Chunlei Liang , George Papadakis, Xiaoyu Luo (2009), Effect of tube spacing on the vortex shedding characteristics of laminar flow
past an inline tube array: A numerical study, International Journal of Computers & Fluids, 38, 950–964