Health Issues - using maps, graphs, charts
6
Health Issues Using data to answer questions
Transcript of Health Issues - using maps, graphs, charts

Health Issues
Using data to answer questions

1980
http://www.economist.com/blogs/dailychart/2011/02/global_obesity

2008

Percentage Change
Suggest reasons for the global variation in BMI change in the last 30 years (5 marks)
Obesity was generally considered a developed world problem back in 1980. By 2008, countries which were previously considered poor were experiencing rising rates of obesity (for example, Brazil)
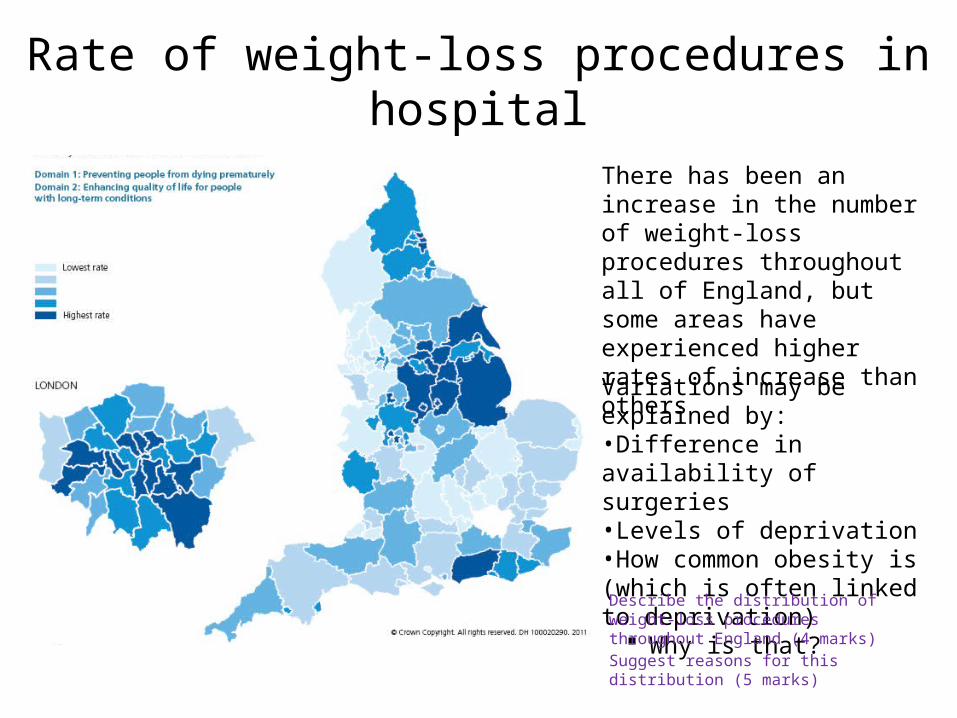
Rate of weight-loss procedures in hospital
There has been an increase in the number of weight-loss procedures throughout all of England, but some areas have experienced higher rates of increase than others
Variations may be explained by:•Difference in availability of surgeries•Levels of deprivation•How common obesity is (which is often linked to deprivation)
Why is that?
Describe the distribution of weight-loss procedures throughout England (4 marks)
Suggest reasons for this distribution (5 marks)

Rate of weight-loss procedures over time