GROWING AREA WQ Boothbay, Edgecomb, … Edgecomb, Newcastle and Damariscotta ANNUAL REVIEW for 2010...
14
2010 Annual Review Effective Date 1/30/2012 GROWING AREA WQ Damariscotta River Boothbay, Edgecomb, Newcastle and Damariscotta ANNUAL REVIEW for 2010 Report Date: 01-30-2012 Eric Sroka APPROVAL Division Director: Kohl Kanwit 1/30/2012 _________________________ _________________________ Date: ____________ Print name signature Page 1 of 14
Transcript of GROWING AREA WQ Boothbay, Edgecomb, … Edgecomb, Newcastle and Damariscotta ANNUAL REVIEW for 2010...
2010 Annual Review Effective Date 1/30/2012
GROWING AREA WQ
Damariscotta River Boothbay, Edgecomb, Newcastle and Damariscotta
ANNUAL REVIEW for 2010
Report Date: 01-30-2012
Eric Sroka
APPROVAL Division Director:
Kohl Kanwit 1/30/2012 _________________________ _________________________ Date: ____________ Print name signature
Page 1 of 14
2010 Annual Review Effective Date 1/30/2012
TABLE OF CONTENTS Executive Summary ......................................................................................................................4 Growing Area Description .............................................................................................................4 Current Classification(s)................................................................................................................4 Activity during Review Period .......................................................................................................5 Conditionally Managed Area(s).....................................................................................................5 Water Quality Review and Discussion ..........................................................................................5 Upward Classification Changes ..................................................................................................10 Shoreline Survey Activity ............................................................................................................10 Aquaculture/Wet Storage Activity ...............................................................................................11 Recommendation for Future Work..............................................................................................11 Appendix A. Annual Review of WQ Conditional Area Management Plan..................................12 Appendix B. Key to Water Quality Table Headers ......................................................................14 LIST OF TABLES Table 1. OBDs in Growing Area WQ Removed in 2010 ...............................................................5 Table 2. Geomean and P90 Scores, Growing Area WQ, 2001-2010 ...........................................6 Table 3. Geomean and P90 Scores for Growing Area WQ Conditionally Approved Stations, Open Status, 2008-2010...............................................................................................................7 Table 4. 2010 Sampling Effort, Growing Area WQ .......................................................................7 Table 5. Great Salt Bay Conditional Area Geomean and P90 Scores, Open Status, 2008-2010....................................................................................................................................................13 LIST OF FIGURES Figure 1. Growing Area WQ, with Active Sampling Stations ........................................................3 Figure 2. Area WQ P90 Trends for Approved Stations (expressed as the percent of the approved standard), 2008-2010....................................................................................................8 Figure 3. Area WQ P90 Trends for Conditionally Approved Stations (expressed as the percent of the approved standard), 2008-2010..........................................................................................9 Figure 4. Area WQ P90 Trends for Restricted Stations (expressed as the percent of the restricted standard), 2008-2010..................................................................................................10 Figure 5. Area Q Conditional Area Detail....................................................................................12
Page 2 of 14
2010 Annual Review Effective Date 1/30/2012
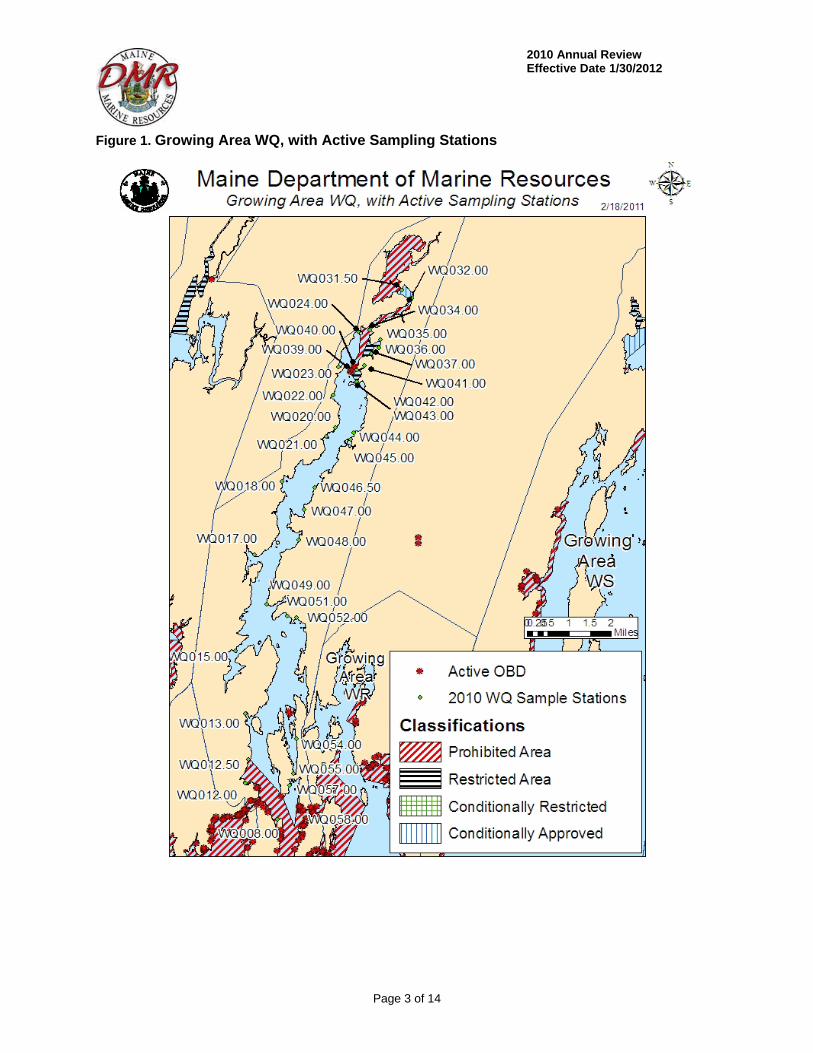
Figure 1. Growing Area WQ, with Active Sampling Stations
Page 3 of 14
2010 Annual Review Effective Date 1/30/2012
Executive Summary This is an annual report for growing area WQ written in compliance with the requirements of the 2009 Model Ordinance and the National Shellfish Sanitation Program. Growing Area WQ has had no significant changes in pollution sources during the review period. Existing pollution sources include two municipal waste water treatment plants, two marinas, six boatyards and licensed over board discharges. In 2010, one sampling station was reactivated (WQ8) in growing area WQ. No sampling stations were removed or deactivated, and no classification changes occurred. Water quality remains generally good in Growing Area WQ. No classification changes are required at this time. The next triennial report is due after 2014; the next sanitary survey report is due after 2011.
Growing Area Description Growing Area WQ is the Damariscotta River estuary, located in Lincoln County along the midcoast region of Maine (Figure 1). The growing area boundary begins at Linekin Neck, East Boothbay; includes the Gut, South Bristol and ends at the southeast tip of Rutherford Island, South Bristol (including Turnip and Thrumcap Islands). A description of the upland boundary can be found in the central files of the Department of Marine Resources in West Boothbay Harbor. The river flows through the following towns: Nobleboro, Damariscotta, Newcastle, South Bristol, Edgecomb, Bristol and Boothbay. The growing area’s head of tide is located below the outlet of Damariscotta Lake on the town line between Newcastle and Nobleboro and the river empties into the Atlantic Ocean 15 miles south of the two towns. Pollution sources in this growing area include two waste water treatment plants, with discharges into the Damariscotta River and 83 licensed OBDs. One OBD was removed during the review period
Current Classification(s) Shellfish growing area WQ currently has areas classified as: Approved Middle Damariscotta River; 21 sample stations : WQ 13, 15, 17, 18, 20, 21, 22, 23, 24,
43, 44, 45, 46.50, 47, 48, 49, 51, 52, 54, 55, 57
Conditionally Approved Area No. 23-A, Area between the Narrows and US Route 1 (Newcastle, Damariscotta), due to Great Salt Bay Sewage Treatment Plant 2 stations: WQ 31.5 and 32.
Restricted Area No. 23-A, Days Cove, (Damariscotta); WQ 35, 36 and 37; due to non-point pollution and water quality not meeting approved standards
Page 4 of 14
2010 Annual Review Effective Date 1/30/2012
Area No. 23-A, Huston Cove, (Damariscotta); WQ 40, 41 and 42; due to non-point pollution and water quality not meeting approved standards
Prohibited Area No. 23-A, Damariscotta River south of Route 1 bridge (Newcastle, Damariscotta); WQ 24 and 39; due to presence of waste water treatment plant outfall. Area No. 23-C, Farmers Island, (South Bristol), due to OBD; no sample stations Area No. 23-C, Lower Damariscotta River (Boothbay and South Bristol); due to the presence of OBDs, marinas and non-point source pollution: WQ 8, 12, 12.5 and 58.
For a complete list of Legal Notices, please visit Maine DMR website: http://www.maine.gov/dmr/rm/public_health/closures/closedarea.htm#Q
Activity during Review Period There were no classification changes in 2010. The DEP has reported that one OBD was removed in growing area WQ in 2010 (Table 1). Table 1. OBDs in Growing Area WQ Removed in 2010
DEP ID Location Flow Reported Removal
Date 003363 Boothbay 300 gpd 5/20/2010
Conditionally Managed Area(s) There is one conditional area located in growing area WQ: Pollution Area No. 23-A: Damariscotta River Conditional Area; due to Great Salt Bay Sewage Treatment Plant; Stations WQ 31.5 and 32. A copy of the management plan for this conditional area can be found in DMR central files; this plan was last updated on 6/13/2011.
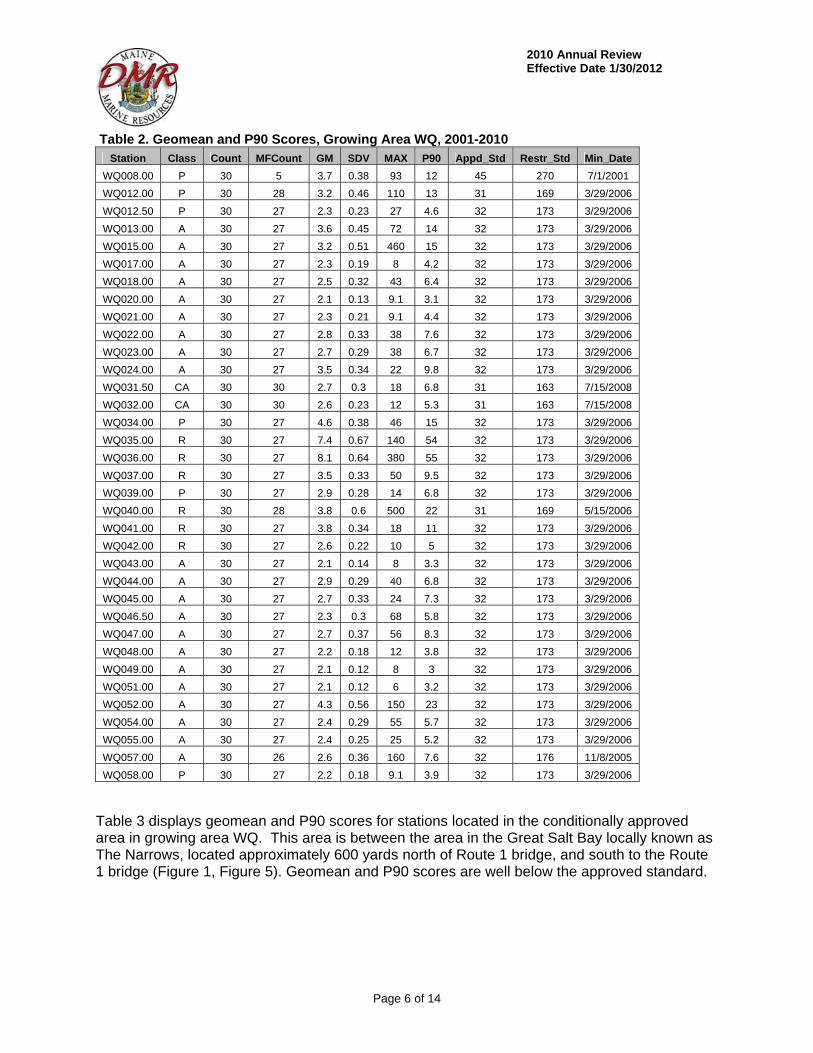
Water Quality Review and Discussion Table 2 lists all active approved, conditionally approved, restricted and prohibited stations in Growing Area WQ, with their respective geometric means and P90 calculations for 2010. Please refer to Appendix B for a key to interpreting the headers on the columns of Table 2. The approved standard (for approved, conditionally approved and prohibited stations) and the restricted standard (for restricted stations) are also displayed in Table 2. All approved, conditionally approved and restricted stations met their NSSP classification standard in 2010 (Table 2).
Page 5 of 14
2010 Annual Review Effective Date 1/30/2012
Table 2. Geomean and P90 Scores, Growing Area WQ, 2001-2010 Station Class Count MFCount GM SDV MAX P90 Appd_Std Restr_Std Min_Date
WQ008.00 P 30 5 3.7 0.38 93 12 45 270 7/1/2001
WQ012.00 P 30 28 3.2 0.46 110 13 31 169 3/29/2006
WQ012.50 P 30 27 2.3 0.23 27 4.6 32 173 3/29/2006
WQ013.00 A 30 27 3.6 0.45 72 14 32 173 3/29/2006
WQ015.00 A 30 27 3.2 0.51 460 15 32 173 3/29/2006
WQ017.00 A 30 27 2.3 0.19 8 4.2 32 173 3/29/2006
WQ018.00 A 30 27 2.5 0.32 43 6.4 32 173 3/29/2006
WQ020.00 A 30 27 2.1 0.13 9.1 3.1 32 173 3/29/2006
WQ021.00 A 30 27 2.3 0.21 9.1 4.4 32 173 3/29/2006
WQ022.00 A 30 27 2.8 0.33 38 7.6 32 173 3/29/2006
WQ023.00 A 30 27 2.7 0.29 38 6.7 32 173 3/29/2006
WQ024.00 A 30 27 3.5 0.34 22 9.8 32 173 3/29/2006
WQ031.50 CA 30 30 2.7 0.3 18 6.8 31 163 7/15/2008
WQ032.00 CA 30 30 2.6 0.23 12 5.3 31 163 7/15/2008
WQ034.00 P 30 27 4.6 0.38 46 15 32 173 3/29/2006
WQ035.00 R 30 27 7.4 0.67 140 54 32 173 3/29/2006
WQ036.00 R 30 27 8.1 0.64 380 55 32 173 3/29/2006
WQ037.00 R 30 27 3.5 0.33 50 9.5 32 173 3/29/2006
WQ039.00 P 30 27 2.9 0.28 14 6.8 32 173 3/29/2006
WQ040.00 R 30 28 3.8 0.6 500 22 31 169 5/15/2006
WQ041.00 R 30 27 3.8 0.34 18 11 32 173 3/29/2006
WQ042.00 R 30 27 2.6 0.22 10 5 32 173 3/29/2006
WQ043.00 A 30 27 2.1 0.14 8 3.3 32 173 3/29/2006
WQ044.00 A 30 27 2.9 0.29 40 6.8 32 173 3/29/2006
WQ045.00 A 30 27 2.7 0.33 24 7.3 32 173 3/29/2006
WQ046.50 A 30 27 2.3 0.3 68 5.8 32 173 3/29/2006
WQ047.00 A 30 27 2.7 0.37 56 8.3 32 173 3/29/2006
WQ048.00 A 30 27 2.2 0.18 12 3.8 32 173 3/29/2006
WQ049.00 A 30 27 2.1 0.12 8 3 32 173 3/29/2006
WQ051.00 A 30 27 2.1 0.12 6 3.2 32 173 3/29/2006
WQ052.00 A 30 27 4.3 0.56 150 23 32 173 3/29/2006
WQ054.00 A 30 27 2.4 0.29 55 5.7 32 173 3/29/2006
WQ055.00 A 30 27 2.4 0.25 25 5.2 32 173 3/29/2006
WQ057.00 A 30 26 2.6 0.36 160 7.6 32 176 11/8/2005
WQ058.00 P 30 27 2.2 0.18 9.1 3.9 32 173 3/29/2006
Table 3 displays geomean and P90 scores for stations located in the conditionally approved area in growing area WQ. This area is between the area in the Great Salt Bay locally known as The Narrows, located approximately 600 yards north of Route 1 bridge, and south to the Route 1 bridge (Figure 1, Figure 5). Geomean and P90 scores are well below the approved standard.
Page 6 of 14
2010 Annual Review Effective Date 1/30/2012
Table 3. Geomean and P90 Scores for Growing Area WQ Conditionally Approved Stations, Open Status, 2008-2010
Station Class Count MFCount GM SDV MAX P90 Appd_Std Min_Date
WQ031.50 CA 30 30 2.7 0.3 18 6.8 31 7/15/2008
WQ032.00 CA 30 30 2.6 0.23 12 5.3 31 7/15/2008
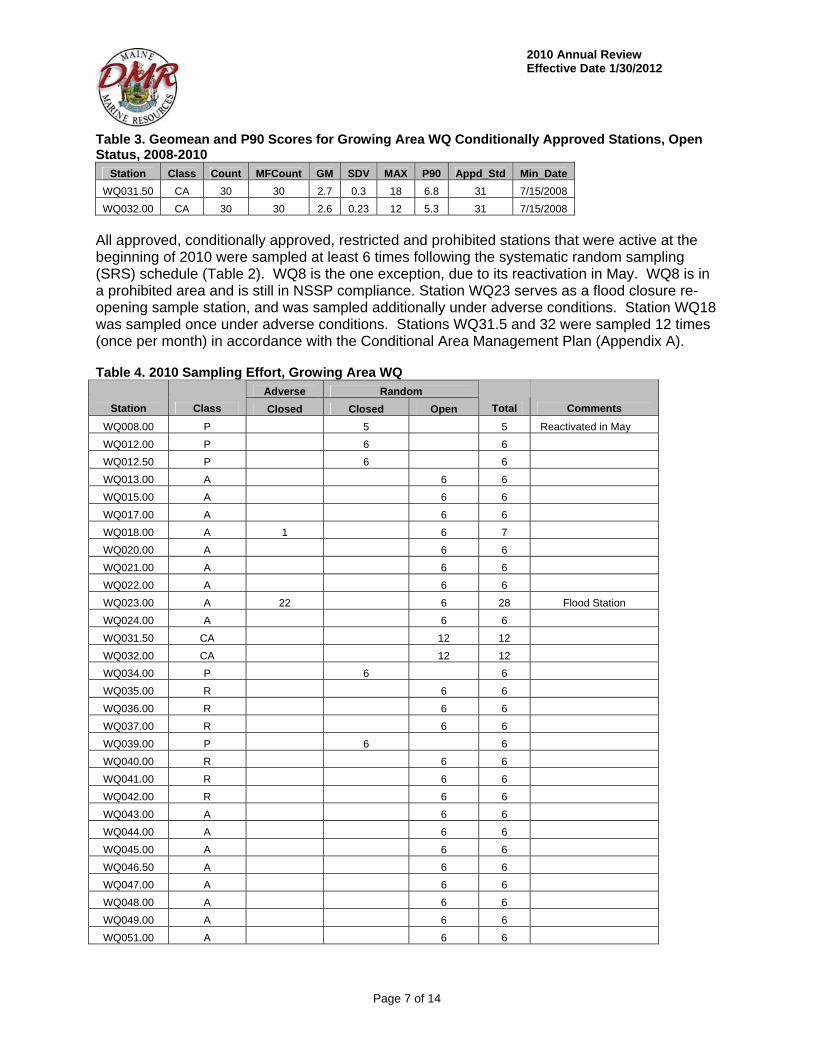
All approved, conditionally approved, restricted and prohibited stations that were active at the beginning of 2010 were sampled at least 6 times following the systematic random sampling (SRS) schedule (Table 2). WQ8 is the one exception, due to its reactivation in May. WQ8 is in a prohibited area and is still in NSSP compliance. Station WQ23 serves as a flood closure re-opening sample station, and was sampled additionally under adverse conditions. Station WQ18 was sampled once under adverse conditions. Stations WQ31.5 and 32 were sampled 12 times (once per month) in accordance with the Conditional Area Management Plan (Appendix A). Table 4. 2010 Sampling Effort, Growing Area WQ
Adverse Random
Station Class Closed Closed Open Total Comments
WQ008.00 P 5 5 Reactivated in May
WQ012.00 P 6 6
WQ012.50 P 6 6
WQ013.00 A 6 6
WQ015.00 A 6 6
WQ017.00 A 6 6
WQ018.00 A 1 6 7
WQ020.00 A 6 6
WQ021.00 A 6 6
WQ022.00 A 6 6
WQ023.00 A 22 6 28 Flood Station
WQ024.00 A 6 6
WQ031.50 CA 12 12
WQ032.00 CA 12 12
WQ034.00 P 6 6
WQ035.00 R 6 6
WQ036.00 R 6 6
WQ037.00 R 6 6
WQ039.00 P 6 6
WQ040.00 R 6 6
WQ041.00 R 6 6
WQ042.00 R 6 6
WQ043.00 A 6 6
WQ044.00 A 6 6
WQ045.00 A 6 6
WQ046.50 A 6 6
WQ047.00 A 6 6
WQ048.00 A 6 6
WQ049.00 A 6 6
WQ051.00 A 6 6
Page 7 of 14
2010 Annual Review Effective Date 1/30/2012
Adverse Random
Station Class Closed Closed Total Comments Open
WQ052.00 A 6 6
WQ054.00 A 6 6
WQ055.00 A 6 6
WQ057.00 A 6 6
WQ058.00 P 6 6
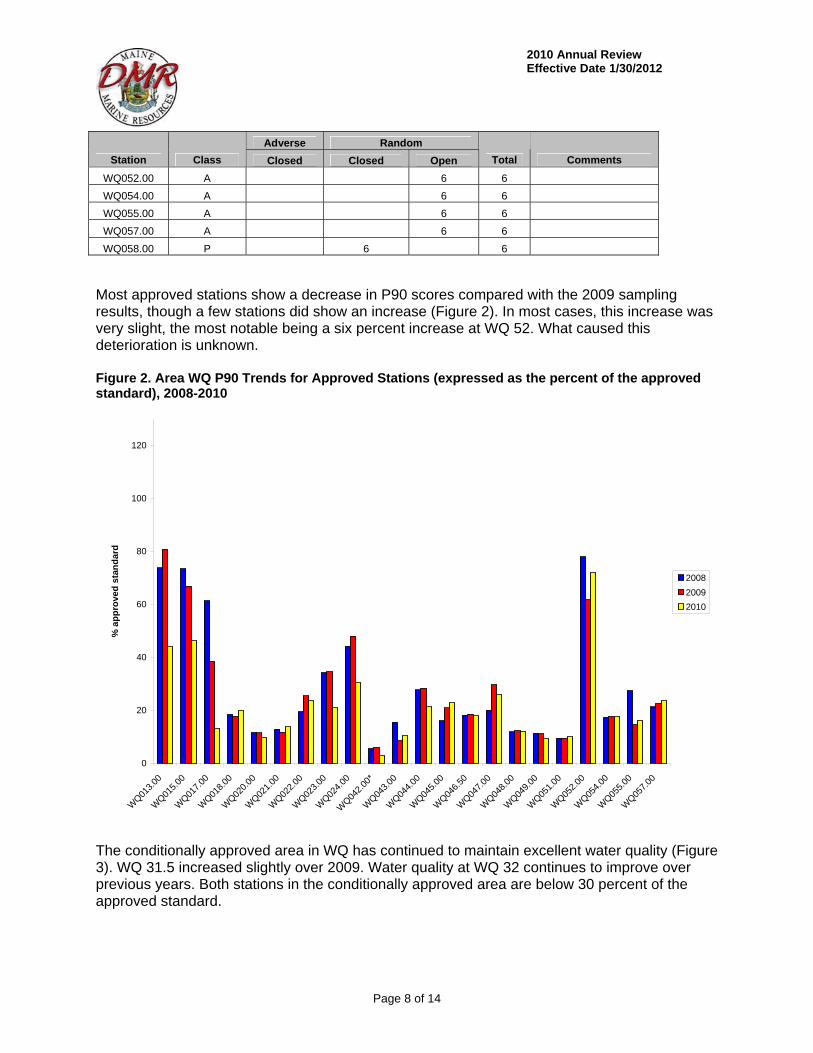
Most approved stations show a decrease in P90 scores compared with the 2009 sampling results, though a few stations did show an increase (Figure 2). In most cases, this increase was very slight, the most notable being a six percent increase at WQ 52. What caused this deterioration is unknown. Figure 2. Area WQ P90 Trends for Approved Stations (expressed as the percent of the approved standard), 2008-2010
0
20
40
60
80
100
120
WQ01
3.00
WQ01
5.00
WQ01
7.00
WQ01
8.00
WQ02
0.00
WQ02
1.00
WQ02
2.00
WQ02
3.00
WQ02
4.00
WQ04
2.00
*
WQ04
3.00
WQ04
4.00
WQ04
5.00
WQ04
6.50
WQ04
7.00
WQ04
8.00
WQ04
9.00
WQ05
1.00
WQ05
2.00
WQ05
4.00
WQ05
5.00
WQ05
7.00
% a
pp
rove
d s
tan
dar
d
2008
2009
2010
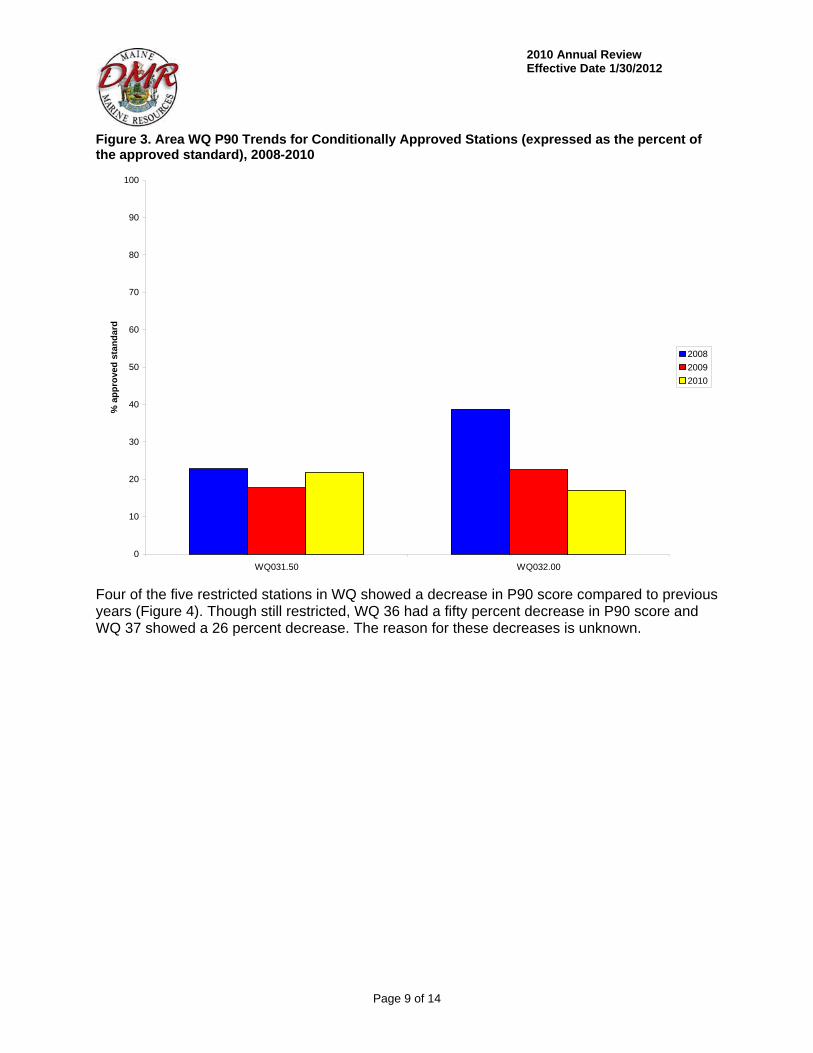
The conditionally approved area in WQ has continued to maintain excellent water quality (Figure 3). WQ 31.5 increased slightly over 2009. Water quality at WQ 32 continues to improve over previous years. Both stations in the conditionally approved area are below 30 percent of the approved standard.
Page 8 of 14
2010 Annual Review Effective Date 1/30/2012
Figure 3. Area WQ P90 Trends for Conditionally Approved Stations (expressed as the percent of the approved standard), 2008-2010
0
10
20
30
40
50
60
70
80
90
100
WQ031.50 WQ032.00
% a
pp
rove
d s
tan
dar
d
2008
2009
2010
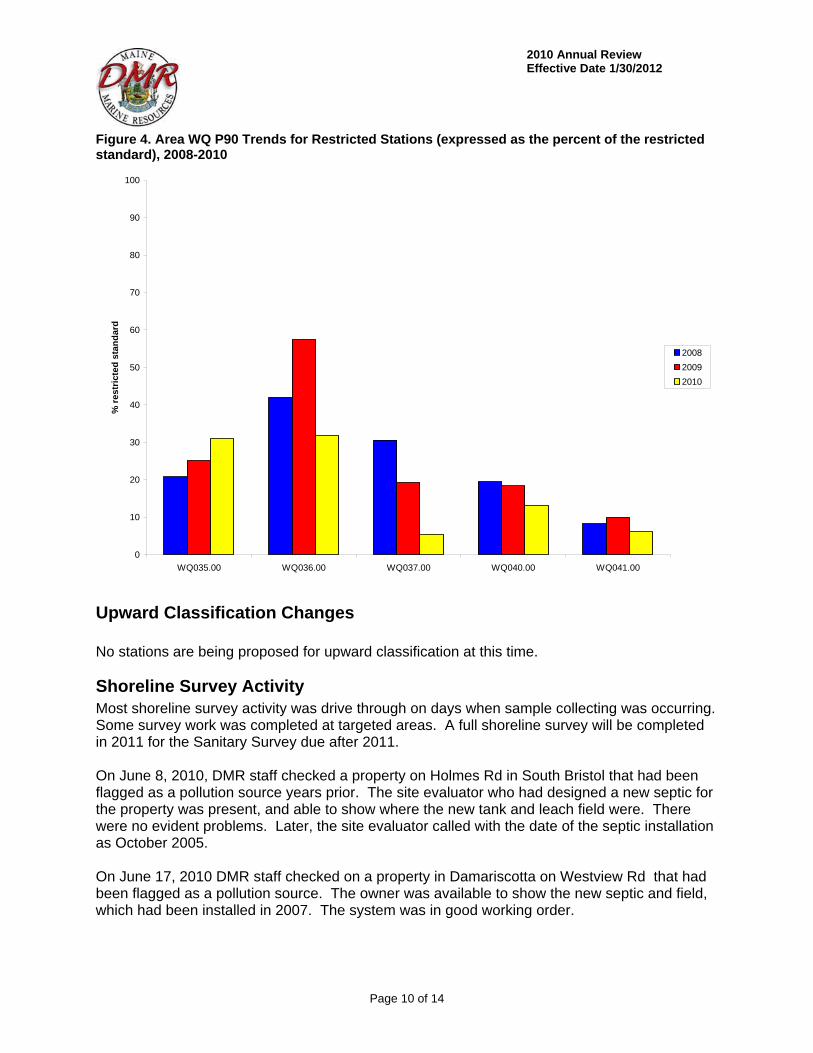
Four of the five restricted stations in WQ showed a decrease in P90 score compared to previous years (Figure 4). Though still restricted, WQ 36 had a fifty percent decrease in P90 score and WQ 37 showed a 26 percent decrease. The reason for these decreases is unknown.
Page 9 of 14
2010 Annual Review Effective Date 1/30/2012
Figure 4. Area WQ P90 Trends for Restricted Stations (expressed as the percent of the restricted standard), 2008-2010
0
10
20
30
40
50
60
70
80
90
100
WQ035.00 WQ036.00 WQ037.00 WQ040.00 WQ041.00
% r
estr
icte
d s
tan
dar
d
2008
2009
2010
Upward Classification Changes No stations are being proposed for upward classification at this time.
Shoreline Survey Activity Most shoreline survey activity was drive through on days when sample collecting was occurring. Some survey work was completed at targeted areas. A full shoreline survey will be completed in 2011 for the Sanitary Survey due after 2011. On June 8, 2010, DMR staff checked a property on Holmes Rd in South Bristol that had been flagged as a pollution source years prior. The site evaluator who had designed a new septic for the property was present, and able to show where the new tank and leach field were. There were no evident problems. Later, the site evaluator called with the date of the septic installation as October 2005. On June 17, 2010 DMR staff checked on a property in Damariscotta on Westview Rd that had been flagged as a pollution source. The owner was available to show the new septic and field, which had been installed in 2007. The system was in good working order.
Page 10 of 14

2010 Annual Review Effective Date 1/30/2012
On July 7, 2010, DMR staff visited a property in Damariscotta at 98 Westview Rd (Tax map 27 lot 14) that had been flagged as a pollution source. The owner was able to show where the tank and leach field were located, on the north side of the house. The owner had no knowledge of any failing septic. The area around the splitter box looked like it had been recently disturbed, possibly pumped out. No problems were observed.
Aquaculture/Wet Storage Activity There are 24 aquaculture leases (23 standard, 1 experimental), 5 LPAs, and 3 Wet Storage Sites in the Damariscotta River. For more information on aquaculture leases, please visit the DMR website: http://www.maine.gov/dmr/aquaculture/leaseinventory/index.htm
Recommendation for Future Work Additional rainfall samples should be collected at stations WQ12, 37, and 40 to assess rainfall impact. Sanitary survey work will be performed during 2011 in order to write a sanitary survey review at the end of the sampling season.
Page 11 of 14
2010 Annual Review Effective Date 1/30/2012
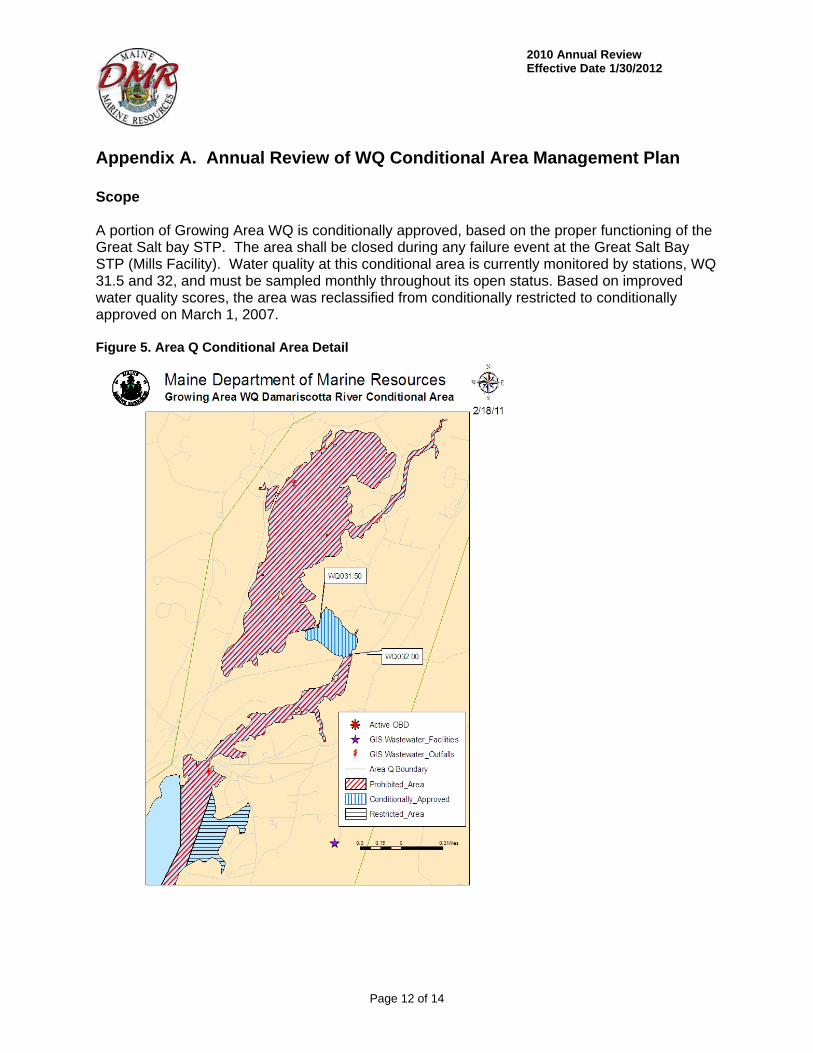
Appendix A. Annual Review of WQ Conditional Area Management Plan Scope A portion of Growing Area WQ is conditionally approved, based on the proper functioning of the Great Salt bay STP. The area shall be closed during any failure event at the Great Salt Bay STP (Mills Facility). Water quality at this conditional area is currently monitored by stations, WQ 31.5 and 32, and must be sampled monthly throughout its open status. Based on improved water quality scores, the area was reclassified from conditionally restricted to conditionally approved on March 1, 2007. Figure 5. Area Q Conditional Area Detail
Page 12 of 14
2010 Annual Review Effective Date 1/30/2012
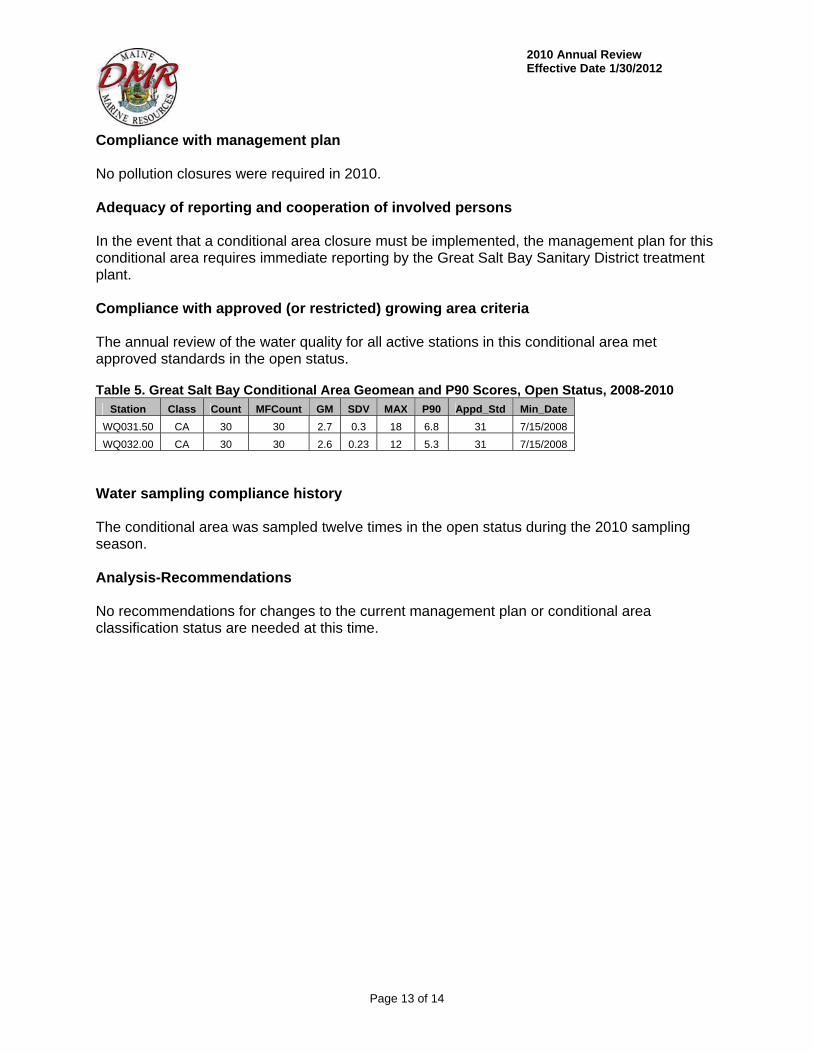
Compliance with management plan No pollution closures were required in 2010. Adequacy of reporting and cooperation of involved persons In the event that a conditional area closure must be implemented, the management plan for this conditional area requires immediate reporting by the Great Salt Bay Sanitary District treatment plant. Compliance with approved (or restricted) growing area criteria The annual review of the water quality for all active stations in this conditional area met approved standards in the open status. Table 5. Great Salt Bay Conditional Area Geomean and P90 Scores, Open Status, 2008-2010
Station Class Count MFCount GM SDV MAX P90 Appd_Std Min_Date
WQ031.50 CA 30 30 2.7 0.3 18 6.8 31 7/15/2008
WQ032.00 CA 30 30 2.6 0.23 12 5.3 31 7/15/2008
Water sampling compliance history The conditional area was sampled twelve times in the open status during the 2010 sampling season. Analysis-Recommendations No recommendations for changes to the current management plan or conditional area classification status are needed at this time.
Page 13 of 14
2010 Annual Review Effective Date 1/30/2012
Page 14 of 14
Appendix B. Key to Water Quality Table Headers Station = water quality monitoring station Class = classification assigned to the station; prohibited (P), restricted (R), conditionally restricted (CR), conditionally approved (CA) and approved (A). Count = the number of samples evaluated for classification, must be a minimum of 30. MFCNT = the number of samples evaluated with the MTec method (included in the total Count column) Geo_Mean = means the antilog (base 10) of the arithmetic mean of the sample result logarithm (base 10). SDV = standard deviation Max = maximum score of the 30 data points in the count column P90 = 90th percentile APPD_STD = the 90th percentile, at or below which the station would meet approved criteria in the absence of pollution sources or poisonous and deleterious substances. RESTR_STD = the 90th percentile, at or below which the station would meet restricted criteria.