Group Annual Report 2018 - Munich Re · 2019-09-17 · Munich Re Group Annual Report 2018 To our...
192
Group Annual Report 2018 Munich Re 2018 WE DRIVE BUSINESS AS ONE
Transcript of Group Annual Report 2018 - Munich Re · 2019-09-17 · Munich Re Group Annual Report 2018 To our...

Group A
nnual Report 2018M
unich Re
Group Annual Report 2018Munich Re
2018WE DRIVE BUSINESS AS ONE
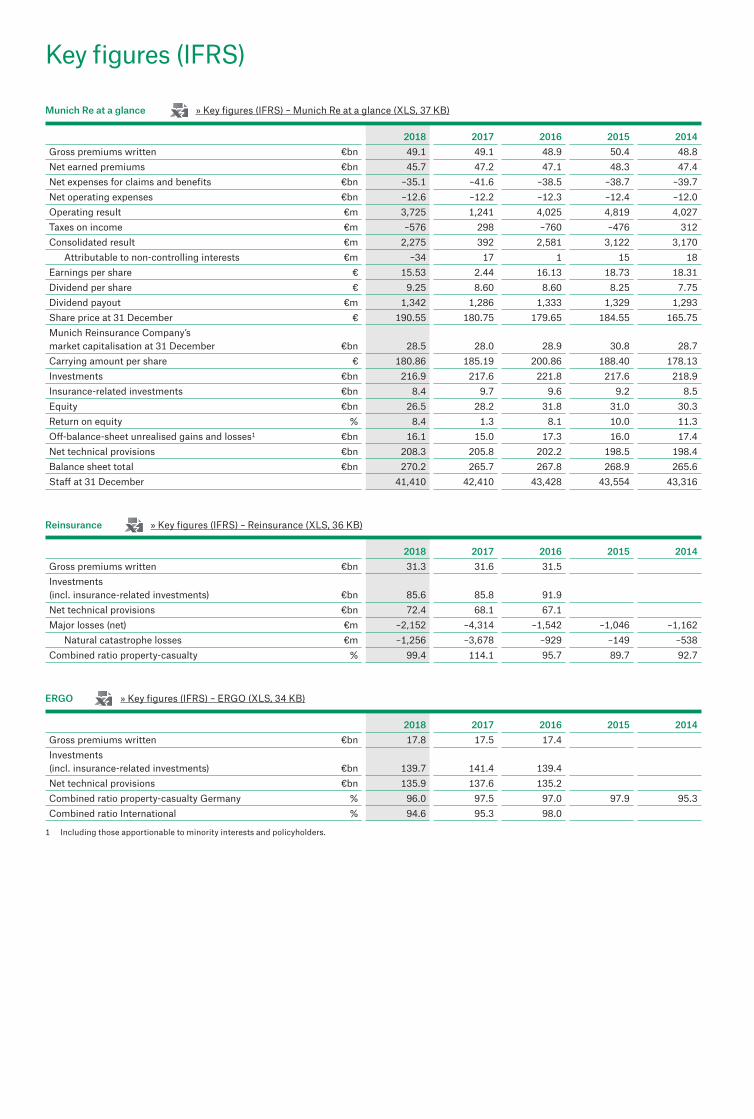
1 Including those apportionable to minority interests and policyholders.
Key figures (IFRS)
» Key figures (IFRS) – Munich Re at a glance (XLS, 37 KB)
» Key figures (IFRS) – Reinsurance (XLS, 36 KB)
» Key figures (IFRS) – ERGO (XLS, 34 KB)ERGO
2018 2017 2016 2015 2014Gross premiums written €bn 17.8 17.5 17.4Investments(incl. insurance-related investments) €bn 139.7 141.4 139.4Net technical provisions €bn 135.9 137.6 135.2Combined ratio property-casualty Germany % 96.0 97.5 97.0 97.9 95.3Combined ratio International % 94.6 95.3 98.0
Reinsurance
2018 2017 2016 2015 2014Gross premiums written €bn 31.3 31.6 31.5Investments(incl. insurance-related investments) €bn 85.6 85.8 91.9Net technical provisions €bn 72.4 68.1 67.1Major losses (net) €m –2,152 –4,314 –1,542 –1,046 –1,162
Natural catastrophe losses €m –1,256 –3,678 –929 –149 –538Combined ratio property-casualty % 99.4 114.1 95.7 89.7 92.7
Munich Re at a glance
2018 2017 2016 2015 2014Gross premiums written €bn 49.1 49.1 48.9 50.4 48.8Net earned premiums €bn 45.7 47.2 47.1 48.3 47.4Net expenses for claims and benefits €bn –35.1 –41.6 –38.5 –38.7 –39.7Net operating expenses €bn –12.6 –12.2 –12.3 –12.4 –12.0Operating result €m 3,725 1,241 4,025 4,819 4,027Taxes on income €m –576 298 –760 –476 312Consolidated result €m 2,275 392 2,581 3,122 3,170
Attributable to non-controlling interests €m –34 17 1 15 18Earnings per share € 15.53 2.44 16.13 18.73 18.31Dividend per share € 9.25 8.60 8.60 8.25 7.75Dividend payout €m 1,342 1,286 1,333 1,329 1,293Share price at 31 December € 190.55 180.75 179.65 184.55 165.75Munich Reinsurance Company’smarket capitalisation at 31 December €bn 28.5 28.0 28.9 30.8 28.7Carrying amount per share € 180.86 185.19 200.86 188.40 178.13Investments €bn 216.9 217.6 221.8 217.6 218.9Insurance-related investments €bn 8.4 9.7 9.6 9.2 8.5Equity €bn 26.5 28.2 31.8 31.0 30.3Return on equity % 8.4 1.3 8.1 10.0 11.3Off-balance-sheet unrealised gains and losses1 €bn 16.1 15.0 17.3 16.0 17.4Net technical provisions €bn 208.3 205.8 202.2 198.5 198.4Balance sheet total €bn 270.2 265.7 267.8 268.9 265.6Staff at 31 December 41,410 42,410 43,428 43,554 43,316

1
Munich Re Group Annual Report 2018
Munich Re at a glanceKey figures Inside front coverQuarterly figures Inside back coverImportant dates Back cover
Letter to shareholders 3
Corporate governance 7Report of the Supervisory Board 9Corporate governance report 16
Combined management report 23Group 25Macroeconomic and industry environment 47Important tools of corporate management 48Business performance 50Financial position 62Risk report 66Opportunities report 75Prospects 77Munich Reinsurance Company (information reported on the basis of German accountancy rules) 81
Consolidated financial statements and notes 89Consolidated balance sheet 92Consolidated income statement 94Statement of recognised income and expense 95Group statement of changes in equity 96Consolidated cash flow statement 98Notes 99
Independent auditor’s report 180
Responsibility statement 187
Imprint/Service 188
More detailed lists of contents are provided on the pagesseparating the individual sections.
Due to rounding, there may be minor deviations in summations and in the calculation of percentages in this report.
This document is a translation of the original German version and is intended to be used for informational purposes only. While every effort has been made to ensure the accuracy and completeness of the translation, please note that the German original is binding.
1
2
3
Contents Group Annual Report 2018


Munich Re Group Annual Report 2018
3To our shareholders
Dr. Joachim WenningChairman of Munich ReinsuranceCompany’s Board of Management
2018 was a good year for Munich Re. We increased our profit to €2.3bn and achieved our result target. And you, our shareholders, will participate in our success through a higher dividend. Subject to the approval of the Supervisory Board and Annual General Meeting, Munich Re will raise the figure to €9.25 per share. Our shares thus remain a high-return investment.
At the same time, Munich Re is a company that plays a significant economic and social role. The very purpose of our undertaking becomes clear when disaster strikes: by providing insurance, we redistribute funds from those spared by tragedy to those affected by it. We alleviate human suffering. After all, it is only because we make risks insurable that people are prepared and in a position to take on new challenges with an uncertain outcome. This benefits society and engenders progress, which increases the prosperity we all depend on.
We have become more ambitious, and that calls for clear goals. In that sense, 2018 was a year of transition. We are setting ourselves a medium-term profit target of €2.8bn for 2020. And we have geared our strategy to this target: we are driving digital transformation forward, reducing complexity and working towards our medium-term profit guidance on the basis of ambitious growth initiatives in reinsurance and primary insurance. In 2018, we made good progress in all three areas of our strategy.

To our shareholders 4
Munich Re is becoming more digital. We are investing systematically in digital transformation. Our focus is on solving the specific problems that our primary insurance clients or sales partners face, and in return we want to participate in the business this generates. We are one of the leading providers of cyber risk insurance, and we offer our clients insurance cover and a wide array of services ranging from preventive measures to the recovery of lost data. In 2018, our purely online insurer nexible almost doubled the number of policies sold, and is now also active in the Austrian market. ERGO is one of the first insurers in Europe to enable its customers to buy insurance using the Alexa voice assistant. We insure algorithms, such as those developed by the start-up company Fraugster, and thus help online traders to check for suspicious transactions more quickly and effectively. Furthermore, the platform of our new digital insurance agent in Canada offers partners with or without an insurance licence the opportunity to sell insurance products online.
The Internet of Things is opening up new, digital fields of business that we will tap into together with partners. In cooperation with Bosch, we intend to continue to support industrial clients that utilise connected manufacturing, so that they can minimise downtimes at their plants, increase the number of units manufactured and improve the quality of their products. For instance, we can provide insurance for the operational risks involved in connected manufacturing or the requisite financing. Together with KUKA and the consulting company MHP, we are also working on a solution to enable commercially viable, flexible small-batch manufacturing and thereby reduce the time to market for new products by up to a third. By covering the cost of investment in production plants and risks such as business interruption through Smart Factory as a Service, we ensure that in future these companies will be able to focus their efforts on developing and testing new products.
We have also invested over US$ 250m in the acquisition of Relayr, a technology company that mainly helps small and medium-sized enterprises to increase their relevance by evaluating data from legacy and new versions of equipment

5To our shareholders
Munich Re Group Annual Report 2018
and software in real time, thus enabling them to anticipate production downtimes and raise productivity.
The number of digital undertakings we have become involved in has allowed us to secure a leading position in the markets, and it has reinforced not only our existing business but also provides us with new sources of income.
Munich Re is getting leaner. Last year, we systematically reduced costs in reinsurance and the Group as a whole. Since then, we have been managing a growing business with fewer resources, which in return is creating further scope for investment in digitalisation through cost savings. This has made us more competitive.
Munich Re is becoming more profitable. After four years of decreasing results, we succeeded in raising our profit – despite unexpectedly high major losses and weak capital markets – and thus made good on our promise.
Our primary insurer ERGO is picking up pace. It is consistently and successfully pursuing its five-year Strategy Programme launched in 2016, as a consequence of which ERGO has strengthened its competitive position, and was once again able to exceed its result target in 2018.
In reinsurance, we wrote profitable new business and saw pleasing growth. The life and health segment generated a technical result that significantly surpassed our expectations – in part thanks to very favourable claims development in the USA. We posted a good profit in property-casualty reinsurance – despite high natural catastrophe losses in the fourth quarter, including Typhoon Jebi and the wildfires in California. This segment accounted for around half of our consolidated profit.
Compared with 2017, reinsurance prices remained stable for treaties renegotiated at the turn of the year. We are confident that the market environment will see an improvement in the course of this year. Nevertheless, we will continue to actively seek and seize opportunities to grow profitably.

To our shareholders 6
Our result ambition is clear: in the coming two years, we intend to increase our consolidated result by a further €500m to €2.8bn. To this end, ERGO will rigorously pursue the successful path it has taken. In reinsurance, we will carry on expanding our new business selectively. The main levers for achieving these goals are growing demand, our technical excellence and our financial strength. In addition, we expect the appointment of a Chief Investment Officer to lead to a progressive increase in our investment income. For 2019, we envisage a profit of approximately €2.5bn.
Munich Re is becoming more digital, leaner, and more profitable. Going forward, we will continue to be a partner that is globally in demand – a provider of reinsurance, primary insurance and insurance-related risk solutions. On behalf of myself and around 41,000 colleagues across the world, I wish to thank you for the trust you place in Munich Re and for accompanying us on this journey.
Yours sincerely,
Joachim Wenning

1
Corporate governance 7
Cor
pora
te g
over
nanc
e

Report of the Supervisory Board 009
Corporate governance report 016Corporate legal structure 016Annual General Meeting 016 Board of Management 016Collaboration between Board of Management and Supervisory Board 017Supervisory Board 017Share trading by Board members 018Responsibilities and seats held by the Board of Management 019Supervisory Board and seats held by members of the Supervisory Board 020
Corporate governanceContents
8

Munich Re Group Annual Report 2018
9Corporate governanceReport of the Supervisory Board
Ladies and Gentlemen,
In the 2018 financial year, the Supervisory Board fulfilled all the tasks and duties incumbent upon it by law and under the Articles of Association and the rules of procedure. All members of the Supervisory Board and of the committees took part in over half of the respective meetings. The overall average attendance for all members of the Supervisory Board was 98% in the reporting year.
Details on the disclosure of individual members’ attendance can be found at www.munichre.com/supervisory-board.
We monitored the Board of Management in its conduct of the business, and gave advice on all matters of importance for the Group. No inspection measures in accordance with Section 111(2) sentence 1 of the German Stock Corporation Act (AktG) were required at any time.
Collaboration between Supervisory Board and Board of Management The Board of Management involved the Supervisory Board in all important business transactions and decisions of fundamental significance for the Group. In our meetings, we discussed all reports from the Board of Management at length. Cooperation with the Board of Management was characterised in every regard by targeted and responsible action aimed at promoting the successful development of Munich Re. The Board of Management satisfied its reporting obligations towards the Supervisory Board in all respects, both verbally and in writing.
Outside of Supervisory Board meetings, the Board of Management informed us promptly about important events in the Group, such as developments during the renewals of property-casualty reinsurance treaties, and the acquisition of the Internet of Things (IoT) technology firm relayr by our US subsidiary Hartford Steam Boiler. The shareholder representatives and the employee representatives met regularly with the Chairman of the Board of Management for separate discussions in preparation for the meetings.
Between meetings, I met regularly with the Chairman of the Board of Management, Joachim Wenning. We discussed individual questions of strategic orientation and risk management, as well as Munich Re’s current business situation. Also between meetings, the Chairman of the Audit Committee, Henning Kagermann, remained in close contact with Jörg Schneider, the member of the Board of Management responsible for Group reporting.
Focal points of the meetings of the full Supervisory BoardThere were six meetings of the Supervisory Board in the year under review. We regularly held in-depth discussions with the Board of Management about business performance and current topics, with special focus on strategic considerations of the Board of Management with respect to the individual fields of business. The Board of Management reported regularly on Munich Re’s investments, addressing the development of the global economy and financial markets in detail, as well as their impact on the Group’s assets and earnings. In addition, we advised the Board of Management on matters of strategic importance for the future of the Group, including its digitalisation and growth strategies, the investment strategy and the Transformation Programme. We also conferred on matters involving the full Board of Management in the latter’s absence. Moreover, we dealt with the following topics at the individual meetings in 2018:
The meeting on 14 March focused among other things on the Company and Group financial statements for 2017, the combined management report, the separate non-financial (Group) statement and the motions for resolution by the 2018 Annual General Meeting. Furthermore, we conferred and took decisions regarding the extension of a Board of Management appointment, and established the details of the assessment basis and the evaluation method used in determining the multi-year variable remuneration component for the members of the Board of Management. We also
Bernd PischetsriederChairman of the Supervisory Board

Munich Re Group Annual Report 2018
Corporate governanceReport of the Supervisory Board
10
received updates on developments at ERGO and on the Group-wide compliance management system. Representatives of the German Federal Financial Supervisory Authority (BaFin) routinely attended this meeting as guests.
The meeting on 24 April dealt with matters involving the Board of Management, specifically the evaluation of the individual Board members’ annual performance for 2017 and their multi-year performance for 2015–2017. We also dealt with a self-assessment of the members of the Supervisory Board concerning their knowledge of specific fields that are important for providing advice and supervision to Munich Re. Compared with the previous year, the Supervisory Board’s good overall level of competence has increased further. We found that the Supervisory Board as a whole possesses the appropriate diversity of qualifications, knowledge and experience to provide advice and supervision to Munich Re in a professional manner, taking account of the company-specific characteristics.
On 25 April, directly prior to the Annual General Meeting, we heard the Board of Management’s report on the present status of business performance in 2018. We also used the meeting to make last-minute preparations for the Annual General Meeting.
On 17 July, we resolved to appoint Christoph Jurecka to the Board of Management with effect from 1 January 2019 as successor to Jörg Schneider, who retired with effect from 31 December 2018. In addition, we adopted amendments to the allocation of responsibilities among the members of the Board of Management. We also resolved to commission voluntary external assurance of the separate non-financial (Group) statement for the 2018 financial year. We heard reports on current and strategic topics, as well as on the measures taken by Munich Re to guard against cyber risks. The Board of Management informed us about Munich Re’s asset management and the planned establishment of a Chief Investment Officer.
The meeting on 18 October dealt with matters of corporate governance, including the adoption of amendments to the Rules of Procedure of the Audit Committee, the annual Declaration of Conformity with the German Corporate Governance Code, as well as the outcome of the annual efficiency review. Further topics included the submission of the 2017 Group-wide remuneration report in accordance with Solvency II and the German Remuneration Regulation for Insurance Companies (VersVergV), and the update of the Munich Re Group Compensation Policy pursuant to Solvency II. The Board of Management also briefed us on Munich Re’s IoT business strategy.
On 13 December, we resolved to appoint Nicholas Gartside to the Board of Management, and to make the requisite changes to the allocation of responsibilities among the members of the Board of Management. Furthermore, we established the amount of remuneration for the Board of Management from 2019, as well as the assessment basis for variable remuneration for 2019. The new remuneration system introduced on 1 January 2018 and approved by the Annual General Meeting on 25 April 2018 has remained unchanged. In addition, we adopted amendments to the Guideline on fringe benefits, and discussed the Group’s risk strategy against the backdrop of the yearly report on Munich Re’s risk situation provided by the Group Chief Risk Officer. The Board of Management further provided a report on Group planning for the period from 2019 to 2021. The Board also presented us with the 2017/2018 Group human resources report and detailed the focal points of human resources work within the Group. Moreover, it provided information on the overall growth strategy for reinsurance and on reinsurance growth in the Asia Pacific and Africa Division.
In addition, two resolutions were adopted by written consent in lieu of a meeting. In preparation of the planned issuance of a subordinated bond, we appointed the external auditor for a review of the quarterly financial report for the third quarter of 2018. Furthermore, in view of the legal requirement to change auditors, we decided to follow the Audit Committee’s recommendation and selected Ernst & Young GmbH Wirtschaftsprüfungsgesellschaft (EY), Munich, as the (Group) auditor from the 2020 financial year.

Munich Re Group Annual Report 2018
11Corporate governanceReport of the Supervisory Board
Work of the committeesThere are six Supervisory Board committees. These are assigned certain matters for resolution, and also prepare the topics which are to be addressed and decided upon by the full Supervisory Board. At each Supervisory Board meeting, detailed information about the work of the committees was provided to the full Supervisory Board by the respective chairs of the committees.
Details of the tasks of the committees and their composition can be obtained on page 20 f. and from our website at www.munichre.com/supervisory-board.
The Personnel Committee held seven meetings in the period under review. It essentially prepared the resolutions on matters involving the Board of Management already mentioned in the report on the work of the full Supervisory Board, unless these fell under the remit of the Remuneration Committee established on 1 January 2018. As a first step, the Personnel Committee and the Remuneration Committee adopted a common set of rules to govern the cooperation between the two committees in evaluating the variable remuneration components for the members of the Board of Management. One of the key tasks of the Personnel Committee consisted in checking the fitness and propriety of two candidates to be appointed to the Board of Management, and of an existing member seeking reappointment. In addition, the Personnel Committee approved the assumption of seats on supervisory, advisory and similar boards by members of the Board of Management. It also dealt with Group-wide succession planning, especially with regard to Board-level appointments.
The Remuneration Committee met five times in 2018. Specifically, it was in charge of preparing resolutions on matters involving the Board of Management – as already mentioned above when reporting on the work of the full Supervisory Board – as far as these resolutions concerned the amount of remuneration, the establishment of the assessment basis for variable remuneration and the corresponding evaluation, as well as the sections of the Board members’ contracts relating to remuneration. In addition, it dealt with the fringe benefits for members of the Board of Management disclosed in the 2017 Group Annual Report.
At its five meetings in 2018, the Standing Committee dealt with the preparation of the respective Supervisory Board meetings and, in particular, with topics of corporate governance. On the basis of a comprehensive questionnaire, the Standing Committee carried out a survey among the members of the Supervisory Board to assess the efficiency of the Supervisory Board’s work in 2018. After analysing the survey, the Standing Committee discussed the findings and agreed on a small number of suggested improvements, which the Chairman of the Supervisory Board then presented to the full Supervisory Board. The Standing Committee determined that, overall, the reporting by the Board of Management and the work of the Supervisory Board were efficient and appropriate. Regular reports by the Chairman of the Board of Management covered changes to the shareholder structure and the status of the share buy-back programmes. In addition, the Standing Committee held various meetings where it dealt in great depth with the separate non-financial (Group) statement, which had to be produced for the first time for the 2017 financial year. On the basis of a resolution adopted by the full Supervisory Board, the Standing Committee commissioned EY to perform a limited assurance engagement on the separate non-financial (Group) statement for the 2018 financial year.
The Audit Committee held nine meetings in the period under review, and adopted one resolution by written consent in lieu of a meeting. Five of these meetings were attended by the external auditor. The Committee discussed the Company and Group financial statements, the combined management report, the auditor’s reports and the Board of Management’s proposal for the appropriation of the net retained profits for the 2017 financial year. The Committee also considered the quarterly statement for the first quarter of 2018, and conducted a detailed review of the 2018 Half-Year Financial Report and the Quarterly Report for the third quarter of 2018 in conjunction with the auditor. The Committee heard regular reports on the key Solvency II figures and discussed the

Munich Re Group Annual Report 2018
Corporate governanceReport of the Supervisory Board
12
quarterly reporting to the Supervisory Authority in these meetings. Another key task of the Committee consisted in monitoring the Group’s risk situation and risk management on an ongoing basis, and discussing its risk strategy: the Group Chief Risk Officer provided detailed verbal input at several meetings of the Committee in addition to the quarterly written reports submitted. The Audit Committee also dealt with the measures taken by Munich Re to guard against cyber attacks. The holder of the actuarial function presented the report of the actuarial function of Munich Re (Group) at two Committee meetings. Further issues discussed regularly were the internal control system and compliance topics. The Group Chief Auditor informed the members of the Committee in full about the outcome of the audits for 2017 and the audit planning for 2018. The Committee received regular updates on the current status of individual compliance issues and the progress of audits. In the absence of the Board of Management, the members of the Committee took the opportunity to confer amongst themselves or with the Group Chief Auditor, the Group Chief Compliance Officer, the Group Chief Risk Officer and the external auditor on a regular basis. In addition, the Audit Committee and the external auditor exchanged their views on selected topics on an ad-hoc basis between meetings. Furthermore, the Audit Committee closely reviewed and monitored the auditor’s independence. It regularly called for reports on the auditor’s new activities beyond the auditing of the annual financial statements and on the utilisation of the statutory limit for awarding such contracts. The auditor presented the Audit Committee with explanations of the key audit matters for the 2018 financial year. Likewise, the Audit Committee prepared a report for the full Supervisory Board on the appointment of the external auditor for the 2018 financial year, determined the main points of the audits, and set the auditor’s fees. Following a resolution by the full Supervisory Board, the Chair of the Committee commissioned KPMG Bayerische Treuhandgesellschaft Aktiengesellschaft Wirtschaftsprüfungsgesellschaft Steuerberatungsgesellschaft (KPMG), Munich, with the audit for the 2018 financial year, and also commissioned the auditor’s review of the 2018 Half-Year Financial Report and the Quarterly Report for the third quarter of 2018.
At the same time, after intensive preparation, the Audit Committee issued an invitation to tender for audit services for the 2020 financial year and beyond. Following a thorough evaluation of the tenders, the Audit Committee submitted a reasoned recommendation to the Supervisory Board for two proposals, with a preference for EY.
The Nomination Committee held six meetings in the period under review. It dealt in great depth with long-term succession planning on the Supervisory Board. In preparation of the upcoming election of ten shareholder representatives at the Annual General Meeting on 30 April 2019, the Nomination Committee drew up requirement profiles and deliberated on the re-election of Supervisory Board members and suitable new candidates to be nominated for election to the Supervisory Board. The Committee also looked for suitable successors to the Chair of the Supervisory Board and the Chair of the Audit Committee. In selecting and evaluating potential candidates, the Committee took account of the objectives set by the Supervisory Board for the composition of the Board and the set of criteria established for this purpose.
There was again no need to convene the Conference Committee in the 2018 financial year.

Munich Re Group Annual Report 2018
13Corporate governanceReport of the Supervisory Board
Supervisory Board succession planning In my role as Chairman of the Supervisory Board, I have been holding discussions with investors and proxy advisors since 2018 about the upcoming election of shareholder representatives to the Supervisory Board at the Annual General Meeting in 2019. Key topics discussed included the candidates’ independence and time availability. All the candidates nominated for election to the Supervisory Board as shareholder representatives at the next Annual General Meeting have confirmed to the full Supervisory Board that they can spend sufficient time at Munich Re on their Supervisory Board work – and, if applicable, Committee work. Among the candidates standing for election for the first time, Karl-Heinz Streibich has a high level of IT and digitalisation expertise, while Nikolaus von Bomhard possesses wide-ranging industry knowledge and an in-depth understanding of Munich Re (Group).
The Chair of the Supervisory Board is a key position and should thus be filled with an individual of exceptional qualities and skills. In order to be able to communicate closely with the Chairman of the Board of Management and to provide oversight and advice to the Company’s management, the Supervisory Board Chair needs to have a deep understanding of the core business and excellent leadership qualities. I fully agree with the Nomination Committee and the Supervisory Board that Nikolaus von Bomhard, due to his excellent expertise across the full value chain of our complex reinsurance and primary insurance business model, his universally acknowledged personal integrity for which he is held in high esteem, and his many years of experience as Chairman of the Board of Management of Munich Re, best meets the requirements of this position. In performing his role, he will promote good corporate governance especially in working together with the Chairman of the Board of Management.
Corporate governance and Declaration of ConformityThe Supervisory Board pays close attention to good corporate governance. Together with the Board of Management, we therefore published the mandatory annual Declaration of Conformity pursuant to Section 161 of the German Stock Corporation Act (AktG) in November 2018. The Company has complied and intends to continue to comply with all of the recommendations of the German Corporate Governance Code as amended on 7 February 2017. We confirmed our assessment that all 20 members of the Supervisory Board are to be regarded as independent and that they do not have any relevant conflicts of interests.
Details of this can be found in the corporate governance report on page 17 f.
Because of conflicting opinions regarding the validity of Ina Hosenfelder’s election to the Supervisory Board, her attendance at the meeting on 17 July 2018 was put to the vote. Ina Hosenfelder did not take part in the vote as it affected her directly.
Munich Re again offered the members of the Supervisory Board specific training at an internal information event in 2018. Almost all members took the opportunity to learn more about selected topics related to reinsurance and risk management.
Changes on the Board of Management Jörg Schneider retired from the Board of Management with effect from 31 December 2018. Christoph Jurecka was appointed his successor with effect from 1 January 2019, and assumed responsibility for the central divisions “Financial and Regulatory Reporting”, “Group Controlling”, “Integrated Risk Management”, “Group Taxation” and “Investor and Rating Agency Relations”.
On 13 December 2018, the Supervisory Board appointed Nicholas Gartside to the Board of Management. In his role as Chief Investment Officer, he will assume responsibility for all asset management activities at Munich Re (Group) as of 18 March 2019.

Munich Re Group Annual Report 2018
Corporate governanceReport of the Supervisory Board
14
Changes on the Supervisory BoardRon Sommer stepped down from the Supervisory Board with effect from the end of the Annual General Meeting in 2018. Kurt Bock was elected to the Supervisory Board for the remainder of Sommer’s period of office by the Annual General Meeting on 25 April 2018.
Former members of the Supervisory BoardDr. Wolfgang Röller passed away on 9 March 2018. He served as Deputy Chairman on Munich Re’s Supervisory Board from 1994 to 1999. We have a great deal to thank him for, and mourn the loss of an exceptional man.
Wolfgang Mayrhuber passed away on 1 December 2018. He was a member of the Supervisory Board from 2002 to 2016, and served on the Personnel Committee and Standing Committee during his last years of office. We owe him a great debt of thanks for his open and constructive cooperation, and mourn the loss of a highly esteemed and outstanding personality.
Further information on the general topic of corporate governance is available in the joint report of the Board of Management and Supervisory Board on page 16 ff.
Company and Group financial statements for 2018, Solvency II reporting and non-financial information Auditor KPMG duly audited the Company and Group financial statements and the combined management report as at 31 December 2018, and issued them with an unqualified auditor’s opinion. The German Public Auditor responsible for the engagement is Dr. Frank Ellenbürger. He first took charge of the audit of the Company and Group financial statements for the financial year ending 31 December 2013.
The above-mentioned reports and the Board of Management’s proposal for appropriation of the net retained profits were submitted directly to the members of the Supervisory Board. At its meeting on 5 February 2019, the Audit Committee had the opportunity to confer in detail about the preliminary year-end figures as at 31 December 2018. On 18 March 2019, it prepared the Supervisory Board’s resolution on the adoption of the Company financial statements and the approval of the Group financial statements. To this end, the Audit Committee examined in advance the Company and Group financial statements, the combined management report and the Board of Management’s proposal for appropriation of the net retained profits. It discussed these at length with the external auditor present at the meeting, and gave detailed consideration to the auditor’s reports. The Audit Committee paid particular attention to the key audit matters described in the auditor’s opinion, including audit activity. The Chair of the Audit Committee briefed the full Supervisory Board about the outcome of its consultations at the balance sheet meeting. In its March meeting, the Audit Committee discussed the preliminary key figures under Solvency II reporting – and the Solvency II ratio in particular – and reported on this in the plenary session.
The full Supervisory Board also reviewed the Company and Group financial statements and the combined management report, and the proposal of the Board of Management for appropriation of the net retained profits. The auditor’s reports were available to all members of the Supervisory Board and were discussed in detail at the balance sheet meeting of the Supervisory Board on 19 March 2019 in the presence of the external auditor. The auditor reported on the scope, the main points, and the key results of the audit, going into particular detail on the key audit matters (please refer to the auditor’s report on page 180 ff. for information) and the audit activity conducted. There were no reports of material weaknesses in the internal control system or the risk management system.

Munich Re Group Annual Report 2018
15Corporate governanceReport of the Supervisory Board
On the basis of this comprehensive examination, the Supervisory Board raised no objections concerning the outcome of the external audit. It approved the Company and Group financial statements on 19 March 2019. The financial statements were thus adopted. Having carefully weighed all relevant aspects, the Supervisory Board followed the proposal of the Board of Management for appropriation of the net retained profits.
The Standing Committee dealt with the separate non-financial (Group) statement for the 2018 financial year on 13 December 2018 and 19 March 2019. Also on 19 March 2019, the full Supervisory Board examined the (Group) statement, taking due consideration of the external auditor’s findings, and approved it.
Words of thanks to the Board of Management and employeesThe Supervisory Board wishes to thank all members of the Board of Management and staff worldwide. With their work and commitment, they have contributed to a successful result for Munich Re.
Munich, 19 March 2019
For the Supervisory Board
Bernd Pischetsrieder Chairman

Corporate governance report1
Corporate governance stands for a form of responsible company management and control geared to long-term creation of value.
The German Corporate Governance Code contains the main legal rules to be observed by listed German companies. In addition, it includes recommendations and proposals based on nationally and internationally recognised standards of good and responsible management. We apply the highest standards to our operations and activities and therefore comply with all the recommendations and proposals of the German Corporate Governance Code. By adopting international guidelines such as the UN Global Compact, the Principles for Responsible Investment and the Principles for Sustainable Insurance, we further demonstrate our commitment to corporate responsibility.
Efficient practices on the Board of Management and Supervisory Board, good collaboration between these bodies and with the Group’s staff, an organisational structure that fits the purpose of the Group, and efficient processes for conducting business are core elements of good corporate governance. They help to secure the confidence of investors, clients, employees and the general public in our corporate activities.
More information on corporate governance can be found at www.munichre.com/cg-en. There, you can also find the Statement on Corporate Governance in accordance with Sections 289f and 315d of the German Commercial Code (HGB) and the Declaration of Conformity by the Board of Management and Supervisory Board with the German Corporate Governance Code in accordance with Section 161 of the German Stock Corporation Act (AktG). The remuneration report can be found on page 29 ff. of the combined management report.
Corporate legal structure
Münchener Rückversicherungs-Gesellschaft Aktien-gesellschaft in München (Munich Reinsurance Company) has three governing bodies: the Annual General Meeting, the Board of Management and the Supervisory Board. Their functions and powers are defined by law, the Articles of Association, the Co-determination Agreement applicable to Munich Reinsurance Company, and by rules of procedure and internal guidelines. Employee co-determination on the Supervisory Board is governed by the Co-determination Agreement concluded pursuant to the German Act on the Co-Determination of Employees in Cross-Border Mergers (MgVG). There, the principle of parity co-determination on the Supervisory Board has been strengthened by taking into account staff employed in the rest of Europe.
The supervisory requirements for (re)insurance companies, especially the German Insurance Supervision Act (VAG) and the European supervisory regulations (Solvency II implementing measures) are placing additional demands on corporate governance. They include specific rules on various issues such as business organisation or the qualifications and remuneration of members of the Board of Management, Supervisory Board members and other individuals.
Annual General Meeting
The Annual General Meeting regularly reaches a resolution on the appropriation of profits and approval of the actions of the Board of Management and Supervisory Board. Besides this, the Annual General Meeting elects the shareholder representatives on the Supervisory Board and, in particular, votes on changes to the Articles of Association and on individual capital measures. Certain corporate contracts also require the approval of the Annual General Meeting to become effective.
The principle of “one share, one vote” applies at the Company’s Annual General Meeting. With the aim of making it easier for shareholders to take part and exercise their voting rights, the Company offers the possibility of postal and electronic voting as well as online participation in the Annual General Meeting.
The documents required by law for the Annual General Meeting will be available in conjunction with the agenda on the Munich Re website with effect from the day the AGM is convened. Shareholders who do not wish to attend the Annual General Meeting in person may also have their voting rights exercised at the Annual General meeting by one of the proxies nominated by Munich Reinsurance Company. These proxies will exercise the voting rights solely in accordance with the instructions they receive from the shareholders. Power of attorney and instructions may also be issued to the Company proxies via the internet. In addition, shareholders may also follow the whole Annual General Meeting on the internet and change their instructions right up to the end of the general debate – provided they have issued power of attorney to the Company proxies.
Board of Management
Pursuant to Article 16 of the Articles of Association, the Board of Management consists of at least two members; beyond this, the number of members is determined by the Supervisory Board. When appointing the Board of Management, the Supervisory Board pays due regard to diversity. In 2018, the Board of Management of Munich Reinsurance Company comprised eight members – one woman and seven men.
The Board of Management is responsible for managing the Company, in particular for setting the Company’s objectives and determining strategy. In doing so, it is obliged to safeguard Company interests and endeavour to achieve a sustainable long-term increase in the
1 In accordance with Section 3.10 of the German Corporate Governance Code.
Munich Re Group Annual Report 2018
Corporate governanceCorporate governance report
16

Supervisory Board
In compliance with Munich Reinsurance Company’s Articles of Association, the Supervisory Board has 20 members. Half are representatives of the shareholders, elected by the Annual General Meeting. The other half are elected representatives of the Group’s employees in the European Economic Area.
The Supervisory Board monitors the Board of Management and gives counsel where appropriate, but it is not authorised to take management action in place of the Board of Management. In accordance with a special rule applicable to (re)insurance companies, the Supervisory Board in particular also appoints the external auditor for the Company and Group financial statements and for the Half-Year Financial Report.
Objectives of the Supervisory Board concerning its composition and competencesIn accordance with Section 5.4.1(2) of the German Corporate Governance Code, the Supervisory Board has set itself the following objectives concerning its composition and has defined requirements regarding the competencies of its members:
Competence profileThe Supervisory Board as a whole must have the necessary knowledge, skills and experience in the markets, business processes, competition and the requirements of reinsurance, primary insurance and investment in order to perform its duties properly. Furthermore, the Board must have the overall required knowledge of risk management, accounting, financial control and auditing, asset liability management, law, regulatory supervision, compliance and taxation. The Members must collectively be familiar with the sector in which the Company operates, and have a good understanding of its business model. At least one member of the Supervisory Board must have expertise in accounting or financial reporting, and specific knowledge and experience in the application of accounting principles and standards. It should be ensured that the competence profile is met when persons are nominated to the Supervisory Board.
InternationalityAs the Group operates internationally, it should be ensured that the Supervisory Board includes an appropriate number of members with international experience.
IndependenceThe Supervisory Board should have at least sixteen independent members within the meaning of Section 5.4.2 of the German Corporate Governance Code, including at least eight shareholder representatives. Members of the Supervisory Board should have no relevant conflicts of interest.
Company’s value. It should take account of the interests of shareholders, employees, and other stakeholders of Munich Reinsurance Company. The Board of Management is responsible for effecting adequate risk management and risk control in the Company. It must ensure that statutory requirements and internal Company guidelines are observed, and works to achieve their compliance by Group companies.
Compliance
The Company’s Group Compliance and Legal Division manages the compliance activities of Munich Re through Group-wide terms of reference, monitoring their implementation by means of the compliance management system (CMS). The CMS is the methodical framework for the structured implementation of early warning, risk control, consulting and supervision functions, as well as for the monitoring of legal frameworks.
At the instigation of the Board of Management, another channel has been established to complement the external, independent ombudsman and thus strengthen compliance within Munich Re: the compliance whistleblowing portal. Staff members and third parties can use the portal to report any activity that may cause reputational damage, or suspected contraventions of the law, especially financial crime (such as corruption offences or money laundering), antitrust law, insurance supervisory law, market abuse law, data protection law, and any alleged serious contraventions of associated internal rules and regulations.
Further information about compliance and the key features of the CMS can be found at www.munichre.com/en/compliance.
Collaboration between Board of Management and Supervisory Board
The Board of Management and the Supervisory Board cooperate closely for the benefit of the Company.
The Board of Management coordinates the Company’s strategic approach with the Supervisory Board and discusses the current state of strategy implementation with it at regular intervals. The Board of Management reports regularly and as needed to the Supervisory Board about all questions relevant to the Company. Beyond this, the Board of Management reports to the Audit Committee on specific topics falling within the latter’s scope of responsibility. The Supervisory Board has defined the Board of Management’s information and reporting obligations in detail. Specific types of transaction, such as certain investments and divestments, require the Supervisory Board’s consent. The Supervisory Board’s approval is also required for sideline activities assumed by members of the Board of Management, and for important transactions involving members of the Board of Management or persons or undertakings closely associated with them.
Munich Re Group Annual Report 2018
17Corporate governanceCorporate governance report

Status of implementation of objectives and competence profile for the composition of the Supervisory BoardThe Supervisory Board believes that it meets the above-mentioned objectives for its composition and competence profile. The members of the Supervisory Board have the required knowledge, expertise and experience to properly carry out their duties in the Supervisory Board, and are collectively familiar with the sector in which the Company operates. An adequate number of Supervisory Board members have the required level of international experience. Diversity aspects are adequately taken into account in the Supervisory Board. The members have different professional and educational credentials (such as a professional background in law, economics, mathematics, natural sciences, business and insurance). The Supervisory Board members also have management experience in various sectors (such as finance and insurance, IT, chemicals, the automobile industry), and extensive experience in academia and politics. The proportion of women on the Supervisory Board at the end of the 2018 financial year was 45%, so the objective of having at least 30% of the seats on the Supervisory Board filled by women is already exceeded.
The Supervisory Board is also of the opinion that all 20 of its members are to be regarded as independent within the meaning of Section 5.4.2 of the German Corporate Governance Code. The shareholder structure was taken into account. The Supervisory Board is not aware of any business or personal relationship between a member and the Company, its governing bodies, a controlling shareholder or an entity affiliated with such a shareholder, as a result of which a major and not only temporary conflict of interest could arise. The Supervisory Board assumes that the employee representatives on the Supervisory Board elected in accordance with the Act on the Co-Determination of Employees in Cross-Border Mergers and the Co-determination Agreement are independent as a matter of principle.
Share trading by Board members
If members of the Company’s Board of Management or Supervisory Board or any persons closely associated with them undertake transactions with shares, debt instruments of Munich Reinsurance Company or with associated derivatives or other related financial instruments, these transactions must be immediately notified to the Company if the total amount of transactions carried out by the Board member or person closely associated with them totals or exceeds €5,000 within a calendar year.
Munich Reinsurance Company publishes information of this kind on its website without undue delay at www.munichre.com/en/managers-transactions.
DiversityThe composition of the Supervisory Board should pay due regard to diversity of its members – especially in terms of professional background and education, internationality, age and gender. No change has been made to the objective of having at least 30% of Supervisory Board seats filled by women at the start of the next term of office. The diversity aspect should be taken into account at an early stage when selecting potential candidates for re-election or appointment to the Supervisory Board.
Length of membership and age limitFuture nominations of candidates for election to the Supervisory Board should also take into account that, as a rule, at the time of election no candidate should already have been on the Supervisory Board for a continuous period of more than ten years. Normally, Supervisory Board members should not serve on the Board for a continuous period of more than twelve years. In addition, nominated candidates should not be older than 70 years of age.
The aforementioned objectives apply to the Supervisory Board as a whole. Shareholder and employee representatives will each contribute towards meeting these objectives.
The Supervisory Board’s Nomination Committee selects candidates for the shareholder representatives based on a defined set of criteria. Besides the objectives and competences mentioned, these criteria include a good overall understanding of the Company’s business model, sufficient time availability, and specific skills and competence. The set of criteria also includes other personal qualities of the Supervisory Board members, such as corporate and international experience, a strong commitment to corporate governance and to a sustainable corporate strategy and business policy geared to creating long-term value for shareholders, strategic and problem-solving skills, and competence in dealing with change.
Additional requirements will be defined on a case-by-case basis for specific tasks to be handled by the Supervisory Board. The European Electoral Board, which is responsible for the election of the employee representatives, applies a corresponding set of criteria. In addition, the specific rules for co-determination apply.
Munich Re Group Annual Report 2018
Corporate governanceCorporate governance report
18

Responsibilities and seats held by the Board of Management
Board of Management Responsibilities Seats1
Dr. oec. publ. Joachim Wenning Chairman of the Board of ManagementChairman of the – Group Committee– Strategy Committee– Group Investment Committee
Group HoldingsGroup Strategy and M&AGroup CommunicationsGroup AuditEconomics, Sustainability & Public Affairs3
Group Human ResourcesGroup Executive AffairsGroup Compliance and Legal (since 1 January 2019)
ERGO Group AG, Düsseldorf2 (Chair)
Dr. rer. pol. Thomas Blunck Life and Health Capital PartnersDigital PartnersReinsurance Investments
Munich Re Digital Partners Ltd.,United Kingdom2 (Chair)
Dr. jur. Doris HöpkeLabour Relations Director
Special and Financial Risks (until 31 July 2018)Europe and Latin America (since 1 August 2018)Human Resources
New Reinsurance Company Ltd., Switzerland2 (President)
Dr. rer. nat. Torsten JeworrekChairman of the – Reinsurance Committee– Global Underwriting and Risk Committee– Board Committee IT Investments
Reinsurance DevelopmentCorporate UnderwritingClaimsAccounting, Controlling andCentral Reserving for ReinsuranceInformation Technology
ERGO Digital Ventures AG, Düsseldorf2
ERGO International AG, Düsseldorf2
Hermann Pohlchristoph Germany, Asia Pacific and Africa (until 31 July 2018)Asia Pacific and Africa (since 1 August 2018)Central ProcurementServices
ERGO International AG, Düsseldorf2
Dr. rer. pol. Markus Rieß Primary insurance/ERGOThird-party asset management
ERGO Deutschland AG, Düsseldorf2 (Chair)ERGO Digital Ventures AG, Düsseldorf2 (Chair)ERGO International AG, Düsseldorf2 (Chair)MEAG MUNICH ERGO Kapitalanlage-gesellschaft mbH, Munich2 (Chair)
Dr. rer. pol. Peter Röder Global Clients and North AmericaEurope and Latin America (until 31 July 2018)
EXTREMUS Versicherungs-AG, CologneMunich Re America Corporation, USA2
(Chair)Munich Reinsurance America Inc., USA2
(Chair)
Dr. jur. Jörg Schneider (until 31 December 2018)Chief Financial OfficerChairman of the Group Risk Committee
Successor from 1 January 2019:Dr. rer. nat. Christoph Jurecka
Financial and Regulatory ReportingGroup ControllingIntegrated Risk ManagementGroup Compliance (until 31 October 2018)Group Legal (until 31 October 2018)Group Compliance and Legal (1 November 2018 to 31 December 2018)Group TaxationInvestor and Rating Agency Relations
MEAG MUNICH ERGO Kapitalanlage-gesellschaft mbH, Munich2
1 As at 31 December 2018; seats held on supervisory boards of German companies and memberships of comparable bodies of German and foreign business enterprises.2 Own Group company within the meaning of Section 18 of the German Stock Corporation Act (AktG).3 Including responsibility for environmental, social and governance (ESG) issues.
Munich Re Group Annual Report 2018
19Corporate governanceCorporate governance report

Dr. Ing. E. h. Dipl. Ing. Bernd Pischetsrieder Chairman Member since 17 April 2002, last re-elected 30 April 2014
Standing CommitteePersonnel CommitteeAudit CommitteeNomination CommitteeConference CommitteeRemuneration Committee (since 1 January 2018)
Daimler AG, Stuttgart4
Tetra Laval Group, Switzerland
Marco Nörenberg Deputy ChairmanEmployee of ERGO Group AG Member since 22 April 2009, last re-elected 30 April 2014
Standing CommitteeConference Committee
ERGO Group AG, Düsseldorf3
Prof. Dr. oec. Dr. iur. Dr. rer. pol. h.c. Ann-Kristin Achleitner Scientific Co-Director of the Center for Entrepreneurial and Financial Studies (CEFS) at the Technical University of Munich Member since 3 January 2013, last re-elected 30 April 2014
Audit CommitteeNomination CommitteeRemuneration Committee (since 1 January 2018)
Deutsche Börse AG, Frankfurt4 (until 8 May 2019)Linde AG, Munich4,7 (until conclusion of the envisaged squeeze-out of the company) Linde plc, Ireland4,7
Engie S.A. (formerly GDF SUEZ S.A.), France4
Dr. rer. pol. Kurt Wilhelm BockChairman of the Board of Management of BASF SE(until 4 May 2018)Member of the Supervisory Board of Munich Reinsurance CompanyMember since 25 April 2018
Fresenius Management SE, Bad HomburgBayerische Motorenwerke AG, Munich4
Clement B. BoothMember of the Board of Directors of Hyperion Insurance Group, United KingdomMember since 27 April 2016
Euroassekuranz Versicherungsmakler AG, Regensburg (Chair)Hyperion Insurance Group Ltd., United Kingdom
Frank FassinRegional Section Head Financial Services, ver.di North Rhine-Westphalia Member since 22 April 2009, last re-elected 30 April 2014
ERGO Group AG, Düsseldorf3
Provinzial NordWest Holding AG, Münster
Dr. jur. Benita Ferrero-WaldnerPartner in the law firm of Cremades & Calvo Sotelo, Spain Member since 12 February 2010, last re-elected 30 April 2014
Christian FuhrmannHead of Divisional Unit, Munich Reinsurance Company Member since 22 April 2009, last re-elected 30 April 2014
Audit Committee
Prof. Dr. rer. nat. Dr. h.c. Ursula GatherRector of TU Dortmund University Member since 30 April 2014
thyssenkrupp AG, Essen4
Supervisory Board1 Membership of committees Seats2
Supervisory Board and seats held by members of the Supervisory Board
See table on next page for footnotes
Munich Re Group Annual Report 2018
Corporate governanceCorporate governance report
20

Supervisory Board1 Membership of committees Seats2
1 As at 31 December 2018.2 Seats held on supervisory boards of German companies and memberships of comparable bodies of German and foreign business enterprises.3 Own Group company within the meaning of Section 18 of the German Stock Corporation Act (AktG).4 Listed on the stock exchange.5 As at the date of departure.6 Membership of a non-statutory supervisory board.7 Belong to the same corporate group (Linde group).
Gerd HäuslerMember of the Supervisory Board of Auto1 Group SE, Munich Member since 30 April 2014
Standing Committee Auto1 Group S.E., Munich
Dr. iur. Anne HorstmannEmployee of ERGO Group AG Member since 30 April 2014
Audit Committee ERGO Group AG, Düsseldorf3
Ina HosenfelderEmployee of ERGO Group AGMember since 30 April 2014
Renata Jungo BrünggerMember of the Board of Management of Daimler AG Member since 3 January 2017
Prof. Dr. rer. nat. Dr. Ing. E. h. Henning Kagermann Chair of the Board of Trustees of acatech – German Academy of Science and Engineering Member since 22 July 1999, last re-elected 30 April 2014
Standing CommitteePersonnel CommitteeAudit CommitteeNomination CommitteeConference Committee
Deutsche Post AG, Bonn4
KUKA AG, Augsburg4
Beate MenschTrades Union Secretary, ver.di, Hessen Member since 30 April 2014
Ulrich PlottkeEmployee of ERGO Group AG Member since 30 April 2014
ERGO Group AG, Düsseldorf3
Andrés Ruiz FegerEmployee of Munich Re, Sucursal en España, Spain Member since 22 April 2009, last re-elected 30 April 2014
Standing Committee
Gabriele Sinz-ToporzysekEmployee of ERGO Beratung und Vertrieb AG Member since 30 April 2014
ERGO Beratung und Vertrieb AG, Düsseldorf3
Dr. phil. Ron SommerChairman of the Supervisory Board of MTS OJSC, Russia Member from 5 November 1998 until 25 April 2018
PrJSC MTS, Ukraine (Chair)Sistema PJSFC, Russia4,5
Tata Consultancy Services Ltd., India4,5
Angelika WirtzEmployee of Munich Reinsurance Company Member since 30 April 2014
Personnel CommitteeConference CommitteeRemuneration Committee (since 1 January 2018)
Dr. iur. Maximilian ZimmererMember of the Supervisory Board of Munich Reinsurance CompanyMember since 4 July 2017
Investmentaktiengesellschaft für langfristige Investoren TGV, Bonn (Chair)Möller & Förster GmbH & Co. KG, Hamburg (Chair of Advisory Council)6
Munich Re Group Annual Report 2018
21Corporate governanceCorporate governance report


2
23
Com
bine
d m
anag
emen
t rep
ort
Combined management report

Combined management reportContent
24
This report combines the management reports of Munich Reinsurance Company and Munich Re (Group).
Group 025Group structure 025Our brands 028 Remuneration report 029
Macroeconomic and industry environment 047Capital markets 047Insurance industry 047
Important tools of corporate management 048Munich Re’s management philosophy – based on value creation 048The Group’s corporate management tools 048Other performance indicators 049
Business performance 050Board of Management’s overall assessment of the businessperformance and situation of the Group 050Business performance of the Group and overview of investment performance 050Reinsurance – Life and health 054Reinsurance – Property-casualty 055ERGO Life and Health Germany 058 ERGO Property-casualty Germany 060ERGO International 061
Financial position 062Analysis of our capital structure 062Technical provisions 062Restraints on disposal 062 Capital position 063Information in accordance with Sections 315a(1) and 289a(1) of the German Commercial Code (HGB) and explanatory report of the Board of Management 063Analysis of the consolidated cash flow statement 065
Risk report 066Risk governance and risk management system 066Significant risks 066Solvency ratio under Solvency II 073Other risks 073Summary 074
Opportunities report 075Business environment 075Innovation and digitalisation 075Social and economic trends 075Climate change and natural catastrophes 076Expanding the limits of insurability 076
Prospects 077Comparison of the prospects for 2018 with the result achieved 077Outlook for 2019 079
Munich Reinsurance Company (Information reported on the basis of German accountancy rules) 081Market environment and major factors of influence 081Business performance 081Financial position 085Statement of Corporate Governance for the 2018 financial year pursuant to Section 289f and Section 315d of the German Commercial Code (HGB) 086Further information 087

25Combined management reportGroup
Munich Re Group Annual Report 2018
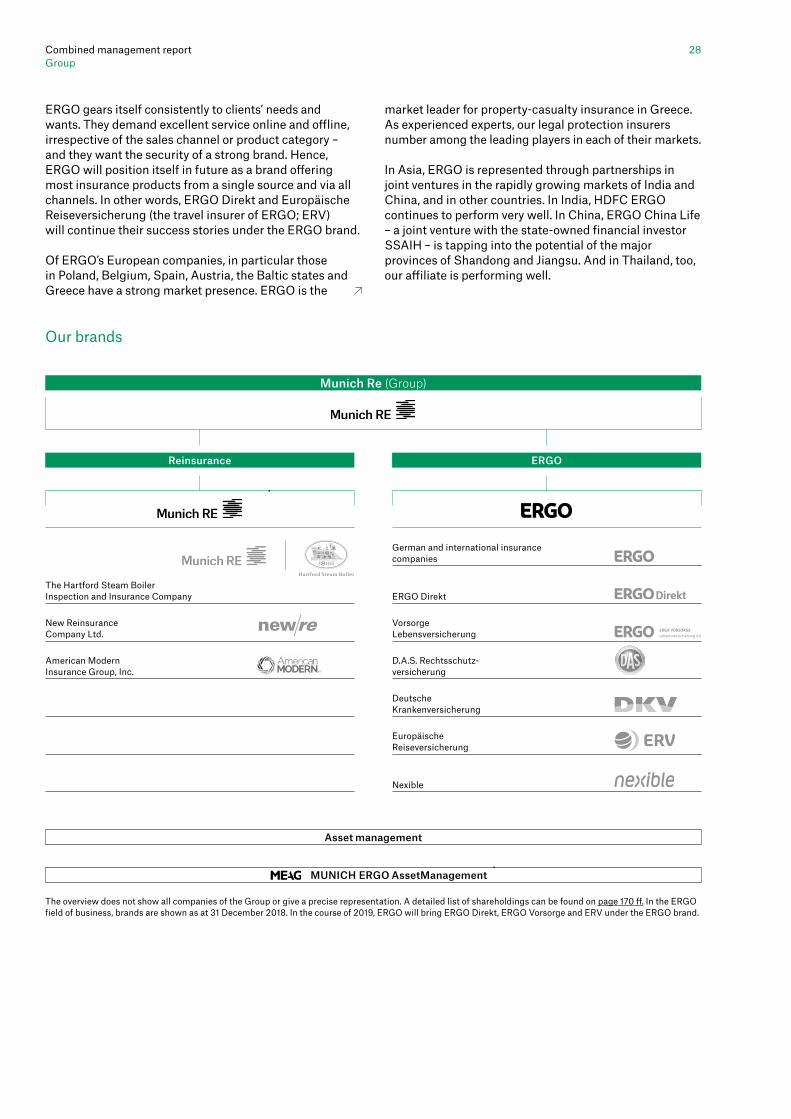
GroupMunich Re is one of the world’s leading risk carriers and provides both insurance and reinsurance under one roof. This enables the Group to cover large stretches of the value chain in the risk market. Almost all reinsurance units operate under the uniform brand of Munich Re. ERGO Group AG (ERGO) is active in nearly all lines of life, health and property-casualty insurance. Munich Re’s investments worldwide are managed by MEAG, which also offers its expertise to private and institutional investors outside the Group. For up-to-date information about Munich Re, visit www.munichre.com.
A core guiding principle for Munich Re is acting in a far-sighted and responsible manner in the interests of both the Group and society. We have thus based our Group-wide corporate responsibility strategy on the shared-value approach. This means that, in our business operations, we bring together economic and social progress to counter the most significant global challenges. For example, we focus on mitigating the consequences of climate change and enhancing general risk awareness by initiating a wide range of prevention and adaptation measures to protect people and make risk zones and regions more resilient.
We have the appropriate expertise and a broad international network of recognised partners to develop holistic and increasingly digital solutions that cover diverse and constantly changing risks. Our voluntary commitments, such as the ten principles of the United Nations Global Compact (UNGC), the Principles for Responsible Investment (PRI), and the Principles for Sustainable Insurance (PSI) are the foundations of our corporate responsibility approach. In our insurance business and investment management, we proactively embrace environmental, social and governance (ESG) factors. We have built up a Group-wide environmental management system, and our operations have been carbon-neutral since 2015. With our social involvement, we play our part as a responsible corporate citizen, focusing on projects and cooperations related to our core business. Further information on our endeavours is available from our corporate responsibility portal at www.munichre.com/cr-en.
In our estimation, the talent and performance of our staff are the keystones to Munich Re’s long-term success. Our international and diversity-focused human resources work sets great store by a corporate and leadership culture which promotes motivation and innovation in our highly qualified staff members. More information can be obtained at www.munichre.com/employees.
As at 31 December 2018, our Group employed 41,410 (42,410) staff members worldwide, 29.8% (28.6%) of whom worked in reinsurance and 70.2% (71.4%) at ERGO.
The non-financial reporting requirements of the European Union’s Corporate Social Responsibility (CSR) Directive have been transposed into the German Commercial Code (HGB). The following have been identified as aspects to be reported for Munich Re and Munich Reinsurance Company within the meaning of the legal requirements:
− Munich Re as an employer of choice, and diversity as a strategic success factor − Anti-corruption and bribery − Data protection − Corporate responsibility (CR) in insurance and investments
The CR in insurance and CR in investment sections include information on the statutory aspects of environmental protection, social factors and human rights. The combined non-financial statement prepared in accordance with sections 289b(3) and 315b(3) of the German Commercial Code (HGB) can be found at www.munichre.com/cnfs in the information on corporate governance.
Group structure
The reinsurance companies of the Group operate globally and in virtually all classes of business. We offer a full range of products, from traditional reinsurance to innovative solutions for risk assumption. Our companies conduct their business from their respective headquarters and via a large number of branches, subsidiaries and affiliated companies. The reinsurance group also includes specialty primary insurers, whose business requires special competence in finding appropriate solutions. These primary insurers have the words “Risk Solutions” added to their logo.
Segmentation
Life and health reinsurance
Property-casualtyreinsurance
ERGO Life and Health Germany
ERGO Property-casualty Germany
ERGO International
Munich Re

Combined management reportGroup
26
Besides assuming underwriting risks, we support our clients in developing new life insurance products. Moreover, we offer clients a wide range of increasingly digital services, from medical expertise to automated risk assessment and claims handling solutions.
In addition, we continuously expand our tailor-made structured concepts for clients seeking to optimise their capitalisation, liquidity, or key performance indicators.
Demand for reinsurance is also growing with regard to the capital market risks often embedded in savings products. We provide our clients with comprehensive advice on product design while offering hedging for embedded options and guarantees linked to the capital markets. Our own exposure is transferred back to the capital markets.
In order to ensure proximity to our clients, we are represented in many markets with local subsidiaries and branches. We write the main portion of our business via our Canadian branch and our subsidiary in the USA. In Europe, we have operations in Germany, the United Kingdom, Spain and Italy. At the same time, we have a strong local presence in Australia and South Africa, and in all important growth markets in Latin America and Asia. Since 2017, we also have a branch in India. Asian business is centrally managed by a dedicated branch in Singapore, which underlines the strategic importance of this region for life and health reinsurance.
The property-casualty reinsurance divisionsGlobal Clients and North America handles our accounts with major international insurance groups, globally operating Lloyd’s syndicates and Bermuda companies. It also pools our know-how in the North American market and is responsible for our property-casualty subsidiaries in this region and for international special-lines business such as marine, aviation and space, as well as agricultural risks.
The three major US-based subsidiaries are Munich Reinsurance America, Inc. (Munich Re, US), The Hartford Steam Boiler Inspection and Insurance Company (HSB), and American Modern Insurance Group, Inc. (American Modern). Munich Re, US writes property-casualty reinsurance business and niche primary insurance business. The primary insurers HSB and American Modern specialise in products for which client proximity and – like in reinsurance – risk understanding are paramount. The Risk Solutions segment within the division is also supported by the Corporate Insurance Partner unit, which is dedicated to industrial clients, and by Munich Re Specialty Group, a leading provider of marine insurance and insurance solutions for the energy industry.
In ERGO, we combine all of Munich Re’s primary insurance activities. Some 68% of gross premiums written by ERGO derive from Germany, and 32% from international business – mainly from central and eastern European countries. ERGO has also extended its activities to Asian markets such as India, China, Singapore and Thailand.
Munich Reinsurance Company and ERGO Group AG are under unified control within the meaning of the German Stock Corporation Act (AktG). The relevant statutory regulations, control agreements and Group directives govern the distribution of responsibilities and competences for key decisions between Group management and ERGO. Control and profit-transfer agreements are in place with many Group companies, especially between ERGO Group AG and its subsidiaries.
Reinsurance
In reinsurance, we operate in life, health and property-casualty business. Under reinsurance, we also include specialised primary insurance activities that are handled by the reinsurance organisation and business from managing general agencies (MGAs). Munich Re does business with over 4,000 corporate clients from more than 160 countries.
As reinsurers, we write our business in direct collaboration with primary insurers, but also via brokers and within the framework of strategic partnerships. In addition to traditional reinsurance business, we participate in insurance pools, public-private partnerships, business in specialist niche segments, and also as a primary insurer. Through our operating field Risk Solutions, we offer our clients a wide range of specialised products, customised insurance solutions and services, which we manage from within our reinsurance organisation. Our clients thus have direct access to the expertise, innovative strength and capacity of a leading global risk carrier. Thanks to our capital management know-how, we are a sought-after partner for products geared to our clients’ balance-sheet, solvency and rating-capital requirements, as well as their risk models.
Focus of life and health reinsurance operationsOur international life and health reinsurance business is written in the Life and Health division. This is split into three geographical regions and one international unit that develops specialised solutions for capital market risks. The focus of the division’s business activities is on traditional reinsurance solutions that concentrate on the transfer of mortality risk. Moreover, we have been increasingly active in the market for living benefits products. These include products such as occupational disability, long-term care, and critical illness, which have seen increased demand. We also offer capacity for longevity risks. Until now, we have concentrated our efforts in this field on the United Kingdom, but are also closely monitoring other markets.

27Combined management reportGroup
Munich Re Group Annual Report 2018
International AG manages the ERGO Group’s international business. The third pillar, ERGO Digital Ventures AG, is responsible for all of the ERGO Group’s digital and direct activities. Since the beginning of 2019, a new IT company to strategically manage international IT activities has been in operation; it is at the same level as ERGO Germany, ERGO International and ERGO Digital Ventures. The new company’s name is ERGO Technology & Services Management AG.
Via ERGO, we offer products in all the main classes of insurance: life insurance, health insurance, and in nearly all lines of property-casualty insurance, as well as travel insurance and legal protection insurance. With these products – in combination with the provision of assistance, other services and individual consultancy – we cover the needs of private and corporate clients. ERGO serves over 35 million (mainly private) clients in more than 30 countries, with the focus on Europe and Asia. The latest information on ERGO can be found at www.ergo-group.com.
With ERGO Versicherung AG, our primary insurance arm is one of Germany’s largest providers of property and legal protection insurance. As a specialist in capital-market-oriented insurance, ERGO Vorsorge Lebensversicherung AG is shaping change in the area of private provision and biometric risk products. ERGO Lebensversicherung AG and Victoria Lebensversicherung AG are responsible for running off our traditional life insurance portfolio. DKV Deutsche Krankenversicherung AG is a leading provider and specialist in the healthcare market, catering for both privately and statutorily insured individuals with its broad range of supplementary covers. The specialist travel insurer ERV is a market leader internationally as well as in Germany.
In Germany, ERGO’s tied agents (agency sales) and ERGO Pro (structured sales force) are bundled under one roof in the sales company ERGO Beratung und Vertrieb AG. The agency sales force focuses on all-round consultancy, cementing the loyalty of portfolio clients, and developing new clients; ERGO Pro is geared to acquiring new business partners and clients. Both have made good progress in 2018 – particularly with regard to digitalisation. Today’s clients are the target, and are presented with the same range of products through all channels – online and offline. A standardised consultancy approach also ensures consistently high-quality advice and service.
Under the aegis of ERGO Digital Ventures AG, ERGO Direkt Versicherungen is the online centre of competence with responsibility for direct business and provides the expertise in digital marketing that is becoming increasingly important across the market. In Europe and Asia, ERGO is represented by life and property insurers and specialised travel and legal protection insurers.
Our Europe and Latin America Division is responsible for property-casualty business with our clients from Europe, Latin America and the Caribbean. Business Units – for example, in London, Madrid, Paris and Milan – afford us market proximity and regional competence. In the South American markets, our Brazilian subsidiary Munich Re do Brasil Resseguradora S.A. and our liaison office in Bogotá help to ensure client proximity. The division also includes the divisional unit Financial Risks. Great Lakes Insurance SE, which has its headquarters in Munich and a large branch office in London, is also assigned to this division. In future, we will pool a significant share of our Group-wide business activities in the United Kingdom in these units. In consultation with the relevant supervisory authorities, we have prepared for the various scenarios and consequences of the United Kingdom leaving the European Union and will be able to continue with our business operations in any of these cases. The necessary preparatory work and measures have been initiated.
The Asia Pacific and Africa Division conducts property-casualty business with our clients in Africa, Asia, Australia, New Zealand and the Pacific Islands. Branches in Mumbai, Beijing, Seoul, Singapore, Sydney and Tokyo allow us to take full advantage of the business opportunities in the rapidly growing Asia-Pacific insurance market. In the African market, we are represented by our subsidiary Munich Reinsurance Company of Africa Ltd., headquartered in Johannesburg. These branches and other liaison offices guarantee our competitiveness in these key growth markets.
The Special and Financial Risks Division (SFR) was dissolved with effect from 1 August 2018. Globally operating SFR units were assigned to the Global Clients and North America Division, whilst units whose business focus is on Europe were allocated to the Europe and Latin America Division. At the same time, responsibility for reinsurance business in Germany was shifted from the Germany, Asia Pacific and Africa Division to the Europe and Latin America Division, which shares the same regulatory environment and has similar business models. The purpose of the reorganisation was to leverage synergies in the best possible way and also to streamline structures and processes. The business models of all units concerned remained unchanged.
ERGO
Munich Re’s second pillar is primary insurance business.
German, international, and direct and digital business are bundled in three separate units – ERGO Deutschland AG, ERGO International AG, and ERGO Digital Ventures AG – under the umbrella of ERGO Group AG. Traditional German business is concentrated in ERGO Deutschland AG. ERGO
Combined management reportGroup
28
market leader for property-casualty insurance in Greece. As experienced experts, our legal protection insurers number among the leading players in each of their markets.
In Asia, ERGO is represented through partnerships in joint ventures in the rapidly growing markets of India and China, and in other countries. In India, HDFC ERGO continues to perform very well. In China, ERGO China Life – a joint venture with the state-owned financial investor SSAIH – is tapping into the potential of the major provinces of Shandong and Jiangsu. And in Thailand, too, our affiliate is performing well.
ERGO gears itself consistently to clients’ needs and wants. They demand excellent service online and offline, irrespective of the sales channel or product category – and they want the security of a strong brand. Hence, ERGO will position itself in future as a brand offering most insurance products from a single source and via all channels. In other words, ERGO Direkt and Europäische Reiseversicherung (the travel insurer of ERGO; ERV) will continue their success stories under the ERGO brand.
Of ERGO’s European companies, in particular those in Poland, Belgium, Spain, Austria, the Baltic states and Greece have a strong market presence. ERGO is the
Munich Re (Group)
Reinsurance ERGO
ERGO Direkt
German and international insurance companies
New Reinsurance Company Ltd.
The Hartford Steam Boiler Inspection and Insurance Company
American Modern Insurance Group, Inc.
Nexible
Asset management
MUNICH ERGO AssetManagement
VorsorgeLebensversicherung
D.A.S. Rechtsschutz-versicherung
Deutsche Krankenversicherung
EuropäischeReiseversicherung
Our brands
The overview does not show all companies of the Group or give a precise representation. A detailed list of shareholdings can be found on page 170 ff. In the ERGO field of business, brands are shown as at 31 December 2018. In the course of 2019, ERGO will bring ERGO Direkt, ERGO Vorsorge and ERV under the ERGO brand.

29Combined management reportGroup
Munich Re Group Annual Report 2018
Remuneration report
The remuneration report describes the structure of the remuneration system for the Board of Management and Supervisory Board in the past financial year, and contains detailed information on the individual remuneration of the members of the Board of Management and Supervisory Board.
Remuneration of the members of the Board of Management in 2018The full Supervisory Board decides on the remuneration system for the Board of Management, and reviews it regularly. Since its formation on 1 January 2018, the Remuneration Committee has been responsible for preparing resolutions on remuneration matters for the full Supervisory Board. The Remuneration Committee is composed of the Chairman of the Supervisory Board and one representative each of the shareholders and employees. Following the 2019 Supervisory Board election, the Committee is to be set up in such a way that the two shareholder representatives may not be members of the Supervisory Board for more than ten years. This meets a key demand of our shareholders.
As a result of the establishment of the Remuneration Committee, responsibility for all remuneration matters concerning members of the Board of Management has been transferred from the Personnel Committee to the Remuneration Committee. All other duties of the Personnel Committee, such as the appointment and dismissal of Board members, the conclusion of contracts or the assessment of the performance of the Board of Management, remain unaffected.
The new remuneration system for the Board of Management, which was introduced in 2018, was voted on by the Annual General Meeting on 25 April 2018 and approved by the majority. It meets the relevant company and supervisory law requirements, including those of the German Corporate Governance Code.
Remuneration comprises fixed (non-performance-related) and variable (performance-related) components and a company pension scheme. Details are included in the following table:
1 For the variable remuneration, the share shown presupposes 100% performance evaluation.2 In light of the fact that the peer group is very small – with just seven companies (main competitors) – and comprises both primary and reinsurance companies, there are no
further performance hurdles or thresholds. Moreover, to ensure sound and effective risk management, members of the Board of Management should not be encouraged to take excessive risks in an endeavour to achieve higher bonuses. The bonus amount must adequately reflect the performance of Munich Re shares compared with that of the peer group.
3 Target overall direct remuneration comprises basic remuneration plus variable remuneration based on 100% performance evaluation.
Structure of the remuneration system for the members of the Board of Management
Assessment basis/ Component Share1 Parameters Corridor Performance evaluation
Basic remuneration 50% Function, responsibility, Fixedplus remuneration in kind/ Length of service fringe benefits on Board
Variable remuneration 50% Corporate performance, Result of divisional unit, Personal performance
30% annual bonus IFRS consolidated result Linear scaling Achievement of Evaluation of (for 100 % performance evaluation) 0 – 200% annual objective overall performance: (fully achieved Bonus scheme = 100 %) Adjustment ofspanning achievement figuresone calendar year by the Supervisory Board, taking into 70% multi-year bonus Total shareholder return Linear scaling2 Performance of account(for 100 % performance evaluation) (TSR) of Munich Re 0 – 200% Munich Re – individual and shares compared with a shares compared collective management Bonus scheme defined peer group 0% = lowest with peer group performancespanning TSR value in – financial situation, five calendar years (Peer group: Allianz, AXA, the peer group performance and Generali, Hannover Re, comparison future prospects of the SCOR, Swiss Re, Zurich Company Insurance Group) 200% = highest TSR value in Loading/reduction of the peer group up to 20 percentage comparison points
Pension
Defined contribution plan Target overall direct Pension > Retirement remuneration3 contribution > Insured event > Premature termination

30Combined management reportGroup
Munich Re Group Annual Report 2018
Both indicators can be influenced by the Board of Management.
Munich Re’s business strategy is geared to profitable growth and successful positioning among our competitors. As an established result aggregate and relevant key figure for the capital market, the IFRS consolidated result takes account of high and stable earnings power in the annual variable remuneration component. The target for the IFRS consolidated result is based on annual planning figures, which in turn reflect Munich Re’s business strategy.
Based on its long-term strategic orientation and economic management of the Group, Munich Re is convinced of its ability to sustainably create value for its shareholders in the form of TSR. TSR takes account of dividend payments as well as share price performance. A multi-year component based on an increase in TSR in comparison with our peer group makes up the largest portion of variable remuneration for the Board of Management. From Munich Re’s point of view, the relative TSR is well suited for bringing in line the interests of shareholders and of the members of the Board of Management. As TSR is measured over a period of several years, it reflects Munich Re’s sustainable and long-term performance not only in absolute terms, but also in relative terms. After all, above-average TSR development in comparison with the peer group is not conceivable in the long term without simultaneously generating good results and creating value for our shareholders. Surpassing the performance of our peer group can be in the interests of shareholders – even in a weak market environment.
As soon as the information on the achievement of objectives is available, as part of the overall performance evaluation the Supervisory Board can take into consideration both in the annual and multi-year bonus the performance of the individual members of the Board of Management and the Board of Management as a whole, along with Munich Re’s financial situation, performance and future prospects. This is done by means of a loading or reduction of up to 20 percentage points on the relevant objective achieved.
In evaluating overall performance, in particular financial and non-financial criteria for the individual member’s performance and the performance of the respective divisional unit/division and the field of business need to be taken into consideration. Other aspects, such as those relating to periods prior to the appraisal period in question, may also be taken into account. For this purpose, the Supervisory Board has compiled a set of criteria with the following examples of bonus-malus aspects:
The equal shares of basic remuneration and variable remuneration provide for a balanced composition of overall remuneration as stipulated in the Solvency II regulations. In accordance with Solvency II, fixed and variable remuneration components must be in balance, so that the fixed component represents a sufficiently high proportion of the total remuneration and enables the undertaking to apply a fully flexible bonus policy, including the possibility of paying no variable remuneration at all. There should be no incentive for members of the Board of Management to engage in excessive risk-taking in order to achieve higher bonuses.
Fixed remunerationFixed remuneration comprises basic remuneration plus remuneration in kind and fringe benefits (such as company cars and insurance policies). The salary tax on the remuneration in kind and fringe benefits is borne by Munich Re.
Variable remunerationAssessment bases and link to corporate strategyVariable remuneration comprises an annual and a multi-year component, both of which are related to the future.
The exact target for the IFRS consolidated result used for the annual bonus, and the respective figures for a 0% and 200% achievement of objectives (linear scaling) are communicated externally. The target cannot be adjusted retroactively. After the assessment period has ended, the IFRS consolidated result achieved and the corresponding achievement of objectives are also disclosed.
As regards the total shareholder return (TSR) of Munich Re’s shares used for the multi-year bonus, which is measured in relative terms in comparison with the peer group, the specific values for assessing the achievement of objectives will not be available until the end of the scheme. The lowest TSR figure in the peer group comparison is taken as 0% on the linear scaling, and the highest figure as 200%. After assessing the achievement of objectives, this too will be communicated together with the comparable values for the peer group. This ensures comprehensive transparency regarding the financial objectives.
As only one financial indicator each is used in the annual and multi-year bonus, the variable remuneration component is easier to understand. The IFRS consolidated result and TSR on Munich Re’s shares in comparison with the peer group are two ambitious and exacting indicators promoting long-term corporate strategy.

31Combined management reportGroup
Munich Re Group Annual Report 2018
€1,800m = 0% achievement of objective€2,500m = 100% achievement of objective€3,200m = 200% achievement of objective
Targets/Achievement of objective for the multi-year bonusThe objective of the multi-year bonus is the sustainable performance of Munich Re’s shares in terms of TSR in comparison with the peer group. The companies in the peer group were selected based on comparable business activities and size. Furthermore, they must be listed on the stock exchange and subject to similar accounting standards as Munich Re, which is why the peer group only includes European primary insurance and reinsurance companies. The peer group comprises Allianz, AXA, Generali, Hannover Re, SCOR, Swiss Re and Zurich Insurance Group. It is the same peer group as for the analysts’ conference.
The multi-year bonus spans five calendar years. In the first calendar year, the initial TSR is established, and at the end of the scheme, the end TSR is computed and compared in order to determine achievement of the objective. The calculations are based on reporting date figures.
The Supervisory Board set a target corridor of 0–200% with the following linear scaling:
Lowest TSRin peer group = 0% achievement of objectiveHighest TSRin peer group = 200% achievement of objective
Because the specific figures for assessing the achievement of objectives will not be available until the end of the scheme, they will be published alongside the target assessment.
DeferralThe run-time of the flexible and deferred multi-year bonus takes account of the nature and time horizon of the Company’s business activities. The TSR in the multi-year
Transparency is provided with regard to whether and for what reason loadings or reductions were applied and what they amounted to.
The evaluation of overall performance can also take into account factors that influence business development but are not reflected in the IFRS consolidated result and TSR. Therefore, in light of the aim of keeping the remuneration system simple and transparent, no further financial assessment bases are needed.
Targets/Achievement of objective for the annual bonusThe aim of the annual bonus is to achieve a high IFRS consolidated result. The chosen targets are challenging for the members of the Board of Management given the prevailing low-interest-rate policies and fierce competition in the reinsurance markets.
Targets for 2018A target of €2,300m was set for 2018, with the following linear scaling for the 0–200% target corridor:
€1,600m = 0% achievement of objective€2,300m = 100% achievement of objective€3,000m = 200% achievement of objective
Achievement of objective in 2018At its meeting in March 2019, the Supervisory Board will decide about the achievement of objectives in 2018 on the basis of the IFRS consolidated result and taking into account any loadings or reductions as part of the overall performance evaluation. As the editorial deadline for the Annual Report precedes the Supervisory Board meeting, this information could not be included in the remuneration report. However, it will be made available at www.munichre.com/board-of-management/remuneration on 20 March 2019.
Targets for 2019A target of €2,500m was set for 2019, with the following linear scaling for the 0–200% target corridor:
1 Further key aspects may also be taken into consideration.
Individual management performance – Result of division/divisional unit, contribution to overall performance– Personal performance (qualitative and/or quantitative)– ESG (environmental, social and governance) criteria– Employee satisfaction– Consideration of special market circumstances or unexpected developments– Implementation of strategy, improvements in organisation and processes, innovation– Conduct (leadership, role model function, adherence to guidelines/compliance
requirements, cooperation with colleagues and Supervisory Board)
Collective management performance – Result of field of business (reinsurance and/or primary insurance)– ESG (environmental, social and governance) criteria– Employee satisfaction– Reaction to special market circumstances and unforeseeable developments
Financial situation, performance and future prospects of the Company
– Financial situation of the Company– Short-term and long-term profit prospects– Market environment (interest rates, situation in the industry, etc.)
Annual and multi-year bonus: Criteria for the evaluation of overall performance1

32Combined management reportGroup
Munich Re Group Annual Report 2018
The contractual indemnity provision protects the Company; it is designed to safeguard the Company’s assets in the event of a serious breach of duty. In the Company’s view, an additional clawback provision for bonuses already paid is therefore not required.
Upper remuneration limitsThe respective 0–200% target corridor defines an upper limit for variable remuneration paid to members of the Board of Management. Any higher achievement of objectives is capped at 200%; in this case, there is therefore also no loading as a result of the overall performance evaluation. In addition, there are caps on the maximum amounts of total remuneration and its variable components in accordance with the German Corporate Governance Code.
Share ownership of the members of the Board of ManagementThe current remuneration system does not require members of the Board of Management to invest in Company shares.
The TSR used in the multi-year bonus reflects the performance of Munich Re’s shares, which ensures that the interests of the Board of Management are in line with those of our shareholders. From the Company’s point of view, the continually increasing requirements in terms of insider trading law regarding the purchase and sale of shares and the rising number of inquiries – also in connection with share-based remuneration components – are compelling reasons to refrain from remuneration based on the obligation to purchase shares. The reputational damage that may ensue for a company is huge (even if the legal proceedings are terminated) and may also have a negative effect on shareholders.
Most of the members of the Board of Management serving in 2018 hold a large number of Company shares. Until 2020 moreover, members of the Board of Management are obliged to continue to invest a portion of their bonus payments from the multi-year performance plans (2016–2018 and 2017–2019) in Company shares.
bonus fully reflects the sustainable and long-term performance of Munich Re’s shares, so that a further multi-year deferral period – which in turn is geared to share price performance – is neither expedient nor necessary. In the case of the annual bonus, a deferral period does not offer any significant added value either, as the annual bonus makes up only 15% of overall remuneration.
Limit to variable remuneration (malus) and clawbackGiven that the Supervisory Board can take into account a loading or reduction of up to 20 percentage points on both the annual bonus and the multi-year bonus in order to reflect the achievements of the individual members of the Board of Management and the Board of Management as a whole, it has the option of reducing variable remuneration in the case of negative result contributions.
According to the employment contracts for members of the Board of Management appointed for the first time after 1 January 2017, all unpaid variable remuneration components are forfeited in the event of termination of a Board member’s contract by the Company for good cause or in the event of relinquishment by a Board member of their appointment to the Board of Management without good cause.
In addition, all employment contracts of the members of the Board of Management provide for the right of the Company to implement any requirements by the supervisory authority to limit, cancel or not pay out variable remuneration in relation to the member of the Board of Management.
Contractual clawback provisions requiring reimbursement of variable remuneration components already paid out are triggered in the event of a serious breach of duty. All employment contracts of the members of the Board of Management include a provision according to which, in particular pursuant to Section 93 of the German Stock Corporation Act (AktG), a member of the Board of Management is required to reimburse the Company for any damage attributable to them as a result of a breach of duty.
Share ownership of the members of the Board of Management
Total value XETRA of shares in Number closing Total value % of basic of shares on price on of shares on remunerationMembers of the Board of Management 28.12.20181 28.12.20181 28.12.20181 for 20182
€ € %Joachim Wenning 11,274 190.55 2,148,260.70 97Thomas Blunck 5,071 190.55 966,279.05 90Doris Höpke 3,309 190.55 630,529.95 59Torsten Jeworrek 13,578 190.55 2,587,287.90 167Hermann Pohlchristoph 223 190.55 42,492.65 4Markus Rieß3 2,358 190.55 449,316.90 18Peter Röder 7,089 190.55 1,350,808.95 126Jörg Schneider 6,010 190.55 1,145,205.50 74
1 Last trading day in 2018.2 Despite the number of shares being predominantly up on 2017’s figure, the overall value of the shares in relation to basic remuneration declined because the share of
basic remuneration in the target overall direct remuneration was increased from 30% to 50% in 2018.3 As regards the overall value of the shares in relation to basic remuneration, the basic remuneration that Markus Rieß received for his work at ERGO Group AG was also
taken into consideration.

33Combined management reportGroup
Munich Re Group Annual Report 2018
As a matter of principle, the Company ensures that severance payments are related to performance achieved over the whole period of activity.
Stock option plansNo stock option plans or similar incentive schemes are in place for the Board of Management.
Remuneration for other board membershipsIn the case of seats held on other boards, remuneration for board memberships must be paid over to the Company. Exempted from this is remuneration for memberships explicitly classified by the Supervisory Board as private.
External consultantsMunich Re does not use the services of external consultants to draft or implement remuneration systems for the Board of Management.
PensionsUp to and including 2008, the members of the Board of Management were members of a defined benefit plan, providing for payment of a fixed pension amount.
As of 2009, newly appointed members of the Board have become members of a defined contribution plan. For this plan, the Company provides a pension contribution for each calendar year (contribution year) during the term of the employment contract. It uniformly amounts to 25.5% of the target overall direct remuneration (= basic remuneration + variable remuneration on the basis of 100% achievement of objectives). The amount of the pension contribution takes into consideration the peer group (including DAX 30 companies) and the pension contributions for the employee groups below the level of the Board of Management. The pension contributions for the members of the Board of Management are paid over to an external pension insurer. The insurance benefits that result from the contribution payments constitute the Company’s pension commitment to the Board member.
Board members appointed before 2009 were transferred to the new system. They kept their pension entitlement from the defined benefit plan (fixed amount in euros) existing at the date of transfer, which was maintained as a vested pension.
For their service years as of 1 January 2009, they receive an incremental pension benefit based on the defined contribution plan.
The Supervisory Board determines the relevant target pension level for pension commitments from defined benefit plans and defined contribution plans – also considering length of service on the Board – and takes account of the resultant annual and long-term cost for the Company.
The members of the Board of Management are also members of the Munich Re pension scheme, which is a defined contribution plan.
Other Continued payment of remuneration in the case of incapacity to workIn the case of temporary incapacity to work due to illness or for another cause beyond the Board member’s control, the remuneration is paid until the end of the contract of employment. The Company may terminate the contract prematurely if Board members are incapacitated for a period of longer than 12 months and it is probable that they will be permanently unable to fully perform the duties conferred on them (permanent incapacity to work). In this event, the Board member will receive a disability pension.
No guaranteed variable remuneration (sign-on bonuses/recruitment bonuses)As a matter of principle, the Company does not pay guaranteed variable remuneration to members of the Board of Management. We only pay sign-on/recruitment bonuses in exceptional cases and on production of corresponding evidence if a new member of the Board of Management forfeits a bonus by a previous employer. Compensation for forfeiting variable remuneration components paid by a previous employer is paid in several instalments and is tied to prerequisites for disbursement.
Severance cap and change of controlMembers of the Board of Management appointed before 1 January 2017 have no contractual right to severance payments. If the Board member’s activities on the Board are terminated prematurely by the Company without good cause, payments due may not exceed the equivalent of two years’ total remuneration (three years’ total remuneration in the event of acquisition of a controlling interest or change of control within the meaning of Section 29(2) of the Securities Acquisition and Takeover Act – WpÜG) and may not cover more than the remaining period of the employment contract if this is shorter. If the employment contract is terminated for good cause on grounds that are within the Board member’s control, no payments are made to the Board member. The calculation is based on the overall remuneration for the past financial year and, if necessary, on the probable overall remuneration for the current financial year.
Members of the Board of Management appointed for the first time after 1 January 2017 whose contracts are terminated by the Company without good cause have a contractual right to a severance payment. Such payments may not exceed the equivalent of two years’ total remuneration, and are restricted by the remaining term of the Board member’s contract if this term is shorter. Annual remuneration is calculated on the basis of fixed annual remuneration and variable remuneration paid out for the prior full financial year before the contract was terminated; remuneration in kind, other fringe benefits and contributions to occupational retirement schemes are not taken into account. Payments received by a Board member during a period of notice after termination of the appointment are offset against any severance payment. There will be no right to severance payments in the event of extraordinary termination of the Board member’s contract by the Company for good cause.
34Combined management reportGroup
Munich Re Group Annual Report 2018
non-extension or revocation of their appointment without the Board members having given cause for this through a gross violation of their duties or having requested it. This applies where the Board members have already passed the age of 50, have been in the employment of the Company for more than ten years when the contract terminates, and have had their appointment to the Board of Management extended at least once.
Benefit: − In the case of defined contribution plans: Annuity based on the policy reserve or payment of the policy reserve as a lump sum at the date the pension benefit is claimed. − In the case of a combination of defined benefit plans and defined contribution plans: Entitlement of between 30% and 60% of pensionable basic remuneration, reduced by 2% for each year or part thereof short of the Board member’s 65th birthday; the Company assumes payment of the difference between the monthly occupational pension and the monthly incremental pension from the external insurance.
Members of the Board of Management appointed for the first time after 1 January 2017 do not have any entitlement to a reduced occupational pension on early retirement.
Vested benefits for occupational pension, disability pension and surviving dependantsVested benefits are paid upon the Board member reaching the age of 60 or 62, in the case of disability, or in the event of the Board member’s death.
Vested benefits under the German Company Pension Act (BetrAVG):Board members are entitled to vested benefits under the German Company Pension Act if they leave the Company before reaching the age of 60 or 62 and the pension commitment has existed for at least three years (previously five years) at the time of departure.
Benefit: − In the case of defined contribution plans: Annuity based on the policy reserve or payment of the policy reserve as a lump sum at the date the insured event occurs. − In the case of a combination of defined benefit plans and defined contribution plans: The entitlement under the vested pension is a proportion of the vested pension based on the ratio of actual service with the Company to the period the Board member would have worked for the Company altogether up to the fixed retirement age (m/n-tel process, Section 2(1) of the Company Pension Act). The entitlement from the incremental pension comprises the pension benefits fully financed under the insurance contract up to the occurrence of the insured event based on the pension contributions made up to the date of leaving the Company – (Section 2(5a) of the Company Pension Act). This entitlement is paid out as an annuity or a lump sum.
Benefits on termination of employmentBoard members appointed before 2006 who are entitled to an occupational pension, disability pension, or reduced occupational pension on early retirement receive a pension in the amount of their previous monthly basic remuneration for a period of six months after retiring or leaving the Company.
Occupational pensionBoard members appointed for the first time before 1 April 2012 are entitled to an occupational pension on retiring from active service with the Company after reaching the age of 60. Board members appointed for the first time as from 1 April 2012 are entitled to an occupational pension on retiring from active service with the Company after reaching the age of 62. All members of the Board of Management must retire from active service no later than at the end of the calendar year in which they turn 67.
Benefit: − In the case of defined contribution plans: Annuity based on the policy reserve or payment of the policy reserve as a lump sum. − In the case of a combination of defined benefit plans and defined contribution plans: Vested pension from the defined benefit plan and annuity from the policy reserve under the defined contribution plan or payment of a lump sum.
Disability pensionDisability in this respect means that the member of the Board of Management is likely to be unable, or has already been unable, to exercise his or her position for six months without interruption, as a result of illness, injury, or infirmity beyond what is normal for his or her age. The entitlement to a disability pension does not arise until expiry of remuneration payment obligations or continuation of remuneration payment obligations after a mutual agreement to terminate the employment contract, as a result of non-extension or revocation of their appointment to the Board or where the contract of employment has been terminated by the Company due to permanent incapacity.
Benefit: − In the case of defined contribution plans: 80% of the insured occupational pension up to the age of 59 or 61, with subsequent occupational pension. − In the case of a combination of defined benefit plans and defined contribution plans: Vested pension from the defined benefit plan and 80% of the insured occupational pension benefit up to age 59, with subsequent occupational pension based on the defined contribution plan.
Reduced occupational pension on early retirementBoard members appointed before 1 January 2017 are entitled to a reduced occupational pension on early retirement if the contract of employment is terminated as a result of
35Combined management reportGroup
Munich Re Group Annual Report 2018
Pay ratiosIn the reporting year, the ratio of the target overall direct remuneration of the Chairman of the Board of Management to the average target overall direct remuneration of all Company employees (excluding the Board of Management) was 38. The ratio of the average target overall direct remuneration of all members of the Board of Management to the average target overall direct remuneration of all employees (excluding the Board of Management) was 24.
Disclosure of Board of Management remunerationBoard of Management remuneration is disclosed under two different sets of rules, namely German Accounting Standard No. 17 (DRS 17, revised 2010) and the German Corporate Governance Code. There are therefore deviations in individual remuneration components and total remuneration.
Board of Management remuneration under DRS 17Under DRS 17, remuneration for the 2018 annual bonus is shown as the provisions set aside for that purpose taking into account the relevant additional/reduced expenditure for the previous year, since the performance on which the remuneration is based has been completed as at the balance sheet date and the requisite Board resolution is already foreseeable. Under DRS 17, remuneration for multi-year performance 2015–2017 is recognised in the year of payment, i.e. in 2018.
Fixed and variable remuneration componentsThe serving members of Munich Reinsurance Company’s Board of Management in 2018 received remuneration totalling €20.5m (15.4m) for fulfilment of their duties in respect of the parent company and its subsidiaries in the financial year. Remuneration therefore increased by around €5.1m year on year, mainly because of a shift caused by the new remuneration system introduced in 2018. The increase in the fixed component under the new system is apparent in 2018, whereas the decrease in the variable component of the same amount will only become fully evident once the multi-year bonus granted from 2018 is paid out for the first time. Total remuneration received by the individual members of the Board of Management is shown in the table below.
Provision for surviving dependantsIn the event of the death of a Board member during active service, the surviving dependants continue to receive the previous monthly basic remuneration for a period of six months if the deceased was appointed to the Board of Management before 2006. In the case of Board members appointed for the first time as from 2006 and until 2018, the previous monthly basic remuneration is paid to the beneficiaries for a period of three months. If the Board member’s death occurs after retirement, the surviving dependants of members of the Board of Management that were appointed for the first time before 2018 receive the previous monthly occupational pension for a period of three months, provided the marriage/registration of the civil partnership took place and/or the child was born before the Board member started drawing the occupational pension.
Surviving spouses and registered civil partners normally receive a pension amounting to 60% of the defined benefit or insured occupational pension; single orphans receive 20% and double orphans 40%. The total amount may not exceed the occupational pension of the Board member. If the Board member’s occupational pension was reduced owing to early retirement, benefits for surviving dependants are based on the reduced occupational pension.
Total remuneration of the Board of ManagementAmount of remunerationThe level of the target overall direct remuneration for the individual members of the Board of Management is set by the full Supervisory Board, acting on recommendations from the Supervisory Board’s Remuneration Committee, and taking into account the responsibilities and performance of each member of the Board of Management, the performance of the full Board of Management and the situation, performance and future prospects of Munich Re. It takes into consideration whether the remuneration is standard practice and appropriate compared with other companies of the peer group (including DAX 30 companies). The target overall direct remuneration for the Chairman of the Board of Management is based on the median remuneration paid to the chairs of the boards of management of DAX 30 companies. In addition, the Supervisory Board takes into account the level of the salaries paid to the Board of Management in relation to the level of salaries paid to senior managers and to general staff members over time.

36Combined management reportGroup
Munich Re Group Annual Report 2018
1 At the time of preparation of this report, no Supervisory Board resolution had yet been passed on the amounts to be paid for the 2018 annual bonus. The amounts shown for the annual bonus are based on estimates, i.e. the relevant provisions and the additional/reduced expenditure for the 2017 annual performance. The amounts shown for the 2017 annual performance comprise the respective provision for 2017 and the relevant additional/reduced expenditure for 2016. The actual bonus payments for 2017 can be seen in the remuneration tables “Remuneration paid in accordance with the German Corporate Governance Code” on page 42 ff.
2 The multi-year performance component paid annually until 2017 is geared to the success of the fields of business and personal performance of the members of the Board of Management, for which three-year objectives were agreed. In addition, the Supervisory Board assesses the overall performance of the Board of Management as a whole and the individual Board members, and it also takes into account developments during the appraisal period that are beyond the influence of the Board. Payment is effected in the fourth year, with 25% of the net payout amount to be invested in Munich Reinsurance Company shares that must be held for at least a two- year period. 3 The amounts paid out in 2018 were for multi-year performance 2015–2017, those paid out in 2017 were for 2014–2016.4 The compensation components that Markus Rieß received for his work at ERGO Group AG are included in the remuneration. Other: Compensation, paid in four equal instalments, for the forfeited variable remuneration from the previous employer.5 The higher basic remuneration compared with the previous year is due to an increase in the fixed component of target overall direct remuneration from 30% to 50% as of 2018, and to a general upward remuneration adjustment.
Remuneration of individual Board members as per DRS 17 (revised 2010)(in accordance with Section 285 sentence 1 (9a) sentences 5–8 of the German Commercial Code (HGB) and Section 314(1) (6a) sentences 5–8 HGB)
Annual bonus (from 2018) Remuner- Annual Basic ation in perform- Multi-year Financial remuner- kind/fringe ance (until perform- Name year ation benefits 2017)1 ance2, 3 Other Total € € € € € €Joachim Wenning (Chairman of the Board 2018 2,225,000 39,201 692,736 646,800 3,603,737of Management since 27 April 2017) 2017 1,045,000 128,254 339,533 872,200 2,384,987Thomas Blunck 2018 1,075,000 33,797 367,717 637,000 2,113,514 2017 615,000 31,466 294,290 872,200 1,812,956Doris Höpke 2018 1,075,000 32,273 260,092 493,675 1,861,040 2017 615,000 32,105 276,203 366,275 1,289,583Torsten Jeworrek 2018 1,550,000 37,021 483,570 937,860 3,008,451 2017 885,000 36,179 323,627 1,264,690 2,509,496Hermann Pohlchristoph (since 27 April 2017) 2018 1,012,500 49,237 319,028 1,380,765 2017 410,000 29,940 138,332 578,272Markus Rieß4 2018 2,462,500 120,626 328,480 471,089 3,382,695
Thereof for Munich Reinsurance Company 637,500 47,250 202,500 165,926 1,053,176 2017 976,250 140,167 615,614 750,000 2,482,031Thereof for Munich Reinsurance Company 337,500 49,342 180,023 750,000 1,316,865
Peter Röder 2018 1,075,000 31,713 326,820 637,000 2,070,533 2017 615,000 30,278 218,522 872,200 1,736,000Jörg Schneider 2018 1,550,000 37,719 477,994 1,051,540 3,117,253(until 31 December 2018) 2017 885,000 41,782 401,251 1,250,480 2,578,513Total5 2018 12,025,000 381,586 3,256,437 4,874,964 0 20,537,988 2017 6,046,250 470,171 2,607,372 5,498,045 750,000 15,371,838

37Combined management reportGroup
Munich Re Group Annual Report 2018
1 The remuneration set for the annual bonus for 2018 is payable in 2019, that for 2019 in 2020. 2 The remuneration set for the multi-year bonus for 2018 is payable in 2022, that for 2019 in 2023. 3 Information on the assessment bases and targets for the amounts set for 2018 and 2019 is provided on page 29 ff. 4 The ERGO Group AG remuneration system does not provide for a variable component. Markus Rieß thus only receives variable target amounts from Munich Reinsurance Company.
Amounts payable for variable remuneration of the individual Board members in the event of 100% performance evaluation as per DRS 17 (revised 2010), corridor 0–200%
Multi-year Total amountsName Annual bonus1, 3 bonus2, 3 payable Set in for € € €Joachim Wenning 2018 2019 667,500 1,557,500 2,225,000 2017 2018 667,500 1,557,500 2,225,000Thomas Blunck 2018 2019 322,500 752,500 1,075,000 2017 2018 322,500 752,500 1,075,000Doris Höpke 2018 2019 322,500 752,500 1,075,000 2017 2018 322,500 752,500 1,075,000Torsten Jeworrek 2018 2019 465,000 1,085,000 1,550,000 2017 2018 465,000 1,085,000 1,550,000Hermann Pohlchristoph 2018 2019 322,500 752,500 1,075,000 2017 2018 303,750 708,750 1,012,500Markus Rieß4 2018 2019 127,500 297,500 425,000
2017 2018 191,250 446,250 637,500Peter Röder 2018 2019 322,500 752,500 1,075,000 2017 2018 322,500 752,500 1,075,000Jörg Schneider (until 31 December 2018) 2018 2019 2017 2018 465,000 1,085,000 1,550,000Total 2018 2019 2,550,000 5,950,000 8,500,000 2017 2018 3,060,000 7,140,000 10,200,000
The variable remuneration amounts payable are listed in the table below.

38Combined management reportGroup
Munich Re Group Annual Report 2018
insurer under the defined contribution system, the visible pension costs since 2009 are noticeably higher. The Company accepts this increase in order to avoid higher costs in future and to eliminate long-term pension-specific risks. The following defined benefits, present values, contribution rates and personnel expenses result for the individual members of the Board of Management:
Penstion entitlementsPersonnel expenses of €5.7m (5.2m) were incurred in the financial year to finance the pension entitlements for serving members of the Board of Management in 2018. Of these, €0.8m was apportionable to defined benefit plans and around €4.9m to defined contribution plans. As a consequence of the risk transfer to an external pension
Pension entitlements
Defined benefit plan Present value Provisions of defined for Financial Defined benefit as at personnelName year benefit1 31 December expenses2
€/year € €Joachim Wenning3, 4 2018 – 16,424 1,698 2017 – 16,414 1,164Thomas Blunck3, 4 2018 120,000 3,693,367 189,535 2017 120,000 3,581,907 178,062Doris Höpke3, 4 2018 – 10,625 574 2017 – 10,664 507Torsten Jeworrek3, 5 2018 171,000 6,437,429 225,482 2017 171,000 6,303,340 212,254Hermann Pohlchristoph3, 6 2018 – 5,761 345 2017 – 5,740 628Markus Rieß3, 7 2018 – 37,192 18,271 Thereof for Munich Reinsurance Company – 37,192 18,271 2017 – 42,116 10,944 Thereof for Munich Reinsurance Company – 42,116 10,944Peter Röder3, 5 2018 90,000 3,164,789 107,050 2017 90,000 3,082,126 112,941Jörg Schneider8 (until 31 December 2018) 2018 275,000 11,401,547 278,559 2017 275,000 11,170,862 356,081Total 2018 656,000 24,767,134 821,514 2017 656,000 24,213,169 872,581
See table on next page for footnotes

39Combined management reportGroup
Munich Re Group Annual Report 2018
The basic remuneration, remuneration in kind/fringe benefits and pension expenses (sum of personnel expenses for defined benefit plans and defined contribution plans) are in accordance with German Accounting Standard No. 17 (DRS 17). There are some deviations with regard to the variable annual and multi-year remuneration components.
The following tables show the benefits granted and the remuneration paid out in accordance with the German Corporate Governance Code:
Board of Management remuneration under the German Corporate Governance CodeAs required by the provisions of the German Corporate Governance Code, the following tables show the benefits granted and remuneration paid out to individual members of the Board of Management in the year under review.
1 In the case of Board members transferred from the old system to the new, the amount corresponds to the value of the annual vested pension at 31 December 2008. 2 Expenses for defined benefit plan, including provision for continued payment of salary for surviving dependants.3 Entitled to occupational pension in the event of termination of employment owing to incapacity to work.4 Entitled to a reduced occupational pension on early retirement in the event of premature or regular termination of employment. 5 Entitled to a reduced occupational pension on early retirement in the event of premature termination of employment, and to an occupational pension in the event of regular termination of employment. 6 Entitled to vested benefits under the Company Pension Act in the event of premature or regular termination of employment.7 Entitled to vested benefits under the Company Pension Act in the event of regular termination of employment. 8 Left the Board as at 31 December 2018; has received a pension since 1 January 2019. 9 Defined contribution plan within the meaning of IAS 19: Employee Benefits, so no present value shown.10 Munich Reinsurance Company: see footnote 9; ERGO Group AG: no Defined Contribution Plan within the meaning of IAS 19, so present value shown.
Pension entitlements
Defined contribution plan Pension Present contribution value of rate for target Entitlement entitlement Financial overall direct as at as at PersonnelName year remuneration 31 December 31 December expenses % €/year € €Joachim Wenning3, 4 2018 25.50 201,663 –9 1,134,750 2017 25.50 162,812 –9 888,250Thomas Blunck3, 4 2018 16.25 137,577 5,718,540 349,375 2017 16.25 123,421 4,974,648 333,125Doris Höpke3, 4 2018 25.50 76,800 –9 548,250 2017 25.50 58,488 –9 522,750Torsten Jeworrek3, 5 2018 19.50 229,892 9,874,883 604,500 2017 19.50 206,002 8,537,140 575,250Hermann Pohlchristoph3, 6 2018 25.50 21,356 –9 516,375 2017 25.50 8,269 –9 324,700Markus Rieß3, 7 2018 25.19 70,802 1,207,23310 781,375 Thereof for Munich Reinsurance Company 25.50 27,380 –9 325,125 2017 25.19 48,557 883,28410 743,125 Thereof for Munich Reinsurance Company 25.50 18,382 –9 286,875Peter Röder3, 5 2018 20.25 160,141 6,739,628 435,375 2017 20.25 143,058 5,781,036 415,125Jörg Schneider8 (until 31 December 2018) 2018 16.50 207,464 8,186,476 511,500 2017 16.50 170,676 7,251,118 486,750Total 2018 1,105,695 31,726,760 4,881,500 2017 921,283 27,427,226 4,289,075

40Combined management reportGroup
Munich Re Group Annual Report 2018
Continued on next page
Benefits granted in accordance with the German Corporate Governance Code
Joachim Wenning Thomas Blunck Board member (until 26 April 2017) Board member Chairman of the Board of Management (since 27 April 2017)€ 2018 2018 (min.) 2018 (max.) 2017 2018 2018 (min.) 2018 (max.) 2017Basic remuneration 2,225,000 2,225,000 2,225,000 1,045,000 1,075,000 1,075,000 1,075,000 615,000Remuneration in kind/fringe benefits 39,201 39,201 39,201 128,254 33,797 33,797 33,797 31,466Total 2,264,201 2,264,201 2,264,201 1,173,254 1,108,797 1,108,797 1,108,797 646,466One-year variable remuneration
Annual performance 2017 882,000 430,500Annual bonus 2018 667,500 0 1,335,000 322,500 0 645,000
Multi-year variable remuneration Multi-year performance 2017–20191 2,058,000 1,004,500Multi-year bonus 2018 1,557,500 0 3,115,000 752,500 0 1,505,000
Other Total 4,489,201 2,264,201 6,714,201 4,113,254 2,183,797 1,108,797 3,258,797 2,081,466Pension expenses 1,136,448 1,136,448 1,136,448 889,414 538,910 538,910 538,910 511,187Total remuneration 5,625,649 3,400,649 7,850,649 5,002,668 2,722,707 1,647,707 3,797,707 2,592,653
Doris Höpke Torsten Jeworrek Board member Board member€ 2018 2018 (min.) 2018 (max.) 2017 2018 2018 (min.) 2018 (max.) 2017Basic remuneration 1,075,000 1,075,000 1,075,000 615,000 1,550,000 1,550,000 1,550,000 885,000Remuneration in kind/fringe benefits 32,273 32,273 32,273 32,105 37,021 37,021 37,021 36,179Total 1,107,273 1,107,273 1,107,273 647,105 1,587,021 1,587,021 1,587,021 921,179One-year variable remuneration
Annual performance 2017 430,500 619,500Annual bonus 2018 322,500 0 645,000 465,000 0 930,000
Multi-year variable remuneration Multi-year performance 2017–20191 1,004,500 1,445,500Multi-year bonus 2018 752,500 0 1,505,000 1,085,000 0 2,170,000
Other Total 2,182,273 1,107,273 3,257,273 2,082,105 3,137,021 1,587,021 4,687,021 2,986,179Pension expenses 548,824 548,824 548,824 523,257 829,982 829,982 829,982 787,504Total remuneration 2,731,097 1,656,097 3,806,097 2,605,362 3,967,003 2,417,003 5,517,003 3,773,683
Hermann Pohlchristoph Board member (since 27 April 2017)€ 2018 2018 (min.) 2018 (max.) 2017Basic remuneration 1,012,500 1,012,500 1,012,500 410,000Remuneration in kind/fringe benefits 49,237 49,237 49,237 29,940Total 1,061,737 1,061,737 1,061,737 439,940One-year variable remuneration
Annual performance 2017 259,000Annual bonus 2018 303,750 0 607,500
Multi-year variable remuneration Multi-year performance 2017–20191 604,333Multi-year bonus 2018 708,750 0 1,417,500
Other Total 2,074,237 1,061,737 3,086,737 1,303,273Pension expenses 516,720 516,720 516,720 325,328Total remuneration 2,590,957 1,578,457 3,603,457 1,628,601
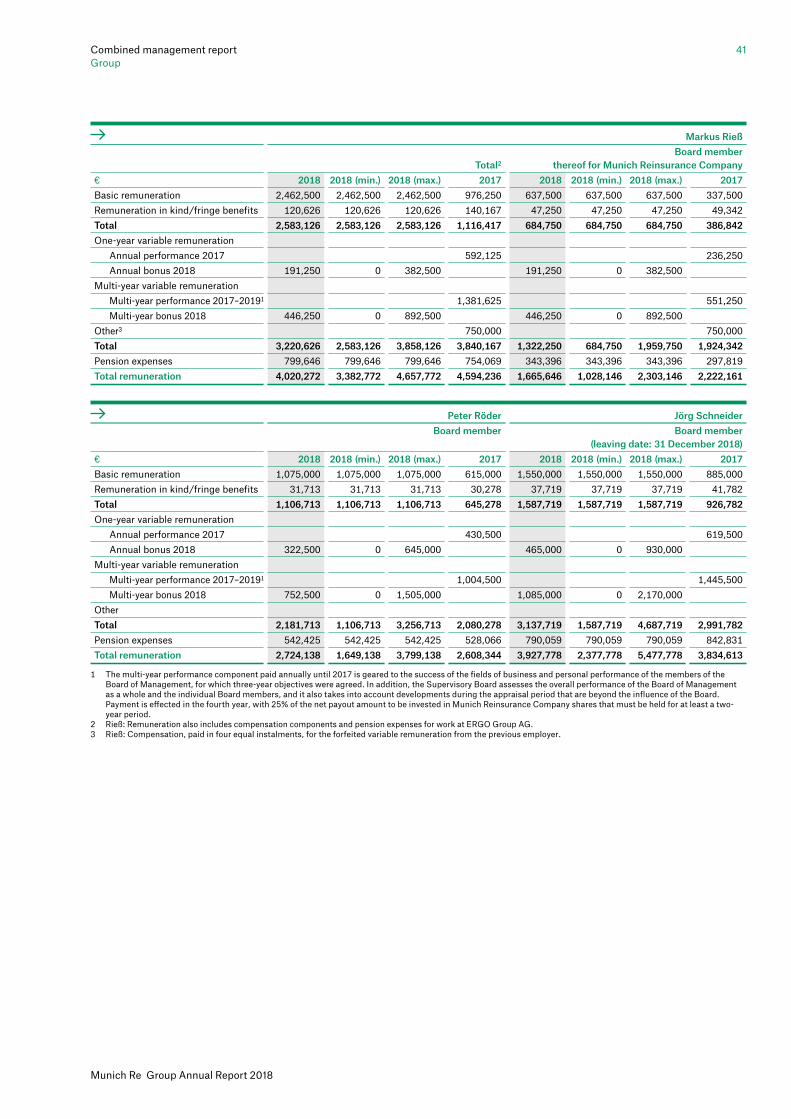
41Combined management reportGroup
Munich Re Group Annual Report 2018
1 The multi-year performance component paid annually until 2017 is geared to the success of the fields of business and personal performance of the members of the Board of Management, for which three-year objectives were agreed. In addition, the Supervisory Board assesses the overall performance of the Board of Management as a whole and the individual Board members, and it also takes into account developments during the appraisal period that are beyond the influence of the Board. Payment is effected in the fourth year, with 25% of the net payout amount to be invested in Munich Reinsurance Company shares that must be held for at least a two- year period.2 Rieß: Remuneration also includes compensation components and pension expenses for work at ERGO Group AG.3 Rieß: Compensation, paid in four equal instalments, for the forfeited variable remuneration from the previous employer.
Markus Rieß Board member Total2 thereof for Munich Reinsurance Company€ 2018 2018 (min.) 2018 (max.) 2017 2018 2018 (min.) 2018 (max.) 2017Basic remuneration 2,462,500 2,462,500 2,462,500 976,250 637,500 637,500 637,500 337,500Remuneration in kind/fringe benefits 120,626 120,626 120,626 140,167 47,250 47,250 47,250 49,342Total 2,583,126 2,583,126 2,583,126 1,116,417 684,750 684,750 684,750 386,842One-year variable remuneration
Annual performance 2017 592,125 236,250Annual bonus 2018 191,250 0 382,500 191,250 0 382,500
Multi-year variable remuneration Multi-year performance 2017–20191 1,381,625 551,250Multi-year bonus 2018 446,250 0 892,500 446,250 0 892,500
Other3 750,000 750,000Total 3,220,626 2,583,126 3,858,126 3,840,167 1,322,250 684,750 1,959,750 1,924,342Pension expenses 799,646 799,646 799,646 754,069 343,396 343,396 343,396 297,819Total remuneration 4,020,272 3,382,772 4,657,772 4,594,236 1,665,646 1,028,146 2,303,146 2,222,161
Peter Röder Jörg Schneider Board member Board member (leaving date: 31 December 2018)€ 2018 2018 (min.) 2018 (max.) 2017 2018 2018 (min.) 2018 (max.) 2017Basic remuneration 1,075,000 1,075,000 1,075,000 615,000 1,550,000 1,550,000 1,550,000 885,000Remuneration in kind/fringe benefits 31,713 31,713 31,713 30,278 37,719 37,719 37,719 41,782Total 1,106,713 1,106,713 1,106,713 645,278 1,587,719 1,587,719 1,587,719 926,782One-year variable remuneration
Annual performance 2017 430,500 619,500Annual bonus 2018 322,500 0 645,000 465,000 0 930,000
Multi-year variable remuneration Multi-year performance 2017–20191 1,004,500 1,445,500Multi-year bonus 2018 752,500 0 1,505,000 1,085,000 0 2,170,000
Other Total 2,181,713 1,106,713 3,256,713 2,080,278 3,137,719 1,587,719 4,687,719 2,991,782Pension expenses 542,425 542,425 542,425 528,066 790,059 790,059 790,059 842,831Total remuneration 2,724,138 1,649,138 3,799,138 2,608,344 3,927,778 2,377,778 5,477,778 3,834,613

42Combined management reportGroup
Munich Re Group Annual Report 2018
See table on next page for footnotes
Doris Höpke Torsten Jeworrek Board member Board member Overall Overall performance performance evaluation evaluation€ 2018 2017 in % 2018 2017 in %Basic remuneration 1,075,000 615,000 1,550,000 885,000 Remuneration in kind/fringe benefits 32,273 32,105 37,021 36,179 Total 1,107,273 647,105 1,587,021 921,179 One-year variable remuneration
Annual performance 20171 292,740 68 371,700 60Annual bonus 20182 309,600 96 446,400 96
Multi-year variable remuneration Multi-year performance 2015–20171, 3 493,675 62 937,860 66Multi-year performance 2016–20183, 4 756,928 84 1,098,580 76
Other Total 2,173,801 1,433,520 3,132,001 2,230,739 Pension expenses 548,824 523,257 829,982 787,504 Total remuneration 2,722,625 1,956,777 3,961,983 3,018,243
Remuneration paid in accordance with the German Corporate Governance Code
Joachim Wenning Thomas Blunck Board member (until 26 April 2017) Board member Chairman of the Board of Management (since 27 April 2017) Overall Overall performance performance evaluation evaluation€ 2018 2017 in % 2018 2017 in %Basic remuneration 2,225,000 1,045,000 1,075,000 615,000 Remuneration in kind/fringe benefits 39,201 128,254 33,797 31,466 Total 2,264,201 1,173,254 1,108,797 646,466 One-year variable remuneration
Annual performance 20171 416,955 57 378,840 88Annual bonus 20182 640,800 96 309,600 96
Multi-year variable remuneration Multi-year performance 2015–20171, 3 646,800 66 637,000 65Multi-year performance 2016–20183, 4 763,420 76 763,420 76
Other Total 3,668,421 2,237,009 2,181,817 1,662,306 Pension expenses 1,136,448 889,414 538,910 511,187 Total remuneration 4,804,869 3,126,423 2,720,727 2,173,493

43Combined management reportGroup
Munich Re Group Annual Report 2018
See table on next page for footnotes
Markus Rieß Board member Total5 thereof for Munich Reinsurance Company Overall performance evaluation€ 2018 2017 2018 2017 in %Basic remuneration 2,462,500 976,250 637,500 337,500 Remuneration in kind/fringe benefits 120,626 140,167 47,250 49,342 Total 2,583,126 1,116,417 684,750 386,842 One-year variable remuneration
Annual performance 20171 642,505 160,650 68Annual bonus 20182 183,600 183,600 96
Multi-year variable remuneration Multi-year performance 2015–20171, 3 471,089 165,926 108Multi-year performance 2016–20183, 4 1,381,625 551,250 100
Other6 750,000 750,000 Total 4,148,351 2,980,011 1,419,600 1,463,418 Pension expenses 799,646 754,069 343,396 297,819 Total remuneration 4,947,997 3,734,080 1,762,996 1,761,237
Hermann Pohlchristoph Board member (joined: 27 April 2017) Overall performance evaluation€ 2018 2017 in %Basic remuneration 1,012,500 410,000 Remuneration in kind/fringe benefits 49,237 29,940 Total 1,061,737 439,940 One-year variable remuneration
Annual performance 20171 165,760 64Annual bonus 20182 291,600 96
Multi-year variable remuneration Multi-year performance 2015–20171, 3 –Multi-year performance 2016–20183, 4 –
Other Total 1,353,337 605,700 Pension expenses 516,720 325,328 Total remuneration 1,870,057 931,028
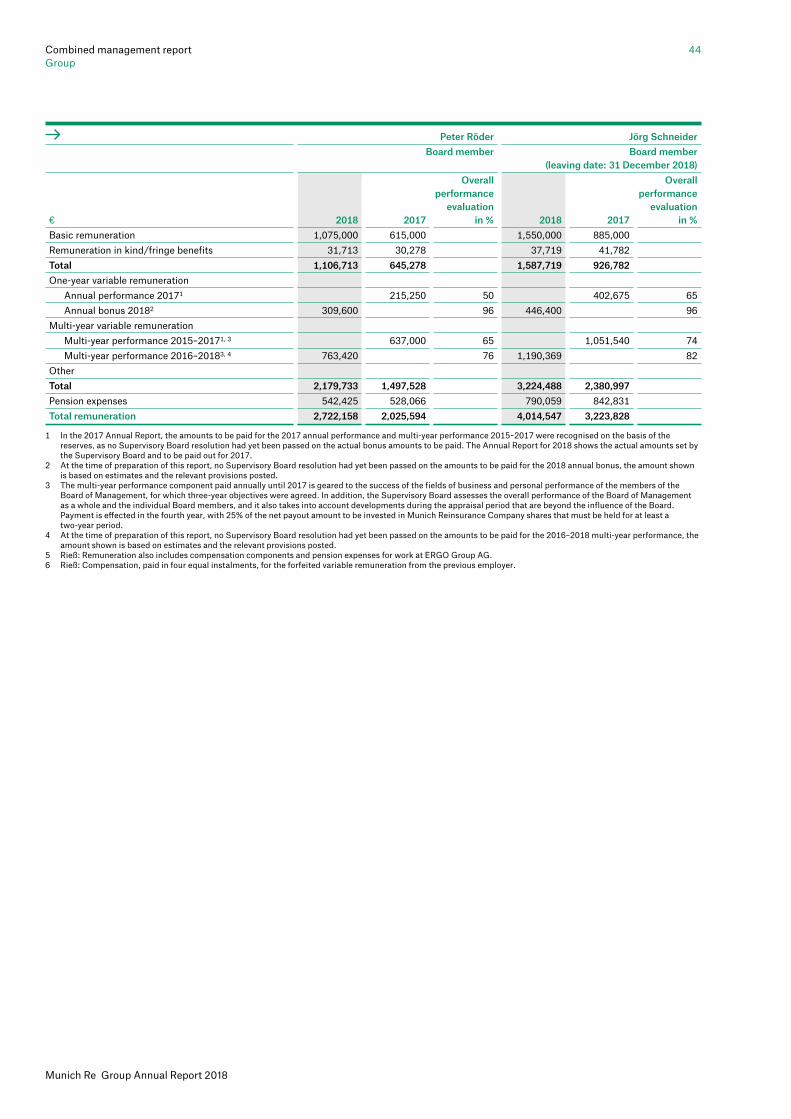
44Combined management reportGroup
Munich Re Group Annual Report 2018
1 In the 2017 Annual Report, the amounts to be paid for the 2017 annual performance and multi-year performance 2015–2017 were recognised on the basis of the reserves, as no Supervisory Board resolution had yet been passed on the actual bonus amounts to be paid. The Annual Report for 2018 shows the actual amounts set by the Supervisory Board and to be paid out for 2017.
2 At the time of preparation of this report, no Supervisory Board resolution had yet been passed on the amounts to be paid for the 2018 annual bonus, the amount shown is based on estimates and the relevant provisions posted. 3 The multi-year performance component paid annually until 2017 is geared to the success of the fields of business and personal performance of the members of the Board of Management, for which three-year objectives were agreed. In addition, the Supervisory Board assesses the overall performance of the Board of Management as a whole and the individual Board members, and it also takes into account developments during the appraisal period that are beyond the influence of the Board. Payment is effected in the fourth year, with 25% of the net payout amount to be invested in Munich Reinsurance Company shares that must be held for at least a two-year period.4 At the time of preparation of this report, no Supervisory Board resolution had yet been passed on the amounts to be paid for the 2016–2018 multi-year performance, the amount shown is based on estimates and the relevant provisions posted. 5 Rieß: Remuneration also includes compensation components and pension expenses for work at ERGO Group AG.6 Rieß: Compensation, paid in four equal instalments, for the forfeited variable remuneration from the previous employer.
Peter Röder Jörg Schneider Board member Board member (leaving date: 31 December 2018) Overall Overall performance performance evaluation evaluation€ 2018 2017 in % 2018 2017 in %Basic remuneration 1,075,000 615,000 1,550,000 885,000 Remuneration in kind/fringe benefits 31,713 30,278 37,719 41,782 Total 1,106,713 645,278 1,587,719 926,782 One-year variable remuneration
Annual performance 20171 215,250 50 402,675 65Annual bonus 20182 309,600 96 446,400 96
Multi-year variable remuneration Multi-year performance 2015–20171, 3 637,000 65 1,051,540 74Multi-year performance 2016–20183, 4 763,420 76 1,190,369 82
Other Total 2,179,733 1,497,528 3,224,488 2,380,997 Pension expenses 542,425 528,066 790,059 842,831 Total remuneration 2,722,158 2,025,594 4,014,547 3,223,828

45Combined management reportGroup
Munich Re Group Annual Report 2018
Members of the Supervisory Board receive a daily attendance fee of €1,000 for Supervisory Board/ Supervisory Board committee meetings – with the exception of the Conference Committee.
The annual remuneration of members of the Supervisory Board increased as of 1 January 2019 from €90,000 to €100,000. The Chairman of the Supervisory Board will receive annual remuneration of €220,000 in future, and the Deputy Chairman will receive €150,000. Members of the Audit Committee each receive an additional €55,000 for their work on the Committee, and each member of the Standing Committee receives an additional €15,000. Each member of the Personnel Committee and the Remuneration Committee receives an additional €30,000. For members of the Supervisory Board serving on both committees, the compensation for serving on the Personnel Committee also covers their membership on the Remuneration Committee. The chairs of these committees continue to each receive double the amounts stated for members. As was previously the case, no remuneration is paid for serving on the Nomination Committee or the Conference Committee. The attendance fee, which is paid to Supervisory Board members once only per day of meetings – even if several are attended on any given day – remains at €1,000 per meeting. The remuneration of members of the Supervisory Board will continue to exclude variable remuneration components and pension benefits.
Total remuneration of the Supervisory Board
Remuneration of the members of the Supervisory Board in 2018In the year under review, each member of the Supervisory Board received fixed annual remuneration of €90,000. The Chairman of the Supervisory Board received annual remuneration of €180,000, and the Deputy Chairman annual remuneration of €135,000.
Members of the Audit Committee each received an additional €45,000; members of the Standing Committee each received an extra €13,500; and members of the Personnel Committee each received an additional €27,000.
A Remuneration Committee was formed as of 1 January 2018. The members of the Remuneration Committee that are not on the Personnel Committee each received an additional €27,000. For members of the Supervisory Board who are on both the Personnel Committee and the Remuneration Committee, their membership of the Remuneration Committee is also covered by their fee for the Personnel Committee.
The Chairs of these committees receive double the amounts stated for members. No additional remuneration is paid for serving on the Nomination Committee or the Conference Committee.

46Combined management reportGroup
Munich Re Group Annual Report 2018
1 Plus value-added tax (USt) in each case, in accordance with the relevant Articles of Association.2 The previous year’s figures do not include the remuneration of members who left the Supervisory Board in the 2017 financial year.
Remuneration of the Supervisory Board members1
For membership of supervisory boards at Munich Reinsurance Company subsidiaries, In accordance with Article 15 of the in accordance with the companies’ Articles of Association respective articles of association Fixed remuneration Fixed remuneration Com- Com- Financial mittee Attend- mittee Attend- Name year Annual work ance fees Total Annual work ance fees Total € € € € € € € €Bernd Pischetsrieder 2018 180,000 126,000 22,000 328,000 Chairman 2017 180,000 126,000 17,000 323,000 Marco Nörenberg 2018 135,000 13,500 7,000 155,500 35,000 – – 35,000Deputy Chairman 2017 135,000 13,500 6,000 154,500 35,000 – – 35,000Ann-Kristin Achleitner 2018 90,000 72,000 20,000 182,000 2017 90,000 45,000 13,000 148,000 Kurt Wilhelm Bock (since 25 April 2018) 2018 67,500 – 3,000 70,500 2017 – – – – Clement B. Booth 2018 90,000 – 6,000 96,000 2017 90,000 – 6,000 96,000 Frank Fassin 2018 90,000 – 6,000 96,000 35,000 – – 35,000 2017 90,000 – 5,000 95,000 35,000 – – 35,000Benita Ferrero-Waldner 2018 90,000 – 6,000 96,000 2017 90,000 – 5,000 95,000 Christian Fuhrmann 2018 90,000 45,000 15,000 150,000 2017 90,000 45,000 12,000 147,000 Ursula Gather 2018 90,000 – 6,000 96,000 2017 90,000 – 6,000 96,000 Gerd Häusler 2018 90,000 13,500 7,000 110,500 2017 90,000 13,500 6,000 109,500 Anne Horstmann 2018 90,000 45,000 15,000 150,000 52,500 7,500 – 60,000 2017 90,000 45,000 12,000 147,000 52,500 7,500 – 60,000Ina Hosenfelder 2018 90,000 – 4,000 94,000 2017 90,000 – 6,000 96,000 Renata Jungo Brüngger 2018 90,000 – 6,000 96,000 2017 90,000 – 3,000 93,000 Henning Kagermann 2018 90,000 130,500 21,000 241,500 2017 90,000 130,500 17,000 237,500 Beate Mensch 2018 90,000 – 6,000 96,000 2017 90,000 – 6,000 96,000 Ulrich Plottke 2018 90,000 – 6,000 96,000 35,000 17,500 – 52,500 2017 90,000 – 6,000 96,000 35,000 17,500 – 52,500Andrés Ruiz Feger 2018 90,000 13,500 7,000 110,500 2017 90,000 13,500 6,000 109,500 Gabriele Sinz-Toporzysek 2018 90,000 – 5,000 95,000 15,000 – – 15,000 2017 90,000 – 6,000 96,000 15,000 – – 15,000Ron Sommer (until 25 April 2018) 2018 30,000 – 3,000 33,000 2017 90,000 – 6,000 96,000 Angelika Wirtz 2018 90,000 27,000 9,000 126,000 2017 90,000 27,000 10,000 127,000 Maximilian Zimmerer 2018 90,000 – 6,000 96,000 2017 45,000 – 2,000 47,000 Total2 2018 1,942,500 486,000 186,000 2,614,500 172,500 25,000 – 197,500 2017 1,890,000 459,000 156,000 2,505,000 172,500 25,000 – 197,500

47
Munich Re Group Annual Report 2018
Combined management reportIndustry environment
Macroeconomic and industry environment Overall, in 2018 global economic growth remained above its long-term average, but the major economies experienced different rates of growth. While the US economy gained momentum, the eurozone and Japanese economies slowed. Growth rates were high in China and India, but remained negligible in Brazil and Russia. Annual inflation rates in developed economies were slightly higher on average than in the previous year, but remained moderate overall.
Capital markets
The US Federal Reserve continued its monetary tightening campaign by raising the policy rate four times in 2018. At the end of December, the target corridor for the US key interest rate was 2.25–2.5%. In addition, expiring bonds previously purchased by the Fed were no longer fully reinvested. By contrast, the European Central Bank (ECB) continued to pursue an expansionary monetary policy, maintaining its key interest rate at 0%. However, during the course of the year it reduced the monthly volume of its bond purchases in two stages, and ceased making any net purchases in December. The redemption amounts for securities purchased as part of the ECB’s bond-buying programme will, however, continue to be reinvested at maturity for quite some time.
Driven by strong economic growth, higher inflation and monetary tightening, yields on ten-year US government bonds rose to over 3.2% during the year. Towards the end of the year, however, yields fell again due to increasing risk aversion on global capital markets. In Europe, the low interest-rate environment continued to pose great challenges for investors: yields on ten-year German government bonds rose to over 0.7% in February, but then repeatedly fell back to a very low level over the further course of the year. One reason for the increased demand for German government bonds – which are perceived as safe – was concern over the fiscal policies of the new government in Italy. The yield differential between Italian and German government bonds widened significantly. Other causes of the fall in German government bond yields were uncertainty about Brexit, the escalating trade war between the USA and its trading partners (especially China), and the financial crisis in Turkey.
Yields on ten-year government bonds
% 31.12.2018 31.12.2017USA 2.7 2.4Germany 0.2 0.4
These events and developments also led to repeated turbulence in international stock markets. As early as February, when bond yields in the USA rose significantly, there were global slumps in share prices. After recoveries in the second and third quarters, volatility increased in the fourth quarter because of fears about recession, and it remained high until the end of the year. Important stock indices such as the US Dow Jones index and the DJ Euro STOXX 50 closed the year with heavy losses.
Equity markets
31.12.2018 31.12.2017DJ EuroStoxx 50 3,001 3,504Dow Jones Index 23,327 24,719
The US dollar to euro exchange rate fluctuated in 2018. The euro exchange rate rose to US$ 1.25 at the beginning of the year, but later fell sharply and reached a low of US$ 1.12 in November. At the end of December, the euro exchange rate was around 5% lower against the US dollar than at the end of 2017, but higher against the Canadian dollar (around 4%) and pound sterling (around 1%). Compared with the previous year, the average annual value of the euro for 2018 was up by almost 5% against the US dollar, by more than 4% against the Canadian dollar, and by around 1% against the pound. Further information on exchange rates can be found in the Notes to the consolidated financial statements on page 116.
Insurance industry
According to preliminary estimates, the German insurance industry’s premium income increased significantly in 2018. Premiums in property-casualty business and health insurance showed solid growth, in line with the average in recent years. In life insurance, premium volume also increased in 2018, following several years of decline.
Premium development in property-casualty reinsurance was supported by very solid growth in many key primary insurance markets. North America, Western Europe and China were the main contributors to the substantial increase in global primary insurance premiums. The renewals for property-casualty reinsurance treaties in January, April and July 2018 saw price increases in markets affected by natural catastrophes. Prices remained stable otherwise, and capacity in the markets is still high. Consequently, the renewals as at 1 January 2019 once again took place in a very competitive market environment. On average, prices remained largely unchanged.

48Combined management reportImportant tools of corporate management
Important tools of corporate managementMunich Re’s management philosophy – based on value creation
The aim of Munich Re’s entrepreneurial thinking and activity is to analyse risks from every conceivable angle and to assess and diversify them, creating lasting value for shareholders, clients, and staff in relation to the risks assumed. This is the aim of our active capital manage ment and the consistent application of value and risk-based management systems.
The framework for any business activity is our risk strategy, from which we derive various limitations and reporting thresholds. A key element is our economic capital resources, which we determine in accordance with the Solvency II supervisory regime. We observe a range of important additional conditions. They include national accounting regulations, tax aspects, liquidity requirements, supervisory parameters, and rating agency requirements.
Our value-based management is characterised by the following aspects:
− Risk capital, i.e. the capital required to cover the risks, is the basis of our value- and risk-based management. The capital requirement corresponds to the solvency capital requirement under Solvency II, as determined on the basis of our certified internal risk model. Information on the internal risk model is provided on page 67 ff. − Consequently, business activities are assessed not only according to their earnings potential, but also relative to the extent of the risks assumed. Only the risk-return relationship reveals how beneficial an activity is from the point of view of our shareholders. − With value-based corporate management tools, we ensure an economic valuation and the comparability of alternative initiatives. − We clearly assign responsibilities and specify the levers for adding value for both management and staff.
Contrasting aspects have to be evaluated when selecting suitable target figures. On the one hand, the often complex economic realities should be reflected as closely as possible in order to emphasise added value as the Group’s overriding guiding principle, on the other hand target figures should be simple and easy to understand for investors, staff, and the public.
The Group’s corporate management tools
Our key corporate management tools at Group level are economic earnings and the IFRS consolidated result.
Economic earnings
The starting point for value-based management is the economic value added in a fixed period which we determine based on the key corporate management tool of economic earnings. These correspond with the change in eligible own funds under Solvency II, adjusted for items that do not represent economic value added in the period – such as capital measures, and the change in regulatory restrictions.
In particular, economic earnings comprise the contribution to profits from our new business, and changes in the value of in-force business against the previous year’s assessment. The development of eligible own funds is also considered because of the effect of changed capital market parameters on the assets and liabilities sides of the solvency balance sheet.
In applying the uniform Group performance-measure-ment model of economic earnings in the individual fields of business, we use conceptually consistent value-based and risk-capital-based measurement approaches that are individually geared to the characteristics of each of the respective businesses. These comprise the adjusted result with a minimum required return on the risk capital for property-casualty reinsurance and the excess return from our investment activity (asset-liability management). In life and health reinsurance, we apply value added by new business and the change in value of in-force business, which are based on the solvency balance sheet. The management tool economic earnings is used directly for ERGO. Group corporate management is designed so that we are in a position to maximise value creation while observing subsidiary parameters.
– ±=Economic earnings
Eligible own funds
31 Dec.
Eligible own funds
1 Jan.
Capital measures, etc.

49
Munich Re Group Annual Report 2018
Combined management reportImportant tools of corporate management
IFRS consolidated result
The IFRS consolidated result is a performance measure derived from our external accounting. It serves as an important cross-line criterion for investors, analysts and the general public to assess corporate performance. With its standardised measurement basis, the IFRS consolidated result can be compared to the results of our market competitors and is thus a management tool used in Munich Re’s financial reporting.
Other performance indicators
Combined ratio
The combined ratio is regularly posted for property-casualty business. Calculated as the percentage ratio of the sum of expenses for claims and benefits plus operating expenses to earned premiums (all of which are net, i.e. after reinsurance cessions), the combined ratio is the sum of the loss ratio and the expense ratio. A combined ratio of 100% means that premium income was exactly sufficient to cover claims and costs. Expenses for claims and benefits mainly include paid claims, the change in claims provisions, and the bulk of other underwriting expenses.2 Operating expenses chiefly comprise the costs arising in the acquisition of new business and for the ongoing administration of insurance contracts.
1 We use the figures set at the beginning of the period in order to calculate RORAC.
2 Expenses for claims and benefits not taken into account in the calculation of the combined ratio are set out on page 122 in the Notes to the consolidated financial statements.
RORAC1 =Net income – Interest rate x (1 – Tax rate) x Additional available economic equity
Capital requirement
For us, the combined ratio by itself is not a sufficiently informative performance measure. It is only of limited suitability for comparing the financial performance of competitors owing to differing calculation methods and portfolio mixes. Generally, we aim to keep the combined ratio as low as possible by means of good underwriting and claims management.
Return on risk-adjusted capital (RORAC)
Munich Re’s value orientation is also reflected in the after-tax return on risk-adjusted capital (RORAC). RORAC is a mixture of accounting ratios and economic indicators. It relates the performance indicator customary in the capital markets (IFRS consolidated result) – which we adjust to eliminate the risk-free return after tax on additional available economic equity – to the necessary capital requirement.
The numerator in the formula comprises the published IFRS net income after deduction of risk-free interest after tax (interest rate x [1 – tax rate]) generated on capital not subject to risk within the given risk tolerance. The latter refers to the additional available economic equity. This corresponds to the surplus of eligible own funds reduced by the subordinated liabilities over the solvency capital requirement multiplied by 1.75. Any excess of liabilities over assets is not taken into consideration.
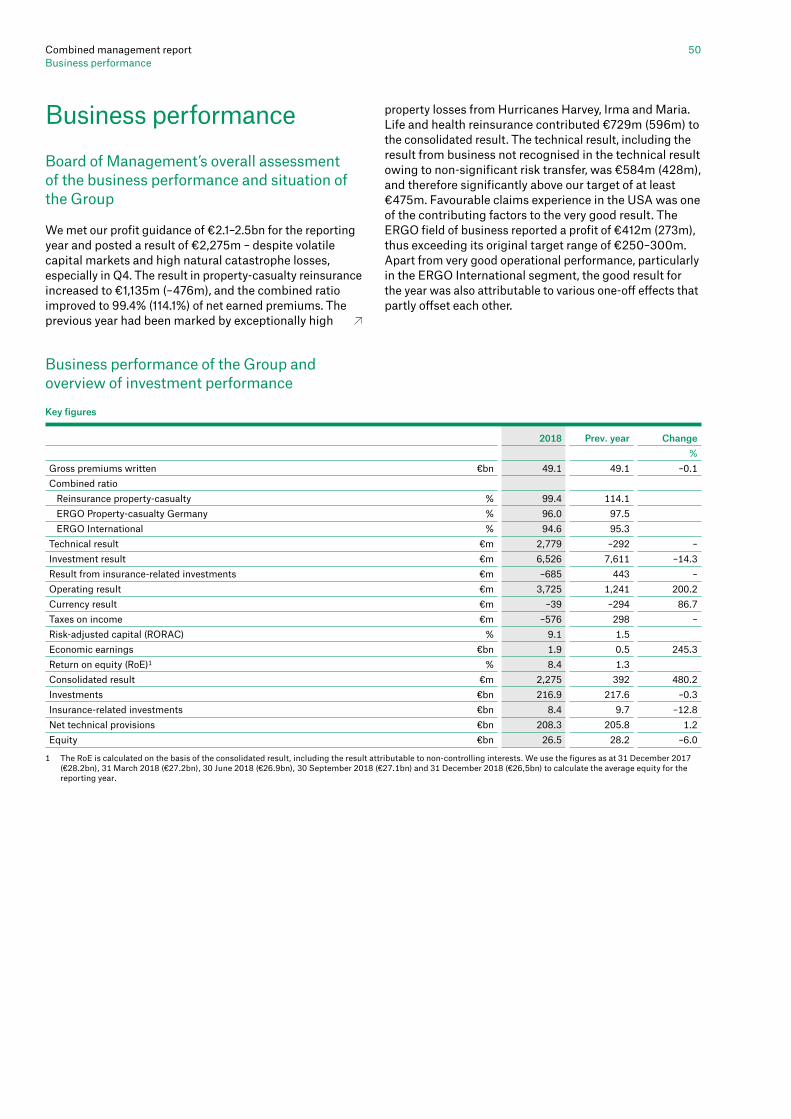
Combined management reportBusiness performance
50
Business performanceBoard of Management’s overall assessment of the business performance and situation of the Group
We met our profit guidance of €2.1–2.5bn for the reporting year and posted a result of €2,275m – despite volatile capital markets and high natural catastrophe losses, especially in Q4. The result in property-casualty reinsurance increased to €1,135m (–476m), and the combined ratio improved to 99.4% (114.1%) of net earned premiums. The previous year had been marked by exceptionally high
property losses from Hurricanes Harvey, Irma and Maria. Life and health reinsurance contributed €729m (596m) to the consolidated result. The technical result, including the result from business not recognised in the technical result owing to non-significant risk transfer, was €584m (428m), and therefore significantly above our target of at least €475m. Favourable claims experience in the USA was one of the contributing factors to the very good result. The ERGO field of business reported a profit of €412m (273m), thus exceeding its original target range of €250–300m. Apart from very good operational performance, particularly in the ERGO International segment, the good result for the year was also attributable to various one-off effects that partly offset each other.
Business performance of the Group and overview of investment performance
5006
1 The RoE is calculated on the basis of the consolidated result, including the result attributable to non-controlling interests. We use the figures as at 31 December 2017 (€28.2bn), 31 March 2018 (€27.2bn), 30 June 2018 (€26.9bn), 30 September 2018 (€27.1bn) and 31 December 2018 (€26,5bn) to calculate the average equity for the reporting year.
Key figures
2018 Prev. year Change %Gross premiums written €bn 49.1 49.1 –0.1Combined ratio
Reinsurance property-casualty % 99.4 114.1 ERGO Property-casualty Germany % 96.0 97.5 ERGO International % 94.6 95.3
Technical result €m 2,779 –292 –Investment result €m 6,526 7,611 –14.3Result from insurance-related investments €m –685 443 –Operating result €m 3,725 1,241 200.2Currency result €m –39 –294 86.7Taxes on income €m –576 298 –Risk-adjusted capital (RORAC) % 9.1 1.5 Economic earnings €bn 1.9 0.5 245.3Return on equity (RoE)1 % 8.4 1.3 Consolidated result €m 2,275 392 480.2Investments €bn 216.9 217.6 –0.3Insurance-related investments €bn 8.4 9.7 –12.8Net technical provisions €bn 208.3 205.8 1.2Equity €bn 26.5 28.2 –6.0
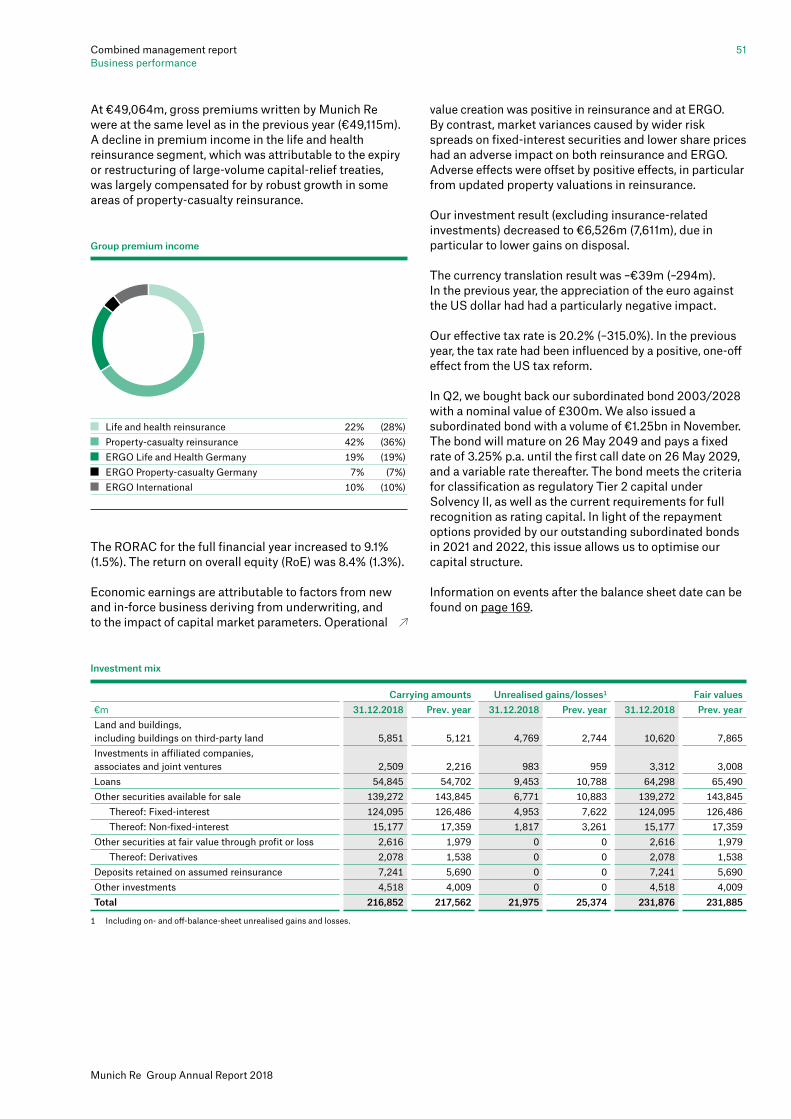
51Combined management reportBusiness performance
Munich Re Group Annual Report 2018
At €49,064m, gross premiums written by Munich Re were at the same level as in the previous year (€49,115m). A decline in premium income in the life and health reinsurance segment, which was attributable to the expiry or restructuring of large-volume capital-relief treaties, was largely compensated for by robust growth in some areas of property-casualty reinsurance.
The RORAC for the full financial year increased to 9.1% (1.5%). The return on overall equity (RoE) was 8.4% (1.3%).
Economic earnings are attributable to factors from new and in-force business deriving from underwriting, and to the impact of capital market parameters. Operational
value creation was positive in reinsurance and at ERGO. By contrast, market variances caused by wider risk spreads on fixed-interest securities and lower share prices had an adverse impact on both reinsurance and ERGO. Adverse effects were offset by positive effects, in particular from updated property valuations in reinsurance.
Our investment result (excluding insurance-related investments) decreased to €6,526m (7,611m), due in particular to lower gains on disposal.
The currency translation result was –€39m (–294m). In the previous year, the appreciation of the euro against the US dollar had had a particularly negative impact.
Our effective tax rate is 20.2% (–315.0%). In the previous year, the tax rate had been influenced by a positive, one-off effect from the US tax reform.
In Q2, we bought back our subordinated bond 2003/2028 with a nominal value of £300m. We also issued a subordinated bond with a volume of €1.25bn in November. The bond will mature on 26 May 2049 and pays a fixed rate of 3.25% p.a. until the first call date on 26 May 2029, and a variable rate thereafter. The bond meets the criteria for classification as regulatory Tier 2 capital under Solvency II, as well as the current requirements for full recognition as rating capital. In light of the repayment options provided by our outstanding subordinated bonds in 2021 and 2022, this issue allows us to optimise our capital structure.
Information on events after the balance sheet date can be found on page 169.
5009Investment mix
Carrying amounts Unrealised gains/losses1 Fair values€m 31.12.2018 Prev. year 31.12.2018 Prev. year 31.12.2018 Prev. yearLand and buildings, including buildings on third-party land 5,851 5,121 4,769 2,744 10,620 7,865Investments in affiliated companies, associates and joint ventures 2,509 2,216 983 959 3,312 3,008Loans 54,845 54,702 9,453 10,788 64,298 65,490Other securities available for sale 139,272 143,845 6,771 10,883 139,272 143,845
Thereof: Fixed-interest 124,095 126,486 4,953 7,622 124,095 126,486Thereof: Non-fixed-interest 15,177 17,359 1,817 3,261 15,177 17,359
Other securities at fair value through profit or loss 2,616 1,979 0 0 2,616 1,979Thereof: Derivatives 2,078 1,538 0 0 2,078 1,538
Deposits retained on assumed reinsurance 7,241 5,690 0 0 7,241 5,690Other investments 4,518 4,009 0 0 4,518 4,009Total 216,852 217,562 21,975 25,374 231,876 231,885
1 Including on- and off-balance-sheet unrealised gains and losses.
Group premium income
Life and health reinsurance 22% (28%) Property-casualty reinsurance 42% (36%) ERGO Life and Health Germany 19% (19%) ERGO Property-casualty Germany 7% (7%) ERGO International 10% (10%)

Combined management reportBusiness performance
52
bonds. We mainly reduced our bond holdings from issuers in the USA, Germany, Italy and Spain in the reporting year. The purchase of government bonds from emerging markets is part of our balanced investment strategy. The share of these bonds came to 9.6% of our portfolio of government bonds; the share of Argentinian and Turkish government bonds came to a total of 0.3%.
The emphasis of our investment in covered bonds remained on German securities, with around 38%. We also held bonds from France (20%) and the United Kingdom (8%) in our portfolio.
The regional weighting of corporate bonds in our portfolio is 33% for the USA and 39% for the eurozone.
Our portfolio of government bonds, covered bonds and corporate bonds had a good rating structure: as at 31 December 2018, some 84% of securities were rated AAA to A.
Our investment in bank bonds is limited, and was further reduced in the course of the year. The share in our overall portfolio of interest-bearing securities was 2% at the reporting date. Financial instruments from states in southern Europe made up 3% of this portfolio. Most of our bank bonds were senior bonds (80%), i.e. bonds that are not subordinated or subject to loss participation. Subordinated bonds and loss-bearing bonds made up 20% of our bank bond holdings.
The portfolio of structured credit products at fair value increased slightly as a result of acquisitions, and totalled 2% of the overall portfolio of interest-bearing securities as at the reporting date. This asset class involves securitised receivables (asset-backed securities or mortgage-backed securities), e.g. securitisations of real estate finance, consumer credit or student loans. Around 56% of our structured credit products have a rating of AAA.
Our equity portfolio decreased due to disposals and market developments. We responded to the significant increase in volatility in Q4 by scaling back our portfolio and ratcheting up the derivatives used for hedging purposes. Our equity-backing ratio (before taking derivatives into account, and including investments in affiliated companies, associates and joint ventures at fair value) came to 6.2% (7.3%) at the end of the year. The equity-backing ratio including derivatives came to 5.2% (6.7%). We also protect ourselves against accelerated inflation in an environment of continuing low interest rates by holding inflation-linked bonds with a fair value of €7.6bn (8.5bn). Real and financial assets such as shares, property, commodities, and investments in infrastructure, renewable energies and new technologies also serve to guard against inflation. Additionally, our investments in real and financial assets have a positive diversification effect on the entire portfolio.
The fair value of our investment portfolio remained largely unchanged as against the previous year. Increasing risk spreads on fixed-interest securities, the reduction in our share portfolio through disposals and negative market development had a negative impact on value. This was compensated for by the development of exchange rates, the increase in the fair value of property due to updated fair value assumptions and higher deposits retained on assumed reinsurance.
The higher level of risk spreads and the realisation of valuation reserves were chiefly responsible for the decline in net unrealised gains on loans and other fixed-interest securities available for sale. The valuation reserves on equities decreased primarily due to negative market development.
We expanded our portfolio of corporate bonds in the reporting year, but decreased our investments in government bonds and bank bonds.
At the reporting date, over half of our portfolio of interest-bearing securities was invested in government bonds. The vast majority of these continue to come from countries with a high credit rating. The fair value of our German and US government bond holdings came to 13.4% (13.8%) and 8.3% (8.7%) of the portfolio of interest-bearing securities. Italian and Spanish government bonds each accounted for around 1.1% (1.6%) and 2.0% (2.3%) of the portfolio of interest-bearing securities. Our new investments in the reporting year were above all in Australian government
Total: €198bn (199bn)
Fixed-interest portfolio by economic category1
1 Presentation essentially shows fixed-interest securities and loans, including deposits and cash at banks, at fair value. The approximation is not fully comparable with IFRS figures.
2 Including other public-sector issuers and government-guaranteed bank bonds.
Government bonds2 53% (54%) Thereof: Inflation-linked bonds 7% (8%)
Covered bonds 23% (23%) Corporate bonds 12% (11%) Cash other 5% (4%) Structured products (credit structures) 2% (2%) Bank bonds 2% (2%) Policy and mortgage loans 4% (3%)

53Combined management reportBusiness performance
Munich Re Group Annual Report 2018
Result from equities and equity derivatives1
€m 2018 Prev. yearRegular income 614 606Write-downs –964 –133Realised gains/losses 739 886Result from equities 389 1,359Change in on-balance-sheet unrealisedgains and losses in equity (gross) –1,444 337Result from equity derivatives 341 –363Total –714 1,333
1 To determine the total annualised return on our equity portfolio (see text), we calculate the ratio of the total result shown in the table and the mean value of the following figures: Equity portfolio (carrying amounts) as at 31 December 2017 (€17,359m), 31 March 2018 (€16,911m), 30 June 2018 (€16,795m), 30 September 2018 (€18,151m) and 31 December 2018 (€15,177m).
The return on equities was buffeted by market developments in the financial year. The total return on our equity portfolio including equity derivatives decreased to –4.2% (8.0%).
Regular income increased slightly on the previous year, primarily due to higher income from rent and higher interest income from deposits retained on assumed reinsurance. The average reinvestment yield increased to 2.2% (1.9%) in the financial year. Due to the low interest rate level in the reporting year, yields on new investments remained lower than the average return on our existing portfolio of fixed-interest investments.
We posted higher net write-downs of non-derivative investments than in the previous year, in particular of our equity portfolio, which was affected by heavy price falls on the stock markets, especially in the fourth quarter of the year.
Net gains on disposal were lower than in the previous year, and chiefly came from our portfolio of fixed-interest securities. This is attributable to the significant decrease in the ERGO Life and Health Germany segment, which in the previous year had required higher gains on disposal to finance the additional interest reserve.
We posted a net gain from write-ups and write-downs of derivatives and from the disposal of derivatives. This was primarily due to gains on equity derivatives, which counterbalanced losses on interest, commodity and credit derivatives.
1 Details of the result by type of investment are shown on page 157 in the Notes to the consolidated financial statements.2 Annual % return on the mean value of the investment portfolio measured at market value as at the quarterly reporting dates. The overall investment portfolio used to
determine the return for 2018 (2.8%) is calculated as the mean value of the investment portfolios (carrying amounts) as at 31 December 2017 (€217,562m), 31 March 2018 (€216,201m), 30 June 2018 (€217,546m), 30 September 2018 (€216,950m) and 31 December 2018 (€216,852m), and the off-balance-sheet unrealised gains and losses (excluding owner-occupied property and insurance-related loans) as at 31 December 2017 (€14,323m), 31 March 2018 (€13,580m), 30 June 2018 (€13,604m), 30 September 2018 (€14,321m) and 31 December 2018 (€15,024m).
Investment result1
2018 Return2 Prev. year Return2
€m % €m %Regular income 6,586 2.8 6,438 2.7Write-ups/write-downs of non-derivative investments –1,054 –0.5 –241 –0.1Gains/losses on the disposal of non-derivative investments 1,582 0.7 2,494 1.1Net balance of derivatives 103 0.0 –470 –0.2Other income/expenses –691 –0.3 –609 –0.3Total 6,526 2.8 7,611 3.2

Combined management reportBusiness performance
54
Reinsurance – Life and health
Key figures
2018 Prev. year Change %Gross premiums written €m 10,849 13,726 –21.0Share of gross premiums written in reinsurance % 34.7 43.5 Technical result incl. result from reinsurance treaties with insufficient risk transfer €m 584 428 36.6Investment result €m 988 865 14.2Operating result €m 930 708 31.5Consolidated result €m 729 596 22.3
Premium
We write the majority of our business in non-euro currencies (around 85%). Exchange-rate fluctuations therefore have a significant impact on premium development. If exchange rates had remained unchanged, our premium income would have fallen by 18.0%. Disregarding currency translation effects, the decrease was chiefly attributable to the planned termination and/or conversion of two large-volume structured reinsurance treaties. Excluding these two treaties, our premium volume would have increased, partly reflecting the persistently high demand for financially motivated reinsurance. Geographically speaking, growth was spread across Europe, Asia and the USA.
Result
At €503m, the technical result was significantly higher than in the previous year (€376m), and thus in excess of our expectations for 2018.
The main reason for this positive development was favourable claims experience overall, mainly on account of mortality business in the USA. By contrast, claims expenditure in Canada was slightly higher than anticipated owing to what can be assumed to be random fluctuations.
As in the previous year, Australian disability business saw increased claims expenditure, which we took into account by strengthening our provisions for outstanding claims. Furthermore, we expect a planned change in legislation to adversely impact our Australian business. In order to make allowance for the foreseeable effects this will have, we have written off part of our deferred acquisition costs. The aforementioned negative developments were largely offset by net positive reserving effects in other portions of the portfolio, including reserve releases in health reinsurance in particular. The result also benefited from the development of new business.
One-off business effects balanced each other out: run- off profits were generated from the recapture of a treaty in Europe, whilst the technical result was adversely impacted by the sale of group life specialist Ellipse in the United Kingdom. However, including the non-technical components, the consolidated result benefited overall from this sale.
The result from the part of the business that is not posted in the technical result as a consequence of non-significant risk transfer continued to develop in a very satisfying manner. At €81m, it was significantly higher than the previous year’s level (€51m).
The investment result was up €123m on the previous year, mainly on account of higher gains on the disposal of fixed-interest securities and a positive one-off effect from the sale of Ellipse in the fourth quarter.
Our individual core markets
Based on premium volume, around 40% of our global reinsurance business is written in North America, with the USA (around 25%) ranking before Canada (around 15%). Some 25% of our premium comes from Europe, with approximately 10% generated in the United Kingdom and about 5% in Germany. Further substantial shares derive from Asia (around 25%) and Australia/New Zealand (approximately 10%). Our activities in the MENA region are ascribed to Asia. We are also well positioned in Africa and Latin America, but due to the small size of these markets, their share of our global business is modest (less than 5% in total).
Premium income in Europe increased to €2.7bn (2.3bn), of which €1.2bn (1.2bn) was from the United Kingdom, and a further €676m (381m) from Germany. The technical result continued to develop at a very pleasing level. Run-off profits were generated from the recapture of a treaty, whilst the technical result was negatively impacted at a comparable level by the sale of group life specialist Ellipse

55Combined management reportBusiness performance
Munich Re Group Annual Report 2018
Reinsurance – Property-casualty
Premium
Premium income in property-casualty reinsurance increased by 14.5% compared with the previous year. Changes in exchange rates had a negative impact on premium development. Approximately 11% of the portfolio is written in euros and 89% in foreign currency, of which 52 percentage points is in US dollars and 13 percentage points in pounds sterling. If exchange rates had remained the same, premium volume would have risen by 19.0% year on year.
The substantial increase in premium volume was due to an expansion of business across almost all lines and regions. Key drivers included growth of existing and new business with selected clients in North America, a new
large-volume reinsurance quota share treaty in Australia, and selective growth in India and China. Motor, fire, liability and marine business were the main sources of growth.
The renewals for reinsurance treaties in 2018 saw prices rise in regions affected by natural catastrophes. In other markets and lines of business, prices remained stable or increased slightly. Despite the high losses from natural catastrophes in 2017, the supply of reinsurance capacity remained high during the 2018 renewals. While prices had fallen in the previous year, they rose by approximately 0.8% in the 2018 renewals. A higher interest-rate level compared with the previous year further strengthened the profitability of our business. Overall, we are adhering to our profit-oriented underwriting policy.
Key figures
2018 Prev. year Change %Gross premiums written €m 20,437 17,843 14.5Share of gross premiums written in reinsurance % 65.3 56.5 Loss ratio % 65.2 80.6
Thereof: Major losses Percentage points 11.6 25.8 Expense ratio % 34.2 33.5 Combined ratio % 99.4 114.1 Technical result €m 1,250 –1,261 –Investment result €m 1,555 1,895 –17.9Operating result €m 1,534 –635 –Consolidated result €m 1,135 –476 –
in the United Kingdom. Overall, however, this sale had a positive effect on the consolidated result.
In the USA, gross premium remained largely constant at €2.8bn (2.8bn), despite the adverse effect of currency exchange rates. We therefore continue to be one of the most important reinsurers in this market, which is the largest worldwide. The technical result was significantly up on the previous year and also gratifyingly higher than we expected – mainly thanks to favourable claims experience overall, particularly in mortality business, and positive reserving effects from health business in the process of being run off. We continue to be very satisfied with the development of our new business, both in terms of volume and profitability.
In Asia, which also comprises business written in the MENA region, our premium income climbed to €2.6bn (2.1bn). New business continued to develop very well. Thanks to our broad diversification, we are in a position to benefit from the growth potential in the region. The technical result was good, and in line with expectations.
We posted a significant decline in premium income to €1.5bn (5.1bn) in Canada, mainly owing to the planned termination and/or conversion of two large-volume structured reinsurance treaties. In traditional business, we were able to retain our leading market position. The technical result was somewhat lower than expected, but still accounts for a disproportionately large contribution to the overall result.
Premium generated by our business in Australia and New Zealand remained largely constant at €827m (850m). We continue to apply a very restrictive underwriting policy in the Australian market, as major parts of disability business still do not meet our profitability requirements. Our main focus here is on the rehabilitation of our existing portfolio. Claims expenditure in this market exceeded our expectations, and we have adjusted our provision for outstanding claims as a consequence. In addition, given the expected impact of planned changes in the applicable law, we have written off part of our deferred acquisition costs. On balance, we therefore posted a negative technical result.

Combined management reportBusiness performance
56
Result
The consolidated result and the operating result in property-casualty reinsurance improved compared with the previous year. Expenditure for major losses was down, and the technical result increased compared with the severely hurricane-affected 2017. Adjusted for commissions, Munich Re’s customary review of provisions resulted in a reduction in the basic claims provisions for prior years of around €860m for the full year, which is equivalent to around 4.6 percentage points of the combined ratio. This positive development related to almost all lines in our portfolio. The safety margin in the provisions remained unchanged year on year.
Major losses – in excess of €10m each – totalled €2,152m (4,314m) in 2018, after retrocession and before tax. This amount includes run-off profits and losses for major claims from previous years, and is equivalent to 11.6% of net earned premium. It is much lower than in the previous year, and also slightly below our major-loss expectation of 12% of net earned premium.
Aggregate losses from natural catastrophes totalled €1,256m (3,678m) for the full year. This figure is equivalent to 6.7% (22.0%) of net earned premium. The biggest loss events of the year were Hurricanes Florence and Michael in the USA, for which we expect a total expenditure of around €560m, and Typhoons Jebi and Trami in Japan, with expected losses in the region of €540m. Two major wildfires in California in November 2018 caused additional losses of approximately €430m.
At €896m, man-made major losses were up on the previous year (€636m). This figure is equivalent to 4.8% (3.8%) of net earned premium. The number of losses above the major-loss threshold was randomly higher than in previous years. The most expensive individual loss resulted from structural damage to a hydroelectric power station in Colombia.
The combined ratio saw a significant improvement to 99.4% (114.1%) thanks to lower major-loss expenditure in 2018. Paid claims and the change in claims provisions totalled €12,132m (€13,474m), along with net operating expenses of €6,372m (€5,600m), compared to net earned premiums of €18,618m (16,723m).
The investment result was down €340m on the previous year, largely due to higher write-downs of shares because of falling equity markets.
Our individual core markets and selected special linesBased on premium volume, around 45% of our global property-casualty reinsurance business – including Risk Solutions – is written in North America (including Canada). Around 35% of our premium comes from Europe, of which more than half is generated in the United Kingdom. Further substantial shares are contributed by Asia (about 10%), Australia/New Zealand (approximately 5%) and Latin America (approximately 5%).
In the US market, we continued to grow our existing reinsurance business with selected clients and, in addition, wrote profitable new business in the past financial year. Consequently, as in the previous year, Munich Reinsurance America Inc. increased its premium volume to €4,384m (3,409m). Reinsurance prices improved in the wake of loss events in the previous year. The year’s results were again negatively affected by Hurricanes Florence and Michael. In addition, other natural hazard events such as the wildfires in California, local hail events and tornadoes also had an impact on the results.
Premium income at Hartford Steam Boiler Group (HSB Group) amounted to €950m (968m). Here, we are expanding our product range of Internet of Things (IoT) insurance solutions, and through the acquisition of Relayr have considerably enhanced our know-how. American Modern posted premium income of €1,032m (1,131m).
In Canada, we are represented in the area of non-life business by the Munich Reinsurance Company of Canada and Temple Insurance Company. At €313m (284m), premium volume saw a gratifying increase thanks to the expansion of attractive business.
European business is dominated by property business and UK motor business. In the United Kingdom, premium volume was up at €3,588m (3,210m). This increase was mainly attributable to the expansion of our business relationships with strategic clients. In Continental Europe, premium volume increased moderately despite the difficult market environment. Targeted growth of business, for instance in France, and alternative capital solutions more than offset the decline from our consistent cycle- and profitability-oriented portfolio management in traditional reinsurance.
At our Swiss subsidiary New Reinsurance Company Ltd. (New Re), business volume in the area of property-casualty increased by 6% to €608m in the 2018 financial year.
In Germany, we succeeded in keeping premium income largely stable at €612m (646m) in 2018 – despite the still-challenging market environment.

57Combined management reportBusiness performance
Munich Re Group Annual Report 2018
In Australia and New Zealand, we significantly grew our reinsurance business to €1,210m (698m) by providing a large-volume, multi-year proportional reinsurance solution for a major client.
Premium income in Japan was slightly up on the previous year; it totalled €336m (281m).
In China, premium volume grew strongly to €822m (615m) year on year as a result of organic growth and selective expansion of business.
In India, we continued to expand our business in 2018, and premium income increased to €206m (120m). Thanks to our local branch, we are well positioned to successfully participate in the expected future growth potential.
In the Caribbean, Central and South America, we still provide high capacity for the coverage of natural hazards, in particular windstorm and earthquake. We were able to hold our strong market position with stable premium volume of €1,052m (1,050m), benefiting from higher prices and thus improved margins in the wake of the previous year’s windstorm events.
At €440m (756m), premium income in agricultural business was down by 42% because we did not renew the business with one major client. The combined ratio improved year on year as a result of more favourable claims experience.
In marine business, total premium volume was up around 15% to €884m (766m), supported by a positive market environment. In addition, the combined ratio improved.
At €657m (634m), credit and bond reinsurance saw a slight increase in premium volume compared with the previous year. The pressure on rates in traditional credit business was offset by profitable new business in specialty and niche segments.
Owing to a positive market environment, premium income in direct industrial business, which we operate in our Corporate Insurance Partner unit, rose to €554m (431m). At the same time, the result was impacted by high major losses.
In aviation and space business, premium income remained largely unchanged at €504m (502m).
The Capital Partners unit offers our clients a broad spectrum of structured, individual reinsurance and capital market solutions. We also use this unit’s services for our own purposes in order to buy retrocession cover on the basis of our defined risk strategy. In the year under review, we structured client transactions worth US$ 200m. In addition, Capital Partners placed a sidecar transaction amounting to US$ 300m (Eden Re II Ltd., Series 2018-1) in the capital markets for its own purposes.

Combined management reportBusiness performance
58
ERGO Life and Health Germany
Premium
Approximately 55% of the segment’s premium income derives from the Health Germany division, around 34% from Life Germany and approximately 11% from German direct business.
In the ERGO Life and Health Germany segment, total premium income and gross premiums written were up in the 2018 financial year. Growth originated from Health Germany and German direct business. The main contributors were travel insurance in Health Germany, and supplementary dental insurance in German direct business. As expected, total premium income and gross premiums written were down on the previous year in the Life Germany division.
Result
The technical result generated by the ERGO Life and Health Germany segment was significantly higher than in the previous year. The increase resulted in part from Life Germany owing to a one-off effect from changed assumptions about profit appropriation. The investment result fell year on year, chiefly owing to lower gains on disposals. A one-off effect from changes in the tax valuation of registered bonds had a positive effect. Overall, both the operating result and the consolidated result improved significantly.
Development of premium income and results by segmentFor the ERGO Life and Health Germany segment, more detailed information about German life, health and direct business is provided below.
Life Germany
The decline in total premium income and gross premiums written was mainly attributable to lower single-premium income. New life business did not compensate for the decline in regular premium income from traditional life business caused by the planned reduction of the portfolio. In terms of annual premium equivalent (APE, i.e. regular premium income plus one-tenth of single-premium volume), which is the performance measure customary among investors, our new business volume dropped by 4.3% compared with the previous year.
1 Total premium income includes not only gross premiums written, but also savings premiums for unit-linked life insurance and capitalisation products in accordance with the applicable statutory accounting guidelines.
Key figures
2018 Prev. year Change €m €m %Total premium income1 3,433 3,525 –2.6Gross premiums written 2,831 2,865 –1.2Technical result 216 112 92.4Operating result 407 314 29.8
1 Total premium income includes not only gross premiums written but also savings premiums for unit-linked life insurance and capitalisation products in accordance with the applicable statutory accounting guidelines.
Key figures
2018 Prev. year Change %Total premium income1 €m 9,974 9,902 0.7Gross premiums written €m 9,345 9,210 1.5Share of gross premiums written by ERGO % 52.6 52.5 Technical result €m 633 435 45.5Investment result €m 3,502 4,196 –16.5Operating result €m 790 705 12.2Consolidated result €m 264 175 50.3

59Combined management reportBusiness performance
Munich Re Group Annual Report 2018
The rise in the technical result was partly due to lower claims expenditure and higher premium income. At €1,236m (1,384m), the investment result saw a decline. Negative contributing factors chiefly included lower gains on disposals and higher write-downs. Altogether, the operating result was slightly lower than in the previous year.
German direct business
Total premium income and gross premiums written increased year on year, in particular on account of growth of 8.9% in health insurance, mainly from supplemental dental plans. Gross premiums written in property-casualty business were also up, by 7.5%. As expected, total premium income and gross premiums written in life insurance respectively decreased by 4.9% and 3.9% compared with the previous year. The decline was chiefly attributable to lower regular premiums in lump-sum life insurance. By contrast, in terms of annual premium equivalent, the volume of new life business grew slightly by 2.1% compared with the previous year.
At 84.9% (82.0%), the 2018 combined ratio for property-casualty business was up 2.9 percentage points on the previous year, but remained at a very good level.
The technical result was slightly higher than in the previous year. The investment result saw a decline to €94m (114m), owing in particular to lower gains on disposals. Altogether, the operating result remained almost stable year on year.
1 Total premium income includes not only gross premiums written but also savings premiums for unit-linked life insurance and capitalisation products in accordance with the applicable statutory accounting guidelines.
Key figures
2018 Prev. year Change €m €m %Total premium income1 1,093 1,057 3.4Gross premiums written 1,066 1,025 4.0Technical result 90 84 7.5Operating result 59 61 –3.2
1 The annual premium equivalent corresponds to the regular premium income plus 10% of single-premium volume.
New business direct life Germany
2018 Prev. year Change €m €m %Regular premiums 27 25 4.6Single premiums 23 29 –19.6Total 50 54 –8.2Annual premiumequivalent1 29 28 2.1
The technical result substantially increased year on year, chiefly thanks to a one-off effect from changed assumptions about profit appropriation. In the past financial year, the investment result totalled €2,172m (2,699m); this decline was mainly attributable to lower gains on disposals. To finance the additional interest reserve (ZZR – to be built up only in single-entity financial statements under German GAAP), we realised lower gains on the disposal of investments compared with 2017. This was mainly on account of the relief as regards allocations to the additional interest reserve brought about by changes in calculation rules (corridor method). On balance, the operating result saw a substantial increase.
Health Germany
In the Health Germany division, gross premiums written in 2018 were up on the previous year. Premiums showed year-on-year growth of 2.3% in supplementary health insurance, and remained approximately at the previous year’s level (–0.4%) in comprehensive health insurance. Growth in supplementary health insurance largely benefited from the performance of business not similar to life insurance (+12.5%). The development in comprehensive health business was partly attributable to a reduced portfolio. In travel insurance, gross premiums written were up 24.8% to €579m (464m). Contributing factors included organic growth and the integration of the non-German company Globality S.A., which formerly transacted international health business, in the first quarter of 2018.
1 The annual premium equivalent corresponds to the regular premium income plus 10% of single-premium volume.
New business Life Germany
2018 Prev. year Change €m €m %Regular premiums 184 178 3.2Single premiums 405 563 –28.1Total 589 741 –20.6Annual premiumequivalent1 224 235 –4.3
Key figures
2018 Prev. year Change €m €m %Total premium income 5,448 5,320 2.4Gross premiums written 5,448 5,320 2.4Technical result 326 239 36.7Operating result 324 330 –1.8

Combined management reportBusiness performance
60
ERGO Property-casualty Germany
Premium
As regards the segment’s premium income, our most important classes of business are motor insurance and fire and property insurance, which respectively account for around 20% and 19% of gross premiums written.
Gross premiums written developed favourably year on year, mainly on account of growth of 10.0% in the other classes of business. These included marine, where underwriting agent business developed positively, and engineering insurance, which saw an increase in new business. Fire and property insurance posted an increase of 7.4% in gross premiums written, mainly on account of growth in commercial building insurance, and positive development of our homeowners’ insurance portfolio. By contrast, in motor insurance and personal accident insurance we posted slightly lower premium income than in 2017, with decreases of 0.7% and 1.9% respectively.
Result
The technical result in the ERGO Property-casualty Germany segment was up on the previous year. Overall, major-loss expenditure from natural catastrophes in the past financial year remained within normal bounds. Beyond this, claims experience was favourable in our core business. At the beginning of the reporting year, natural catastrophe losses, particularly those from Winter Storm Friederike, had exceeded expectations.
The combined ratio for 2018 was 1.6 percentage points lower than in the previous year. While the loss ratio improved considerably, mainly on account of a higher run-off result, the cost ratio remained roughly at the same level as in the previous year. Paid claims and the change in claims provisions totalled €2,033m (€2,053m), along with net operating expenses of €1,087m (€1,072m), compared to net earned premiums of €3,252m (3,204m).
The investment result was down on the previous year, chiefly on account of lower gains from the disposal of equities and interest-bearing investments, and a decline in regular income.
The decline in the segment result was attributable to the lower investment result.
Key figures
2018 Prev. year Change %Gross premiums written €m 3,377 3,293 2.5Share of gross premiums written by ERGO % 19.0 18.8 Loss ratio % 62.5 64.1 Expense ratio % 33.4 33.5 Combined ratio % 96.0 97.5 Technical result €m 166 138 19.6Investment result €m 133 185 –28.0Operating result €m 228 244 –6.4Consolidated result €m 45 57 –21.5

61Combined management reportBusiness performance
Munich Re Group Annual Report 2018
ERGO International
Result
The technical result in the ERGO International segment improved significantly year on year. The reasons for this positive development were quantitative growth in Polish motor business, the positive effects of price adjustments in this field of business in 2017, and a higher technical result in Belgian life insurance business due to the absence of negative one-off effects.
In international property-casualty business, the combined ratio improved by 0.6 percentage points year on year. Improvement was especially pronounced in Poland (–2.3 percentage points), where business benefited from price adjustments, and in international legal protection business in the United Kingdom (–3.3 percentage points). The combined ratio also improved in international health business (–2.9 percentage points). Paid claims and the change in claims provisions totalled €2,047m (€2,060m), along with net operating expenses of €1,068m (€1,022m), compared to net earned premiums of €3,292m (3,236m).
The investment result was down on the previous year, chiefly on account of lower gains on disposals that partly resulted from losses on the disposal of shareholdings.
The increase in the consolidated result was mainly attributable to the higher technical result.
1 The annual premium equivalent corresponds to the regular premium income plus 10% of single-premium volume.
New business Life International
2018 Prev. year Change €m €m %Regular premiums 36 74 –51.7Single premiums 140 262 –46.6Total 176 336 –47.7Annual premiumequivalent1 88 100 –12.5
Premium
With regard to the segment’s premium income, property-casualty insurance accounts for around 53%, health for about 26% and life insurance for approximately 21%. Our biggest markets include Poland, accounting for approximately 28% of the premium volume, Belgium (approx. 19%) and Spain (approx. 15%).
Despite a streamlined international portfolio, total premium income and gross premiums written remained almost at the same level compared with the previous year, bolstered by growth in international property-casualty business. Adjusted to eliminate negative currency translation effects, gross premiums written in the ERGO International segment would have increased by 1.7% compared with the previous year.
In international property-casualty business, we posted gross premiums written of €2,840m, up 2.0% compared with the previous year (€2,783m). At 11.0%, growth was especially strong in Poland, our largest market. We also increased our premium volume in the Baltic States and Austria.
In international health business, gross premiums written were down 2.2% to €1,374m (1,405m), partly due to the reallocation of Globality S.A.; by contrast, we posted higher premium income in our two major markets Spain and Belgium.
At €843m (855m), gross premiums written in international life insurance business were down on the previous year by 1.4%. This was partly due to developments in Belgium, where we deliberately stopped writing new business in the middle of 2017. Total premium income in international life insurance business was down 3.5% to €1,123m (1,164m).
1 Total premium income includes not only gross premiums written but also savings premiums for unit-linked life insurance and capitalisation products in accordance with the applicable statutory accounting guidelines.
Key figures
2018 Prev. year Change %Total premium income1 €m 5,337 5,352 –0.3Gross premiums written €m 5,057 5,043 0.3Share of gross premiums written by ERGO % 28.4 28.7 Loss ratio % 62.2 63.7 Expense ratio % 32.5 31.6 Combined ratio % 94.6 95.3 Technical result €m 228 20 >1,000.0Investment result €m 348 470 –26.0Operating result €m 242 219 10.3Consolidated result €m 103 40 156.3

62Combined management reportFinancial position
Financial position Analysis of our capital structure
Our primary insurance and reinsurance operations have a significant influence on the structure of our balance sheet: as we have consistently geared our Group towards value creation in its core business, investments serve to cover technical provisions (79% of the balance sheet total). Equity (10% of the balance sheet total) and bonds classified as strategic debt (1% of the balance sheet total) are the most important sources of funds.
Development of Group equity
31.12.2018 Prev. year Change €m €m %Issued capital and capital reserve 7,418 7,418 0.0Retained earnings 13,201 15,036 –12.2Other reserves 3,440 5,183 –33.6Consolidated resultattributable to equity holders of MunichReinsurance Company 2,310 375 515.4Non-controlling interests 131 186 –29.8Total 26,500 28,198 –6.0
Group equity was lower than at the beginning of the year. This is attributable in particular to the dividend payment, share buy-back programme and decline in the valuation reserves for fixed-interest securities on account of increased risk spreads. This decline was partly counterbalanced by our consolidated result and a higher currency translation reserve.
Strategic debt
We define as strategic debt all financial instruments with the character of outside financing that do not have a direct link to our operative business. Strategic debt supplements our financial resources, is essentially designed to optimise the cost of capital, and ensures that we have sufficient liquidity at all times. We quantify our debt leverage to make our capital structure transparent. Debt leverage is defined as the ratio – expressed as a percentage – of strategic debt to the sum of Group equity and strategic debt. Our technical provisions are not considered, even though they are mostly available to us on a long-term basis as a source of financing for investment.
Debt leverage
31.12.2018 Prev. year Change €m €m %Strategic debt1 4,015 3,125 28.5Group equity 26,500 28,198 –6.0Total 30,515 31,323 –2.6
Debt leverage % 13.2 10.0
1 The main components of our strategic debt are subordinated liabilities, and bonds and notes issued (see pages 144 and 153 of the Notes to the consolidated financial statements).
Under the supervisory regulations of Solvency II, subordinated liabilities are recognised as own funds provided that they are available at all times to cover losses on a going-concern basis. Munich Re’s subordinated liabilities amount to €3,689m. Of this sum, €3,643m were recognised as at the reporting date as eligible own funds pursuant to Solvency II. As a consequence, strategic debt is reduced to €372m and the debt leverage amounts to only 1.2%.
Technical provisions
Reinsurance business accounts for approximately 35% of technical provisions; around 65% comes from primary insurance. In contrast to liabilities under loans and securities issued, we cannot foresee with certainty how high our liabilities from underwriting business will be and when they will arise. This applies especially to reinsurance. Whereas in property insurance a major portion of the provisions is generally paid out within two to three years, in life or liability insurance substantial amounts may still be due decades after the contracts were concluded. The currency distribution of our provisions reflects the global orientation of our Group. Besides the euro, our main currencies are the US dollar, pound sterling, the Canadian dollar and the Australian dollar.
Restraints on disposal
Since we are an international (re)insurance group, some of our financial resources are subject to restraints on disposal. Supervisory authorities in some countries, for example, require foreign reinsurers to establish premium and reserve deposits to the benefit of primary insurers, or set up trustee accounts or guarantees with certain financial institutions. At the reporting date, this involved investments with a volume of €9.2bn (8.8bn). In addition, there were contingent liabilities. Information on these can be found on page 167 in the Notes to the consolidated financial statements.

63
Munich Re Group Annual Report 2018
Combined management reportFinancial position
Information in accordance with Sections 315a(1) and 289a(1) of the German Commercial Code (HGB) and explanatory report of the Board of Management
Composition of the subscribed capital As at 31 December 2018, Munich Reinsurance Company’s share capital of €587,725,396.48 was divided into 149,538,477 registered, no-par-value, fully paid shares. The rights and obligations deriving from these shares follow from the applicable statutory requirements and the Company’s Articles of Association. With respect to the Company, the only parties deemed shareholders in accordance with Section 67 of the German Stock Corporation Act (AktG) are those entered as such in the Company’s register of shareholders.
Restrictions on voting rights and the transfer of sharesThe listed registered shares are subject to transfer restrictions. The issuing of restrictedly transferable registered shares by Munich Reinsurance Company dates back to the Company’s foundation in 1880. Restricted transferability means that these shares may be transferred to another holder only with the Company’s consent, which, according to Article 3(2) of Munich Reinsurance Company’s Articles of Association, is granted at the Company’s discretion. Since the share-trading processes have been made very efficient, the consent requirement does not lead to any delays in entry in the register. In recent decades, it has been granted without exception. Contractual agreements are in place with the members of the Board of Management providing for two or four-year minimum holding periods for the shares of the Company they have to purchase as part of share-based remuneration programmes under the remuneration system applicable prior to 2018.
Each share carries one vote at the Annual General Meeting and determines the shareholders’ participation in the Company’s profit. This excludes own shares held by the Company, from which it enjoys no rights. In the cases specified in Section 136 of the Stock Corporation Act, voting rights from the shares concerned are excluded by law. If shareholders are entered under their own name for shares which belong to a third party and exceed at this time the upper limit of 2% of the share capital as stated in the Articles of Association, pursuant to Article 3(5) of the Articles of Association the shares entered shall not carry any voting rights.
Shareholdings exceeding 10% of the voting rights
Munich Reinsurance Company has not been notified, nor has it otherwise learned, about any direct or indirect shareholdings in the Company that exceeded 10% of the voting rights as at 31 December 2018.
Shares with special control rights
There are no shares with special control rights.
Capital position
Through active capital management, we strive to ensure that Munich Re’s capital satisfies all applicable standards. In addition to the capital requirements determined using our internal risk model, more far-reaching requirements by regulatory authorities, rating agencies and our key insurance markets must be met. The Solvency II ratio is a fundamental measure of Munich Re’s capital strength. Further information on this ratio can be found on page 73 in the risk report. We aim to ensure that our financial strength is such that it enables us to take advantage of profitable opportunities for growth, is not significantly affected by normal fluctuations in capital market conditions, and remains at a reasonable level even in the wake of major loss events or substantial falls in the stock markets. At the same time, we also define an appropriate level of Group own funds as one which does not lastingly exceed that which is required. Excess capital is returned to our shareholders via dividends and share buy-backs. In practice, capital repatriation comes up against limits because German commercial law (the German Commercial Code; HGB) forces our parent, Munich Reinsurance Company, to maintain the claims equalisation provision in local GAAP accounting at a level that exceeds the economic requirements. This restricts the revenue reserves and profit distribution possibilities, but stabilises results in years with high claims expenditure. As at 31 December 2018, Munich Reinsurance Company’s claims equalisation provision totalled €8.5bn. Additional information can be found under Munich Reinsurance Company (comments based on the German Commercial Code) on page 85 f.
Between 2006 and 2018, we returned a total of €26.6bn to our shareholders. In March 2018, the Board of Management launched another share buy-back programme. We intend to buy back shares up to a maximum purchase price of €1bn by the Annual General Meeting on 30 April 2019. During the reporting year, we had bought back shares with a total volume of €1,013m.
64Combined management reportFinancial position
System of control for employee share scheme where the control rights are not exercised directly by the employees
Like other shareholders, employees of Munich Reinsurance Company exercise their control rights in accordance with statutory provisions and the Articles of Association.
Statutory regulations and provisions of the Articles of Association regarding appointment and dismissal of members of the Board of Management, and concerning amendments to the Articles of AssociationThe legal parameters for the appointment and dismissal of members of the Board of Management are specified in the Company’s Co-determination Agreement, Articles 13(3) and 16 of the Articles of Association, Sections 84 and 85 of the Stock Corporation Act (AktG), and Sections 24, 47 and 303 of the German Insurance Supervision Act (VAG). Munich Re’s Co-determination Agreement and Articles of Association follow the legal tenets of the German Co-Determination Act (MitbestG). Pursuant to Article 16 of the Articles of Association, the Board of Management must comprise a minimum of two persons; beyond this, the number of members is determined by the Supervisory Board. There are currently nine members of the Board of Management (eight members until 17 March 2019). The Supervisory Board appoints the members of the Board of Management pursuant to Section 84 of the Stock Corporation Act and may dismiss them at any time for good cause. On initial appointment, members of the Board of Management are usually given contracts for a term of between three and five years, and extensions of up to five years are possible. For the appointment or dismissal of members of the Board of Management, Article 13(3) of the Articles of Association stipulates a two-thirds majority of the votes cast on the Supervisory Board. If the requisite majority is not obtained in the initial resolution, the appointment or dismissal of the Board of Management requires a simple majority of the votes cast. The second resolution is only possible following a suitable period of reflection and after the issue has been dealt with in the competent committee, but is thereafter also possible by written consent in lieu of a meeting. In exceptional cases, members of the Board of Management may also be appointed by a court of law, pursuant to Section 85 of the Stock Corporation Act.
The Stock Corporation Act contains general provisions governing amendments to the Articles of Association – Section 124(2) sentence 3, and Sections 179–181 of the Act. These state that only the Annual General Meeting can make resolutions on changes to the Articles of Association. In order to be carried, such a resolution must receive the votes cast by at least three-quarters of the share capital represented in the vote. The Articles of Association may stipulate a different capital majority (higher or lower) or other requirements, but the Company’s Articles of Association do not provide for any such special features.
The Stock Corporation Act contains special regulations on amendments to the Articles of Association where increases and reductions in share capital are concerned (Sections 182–240 of the Act). Under these regulations, resolutions on capital measures are generally to be made by the Annual General Meeting. Within a self-determined scope, however, the Annual General Meeting can authorise the Board of Management to initiate certain (capital) measures. The authorisations relating to Munich Reinsurance Company are listed below. In all such cases, a resolution of the Annual General Meeting is required that has been adopted by at least a three-quarter majority of the share capital represented in the vote. Where these resolutions are concerned, the Company’s Articles of Association again do not provide for other (i.e. higher) majorities or further requirements. Pursuant to Article 14 of the Articles of Association and Section 179(1) sentence 2 of the Stock Corporation Act, the Supervisory Board is empowered to make amendments to the Articles of Association which affect only the wording.
Powers of the Board of Management, with particular regard to the option of issuing or buying back shares
The powers of the members of the Board of Management are defined in Sections 71 and 76–94 of the Stock Corporation Act (AktG). The Board of Management has the following powers to issue and buy back shares:
− The Annual General Meeting of 25 April 2018 authorised the Company, pursuant to Section 71(1) no. 8 of the Stock Corporation Act, to buy back shares until 24 April 2023 up to a total amount of 10% of the share capital. The shares acquired, plus other own shares in the possession of the Company or attributable to the Company in accordance with Section 71a ff. of the Stock Corporation Act, may at no time amount to more than 10% of the share capital. In accordance with the provisions of the authorisation, the shares may be acquired in various ways. The Board of Management is authorised to use shares thus acquired for all legally permissible purposes, in particular those specified in the authorisation, whilst excluding subscription rights. Among other things, the Board of Management is empowered under Section 71(1) no. 8 of the Stock Corporation Act to retire the shares without requiring further approval from the Annual General Meeting. By resolution of 15 March 2018, the Board of Management decided to utilise this authorisation to acquire own shares. Around 3.7 million shares had been acquired by 31 December 2018 at a purchase price of approximately €697m.
− The Annual General Meeting of 23 April 2015 authorised the Board of Management to issue, with the consent of the Supervisory Board, in one or more issues up to 22 April 2020, convertible bonds, bonds with warrants, profit participation rights, profit participation certificates or combinations of such instruments (hereinafter collectively referred to as “bonds”) for a maximum nominal amount of €3bn with or without a limited term

65
Munich Re Group Annual Report 2018
Combined management reportFinancial position
to maturity. Shareholders are generally entitled to a subscription right in respect of these bonds, but the Board of Management is authorised, with the consent of the Supervisory Board, to exclude this subscription right in the cases specified in the authorisation. The holders of such bonds may be granted conversion rights, warrants or conversion obligations in respect of shares issued by the Company up to a maximum amount of €117m of the share capital, in accordance with the respective bond or warrant conditions. As a precautionary measure, capital of €117m was conditionally authorised under Article 4(3) of the Articles of Association (Contingent Capital 2015).
− Under Article 4(1) of the Articles of Association, the Board of Management is authorised, with the consent of the Supervisory Board, to increase the Company’s share capital at any time up to 25 April 2022 by an amount of up to €280m by issuing new shares against cash or non-cash contribution (Authorised Capital 2017). In accordance with the above-mentioned provisions of the Articles of Association, it may exclude subscription rights. As regards the resolution of 26 April 2017, the Board of Management declared that it will utilise the Authorised Capital 2017 only up to a maximum amount of 33% of the share capital at the time of the Annual General Meeting. It further stated that it will only exercise the authority to exclude shareholders’ subscription rights where such shares do not exceed 10% of the existing share capital at the time the authorisation is exercised for the first time.
− Under Article 4(2) of the Articles of Association, the Board of Management is authorised, with the consent of the Supervisory Board, to increase the Company’s share capital at any time up to 22 April 2020 by an amount of up to €10m by issuing new shares against cash contribution (Authorised Capital 2015). The subscription right of shareholders is excluded insofar as this is necessary to allow the new shares to be issued to employees of Munich Reinsurance Company and its affiliated companies.
The complete text of the aforementioned authorisations and the declaration by the Board of Management is provided in the agenda of the respective Annual General Meetings at www.munichre.com/agm/archive. Munich Reinsurance Company’s Articles of Association are available at www.munichre.com/articles-of-association.
Significant agreements which take effect, alter or terminate upon a change of control following a takeover bid, and resultant implications Based on our underwriting guidelines, our reinsurance agreements generally include a clause that grants both parties to the agreement a right of extraordinary cancellation in the event that “the other party merges with another company or its ownership and control undergoes a material change”. Such or similar clauses are typical of the industry. They are also common in joint venture or cooperation agreements between shareholders of a joint investment company.
Compensation agreements concluded with members of the Board of Management or employees for the event of a takeover bid There are no compensation agreements with members of the Board of Management or employees for the event of a takeover bid.
Analysis of the consolidated cash flow statement
Our primary insurance and reinsurance operations have a significant influence on Munich Re’s cash flow. We generally first collect the premiums for the risks assumed and do not make payments until later, when claims need to be settled. Cash flow statements of insurance companies are therefore of limited relevance. The cash flow statement is adjusted to eliminate the effects of fluctuations in exchange rates and changes in the entities consolidated.
Consolidated cash flow statement
2018 Prev. year Change €m €m %Cash flows from operating activities 2,998 1,833 63.6Cash flows from investing activities –95 2,326 –Cash flows from financing activities –1,338 –3,754 64.4Cash flows for the financial year 1,565 405 286.3
In the consolidated cash flow statement, the consolidated profit of €2,275m is used as the starting point for determining the cash inflows from operating activities. The consolidated result is also adjusted by €4,449m to take account of the higher technical provisions. The net gains on the disposal of investments – which in adjusting the consolidated profit have to be deducted from the cash flows – are essentially attributable to the disposal of securities available for sale.
Inflows from investing activities were determined by the change from the acquisition and sale of investments for unit-linked life insurance contracts totalling €485m, which contrasted with outflows of €889m for obtaining control of consolidated subsidiaries.
The cash outflows for financing activities stem mainly from the dividend payment in 2018, the share buy-back programme and the issuance of a new subordinated bond.
Overall in the year under review, cash – which encompasses cash with banks, cheques and cash in hand – rose by €1,565m (including currency effects) to €5,150m. There were items pledged as security and other restrictions on title amounting to €12m (45m).

Combined management reportRisk report
66
Our implementation of risk management at the operational level embraces the identification, analysis and assessment of all material risks. This provides a basis for risk reporting, the control of limits and monitoring.
Risk identification is performed by means of appropriate processes and indicators, which are complemented by expert opinions. Our process for early identification of risks also encompasses emerging risks, which we define as potential trends or sudden events that are characterised by a high degree of uncertainty in terms of occurrence probability, expected loss amount, and possible effects on Munich Re.
As part of the risk analysis, a quantitative and qualitative assessment of all risks at consolidated Group level is made in order to take into account possible interactions between risks across all fields of business. Internal risk reporting provides the Board of Management with regular, detailed information on the risk situation, as regards the individual risk categories and the entire Group alike. This ensures that negative trends are identified in sufficient time for countermeasures to be taken. The purpose of our external risk reporting is to provide clients, shareholders and the supervisory authorities with a clear overview of the Group’s risk situation. Actual risk limits are derived from the risk strategy: taking the defined risk appetite as a basis, limits, rules and any risk-reducing measures required are approved and implemented. We also have a comprehensive early-warning system that draws our attention to any potential shortages of capacity.
Quantitative risk monitoring based on indicators is carried out both centrally and within units. We monitor risks that cannot be expressed directly as an amount either centrally or in our units, depending on their materiality and allocation. The risk management system is regularly audited by Group Audit, external auditors and the Federal Financial Supervisory Authority (BaFin).
Significant risks
Our definition of a risk is a possible future development or event that could result in a negative deviation from the Group’s prognoses or targets. We classify risks as “significant” if they could have a long-term adverse effect on Munich Re’s assets, financial situation or profitability. We have applied this definition consistently to each business unit and legal entity, taking account of its individual risk-bearing capacity. In doing so, we differentiate between risks depicted in our internal model and other risks.
Risk report Risk governance and risk management system
Risk management organisation
Organisational structureMunich Re has set up a governance system as required under Solvency II. The main elements of this system are the risk management, compliance, audit and actuarial functions. At Group level, risk management is part of the Integrated Risk Management division (IRM) and reports to the Chief Risk Officer (Group CRO). In addition to the Group functions, there are risk management units in the fields of business, each headed up by its own CRO.
Risk governanceOur risk governance ensures that an appropriate risk and control culture is in place by clearly assigning roles and responsibilities for all material risks. Risk governance is supported by various committees at Group and field-of- business level. The Board of Management must consult the risk management function on major decisions to be taken.
Defining the risk strategyThe risk strategy, which is aligned with Munich Re’s business strategy, defines where, how and to what extent we are prepared to incur risks. The further development of our risk strategy is embedded in the annual planning cycle, and hence in our business planning. It is approved by the Board of Management, and discussed regularly with the Audit Committee of the Supervisory Board as a material element of the own risk and solvency assessment (ORSA) process.
We determine the risk strategy by defining limits and triggers for a number of risk criteria that are based on the capital and liquidity available, and on our earnings target, and provide a frame of reference for the Group’s operating divisions.
Implementation of strategy and the risk management cycleThe risk appetite defined by the Board of Management is reflected in our business planning and integrated into the management of our operations. If capacity shortages or conflicts with the limit system or regulations arise, defined escalation and decision-making processes are followed. These have been designed to ensure that the interests of the business and risk management considerations are weighed and reconciled with each other as far as possible.

67Combined management reportRisk report
Munich Re Group Annual Report 2018
property-casualty, life and health, market, credit and operational risks. We use primarily historical data for the calibration of these distributions, complemented in some areas by expert judgement. Our historical data covers a long period to take account of the one-year time horizon and to provide a stable and appropriate estimate of our risk parameters. We continue to take account of diversification effects we achieve through our broad spread across various risk categories and the combination of primary insurance and reinsurance business. We also take into account dependencies between the risks, which can result in higher capital requirements than would be the case if no dependency were assumed. We then determine the effect of the loss absorbency of deferred taxes.
The table shows the solvency capital requirement for Munich Re and its risk categories as at 31 December 2018.
Risks depicted in the internal model
Solvency capital requirement – Internal modelMunich Re has a comprehensive internal model that determines the capital needed to ensure that the Group is able to meet its commitments even after extreme loss events. We use the model to calculate the capital required under Solvency II (the solvency capital requirement, or SCR). The SCR is the amount of eligible own funds that Munich Re needs to have available, with a given risk tolerance, to cover unexpected losses in the following year. It corresponds to the value at risk of the economic profit and loss distribution over a one-year time horizon with a confidence level of 99.5%, and thus equates to the economic loss for Munich Re that, given unchanged exposures, will be exceeded each year with a statistical probability of 0.5%. Our internal model is based on specially modelled distributions for the risk categories
1 Capital requirements for other financial sectors, e.g. institutions for occupational retirement provisions.
Solvency capital requirements (SCR)
Reinsurance ERGO Diversification 31.12.2018 Prev. year 31.12.2018 Prev. year 31.12.2018 Prev. year €m €m €m €m €m €mProperty-casualty 7,557 6,210 425 403 –347 –321Life and health 4,527 4,331 1,116 808 –356 –224Market 5,513 5,890 5,746 5,607 –2,042 –2,276Credit 2,112 2,284 1,156 1,291 –107 –127Operational risk 752 754 528 775 –218 –291Other1 446 454 221 205 Subtotal 20,907 19,923 9,192 9,089 Diversification effect –7,764 –7,397 –1,985 –1,923 Tax –2,346 –2,144 –633 –597 Total 10,798 10,382 6,574 6,569 –2,702 –2,597
Group 31.12.2018 Prev. year Change €m €m €m %Property-casualty 7,634 6,292 1,342 21.3Life and health 5,288 4,914 373 7.6Market 9,217 9,221 –4 0.0Credit 3,161 3,449 –288 –8.4Operational risk 1,063 1,238 –175 –14.1Other1 667 659 9 1.3Subtotal 27,030 25,773 1,257 4.9Diversification effect –9,912 –9,133 –779 8.5Tax –2,448 –2,287 –160 7.0Total 14,670 14,353 317 2.2
segments. The diversification effect between all categories is now just under 37%. Further information on the changes within individual risk categories can be found in the sections below.
Compared with the status quo at 31 December of the previous year, the SCR at Group level were up slightly from €14.4bn to €14.7bn. The main drivers behind this rise was increased exposure in risk-capital intensive areas of the property-casualty and life and health reinsurance
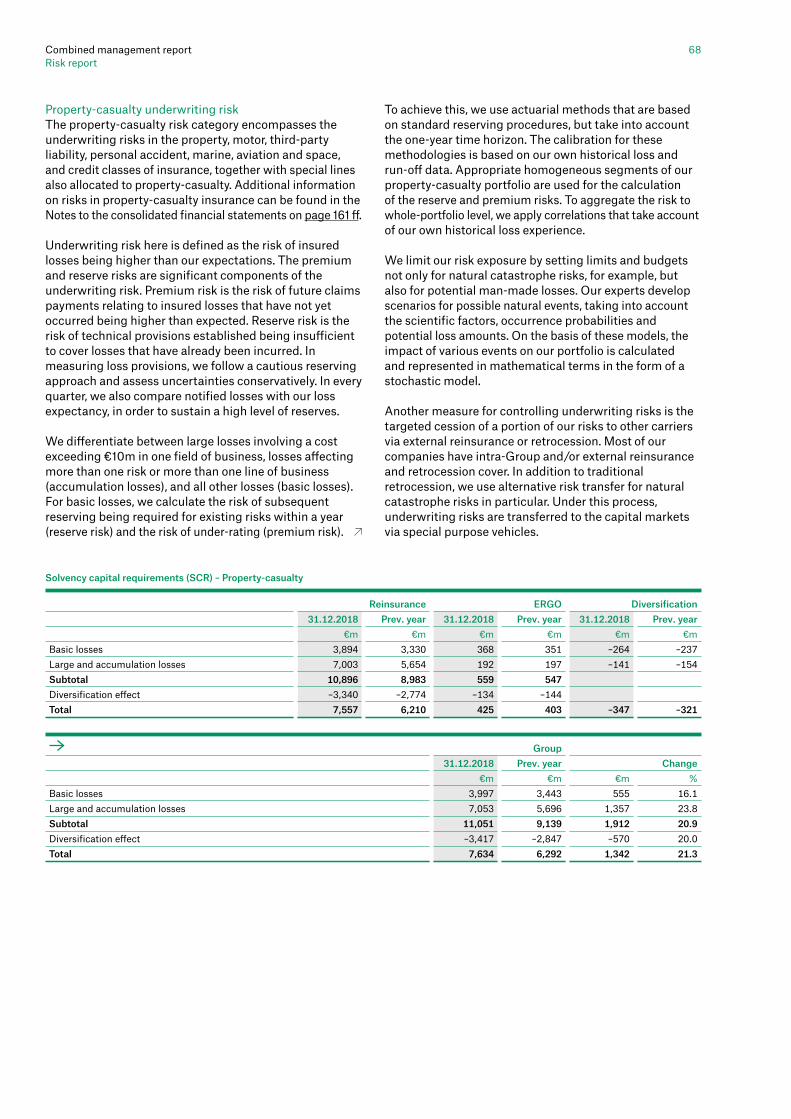
Combined management reportRisk report
68
Property-casualty underwriting riskThe property-casualty risk category encompasses the underwriting risks in the property, motor, third-party liability, personal accident, marine, aviation and space, and credit classes of insurance, together with special lines also allocated to property-casualty. Additional information on risks in property-casualty insurance can be found in the Notes to the consolidated financial statements on page 161 ff.
Underwriting risk here is defined as the risk of insured losses being higher than our expectations. The premium and reserve risks are significant components of the underwriting risk. Premium risk is the risk of future claims payments relating to insured losses that have not yet occurred being higher than expected. Reserve risk is the risk of technical provisions established being insufficient to cover losses that have already been incurred. In measuring loss provisions, we follow a cautious reserving approach and assess uncertainties conservatively. In every quarter, we also compare notified losses with our loss expectancy, in order to sustain a high level of reserves.
We differentiate between large losses involving a cost exceeding €10m in one field of business, losses affecting more than one risk or more than one line of business (accumulation losses), and all other losses (basic losses). For basic losses, we calculate the risk of subsequent reserving being required for existing risks within a year (reserve risk) and the risk of under-rating (premium risk).
To achieve this, we use actuarial methods that are based on standard reserving procedures, but take into account the one-year time horizon. The calibration for these methodologies is based on our own historical loss and run-off data. Appropriate homogeneous segments of our property-casualty portfolio are used for the calculation of the reserve and premium risks. To aggregate the risk to whole-portfolio level, we apply correlations that take account of our own historical loss experience.
We limit our risk exposure by setting limits and budgets not only for natural catastrophe risks, for example, but also for potential man-made losses. Our experts develop scenarios for possible natural events, taking into account the scientific factors, occurrence probabilities and potential loss amounts. On the basis of these models, the impact of various events on our portfolio is calculated and represented in mathematical terms in the form of a stochastic model.
Another measure for controlling underwriting risks is the targeted cession of a portion of our risks to other carriers via external reinsurance or retrocession. Most of our companies have intra-Group and/or external reinsurance and retrocession cover. In addition to traditional retrocession, we use alternative risk transfer for natural catastrophe risks in particular. Under this process, underwriting risks are transferred to the capital markets via special purpose vehicles.
Solvency capital requirements (SCR) – Property-casualty
Reinsurance ERGO Diversification 31.12.2018 Prev. year 31.12.2018 Prev. year 31.12.2018 Prev. year €m €m €m €m €m €mBasic losses 3,894 3,330 368 351 –264 –237Large and accumulation losses 7,003 5,654 192 197 –141 –154Subtotal 10,896 8,983 559 547 Diversification effect –3,340 –2,774 –134 –144 Total 7,557 6,210 425 403 –347 –321
Group 31.12.2018 Prev. year Change €m €m €m %Basic losses 3,997 3,443 555 16.1Large and accumulation losses 7,053 5,696 1,357 23.8Subtotal 11,051 9,139 1,912 20.9Diversification effect –3,417 –2,847 –570 20.0Total 7,634 6,292 1,342 21.3

69Combined management reportRisk report
Munich Re Group Annual Report 2018
over the entire duration of the policies. This can mean that negative developments in risk drivers with long-term effects sustainably reduce the value of the insurance portfolio (trend risks). The risk drivers mortality and disability are dominated by the reinsurance field of business, particularly by exposure in North America and Asia. The longevity risk driver can be found in the products marketed by ERGO in Germany together with typical risks related to policyholder behaviour, such as the lapse risk, but we also underwrite longevity risk in the reinsurance field of business, especially in the United Kingdom. To a lesser extent, risks connected with the increase in treatment costs arise in the ERGO field of business in particular.
Risk modelling attributes probabilities to potential modified assumptions, and produces a complete profit and loss distribution. We use primarily historical data extracted from our underlying portfolios to calibrate these probabilities, and additionally apply general mortality rates for the population to model the mortality trend risk. To enable us to define appropriate parameters for the modelling of the range of areas in which we operate, portfolios with a homogeneous risk structure are grouped together. We then aggregate the individual profit and loss distributions taking account of the dependency structure to obtain an overall distribution.
Our largest short-term accumulation risk in the life and health risk category is a severe pandemic. We counter this risk by examining our overall exposure in detail using scenario analysis, and by defining appropriate measures to manage the risks.
In reinsurance, we control the assumption of biometric risks by means of a risk-commensurate underwriting policy. Interest-rate and other market risks are frequently ruled out by depositing the provisions with the cedant, with a guaranteed rate of interest from the deposit. In individual cases, these risks are also hedged by means of suitable capital-market instruments. For primary insurance, substantial risk minimisation is achieved through product design. In case of adverse developments, parts of the provision for premium refunds – which are recognised and reversed in profit or loss – are of great significance for risk-balancing. In health primary insurance, most long-term contracts include the possibility and/or obligation to adjust premiums. Practically, however, there are limits to the resilience of policyholders.
Solvency capital requirement – Property-casualtyThe 21% jump in the reinsurance segment capital requirement is largely a consequence of the strong growth in the course of 2018 of business exposed to natural hazards. It should further be highlighted that a major change in the methodology used for the basic loss model has driven the SCR increase.
Our internal model considers the accumulation-risk scenarios as independent events. Munich Re’s greatest natural hazard exposure lies in the scenarios “Atlantic Hurricane” and “Earthquake North America”. The exposure to cyber risks was up on the previous year, but remained significantly lower than the exposure to natural catastrophes. The diagrams show how we estimate our exposure for the coming year to the peak scenarios for a return period of 200 years.
2018
2017
Atlantic HurricaneAggregate VaR (return period: 200 years)€bn (before tax), retained
5.0
4.3
2018
2017
Earthquake North AmericaAggregate VaR (return period: 200 years)€bn (before tax), retained
4.9
3.6
Life and health underwriting riskThe underwriting risk is defined here as the risk of insured benefits payable in life or health insurance business being higher than expected. Of particular relevance are biometric risks and policyholder-behaviour risks, such as lapses and lump-sum options. We differentiate between risks that have a short-term or long-term effect on our portfolio. In addition to the simple risk of random fluctuations resulting in higher claims expenditure in a particular year, the adverse developments with a short-term impact that we model notably include rare – but costly – events such as pandemics. More information on the risks in life and health insurance can be found in the Notes to the consolidated financial statements on page 159 ff.
Life primary insurance products in particular, and a large part of our health primary insurance business, are long term in nature, and the results they produce are spread
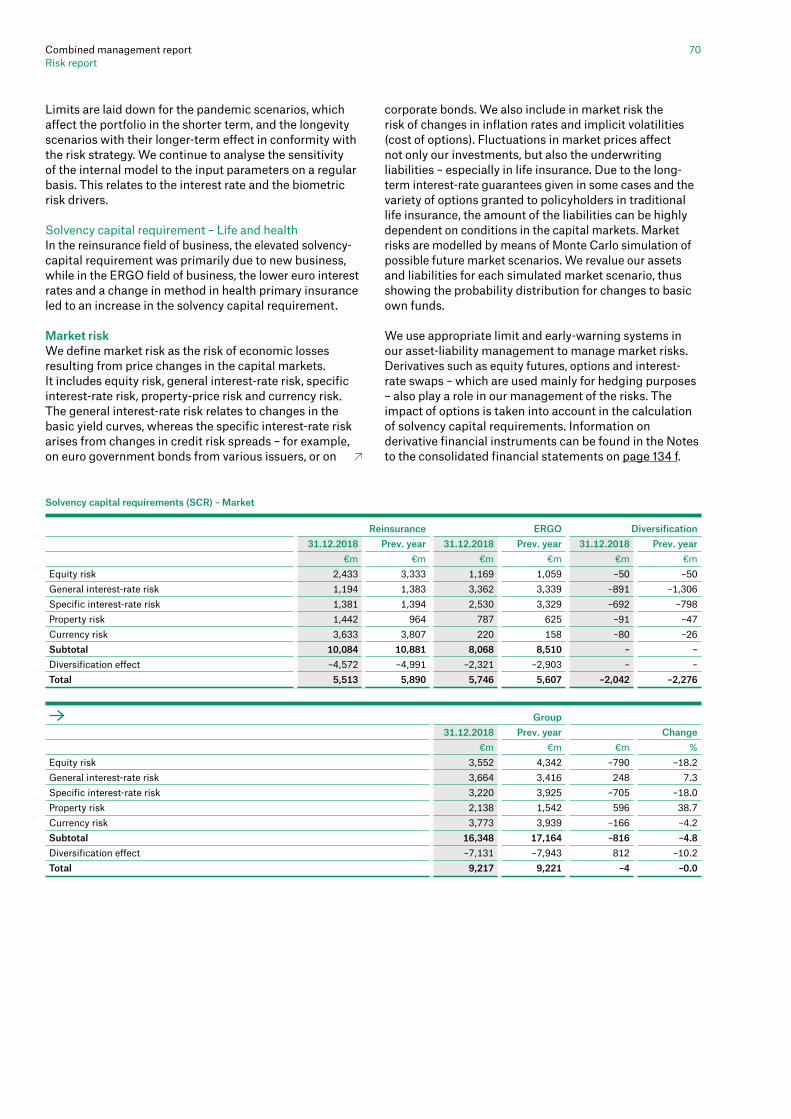
Combined management reportRisk report
70
Limits are laid down for the pandemic scenarios, which affect the portfolio in the shorter term, and the longevity scenarios with their longer-term effect in conformity with the risk strategy. We continue to analyse the sensitivity of the internal model to the input parameters on a regular basis. This relates to the interest rate and the biometric risk drivers.
Solvency capital requirement – Life and healthIn the reinsurance field of business, the elevated solvency-capital requirement was primarily due to new business, while in the ERGO field of business, the lower euro interest rates and a change in method in health primary insurance led to an increase in the solvency capital requirement.
Market riskWe define market risk as the risk of economic losses resulting from price changes in the capital markets. It includes equity risk, general interest-rate risk, specific interest-rate risk, property-price risk and currency risk. The general interest-rate risk relates to changes in the basic yield curves, whereas the specific interest-rate risk arises from changes in credit risk spreads – for example, on euro government bonds from various issuers, or on
corporate bonds. We also include in market risk the risk of changes in inflation rates and implicit volatilities (cost of options). Fluctuations in market prices affect not only our investments, but also the underwriting liabilities – especially in life insurance. Due to the long-term interest-rate guarantees given in some cases and the variety of options granted to policyholders in traditional life insurance, the amount of the liabilities can be highly dependent on conditions in the capital markets. Market risks are modelled by means of Monte Carlo simulation of possible future market scenarios. We revalue our assets and liabilities for each simulated market scenario, thus showing the probability distribution for changes to basic own funds.
We use appropriate limit and early-warning systems in our asset-liability management to manage market risks. Derivatives such as equity futures, options and interest-rate swaps – which are used mainly for hedging purposes – also play a role in our management of the risks. The impact of options is taken into account in the calculation of solvency capital requirements. Information on derivative financial instruments can be found in the Notes to the consolidated financial statements on page 134 f.
Solvency capital requirements (SCR) – Market
Reinsurance ERGO Diversification 31.12.2018 Prev. year 31.12.2018 Prev. year 31.12.2018 Prev. year €m €m €m €m €m €mEquity risk 2,433 3,333 1,169 1,059 –50 –50General interest-rate risk 1,194 1,383 3,362 3,339 –891 –1,306Specific interest-rate risk 1,381 1,394 2,530 3,329 –692 –798Property risk 1,442 964 787 625 –91 –47Currency risk 3,633 3,807 220 158 –80 –26Subtotal 10,084 10,881 8,068 8,510 – –Diversification effect –4,572 –4,991 –2,321 –2,903 – –Total 5,513 5,890 5,746 5,607 –2,042 –2,276
Group 31.12.2018 Prev. year Change €m €m €m %Equity risk 3,552 4,342 –790 –18.2 General interest-rate risk 3,664 3,416 248 7.3 Specific interest-rate risk 3,220 3,925 –705 –18.0 Property risk 2,138 1,542 596 38.7Currency risk 3,773 3,939 –166 –4.2Subtotal 16,348 17,164 –816 –4.8 Diversification effect –7,131 –7,943 812 –10.2Total 9,217 9,221 –4 –0.0

71Combined management reportRisk report
Munich Re Group Annual Report 2018
Solvency capital requirement – Market Equity riskThe lower equities exposure after derivatives compared with the previous year was reflected in a fall in the solvency capital requirement.
Interest-rate riskThe fall in the general interest-rate risk in the reinsurance field of business was substantially the result of a reduction in long-term liabilities. The specific interest-rate risk fell considerably in the ERGO field of business. A large part of the decrease was caused by an improved reflection of these risks in the life and health units.
In the reinsurance field of business, the market value of interest-sensitive investments as at 31 December 2018 was €67.8bn (66.6bn). Measured in terms of modified duration, the interest-rate sensitivity of those investments was 5.0 (5.8), while that of the liabilities1 was 5.8 (5.8). The change in available financial resources in the event of a decrease in interest rates of one basis point would be approximately €4.0m (7.5m).
In the ERGO field of business, the market value of interest-sensitive investments as at 31 December 2018 was €127.8bn (130.6bn). The modified duration was 8.8 (8.8) for interest-sensitive investments and 9.2 (9.5) for liabilities. A decrease in interest rates of one basis point would have reduced the available own funds by approximately €7.6m (9.8m). This resulted in exposure to falling interest rates arising mainly out of the long-term options and guarantees in life insurance business.
Property riskAs a consequence of increases in market values of our property portfolio, there has been a significant increase in property risk.
Currency riskThe currency risk receded, primarily due to a reduction in USD positions.
Credit riskWe define credit risk as the financial loss that Munich Re could incur as a result of a change in the financial situation of a counterparty. In addition to credit risks arising out of investments in securities and payment transactions with clients, we actively assume credit risk through the writing of credit and financial reinsurance and in corresponding primary insurance business.
Munich Re determines credit risks using a portfolio model, which is calibrated over a longer period (at least one full credit cycle), and which takes account of both changes in fair value caused by rating migrations and
debtor default. The credit risk arising out of investments (including deposits retained on assumed reinsurance, government bonds and credit default swaps – CDSs) and reserves ceded is calculated by individual debtor. We use historical capital-market data to determine the associated migration and default probabilities. Correlation effects between debtors are derived from the sectors and countries in which they operate, and sector and country correlations are based on the interdependencies between the relevant stock indices. The calculation of the credit risk in “other receivables” is based on internal expert assessments. For life and health primary insurance business, we also take account of the share of the mitigating effect on the credit risk resulting from policyholders’ participation in profits. We also capitalise the credit risk for highly rated government bonds. Information on the ratings of the fixed-interest securities and loans can be found in the Notes to the consolidated financial statements on page 132 ff.
We use a cross-balance-sheet counterparty limit system valid throughout the Group to monitor and control our Group-wide credit risks. The limits for each counterparty (a group of companies or country) are based on its financial situation as determined by the results of our fundamental analyses, ratings and market data, and the risk appetite defined by the Board of Management. The utilisation of limits is calculated on the basis of credit-equivalent exposure (CEE). There are also volume limits for securities lending and repurchase transactions. Group-wide rules for collateral management – for example, for over-the-counter (OTC) derivatives and catastrophe bonds issued – enable the associated credit risk to be reduced. Exposure to issuers of interest-bearing securities and CDSs in the financial sector is limited by a financial sector limit at Group level.
In monitoring the country risks, we do not simply rely on the usual ratings, but perform independent analyses of the political, economic and fiscal situation in the most important of the countries issuing paper in which we might potentially invest. On this basis, and taking account of the investment requirements of the fields of business in the respective currency areas and countries, limits or action to be taken are approved. These are mandatory throughout the Group for investments and the insurance of political risks.
With the help of defined stress scenarios, our experts forecast potential consequences for the financial markets, the fair values of our investments, and the present values of our underwriting liabilities. At Group level, we counter any negative effects with the high degree of diversification in both our investments and our liability structure, and with our active Group-wide asset-liability management. We
1 The liabilities mainly comprise the technical provisions in accordance with Solvency II (best estimate and risk margin). In the previous year, the entire liabilities side, including economic own funds, was considered here. The previous year’s figures have been adjusted accordingly.

Combined management reportRisk report
72
The Group has established an accounting manual and a system providing regular information on changes to rules applied throughout the Group. Financial accounting and reporting are subject to materiality thresholds to ensure that the cost of the internal controls performed is proportionate to the benefits derived. The risks that are significant from a Group perspective for our financial reporting are covered by the ICS and are reviewed by the risk carriers on a regular basis.
We use scenario analyses to quantify operational risks. The results are fed into the modelling of the solvency capital requirement for operational risks and are validated using various sources of information, such as the ICS and internal and external loss data.
The sensitivity in the internal model is regularly checked against the most important input parameters. This mainly relates to the dependence of the result on frequency and loss amounts and the parameters for the correlations between scenarios. The analyses showed no anomalies in the year under review.
Solvency capital requirement – Operational riskThe reduction in the solvency capital requirement was due on the one hand to ERGO’s more detailed appraisal of a number of scenarios, and risk-mitigating measures for cyber risks on the other.
Other risk categories
We use appropriate procedures to specifically identify and analyse reputational risk, strategic risk, liquidity risk and security risk. These risks are also assessed and managed in our risk management process.
Reputational riskWe define reputational risk as the risk of damage to Munich Re’s reputation as a consequence of a negative public image resulting in a deterioration in its credit rating, corporate value, etc. The reputational-risk aspect of relevant issues is assessed in the fields of business by “Reputational Risk Committees”. Where a reputational risk could potentially have an impact on Munich Re, central divisions at Group level are involved in the assessment.
Strategic riskWe define strategic risk as the risk of making wrong business decisions, implementing decisions poorly, or being unable to adapt to changes in the operating environment. Existing and new potential for success in the Group and the fields of business in which it operates creates strategic risks, which we manage by carrying out risk analyses for significant strategic issues and regularly
manage credit default risk in retrocession and external reinsurance with the assistance of limits determined by the Retro Security Committee. Our reserves ceded to reinsurers were assignable to the following rating categories as at 31 December:
Further information on the risks arising out of receivables relating to insurance business can be found in the Notes to the consolidated financial statements on page 136.
Solvency capital requirement – CreditThe decline in the solvency capital requirement was mainly due to developments in the capital markets, particularly the heightened USD interest rates and a fall in the historical rating migration and default probabilities that are used to calibrate the models.
Operational riskWe define operational risk as the risk of losses resulting from inadequate or failed internal processes, incidents caused by the actions of personnel or system malfunctions, or external events. This includes criminal acts committed by employees or third parties, insider trading, infringements of antitrust law, business interruptions, inaccurate processing of transactions, non-compliance with reporting obligations, and disagreements with business partners.
Operational risks are managed through our internal control system (ICS). It addresses Group management requirements, while complying with local regulations. Appropriate measures – up to and including larger projects – are used to correct identified weaknesses or mistakes. The identification of risks that are significant from a Group perspective is covered by our ICS, and these risks are reviewed by the risk carriers and process owners on a regular basis. Furthermore, the design of the ICS and compliance with the system is regularly reviewed by Group Audit.
A key component of the ICS lies in ensuring the reliability of annual financial statements at both consolidated and solo-undertaking level, and the identification, management and control of risks arising out of the accounting process.
5109Ceded share of technical provisions according to rating
% 31.12.2018 Prev. yearAAA 0.0 3.2AA 27.8 29.1A 31.2 37.9BBB and lower 8.5 2.7No rating available 32.6 27.1

73Combined management reportRisk report
Munich Re Group Annual Report 2018
The eligible own funds as at the balance sheet date take into account deductions for the dividend agreed by the Board of Management for the 2018 financial year of €1.3bn, and purchases not yet made under the share buy-back programme for 2018/2019 in the amount of €303m. In order to make the effects of potential further capital measures on the Solvency II ratio transparent to financial statement users, we further recognise a possible share buy-back programme for 2019/2020 in the amount of €1bn. At the time the consolidated financial statements were prepared, this had neither been resolved nor approved by the competent bodies.
Other risks
Economic and financial-market developments and regulatory risksMunich Re has substantial investments in the eurozone. We attach importance to maintaining a correspondingly broad diversification of investments to cover our technical provisions and liabilities in euros. However, low interest rates continue to pose major challenges, in particular for life insurance companies in the eurozone. Fluctuations in the capital markets give rise to considerable volatility in the balance sheet. We counter these risks with various risk-management measures.
Political risks in the eurozone continue to exist owing to the discord caused by conflicting national interests of the individual member states. In Italy, borrowing costs rose with the change of government in 2018, though the regime now appears to be relenting. The reduction in the stimulus provided by the European Central Bank’s monetary policy could cause borrowing costs to rise for some countries. Though progress has been made in the exit negotiations between the EU and the United
Solvency II ratio1
31.12.2018 Prev. year2 ChangeEligible own funds3 €m 35,995 35,060 935Solvency capitalrequirement €m 14,670 14,353 317Solvency II ratio % 245.4 244.3
1 Eligible own funds excluding the application of transitional measures for technical provisions; including the application of transitional measures for technical provisions, the own funds amounted to €43.2bn (42.6bn); Solvency II ratio: 295% (297%).
2 The redemption of a subordinated bond callable in 2018 in the amount of £300m had already been anticipated as a deduction in eligible own funds for the 2017 financial year, and was made accordingly in 2018.
3 Economic earnings and the newly issued subordinated bond increased the eligible own funds as at the reporting date by a total of around €3.2bn. At the same time, the dividend approved by the Board of Management for the 2018 financial year and the potential 2019/2020 share buy-back had a reducing effect of approximately €2.3bn.
monitoring the implementation of measures deemed necessary. The Chief Risk Officer is involved in operational business planning and the processes for significant company mergers and acquisitions.
Liquidity riskOur objective in managing liquidity risk is to ensure that we are in a position to meet our payment obligations at all times. To guarantee this, the liquidity position at our units is continuously monitored and subject to stringent requirements for the availability of liquidity. The short-term and medium-term liquidity planning is submitted to the Board of Management on a regular basis. The liquidity risk is managed within the framework of our holistic risk strategy, with the Board of Management defining limits on which minimum liquidity requirements for our operations are based. These risk limits are reviewed annually, and compliance with the minimum requirements is continuously monitored. Using quantitative risk criteria, we ensure that Munich Re has sufficient liquidity available to meet its payment obligations even under adverse scenarios, with the liquidity position being assessed both for insurance catastrophe scenarios and for adverse situations in the capital markets. Further information on liquidity risks in life and health insurance business and in property-casualty business can be found in the Notes to the consolidated financial statements on pages 159 ff. and 161 ff.
Security riskWe define security risks as risks resulting from threats to the security of our employees, data, information, and property. We are intensifying our analysis of cyber risks in particular in recognition of the increasing importance of information technology for Munich Re’s core processes and the dynamic growth of cyber crime. Security risk committees have been set up in the fields of business to steer and coordinate measures aimed at managing security risks. The members of the security risk committees are managers from operational units (e.g. IT Security), the control functions (e.g. Information Security Officer, Data Protection) and representatives of the divisional units and central divisions. To further improve cyber security, we are working together on initiatives across the fields of business.
Solvency ratio under Solvency II
The solvency ratio under Solvency II is the ratio of the eligible own funds to the solvency capital requirement.

Combined management reportRisk report
74
Climate change
Climate change represents one of the greatest long-term risks of change for the insurance industry. We expect climate change to lead to a lasting increase in extreme weather events. Our risk-management competence built up over many years and our highly developed risk models allow us to professionally assess these altered natural hazard risks and to adequately account for these risks in the solvency capital requirement and in pricing.
Legal risks
As part of the normal course of business, Munich Re companies are involved in court, regulatory and arbitration proceedings in various countries. The outcome of pending or impending proceedings is neither certain nor predictable. However, we believe that none of these proceedings will have a significant negative effect on the financial position of Munich Re. In a ruling in December 2018, the German Federal Court of Justice endorsed the industry’s existing practice with regard to trustee independence in private health insurance – an issue that had been the subject of much debate in the industry.
Summary
In accordance with the prescribed processes, our Board committees explicitly defined the risk appetite for significant risk categories in the year under review, and quantified it with key figures. We determined and documented the risk appetite across the Group hierarchy and communicated it throughout the Group. During the whole of 2018, risk exposures were regularly quantified and compared with the risk appetite. We assess Munich Re’s risk situation to be manageable and under control.
Kingdom, it is still not possible to rule out a disorderly outcome (hard Brexit) with corresponding consequences for individual EU countries. A number of Munich Re insurance and reinsurance units conduct business in the United Kingdom, and the country’s departure from the EU will have implications for that business. We have set up a Group-wide project to ensure that our local structure is adapted to the direct effects of Brexit. These preparation measures will enable Munich Re to continue to write business in the UK, regardless of the outcome of the Brexit negotiations. In addition, there may be indirect effects on our business – for instance, owing to negative economic development, falling exchange rates or rising inflation. However, also because there may be contrary effects, what this may mean for Munich Re is not currently foreseeable. Taking into account the various possible Brexit scenarios, as things stand at present we do not expect any significant negative direct or indirect effects overall on Munich Re’s assets, liabilities, financial position or results. In Germany, government action with implications for private health insurance cannot be ruled out, especially if political parties advocating a “citizens’ insurance scheme” influence the policies of a future German Federal Government. At the present time, however, it is not possible to predict what these implications might be.
Further escalation of the trade war, political imponderables in Europe, political and economic challenges in emerging markets (particularly Turkey and Argentina), a flare-up in the differences between the USA and North Korea, an escalation in the Middle East (especially where Iran is concerned), or heightened confrontation between Russia and the West could significantly elevate uncertainty and have noticeable consequences for the respective region and global capital markets alike.
We constantly analyse the potential impact that developments of this sort may have on our risk profile.
Global players such as Munich Re are subject to increased fiscal pressure nationally and internationally, as well as a higher audit intensity. This trend is likely to strengthen yet further given the political spotlight on the appropriate taxation of international enterprises.

75Combined management reportOpportunities report
Munich Re Group Annual Report 2018
Opportunities report Our strong client focus, global risk management capabilities and industry knowledge put us in a good position to benefit from continuously evolving markets and changes in client behaviour, whilst we create new business opportunities by developing customised solutions for our clients. Unless stated otherwise, the opportunities for Munich Re outlined below generally relate equally to all fields of business.
Business environment
The currently still solid economic growth in many parts of the world should have a positive impact on the demand for insurance cover, and trigger higher premium volume in most classes of insurance. The reporting-year reinsurance renewals brought about a gradual improvement in rates. In addition, a less expansionary monetary policy could also lead to a normalisation of the bond markets. Although this would entail price losses, it would be favourable to our insurance business and bring higher returns in the long run. At the same time, the pressure on our cedants from the still prevailing low-interest-rate environment opens up diverse business opportunities for our reinsurance activities, although this is currently also giving rise to challenges for our investment. We are closely monitoring the potential consequences of political movements increasingly critical of globalisation. We have also made operational preparations for the potential implications of Brexit, with the aim of minimising the risks involved.
Innovation and digitalisation
Markets are being increasingly shaped by digitalisation, and changes in client behaviour call for flexibility in terms of coverage and solutions. Munich Re is investing heavily in our digital infrastructure and skills as well as in cooperation with strategic partners – including start-ups – in order to help bring about the requisite changes in terms of innovative products, services and internal processes. With Munich Re’s presence in major start-up hubs, the collaboration with accelerators, and the new Digital
Partners and Digital Ventures units, numerous new business and cooperation ideas are arising which will help us to expand our business model beyond the insurance value chain and tap the growth opportunities offered by the digital world.
We strive to obtain the highest possible degree of automation throughout the value chain and across all business units to not only meet our clients’ and our own needs as regards quality, speed and security, but also to improve efficiency. Significant investments in data, infrastructure, and human resources make it possible for us to use big data analytics even more systematically for our own business and make the technology available to our clients. Given our clients’ changing and increasingly hybrid requirements, we are actively driving the integration of various products and sales channels, and the expansion of direct sales in all classes of primary insurance. Besides investments in offers for ERGO’s hybrid customers, a very promising example that can be mentioned in this regard is nexible – ERGO’s purely digital insurer – which after its successful start in Germany is now also expanding into select other countries and aiming to further broaden its product range. As well as building our own digital competence, we are also focusing our activities on acquiring auspicious technology companies with which we intend to generate further growth. By way of example, we have purchased a 100% stake in the rapidly growing Internet of Things (IoT) specialist Relayr via our US subsidiary Hartford Steam Boiler. In addition to our IoT-related cooperation with Bosch and KUKA, this is a further important step in pressing ahead with new business models and helping to shape change in the manufacturing industry.
Social and economic trends
The generally positive economic dynamics and low levels of insurance penetration in many developing and emerging markets provide opportunities for profitably expanding and further diversifying our business portfolio, and we are utilising these in order to expand selectively. In life and health insurance, demand for private-provision products will rise on account of the ageing population.

Combined management reportOpportunities report
76
Expanding the limits of insurability
Together with our clients, we strive to expand the boundaries of insurability in many ways, working on cyber risks and enhanced cover options, among other things. We now offer our clients diverse coverage concepts for risks and damage caused by faulty product software and cyber attacks. Besides this, we are expanding our range of integrated cyber services, with the aim of providing our clients with optimal support before, during and after a potential loss event. In addition to this, we are developing a broad range of covers for risks, such as alternative energies, pandemic risks, agricultural risks or entrepreneurial risks in their multitude of different forms, for our clients. Many of these risks in our changed world are now of much greater significance than the perils traditionally covered by the insurance industry.
Together with the primary insurance and reinsurance undertakings of our Group, MEAG plays an important role with its expertise in asset management; as a reinsurer, we also provide life insurance companies outside our Group with integrated financial and reinsurance solutions for the benefit of clients.
Climate change and natural catastrophes
We expect climate change to lead to an increase in weather-related natural catastrophes in the long term. This growing loss potential will result in greater demand for primary insurance and reinsurance products. Our expertise in dealing with natural hazard risks enables us to calculate adequate prices for traditional covers, and develop new solutions for our primary insurance and reinsurance clients.

77Combined management reportProspects
Munich Re Group Annual Report 2018
Prospects Our predictions for the forthcoming development of our Group are based on planning figures, forecasts and expectations. Consequently, the following outlook merely reflects our imperfect assumptions and subjective views. It follows that we do not accept any responsibility or liability in the event that they are not realised in part or in full.
Comparison of the prospects for 2018 with the result achieved
Munich Re (Group)
At the beginning of the year, we projected gross premium in the range of €46–49bn for the 2018 financial year. Given the positive premium development in property-casualty reinsurance, we adjusted this range to €48–49bn in the third quarter. Despite negative currency translation effects, we exceeded the adjusted range and posted €49.1bn, thus achieving roughly the same level as in the previous year.
For the 2018 financial year, we had forecast a consolidated result of €2.1–2.5bn at the start of the year. The figure achieved – €2.3bn – was right in the middle of our anticipated profit guidance range – despite volatile capital markets and high losses from natural catastrophes in the fourth quarter. The return on equity (ROE) amounted to 8.4%.
At €6.5bn, the Group’s investment result (excluding insurance-related investments) fell significantly short of our expectations of over €7bn, especially owing to lower gains on disposal. In the previous year, we had achieved higher gains on disposal to finance the additional interest reserve, in particular in the ERGO Life and Health
Comparison of prospects for Munich Re (Group) for 2018 with results achieved
Target Result 2018 2018Gross premiums written €bn 46–49 49.1Technical result life and health reinsurance1 €m at least 475 584Combined ratio property-casualty reinsurance % 99 99.4Combined ratio ERGO Property-casualty Germany % 96 96.0Combined ratio ERGO Property-casualty International % 97 94.6Return on investment2 % around 3 2.8Economic earnings €bn over 2.1–2.5 1.9Consolidated result €bn 2.1–2.5 2.3
1 Including the result from business with non-significant risk transfer. 2 Excluding insurance-related investments.
5115
It is not only the obvious fluctuations in the incidence of major losses that make an accurate forecast of IFRS results impossible. The pronounced volatility of the capital markets and exchange rates, as well as the special features of IFRS accounting, also make this difficult. Thus, there may be significant fluctuations in the investment result, currency result and consolidated result, despite the fact that our assets are geared to the characteristics of our liabilities.
Germany segment. Munich Re posted a higher net year-on-year balance of write-downs of non-derivative investments for 2018, which owing to price losses on the stock markets mainly affected our equities portfolio. This contrasted with higher regular income, especially owing to increased income from rent and deposit interest, as well as a positive net balance of derivatives. The investment result represents a return of 2.8% overall, which is slightly below the originally anticipated target return on investment of around 3%.
For the 2018 financial year, we had forecast an economic earnings target corridor of “just over €2.1–2.5bn”. With our economic earnings totalling €1.9bn, we did not meet this target. Although the result contribution from business operations met our expectations overall, negative capital market developments had an adverse impact on the measurement of our assets and liabilities. However, effects caused by wider risk spreads on fixed-interest securities and lower share prices were largely offset for the Group by positive developments – in particular from updated property valuations.

Combined management reportProspects
78
ERGO
For the ERGO Life and Health Germany segment, we had forecast total premium income of €9.5–10bn; at €10.0bn, the figure was at the very upper end of our expectations. At €9.3bn, gross premiums written were within the projected range of €9–9.5bn. At the beginning of the year, we had anticipated a decline in premium income to €3–3.5bn for the Life Germany division. Despite the shrinking portfolio, we posted premium volume of €3.4bn, i.e. almost the same level as in the previous year (€3.5bn). Gross premium in Health Germany – €5.4bn – was at the upper end of the target corridor of €5–5.5bn. In German direct business, we had anticipated a marginal increase in gross premium to €1–1.2bn at the beginning of the year. We achieved this target and posted €1.1bn.
The Property-casualty Germany segment posted gross premiums of €3.4bn, which were comfortably within our original target corridor of €3–3.5bn. Our forecast at the start of the year for the combined ratio had been around 96% – provided major losses remained within normal bounds. Although in the first quarter of the year natural catastrophe losses, particularly those from Winter Storm Friederike, had exceeded expectations, we achieved a ratio of exactly 96.0% thanks to a low level of natural catastrophe losses in the second and third quarters.
In ERGO International, we posted a slight increase in gross premiums written to €5.1bn (5.0bn), thus exceeding our forecast of €4.5–5bn from the beginning of the year – despite negative currency translation effects. At €5.3bn, total premium income was in the medium range of our target corridor of €5–5.5bn. At the beginning of the year, we had aimed for a combined ratio of around 97% in the ERGO Property-casualty International segment, provided major losses remained within normal bounds. Thanks to our good performance in the first six months, we were able to reduce our forecast to 96% in the second quarter. Especially in Poland, the positive performance continued into the third and fourth quarters, enabling us to achieve a combined ratio of 94.6% at year-end – considerably better than the forecast.
At the beginning of the year, we had forecast a result in the range of €250–300m for the ERGO field of business. Thanks to the good result for the first nine months, we were able to raise our forecast to over €350m in the third quarter. With a very pleasing consolidated result of €412m, ERGO significantly exceeded the revised forecast. Apart from very good operational performance, particularly in the ERGO International segment, the good result for the year was also attributable to various one-off effects that partly offset each other.
Reinsurance
At the beginning of the financial year, we had forecast gross premiums written of €29–31bn in the reinsurance field of business. At €31.3bn, we surpassed this target. In life and health reinsurance, we had projected an appreciable decline in gross premiums written to €9.5–10.5bn, chiefly on account of the termination of large-volume treaties and negative currency translation effects. With premium income at €10.8bn, the decline was not quite as strong as expected at the beginning of the year. In property-casualty reinsurance, we had forecast gross premiums written of €19.5–20.5bn. At €20.4bn, we were at the upper end of the range, mainly owing to the conclusion of new large-volume treaties.
At the start of the year, we forecast a technical result for life and health reinsurance – including the result from business with non-significant risk transfer – of at least €475m; we significantly surpassed this target and achieved a technical result of €584m, partly thanks to favourable claims experience in the USA.
The combined ratio envisaged for property-casualty reinsurance at the beginning of the financial year was 99% of net earned premiums. Given the low major-loss expenditure in the first quarter, we reduced our forecast for the full year to 97%. Mainly owing to exceptionally high major losses from natural catastrophes in the fourth quarter, we missed this target by 2.4 percentage points and recorded a combined ratio of 99.4%.
The consolidated result for 2018 in reinsurance amounted to €1.9bn, which was in line with our initial expectations of €1.8–2.2bn.

79Combined management reportProspects
Munich Re Group Annual Report 2018
As at 1 January 2019, around half of the non-life reinsurance business was up for renewal, representing a premium volume of €9.4bn. At around €10.0bn, total premium volume written was up 6%. Thanks to our excellent client relationships and our sought-after expertise, we were able to tap into attractive business opportunities across all regions and classes of business. These involved the expansion of existing client relationships as well as new business.
The renewals at 1 April 2019 (mainly Japan) and 1 July 2019 (parts of the portfolio in the USA, Australia and Latin America) will involve the renegotiation of a premium volume of around €5bn in reinsurance treaty business. It is Munich Re’s expectation that the market environment will improve in the April renewals, as treaties in regions with significant claims experience in 2018, such as Japan, will then be renegotiated.
ERGO
Total premium income in 2019 for the ERGO field of business should roughly be at the same level as the previous year – around €18.5bn – with gross premiums written of around €17.5bn. For the ERGO field of business, we anticipate a consolidated result of around €400m in 2019, just slightly below the very good level attained in the 2018 financial year.
In the Life and Health Germany segment, we expect gross premiums written of around €9bn and total premium income of around €10bn. While we anticipate a portfolio reduction in the Life Germany division, both Health Germany and German direct business should see slight growth.
Outlook for 2019
Reinsurance Gross premium in reinsurance as a whole should be around €31bn in 2019, i.e. roughly at the same level as the previous year. Currency translation effects could potentially have a considerable impact on this estimate. We project a consolidated result in reinsurance of around €2.1bn, up on the profit for 2018.
We expect gross premiums written in life and health reinsurance to be around €10bn, some €0.8bn short of the previous year’s figure. The technical result plus the result from business with non-significant risk transfer should amount to about €500m. The result from reinsurance treaties without sufficient risk transfer is recognised under “other operating result” and thus forms part of the non-technical result.
In property-casualty reinsurance, we expect gross premiums written for 2019 to come to about €21bn, around €0.6bn more than the previous year’s figure. We anticipate a combined ratio of around 98% of net earned premiums. At 12% of net earned premiums, our major- loss expectation remains the same as in the previous year, roughly equivalent to €2.3bn.
The reinsurance renewals as at 1 January 2019 once again took place in a very competitive market environment, as reinsurers and capital market players continued to offer substantial capacity for the renewals. Prices for the Munich Re portfolio remained stable overall (+0.0%). Rising interest rates – especially in the US dollar area – led to improved economic profitability despite the lack of price increases.
Outlook for Munich Re (Group)
2019Gross premiums written €bn 49Technical result life and health reinsurance1 €m 500Combined ratio property-casualty reinsurance % 98Combined ratio ERGO Property-casualty Germany % 93Combined ratio ERGO Property-casualty International % 95Return on investment2 % 3Economic earnings €bn over 2.5Consolidated result €bn 2.5
1 Including the result from business with non-significant risk transfer.2 Excluding insurance-related investments.
5118
Combined management reportProspects
80
As in the previous year, we want to incrementally increase our widely diversified investments and investment commitments in the area of alternative investments. Regular income from our investments should come to around 2.8%, roughly at the previous year’s level. Overall, we expect the investment result to be around €6.5bn, i.e. on par with 2018, equivalent to an annual return on investment of around 3%.
We aim to achieve a consolidated result of around €2.5bn, i.e. €0.2bn higher than the previous year’s figure. The effective tax rate should be around 25%. This profit guidance is subject to claims experience with regard to major losses being within normal bounds, to claims provisions remaining unchanged and to our income statement not being impacted by severe currency or capital market movements, significant changes in fiscal parameters, or other special factors.
In the period from June 2018 to the end of February 2019, we bought back shares with a value of €834m; another €166m are to be used for share buy-backs before the Annual General Meeting in April 2019. We are using this measure to return unneeded capital to shareholders. Despite the buy-backs, our good capital position will allow us to continue paying attractive dividends and selectively utilising opportunities for profitable growth.
Subject to approval by the Annual General Meeting, the dividend will rise by 65 cents to €9.25 per share. This is equivalent to a total payout of €1.3bn.
For the Property-casualty Germany segment, we envisage gross premiums written of around €3.5bn. The combined ratio should be around 93%, provided major losses remain within normal bounds.
In the ERGO International segment, we aim to achieve gross premiums written of approximately €5bn, and generate overall premium volume of just over €5bn. There is some uncertainty concerning the demand for single-premium business in life insurance. We expect premium volume to increase year on year in health insurance, and to see a slight reduction in property-casualty insurance. The combined ratio should be around 95%, provided major losses remain within normal bounds.
Munich Re (Group)
We expect the Group’s gross premiums written for 2019 to total around €49bn, on par with the previous year.
For the 2019 financial year, we predict economic earnings of over €2.5bn. The higher target figure compared with the envisaged IFRS result is chiefly due to new business in the life and health reinsurance segment. In economic metrics, corresponding profit contributions fully materialise in the underwriting year and thus earlier than in IFRS.
The projection is based on the assumption of stable capital markets, normal major-loss incidence and unchanged modelling parameters. Deviations from these assumptions may have a different impact on economic earnings than on IFRS accounting. Further information on economic earnings as a management tool can be found on page 48.

81Combined management reportMunich Reinsurance CompanyInformation reported on the basis of German accountancy rules
Munich Re Group Annual Report 2018
Market environment and major factors of influence
The macroeconomic and industry environment of Munich Reinsurance Company essentially corresponds to that of the Group. Further information on this can be found on page 47.
Business performance
In the 2018 financial year, Munich Reinsurance Company’s business performance was pleasing overall. Major-loss expenditure was much lower than in the previous year – which had seen exceptionally high property losses from the Hurricanes Harvey, Irma and Maria – and was below the expected range. The release of loss reserves for prior accident years, which we were able to make following a review of our reserving position, also made a positive contribution to the underwriting result before claims equalisation provision.
The accounting result of Munich Reinsurance Company developed as follows:
Munich Reinsurance Company (information reported on the basis of German accountancy rules) For the 2018 financial year, Munich Re again utilised the option of publishing a combined management report in accordance with Section 315(5) in conjunction with Section 298(2) of the German Commercial Code (HGB). Supplementary to our Munich Re (Group) reporting, this section provides details on the performance of Munich Reinsurance Company.
The annual financial statements of Munich Reinsurance Company are prepared in accordance with German accounting rules (HGB). By contrast, the consolidated financial statements are prepared in accordance with International Financial Reporting Standards (IFRSs). As a result, there are some deviations in the accounting policies – mainly with regard to intangible assets, investments, financial instruments, individual underwriting assets and liabilities, and deferred taxes.
Condensed income statement for Munich Reinsurance Company
2018 Prev. year Change €m €m %Earned premiums for own account 16,856 20,525 –17.9Interest on technical provisions for own account 398 469 –15.3Other underwriting income for own account 18 39 –52.8Claims incurred for own account –11,562 –16,711 30.8Change in other technical provisions for own account 418 –552 –Expenses for performance-related and non-performance-related premium refunds for own account 0 –1 –Operating expenses for own account –4,964 –5,736 13,5Other underwriting expenses for own account –133 –23 –470.6Subtotal 1,031 –1,990 –Change in claims equalisation provision and similar provisions –780 2,382 –Underwriting result for own account 251 392 –36.1Investment income 4,789 4,333 10.5Investment expenses –2,305 –1,257 –83.4Interest income on technical provisions –403 –493 18.3Other income 465 204 128.2Other expenses –617 –546 –13.0Non-technical result 1,929 2,241 –13.9Operating result before tax 2,179 2,634 –17.3Taxes on income and profit and other taxes –20 –434 95.5Profit for the year 2,160 2,199 –1.8Profit brought forward from previous year 47 52 –8.9Transfers from other revenue reserves 0 0 –Appropriations to revenue reserves –824 –918 10.3Net retained profits 1,383 1,333 3.7

Combined management reportMunich Reinsurance CompanyInformation reported on the basis of German accountancy rules
82
Major-loss expenditure totalling €1,316m (3,428m) after retrocession and before tax was significantly lower than in the previous year and fell below our expectations. There were also a large number of major losses in 2018, the largest by far being Typhoon Jebi, which caused severe damage in Japan in September.
Nevertheless, aggregate natural catastrophe losses of €599m (2,862m) were significantly lower than in the previous year, which had been marked by exceptionally high property losses from Hurricanes Harvey, Irma and Maria. In terms of net earned premium, aggregate natural catastrophe losses accounted for 4.7 (20.8) percentage points of the loss ratio.
In property-casualty reinsurance, man-made losses totalled €686m (554m), equivalent to 5.4 (4.0) percentage points of net earned premiums.
The combined ratio, which reflects the relation of claims and costs to net earned premiums, came to 95.3% (113.7%), mainly owing to the above effects.
Performance of the classes of business
In life reinsurance, the decrease in premium income was chiefly attributable to the planned termination and conversion of two large-volume structured reinsurance treaties.
The technical result is significantly above the level of the previous year. The previous year’s result was impacted in part by significant reserve strengthening in Israel. There was also a positive effect from the restructuring of retrocession programmes at US subsidiaries in 2018. By contrast, claims expenditure in the United Kingdom and Canada was slightly higher than expected.
Life
2018 Prev. year Change %Gross premiums written €m 5,754 7,719 –25.5Underwriting resultbefore claims equalisation provision and similar provisions €m 447 –111 –
5205
Technical result
In the 2018 financial year, Munich Reinsurance Company’s gross premium income totalled €20,503m (22,612m). The year-on-year decrease of 9.3% was mainly due to the planned termination and conversion of two large-volume structured reinsurance treaties in life and health reinsurance. Another factor in the reduction was changes in the value of the euro as against other currencies.
Gross premium volume in life and health reinsurance in 2018 was much lower than in the previous year. Gross premium fell sharply by 35.0% to €7,014m (10,798m). A large part of the fall in premium volume was due to the planned termination and conversion of two large-volume structured reinsurance treaties. If exchange rates had remained unchanged, our premium income in life and health reinsurance would have fallen by 33.3% .
In property-casualty reinsurance, we posted growth in premium income of 14.2% to €13,489m (11,813bn) in 2018. The substantial increase was due to an expansion of business across almost all lines and regions. The main driver was a new large-volume reinsurance quota share treaty in Australia. Motor, fire, and liability business were the main sources of growth. This was partially offset by negative currency effects; if exchange rates had remained unchanged, premium volume would have increased by 18.8%. Even after the high natural catastrophe losses of the previous year, the amount of reinsurance capital in the market remained high. Nevertheless, the 2018 renewals showed a marginal price increase of 0.8%, after the previous year had seen prices fall. This increase was particularly due to the regions hit by natural catastrophes. In other regions and lines of business, prices remained largely stable or increased slightly. A higher interest-rate level compared with the previous year further strengthened the profitability of our business. New attractive quota share treaties were major contributory factors that allowed for selective expansion of our business in individual markets. Overall, we are adhering to our profit-oriented underwriting policy.
The underwriting result before claims equalisation provision amounted to €1,031m in the 2018 financial year, compared with a loss of €1,990m in the previous year. This improvement in the result was primarily due to much lower major-loss expenditure in comparison with the previous year. In addition, a customary review of provisions for the full year resulted in a reduction in the provisions for claims from prior years, which was at a higher level than in the previous year. Over the years, the safety margin in the provisions has remained unchanged at a high level.

83Combined management reportMunich Reinsurance CompanyInformation reported on the basis of German accountancy rules
Munich Re Group Annual Report 2018
provision to improve significantly year on year. In addition, more loss reserves for prior accident years could be released.
Premium volume in motor reinsurance increased significantly in the reporting year. This was mainly driven by a new large-volume reinsurance quota share treaty in Australia and business expansion in various other markets. But the technical result was lower than in the previous year, primarily on account of reduced reserve releases for claims from prior accident years.
In marine reinsurance, premium volume was up slightly in the reporting year. The result before claims equalisation provision improved appreciably owing to lower major-loss expenditure than in the previous year.
Motor
2018 Prev. year Change %Gross premiums written €m 3,953 2,970 33.1Combined ratio % 106.7 105.9 Underwriting resultbefore claims equalisation provision and similar provisions €m –217 –153 –42.2
5225
Marine
2018 Prev. year Change %Gross premiums written €m 317 277 14.3Combined ratio % 30.0 73.1 Underwriting resultbefore claims equalisation provision and similar provisions €m 180 73 148.1
5230
Aviation
2018 Prev. year Change %Gross premiums written €m 392 486 –19.4Combined ratio % 86.0 73.3 Underwriting resultbefore claims equalisation provision and similar provisions €m 58 132 –56.3
5235
In health reinsurance, the decrease in premium income was also chiefly attributable to the planned termination and conversion of two large-volume structured reinsurance treaties. The result was slightly up on the previous year due to a lower loss ratio.
In personal accident reinsurance, premium income was up slightly in the reporting year. The result before claims equalisation provision improved appreciably owing to lower claims expenditure than in the previous year.
In third-party liability reinsurance, premium income increased in the reporting year mainly on account of new business. A significant decrease in major-loss expenditure caused the underwriting result before claims equalisation
Health
2018 Prev. year Change %Gross premiums written €m 1,260 3,079 –59.1Combined ratio % 97.0 99.5 Underwriting resultbefore claims equalisation provision and similar provisions €m 32 14 135.2
5210
Personal accident
2018 Prev. year Change %Gross premiums written €m 261 236 10.9Combined ratio % 4.5 55.8 Underwriting resultbefore claims equalisation provision and similar provisions €m 225 105 113.4
5215
Third-party liability
2018 Prev. year Change %Gross premiums written €m 1,937 1,668 16.1Combined ratio % 106.7 138.3 Underwriting resultbefore claims equalisation provision and similar provisions €m –123 –634 80.6
5220

Combined management reportMunich Reinsurance CompanyInformation reported on the basis of German accountancy rules
84
Under other classes of business, we subsume the remaining classes of property reinsurance, such as burglary, plate glass, hail (including agricultural reinsurance), water damage, contingency, windstorm, livestock and householders’ and homeowners’ comprehensive reinsurance – as well as credit and fidelity guarantee reinsurance.
Year-on-year premium income remained almost constant. The combined technical result of these other classes of business improved strongly compared with the previous year, primarily due to lower claims and major-loss expenditure.
Non-technical result
In Europe, the low interest-rate environment continued to pose major challenges for investors: although yields on ten-year German government bonds rose to over 0.7% in January 2018, they fell again over the further course of the year.
Yields on ten-year US government bonds increased during the course of the year to over 3.2%. The rise was driven by strong economic growth, higher inflation and monetary tightening. Towards the end of the year, however, yields fell again due to increasing risk aversion on global capital markets.
International equity markets suffered repeated bouts of turbulence during the past financial year, such as the global price slump in February 2018. After some recovery in the second and third quarters, volatility on equity markets increased in the fourth quarter and remained high until the end of the year. Overall, the US Dow Jones index and the EuroStoxx 50 closed the year with heavy losses.
The exchange rate between the euro and the US dollar fluctuated over the course of 2018. It rose at the beginning of the year, later fell back significantly, and hit a low point in November 2018. At the end of December, the euro exchange rate was around 5% lower against the US dollar than at the end of 2017, but higher against the Canadian dollar (around 4%) and the pound sterling (around 1%).
Other classes
2018 Prev. year Change %Gross premiums written €m 2,358 2,332 1.1Combined ratio % 92.3 102.7 Underwriting resultbefore claims equalisation provision and similar provisions €m 163 –42 –
5250
Premium income in aviation reinsurance, which comprises the aviation and space classes, decreased in the financial year. This was due to the fact that business that had previously been written by Munich Reinsurance Company was transferred to a subsidiary. The technical result declined due to higher claims expenditure than in the previous year.
The increase in premium income in fire reinsurance was largely attributable to new business in various markets. After generating a loss in the previous year, the underwriting result before claims equalisation provision moved into positive territory in the reporting year. The main reason for this positive development was a significant reduction in major-loss expenditure.
In engineering reinsurance (machinery, EAR, CAR, EEI, etc.), premium income increased slightly on the previous year. After recording a loss in the previous year, the technical result for 2018 was positive. This was partly due to a fall in major-loss expenditure, partly because more loss reserves for prior accident years were released than in the previous year.
Fire
2018 Prev. year Change %Gross premiums written €m 3,658 3,278 11.6Combined ratio % 91.9 142.8 Underwriting resultbefore claims equalisation provision and similar provisions €m 237 –1,248
5240
Engineering
2018 Prev. year Change %Gross premiums written €m 613 567 8.1Combined ratio % 94.8 122.0 Underwriting resultbefore claims equalisation provision and similar provisions €m 29 –125 –
5245

85Combined management reportMunich Reinsurance CompanyInformation reported on the basis of German accountancy rules
Munich Re Group Annual Report 2018
In the 2018 financial year, Munich Reinsurance Company’s return on investment (including deposits retained on assumed reinsurance) totalled 3.3% (3.9%) on the basis of carrying amounts.
In the 2018 financial year, Munich Reinsurance Company’s investment result fell by €593m, mainly due to a decrease in regular income caused by dividend payouts. Impairment losses and reversals of impairment losses largely balanced each other out due to counterbalancing effects. The significant improvement in gains on the
Investment result
€m 2018 Prev. yearRegular income 1,659 3,152Write-ups and write-downs 37 –70Realised gains/losses on the disposal of investments 980 170Other income/expenses –194 –175Total 2,483 3,076
5255
disposal of investments could not fully compensate for the fall in regular income.
The gains on disposal resulted mainly from property contributions to affiliated companies of Munich Reinsurance Company, taking into account organisational, tax and commercial law aspects.
Profit for the year
Munich Reinsurance Company generated a profit of €2,160m (2,199m).
The result was driven by a solid technical result – which was in part marked by significant allocations to the claims equalisation provision – an improved currency result and a reduced tax burden.
The lower tax expenditure in 2018 compared with the previous year is due to the fall in taxable income at the German parent company and a decrease in the tax burden for previous years.
Financial position
In the 2018 financial year, Munich Reinsurance Company generated net retained profits of €1,383m (1,333m) according to German accountancy rules (HGB). Including these net retained profits, the Company’s revenue reserves amounted to €4,283m (4,422m) as at the reporting date, of which €465m (376m) is subject to a restriction on distribution. The distributable funds thus amount to €3,818m (4,046m).
Balance sheet structure of Munich Reinsurance Company
2018 Prev. year Change €m €m %Intangible assets 186 188 –1.3Investments 74,450 76,679 –2.9Receivables 10,184 7,051 44.4Other assets 971 601 61.5Deferred items 355 270 31.4Excess of plan assets over pension liabilities 453 456 –0.8Total assets 86,598 85,246 1.6Equity 11,701 11,841 –1.2Subordinated liabilities 3,651 2,745 33.0Technical provisions 59,133 60,036 –1.5Other provisions 1,991 2,299 –13.4Deposits retained on retroceded business 1,407 1,686 –16.5Other liabilities 8,686 6,620 31.2Deferred items 28 19 43.7Total equity and liabilities 86,598 85,246 1.6
5260
The shareholders’ equity of Munich Reinsurance Company as determined under German accountancy rules is protected effectively against the risk of loss arising from a random accumulation of losses by the claims equalisation provision totalling €8,479m (7,724m). Given our robust capital position according to all calculation methods, we intend – subject to the approval of the Annual General Meeting – to pay our shareholders an increased dividend of €9.25 per share for the 2018 financial year, or €1,334m in total, from Munich Reinsurance Company’s net retained profits.

Combined management reportMunich Reinsurance CompanyInformation reported on the basis of German accountancy rules
86
The carrying amount of Munich Reinsurance Company’s investments excluding deposits retained on assumed reinsurance increased slightly to €64,296m (64,010m).
As at 31 December 2018, 95% of our fixed-interest securities were investment-grade, and around 88% were rated “A” or better.
1 Information on Section 160(1) no. 2 of the German Stock Corporation Act can be found on page 23 of Munich Reinsurance Company’s Annual Report 2018.
Pursuant to German commercial and company law, dividends and share buy-backs may only be paid out of profits and revenue reserves. Besides the expenses and income incurred in the current year, changes in the claims equalisation provision also have a significant influence on the level of profits.
The claims equalisation provision is established for individual classes of property-casualty business. It serves to smooth significant fluctuations in loss experience over a number of years. Its recognition and measurement are largely governed by legal provisions.
If, in a given financial year, loss ratios in individual classes of business are significantly in excess of the long-term average (which amounts to 15 years in most classes), the claims equalisation provision is reduced and the above-average loss expenditure is largely offset. According to current calculations, it is expected that – given normal claims expenditure – the allocations to the claims equalisation provision, which have an adverse impact on the result, will be lower.
The target or maximum amount allowed for the claims equalisation provision, which is essentially calculated on the basis of earned premiums and the standard deviation of the loss ratio in the respective class of insurance, determines the amount of the annual non-performance-related allocation to the claims equalisation provision. The performance-related change in the claims equalisation provision is added to this figure in years in which claims experience is favourable (i.e. when the random occurrence of claims is below average), whereas amounts are withdrawn in years in which claims experience is adverse (i.e. the random occurrence of claims is above average).
Munich Re Group Annual Report 2018
Equity1
€m 2018 Prev. yearIssued capital 573 573Capital reserve 6,845 6,845Revenue reserves 2,900 3,089Net retained profits 1,383 1,333Equity 11,701 11,8415265
The balance sheet item “claims equalisation provision and similar provisions” increased by €780m to €9,043m (8,263m) in the 2018 financial year. Owing to the positive results, we had to allocate significant amounts to the claims equalisation provision in some classes of business – especially in third-party liability €190m (–258m),fire €152m (–1,419m) and motor €150m (77m), as wellas in other classes €103m (72m), personal accident €82m(166m), credit €81m (–100m) and engineering €37m (–127m).
By contrast, due to the fall in the maximum amount allowed the claims equalisation provision in marine was reduced by –€41m (–92m).
No claims equalisation provision is currently established for aviation, as the conditions for setting aside a provision in this class of business are not met.
The current level of the claims equalisation provision is 100% of the legally stipulated maximum amount allowed in the liability, marine, and accident classes of business, and more than 50% in fire, motor and credit.
Liquidity
Our liquidity is ensured at all times by means of detailed liquidity planning. As a rule, the Company generates significant liquidity from its premium income, from regular investment income and from investments that mature. We also attach great importance to the credit rating and fungibility of our investments. Given the maturity structure of the outstanding bonds and the credit facilities employed (which are, in any case, relatively insignificant in scope), there are no refinancing requirements.
Statement on Corporate Governance for the 2018 financial year pursuant to Section 289f and Section 315d of the German Commercial Code (HGB)
Munich Reinsurance Company has submitted the Statement of Corporate Governance in accordance with Section 289f of the Commercial Code (HGB), and the Group Statement of Corporate Governance in accordance with Section 315d of the Commercial Code. The Statements have been combined and can be found at www.munichre.com/cg-en.

87Combined management reportMunich Reinsurance CompanyInformation reported on the basis of German accountancy rules
Munich Re Group Annual Report 2018
Prospects
The projections by Munich Reinsurance Company about the future development of its business are essentially subject to the same influences as the reinsurance life and health and reinsurance property-casualty segments presented in the consolidated financial statements. You will find this information on page 79.
Against this background, Munich Reinsurance Company should post gross premium of around €21bn in the 2019 financial year – assuming that exchange rates remain constant. We expect the combined ratio to be around 98% of net earned premium. An accurate forecast is not possible, partly due to the obvious fluctuations in the incidence of major losses. Assuming average claims experience, we project that the underwriting result before claims equalisation provision for the 2019 financial year will be at around the same level as the reporting year.
The investment result of Munich Reinsurance Company is expected to decrease in the 2019 financial year. The forecast increase in regular income, particularly from affiliated companies, is unlikely to fully compensate for the effects of net gains and losses on disposal in 2018.
As things stand at present, we expect to achieve an adequate German GAAP (HGB) result in 2019, although it is likely to be lower than in the reporting year.
Further information
Risks and opportunities
The business performance of Munich Reinsurance Company is largely subject to the same risks and opportunities as the performance of the reinsurance field of business presented in the consolidated financial statements. Munich Reinsurance Company generally participates in the risks of its shareholdings and subsidiaries in accordance with its respective percentage interest held. Munich Reinsurance Company is integrated in the Group-wide risk management system and internal control system of the Group. Further information is provided in the risk report on page 66 ff. and in the opportunities report on page 75 f.
Remuneration report of Munich Reinsurance CompanyThe principles regarding the structure and design of the compensation system of Munich Reinsurance Company correspond to those of the Group. The remuneration report can be found on page 29 ff.
Other information
On 31 December 2018, Munich Reinsurance Company had 4,043 employees.
Munich Reinsurance Company has branches in Australia, China, France, the United Kingdom, Hong Kong, India, Italy, Japan, Canada, Malaysia, New Zealand, Singapore, Spain and South Korea.


Fina
ncia
l sta
tem
ents
and
not
es3
89Consolidated financial statements and notes
90Consolidated financial statementsContents
Consolidated balance sheet 092Consolidated income statement 094Statement of recognised income and expense 095Group statement of changes in equity 096Consolidated cash flow statement 098
Notes to the consolidated financial statements 099Application of International Financial Reporting Standards (IFRSs) 099Declaration of Conformity with the German Corporate Governance Code in accordance with Section 161 of the German Stock Corporation Act (AktG) 099Recognition and measurement 099Consolidation 104
Assets 109A Intangible assets 109B Investments 109C Insurance-related investments 111D Ceded share of technical provisions 112E Receivables 112F Cash at banks, cheques and cash in hand 112G Deferred acquisition costs 112H Deferred tax assets 112I Other assets 112 J Assets held for sale 112
Equity and liabilities 113A Equity 113B Subordinated liabilities 113C Gross technical provisions 113D Gross technical provisions for unit-linked life insurance 115E Other provisions 115F Liabilities 115G Deferred tax liabilities 115 H Liabilities related to assets held for sale 115
Foreign currency translation 116
Segment reporting 117Segment assets 118Segment equity and liabilities 118Segment income statement 120Other disclosures 120Notes on determining the combined ratio 122 Non-current assets by country 122Investments in non-current assets per segment 122Gross premiums written 122
Notes to the consolidated balance sheet – Assets 12301 Goodwill 12302 Other intangible assets 12403 Land and buildings, including buildings on third-party land 12604 Hierarchy for the fair value measurement of investments 12605 Investments in affiliated companies, associates and joint ventures 13206 Loans 13207 Other securities available for sale 13308 Other securities at fair value through profit or loss and insurance-related investments 134

91Consolidated financial statementsContents
09 Deposits retained on assumed reinsurance 13510 Other investments 13511 Ceded share of technical provisions 13612 Other receivables 13613 Deferred acquisition costs 13714 Deferred tax 13815 Other assets 13916 Assets held for sale 140
Notes to the consolidated balance sheet – Equity and liabilities 14117 Equity 14118 Fair value hierarchy of liabilities 142 19 Subordinated liabilities 14420 Unearned premiums 14421 Provision for future policy benefits 14522 Provision for outstanding claims 14523 Other technical provisions 14824 Gross technical provisions for unit-linked life insurance 14825 Other provisions 14926 Bonds and notes issued 15327 Deposits retained on ceded business 15328 Other liabilities 15329 Liabilities from financing activities 154
Notes to the consolidated income statement 15530 Premiums 15531 Income from technical interest 15532 Expenses for claims and benefits 15633 Operating expenses 15634 Investment result 15735 Insurance-related investment result 15736 Other operating result 15737 Other non-operating result, impairment losses on goodwill and net finance costs 15838 Taxes on income 158
Disclosures on risks from insurance contracts and financial instruments 15939 Disclosures on risks from life and health insurance business 15940 Disclosures on risks from property-casualty insurance business 161
Other information 16541 Parent 16542 Related parties 16543 Personnel expenses 16544 Mid-Term Incentive Plan 16545 Remuneration report 16646 Number of staff 16647 Auditor’s fees 16648 Contingent liabilities, other financial commitments 16749 Significant restrictions 16850 Leasing 16851 Events after the balance sheet date 16952 Earnings per share 16953 Proposal for appropriation of profit 169
List of shareholdings as at 31 December 2018 pursuant toSection 313(2) of the German Commercial Code (HGB) 170

Consolidated financial statementsConsolidated balance sheet
92
Consolidated balance sheet as at 31 December 2018
Assets
Notes 31.12.2018 Prev. year Change €m €m €m €m €m %A. Intangible assets I. Goodwill (1) 2,904 2,584 320 12.4 II. Other intangible assets (2) 1,161 1,105 55 5.0 4,064 3,689 375 10.2B. Investments I. Land and buildings, including buildings on third-party land (3) 5,851 5,121 730 14.3 II. Investments in affiliated companies, associates and joint ventures (5) 2,509 2,216 293 13.2 Thereof: Associates and joint ventures accounted for using the equity method 2,296 2,010 286 14.2 III. Loans (6) 54,845 54,702 143 0.3 IV. Other securities 1. Available for sale (7) 139,272 143,845 –4,572 –3.2 2. At fair value through profit or loss (8) 2,616 1,979 636 32.1 141,888 145,824 –3,936 –2.7 V. Deposits retained on assumed reinsurance (9) 7,241 5,690 1,550 27.2 VI. Other investments (10) 4,518 4,009 509 12.7 216,852 217,562 –710 –0.3C. Insurance-related investments (8) 8,424 9,664 –1,239 –12.8D. Ceded share of technical provisions (11) 4,263 4,169 93 2.2E. Receivables I. Current tax receivables 604 440 164 37.3 II. Other receivables (12) 17,239 13,385 3,854 28.8 17,842 13,825 4,018 29.1F. Cash at banks, cheques and cash in hand 4,986 3,625 1,360 37.5G. Deferred acquisition costs (13) Gross 9,466 9,563 –97 –1.0 Ceded share –254 –135 –119 –88.2 Net 9,212 9,428 –216 –2.3H. Deferred tax assets (14) 545 534 10 2.0I. Other assets (15) 2,950 3,107 –157 –5.1J. Assets held for sale (16) 1,029 118 911 773.8Total assets 270,168 265,722 4,446 1.7
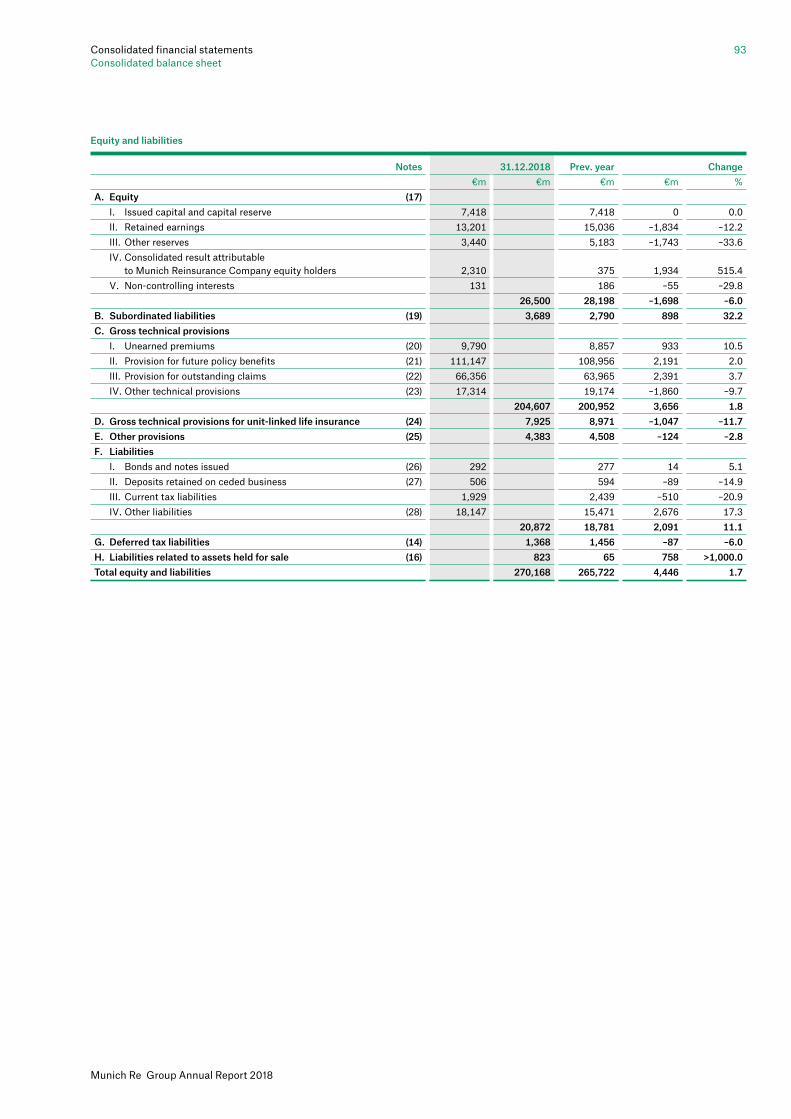
93Consolidated financial statementsConsolidated balance sheet
Munich Re Group Annual Report 2018
Equity and liabilities
Notes 31.12.2018 Prev. year Change €m €m €m €m %A. Equity (17) I. Issued capital and capital reserve 7,418 7,418 0 0.0 II. Retained earnings 13,201 15,036 –1,834 –12.2 III. Other reserves 3,440 5,183 –1,743 –33.6 IV. Consolidated result attributable to Munich Reinsurance Company equity holders 2,310 375 1,934 515.4 V. Non-controlling interests 131 186 –55 –29.8 26,500 28,198 –1,698 –6.0B. Subordinated liabilities (19) 3,689 2,790 898 32.2C. Gross technical provisions I. Unearned premiums (20) 9,790 8,857 933 10.5 II. Provision for future policy benefits (21) 111,147 108,956 2,191 2.0 III. Provision for outstanding claims (22) 66,356 63,965 2,391 3.7 IV. Other technical provisions (23) 17,314 19,174 –1,860 –9.7 204,607 200,952 3,656 1.8D. Gross technical provisions for unit-linked life insurance (24) 7,925 8,971 –1,047 –11.7E. Other provisions (25) 4,383 4,508 –124 –2.8F. Liabilities I. Bonds and notes issued (26) 292 277 14 5.1 II. Deposits retained on ceded business (27) 506 594 –89 –14.9 III. Current tax liabilities 1,929 2,439 –510 –20.9 IV. Other liabilities (28) 18,147 15,471 2,676 17.3 20,872 18,781 2,091 11.1G. Deferred tax liabilities (14) 1,368 1,456 –87 –6.0H. Liabilities related to assets held for sale (16) 823 65 758 >1,000.0Total equity and liabilities 270,168 265,722 4,446 1.7

94Consolidated financial statementsConsolidated income statement
Consolidated income statement for the 2018 financial year
» Consolidated income statement (XLS, 44 KB)Items
Notes 2018 Prev. year Change €m €m €m €m €m %Gross premiums written 49,064 49,115 –51 –0.1 1. Earned premiums (30) Gross 48,019 48,691 –672 –1.4 Ceded share –2,284 –1,528 –757 –49.5 Net 45,735 47,164 –1,429 –3.0 2. Income from technical interest (31) 4,747 6,376 –1,629 –25.5 3. Expenses for claims and benefits (32) Gross –36,366 –43,194 6,829 15.8 Ceded share 1,250 1,549 –299 –19.3 Net –35,116 –41,645 6,529 15.7 4. Operating expenses (33) Gross –13,105 –12,498 –607 –4.9 Ceded share 518 313 206 65.8 Net –12,587 –12,186 –401 –3.3 5. Technical result (1– 4) 2,779 –292 3,070 – 6. Investment result (34) 6,526 7,611 –1,085 –14.3 Thereof: Income from associates and joint ventures accounted for using the equity method 187 145 41 28.5 7. Insurance-related investment result (35) –685 443 –1,128 – 8. Other operating income (36) 827 778 49 6.3 9. Other operating expenses (36) –976 –924 –52 –5.6 10. Deduction of income from technical interest –4,747 –6,376 1,629 25.5 11. Non-technical result (6– 10) 946 1,533 –586 –38.3 12. Operating result 3,725 1,241 2,484 200.2 13. Other non-operating result (37) –672 –926 253 27.4 14. Impairment losses on goodwill (37) –6 –9 3 32.7 15. Net finance costs (37) –196 –211 16 7.5 16. Taxes on income (38) –576 298 –873 – 17. Consolidated result 2,275 392 1,883 480.2 Thereof: Attributable to Munich Reinsurance Company equity holders 2,310 375 1,934 515.4 Attributable to non-controlling interests (17) –34 17 –51 – Notes € € € %Earnings per share (52) 15.53 2.44 13.10 537.5

95
Munich Re Group Annual Report 2018
Consolidated financial statementsStatement of recognised income and expense
Statement of recognised income and expense for the 2018 financial year
€m 2018 Prev. yearConsolidated result 2,275 392 Currency translation
Gains (losses) recognised in equity 345 –1,837Recognised in the consolidated income statement 0 0
Unrealised gains and losses on investments Gains (losses) recognised in equity –1,602 970Recognised in the consolidated income statement –527 –610
Change resulting from equity method measurement Gains (losses) recognised in equity 47 –20Recognised in the consolidated income statement 0 0
Change resulting from cash flow hedges Gains (losses) recognised in equity 0 –1Recognised in the consolidated income statement 0 0
Other changes –1 4I. Items where income and expenses recognised directly in equity are reallocated into the consolidated income statement –1,738 –1,494 Remeasurements of defined benefit plans 78 –36 Other changes 0 0II. Items where income and expenses recognised directly in equity are not reallocated to the consolidated income statement 78 –36Income and expense recognised directly in equity (I + II) –1,659 –1,530Total recognised income and expense 616 –1,138Thereof: Attributable to Munich Reinsurance Company equity holders 658 –1,146Attributable to non-controlling interests –42 9

96Consolidated financial statementsGroup statement of changes in equity
Group statement of changes in equity for the 2018 financial year
Equity attributable to Munich Reinsurance Company Non-controlling Total equity holders interests equity Consolidated Issued capital Capital reserve Retained earnings Other reserves result Retained Remeasurement earnings before Unrealised Currency gains/losses deduction of Treasury gains and translation from cash flow €m own shares shares losses reserve hedges Balance at 31.12.2016 573 6,845 15,544 –654 4,441 2,195 –8 2,580 269 31,785Allocation to retained earnings 0 0 1,247 0 0 0 0 –1,247 0 0Consolidated result 0 0 0 0 0 0 0 375 17 392Income and expense recognised directly in equity 0 0 –76 0 370 –1,831 16 0 –8 –1,530
Currency translation 0 0 0 0 0 –1,831 0 0 –7 –1,837Unrealised gains and losses on investments 0 0 0 0 366 0 0 0 –6 360Change resulting from equity method measurement 0 0 –41 0 4 0 16 0 0 –20Change resulting from cash flow hedges 0 0 0 0 0 0 –1 0 0 –1Remeasurements of defined benefit plans 0 0 –37 0 0 0 0 0 1 –36Other changes 0 0 1 0 0 0 0 0 3 4
Total recognised income and expense 0 0 –76 0 370 –1,831 16 375 9 –1,138Change in shareholdings in subsidiaries 0 0 –9 0 0 0 0 0 –87 –97Change in consolidated group 0 0 0 0 0 0 0 0 0 0Dividend 0 0 0 0 0 0 0 –1,333 –4 –1,338Purchase/sale of own shares –21 0 0 –994 0 0 0 0 0 –1,015Retirement of own shares 22 0 –1,002 980 0 0 0 0 0 0Balance at 31.12.2017 573 6,845 15,703 –668 4,811 365 7 375 186 28,198Allocation to retained earnings 0 0 –911 0 0 0 0 911 0 0Consolidated result 0 0 0 0 0 0 0 2,310 –34 2,275Income and expense recognised directly in equity 0 0 91 0 –2,095 344 9 0 –8 –1,659
Currency translation 0 0 0 0 0 344 0 0 1 345Unrealised gains and losses on investments 0 0 0 0 –2,120 0 0 0 –9 –2,129Change resulting from equity method measurement 0 0 13 0 25 0 9 0 0 47Change resulting from cash flow hedges 0 0 0 0 0 0 0 0 0 0Remeasurements of defined benefit plans 0 0 78 0 0 0 0 0 0 78Other changes 0 0 –1 0 0 0 0 0 0 –1
Total recognised income and expense 0 0 91 0 –2,095 344 9 2,310 –42 616Change in shareholdings in subsidiaries 0 0 0 0 0 0 0 0 0 –1Change in consolidated group 0 0 0 0 0 0 0 0 –12 –12Dividend 0 0 0 0 0 0 0 –1,286 –1 –1,287Purchase/sale of own shares –21 0 0 –993 0 0 0 0 0 –1,014Retirement of own shares 21 0 –1,000 979 0 0 0 0 0 0Balance at 31.12.2018 573 6,845 13,883 –681 2,715 709 16 2,310 131 26,500

97
Munich Re Group Annual Report 2018
Consolidated financial statementsGroup statement of changes in equity
Equity attributable to Munich Reinsurance Company Non-controlling Total equity holders interests equity Consolidated Issued capital Capital reserve Retained earnings Other reserves result Retained Remeasurement earnings before Unrealised Currency gains/losses deduction of Treasury gains and translation from cash flow €m own shares shares losses reserve hedges Balance at 31.12.2016 573 6,845 15,544 –654 4,441 2,195 –8 2,580 269 31,785Allocation to retained earnings 0 0 1,247 0 0 0 0 –1,247 0 0Consolidated result 0 0 0 0 0 0 0 375 17 392Income and expense recognised directly in equity 0 0 –76 0 370 –1,831 16 0 –8 –1,530
Currency translation 0 0 0 0 0 –1,831 0 0 –7 –1,837Unrealised gains and losses on investments 0 0 0 0 366 0 0 0 –6 360Change resulting from equity method measurement 0 0 –41 0 4 0 16 0 0 –20Change resulting from cash flow hedges 0 0 0 0 0 0 –1 0 0 –1Remeasurements of defined benefit plans 0 0 –37 0 0 0 0 0 1 –36Other changes 0 0 1 0 0 0 0 0 3 4
Total recognised income and expense 0 0 –76 0 370 –1,831 16 375 9 –1,138Change in shareholdings in subsidiaries 0 0 –9 0 0 0 0 0 –87 –97Change in consolidated group 0 0 0 0 0 0 0 0 0 0Dividend 0 0 0 0 0 0 0 –1,333 –4 –1,338Purchase/sale of own shares –21 0 0 –994 0 0 0 0 0 –1,015Retirement of own shares 22 0 –1,002 980 0 0 0 0 0 0Balance at 31.12.2017 573 6,845 15,703 –668 4,811 365 7 375 186 28,198Allocation to retained earnings 0 0 –911 0 0 0 0 911 0 0Consolidated result 0 0 0 0 0 0 0 2,310 –34 2,275Income and expense recognised directly in equity 0 0 91 0 –2,095 344 9 0 –8 –1,659
Currency translation 0 0 0 0 0 344 0 0 1 345Unrealised gains and losses on investments 0 0 0 0 –2,120 0 0 0 –9 –2,129Change resulting from equity method measurement 0 0 13 0 25 0 9 0 0 47Change resulting from cash flow hedges 0 0 0 0 0 0 0 0 0 0Remeasurements of defined benefit plans 0 0 78 0 0 0 0 0 0 78Other changes 0 0 –1 0 0 0 0 0 0 –1
Total recognised income and expense 0 0 91 0 –2,095 344 9 2,310 –42 616Change in shareholdings in subsidiaries 0 0 0 0 0 0 0 0 0 –1Change in consolidated group 0 0 0 0 0 0 0 0 –12 –12Dividend 0 0 0 0 0 0 0 –1,286 –1 –1,287Purchase/sale of own shares –21 0 0 –993 0 0 0 0 0 –1,014Retirement of own shares 21 0 –1,000 979 0 0 0 0 0 0Balance at 31.12.2018 573 6,845 13,883 –681 2,715 709 16 2,310 131 26,500

98Consolidated financial statementsConsolidated cash flow statement
Consolidated cash flow statement for the 2018 financial year
€m 2018 Prev. yearConsolidated result 2,275 392
Net change in technical provisions 4,449 6,003Change in deferred acquisition costs 118 107Change in deposits retained and accounts receivable and payable –2,072 –1,580Change in other receivables and liabilities –1,232 –1,544Gains and losses on the disposal of investments and insurance-related investments –1,672 –2,134Change in securities at fair value through profit or loss –534 300Change in other balance sheet items –119 –286Other non-cash income and expenses 1,785 575
I. Cash flows from operating activities 2,998 1,833Change from losing control of consolidated subsidiaries 72 9Change from obtaining control of consolidated subsidiaries –889 –48Change from the acquisition, sale and maturity of investments and insurance-related investments 140 2,142Change from the acquisition and sale of investments for unit-linked life insurance contracts 485 99Other 97 124
II. Cash flows from investing activities –95 2,326Inflows from increases in capital and from non-controlling interests 0 0Outflows to ownership interests and non-controlling interests –1,015 –1,034Dividend payments –1,287 –1,338Change from other financing activities 963 –1,382
III. Cash flows from financing activities –1,338 –3,754Cash flows for the financial year (I + II + III)1 1,565 405
Effect of exchange-rate changes on cash and cash equivalents –40 –130Cash at the beginning of the financial year 3,625 3,353Cash at the end of the financial year 5,150 3,628
Thereof: Cash not attributable to disposal group2 4,986 3,625Cash attributable to disposal group 164 3Restricted cash 12 45
Additional information Income tax paid (net) – included in the cash inflows from operating activities –638 –225Dividends received 700 638Interest received 5,225 5,236Interest paid –315 –362
1 Cash mainly comprises cash at banks. 2 For a definition of the disposal group, see Assets – J Assets held for sale.

99Consolidated financial statementsNotes
Munich Re Group Annual Report 2018
Discretionary judgements and estimates are of significance for the following items in particular and are described in more detail in the respective explanatory Notes:
− Consolidated group − Goodwill and other intangible assets − Fair values and impairments of financial instruments − Deferred acquisition costs − Technical provisions − Provisions for post-employment benefits − Deferred tax − Contingent liabilities
Presentation currency and rounding of figures
Our presentation currency is the euro (€). Amounts are rounded to million euros. Due to rounding, there may be minor deviations in summations and in the calculation of percentages, with figures in brackets referring to the previous year. Expenses, outflows and losses are shown using the minus sign unless it is clear from the context that these figures represent expenses, outflows and losses; income and inflows are shown without a plus or minus sign.
Figures for previous years
Retrospective adjustments have been made to the segment balance sheet for the 2017 financial year in the Notes to the consolidated financial statements (see section “Changes in accounting policies and other adjustments”). The other previous-year figures have been calculated on the same basis as the figures for the 2018 financial year.
Changes in accounting policies and other adjustmentsApplication of the recognition, measurement and disclosure methods follows the principle of consistency.
In the 2018 financial year, the following amended IFRSs had to be applied for the first time, after having been adopted into European law.
− IFRS 15 (5/2014), Revenue from Contracts with Customers − Clarification of IFRS 15 (4/2016), Revenue from Contracts with Customers − Amendments to IFRS 2 (rev. 6/2016), Classification and Measurement of Share-based Payment Transactions − Amendments to IFRS 4 (rev. 9/2016): Applying IFRS 9 Financial Instruments with IFRS 4 Insurance Contracts − Amendments to IAS 40 (rev. 12/2016), Transfers of Investment Property − Annual Improvements to IFRS Standards 2014–2016 Cycle (12/2016): Amendments to IFRS 1, First-time Adoption of International Financial Reporting Standards, and IAS 28, Investments in Associates and Joint Ventures − IFRIC 22 (12/2016), Foreign Currency Transactions and Advance Consideration
Recognition and measurement
Use of judgements and estimates in recognition and measurementIn preparing the consolidated financial statements, we have to use our judgement in applying accounting policies and to make estimates and assumptions that affect the year-end items shown in the consolidated balance sheet, the consolidated income statement and the disclosures on contingent liabilities.
Particularly in primary insurance and reinsurance, the use of estimates for measuring technical provisions is of substantial significance, given that measurement is invariably based on models and the development of future cash flows from insurance contracts cannot be conclusively predicted. But judgements and estimates play a significant role in the case of other items as well.
Our internal processes are geared to determining amounts as accurately as possible, taking into account all the relevant information. The basis for determining amounts is management’s best knowledge regarding the items concerned at the reporting date. Nevertheless, it is in the nature of these items that estimates may have to be adjusted in the course of time to take account of new knowledge.
Notes to the consolidated financial statementsApplication of International Financial Reporting Standards (IFRSs)
Munich Re’s consolidated financial statements have been prepared on the basis of the International Financial Reporting Standards (IFRSs), as adopted by the EU, and the additional requirements of German commercial law pursuant to Section 315e(1) of the German Commercial Code (HGB).
In accordance with the provisions of IFRS 4, Insurance contracts, underwriting items are recognised and measured on the basis of US GAAP (United States Generally Accepted Accounting Principles) at first-time adoption of IFRS 4 on 1 January 2005.
Declaration of Conformity with the German Corporate Governance Code in accordance with Section 161 of the German Stock Corporation Act (AktG)
In November 2018, the Board of Management and Supervisory Board of Munich Reinsurance Company published an updated Declaration of Conformity with the German Corporate Governance Code in accordance with Section 161 of the German Stock Corporation Act (AktG), and made this Declaration permanently available to shareholders on the internet at www.munichre.com/cg-en.

Consolidated financial statementsNotes
100
time of measurement more than 90% of total liabilities were related to insurance business. Besides liabilities that fall within the scope of IFRS 4, these also include liabilities from investment contracts measured at fair value and other liabilities resulting from insurance business. At Munich Re, liabilities related to insurance business accounted for a share of around 96.5% of total liabilities as at 31 December 2015. In the meantime, there have been no changes to our business activities that would necessitate a reassessment.
The measurement of our investments under IFRS 9 is partly geared to their contractual cash flows. If these only comprise the payment of principal and interest on the amount outstanding, measurement is based either on amortised cost or – without impact on profit or loss – on the fair value, depending on the business model. This does not apply in particular to equities and derivatives or to complex structured products. These are measured at fair value through profit or loss. The measurement of our investments under IFRS 9 will thus differ from our current measurement. The objective of the following table is therefore to achieve comparability in terms of the measurement of our investments with those undertakings that already apply IFRS 9.
In addition, in March 2018 the IASB published a revised version of the Conceptual Framework for Financial Reporting (2018). This is not an IFRS, and is thus not subject to the European endorsement process. The Conceptual Framework includes general principles of financial reporting, and is to be applied whenever there is an area that is not covered by a standard. The Framework does not have a mandatory date for first-time application, and the IASB itself has taken it into account since publication.
The amendments will have little or no material effects on Munich Re, except for the Amendments to IFRS 4 described below.
Due to the close interlinking of underwriting liabilities and investments of insurance companies, it is essential to have an aligned measurement of these line items in the balance sheet in order to prevent balance sheet distortions. The IASB therefore published an amendment standard to IFRS 4, Insurance Contracts, in September 2016. This gives the possibility of postponing the first-time application of IFRS 9 until 2021, but requires evidence on the basis of the financial statements as at 31 December 2015 that most of the Group’s activity is in insurance. Insurance business is considered “predominant” if at the

101Consolidated financial statementsNotes
Munich Re Group Annual Report 2018
Investments held by subsidiaries already required to use IFRS 9 under local regulations also accounted for a negligible share of overall investments from a Group perspective.
In terms of numbers and size, associates and joint ventures already required to use IFRS 9 under local regulations and accounted for in Munich Re’s consolidated financial statements using the equity method were immaterial. Therefore, these entities have not been remeasured, and no detailed information has been disclosed.
In the second quarter, the previous-year figures for intangible assets in the property-casualty reinsurance and life and health reinsurance segments were adjusted by €235m in the segment balance sheet. This figure relates to an acquired insurance portfolio that was transferred within the Group in 2016 to a company disclosed in the property-casualty reinsurance segment. As responsibility for managing the business affected rested and continues to rest with the life and health reinsurance segment, the portfolio is now disclosed in this segment and the previous year’s figures have been adjusted accordingly.
The following table provides for an assessment of the quality of our investments, whose contractual cash flows only comprise the payment of principal and interest on the amount outstanding and will therefore not be measured at fair value through profit or loss once we apply IFRS 9. The amounts shown are the carrying amounts of these investments pursuant to IAS 39.
From a Group perspective, investments not low in credit risk – i.e. rated BB or lower, and measured at amortised cost under IAS 39 – made up a negligible share of overall investments.
Ratings for investments that meet the cash flow requirement
€m 31.12.2018AAA 64,792AA 51,811A 23,149BBB 21,231Lower 5,572No rating 1,070Total 167,625
Disclosures relating to fair value
Cash flow requirement met1 Cash flow requirement not met2
€m 31.12.2018 31.12.2017 Change 31.12.2018 31.12.2017 ChangeLoans Mortgage loans 7,037 6,510 527 0 0 0 Other loans 48,815 49,454 –639 8,206 9,259 –1,053Other securities available for sale Fixed-interest securities Government bonds Germany 6,513 6,826 –313 11 11 0 Rest of EU 28,471 26,298 2,173 92 87 6 USA 14,975 16,296 –1,321 0 0 0 Other 17,780 17,500 280 55 3 52 Corporate debt securities 43,345 42,764 581 1,520 2,036 –516 Other 10,975 14,233 –3,258 358 433 –75 Non-fixed-interest securities Equities 0 0 0 10,180 13,012 –2,832 Investment funds Equity funds 0 0 0 530 734 –204 Bond funds 0 0 0 1,463 1,139 323 Real estate funds 0 0 0 321 305 16 Other 0 0 0 2,683 2,168 515Other securities at fair value through profit or loss Held for trading 15 18 –2 2,191 1,605 585 Securities designated as at fair value through profit or loss 50 43 6 360 313 47Other investments Deposits with banks 3,219 3,138 82 0 0 0Insurance-related investments Investments for unit-linked life insurance contracts 0 0 0 7,533 8,772 –1,239 Other insurance-related investments 7 0 7 833 853 –21
1 Excluding investments measured at fair value through profit or loss in accordance with IFRS 9, irrespective of whether they meet the cash-flow requirements.2 Including investments measured at fair value through profit or loss in accordance with IFRS 9, irrespective of whether they meet the cash-flow requirements.

Consolidated financial statementsNotes
102
In October 2017, the IASB issued an amendment to IFRS 9 (rev. 10/2017), Prepayment Features with Negative Compensation. This amendment clarifies how certain financial instruments with prepayment features are to be classified and therefore measured under IFRS 9. This amendment is to be applied from 2019 onwards and will be taken into consideration by Munich Re as part of its overall IFRS 9 project.
IFRS 16 (1/2016), Leases, mainly involves a revision of the accounting rules for lessees. IFRS 16 introduces universal accounting rules, according to which leases must be reported on the lessee’s balance sheet. Pursuant to the new standard, the lessee must recognise a right-of-use asset and a lease liability. Accounting rules for the lessor remain largely unchanged.
Munich Re will apply the standard from 1 January 2019, i.e. the date for mandatory first-time application. In future, assets and liabilities from operating leases will be recognised for property, office premises, and the vehicle fleet. Previous leasing expenditure will continue to be recognised by means of an amortisation expense for rights of use and interest expenses for the liabilities. Up to now, operating lease expenditures have been recognised on a straight-line basis over the term of the lease. As Munich Re will make use of the simplified rules for short-term leases and leases for low-value assets, this leasing expenditure will continue to be recognised on a straight-line basis in the income statement. The measurement of rights of use and lease liabilities relies on assumptions and estimates, especially when establishing the interest rate, determining the term of lease, and assessing termination and extension options. We will use the modified retrospective approach on transitioning to IFRS 16, and will not retrospectively adjust comparative information for the year prior to first-time application. As at 1 January 2019, rights of use will be measured at the amount of the lease liability, adjusted for any prepaid or accrued lease payments. In addition, we will take advantage of the exception regarding maintenance of the definition of leasing.
As at 31 December 2018, future minimum lease payments under non-cancellable operating leases (on a non-discounted basis) totalled €438m (409m), see Other information (50) Leasing.
We do not expect the new rules to have any material effects on the consolidated financial statements of Munich Re.
Standards or changes in standards not yet entered into forceUnless otherwise stated, all standards or amendments to standards that have not yet entered into force will be applied by Munich Re for the first time as from the mandatory effective date for entities with their registered office in the European Union. The relevant dates for mandatory first-time application are shown in the following list of new standards.
IFRS 9 (7/2014), Financial Instruments, replaces IAS 39 as regards the requirements relating to recognition and measurement of financial instruments. Under this revision, in future financial assets will be categorised on the basis of contractual cash flow characteristics and the business model to which the asset is allocated. Accordingly, subsequent measurement is made at amortised cost, at fair value without impact on profit or loss, or at fair value through profit or loss.
For financial liabilities, there are no changes in the measurement rules except that if the fair value option is applied, value changes attributable to a change in the entity’s credit risk must in future be recognised without impact on profit or loss.
IFRS 9 envisages an expected loss model for recognising impairments, by which – unlike under the current incurred loss model of IAS 39 – expected losses are anticipated before they arise and must be accounted for as an expense. There is to be only one model for recognising impairments that is to be used for all financial assets falling under the impairment rules of IFRS 9.
Hedge accounting under IFRS 9 focuses more strongly on the entity’s risk management activities than was the case under the current rules of IAS 39.
The provisions of IFRS 9 are associated with extensive additional disclosures required in the appendices that were adopted in IFRS 7, Financial Instruments: Disclosures. The provisions are mandatory for financial years beginning on or after 1 January 2018. We are making use of the option to postpone the first-time application of these new provisions, see section “Changes in accounting policies and other adjustments”.
Due to the great importance of this standard for Munich Re, we established a Group-wide project shortly after the publication of IFRS 9 to analyse the provisions in detail, and we are currently driving forward the required implementation processes.

103Consolidated financial statementsNotes
Munich Re Group Annual Report 2018
In IFRS 17 (5/2017), Insurance Contracts, the IASB has for the first time published a standard that governs the recognition, measurement and disclosure of insurance contracts in a comprehensive manner; in addition, the rules require extensive new disclosures in the Notes to the consolidated financial statements. The new standard will replace IFRS 4, Insurance Contracts.
IFRS 17 is applicable to all primary insurance contracts, reinsurance contracts and investment contracts with a discretionary participation in surplus. The valuation rules are mainly based on a “building block approach”, which is made up of a fulfilment value (discounted expected future cash flows and an explicit risk margin) and a contractual service margin. Under certain conditions, a simplified measurement approach is permitted for short-term contracts. The general measurement model in adjusted form is to be applied to primary insurance contracts with a discretionary participation in surplus and to ceded reinsurance, in order to take account of the special features of this business.
Measurement is not made at the individual contract level, but on the basis of portfolios that are subdivided into specified groups. This should largely take account of all cash flows resulting from the conclusion of insurance contracts, which by implication means that certain items currently shown separately in our financial statements will not be included in future.
Another new feature is the clearly stipulated differentiation in the income statement between the technical result – which is precisely defined in IFRS 17 and comprises insurance revenue and insurance service expenses – and insurance finance income or expenses. Insurance revenue is defined in order to allow for comparability with the revenues of other industries. In particular, savings premiums (“deposit components”) may no longer be recognised as result components. The new definition will thus require a fundamental rethink of the way we disclose revenue, which currently includes all premium components. IFRS 17 contains an option regarding the recognition of changes in value because of amendments to financial inputs. The option allows for recognition either in the income statement or directly in equity. It can be exercised at individual portfolio level.
The new rules require detailed reconciliations to be disclosed for changes to individual measurement components, as under IFRS 17 the measurement of insurance business is made on the basis of models that include unobservable inputs. Notes about the risks from insurance contracts remain largely unchanged.
IFRS 17 will involve fundamental changes to the accounting for insurance contracts and related processes. As the required changes will involve a considerable amount of work, we started to analyse them in great detail at an early stage. An implementation project was set up shortly after the publication of the new requirements in which all important areas of our reinsurance and primary insurance group have been involved from the outset. We thus ensure at an early stage that all special aspects of the individual insurance lines of business are taken into account.
Application of IFRS 17 will be mandatory for financial years beginning on or after 1 January 2021. Due to the high complexity of the rules and the substantial work required for their implementation, discussions are currently under way about deferring this effective date. In November 2018, the IASB tentatively decided to defer the mandatory effective date of this standard by one year to 1 January 2022. At the same time, insurance companies qualifying for deferral of IFRS 9 would be allowed an additional year of deferral to 2022 for the first-time application of IFRS 9. Meanwhile, the first changes to IFRS 17 are being discussed, but have yet to evolve into an amendment standard. This amendment standard is likely to be published at the end of the second half of 2019.
IFRS 9 and IFRS 16 were adopted into European law in November 2016 and October 2017 respectively. The endorsement of IFRS 17 is still outstanding.
The IASB has also published amendments to the following standards that – except for the Amendment to IAS 28 and the IFRIC Interpretation 23 – have not yet been adopted into European law:
− Amendments to IAS 28 (rev. 10/2017), Long-term Interests in Associates and Joint Ventures − Annual Improvements to IFRS Standards 2015–2017 Cycle (12/2017): Amendments to IAS 12, Income taxes; IAS 23, Borrowing costs; IFRS 3, Business combinations; and IFRS 11, Accounting for Acquisitions of Interests in Joint Operations − Amendments to IAS 19 (rev. 2/2018), Plan Amendment, Curtailment or Settlement − Amendments to IFRS 3 (rev. 10/2018), Definition of Business − Amendments to IAS 1 and IAS 8 (rev. 10/2018), Definition of Material − IFRIC 23 (6/2017), Uncertainty over Income Tax Treatments
The amendments will become mandatory in 2019 or 2020, but have little or no material effects on Munich Re.
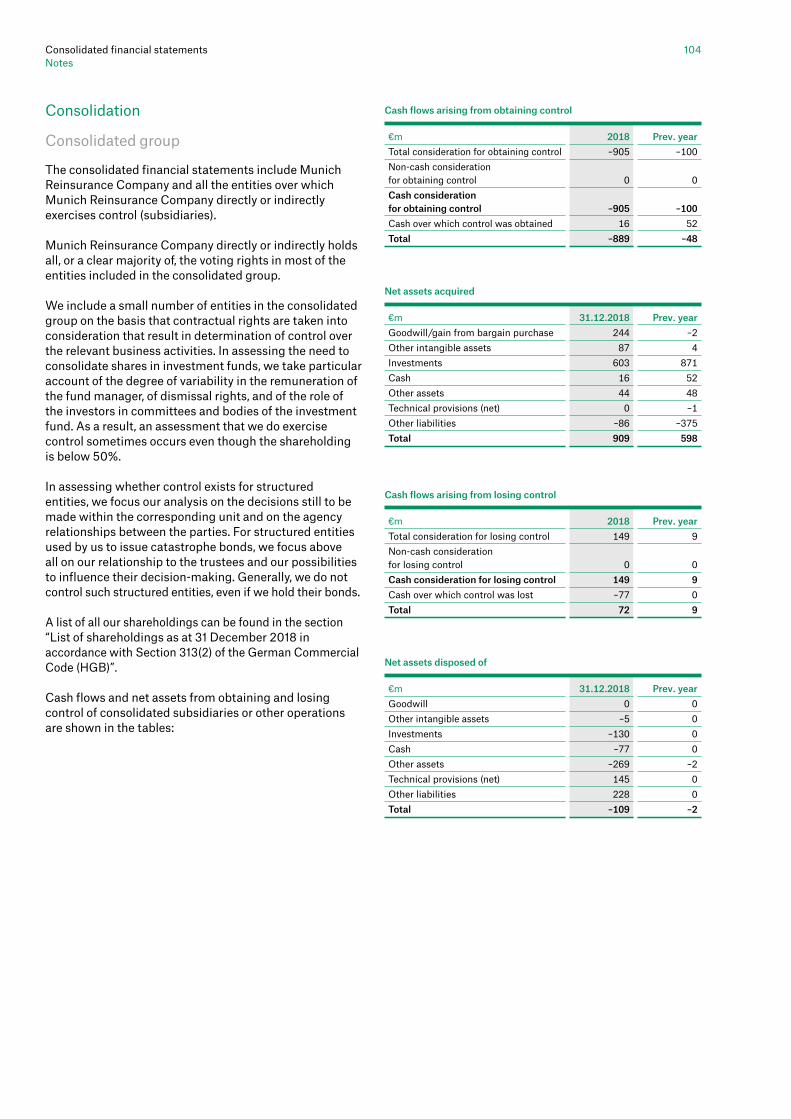
Consolidated financial statementsNotes
104
Cash flows arising from obtaining control
€m 2018 Prev. yearTotal consideration for obtaining control –905 –100Non-cash consideration for obtaining control 0 0Cash consideration for obtaining control –905 –100Cash over which control was obtained 16 52Total –889 –48
Net assets acquired
€m 31.12.2018 Prev. yearGoodwill/gain from bargain purchase 244 –2Other intangible assets 87 4Investments 603 871Cash 16 52Other assets 44 48Technical provisions (net) 0 –1Other liabilities –86 –375Total 909 598
Cash flows arising from losing control
€m 2018 Prev. yearTotal consideration for losing control 149 9Non-cash consideration for losing control 0 0Cash consideration for losing control 149 9Cash over which control was lost –77 0Total 72 9
Net assets disposed of
€m 31.12.2018 Prev. yearGoodwill 0 0Other intangible assets –5 0Investments –130 0Cash –77 0Other assets –269 –2Technical provisions (net) 145 0Other liabilities 228 0Total –109 –2
Consolidation
Consolidated group
The consolidated financial statements include Munich Reinsurance Company and all the entities over which Munich Reinsurance Company directly or indirectly exercises control (subsidiaries).
Munich Reinsurance Company directly or indirectly holds all, or a clear majority of, the voting rights in most of the entities included in the consolidated group.
We include a small number of entities in the consolidated group on the basis that contractual rights are taken into consideration that result in determination of control over the relevant business activities. In assessing the need to consolidate shares in investment funds, we take particular account of the degree of variability in the remuneration of the fund manager, of dismissal rights, and of the role of the investors in committees and bodies of the investment fund. As a result, an assessment that we do exercise control sometimes occurs even though the shareholding is below 50%.
In assessing whether control exists for structured entities, we focus our analysis on the decisions still to be made within the corresponding unit and on the agency relationships between the parties. For structured entities used by us to issue catastrophe bonds, we focus above all on our relationship to the trustees and our possibilities to influence their decision-making. Generally, we do not control such structured entities, even if we hold their bonds.
A list of all our shareholdings can be found in the section “List of shareholdings as at 31 December 2018 in accordance with Section 313(2) of the German Commercial Code (HGB)”.
Cash flows and net assets from obtaining and losing control of consolidated subsidiaries or other operations are shown in the tables:
105Consolidated financial statementsNotes
Munich Re Group Annual Report 2018
Business combinations occurring during the reporting periodOn 11 July 2018, via its subsidiary ERGO Group AG, Düsseldorf, Munich Re acquired 100% of the voting shares in Atena Usługi Informatyczne i Finansowe S.A. (Atena), Sopot, Poland. Atena offers innovative software products for the insurance sector specifically, and is a leading IT service provider on the Polish market. The intent is to involve Atena in Group-wide IT projects.
On 30 August 2018, via its subsidiary MR RENT-Investment GmbH, Munich, Munich Re acquired 100% of the voting shares in the wind-park company Eolus Vindpark Sex AB, Hässleholm, Sweden, from Eolus Vindpark Fem AB, Hässleholm, Sweden. Upon conclusion of the transaction, Eolus Vindpark Sex AB was renamed Wind Farm Jenasen AB. The company operates a completed wind farm that is connected to the power grid and has an installed capacity of 79 megawatts. The purchase price of €106.3m for the wind-park company was settled in cash and cash equivalents. In the period between acquisition and 31 December 2018, Wind Farm Jenasen contributed revenue of €4.6m and a net profit of €1.3m to the consolidated result. Because the wind farm was only completed shortly before the business combination, no disclosure can be made about what revenues and profit contribution would have been achieved had the business combination taken place as at 1 January 2018. The acquisition is part of our infrastructure invest ment strategy.
On 25 October 2018, via its subsidiary HSB Group Inc., Wilmington, Delaware, USA, Munich Re acquired an additional 83.7% of the voting shares of relayr Inc., Wilmington, Delaware, USA (relayr). This raised Munich Re’s holding to a total of 100%, thus giving it control of relayr and its subsidiaries in which relayr, in turn, owns a 100% stake: relayr GmbH, Pullach i. Isartal, Germany relayr Ltd. , Watford, UK Proximetry LLC, Delaware, USA Proximetry Poland Sp. z.o.o., Katowice, Poland Neokami Inc., Delaware, USA Neokami GmbH, Munich, Germany
The purchase price of €241.4m was settled in cash and cash equivalents.
relayr is an Internet of Things (IoT) company providing end-to-end enterprise IoT software, hardware and professional services solutions for commercial and industrial players across a wide range of sectors. The investment strengthens Munich Re’s IoT activities, which began in 2014 when the Group started building
its own solutions, acquiring IoT technology providers, and establishing partnerships with leading IoT players. The fair value of Munich Re’s equity in relayr immediately prior to the acquisition was €46.8m. A profit of €25.9m from the remeasurement of this share was recognised as investment income. The transaction resulted in goodwill of €220.2m mainly attributable to the expertise of relayr employees and expected synergies with the Group’s other IoT products. As part of the acquisition, agreements concerning remuneration were made for future payments to existing shareholders who remain employed by relayr following the acquisition. Remuneration obligations will be recognised as other liabilities in the consolidated balance sheet. In the period between acquisition and 31 December 2018, relayr contributed revenue of €0.5m and a net loss of €4.0m to the consolidated result. Had the acquisition taken place at 1 January 2018, relayr would have contributed revenue of €2.2m and a negative result of €21.7m to the consolidated result.
On 12 December 2018, via its subsidiaries FS San Augustine LLC, Wilmington, Delaware, USA, and FS Louisiana II LLC, Wilmington, Delaware, USA, Munich Re acquired 91,000 hectares of forest in Texas and Louisiana from an institutional investor and concluded an agreement with a timber investment management organisation (TIMO). The forest areas are professionally and sustainably managed by this TIMO to ensure long-term cash flow for Munich Re via logging and scheduled afforestation. The total provisional purchase price for the forest areas is €389.1m (€197.4m for FS San Augustine LLC and €191.7m for FS Louisiana II LLC). This was settled using cash and cash equivalents. The revenue and contribution to the consolidated result during the period from 12 December 2018 to the reporting date were immaterial. Had the acquisition taken place at 1 January 2018, Munich Re would have achieved revenue of €15m and a net result of €8m for forest management in the past financial year.
On 27 December 2018, via its subsidiaries Ergo Private Capital Zweite GmbH & Co. KG, Düsseldorf, Ergo Private Capital Dritte GmbH & Co. KG, Düsseldorf, and Ergo Private Capital Vierte GmbH & Co. KG, Düsseldorf, Munich Re acquired 100% of the voting shares in the solar power company FREE MOUNTAIN SYSTEMS S.L., Barcelona, Spain. The provisional purchase price was €128.0m, and was settled using cash and cash equivalents. A payment for the balance of this – a total of €2.5m – is due upon commissioning. Contract negotiations resulted in a bargain purchase gain of €3.3m, which was recognised with an impact on consolidated income. No revenue or contributions to the consolidated result were recognised for the period from 27 December 2018 to the reporting date. Because the solar park is only scheduled for commissioning in 2019, no disclosure can

Consolidated financial statementsNotes
106
Associates and joint ventures
Entities and special funds are considered associates if we are able to significantly influence their financial and operating policies. We regularly operate on this assumption if we hold between 20% and 50% of the voting power or similar rights, unless the financial and operating policies of the entity or special fund are largely pre-determined.
Entities and special funds are considered joint ventures if we are able to determine their relevant operations solely by unanimous agreement of all parties entitled to joint control, and we only have rights to their net assets.
Joint operations
A joint operation exists if its relevant operations can only be determined by unanimous agreement of all parties entitled to joint control, and these parties – due to the legal form of the joint operation, contractual provisions or other circumstances – have rights to assets and obligations for the liabilities of the joint operation, instead of rights to net assets.
We recognise our share of assets, liabilities, income and expenses of joint operations in which we have joint control in the balance sheet in accordance with the relevant IFRSs.
be made about what revenues and contribution to the consolidated profit would have been achieved had the business combination taken place as at 1 January 2018. The total installed capacity of the completed solar park is estimated at 175 megawatts peak. This acquisition is part of our infrastructure investment strategy.
The fair values of the assets and liabilities at the time of acquisition are shown in the above table. The fair values for the acquisition of forest areas via FS San Augustine LLC and FS Louisiana II LLC and for the purchase of FREE MOUNTAIN SYSTEMS S.L. are provisional.
1 The fair value of the receivables acquired as part of the transaction largely corresponds to the carrying amount. No material defaults were expected at the acquisition date.
2 The fair value of potential tax liabilities, taking into account the range of possible results, is €4m. These liabilities are matched by contractually agreed indemnity payments in the same amount, which are recognised as an indemnification asset.
Fair values of the assets and liabilities at the acquisition date
FS FREE Wind Farm San FS MOUNTAIN €m relayr Jenasen Augustine Louisiana II SYSTEMSPurchase price 241 106 197 192 128Assets acquired 29 134 198 192 164
Intangible assets 1 23 0 0 39Investments 0 97 198 192 115Receivables1 1 9 0 0 4Cash at bank, cheques and cash in hand 13 0 0 0 0Deferred tax assets 10 4 0 0 6Other assets 5 0 0 0 0
Liabilities assumed 8 34 1 0 33Other provisions 0 0 0 0 2Liabilities 4 29 1 0 21Deferred tax liabilities 0 5 0 0 10Contingent liabilities recognised pursuant to IFRS 3.232 4 0 0 0 0

107Consolidated financial statementsNotes
Munich Re Group Annual Report 2018
Structured entities
Structured entities are entities that have been designed so that voting or similar rights are not the dominant factor in deciding who controls the entity, such as when any voting rights relate to administrative tasks only and the relevant business activities are directed by means of contractual arrangements.
Munich Re has interests in both consolidated and unconsolidated structured entities.
Munich Re classifies unconsolidated structured entities as either investment funds or securitisation vehicles on the basis of the type of structured entity.
Investment funds As part of its investment activities Munich Re invests in investment funds on its own behalf, and on behalf of policyholders under unit-linked life insurance. Investment funds are mainly financed by issuing redeemable shares or units. Some of the investment funds are managed by MEAG MUNICH ERGO AssetManagement GmbH, others by fund managers outside the Group. We also report under investment funds all investments in infrastructure, forestry, private equity and other investments.
Securitisation vehicles Munich Re invests in debt securities that are issued by securitisation vehicles which are not set up by Munich Re. Munich Re also uses securitisation vehicles to issue catastrophe bonds, and it also invests in third-party catastrophe bonds. Securitisation vehicles are self-financed by issuing securities.
In order to protect its own portfolio, Munich Re uses alternative risk transfer in addition to traditional retrocession. Under this process, underwriting risks are transferred to the capital markets with the assistance of securitisation vehicles.
Munich Re also invests in the area of catastrophe risks. Munich Re invests in various securities whose repayment and interest is generally linked to the occurrence of natural catastrophes. The securities are issued by securitisation vehicles which as a matter of general policy are not set up by Munich Re.
Size of structured entities For investment funds, including investments in infrastructure, forestry, private equity and other investments, and investment funds for policyholders under unit-linked life insurance, the carrying amount gives an indication of the size of the structured entity. For debt securities and the securitisation of underwriting risks, the emission volume (nominal value) is used as an indicator for measuring the size of the structured entity. The size of the funds refers to both the issued volume of the securitisation vehicles set up by Munich Re and that of those securitisation vehicles in which Munich Re has invested.
Maximum exposure to loss With the exception of investment funds for investments for unit-linked life insurance, the maximum exposure to loss is the carrying amount of the respective items on the assets side, and zero for the items on the liabilities side. Therefore, for the items on the assets side, there is usually no difference between the carrying amount of interests in unconsolidated structured entities and the maximum exposure to loss.
Normally, the maximum exposure to loss for investments for unit-linked life insurance is also the carrying amount of the interests. However, the investment is held for the benefit of policyholders who bear the investment risk.
Managed fund assets MEAG MUNICH ERGO Kapitalanlagegesellschaft mbH also manages investment funds for private clients and institutional investors, for which it receives a management fee. The management fees are recognised as an expense in the consolidated income statement.
The maximum exposure to loss relates to the loss of future management fees. Fund management activities generated income of €42m (41m) in the financial year. The value of fund assets under management provides information about the size of the unconsolidated structured entities. As at 31 December 2018, the managed fund assets amounted to €3,815m (4,239m), and Munich Re itself also holds a small interest in these funds.
Sponsored unconsolidated structured entities Munich Re provides structuring and consultancy services for clients within the context of the foundation and structuring of third-party securitisation vehicles. As at 31 December 2018, Munich Re did not have any interests in these structured entities.

Consolidated financial statementsNotes
108
Unconsolidated structured entities
Investment funds – Securiti- Securiti- Investment Investments sation sation funds – for unit- vehicles – vehicles – Munich Re linked life Debt Underwriting investments insurance securities risks Total€m 31.12.2018 31.12.2018 31.12.2018 31.12.2018 31.12.2018Loans 7 0 0 0 7Other securities
Available for sale 4,391 0 2,776 661 7,828At fair value through profit or loss 0 0 0 0 0
Deposits retained on assumed reinsurance 0 0 0 390 390Investments for unit-linked life insurance contracts 0 8,141 0 0 8,141Ceded share of technical provisions 0 0 0 61 61Assets held for sale 118 149 4 0 271Total assets 4,517 8,290 2,780 1,112 16,699Technical provisions 0 0 0 0 0Other liabilities 0 0 0 5 5Total equity and liabilities 0 0 0 5 5Size of structured entity 4,517 8,290 72,517 9,257 94,581
Unconsolidated structured entities
Investment funds – Securiti- Securiti- Investment Investments sation sation funds – for unit- vehicles – vehicles – Munich Re linked life Debt Underwriting investments insurance securities risks Total€m Prev. year Prev. year Prev. year Prev. year Prev. yearLoans 82 0 0 0 82Other securities
Available for sale 3,899 0 2,888 579 7,366At fair value through profit or loss 0 0 0 4 4
Deposits retained on assumed reinsurance 0 0 0 436 436Investments for unit-linked life insurance contracts 0 7,346 0 0 7,346Ceded share of technical provisions 0 0 0 85 85Assets held for sale 1 0 0 0 1Total assets 3,982 7,346 2,888 1,103 15,320Technical provisions 0 0 0 6 6Other liabilities 0 0 0 0 0Total equity and liabilities 0 0 0 6 6Size of structured entity 3,982 7,347 122,737 7,647 141,712

109Consolidated financial statementsNotes
Munich Re Group Annual Report 2018
Assets
A Intangible assets
Goodwill resulting from the first-time consolidation of subsidiaries is tested for impairment at least annually. We additionally carry out ad-hoc impairment tests if there are indications of impairment.
For impairment testing, the goodwill is allocated to the cash-generating units that derive benefit from the synergies of the business combinations. At the same time, the unit to which the goodwill is allocated represents the lowest level at which goodwill is monitored for internal management purposes. Goodwill is allocated in reinsurance to divisions, and in primary insurance to the ERGO segment Property-casualty Germany, and to legal entities. We regard amounts of 10% or more of total Group goodwill as significant.
The other intangible assets mainly comprise acquired insurance portfolios and software inventories.
Acquired insurance portfolios are recognised at their present value on acquisition (PVFP – present value of future profits). This is determined as the present value of expected profits from the portfolio acquired, without consideration of new business and tax effects. The acquired insurance portfolios are amortised in accordance with the realisation of the profits from the insurance portfolios underlying the PVFP calculation. They are regularly tested for impairment using a liability adequacy test as per IFRS 4; see Equity and liabilities C – Gross technical provisions. Write-downs are recognised under operating expenses.
Software assets are carried at cost and are amortised on a straight-line basis over a useful life of three to five years. The depreciations and amortisations are distributed in the consolidated income statement between investment expenses, expenses for claims and benefits, and operating expenses. If it is not possible to allocate impairments to the functional areas, they are shown under “other non-operating result”. Impairments or impairment losses reversed are recognised if required.
B Investments
Land and buildings shown under investments comprise property used by third parties and are carried at cost. Maintenance expenses are recognised as an expense. Structural measures equivalent to 5% or more of the historical cost of a building are generally assessed with regard to whether they have to be capitalised. Buildings are depreciated on a straight-line basis in accordance with the component approach, depending on the weighted useful life for their specific building class. The underlying useful lives mainly range between 40 and 57 years. If the recoverable amount of land and buildings falls below their carrying amount, the carrying amount is written down to the recoverable amount.
Investments in affiliated companies, associates and joint ventures that are not material for assessing the Group’s financial position are generally accounted for at fair value. Changes in the fair value are recognised in “other reserves” under unrealised gains and losses. For the consolidated financial statements, investments in associates and joint ventures are measured using the equity method, i.e. with our share of their equity. Our share in the earnings is included in the investment result. As a rule, the equity and annual result from the most recent individual or consolidated financial statements of the associate or joint venture are used. In the case of financial statements of important associates or joint ventures, appropriate adjustments are made to ensure they conform with Munich Re’s accounting policies and exceptional transactions are recognised in the same reporting period.
Loans are non-derivative financial assets with fixed or determinable payments that are not quoted in an active market. They are measured at amortised cost in accordance with the effective interest method. Write-downs for impairments are made in cases where the repayment of a loan can no longer be expected.
Fixed-interest or non-fixed-interest securities available for sale that are not designated as at fair value through profit or loss or recognised under loans are accounted for at fair value, with resulting changes in value recognised in equity with no effect on profit or loss. Unrealised gains or losses are calculated taking into account interest accrued and, after deduction of deferred taxes and the amounts apportionable to policyholders by the life and health insurers on realisation (provision for deferred premium refunds), are recognised directly in equity under “other reserves”.

Consolidated financial statementsNotes
110
Recognition of financial instrumentsFinancial assets are accounted for at the trade date.
Determining fair values IFRS 13 defines fair value as the price that would be received to sell an asset or paid to transfer a liability in an orderly transaction between market participants at the measurement date. All investments and other assets and liabilities that are recognised at fair value, and such investments and other items for which a fair value is disclosed solely in the Notes, are allocated to one of the fair value hierarchy levels of IFRS 13, which provides for three levels.
The allocation reflects which of the fair values derive from transactions in the market and where valuation is based on models because market transactions are lacking. If market prices are available, these are an objective yardstick for recognition at fair value. If valuation is based on models, there is a certain amount of scope for applying such methods. The greater the number of inputs used that are not observable on the market but are based on internal estimates, the greater the amount of discretionary scope available to Munich Re.
Information on the valuation models and processes can be found in the Notes to the consolidated balance sheet – Assets (4) Hierarchy for the fair value measurement of assets. An internal process ensures that the measurement basis at every reporting date results in the correct allocation to the individual levels of the fair value hierarchy according to IFRS 13.
In the case of Level 1, valuation is based on unadjusted quoted prices in active markets for identical financial assets which Munich Re can refer to at the balance sheet date. If a quoted price in an active market is available, this should always be used. The financial instruments we have allocated to this level mainly comprise equities, equity funds, exchange-traded derivatives, and exchange-traded subordinated liabilities.
Assets allocated to Level 2 are valued using models based on observable market data. If the financial instrument concerned has a fixed contract period, the inputs used for valuation must be observable for the whole of this period. Moreover, we have allocated to this level such assets for which prices are provided by price quoters but for which there is no proof that these were based on actual market transactions. The financial instruments we have allocated to this level mainly comprise bearer bonds and bond funds, borrowers’ note loans, covered bonds, subordinated securities, derivatives not traded on the stock market, and physical gas.
Securities at fair value through profit or loss comprise securities held for trading and securities classified as at fair value through profit or loss. Securities held for trading mainly include all derivative financial instruments with positive fair values which we have acquired to manage and hedge risks but which do not meet the requirements of IAS 39 for hedge accounting. Securities designated as at fair value through profit or loss comprise structured securities and securities designated as at fair value in order to avoid accounting mismatches. In addition, loan portfolios are managed based on the fair value of the entire portfolio, which is why it was also designated as at fair value through profit or loss.
Deposits retained on assumed reinsurance are receivables from our cedants for cash deposits that have been retained under the terms of reinsurance agreements; they are accounted for at face value.
Other investments include deposits with banks and investments in renewable energies, physical gold and forestry. With the exception of forestry investments, these are measured at amortised cost. We apply the effective interest method for deposits with banks. Investments in renewable energies are amortised on a straight-line basis over a useful life of 20–30 years, but mostly over 20 years. If required, impairment losses or impairment losses reversed follow the annual impairment test. If the recoverable amount of physical gold is lower than the carrying amount, a write-down for impairment is carried out. If higher, the impairment is reversed, with impact on the income statement. The resultant carrying amount may not exceed the acquisition cost.
Forestry investments fall into the category of biological assets and include standing wood. These investments are measured at fair value less costs of disposal, with impact on profit or loss.
Repurchase agreements and securities lending Under repurchase agreements we, as the lender, acquire securities against payment of an amount with the obligation to sell them back to the borrower at a later date. As the risks and rewards from the securities remain with the borrower, the amounts paid are not posted as such in our accounts but are shown as a receivable from the borrower under “other investments, deposits with banks”. Interest income from these transactions is recognised in the investment result.
Securities that we lend by way of securities lending continue to be recognised in our balance sheet, as the main risks and rewards remain with Munich Re; securities that we have borrowed are not recognised in the balance sheet. Fees from securities lending are recognised in the investment result.

111Consolidated financial statementsNotes
Munich Re Group Annual Report 2018
IAS 39.59 contains a list providing evidence of impairment of financial assets. In addition, IAS 39.61 states that, for equity investments, a significant or prolonged decline in the fair value of the investment below its acquisition cost is objective evidence of impairment. These rules are given more concrete form by means of internal guidelines. For equities quoted on the stock exchange, we assume a significant decline in fair value if the market price at the review date is at least 20% below the average purchase price or has been lower than this amount for at least six months. In the case of fixed-interest securities and loans, the main basis for establishing impairment is an indication of substantial financial difficulty on the part of the issuer, the current market situation or media reports on the issuer.
We determine acquisition cost on the basis of the average purchase price. In the case of an impairment, a write-down is made to the fair value at the balance sheet date and recognised in profit or loss.
C Insurance-related investments
Investments for unit-linked life insurance contractsInvestments for policyholders under unit-linked life insurance are measured at fair value. Unrealised gains or losses from changes in fair value are included in the insurance-related investment result. They are matched by corresponding changes in the technical provisions (see Equity and liabilities D – Gross technical provisions for unit-linked life insurance), which are included in the technical result.
Other insurance-related investmentsOther insurance-related investments are not utilised for asset-liability management. They include insurance-linked derivatives, derivatives to hedge variable annuities, weather and commodity derivatives, and physical gas. Insurance-linked derivatives include derivatives embedded in variable annuities, the derivative components of natural catastrophe bonds and from securitisations of mortality and morbidity risks, individually structured insurance-linked derivatives, and derivative components which are separated from their host insurance contract in accounting. Insurance-linked derivatives also include retrocessions in the form of derivatives to hedge insurance risks assumed. Insurance risks are defined as risks which – in a modified form – can also be covered by an insurance contract within the meaning of IFRS 4. Other insurance-related investments are accounted for at fair value, and we recognise changes in value in profit or loss. For physical gas, the fair value is reduced by estimated costs to sell.
Net insurance-related investment resultThe composition of the net result from insurance-related investments corresponds to that of the net investment result.
For assets allocated to Level 3, we use valuation techniques that are also based on unobservable inputs. This is only permissible insofar as no observable market data is available. The inputs used reflect Munich Re’s assumptions regarding the factors which market players would consider in their pricing. We use the best available information for this, including internal company data. The financial instruments allocated to this level of the fair value hierarchy largely comprise land and buildings, real estate funds, funds that mainly invest in theoretically valued instruments, investments in infrastructure and private equity, certain credit structures, and investments in subsidiaries, associates and joint ventures measured at fair value. Insurance-linked derivatives are also allocated to Level 3.
In the case of loans, bank borrowing, liabilities from financial transactions, and bond and note liabilities not traded on an active market, we have decided on a case- by-case basis to which level of the fair value hierarchy to allocate the respective fair values.
Owing to their leverage effect, changes in individual inputs may significantly affect the fair value shown for instruments measured under Level 3. If we make such adjustments in measuring fair value in the individual case, we explain the resultant effects.
Net investment resultThe net investment result comprises regular income, income from write-ups, gains and losses on the disposal of investments, other income, write-downs of investments, management expenses, interest charges and other expenses. Regular income and expenses from investments not measured at fair value through profit or loss are calculated in accordance with the effective interest method, i.e. any premiums or discounts are spread over the period of maturity, with impact on profit or loss. Impairment At each balance sheet date, we assess whether there is any substantial objective evidence of impairment in a financial asset or group of financial assets. As the recognition of impairments – both on the merits and in terms of amount – is based on discretionary judgement and estimates, we have established a process that guarantees that at every reporting date all investments that might be subject to impairment are identified and tested for impairment. On the basis of these test results, a list of investments will be prepared for which an impairment must be recognised; this list will then be verified once again with the involvement of management.

Consolidated financial statementsNotes
112
D Ceded share of technical provisions
The share of technical provisions for business ceded by us is determined from the respective technical provisions in accordance with the terms of the reinsurance agreements; see Equity and liabilities – C Gross technical provisions. Appropriate allowance is made for the credit risk.
E Receivables
Current tax receivables are accounted for in accordance with local tax regulations and other receivables at amortised cost. The impairment test of our receivables is performed in a two-stage process, firstly at the level of individual items, and then on the basis of groups of similar receivables. The impairment is recognised as an expense. If, in a subsequent period, the reasons for the impairment cease to apply, the impairment is reversed, with impact on the income statement. The resultant carrying amount may not exceed the original amortised cost.
Current tax receivables comprise current taxes on income of the individual companies, based on their respective national taxation. Other tax receivables are shown under “other receivables”.
F Cash at banks, cheques and cash in hand
Cash and cheques are accounted for at face value.
G Deferred acquisition costs
Deferred acquisition costs comprise commissions and other variable costs directly connected with acquisition or renewal of insurance contracts. In accordance with IFRS 4, we do not use shadow accounting for deferred acquisition costs in life primary insurance. In life business and long-term health primary insurance, deferred acquisition costs are recognised and amortised over the duration of the contracts. In determining the amount of amortisation, we take into account an actuarial interest rate and changes resulting from the disposal or withdrawal of contracts from the portfolio. In property-casualty business, short-term health primary insurance and health reinsurance, the deferred acquisition costs are amortised on a straight-line basis over the average term of the policies, from one to five years.
H Deferred tax assets
Deferred tax assets must be recognised in cases where asset items have to be valued lower, or liability items higher, in the consolidated balance sheet than in the tax accounts of the Group company concerned and these differences will be eliminated at a later date with a corresponding effect on taxable income (temporary differences). Also included are tax assets deriving from tax loss carry-forwards. Deferred tax assets are recognised to the extent that, on the basis of tax result planning, it is sufficiently probable that they will be utilised. As a rule, a five-year forecast period is considered. We take into account the tax rates of the countries concerned and the consolidated company’s respective tax situation; in some cases, for purposes of simplification, we use uniform tax rates for individual circumstances or subsidiaries. Changes in tax rates and tax legislation that have already been adopted by the government at the balance sheet date are taken into account.
Deferred tax assets and liabilities are disclosed on a net basis, provided that they refer to the same taxable entity and tax office. The offsetting is made to the extent possible with respect to the underlying tax receivables and liabilities.
I Other assets
Other assets are generally recognised at amortised cost. Amortisations or depreciations mainly occur on a straight-line basis; the average useful life is 55 years. Where required, impairment losses are recognised or reversed for the Group’s owner-occupied property, plant and equipment. These impairment losses and impairment losses reversed are distributed between the functional areas.
J Assets held for sale
Assets held for sale are assets that can be sold in their current condition and whose sale is highly probable. The item may comprise individual assets or groups of assets. We account for assets held for sale at fair value less sales cost, provided the fair value is lower than the carrying amount. They are no longer depreciated. Measurement of financial instruments remains unchanged; the only difference is how they are disclosed.

113Consolidated financial statementsNotes
Munich Re Group Annual Report 2018
C Gross technical provisions
Technical provisions are shown as gross figures in the balance sheet, i.e. before deduction of the ceded share; see the explanatory remarks on Assets – D Ceded share of technical provisions. The ceded share is calculated and accounted for on the basis of the individual reinsurance agreements. Acquisition costs for insurance contracts are recognised and amortised over the terms of the contracts; see Assets – G Deferred acquisition costs. The measurement of technical provisions is based on US GAAP FAS 60 (life primary insurance without performance-related participation in surplus, health primary insurance and the bulk of reinsurance treaties), FAS 97 (life primary insurance based on the universal life model, unit-linked life insurance and life reinsurance for assumed business based on FAS 97) and FAS 120 (life primary insurance with performance-related participation in surplus). Credit insurance contracts are accounted for in accordance with the rules of IFRS 4.
Unearned premiums are accrued premiums already written for future risk periods. For primary insurance, these premiums are calculated separately for each insurance policy pro rata temporis; for reinsurance, nominal percentages are used in some cases where the data for a calculation pro rata temporis is not available. The posting of unearned premiums is restricted to short-term underwriting business; i.e. property-casualty business and parts of accident and health business. In the case of long-term business, a provision for future policy benefits is established.
The provision for future policy benefits in long-term underwriting business is posted for the actuarially calculated value of obligations arising from policyholders’ guaranteed entitlements. As well as life insurance, this concerns portions of health and personal accident insurance, insofar as the business is conducted like life insurance. Measurement is usually based on the prospective method, by determining the difference between the present values of future benefits and future premiums. The actuarial assumptions used for their calculation include, in particular, assumptions relating to mortality, disability and morbidity, as well as assumptions regarding interest-rate development, lapses and costs. These are estimated on a realistic basis at the time the insurance contracts are concluded, and they include adequate provision for adverse deviation to make allowance for the risks of change, error and random fluctuations.
Equity and liabilities
A Equity
The line item issued capital and capital reserve contains the amounts that the equity holders of Munich Reinsurance Company have paid in on shares.
Under retained earnings, we show the profits which consolidated companies have earned and retained since becoming part of Munich Re, and income and expenses resulting from changes in the consolidated group. In addition, the adjustment amount resulting from changes in accounting policies for earlier periods not included in the consolidated financial statements is recognised in the opening balance of the retained earnings for the earliest prior period reported. Retained earnings also include the effects from remeasurement of defined benefit plans.
Own shares are deducted from equity. The purchase, sale or retirement of these shares are recognised in equity items, without impact on profit or loss.
Other reserves primarily contain unrealised gains and losses resulting from the recognition at fair value of other securities available for sale and from interests in unconsolidated affiliated companies, and in associates and joint ventures not accounted for using the equity method. These reserves also include unrealised gains and losses from the measurement of associates and joint ventures using the equity method, differences resulting from the currency translation of foreign subsidiaries’ figures, and remeasurement gains/losses from the hedging of cash flows.
B Subordinated liabilities
Subordinated liabilities are liabilities which, in the event of liquidation or insolvency, are only satisfied after the claims of other creditors. They are measured at amortised cost in accordance with the effective interest method.

Consolidated financial statementsNotes
114
actuarial projection methods. Where ranges have been calculated, a realistic estimated value for the ultimate loss is determined within these. In applying the statistical methods, we regard large exposures separately.
Other technical provisions mainly include the provision for premium refunds in primary insurance and the provision for profit commission in reinsurance. The former is posted in life and health primary insurance for obligations involving policyholder bonuses and rebates that have not yet been irrevocably allocated to individual contracts at the balance sheet date. These provisions are posted on the basis of national regulations only for German primary insurance business; a retrospective approach is usually taken based on supervisory or individual contract regulations.
Besides this, there are provisions for deferred premium refunds, which are posted for the amounts apportionable to policyholders from the measurement differences between IFRS and local GAAP on the basis of the expected future participation quotas. For unrealised gains and losses on investments available for sale, which are recognised directly in equity (see Assets – B Investments – Fixed-interest or non-fixed-interest securities available for sale), the resultant provision for deferred premium refunds is also posted without impact on profit or loss; otherwise, changes in this provision are recognised in the income statement.
Liability adequacy testAll technical provisions are regularly subjected to a liability adequacy test in accordance with IFRS 4. If current experience shows that the provisions posted on the basis of the original assumptions – less the related deferred acquisition costs and the present value of the related premiums – are inadequate to cover the expected future benefits, we adjust the relevant technical provisions with recognition in profit or loss and disclose this under impairment losses in the Notes to the consolidated balance sheet; see Notes to the consolidated balance sheet – Assets (2) Other intangible assets, Assets (13) Deferred acquisition costs, and Equity and liabilities (21) Provision for future policy benefits. The appropriateness of unearned premiums and of the provision for outstanding claims is assessed in relation to the realistically estimated future amount to be paid. The appropriateness of the provision for future policy benefits is assessed on the basis of realistic estimates of the actuarial assumptions, the proportional investment result and, for contracts with participation in surplus, future profit sharing.
In reinsurance, measurement is carried out partly individually for each risk and partly collectively for reinsured portfolios, using biometric actuarial assumptions based on the tables of the national actuarial associations. These are adjusted for the respective reinsured portfolio, in line with the probabilities observed for the occurrence of an insured event. Discount rates are chosen that reflect the best estimate of expected investment income, less a safety margin. For the major part of the portfolio, these assumptions are fixed at the beginning of the contract and not changed over its duration.
In primary insurance, measurement is generally carried out individually for each risk. In German life primary insurance, biometric actuarial assumptions are used. These are based on the tables of the German Association of Actuaries (Deutsche Aktuarvereinigung e. V.). We also largely use the tables of the national actuarial associations for the rest of primary insurance business. The actuarial interest rate employed for discounting in life primary insurance is limited by the respective maximum actuarial interest rate prescribed by the supervisory authorities. In health primary insurance, discount rates are chosen that reflect the best estimate of expected investment income, less a safety margin.
The provision for outstanding claims is for payment obligations arising from insurance contracts in primary insurance and reinsurance where the size of the claim or the timing of the payment is still uncertain. Part of the provision is for known claims for which individually calculated provisions are posted. Another part is for expenses for claims whose occurrence is not yet known. There are also provisions for claims that are known, but whose extent has turned out to be greater than originally foreseen. All these provisions include expenses for internal and external loss adjustments. The provision for outstanding claims is based on estimates: the actual payments may be higher or lower. The amounts posted are the realistically estimated future amounts to be paid; they are calculated on the basis of past experience and assumptions about future developments (e.g. social, economic or technological factors). Future payment obligations are generally not discounted; exceptions are some provisions for occupational disability pensions and annuities in workers’ compensation and other lines of property-casualty business. For determining the provision for outstanding claims, Munich Re uses a range of

115Consolidated financial statementsNotes
Munich Re Group Annual Report 2018
D Gross technical provisions for unit-linked life insurance
This item encompasses the provision for future policy benefits in life primary insurance where policyholders bear the investment risk themselves (unit-linked life insurance). The value of the provision for future policy benefits essentially corresponds to the fair value of the relevant investments shown under Assets – C Insurance-related investments – Investments for policyholders under unit-linked life insurance contracts. Changes in this provision are fully recognised in the technical result. Insofar as these changes derive from unrealised gains and losses from alterations in the fair values of the related investments, they are matched by opposite changes of the same amount in the insurance-related investment result.
E Other provisions
This item includes provisions for post-employment benefits and similar obligations. Under defined contribution plans, the companies pay fixed contributions to an insurer or a pension fund. This fully covers the companies’ obligations. Under defined benefit plans, the staff member is promised a particular level of retirement benefit either by the companies or by a pension fund. The companies’ contributions needed to finance this are not fixed in advance. If pension obligations are covered by assets held by a legally separate entity (e.g. a fund or a contractual trust agreement in the form of a two-way trust) – assets that may only be used to cover the pension commitments given and are not accessible to creditors – the pension obligations are shown less the amount of these plan assets. If the fair value of the assets exceeds the related outsourced pension commitments, this reimbursement right is recognised under “Other receivables”.
Pension obligations are recognised in accordance with IAS 19, using the projected unit credit method. The calculation includes not only the pension entitlements and current pensions known at the balance sheet date, but also their expected future development. The assumptions for the future development are determined on the basis of the circumstances in the individual countries.
The discount rate applied to the pension obligations is based on the yields for long-term high-quality bonds (e.g. corporate or government bonds).
The item also includes miscellaneous provisions, which we establish in the amount of the probable requirement. Such amounts are not discounted if the interest-rate effect is insignificant.
F Liabilities
This item comprises bonds and notes issued, deposits retained on ceded business, current tax liabilities, and other liabilities. Financial liabilities are generally recognised at amortised cost. Derivative financial instruments are recognised at fair value. Details of how the fair value is determined are provided under Assets – B Investments – Determining fair values.
Current tax liabilities comprise current taxes on income of the individual companies, based on their respective national taxation. Other tax liabilities are shown under “other liabilities”.
G Deferred tax liabilities
Deferred tax liabilities must be recognised if asset items have to be valued higher, or liabilities items lower, in the consolidated balance sheet than in the tax accounts of the reporting company, and these differences will be eliminated at a later date with a corresponding impact on taxable income (temporary differences); see Assets – H Deferred tax assets.
H Liabilities related to assets held for sale
Liabilities to be transferred together with disposal groups are recognised in this item; see Assets – J Assets held for sale.

Consolidated financial statementsNotes
116
Foreign currency translation
Munich Re’s presentation currency is the euro (€). Our subsidiaries largely recognise differences resulting from the translation into their respective national currencies in profit or loss. These differences are shown under the “other non-operating result”. The thus converted net assets of foreign subsidiaries whose national currency
is not the euro are then translated using the year-end exchange rates, and results using quarterly average exchange rates. Any exchange differences arising in the process are recognised in equity (reserve for currency translation adjustments).
The following table shows the exchange rates of the most important currencies for our business:
Currency translation rates
Balance sheet Income statement Income statementRate for €1 31.12.2018 Prev. year Q4 2018 Q3 2018 Q2 2018 Q1 2018 Q4 2017 Q3 2017 Q2 2017 Q1 2017Australian dollar 1.62380 1.53525 1.59136 1.59014 1.57500 1.56349 1.53173 1.48829 1.46583 1.40705Canadian dollar 1.56130 1.50450 1.50759 1.52057 1.53869 1.55436 1.49672 1.47252 1.47958 1.41077Pound sterling 0.89755 0.88765 0.88714 0.89240 0.87594 0.88313 0.88732 0.89774 0.86022 0.85995Rand 16.44420 14.86590 16.30460 16.34480 15.06580 14.70750 16.03980 15.48550 14.51670 14.09310Swiss franc 1.12690 1.17015 1.13625 1.14482 1.17413 1.16556 1.16200 1.13071 1.08353 1.06956US dollar 1.14315 1.20080 1.14113 1.16329 1.19207 1.22872 1.17758 1.17449 1.10081 1.06557Yen 125.4210 135.2700 128.6470 129.6680 130.0460 133.0920 132.9370 130.3270 122.3210 121.0950Yuan Renminbi 7.84855 7.81965 7.89303 7.91320 7.60016 7.81422 7.78802 7.83515 7.55287 7.34193

117Consolidated financial statementsNotes
Munich Re Group Annual Report 2018
Segment reporting
In accordance with the management approach, the segmentation of our business operations is based on the way in which Munich Re is managed internally.
We have identified five segments to be reported:
− Life and health reinsurance (global life and health reinsurance business) − Property-casualty reinsurance (global property-casualty reinsurance business) − ERGO Life and Health Germany (German life and health primary insurance business, German property-casualty direct insurance business, and global travel insurance business) − ERGO Property-casualty Germany (German property-casualty insurance business, excluding direct business) − ERGO International (ERGO’s primary insurance business outside Germany)
Certain primary insurers whose business requires special solution-finding competence are coupled to reinsurance as the risk carrier. We therefore transact their business from within reinsurance and consequently allocate them to the reinsurance segments.
The IFRS result contributions are the basis of planning and strategy in all segments, hence the IFRS segment result is the uniform assessment basis for internal control.
Income and expenses from intra-Group loans are shown unconsolidated under “Other non-operating result, impairment losses on goodwill and net finance costs” for the segments concerned. These are otherwise shown after elimination of intra-Group transactions and shareholdings.

Consolidated financial statementsNotes
118
Segment equity and liabilities
Reinsurance ERGO Total Life and Health Property-casualty Life and health Property-casualty Germany Germany International €m 31.12.2018 Prev. year 31.12.2018 Prev. year 31.12.2018 Prev. year 31.12.2018 Prev. year 31.12.2018 Prev. year 31.12.2018 Prev. yearA. Subordinated liabilities 977 785 2,700 1,993 0 0 0 0 13 13 3,689 2,790B. Gross technical provisions I. Unearned premiums 309 295 6,985 6,034 250 214 484 468 1,762 1,846 9,790 8,857 II. Provision for future policy benefits 12,107 10,825 26 26 88,950 87,774 422 433 9,641 9,897 111,147 108,956 III. Provision for outstanding claims 9,034 8,694 46,919 45,004 2,886 2,935 4,670 4,483 2,848 2,849 66,356 63,965 IV. Other technical provisions 301 320 293 373 16,139 17,846 96 91 485 544 17,314 19,174 21,751 20,134 54,222 51,437 108,225 108,770 5,672 5,475 14,736 15,137 204,607 200,952C. Gross technical provisions for unit-linked life insurance contracts 0 0 0 0 5,098 5,809 0 0 2,827 3,162 7,925 8,971D. Other provisions 226 231 604 607 1,662 1,711 918 935 972 1,023 4,383 4,508E. Liabilities related to assets held for sale 0 0 392 0 168 3 0 0 263 63 823 65F. Other segment liabilities 8,938 6,842 7,189 7,480 4,156 3,873 741 664 1,218 1,378 22,241 20,237Total segment liabilities 31,891 27,991 65,108 61,517 119,309 120,166 7,331 7,074 20,028 20,776 243,668 237,524 Equity 26,500 28,198 Total equity and liabilities 270,168 265,722
Segment assets
Reinsurance ERGO Total Life and Health Property-casualty Life and health Property-casualty Germany Germany International €m 31.12.2018 Prev. year 31.12.2018 Prev. year 31.12.2018 Prev. year 31.12.2018 Prev. year 31.12.2018 Prev. year 31.12.2018 Prev. yearA. Intangible assets1 330 361 2,304 1,984 204 168 1,044 961 182 215 4,064 3,689B. Investments I. Land and buildings, including buildings on third-party land 433 309 2,150 1,532 2,937 2,961 221 200 111 119 5,851 5,121 II. Investments in affiliated companies, associates and joint ventures 44 44 1,433 1,225 441 331 75 72 517 544 2,509 2,216 Thereof: Associates and joint ventures accounted for using the equity method 28 28 1,371 1,164 387 282 9 24 502 513 2,296 2,010 III. Loans 178 176 701 745 52,089 51,952 1,606 1,593 271 236 54,845 54,702 IV. Other securities 1. Available for sale 19,689 20,675 49,116 51,883 50,603 51,727 4,625 4,409 15,240 15,151 139,272 143,845 2. At fair value through profit or loss 122 75 634 378 1,362 1,024 53 14 444 488 2,616 1,979 19,812 20,751 49,750 52,261 51,965 52,751 4,678 4,423 15,684 15,638 141,888 145,824 V. Deposits retained on assumed reinsurance 4,890 3,759 2,286 1,870 44 40 21 21 0 1 7,241 5,690 VI. Other investments 688 559 2,400 1,715 1,012 1,093 270 435 149 207 4,518 4,009 26,044 25,597 58,718 59,349 108,487 109,129 6,871 6,743 16,731 16,745 216,852 217,562C. Insurance-related investments 745 754 97 104 4,673 5,317 0 0 2,909 3,488 8,424 9,664D. Ceded share of technical provisions 858 735 2,709 2,727 19 15 74 78 603 615 4,263 4,169E. Assets held for sale 0 0 414 0 269 26 1 0 344 92 1,029 118F. Other segment assets 13,006 9,208 11,126 9,520 7,047 7,124 1,581 1,429 2,775 3,239 35,535 30,520Total segment assets 40,984 36,655 75,369 73,684 120,701 121,779 9,572 9,210 23,542 24,394 270,168 265,722
1 Previous year’s figures adjusted owing to IAS 8; see “Changes in accounting policies and other adjustments”.
» Segment assets (XLS, 39 KB)
» Segment equity and liabilities (XLS, 40 KB)

119Consolidated financial statementsNotes
Munich Re Group Annual Report 2018
Segment equity and liabilities
Reinsurance ERGO Total Life and Health Property-casualty Life and health Property-casualty Germany Germany International €m 31.12.2018 Prev. year 31.12.2018 Prev. year 31.12.2018 Prev. year 31.12.2018 Prev. year 31.12.2018 Prev. year 31.12.2018 Prev. yearA. Subordinated liabilities 977 785 2,700 1,993 0 0 0 0 13 13 3,689 2,790B. Gross technical provisions I. Unearned premiums 309 295 6,985 6,034 250 214 484 468 1,762 1,846 9,790 8,857 II. Provision for future policy benefits 12,107 10,825 26 26 88,950 87,774 422 433 9,641 9,897 111,147 108,956 III. Provision for outstanding claims 9,034 8,694 46,919 45,004 2,886 2,935 4,670 4,483 2,848 2,849 66,356 63,965 IV. Other technical provisions 301 320 293 373 16,139 17,846 96 91 485 544 17,314 19,174 21,751 20,134 54,222 51,437 108,225 108,770 5,672 5,475 14,736 15,137 204,607 200,952C. Gross technical provisions for unit-linked life insurance contracts 0 0 0 0 5,098 5,809 0 0 2,827 3,162 7,925 8,971D. Other provisions 226 231 604 607 1,662 1,711 918 935 972 1,023 4,383 4,508E. Liabilities related to assets held for sale 0 0 392 0 168 3 0 0 263 63 823 65F. Other segment liabilities 8,938 6,842 7,189 7,480 4,156 3,873 741 664 1,218 1,378 22,241 20,237Total segment liabilities 31,891 27,991 65,108 61,517 119,309 120,166 7,331 7,074 20,028 20,776 243,668 237,524 Equity 26,500 28,198 Total equity and liabilities 270,168 265,722
Segment assets
Reinsurance ERGO Total Life and Health Property-casualty Life and health Property-casualty Germany Germany International €m 31.12.2018 Prev. year 31.12.2018 Prev. year 31.12.2018 Prev. year 31.12.2018 Prev. year 31.12.2018 Prev. year 31.12.2018 Prev. yearA. Intangible assets1 330 361 2,304 1,984 204 168 1,044 961 182 215 4,064 3,689B. Investments I. Land and buildings, including buildings on third-party land 433 309 2,150 1,532 2,937 2,961 221 200 111 119 5,851 5,121 II. Investments in affiliated companies, associates and joint ventures 44 44 1,433 1,225 441 331 75 72 517 544 2,509 2,216 Thereof: Associates and joint ventures accounted for using the equity method 28 28 1,371 1,164 387 282 9 24 502 513 2,296 2,010 III. Loans 178 176 701 745 52,089 51,952 1,606 1,593 271 236 54,845 54,702 IV. Other securities 1. Available for sale 19,689 20,675 49,116 51,883 50,603 51,727 4,625 4,409 15,240 15,151 139,272 143,845 2. At fair value through profit or loss 122 75 634 378 1,362 1,024 53 14 444 488 2,616 1,979 19,812 20,751 49,750 52,261 51,965 52,751 4,678 4,423 15,684 15,638 141,888 145,824 V. Deposits retained on assumed reinsurance 4,890 3,759 2,286 1,870 44 40 21 21 0 1 7,241 5,690 VI. Other investments 688 559 2,400 1,715 1,012 1,093 270 435 149 207 4,518 4,009 26,044 25,597 58,718 59,349 108,487 109,129 6,871 6,743 16,731 16,745 216,852 217,562C. Insurance-related investments 745 754 97 104 4,673 5,317 0 0 2,909 3,488 8,424 9,664D. Ceded share of technical provisions 858 735 2,709 2,727 19 15 74 78 603 615 4,263 4,169E. Assets held for sale 0 0 414 0 269 26 1 0 344 92 1,029 118F. Other segment assets 13,006 9,208 11,126 9,520 7,047 7,124 1,581 1,429 2,775 3,239 35,535 30,520Total segment assets 40,984 36,655 75,369 73,684 120,701 121,779 9,572 9,210 23,542 24,394 270,168 265,722

Consolidated financial statementsNotes
120
Segment income statement
Reinsurance ERGO Total Life and Health Property-casualty Life and health Property-casualty Germany Germany International €m 2018 Prev. year 2018 Prev. year 2018 Prev. year 2018 Prev. year 2018 Prev. year 2018 Prev. yearGross premiums written 10,849 13,726 20,437 17,843 9,345 9,210 3,377 3,293 5,057 5,043 49,064 49,115 1. Net earned premiums 9,868 13,431 18,618 16,723 9,301 9,184 3,252 3,204 4,696 4,622 45,735 47,164 2. Income from technical interest 637 602 1,144 1,083 2,817 4,180 76 75 73 435 4,747 6,376 3. Net expenses for claims and benefits –7,855 –10,842 –12,140 –13,467 –9,955 –11,734 –2,075 –2,069 –3,091 –3,533 –35,116 –41,645 4. Net operating expenses –2,146 –2,815 –6,372 –5,600 –1,530 –1,195 –1,087 –1,072 –1,451 –1,504 –12,587 –12,186 5. Technical result (1– 4) 503 376 1,250 –1,261 633 435 166 138 228 20 2,779 –292 6. Investment result 988 865 1,555 1,895 3,502 4,196 133 185 348 470 6,526 7,611 7. Insurance-related investment result 17 43 3 –80 –493 300 0 0 –212 180 –685 443 8. Other operating result 58 25 –130 –105 –34 –46 6 –4 –48 –15 –148 –146 9. Deduction of income from technical interest –637 –602 –1,144 –1,083 –2,817 –4,180 –76 –75 –73 –435 –4,747 –6,376 10. Non-technical result (6– 9) 427 331 284 627 158 270 62 105 14 199 946 1,533 11. Operating result 930 708 1,534 –635 790 705 228 244 242 219 3,725 1,241 12. Other non-operating result, net finance costs and impairment losses on goodwill –34 –82 –110 –284 –400 –437 –204 –185 –127 –158 –874 –1,146 13. Taxes on income –168 –30 –289 443 –127 –92 21 –2 –12 –21 –576 298 14. Consolidated result 729 596 1,135 –476 264 175 45 57 103 40 2,275 392
Other segment disclosures
Reinsurance ERGO Total Life and Health Property-casualty Life and health Property-casualty Germany Germany International €m 2018 Prev. year 2018 Prev. year 2018 Prev. year 2018 Prev. year 2018 Prev. year 2018 Prev. yearInterest income 753 715 1,103 1,125 2,922 2,961 92 87 360 353 5,230 5,241Interest expenses –14 –17 –51 –46 –36 –42 –9 –9 –16 –17 –125 –132Depreciation and amortisation –62 –42 –111 –140 –52 –79 –43 –50 –83 –80 –351 –392Other operating income 172 136 314 289 115 103 88 87 138 163 827 778Other operating expenses –114 –112 –444 –394 –149 –149 –83 –91 –187 –178 –976 –924Income from associates and joint ventures accounted for using the equity method 1 0 113 82 44 31 2 4 27 28 187 145
» Segment income statement (XLS, 39 KB)

121Consolidated financial statementsNotes
Munich Re Group Annual Report 2018
Segment income statement
Reinsurance ERGO Total Life and Health Property-casualty Life and health Property-casualty Germany Germany International €m 2018 Prev. year 2018 Prev. year 2018 Prev. year 2018 Prev. year 2018 Prev. year 2018 Prev. yearGross premiums written 10,849 13,726 20,437 17,843 9,345 9,210 3,377 3,293 5,057 5,043 49,064 49,115 1. Net earned premiums 9,868 13,431 18,618 16,723 9,301 9,184 3,252 3,204 4,696 4,622 45,735 47,164 2. Income from technical interest 637 602 1,144 1,083 2,817 4,180 76 75 73 435 4,747 6,376 3. Net expenses for claims and benefits –7,855 –10,842 –12,140 –13,467 –9,955 –11,734 –2,075 –2,069 –3,091 –3,533 –35,116 –41,645 4. Net operating expenses –2,146 –2,815 –6,372 –5,600 –1,530 –1,195 –1,087 –1,072 –1,451 –1,504 –12,587 –12,186 5. Technical result (1– 4) 503 376 1,250 –1,261 633 435 166 138 228 20 2,779 –292 6. Investment result 988 865 1,555 1,895 3,502 4,196 133 185 348 470 6,526 7,611 7. Insurance-related investment result 17 43 3 –80 –493 300 0 0 –212 180 –685 443 8. Other operating result 58 25 –130 –105 –34 –46 6 –4 –48 –15 –148 –146 9. Deduction of income from technical interest –637 –602 –1,144 –1,083 –2,817 –4,180 –76 –75 –73 –435 –4,747 –6,376 10. Non-technical result (6– 9) 427 331 284 627 158 270 62 105 14 199 946 1,533 11. Operating result 930 708 1,534 –635 790 705 228 244 242 219 3,725 1,241 12. Other non-operating result, net finance costs and impairment losses on goodwill –34 –82 –110 –284 –400 –437 –204 –185 –127 –158 –874 –1,146 13. Taxes on income –168 –30 –289 443 –127 –92 21 –2 –12 –21 –576 298 14. Consolidated result 729 596 1,135 –476 264 175 45 57 103 40 2,275 392
Other segment disclosures
Reinsurance ERGO Total Life and Health Property-casualty Life and health Property-casualty Germany Germany International €m 2018 Prev. year 2018 Prev. year 2018 Prev. year 2018 Prev. year 2018 Prev. year 2018 Prev. yearInterest income 753 715 1,103 1,125 2,922 2,961 92 87 360 353 5,230 5,241Interest expenses –14 –17 –51 –46 –36 –42 –9 –9 –16 –17 –125 –132Depreciation and amortisation –62 –42 –111 –140 –52 –79 –43 –50 –83 –80 –351 –392Other operating income 172 136 314 289 115 103 88 87 138 163 827 778Other operating expenses –114 –112 –444 –394 –149 –149 –83 –91 –187 –178 –976 –924Income from associates and joint ventures accounted for using the equity method 1 0 113 82 44 31 2 4 27 28 187 145

Consolidated financial statementsNotes
122
Notes on determining the combined ratio1
Reinsurance ERGO Property-casualty Property-casualty Germany International2
€m 2018 Prev. year 2018 Prev. year 2018 Prev. yearNet earned premiums 18,618 16,723 3,252 3,204 3,292 3,236Net expenses for claims and benefits –12,140 –13,467 –2,075 –2,069 –2,088 –2,068Net operating expenses –6,372 –5,600 –1,087 –1,072 –1,068 –1,022
Loss-ratio calculation adjustments 8 –7 41 15 41 8Fire brigade tax and other expenses 14 17 15 13 31 28Expenses for premium refunds3 0 0 23 18 0 1Other underwriting income –6 –24 –3 –5 –25 –24Change in other technical provisions andother underwriting expenses3 0 0 7 –10 35 2
Adjusted net expenses for claims and benefits –12,132 –13,474 –2,033 –2,053 –2,047 –2,060Loss ratio in % 65.2 80.6 62.5 64.1 62.2 63.7Combined ratio in % 99.4 114.1 96.0 97.5 94.6 95.3
1 Information on the combined ratio is provided in the management report under “Important tools of corporate management”.2 Property-casualty business and short-term health business (excluding health insurance conducted like life insurance).3 No adjustment for property-casualty reinsurance.
1 The non-current assets mainly comprise intangible assets (especially goodwill) and our owner-occupied and investment property, as well as investments in renewable energy.
Investments in non-current assets per segment1
€m 2018 Prev. yearLife and health reinsurance 190 51Property-casualty reinsurance 1,043 150ERGO Life and Health Germany 241 772ERGO Property-casualty Germany 151 108ERGO International 62 65Total 1,688 1,146
Non-current assets by country1
€m 31.12.2018 Prev. yearGermany 7,166 6,838USA 3,364 2,424UK 573 594Sweden 387 268France 377 402Spain 302 150Poland 233 190Malta 202 235Italy 186 196Austria 161 195Belgium 132 129Netherlands 115 177Switzerland 91 89Portugal 69 70Finland 65 65Lithuania 54 38Others 178 191Total 13,655 12,251
1 The non-current assets mainly comprise intangible assets (especially goodwill) and our owner-occupied and investment property, as well as investments in renewable energy.
Gross premiums written1
Total€m 2018 Prev. yearEurope
Germany 13,397 13,050UK 5,276 4,790Poland 1,542 1,385Spain 1,276 1,346Belgium 895 876Others 4,923 4,510
27,309 25,957North America
USA 11,260 10,314Canada 1,956 5,526
13,216 15,840Asia and Australasia
Australia 1,987 1,491China 1,366 1,185Japan 985 642South Korea 284 311Others 877 829
5,499 4,458Africa, Middle East
South Africa 655 521United Arab Emirates 428 489Others 680 620
1,763 1,630Latin America 1,277 1,230Total 49,064 49,115
1 The premiums are generally allocated according to the location of the risks insured.

123Consolidated financial statementsNotes
Munich Re Group Annual Report 2018
Notes to the consolidated balance sheet – Assets
1 GoodwillChanges in goodwill
€m 2018 Prev. yearGross carrying amount at 31 Dec. previous year 4,134 4,358Accumulated amortisation and impair- ment losses at 31 Dec. previous year –1,550 –1,541Carrying amount at 31 Dec. previous year 2,584 2,817Currency translation differences 81 –217Additions 245 1Disposals 0 –8Reclassifications 0 0Amortisation and impairment losses –6 –9Carrying amount at 31 Dec. financial year 2,904 2,584Accumulated amortisation and impair- ment losses at 31 Dec. financial year –1,556 –1,550Gross carrying amount at 31 Dec. financial year 4,460 4,134
8000
Cash-generating units Global ERGO Clients and North America Division Property-casualty Germany segment reinsurance property-casualty
Allocated goodwill 1,861 929at 31 Dec. 2018 in €m
Basis for calculating the Value in use Value in userecoverable amount
Key assumptions regarding the planning In the detailed planning phase (three years), For the detailed planning phase (three years),calculation (at the time of planning) we expected increasing premium income we expected a moderate rise in premium and a slight improvement in the combined income with an improved combined ratio. ratio if major losses remained stable. Our general assumption was that there Our general assumption was that there would would be moderate upward movement on be moderate upward movement on the equity the equity markets and a stable interest-rate markets and a stable interest-rate level. level.
Growth rates after the detailed 1.5% 0.5%planning phase
Discount rates 8.2% 10.4%
In the context of the reorganisation of the divisions, any goodwill allocated to reinsurance is now monitored uniformly at the level of the individual division. This had no impact on the result of the impairment testing of goodwill.
Impairment tests for cash-generating units to which a significant portion of the goodwill was allocated are based on the assumptions shown below.

Consolidated financial statementsNotes
124
environment. After the detailed planning phase, we estimate the target results achievable long term on the basis of the last adjusted planning year and taking into account growth rates and RoI derived from macroeconomic forecasts.
Cost-of-equity rates derived using the Capital Asset Pricing Model (CAPM) were used as discount rates. Calculations were made after consideration of normalised taxes. In the table, for disclosure purposes, a corresponding discount rate before tax is given in each case. Sensitivity analyses were performed for the discount rates, growth rates and distributable target results. No impairments have been identified.
The calculation of these values in use is based on distributable target results derived from the current market environment and the latest corporate planning approved by management. Prepared in an interactive process involving the operational units, the responsible controlling units and the Board of Management, the corporate plans are reviewed and updated at least every quarter. The aforementioned key assumptions regarding premium income development and combined ratios derive from the aggregation of the company plans of the individual companies of a cash-generating unit. The key assumptions regarding developments in the equity market and interest-rate level are defined on the basis of the current market
2 Other intangible assets
Continued on next page
Development of other intangible assets
Acquired insurance portfolios Software Internally developed Other€m 2018 Prev. year 2018 Prev. year 2018 Prev. yearGross carrying amount at 31 Dec. previous year 1,304 1,334 413 405 1,244 1,186Accumulated amortisation and impairment losses at 31 Dec. previous year –870 –798 –383 –363 –972 –898Carrying amount at 31 Dec. previous year 433 536 30 42 272 288Currency translation differences –6 –24 –1 –1 1 –7Additions
Business combinations 0 0 25 0 1 0Other 0 0 23 17 134 96
Disposals Loss of control 0 0 0 0 –5 0Other 0 0 0 0 –7 –12
Reclassifications 0 0 0 1 –5 –1Impairment losses reversed 0 0 0 0 0 0Amortisation and impairment losses
Amortisation –55 –78 –33 –29 –73 –82Impairment losses 0 0 0 0 –1 –10
Carrying amount at 31 Dec. financial year 373 433 44 30 317 272Accumulated amortisation and impairment losses at 31 Dec. financial year –926 –870 –418 –383 –1,026 –972Gross carrying amount at 31 Dec. financial year 1,299 1,304 462 413 1,343 1,244
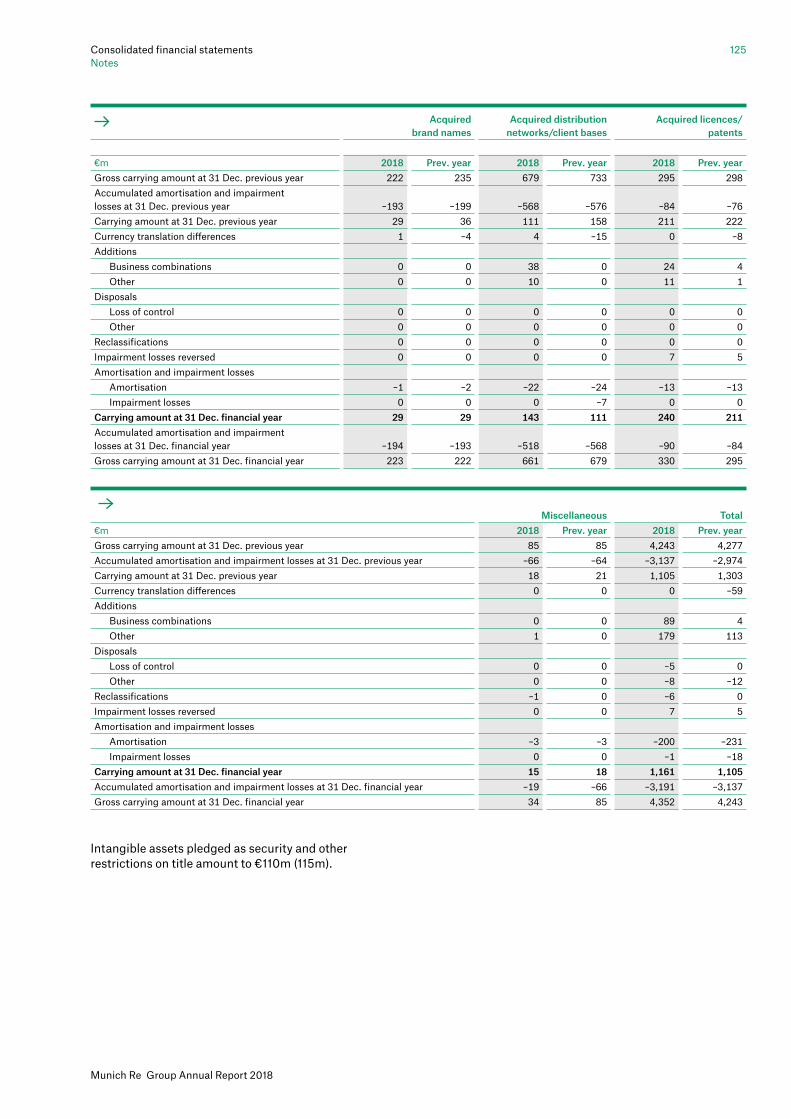
125Consolidated financial statementsNotes
Munich Re Group Annual Report 2018
Intangible assets pledged as security and other restrictions on title amount to €110m (115m). 8006_C
Acquired Acquired distribution Acquired licences/ brand names networks/client bases patents €m 2018 Prev. year 2018 Prev. year 2018 Prev. yearGross carrying amount at 31 Dec. previous year 222 235 679 733 295 298Accumulated amortisation and impairment losses at 31 Dec. previous year –193 –199 –568 –576 –84 –76Carrying amount at 31 Dec. previous year 29 36 111 158 211 222Currency translation differences 1 –4 4 –15 0 –8Additions
Business combinations 0 0 38 0 24 4Other 0 0 10 0 11 1
Disposals Loss of control 0 0 0 0 0 0Other 0 0 0 0 0 0
Reclassifications 0 0 0 0 0 0Impairment losses reversed 0 0 0 0 7 5Amortisation and impairment losses
Amortisation –1 –2 –22 –24 –13 –13Impairment losses 0 0 0 –7 0 0
Carrying amount at 31 Dec. financial year 29 29 143 111 240 211Accumulated amortisation and impairment losses at 31 Dec. financial year –194 –193 –518 –568 –90 –84Gross carrying amount at 31 Dec. financial year 223 222 661 679 330 295
Miscellaneous Total€m 2018 Prev. year 2018 Prev. yearGross carrying amount at 31 Dec. previous year 85 85 4,243 4,277Accumulated amortisation and impairment losses at 31 Dec. previous year –66 –64 –3,137 –2,974Carrying amount at 31 Dec. previous year 18 21 1,105 1,303Currency translation differences 0 0 0 –59Additions
Business combinations 0 0 89 4Other 1 0 179 113
Disposals Loss of control 0 0 –5 0Other 0 0 –8 –12
Reclassifications –1 0 –6 0Impairment losses reversed 0 0 7 5Amortisation and impairment losses
Amortisation –3 –3 –200 –231Impairment losses 0 0 –1 –18
Carrying amount at 31 Dec. financial year 15 18 1,161 1,105Accumulated amortisation and impairment losses at 31 Dec. financial year –19 –66 –3,191 –3,137Gross carrying amount at 31 Dec. financial year 34 85 4,352 4,243

Consolidated financial statementsNotes
126
3 Land and buildings, including buildings on third-party land
Development of investments in land and buildings, including buildings on third-party land
€m 2018 Prev. yearGross carrying amount at 31 Dec. previous year 6,423 5,668Accumulated amortisation and impairment losses at 31 Dec. previous year –1,302 –1,224Carrying amount at 31 Dec. previous year 5,121 4,444Currency translation differences 15 –67Additions
Subsequent acquisition costs 26 44Business combinations 0 661Other 672 159
Disposals Loss of control 0 0Other –34 –9
Impairment losses reversed 169 33Amortisation and impairment losses
Amortisation –121 –95Impairment losses –2 –46
Reclassifications 6 –3Carrying amount at 31 Dec. financial year 5,851 5,121Accumulated amortisation and impairment losses at 31 Dec. financial year –1,255 –1,302Gross carrying amount at 31 Dec. financial year 7,107 6,423
The fair value of investment property at the balance sheet date amounted to €10,620m (7,865m). The portfolio managed by the Group is measured by valuers within the Group, and the portfolio managed by third parties is valued by external valuers. Property is allocated to Level 3 of the fair value hierarchy; see Assets – B Investments – Determining fair values. Determining the sustainability of cash inflows and outflows, taking into account the market conditions at the property location, is material for measurement. The fair value is determined individually per item by discounting the future cash flow as at the measurement date. Depending on the type of property and its individual opportunity/risk profile, discount rates of 0.7% to 3.9% are used for residential buildings and 0.9% to 5.5% for office buildings and commercial property.
The most important additions include an office building in Washington D.C. and commercial property in Munich.
The impairment losses reversed are primarily attributable to the increase in property market values from updated fair value assumptions. They mainly derive from the property-casualty reinsurance segment (€67m) and the ERGO Life and Health Germany segment (€80m).
Under reclassifications, we mainly recognise the land and buildings that are classified as held for sale, as well as owner-occupied property reclassified as investment property.
Property pledged as security and other restrictions on title amount to €1,000m (916m). Contractual commitments to acquire property amount to €78m (239m).
4 Hierarchy for the fair value measurement of assets
All assets recognised at fair value are allocated to one of the fair value hierarchy levels of IFRS 13, as are those assets which are not recognised at fair value in the balance sheet but for which a fair value has to be disclosed in the Notes. Information on the criteria for allocation to the individual levels of the fair value hierarchy can be found under Assets – B Investments – Determining fair values. Regularly, at each reporting date, we assess whether the allocation of our assets to the levels of the valuation hierarchy is still appropriate. If changes in the basis of valuation have occurred – for instance, if a market is no longer active or the valuation was performed using inputs requiring another allocation – we make the necessary adjustments.
The following table provides an overview of the models used to measure the fair values of our investments when market prices are not available.

127Consolidated financial statementsNotes
Munich Re Group Annual Report 2018
Valuation techniques for assets
Bonds Pricing method Parameters Pricing modelInterest-rate risks Loans against borrower’s note/ Theoretical price Sector-, rating- or Present-value methodregistered bonds issuer-specific yield curve Cat bond (host) Theoretical price Interest-rate curve Present-value methodMortgage loans Theoretical price Sector-specific yield curve Present-value method Derivatives Pricing method Parameters Pricing modelEquity and index risks OTC stock options Theoretical price Listing of underlying shares Black-Scholes (European) Effective volatilities Cox, Ross and Rubinstein Money-market interest rate (American) Dividend yield Monte Carlo simulationEquity forwards Theoretical price Listing of underlying shares Present-value method Money-market interest rate Dividend yield Interest-rate risks Interest-rate swaps Theoretical price CSA/swap curve Present-value method Swaptions/interest-rate Theoretical price At-the-money volatility matrix and skew Bachelier/guarantee OIS/swap curve Normal Black Interest-rate currency swaps Theoretical price Swap curve Present-value method Currency spot rates Money-market interest-rate curve Inflation swaps Theoretical price Zero-coupon inflation swap rates Present-value method OIS curve Bond forwards (forward transactions) Theoretical price Listing of underlying Present-value method Swap curve Currency risks Currency options Theoretical price Volatility skew Garman-Kohlhagen Currency spot rates (European) Money-market interest-rate curve Currency forwards Theoretical price Currency spot rates Present-value method Currency forward rates/ticks Money-market rates Other transactions Insurance derivatives Theoretical price Fair values of cat bonds Present-value method(excluding variable annuities) Historical event data Interest-rate curve Insurance derivatives Theoretical price Biometric rates and lapse rates Present-value method(variable annuities) Volatilities Interest-rate curve Currency spot rates Catastrophe swaps Theoretical price Fair values of cat bonds Present-value method Interest-rate curve Credit default swaps Theoretical price Credit spreads Present-value method Recovery rates ISDA CDS Standard Model Interest-rate curve Total return swaps on Theoretical price Listing of underlying index Index ratio calculationcommodities Commodity options Theoretical price Listing of underlying Black-Scholes (European) Effective volatilities Cox, Ross and Rubinstein Money-market interest rate (American)
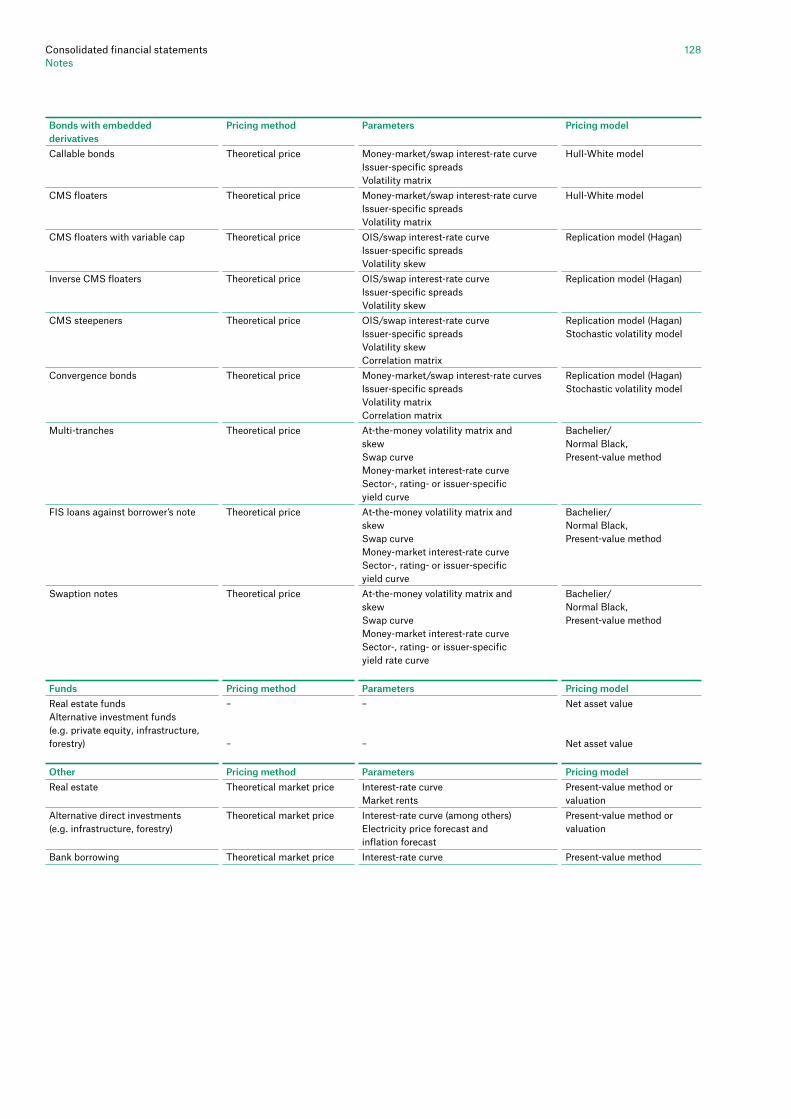
Consolidated financial statementsNotes
128
Bonds with embedded Pricing method Parameters Pricing modelderivativesCallable bonds Theoretical price Money-market/swap interest-rate curve Hull-White model Issuer-specific spreads Volatility matrix CMS floaters Theoretical price Money-market/swap interest-rate curve Hull-White model Issuer-specific spreads Volatility matrix CMS floaters with variable cap Theoretical price OIS/swap interest-rate curve Replication model (Hagan) Issuer-specific spreads Volatility skew Inverse CMS floaters Theoretical price OIS/swap interest-rate curve Replication model (Hagan) Issuer-specific spreads Volatility skew CMS steepeners Theoretical price OIS/swap interest-rate curve Replication model (Hagan) Issuer-specific spreads Stochastic volatility model Volatility skew Correlation matrix Convergence bonds Theoretical price Money-market/swap interest-rate curves Replication model (Hagan) Issuer-specific spreads Stochastic volatility model Volatility matrix Correlation matrix Multi-tranches Theoretical price At-the-money volatility matrix and Bachelier/ skew Normal Black, Swap curve Present-value method Money-market interest-rate curve Sector-, rating- or issuer-specific yield curveFIS loans against borrower’s note Theoretical price At-the-money volatility matrix and Bachelier/ skew Normal Black, Swap curve Present-value method Money-market interest-rate curve Sector-, rating- or issuer-specific yield curve Swaption notes Theoretical price At-the-money volatility matrix and Bachelier/ skew Normal Black, Swap curve Present-value method Money-market interest-rate curve Sector-, rating- or issuer-specific yield rate curve
Funds Pricing method Parameters Pricing modelReal estate funds – – Net asset value Alternative investment funds (e.g. private equity, infrastructure,forestry) – – Net asset value
Other Pricing method Parameters Pricing modelReal estate Theoretical market price Interest-rate curve Present-value method or Market rents valuationAlternative direct investments Theoretical market price Interest-rate curve (among others) Present-value method or(e.g. infrastructure, forestry) Electricity price forecast and valuation inflation forecastBank borrowing Theoretical market price Interest-rate curve Present-value method

129Consolidated financial statementsNotes
Munich Re Group Annual Report 2018
of the market quotes available from market data providers is insufficient, so we use broker valuations. With these investments, we thus do not perform our own valuations using inputs that are not based on observable market data. We regularly subject the valuations supplied to plausibility tests on the basis of comparable investments.
At 31 December 2018, around 11% (13%) of the investments measured at fair value were allocated to Level 1 of the fair value hierarchy, 85% (83%) to Level 2 and 5% (4%) to Level 3, as shown in the table below.
Among the associates and joint ventures accounted for using the equity method, there is only one company for which a quoted market price is available. This price amounts to €96m (104m) and is allocated to Level 1 of the fair value hierarchy.
In the financial year, the allocation to the individual levels of the fair value hierarchy was largely unchanged. The minor transfer amounts relating to Level 3 of the fair value hierarchy are adjustments to our Group requirements.
The following table but one resents the reconciliation from the opening balances to the closing balances for investments allocated to Level 3.
Gains (losses) recognised in the consolidated income statement are shown in the investment result or insurance-related investment result, while gains (losses) recognised in equity are shown in the statement of recognised income and expense for the 2018 financial year under “Unrealised gains and losses on investments, Gains (losses) recognised in equity”. Gains (losses) recognised in the consolidated income statement that are attributable to investments recognised at the end of the financial year are shown in the statement of recognised income and expense for the 2018 financial year under “Unrealised gains and losses on investments, Recognised in the consolidated income statement”.
Insurance-linked derivatives (excluding variable annuities) are allocated to Level 3 of the fair value hierarchy. The derivative components of catastrophe bonds are measured based on the values supplied by brokers for the underlying bonds, which is why it is not possible to quantify the inputs used that were not based on observable market data. If no observable inputs are available for customised insurance-linked derivatives, the present-value method on the basis of current interest-rate curves and historical event data is used. Due to the low volume involved, the effects of alternative inputs and assumptions are immaterial.
The inputs requiring consideration in measuring variable annuities are derived either directly from market data (in particular volatilities, interest-rate curves and currency spot rates) or from actuarial data (especially biometric and lapse rates). The lapse rates used are modelled dynamically and range between 0.5% and 50%, depending on the specific insurance product and current situation of the capital markets. Compared with the relevant market risk inputs for the determination of fair values, the impact on the fair value of an increase or decrease in lapse rates would be immaterial. The assumptions with regard to mortality are based on published mortality tables, which are adjusted with a view to the target markets and the actuaries’ expectations. The impact of these and other non-observable assumptions is not material. The dependency between different capital market inputs is modelled by correlation matrices. We allocate these products to Level 3 of the fair value hierarchy.
The other investments allocated to Level 3 are mainly external fund units (in particular, private equity, real estate and funds that invest in a variety of assets that are subject to theoretical valuation) as well as relatively illiquid credit structures (especially commercial mortgage-backed securities and collateralised loan obligations). In the case of external fund units, market quotes are not available on a regular basis; rather, net asset values (NAVs) are provided by the asset managers. With regard to the NAVs, the quality

Consolidated financial statementsNotes
130
Allocation of investments (including insurance-related investments) to levels of the fair value hierarchy
31.12.2018€m Level 1 Level 2 Level 3 TotalInvestments measured at fair value Investments in affiliated companies measured at fair value 0 0 177 177Investments in associates and joint ventures measured at fair value 0 0 36 36Other securities available for sale
Fixed-interest 48 120,910 3,137 124,095Non-fixed-interest 10,451 1,316 3,410 15,177
Other securities at fair value through profit or loss Held for trading, and hedging derivatives1 545 1,680 1 2,226Designated as at fair value through profit or loss 167 242 0 410
Other investments 0 10 255 265Insurance-related investments 4,914 3,270 233 8,417Total 16,125 127,429 7,249 150,803Investments not measured at fair value Loans 0 62,632 1,663 64,295Total 0 62,632 1,663 64,295
1 Including hedging derivatives of €20m (27m) accounted for under “Other assets”.
Prev. year€m Level 1 Level 2 Level 3 TotalInvestments measured at fair value Investments in affiliated companies measured at fair value 0 0 171 171Investments in associates and joint ventures measured at fair value 0 0 34 34Other securities available for sale
Fixed-interest 290 123,521 2,675 126,486Non-fixed-interest 13,540 959 2,860 17,359
Other securities at fair value through profit or loss Held for trading, and hedging derivatives1 224 1,424 2 1,649Designated as at fair value through profit or loss 187 169 0 357
Other investments 0 10 36 46Insurance-related investments 5,622 3,738 304 9,664Total 19,862 129,822 6,082 155,766Investments not measured at fair value Loans 0 64,082 1,393 65,475Total 0 64,082 1,393 65,475
Reconciliation for investments allocated to Level 3
Investments in affiliated Investments in associates companies measured at and joint ventures fair value measured at fair value €m 2018 Prev. year 2018 Prev. yearCarrying amount at 31 Dec. previous year 171 138 34 8Gains and losses –15 4 0 0
Gains (losses) recognised in the income statement –17 –9 –3 0Gains (losses) recognised in equity 3 13 3 0
Acquisitions 34 50 19 26Disposals –14 –14 –19 0Transfer to Level 3 0 5 2 0Transfer out of Level 3 0 –11 0 0Changes in the fair value of derivatives 0 0 0 0Carrying amount at 31 Dec. financial year 177 171 36 34Gains (losses) recognised in the income statement that are attributable to investments shown at the end of the financial year –21 –10 –3 0
Continued on next page

131Consolidated financial statementsNotes
Munich Re Group Annual Report 2018
Insurance-related investments Total €m 2018 Prev. year 2018 Prev. yearCarrying amount at 31 Dec. previous year 304 277 6,082 5,959Gains and losses 43 106 81 97
Gains (losses) recognised in the income statement 33 128 7 192Gains (losses) recognised in equity 10 –22 74 –95
Acquisitions 14 110 2,571 2,793Disposals –129 –192 –1,488 –2,772Transfer to Level 3 2 0 7 32Transfer out of Level 3 0 0 –2 –30Changes in the fair value of derivatives –1 3 –1 3Carrying amount at 31 Dec. financial year 233 304 7,249 6,082Gains (losses) recognised in the income statement that are attributable to investments shown at the end of the financial year –50 45 –118 70
Other securities available for sale Fixed-interest Non-fixed-interest€m 2018 Prev. year 2018 Prev. yearCarrying amount at 31 Dec. previous year 2,675 2,683 2,860 2,814Gains and losses –50 –14 118 3
Gains (losses) recognised in the income statement –15 74 24 1Gains (losses) recognised in equity –35 –89 93 3
Acquisitions 1,457 1,796 811 809Disposals –944 –1,770 –383 –793Transfer to Level 3 0 0 3 27Transfer out of Level 3 0 –19 0 0Changes in the fair value of derivatives 0 0 0 0Carrying amount at 31 Dec. financial year 3,137 2,675 3,410 2,860Gains (losses) recognised in the income statement that are attributable to investments shown at the end of the financial year –14 74 –15 –39
Designated as at fair value Held for trading, Other through profit or loss and hedging derivatives investments €m 2018 Prev. year 2018 Prev. year 2018 Prev. yearCarrying amount at 31 Dec. previous year 0 2 2 0 36 37Gains and losses 0 0 0 0 –15 –1
Gains (losses) recognised in the income statement 0 0 0 0 –15 –1Gains (losses) recognised in equity 0 0 0 0 0 0
Acquisitions 3 0 0 2 234 0Disposals 0 –2 –1 0 0 0Transfer to Level 3 0 0 0 0 0 0Transfer out of Level 3 –2 0 0 0 0 0Changes in the fair value of derivatives 0 0 0 0 0 0Carrying amount at 31 Dec. financial year 0 0 1 2 255 36Gains (losses) recognised in the income statement that are attributable to investments shown at the end of the financial year 0 0 0 0 –15 –1

Consolidated financial statementsNotes
132
6 Loans
Breakdown of loans
Carrying amounts€m 31.12.2018 Prev. yearMortgage loans 6,326 5,842Loans and advance payments on insurance policies 239 266Other loans 48,280 48,595Total 54,845 54,702
Other loans mainly comprise covered bonds and government bonds.
The fair value of the loans is based on recognised valuation techniques in line with the present value principle and taking observable market inputs into account; see (4) Hierarchy for the fair value measurement of assets. The fair value totalled €64,298m (65,490m) at the reporting date.
Rating of “other loans” on the basis of amortised cost
€m 31.12.2018 Prev. yearAAA 28,001 27,560AA 13,947 13,924A 3,026 3,539BBB or lower 2,309 2,285No rating 997 1,287Total 48,280 48,595
The rating categories are based on those of the leading international rating agencies. Virtually no credit risk exists in respect of the mortgage loans or the loans and advance payments on insurance policies.
8021
8024
5 Investments in affiliated companies, associates and joint ventures
Reversed impairment losses with respect to associates and joint ventures amounted to €36m (15m). They are distributed between the following segments: €35m (14m) is apportionable to property-casualty reinsurance, €0m (1m) to ERGO Life and Health Germany, and €1m (0m) to ERGO International.
Impairment losses with respect to these companies amounted to €62m (11m). They are distributed between the following segments: €62m (0m) is apportionable to property-casualty reinsurance, and €0m (11m) to ERGO International.
In the financial year, shares of losses of associates and joint ventures amounting to €1m (3m) were not recognised in the balance sheet. Overall, losses not recognised in the balance sheet totalled €4m (3m).
Further information about affiliated companies, associates and joint ventures can be found in Other information (48) Contingent liabilities, other financial commitments, (49) Significant restrictions, and in the List of shareholdings as at 31 December 2018 pursuant to Section 313(2) of the German Commercial Code (HGB).
Aggregated financial information on investments in associates and joint ventures accounted for using the equity method
€m 31.12.2018 Prev. yearOverall result for the year after tax from continued operations 165 106Result after tax from discontinued operations 0 0Income and expenses recognised directly in equity –17 9Total recognised income and expenses 148 115
8018

133Consolidated financial statementsNotes
Munich Re Group Annual Report 2018
Disposal proceeds in the financial year
€m 2018 Prev. yearFixed-interest securities 54,803 48,780Non-fixed-interest securities
Quoted 11,547 20,953Unquoted 7,538 1,012
Total 73,888 70,745
Realised gains and losses
€m 2018 Prev. yearGains on disposal 2,027 2,067
Fixed-interest securities 1,053 1,034Non-fixed-interest securities 974 1,033
Losses on disposal –768 –481Fixed-interest securities –533 –334Non-fixed-interest securities –234 –148
Total 1,259 1,586
Rating of fixed-interest securities according to fair values
€m 31.12.2018 Prev. yearAAA 37,296 38,365AA 40,181 40,298A 20,562 19,552BBB 19,775 21,796Lower 5,557 5,791No rating 726 682Total 124,095 126,486
The rating categories are based on those of the leading international rating agencies.
8030
7 Other securities available for sale
Approximately 40% of the corporate debt securities are covered bonds or government-guaranteed bank issues. The remaining portfolio is composed of securities issued by companies outside the banking sector, with each individual risk making up less than 1%, bonds issued by banks and state central savings banks, and asset-backed securities/mortgage-backed securities. The asset-backed securities/mortgage-backed securities are largely rated A or better. Assets pledged as security and other restrictions on title amount to €8,015m (7,677m). Of the securities shown, €1,910m (0m) had been loaned to third parties. Loaned securities are not derecognised, as the main resultant risks and rewards remain with Munich Re. Of the €6,771m (10,883m) in unrealised gains and losses, €2,565m (4,672m) has been recognised in equity (other reserves), after deduction of provisions for deferred premium refunds, deferred taxes, non-controlling interests, and consolidation and currency translation effects.
Breakdown of other securities available for sale
Carrying amounts Unrealised gains/losses Amortised cost€m 31.12.2018 Prev. year 31.12.2018 Prev. year 31.12.2018 Prev. yearFixed-interest securities Government bonds
Germany 6,524 6,837 806 873 5,718 5,964Rest of EU 28,564 26,384 1,727 1,904 26,837 24,480USA 14,975 16,296 212 624 14,762 15,672Other 17,835 17,503 454 801 17,381 16,703
Corporate debt securities 44,865 44,799 943 2,197 43,921 42,602Other 11,333 14,666 811 1,223 10,522 13,443 124,095 126,486 4,953 7,622 119,142 118,864Non-fixed-interest securities Shares 10,181 13,013 1,246 2,709 8,935 10,304Investment funds
Equity funds 530 734 –13 56 543 678Bond funds 1,463 1,139 37 58 1,425 1,081Real estate funds 321 305 50 46 270 259
Other 2,683 2,168 497 393 2,186 1,775 15,177 17,359 1,817 3,261 13,360 14,098Total 139,272 143,845 6,771 10,883 132,502 132,961

Consolidated financial statementsNotes
134
The rating categories are based on those of the leading international rating agencies.
The insurance-related investments include investments for unit-linked life insurance contracts of €7,533m (8,772m) and other insurance-related investments of €891m (891m).
Derivative financial instruments are used by Munich Re to manage and hedge against interest-rate, currency, and other market risks. This is done at the Group companies within the framework of individual supervisory regulations and additional internal company guidelines. Given the daily margining process, the risk of default is practically non-existent in the case of products traded on the stock exchange. Over-the-counter products, on the other hand, harbour a theoretical risk in the amount of the replacement costs. Therefore, Munich Re selects only top-quality counterparties for such transactions, and exchanges collateral daily on the basis of current fair values.
As at 31 December 2018, Munich Re held collateral for derivatives in the form of cash collateral and securities with a rating of at least AA. The fair value of the securities amounts to €29m (26m), and the cash collateral approximately €530m (383m). The collateral received is subject to a title transfer collateral arrangement, but is not re-sold or pledged.
8 Other securities at fair value through profit or loss and insurance-related investments
Securities at fair value through profit or loss comprise securities of €2,206m (1,623m) held for trading as well as securities and loans of €410m (357m) designated as at fair value through profit or loss.
The securities held for trading are made up of fixed-interest securities totalling €15m (18m), non-fixed-interest securities totalling €113m (67m) and derivatives held for trading amounting to €2,078m (1,538m). The securities designated as at fair value through profit or loss comprise €217m (146m) assignable to fixed-interest securities and loans and €193m (211m) to non-fixed interest securities. Some €2m (15m) of the instruments at fair value through profit or loss is due within one year.
For securities designated as at fair value through profit or loss, items pledged as security and other restrictions on title amount to €30m (36m).
Rating of fixed-interest securities according to fair values
€m 31.12.2018 Prev. yearAAA 25 25AA 43 43A 44 55BBB 25 40Lower 1 0No rating 95 Total 232 164
8039
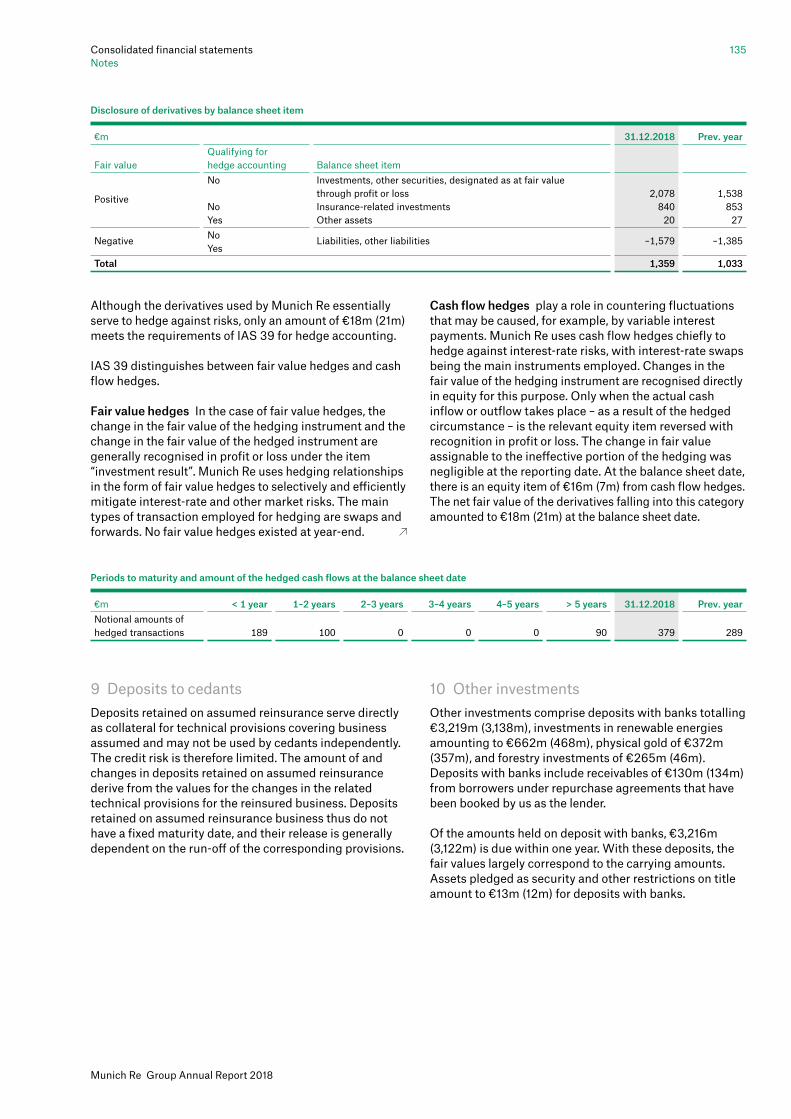
135Consolidated financial statementsNotes
Munich Re Group Annual Report 2018
Cash flow hedges play a role in countering fluctuations that may be caused, for example, by variable interest payments. Munich Re uses cash flow hedges chiefly to hedge against interest-rate risks, with interest-rate swaps being the main instruments employed. Changes in the fair value of the hedging instrument are recognised directly in equity for this purpose. Only when the actual cash inflow or outflow takes place – as a result of the hedged circumstance – is the relevant equity item reversed with recognition in profit or loss. The change in fair value assignable to the ineffective portion of the hedging was negligible at the reporting date. At the balance sheet date, there is an equity item of €16m (7m) from cash flow hedges. The net fair value of the derivatives falling into this category amounted to €18m (21m) at the balance sheet date.
10 Other investmentsOther investments comprise deposits with banks totalling €3,219m (3,138m), investments in renewable energies amounting to €662m (468m), physical gold of €372m (357m), and forestry investments of €265m (46m). Deposits with banks include receivables of €130m (134m) from borrowers under repurchase agreements that have been booked by us as the lender.
Of the amounts held on deposit with banks, €3,216m (3,122m) is due within one year. With these deposits, the fair values largely correspond to the carrying amounts. Assets pledged as security and other restrictions on title amount to €13m (12m) for deposits with banks.
Although the derivatives used by Munich Re essentially serve to hedge against risks, only an amount of €18m (21m) meets the requirements of IAS 39 for hedge accounting.
IAS 39 distinguishes between fair value hedges and cash flow hedges.
Fair value hedges In the case of fair value hedges, the change in the fair value of the hedging instrument and the change in the fair value of the hedged instrument are generally recognised in profit or loss under the item “investment result”. Munich Re uses hedging relationships in the form of fair value hedges to selectively and efficiently mitigate interest-rate and other market risks. The main types of transaction employed for hedging are swaps and forwards. No fair value hedges existed at year-end.
9 Deposits to cedantsDeposits retained on assumed reinsurance serve directly as collateral for technical provisions covering business assumed and may not be used by cedants independently. The credit risk is therefore limited. The amount of and changes in deposits retained on assumed reinsurance derive from the values for the changes in the related technical provisions for the reinsured business. Deposits retained on assumed reinsurance business thus do not have a fixed maturity date, and their release is generally dependent on the run-off of the corresponding provisions.
Periods to maturity and amount of the hedged cash flows at the balance sheet date
€m < 1 year 1–2 years 2–3 years 3–4 years 4–5 years > 5 years 31.12.2018 Prev. yearNotional amounts of hedged transactions 189 100 0 0 0 90 379 289
Disclosure of derivatives by balance sheet item
€m 31.12.2018 Prev. year Qualifying for Fair value hedge accounting Balance sheet item No Investments, other securities, designated as at fair value through profit or loss 2,078 1,538Positive
No Insurance-related investments 840 853 Yes Other assets 20 27 No Negative
Yes Liabilities, other liabilities –1,579 –1,385
Total 1,359 1,033

Consolidated financial statementsNotes
136
12 Other receivables
Of the amounts receivable on primary insurance business, €747m (653m) is apportionable to receivables from insurance agents. The miscellaneous receivables include receivables of €5,297m (2,306m) resulting from contracts with non-significant risk transfer, which do not fall within the scope of IFRS 4.
Assets pledged as security and other restrictions on title amount to €73m (62m).
The miscellaneous receivables contain cash collateral of €656m (356m), mainly for derivative transactions.
Given that the majority of other receivables, i.e. a total of €11,878m (10,497m), have a period to maturity of less than one year, the fair values largely correspond to the carrying amounts.
As at 31 December 2018, our accounts receivable on ceded reinsurance business were split between the following ratings (based on those of Standard & Poor’s):
Rating of accounts receivable
€m 31.12.2018 Prev. yearAAA 0 1AA 42 54A 44 95BBB and lower 10 3No external rating 90 89
Of all our receivables on underwriting business at the balance sheet date, €371m (379m) was outstanding for more than 90 days. The average defaults of the last three years amount to €864m (282m).
Breakdown of other receivables
€m 31.12.2018 Prev. yearAmounts receivable on primary insurance business 2,586 2,615Accounts receivable on reinsurance business 6,808 6,202Miscellaneous receivables 7,845 4,568Total 17,239 13,385
Development of investments in renewable energies
€m 2018 Prev. yearGross carrying amount at 31 Dec. previous year 699 676Accumulated amortisation and impairment losses at 31 Dec. previous year –231 –195Carrying amount at 31 Dec. previous year 468 482Currency translation differences –4 –6Additions
Business combinations 213 32Other 0 0
Disposals Loss of control 2 0Other 0 0
Impairment losses reversed 21 4Depreciation and impairment losses
Depreciation –38 –36Impairment losses 0 –7
Reclassification 0 0Carrying amount at 31 Dec. financial year 662 468Accumulated amortisation and impairment losses at 31 Dec. financial year –245 –231Gross carrying amount at 31 Dec. financial year 907 699
The investments in renewable energies include items pledged as security and other restrictions on title amounting to €173m (182m).
11 Ceded share of technical provisions
Details of the ceded share of technical provisions are shown in the Notes to the consolidated balance sheet – Equity and liabilities (20) Unearned premiums, (21) Provisions for future policy benefits, (22) Provisions for outstanding claims, (23) Other technical provisions, and in the risk report in the section “Credit risks”.
Ceded share of technical provisions
€m 31.12.2018 Prev. yearUnearned premiums 390 328Provision for future policy benefits 823 760Provision for outstanding claims 3,005 2,957Other technical provisions 46 125Total 4,263 4,169
8063

137Consolidated financial statementsNotes
Munich Re Group Annual Report 2018
The amortisation includes accrued interest as well as write-downs. The impairment losses comprise impairment losses and reversals of impairment losses stemming from changes in the assumptions underlying the calculations which require an adjustment in the measurement.
In the ERGO Life and Health Germany segment, there was an adjustment in 2018 to the assumptions regarding future lapses, expenses and long-term interest-rate levels that are geared to the long-term regular return on investments. Overall, these adjustments led to impairment losses on deferred acquisition costs.
The deferred acquisition costs of the disposal group amounting to €85m (4m) are recognised under Changes in consolidated group/Other.
13 Deferred acquisition costs
Development of gross deferred acquisition costs
€m 31.12.2018 Prev. yearStatus at 31 Dec. previous year 9,563 9,634Currency translation differences –38 –257Change in consolidated group/Other –133 –4New deferred acquisition costs 3,147 2,533Changes
Amortisation –2,949 –2,445Impairment losses –125 102
Status at 31 Dec. financial year 9,466 9,563
Deferred acquisition costs
€m 31.12.2018 Prev. yearGross 9,466 9,563Ceded share –254 –135Net 9,212 9,428

Consolidated financial statementsNotes
138
14 Deferred tax
The deferred tax assets and liabilities recognised in the consolidated balance sheet concern the following balance sheet items:
No deferred taxes were posted for temporary differences of €57m (52m) in connection with investments in subsidiaries and associates, also referred to as outside basis differences. Likewise, no deferred tax assets were
Deferred tax
31.12.2018 Prev. year€m Assets Liabilities Assets LiabilitiesAssets A. Intangible assets 141 154 119 159B. Investments 1,994 2,345 2,479 3,096C. Insurance-related investments 1 5 1 10E. Receivables 51 136 50 134I. Other assets 311 496 1,036 1,269Total assets 2,498 3,136 3,685 4,668 Equity and liabilities C. Net technical provisions 3,045 4,625 2,910 4,374E. Other provisions 908 238 926 233F. Liabilities 214 21 220 11Total equity and liabilities 4,167 4,884 4,056 4,618 Loss carry-forwards and tax credits 532 0 623 0 Total before netting 7,197 8,020 8,364 9,286Netting amount –6,652 –6,652 –7,830 –7,830Total 545 1,368 534 1,456
Tax loss carry-forwards and tax credits
31.12.2018 Prev. year For which For which For which For which deferred deferred deferred deferred tax assets tax assets tax assets tax assets are are not are are not €m recognised recognised Total recognised recognised TotalCorporation tax loss carry-forwards
Expiring in up to three years 30 35 65 24 43 67Expiring in over three years and up to ten years 205 164 369 266 66 332Expiring in over ten years 295 4 299 206 25 231Not expiring 663 2,204 2,867 526 2,080 2,606
1,193 2,407 3,600 1,022 2,214 3,236Trade tax loss carry-forwards
Not expiring 1,483 301 1,784 1,330 176 1,506 1,483 301 1,784 1,330 176 1,506Loss carry-forwards from capital losses
Expiring in up to three years 0 0 0 0 0 0Expiring in over three years and up to ten years 0 0 0 0 0 0Expiring in over ten years 0 0 0 0 0 0Not expiring 0 0 0 0 0 0
0 0 0 0 0 0Tax credits
Expiring in up to three years 5 8 13 13 0 13Expiring in over three years and up to ten years 49 66 115 104 0 104Expiring in over ten years 0 0 0 0 0 0Not expiring 0 0 0 30 0 30
54 74 128 147 0 147
recognised on deductible temporary differences of €196m (246m) due to lack of recoverability. The available tax loss carry-forwards and tax credits are broken down as follows.

139Consolidated financial statementsNotes
Munich Re Group Annual Report 2018
15 Other assets
These mainly comprise property, plant and equipment, with owner-occupied property totalling €2,178m (2,280m), and
operating and office equipment amounting to €219m (241m). Advance payments on insurance amounted to €303m (333m), derivatives totalled €20m (27m), and miscellaneous deferred items came to €177m (170m).
Development of property, plant and equipment
Owner- Operating occupied and office €m property equipment Other Total 2018 2018 2018 2018Gross carrying amount at 31 Dec. previous year 3,494 1,000 31 4,525Accumulated amortisation and impairment losses at 31 Dec. previous year –1,214 –760 –24 –1,998Carrying amount at 31 Dec. previous year 2,280 241 7 2,527Currency translation differences 6 –1 0 5Additions
Business combinations 0 2 0 2Other 13 69 1 83
Disposals Loss of control 0 –2 0 –2Other –2 –5 –1 –8
Impairment losses reversed 58 0 0 58Depreciation and impairment losses
Depreciation –64 –83 –4 –151Impairment losses –1 0 0 –1
Reclassification –111 –2 0 –113Carrying amount at 31 Dec. financial year 2,178 219 4 2,400Accumulated amortisation and impairment losses at 31 Dec. financial year –1,170 –743 –25 –1,938Gross carrying amount at 31 Dec. financial year 3,348 962 28 4,338
Owner- Operating occupied and office €m property equipment Other Total Prev. year Prev. year Prev. year Prev. yearGross carrying amount at 31 Dec. previous year 3,554 1,038 34 4,625Accumulated amortisation and impairment losses at 31 Dec. previous year –1,179 –765 –24 –1,967Carrying amount at 31 Dec. previous year 2,374 272 11 2,657Currency translation differences –23 –3 –1 –27Additions
Business combinations 0 0 0 0Other 16 88 2 106
Disposals Loss of control 0 –1 0 –1Other –9 –19 –1 –29
Impairment losses reversed 5 0 0 5Depreciation and impairment losses
Depreciation –65 –92 –4 –161Impairment losses 0 –1 0 –1
Reclassification –19 –3 0 –22Carrying amount at 31 Dec. financial year 2,280 241 7 2,527Accumulated amortisation and impairment losses at 31 Dec. financial year –1,214 –760 –24 –1,998Gross carrying amount at 31 Dec. financial year 3,494 1,000 31 4,525

Consolidated financial statementsNotes
140
The other reserves of Group equity include an amount of €7m for disposal groups mainly attributable to unrealised gains on fixed-interest securities, and €44m in unrealised losses on the currency translation reserve.
In the fourth quarter of 2018, the disposal groups ERGO Russia Life, Moscow, and the Dutch companies Van Arkel Gerechtsdeurwaarders B.V., Leiden, Landelijke Associatie Van Gerechtsdeurwaarders B.V., Groningen, and Bos Incasso B.V., Groningen were sold and deconsolidated.
In the segment reporting, we disclose how the non-current assets held for sale are allocated between the segments. Transactions between the disposal group and the Group’s continuing operations continued to be fully eliminated. The assets and liabilities of the disposal group and assets held for sale are shown in the following table:
Of the “other securities available for sale” shown in the table, €70m (52m) is allocated to Level 1, €129m (23m) to Level 2 and €89m (0m) to Level 3 of the fair value hierarchy.
Non-current assets and disposal groups held for sale €m 31.12.2018 Prev. yearAssets Land and buildings, including buildings on third-party land 102 22Other securities available for sale 288 75Other investments 16 3Other assets of the disposal group 622 17Total assets 1,029 118Liabilities Gross technical provisions 749 57Other liabilities of the disposal group 74 8Total liabilities 823 65
The fair value of the land and buildings amounts to €3,222m (2,936m). This is allocated to Level 3 of the fair value hierarchy; see Assets – B Investments – Determining fair values. The methodology for determining the fair values is described in the Notes to the consolidated balance sheet – Assets (3) Land and buildings, including buildings on third-party land.
The expenditures recognised in the carrying amount for assets in the course of construction totalled €5m (4m) for property and €14m (22m) for plant and equipment. Commitments to acquire property total €10m (3m) and commitments to acquire plant and equipment €6m (12m).
16 Assets held for sale
In the fourth quarter of 2018, ERGO Lebensversicherung AG agreed to sell the shopping mall Gänsemarkt-Passage, Hamburg, which is used as an investment property, to SIGNA Real Estate Group. At the balance sheet date, we recognised this investment property as held for sale. Its disposal is planned for the second quarter of 2019. Furthermore, as at 31 December 2018, we recognised as held for sale four properties held by VICTORIA Lebens-versicherung Aktiengesellschaft, Düsseldorf, and a further property held by several ERGO insurance companies. All of these properties had previously been held for investment purposes by the respective companies. As part of the classification of one of these properties as held for sale we reversed an impairment loss of €2m that had been recognised in previous years, with impact on the income statement.
As at the balance sheet date, nine ERGO insurance companies and/or branches primarily operating in eastern Europe were classified as held for sale. No value adjustments were required in the process. The sales are expected to take place in 2019 and support our strategic alignment.
Furthermore, as at 31 December 2018, we recognised MSP Underwriting Ltd., London, including its Beaufort subsidiaries as a disposal group. It was classified as such in the third quarter of 2018. The sale was completed at the end of February 2019.
8106 A
8106 B

141Consolidated financial statementsNotes
Munich Re Group Annual Report 2018
Notes to the consolidated balance sheet – Equity and liabilities
17 EquityThe total share capital of €587,725,396.48 as at 31 December 2018 is divided into 149,538,477 no-par-value registered shares, each fully paid up and entitled to one vote. The number of shares in circulation was as follows:
Development of shares in circulation
Number of shares 2018 Prev. yearStatus at 31 Dec. previous year 151,259,431 156,902,293Additions
Disposals from hedging stock appreciation rights under long-term incentive plans 0 200
Reductions Acquisition of shares for retirement (share buy-back programme) –5,462,053 –5,643,062
Status at 31 Dec. financial year 145,797,378 151,259,431
On 31 December 2018, a total of 3,741,099 Munich Reinsurance Company shares with a calculated nominal value of around €14.7m were held by Group companies. This represents around 2.5% of the share capital.
In the financial year, Munich Re bought back 5,462,053 shares. This includes the 2017/2018 share buy-back programme completed on 6 April 2018, and the 2018/2019 programme approved by the Board of Management of Munich Reinsurance Company on 15 March 2018, which provides for the acquisition of shares up to a value of €1bn before the 2019 Annual General Meeting.
The acquisition costs of all Munich Re shares in the possession of Group companies at the end of the financial year totalled €696,764,312.27.
A total of €1,286m was distributed to Munich Reinsurance Company’s equity holders for the financial year 2017 in the form of a dividend of €8.60 per dividend-bearing share.
Composition of the authorised capital
€m 31.12.2018Authorised Capital 2015 (until 22 April 2020) 10Authorised Capital 2017 (until 25 April 2022) 280Total 290
Composition of contingent capital
€m 31.12.2018Contingent Capital 2015 (until 22 April 2020) 117Total 117

Consolidated financial statementsNotes
142
The taxes of €405m (121m) recognised directly in equity comprise an amount of €368m (120m) for deferred tax assets, and current taxes on unrealised gains and losses of €37m (1m) on investments.
Information on capital management is provided in the management report under “Financial position – Capital position”.
18 Hierarchy for the fair value measurement of liabilities
All financial liabilities that are recognised at fair value, and such financial instruments that are not recognised at fair value but for which a fair value is disclosed in the Notes, are allocated to one of the fair value hierarchy levels of IFRS 13.
At each reporting date, we assess whether the allocation of these liabilities to the levels of the fair value hierarchy is still appropriate. If changes in the basis of valuation have occurred – for instance, if a market is no longer active or the valuation was performed using inputs requiring another allocation – we make the necessary adjustments.
For information on the valuation models used for measuring derivatives, please see the table and explanations in the Notes to the consolidated balance sheet – Assets (4) Hierarchy for the fair value measurement of assets. The measurement of subordinated bonds for which no market prices are available is conducted using the present-value method and taking observable market inputs into account. For the bonds we have issued, we use the market prices provided by price quoters for the corresponding assets. The fair values of our amounts due to banks are determined using the present-value method, in part exclusively using observable market inputs, and partly also taking into account non-observable inputs.
The following table shows the allocation of the financial liabilities to levels of the fair value hierarchy.
Tax effects in the income and expenses recognised directly in equity
2018 Prev. year€m Before tax Tax After tax Before tax Tax After taxCurrency translation 345 0 345 –1,837 0 –1,837Unrealised gains and losses on investments –2,563 434 –2,129 167 193 360Change resulting from equity method measurement 47 0 47 –15 –5 –20Change resulting from cash flow hedges 0 0 0 –1 0 –1Remeasurements of defined benefit plans 107 –29 78 31 –67 –36Other changes –1 0 –1 4 0 4Income and expenses recognised directly in equity –2,064 405 –1,659 –1,651 121 –1,530

143Consolidated financial statementsNotes
Munich Re Group Annual Report 2018
Gains (losses) recognised in the consolidated income statement are shown in the insurance-related investment result, while gains (losses) recognised in equity are shown in the statement of recognised income and expense for the 2018 financial year in the item Unrealised gains and losses on investments, Gains (losses) recognised in equity. Gains (losses) recognised in the consolidated income statement that are attributable to liabilities shown at the end of the financial year are shown in the statement of recognised income and expense for the 2018 financial year under “Unrealised gains and losses on investments, Recognised in the consolidated income statement”.
Only derivatives with a negative fair value are currently recognised at fair value. Of these, we allocate the insurance derivatives to level 3 of the fair value hierarchy.
The following table presents the reconciliation from the opening balances to the closing balances for these insurance-linked derivatives:
Reconciliation for liabilities allocated to Level 3
Other liabilities at fair value through profit or loss€m 31.12.2018 Prev. yearCarrying amount at 31 Dec. previous year 471 545Gains and losses –59 51
Gains (losses) recognised in the income statement –41 1Gains (losses) recognised in equity –18 50
Acquisitions 239 185Disposals –116 –211Transfer to Level 3 0 0Transfer out of Level 3 0 0Change in the fair value of derivatives –1 3Carrying amount at 31 Dec. financial year 652 471Gains (losses) recognised in the income statement that are attributable to liabilities shown at the end of the financial year –23 143
Prev. year€m Level 1 Level 2 Level 3 TotalLiabilities measured at fair value Other liabilities
Derivatives 32 881 471 1,385Total 32 881 471 1,385Liabilities not measured at fair value Subordinated liabilities 3,250 57 2 3,309Bonds and notes issued 354 0 0 354Amounts due to banks 0 120 485 606Other liabilities from financial transactions 0 352 16 368Total 3,604 530 503 4,637
Allocation of liabilities to levels of the fair value hierarchy
31.12.2018€m Level 1 Level 2 Level 3 TotalLiabilities measured at fair value Other liabilities
Derivatives 139 788 652 1,579Total 139 788 652 1,579Liabilities not measured at fair value Subordinated liabilities 4,002 55 2 4,059Bonds and notes issued 354 0 0 354Amounts due to banks 0 101 463 564Other liabilities from financial transactions 0 388 32 419Total 4,356 544 497 5,397

Consolidated financial statementsNotes
144
Munich Re Group Annual Report 2018
19 Subordinated liabilities
In the case of Munich Reinsurance Company bonds, annual outflows of liquidity amounting to the respective interest payments occur until the first possible call dates. In the financial year, these amounted to €176m (254m). Thereafter, the liquidity outflows will vary, depending on the respective interest-rate level. For the registered bonds of ERGO Versicherung Aktiengesellschaft, and for the
HSB Group bonds, the annual outflow is variable, depending on the respective interest-rate levels.
The fair value of the subordinated liabilities at the balance sheet date amounted to €4,059m (3,309m). For the Munich Reinsurance Company bonds, we take the stock market prices as fair values. For the other subordinated liabilities, we determine the fair values using net present-value methods with observable market inputs.
Breakdown of subordinated liabilities
€m A.M. Best Fitch Moody’s S&P 31.12.2018 Prev. yearMunich Reinsurance Company, Munich, 3.25% until 2029, thereafter floating, €1,250m, Bonds 2018/2049 – A A2 (hyb) – 1,236 0Munich Reinsurance Company, Munich, 6.25% until 2022, thereafter floating, €900m, Bonds 2012/2042 a+ A – A 897 896Munich Reinsurance Company, Munich, 6.625% until 2022, thereafter floating, £450m, Bonds 2012/2042 a+ A – A 501 506Munich Reinsurance Company, Munich, 6.00% until 2021, thereafter floating, €1,000m, Bonds 2011/2041 a+ A – A 997 995Munich Reinsurance Company, Munich, 7.625% until 2018, thereafter floating, £300m1, Bonds 2003/2028 – – – – 0 338ERGO Versicherung Aktiengesellschaft, Vienna, secondary market yield on federal government bonds (Austria) +70 BP, €6m, Registered bonds 2001/perpetual – – – – 6 6ERGO Versicherung Aktiengesellschaft, Vienna, secondary market yield on federal government bonds (Austria) +70 BP, €7m, Registered bonds 1998/perpetual – – – – 7 7HSB Group Inc., Delaware, LIBOR +91 BP, US$ 76m, Bonds 1997/2027 – – – – 46 42Total 3,689 2,790
1 In the second quarter 2018, the issuer redeemed the entire bond.
20 Unearned premium
Unearned premiums
€m 31.12.2018 Prev. yearGross 9,790 8,857Ceded share –390 –328Net 9,400 8,529
Development of gross unearned premiums
€m 31.12.2018 Prev. yearStatus at 31 Dec. previous year 8,857 8,984Currency translation effects 96 –535Changes in consolidated group/Other –208 –16Gross premiums written 49,064 49,115Earned premiums –48,019 –48,691Status at 31 Dec. financial year 9,790 8,857
The item Changes in consolidated group/Other includes unearned premiums of the disposal group totalling –€124m (–16m).

145Consolidated financial statementsNotes
Munich Re Group Annual Report 2018
21 Provision for future policy benefits
Provision for future policy benefits
€m 31.12.2018 Prev. yearGross 111,147 108,956Ceded share –823 –760Net 110,324 108,196
Gross provision for future policy benefits according to type of insurance cover
€m 31.12.2018 Prev. yearLife and health 110,469 108,287Reinsurance 12,107 10,825ERGO 98,362 97,462
Term life insurance 3,000 3,317Other life insurance 24,403 25,490Annuity insurance 34,082 33,210Disability insurance 1,417 1,337Contracts with combinationof more than one risk 0 47Health 35,460 34,061
Property-casualty 678 668Reinsurance 26 26ERGO 652 643Total 111,147 108,956
The provision for future policy benefits in life reinsurance largely involves contracts where the mortality or morbidity risk predominates. In reinsurance, annuity contracts have a significantly lower weight than in primary insurance.
Essentially the same actuarial assumptions have been used as in the previous year for measuring the provisions for future policy benefits for business in force.
In the ERGO Life and Health segment, there was an adjustment in 2018 to the assumptions regarding future lapses, expenses, and long-term interest-rate levels that are geared to the long-term regular return on investments. The provision for future policy benefits reduced as a result of these adjustments.
Further information on the underwriting risks can be found in the risk report in the section “Significant risks”.
Development of gross provision for future policy benefits
€m 2018 Prev. yearStatus at 31 Dec. previous year 108,956 108,108Currency translation differences 92 –175Changes in consolidated group/Other 745 301Changes
Scheduled 1,479 629Unscheduled –125 92
Status at 31 Dec. financial year 111,147 108,956
The change shown under “Changes in consolidated group/other” contains €360m (321m) in savings premiums for capitalisation products and €548m (707m) for reclassifications from the provision for premium refunds. This still includes the provision for outstanding claims of the disposal group amounting to €130m (8m).
Scheduled changes in the provision for future policy benefits contain the changes deriving from prospective calculation as a result of premium payments, claims and the unwinding of discount in the 2018 financial year.
22 Provision for outstanding claims
Provision for outstanding claims
€m 31.12.2018 Prev. yearGross 66,356 63,965Ceded share –3,005 –2,957Net 63,352 61,008
Gross provision by type
€m 31.12.2018 Prev. yearAnnuity claims provision 7,333 7,105Case reserve 25,697 24,592IBNR reserve 33,326 32,268Total 66,356 63,965
The annuity claims provision involves periodic payments for occupational and other disability cases and is usually due long term. A major part of this provision is established in the life and health reinsurance and ERGO Life and Health Germany segments for future annuity payments; a small part refers to provisions for annuities in personal accident, liability and workers’ compensation insurance. The biometric actuarial assumptions are selected using appropriate actuarial principles.
Provisions for annuity claims are calculated as the present value of the expected future payments. The discount rates used are presented in the disclosures on risks from insurance contracts under (39) Disclosures on risks from life and health insurance business and (40) Disclosures on risks from property-casualty insurance business.
The case reserve reflects the amount which is expected to be needed to settle claims which are known and have already been reported at the balance sheet date. The major part of this provision is measured at face value. The IBNR reserve is calculated using actuarial methods on the basis of historical claims development data and taking into account foreseeable future trends.
8209
8212

Consolidated financial statementsNotes
146
In the financial year, most sectors experienced relatively low claims-reporting activity from previous years, which had a positive influence on the ultimate-loss projection.
Net run-off results in property-casualty business The values in the following run-off triangles cover more than 99% of our Group’s portfolio of property-casualty business.
The expected timing of payments from the provisions for outstanding claims may involve considerable uncertainty.
The claims expenses for the financial year show payments made for the financial year and expenses for posting the claims reserve in that year. The provisions set up for claims from previous years are regularly updated using best estimates based on exposure and claims information and past claims experience. The respective change is shown under “claims expenses for previous years”. The gross provision for outstanding claims of the disposal group amounting to –€301m (–30m) is recognised under “Changes in consolidated group/Other”.
Expected payments from the provisions for outstanding claims (property-casualty only)
Reinsurance ERGO% 31.12.2018 Prev. year 31.12.2018 Prev. yearUp to one year 36.3 34.9 30.4 32.8Over one year and up to five years 44.2 44.5 38.6 37.8Over five years and up to ten years 11.4 11.7 15.7 15.1Over ten years and up to fifteen years 3.7 3.9 5.5 5.2Over fifteen years 4.4 5.0 9.8 9.1
Development of the claims reserve in the property-casualty segment1
2018 Prev. year Ceded Ceded €m Gross share Net Gross share NetBalance at 31 Dec. previous year 51,831 –2,757 49,074 48,877 –2,235 46,643Currency translation differences 1,024 –81 943 –3,266 164 –3,102Changes in consolidated group/Other –545 74 –471 –30 0 –30Claims expenses
For the year under review 18,443 –766 17,677 19,201 –1,209 17,992For previous years –2,252 133 –2,119 –1,084 –20 –1,104
Total claims expenses 16,191 –634 15,558 18,118 –1,230 16,888Unwinding of discount 48 –2 46 49 –2 48Less payments
For the year under review –5,756 285 –5,471 –5,239 132 –5,107For previous years –8,857 338 –8,519 –6,678 413 –6,265
Total payments –14,613 624 –13,990 –11,917 545 –11,372Balance at 31 Dec. financial year 53,937 –2,776 51,161 51,831 –2,757 49,074
1 Comprises the segments property-casualty reinsurance, ERGO Property-casualty Germany and the property-casualty section of the ERGO International segment.
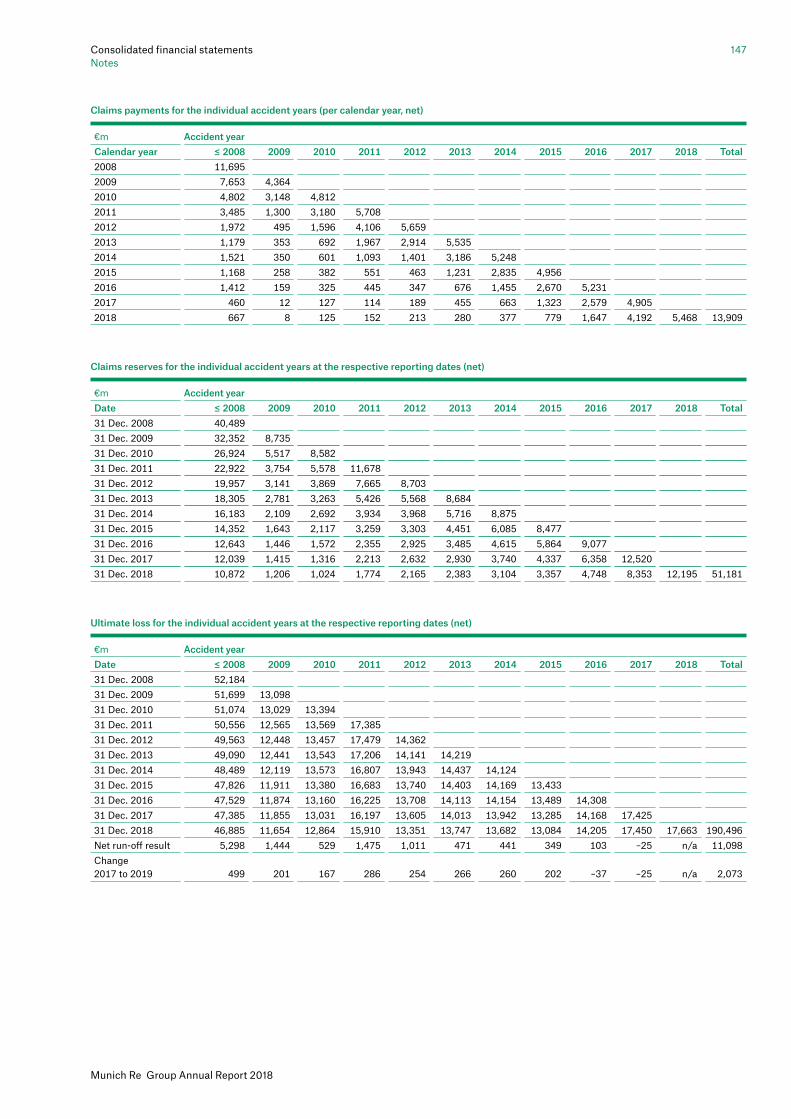
147Consolidated financial statementsNotes
Munich Re Group Annual Report 2018
Claims payments for the individual accident years (per calendar year, net)
€m Accident year Calendar year ≤ 2008 2009 2010 2011 2012 2013 2014 2015 2016 2017 2018 Total2008 11,695 2009 7,653 4,364 2010 4,802 3,148 4,812 2011 3,485 1,300 3,180 5,708 2012 1,972 495 1,596 4,106 5,659 2013 1,179 353 692 1,967 2,914 5,535 2014 1,521 350 601 1,093 1,401 3,186 5,248 2015 1,168 258 382 551 463 1,231 2,835 4,956 2016 1,412 159 325 445 347 676 1,455 2,670 5,231 2017 460 12 127 114 189 455 663 1,323 2,579 4,905 2018 667 8 125 152 213 280 377 779 1,647 4,192 5,468 13,909
Claims reserves for the individual accident years at the respective reporting dates (net)
€m Accident year Date ≤ 2008 2009 2010 2011 2012 2013 2014 2015 2016 2017 2018 Total31 Dec. 2008 40,489 31 Dec. 2009 32,352 8,735 31 Dec. 2010 26,924 5,517 8,582 31 Dec. 2011 22,922 3,754 5,578 11,678 31 Dec. 2012 19,957 3,141 3,869 7,665 8,703 31 Dec. 2013 18,305 2,781 3,263 5,426 5,568 8,684 31 Dec. 2014 16,183 2,109 2,692 3,934 3,968 5,716 8,875 31 Dec. 2015 14,352 1,643 2,117 3,259 3,303 4,451 6,085 8,477 31 Dec. 2016 12,643 1,446 1,572 2,355 2,925 3,485 4,615 5,864 9,077 31 Dec. 2017 12,039 1,415 1,316 2,213 2,632 2,930 3,740 4,337 6,358 12,520 31 Dec. 2018 10,872 1,206 1,024 1,774 2,165 2,383 3,104 3,357 4,748 8,353 12,195 51,181
Ultimate loss for the individual accident years at the respective reporting dates (net)
€m Accident year Date ≤ 2008 2009 2010 2011 2012 2013 2014 2015 2016 2017 2018 Total31 Dec. 2008 52,184 31 Dec. 2009 51,699 13,098 31 Dec. 2010 51,074 13,029 13,394 31 Dec. 2011 50,556 12,565 13,569 17,385 31 Dec. 2012 49,563 12,448 13,457 17,479 14,362 31 Dec. 2013 49,090 12,441 13,543 17,206 14,141 14,219 31 Dec. 2014 48,489 12,119 13,573 16,807 13,943 14,437 14,124 31 Dec. 2015 47,826 11,911 13,380 16,683 13,740 14,403 14,169 13,433 31 Dec. 2016 47,529 11,874 13,160 16,225 13,708 14,113 14,154 13,489 14,308 31 Dec. 2017 47,385 11,855 13,031 16,197 13,605 14,013 13,942 13,285 14,168 17,425 31 Dec. 2018 46,885 11,654 12,864 15,910 13,351 13,747 13,682 13,084 14,205 17,450 17,663 190,496Net run-off result 5,298 1,444 529 1,475 1,011 471 441 349 103 –25 n/a 11,098Change 2017 to 2019 499 201 167 286 254 266 260 202 –37 –25 n/a 2,073

Consolidated financial statementsNotes
148
The ultimate loss of an accident year comprises all payments made for that accident year up to the reporting date, plus the claims reserve at the reporting date. Given complete information regarding all losses incurred up to the balance sheet date, the ultimate-loss status for each accident-year period would remain the same. In practice, however, the ultimate-loss status (based on estimates) is exposed to fluctuations that reflect the growth in knowledge about the claims cases. Changes in the consolidated group, especially new acquisitions or the composition of reportable segments, can also have an influence on the ultimate-loss status.
The run-off triangles are prepared on a currency-adjusted basis. For this purpose, all figures are translated from the respective local currency into the Group currency (euro) based on year-end exchange rates. This ensures that currency translation does not lead to run-off effects.
23 Other technical provisions
Breakdown of other technical provisions
€m 31.12.2018 Prev. yearProvision for premium refunds based on national regulations 8,549 8,642Provision for deferred premium refunds 8,041 9,709
Thereof resulting from unrealised gains and losses on investments (recognised directly in equity) 3,254 4,820Thereof resulting from other remeasurements (recognised in profit or loss) 4,788 4,889
Provision for profit commissions 593 676Other 132 147Total (gross) 17,314 19,174
Of the provision for premium refunds based on national regulations, €78m (77m) is apportionable to property-casualty insurance. The provision for deferred premium refunds is established solely for life and health insurance.
The ceded share of “Other technical provisions” amounts to €46m (125m), of which €3m (0m) is apportionable to the ceded share of the provision for premium refunds based on national regulations.
Development of provision for premium refunds based on national regulations
€m 2018 Prev. yearStatus at 31 Dec. previous year 8,642 8,209Changes in consolidated group 2 0Allocation/Withdrawal –96 433Status at 31 Dec. financial year 8,549 8,642
8230
8233
Development of provision for deferred premium refunds
€m 2018 Prev. yearStatus at 31 Dec. previous year 9,709 10,155Changes in consolidated group 0 0Change resulting from unrealisedgains and losses on investments(recognised directly in equity) –1,566 –769Change resulting fromother remeasurements (recognised in profit or loss) –101 323Status at 31 Dec. financial year 8,041 9,709
The above change resulting from unrealised gains and losses on investments reflects the proportional allocation to expected future policyholders’ bonuses of the change in fair values that occurred in the past year.
To determine the portion of the measurement differences allocable to the provision for deferred premium refunds, rates of between 50% and 92.5% after tax were used.
24 Gross technical provisions for unit-linked life insurance
These provisions are measured retrospectively. The withdrawal for underwriting risks from the premiums and provision for future policy benefits is made on the basis of prudent assumptions regarding expected mortality and morbidity. Here, as with the provision for future policy benefits for non-unit-linked life insurance, we base the underlying calculation on best estimates, with appropriate provisions for adverse deviation.
The provisions are directly covered by the investments for unit-linked life insurance contracts. Small differences in relation to these investments arise as a result of including unearned revenue liability in these provisions.
We recognise a provision for the disposal group of €165m (0m) in the item “Changes in consolidated group/Other”.
8236
Development of gross provisions
€m 2018 Prev. yearBalance at 31 Dec. previous year 8,971 8,429Changes in consolidated group/Other –178 43Savings premiums 465 755Unrealised gains/losses on fund assets –733 414Withdrawal for expenses and risk –33 –63Withdrawal for benefits –567 –606Balance at 31 Dec. financial year 7,925 8,971
8239

149Consolidated financial statementsNotes
Munich Re Group Annual Report 2018
25 Other provisions
Breakdown of other provisions
€m 31.12.2018 Prev. yearProvisions for post-employment benefits 2,992 2,982Other provisions 1,391 1,526Total 4,383 4,508
Provisions for post-employment benefits and similar obligationsMunich Re companies generally give pension commitments to their employees in the form of defined contribution plans or defined benefit plans. Special regional economic, legal and tax features are taken into account. The type and amount of the pension obligations are determined by the conditions of the respective pension plan. The pension commitments comprise obligations towards active members or retired members with vested benefits, and current pension payments. Defined benefit plans are funded internally through provisions for post-employment benefits, and externally through funds and insurance contracts concluded to cover the benefit obligations.
Expenses for defined contribution plans in the year under review totalled €64m (66m), with €109m (113m) for contributions to state plans.
The present value of obligations under defined pension plans is €5,921m (5,924m), and the plan assets to be offset amount to €3,301m (3,253m). Defined benefit plans comprise the following main plans:
Munich Reinsurance Company‘s pension obligations account for €1,521m (1,490m) of the present value of obligations under defined pension plans and €1,710m (1,619m) of plan assets. The obligations include disability and old-age pensions, and pensions for surviving dependants. The amount of the pensions generally depends on salary and length of service. The defined benefits granted up to 31 December 2007 are financed through a fund. New members on or after 1 January 2008 receive pension commitments in the form of defined contribution plans financed by means of intra-Group insurance contracts securing the obligations under pension schemes. The fund and insurance contracts have been grouped in a contractual trust agreement (CTA).
The pension obligations of the ERGO Group account for €3,018m (2,960m) of the present value of obligations under defined pension plans and €423m (422m) of plan assets. The obligations include disability and old-age
8242
pensions, and pensions for surviving dependants. The amount of the pensions generally depends on salary and length of service. The commitments are generally funded through pension provisions. New members receive pension commitments in the form of defined contribution plans financed by means of intra-Group insurance contracts securing the obligations under pension schemes. There are also medical-care benefit obligations.
The pension obligations of Munich Reinsurance America, Inc. account for €661m (694m) of the present value of obligations under defined benefit plans, and €484m (501m) of plan assets. The obligations include pensions for employees and surviving dependants. The amount of the pensions generally depends on includable compensation and length of service. The plan is financed through a trust and pension provisions. The plan was closed to new members effective 1 January 2006, and to all remaining members effective 31 December 2011. With effect from 1 January 2012, all members now receive pension commitments in the form of defined contribution plans. There are also retiree medical-care benefit obligations.
Development of the present value of the defined benefit obligations
€m 2018 Prev. yearStatus at 31 Dec. previous year 5,924 6,095Currency translation differences 35 –150Changes in consolidated group –1 1Current service cost 145 163Past service cost 9 –41Gains and losses from plan settlements 0 0Contributions by plan participants 3 7Interest expense 121 120Payments –145 –145Payments from plan settlements –4 –3Transfer of obligations 0 4Actuarial gains/losses: Change in demographic assumptions –9 –9Actuarial gains/losses: Change in financial assumptions –148 –58Actuarial gains/losses: Experience adjustments –6 –30Other –2 –29Status at 31 Dec. financial year 5,921 5,924
The present value of medical-care benefit obligations amounted to €274m (281m) at the balance sheet date.
The present value of the obligations under defined benefit plans breaks down as follows:
8245

Consolidated financial statementsNotes
150
As in the previous year, the plan assets do not include any own shares.
For the 2019 financial year, capital transfers of €84m (81m) to plan assets are expected.
The reimbursement rights derive from insurance concluded to cover the benefit obligations.
There was an effect of €12m (13m) resulting from the asset ceiling on overfunded defined benefit plans.
Breakdown of the fair value of plan assets for defined benefit plans
% 31.12.2018 Prev. yearNo quoted market price in an active market Cash or cash equivalents 0 1Real estate 1 1Fixed-interest securities 0 1Non-fixed-interest securities 3 4
Equities 0 0Investment funds 3 4Other 0 0
Insurance contracts 31 29Other 1 1
Development of the reimbursement rights for defined benefit plans
€m 2018 Prev. yearBalance at 31 Dec. previous year 280 276Changes in consolidated group –1 1Interest income 5 5Return excluding interest income –4 –4Contributions by the employer 21 20Contributions by plan participants 0 0Payments –8 –7Transfer of assets 0 –10Other –1 –1Balance at 31 Dec. financial year 292 280
8253
Breakdown of the present value of defined benefit obligations
% 31.12.2018 Prev. yearActive members 48 50Deferred members 16 15Pensioners 36 35Total 100 100
Pension obligations are measured using assumptions about future developments. The consolidated companies used the following actuarial assumptions (weighted-average values):
Actuarial assumptions
% 2018 Prev. yearDiscount rate 2.2 2.1Future increases in entitlement/salary 1.8 2.0Future pension increases 1.5 1.4Medical cost trend rate 3.6 3.7
Munich Re uses generally recognised biometric actuarial assumptions, adjusted as a rule to take account of company-specific circumstances. The average remaining life expectancy of a 65-year-old plan participant is 24.6 years for women and 24.4 years for men.
Development of the fair value of plan assets for defined benefit plans
€m 2018 Prev. yearBalance at 31 Dec. previous year 3,253 3,388Currency translation differences 20 –109Changes in consolidated group 0 0Interest income 72 74Return excluding interest income –45 –75Contributions by the employer 70 84Contributions by plan participants 1 6Payments –68 –78Payments from plan settlements –1 –5Transfer of assets 0 –1Other –1 –30Balance at 31 Dec. financial year 3,301 3,253
Breakdown of the fair value of plan assets for defined benefit plans
% 31.12.2018 Prev. yearQuoted market price in an active market Fixed-interest securities 41 40Non-fixed-interest securities 22 23
Equities 4 4Investment funds 17 19Other 1 0
Other 1 0
8246
8247
8250

151Consolidated financial statementsNotes
Munich Re Group Annual Report 2018
Funded status of defined benefit plans
€m 31.12.2018 Prev. yearObligations funded through provisions
Present value of defined benefit obligations 2,780 2,743Other 0 –1Net balance sheet liability 2,780 2,741
Obligations funded through plan assets
Present value of defined benefit obligations 3,140 3,181Plan assets –3,301 –3,253Assets from the defined benefit plan 365 303Effect of asset ceiling 12 13Other –6 –4Net balance sheet liability 212 241
Obligations independent of funded obligations
Present value of defined benefit obligations 5,921 5,924Plan assets –3,301 –3,253Assets from the defined benefit plan 365 303Effect of asset ceiling 12 13Other –6 –5
Net balance sheet liability 2,992 2,982
The plan assets have the exclusive purpose of fulfilling the defined benefit obligations to which they are allocated and making provision for future outflows. This is required by law in several countries, whilst in other countries plan assets are provided on a voluntary basis.
The relationship between the fair value of the plan assets and the present value of the defined benefit obligations is referred to as the funded status. If the present value of defined benefit obligations exceeds the fair value of the plan assets, this excess of liabilities over assets is financed by means of provisions for post-employment benefits.
If the fair value of the plan assets exceeds the present value of the defined benefit obligations, an asset arises out of the defined benefit plan. As each plan is analysed individually, this may give rise to both a provision for post-employment benefits and an asset from the defined benefit plan.
Market fluctuations may give rise to changes in the fair value of the plan assets over time. Adjustments to the actuarial assumptions (e.g. life expectancy, actuarial interest rate) or deviations in actual risk experience from the risk experience assumed may result in changes in the
8255present value of the defined benefit obligations. Both factors may therefore lead to fluctuations in the funded status. To avoid these fluctuations wherever possible, care is taken, when choosing investments, that fluctuations in the fair value of the plan assets and in the present value of defined benefit obligations offset each other as far as possible whenever changes in certain influencing variables occur (asset-liability matching).
Development of the provision for defined benefit plans
€m 2018 Prev. yearBalance at 31 Dec. previous year 2,982 3,058Currency translation differences 13 –45Changes in consolidated group –1 1Expenses 201 172Payments –76 –67Payments from plan settlements –4 2Capital transfer to plan assets –71 –90Transfer of assets 0 5Transfer to other receivables 64 –36Actuarial gains/losses recognisedin equity –114 –14Other –2 –4Balance at 31 Dec. financial year 2,992 2,982
Breakdown of expenses booked in the financial year
€m 2018 Prev. yearNet interest cost 44 42Service cost 156 129Other 1 1Total 201 172
The expenses are distributed between the functional areas and shown mainly under “Operating expenses” and “Expenses for claims and benefits” in the consolidated income statement.
The actual losses on plan assets amount to €27m (actual losses of €1m), and the actual gains on reimbursements to €0m (€1m).
8258
8260
Breakdown of the present value of defined benefit obligations
% 31.12.2018 Prev. yearActive members 48 50Deferred members 16 15Pensioners 36 35Total 100 100
Pension obligations are measured using assumptions about future developments. The consolidated companies used the following actuarial assumptions (weighted-average values):
Actuarial assumptions
% 2018 Prev. yearDiscount rate 2.2 2.1Future increases in entitlement/salary 1.8 2.0Future pension increases 1.5 1.4Medical cost trend rate 3.6 3.7
Munich Re uses generally recognised biometric actuarial assumptions, adjusted as a rule to take account of company-specific circumstances. The average remaining life expectancy of a 65-year-old plan participant is 24.6 years for women and 24.4 years for men.
Development of the fair value of plan assets for defined benefit plans
€m 2018 Prev. yearBalance at 31 Dec. previous year 3,253 3,388Currency translation differences 20 –109Changes in consolidated group 0 0Interest income 72 74Return excluding interest income –45 –75Contributions by the employer 70 84Contributions by plan participants 1 6Payments –68 –78Payments from plan settlements –1 –5Transfer of assets 0 –1Other –1 –30Balance at 31 Dec. financial year 3,301 3,253
Breakdown of the fair value of plan assets for defined benefit plans
% 31.12.2018 Prev. yearQuoted market price in an active market Fixed-interest securities 41 40Non-fixed-interest securities 22 23
Equities 4 4Investment funds 17 19Other 1 0
Other 1 0
8246
8247
8250

Consolidated financial statementsNotes
152
includes components for multi-year performance and for the medium-term incentive plans. The “Miscellaneous” provisions comprise a large number of different items. The provisions for restructuring, early-retirement benefits/semi-retirement, anniversary benefits, multi-year performance and medium-term incentive plans are mainly long term, whereas the provisions for earned commission, salary obligations, other remuneration for desk and field staff, and miscellaneous are essentially short term.
Miscellaneous provisions
The provisions for restructuring mainly concern €295m (333m) for the “ERGO Strategy Programme” and €132m (170m) for the comprehensive restructuring of the sales organisations of the ERGO Group. ERGO also posted further restructuring provisions of €16m (39m) for the “Continuous improvement of the competitive position” project plus €7m (30m) for the discontinuation of new business and the winding up of the sales organisation in Belgium. The provision for multi-year variable remuneration
8275
Miscellaneous provisions
Other €m Prev. year Additions Withdrawals Reversal changes 31.12.2018Restructuring 601 39 –156 –25 0 459Commissions 176 1,936 –1,922 –9 –1 180Multi-year variable compensation 109 35 –27 –3 –3 111Early retirement benefits/semi-retirement 84 104 –76 –2 –1 109Anniversary benefits 102 15 –14 0 –2 101Salary obligations and other remuneration for desk and field staff 100 2 –10 0 0 92Miscellaneous 353 350 –317 –48 1 339Total 1,525 2,481 –2,522 –87 –6 1,391
The weighted average contractual period to maturity of our pension obligations is 20 (20) years.
An increase or decrease in the following essential actuarial assumptions has an impact on the present value of defined benefit obligations:
Contractual period to maturity of pension obligations
€m 31.12.2018 Prev. yearUp to one year 156 151Over one year and up to five years 730 679Over five years and up to ten years 1,031 975Over ten years and up to twenty years 2,503 2,398Over twenty years 6,058 6,037Total 10,478 10,241
The calculations for the actuarial assumptions classified as essential were carried out individually in order to display their effects separately.
8268
Sensitivity analysis
€m 31.12.2018 Prev. yearIncrease in actuarial discount rate by 50 BP –531 –534Decrease in actuarial discount rate by 50 BP 593 627Increase in salary/entitlement trends by 10 BP 23 22Decrease in salary/entitlement trends by 10 BP –20 –22Increase in pension trends by 10 BP 60 61Decrease in pension trends by 10 BP –61 –59Increase in medical cost trend rateby 100 BP 44 47Decrease in medical cost trend rate by 100 BP –37 –39Increase in mortality rate by 10 % –158 –161Decrease in mortality rate by 10 % 170 171
153Consolidated financial statementsNotes
Munich Re Group Annual Report 2018
with a negative fair value of €631m (665m), and negative fair values totalling €948m (719m) for insurance-linked derivatives and hedging derivatives of variable annuities. The miscellaneous liabilities also include €21m (25m) for social security and €148m (131m) for interest and rent.
The following table provides information on the remaining contractual maturities of the items shown under “Other liabilities”. The amounts payable on primary insurance business are directly linked to the underlying insurance business, and therefore not taken into account here. This currently also applies to the derivatives embedded in variable annuity business; see Disclosures on risks from insurance contracts, (39) Disclosures on risks from life and health insurance business. The derivatives listed below are recognised at fair value.
Remaining terms of the other liabilities according to carrying amounts
Carrying amounts€m 31.12.2018 Prev. yearUp to one year 9,516 8,549Over one year and up to two years 163 125Over two years and up to three years 271 770Over three years and up to four years 172 48Over four years and up to five years 2,062 159Over five years and up to ten years 1,391 1,069Over ten years 711 820Total 14,288 11,540
The major portion of the liabilities up to one year involve interest-free items, where the carrying amounts and the undiscounted cash flows are identical. A total of €334m (59m) of the amounts owed to banks and €920m (674m) of the liabilities from derivatives are due within one year. Any deviations in the liabilities with remaining terms of over one year from the undiscounted cash flows are not material for presenting the significance of the financial liabilities for our financial position and performance.
8284
26 Bonds and notes issued
Outflows of liquidity occur annually in the amount of the interest payments until the notes mature. These totalled US$ 25m (25m) in the financial year. The fair value at the reporting date amounts to €354m (354m).
27 Deposits retained on ceded business
Deposits retained on ceded business are collateral for technical provisions covering business ceded to reinsurers and retrocessionaires. As a rule, the changes in deposits retained on ceded business derive from the changes in the relevant technical provisions covering ceded business. Deposits retained on ceded business thus do not have a fixed maturity date, their release generally being dependent on run-off of the corresponding provisions.
28 Other liabilities
Breakdown of other liabilities
€m 31.12.2018 Prev. yearAmounts payable on primary insurance business 2,946 3,243Accounts payable on reinsurance business 4,555 4,690Amounts due to banks 674 602Miscellaneous liabilities 9,972 6,936Total 18,147 15,471
The accounts payable on primary insurance business mainly contain liabilities towards policyholders resulting from accumulated participation in surplus, premium deposits and insurance contracts with non-significant risk transfer.
Of the amounts due to banks, €93m (110m) is attributable to bank borrowing by Group companies acquired by Munich Re under its infrastructure investment strategy.
The miscellaneous liabilities contain liabilities of €3,989m (1,622m) resulting from reinsurance contracts with non-significant risk transfer, derivative financial instruments
8278
8281
Breakdown of bonds and notes issued
A.M. €m Best Fitch Moody’s S&P 31.12.2018 Prev. yearMunich Re America Corporation, Wilmington, 7.45%, US$ 334m, Senior Notes 1996/2026 a A+ A2 A– 292 277Total 292 277

Consolidated financial statementsNotes
154
29 Liabilities from financing activities
The table shows the cash and non-cash changes in liabilities arising from financing activities between the beginning of the financial year and the balance sheet date. The cash changes are included in the consolidated cash flow statement as item III., Cash flows from financing activities.
Long-term borrowings include subordinated liabilities and bonds and notes issued.
Change in the liabilities from financing activities
Assets held Short-term Long-term to hedge long-term Liabilities from borrowings borrowings borrowings from financing activities€m 2018 Prev. year 2018 Prev. year 2018 Prev. year 2018 Prev. yearBalance at 31 Dec. prev. year 602 396 3,068 4,542 0 –31 3,670 4,907Cash changes 71 –13 893 –1,368 0 0 963 –1,382Non-cash changes
Currency changes 1 0 15 –79 0 0 16 –79Changes in the fair value 0 0 0 –31 0 31 0 –1Changes in consolidated group/ other 0 220 4 5 0 0 5 224
Balance at 31 Dec. financial year 674 602 3,980 3,068 0 0 4,654 3,670

155Consolidated financial statementsNotes
Munich Re Group Annual Report 2018
Notes to the consolidated income statement
30 Premiums
Premiums
€m 2018 Prev. yearTotal gross premiums 49,973 50,117Gross premiums written 49,064 49,115Change in gross unearned premiums –1,045 –424Gross earned premiums 48,019 48,691 Ceded premiums written –2,357 –1,565Change in unearned premiums – Ceded share 72 37Earned premiums ceded –2,284 –1,528 Net earned premiums 45,735 47,164
The total gross premiums include not only the gross premiums written but also savings premiums from unit-linked life insurance and capitalisation products. Premiums from long-term insurance business, especially in life primary insurance, are recognised in full as earned premiums and income when they become due. Under gross premiums written, only those parts of the premium from unit-linked life business are included that are used to cover the risks and associated costs.
Of the gross premiums written from short-term insurance business, the portions attributable to periods after the balance sheet date are recognised as unearned premiums; see Notes to the consolidated balance sheet – Equity and liabilities under (20) Unearned premiums. Over the duration of the contracts, unearned premiums are reversed in accordance with the reduction in risk.
31 Interest income on technical provisions
The income from technical interest is the amount earned by assumed insurance business from the mainly risk-free investment of assets covering the technical provisions. The deposits retained on ceded business are also taken into account as a basis for the technical interest. Thus the portion of investment income corresponding to the deposit interest expense is included as a component in the calculation of the technical interest and reallocated to the technical result.
Quantitative information on technical interest can be found in the segment income statement.
In terms of the assets required to cover the technical provisions, the composition of the technical interest varies from segment to segment, depending on the type of insurance business conducted and the related statutory regulations.
In the life and health reinsurance segment, the income from technical interest in life reinsurance business corresponds to the risk-free interest on our technical provisions. For deposited provisions, income from technical interest corresponds to the agreed interest rate. In health reinsurance business, the interest on long-term reinsurance treaties corresponds to the contractually agreed allocations of interest. For short-term reinsurance business, the income from technical interest is calculated on the basis of the risk-free interest on technical provisions at the relevant national interest rate.
In property-casualty reinsurance, we allow for the fact that provisions established in prior years were invested at higher interest rates than the current level of market interest rates. The income from technical interest therefore corresponds to the risk-free interest on our discounted technical provisions at the respective historical interest rate, taking into account the relevant period of insurance and currency. Short-term interest rates are applied to the difference between the discounted provisions and balance sheet provisions.
In the ERGO Life and Health Germany segment, the income from technical interest for life primary insurance companies comprises the gains and losses from unit-linked life insurance, plus the guaranteed interest rate and profit sharing on the basis of the non-technical result sources. For health primary insurance companies, the income from technical interest corresponds to the allocation of interest to the ageing reserve (actuarial interest) and the allocation to the provision for premium refunds. The latter is based on the allocation of interest to the provision for non-performance-related premium refunds, on the investment result exceeding the actuarial interest rate, and on policyholders’ participation in the other non-technical result components.
In the ERGO Property-casualty Germany segment, the income from technical interest is calculated analogously to the procedure in the property-casualty reinsurance segment.
In the ERGO International segment, the income from technical interest for life primary insurance companies corresponds to the risk-free interest on the provision for future policy benefits at the relevant national interest rate, the gains and losses from unit-linked life insurance, and profit sharing where there are types of contract providing for this. The income from technical interest for property-casualty primary insurance companies is calculated analogously to the procedure in the property-casualty reinsurance segment.
The income from technical interest for health primary insurance business is based on the interest on other technical provisions at the relevant national risk-free interest rate and, where applicable, on the interest allocated to the provision for future policy benefits.

Consolidated financial statementsNotes
156
The change in the provision for future policy benefits (net) contains –€733m (414m) in unrealised gains/losses from unit-linked life insurance. Expenses for claims and benefits include expenses for policyholders’ bonuses. Of these expenses, €1,194m (1,009m) is for the allocation to the provision for premium refunds on the basis of national regulations, +€111m (–319m) for the change in the provision for deferred premium refunds recognised in the income statement, and €47m (107m) for direct crediting. The other technical result for life primary insurance mainly includes interest on policyholders’ accumulated credit.
Expenses for profit commission in reinsurance are shown under “operating expenses”, not under “expenses for claims and benefits”.
33 Operating expenses
Operating expenses
€m 2018 Prev. yearGross Acquisition costs, profit commission and reinsurance commission paid –10,098 –9,615Administrative expenses –3,027 –2,962Change in deferred acquisition costs and contingent commissions, amortisation and impairment losses on acquired insurance portfolios 20 78Gross operating expenses –13,105 –12,498 Ceded share Acquisition costs, profit commission and reinsurance commission paid 635 355Change in deferred acquisition costsand contingent commissions –116 –42Operating expenses – Ceded share 518 313 Net operating expenses –12,587 –12,186
32 Expenses for claims and benefits
Expenses for claims and benefits
€m 2018 Prev. yearGross Claims and benefits paid –33,679 –33,480Change in technical provisions
Provision for future policy benefits 211 –914Provision for outstanding claims –1,933 –6,577Provision for premium refunds –839 –1,968
Other technical result –125 –255Gross expenses for claims and benefits –36,366 –43,194 Ceded share Claims and benefits paid 851 934Change in technical provisions
Provision for future policy benefits 346 –12Provision for outstanding claims 45 646Provision for premium refunds 3 –1
Other technical result 6 –17Expenses for claims and benefits – Ceded share 1,250 1,549 Net Claims and benefits paid –32,829 –32,547Change in technical provisions
Provision for future policy benefits 556 –926Provision for outstanding claims –1,888 –5,931Provision for premium refunds –836 –1,969
Other technical result –119 –272Net expenses for claims and benefits –35,116 –41,645

157Consolidated financial statementsNotes
Munich Re Group Annual Report 2018
35 Insurance-related investment result
Result from insurance-related investments
€m 2018 Prev. yearResult from investments for unit-linked life insurance contracts –696 479Result from other insurance-related investments 12 –36Total –685 443
36 Other operating result
Other operating result
€m 2018 Prev. yearOther operating income 827 778
Thereof: Interest and similar income 135 111 Write-ups of other operating assets 83 21
Other operating expenses –976 –924Thereof: Interest and similar charges –117 –119Write-downs of other operating assets –86 –34
Other operating income mainly comprises income of €473m (497m) from services rendered, interest income of €30m (39m), income of €88m (95m) from the release/reduction of miscellaneous provisions and provisions for bad and doubtful debts, and income of €79m (30m) from owner-occupied property, some of which is also leased out.
In addition to expenses of €439m (399m) for services rendered, other operating expenses chiefly include interest expenses of €87m (102m), other write-downs of €78m (29m), and other tax of €119m (127m). They also contain expenses of €16m (13m) for owner-occupied property, some of which is also leased out.
The other operating result includes the result from reinsurance treaties with non-significant risk transfer totalling €80m (55m). A total of €81m (51m) derives from the life and health reinsurance segment.
8325
34 Investment result
Investment result by type of investment (before deduction of income from technical interest)
€m 2018 Prev. yearLand and buildings, including buildings on third-party land 563 324Investments in affiliated companies –3 –40Investments in associates and joint ventures 186 146Loans 2,092 2,825Other securities available for sale Fixed-interest 3,408 3,637Non-fixed-interest 389 1,359Other securities at fair value through profit or loss Held for trading
Fixed-interest 0 0Non-fixed-interest –6 7Derivatives 246 –364
Designated at fair value through profit or loss
Fixed-interest 3 –1Non-fixed-interest –23 26
Deposits retained on assumed reinsurance, and other investments 280 247Expenses for the management of investments, other expenses –610 –554Total 6,526 7,611
The result for land and buildings includes rental income of €489m (427m). The expenses for the management of investments include running costs and expenses for repair and maintenance of property totalling €92m (79m). We earned interest income of €1,889m (1,929m) on loans. Other securities available for sale produced regular income of €3,506m (3,547m), while derivatives generated €151m (112m). Interest expenses on non-derivative investments amounted to €8m (12m), administrative expenses to €392m (380m), and other expenses to €126m (96m).
Write-downs of non-derivative investments
€m 2018 Prev. yearLand and buildings, including buildings on third-party land –124 –141Investments in affiliated companies –10 –3Investments in associates and joint ventures –62 –11Loans –21 –11Other securities available for sale –968 –137Other securities at fair valuethrough profit or loss –74 –22Other investments –56 –44Total –1,315 –371

Consolidated financial statementsNotes
158
37 Other non-operating result, impairment losses on goodwill and net finance costs
Other non-operating result, impairment losses on goodwill and net finance costs
€m 2018 Prev. yearOther non-operating result –672 –926Impairment losses on goodwill –6 –9Net finance costs –196 –211
The other non-operating result is unrelated to the conclusion, administration or settlement of insurance contracts or the administration of investments. It essentially comprises a foreign-currency result of –€39m (–294m), the other non-technical result of –€507m (–497m), write-downs of €49m (68m) on other intangible assets, and restructuring expenses of €90m (76m).
Net finance costs include all interest income, interest expenses and other expenses directly attributable to strategic debt. Debt has a strategic character for us if it does not have an original, direct link with our operative business.
Net finance costs by financing instrument
€m 2018 Prev. yearSubordinated bonds ofMunich Reinsurance Company, Munich –170 –181Senior notes of Munich Re AmericaCorporation, Wilmington –21 –25Subordinated bonds ofHSB Group Inc., Delaware –3 –3Other –1 –2Total –196 –211
38 Taxes on income
This item shows the corporation tax and municipal trade earnings tax paid by the German consolidated companies (including solidarity surcharge) and the comparable taxes on earnings paid by the foreign consolidated companies in the Group. The determination of taxes on income includes the calculation of deferred taxes.
8327
8329
The following table shows the reconciliation between the expected taxes on income and the tax on income actually shown. The expected tax expenses are calculated by multiplying the consolidated result before taxes on income (after “other tax”) by the Group tax rate. The applicable Group tax rate amounts to 33%. This takes into account corporation tax including solidarity surcharge, and trade tax (GewSt). Trade-tax municipal factors range from 240% to 490%.
The effective tax burden is the ratio between the “taxes on income shown” and the “result before taxes on income (after “other tax”)”. In the 2018 financial year, there was a tax burden of 20.2% (previous year: tax relief of 315.0%).
8335 Main components of tax expenses/income
€m 2018 Prev. yearCurrent tax for financial year –893 –787Current tax for other periods 550 193Deferred tax resulting from the occurrence or reversal of temporary differences –182 1,038Deferred tax resulting fromthe occurrence or utilisation of loss carry-forwards 41 –224Valuation allowances for deferredtaxes/loss carry-forwards –93 –38Effects of changes in tax rateson deferred tax 1 116Taxes on income –576 298
Reconciliation to effective tax expenses/income
€m 2018 Prev. yearResult before taxes on income (after “other tax”) 2,851 94Group tax rate in % 33 33Derived taxes on income –941 –31Tax effect of:
Tax rate differences 179 104Tax-free income 23 129Non-deductible expenses –242 –206Valuation allowances for deferred taxes/loss carry-forwards –93 –38Change in tax rates and tax legislation 1 91Tax for prior years 586 297Trade tax adjustments –1 –6Other –88 –42
Taxes on income shown –576 298
8338

159Consolidated financial statementsNotes
Munich Re Group Annual Report 2018
39 Disclosures on risks from life and health insurance business
Significant risks from life and health insurance business comprise underwriting risks, market risks and liquidity risks. These risks are described in detail in the risk report.
Underwriting risk Of importance for the underwriting risks are biometric risks and lapse risks. Biometric risks mainly relate to mortality, disability, morbidity and longevity. The biometric assumptions we use for measuring insurance contracts in our portfolios are regularly reviewed on the basis of updated portfolio information. Especially in primary insurance, this includes considering country-specific reviews by supervisory authorities. We also take account of market standards when checking the adequacy of biometric actuarial assumptions and the trend assumptions included in them. In reinsurance, a lapse risk also derives from the indirect transfer of lapse risks from cedants. As a rule, both this risk and the financial risk from extraordinary termination of reinsurance contracts are largely ruled out through appropriate contract design. The lapse risk in primary insurance is allowed for by means of appropriate liquidity planning and adequate calculation of the surrender value.
Market risk With regard to our technical provisions, we are particularly exposed to interest-rate risk. A distinction must be made between risks of changes in interest rates on the one hand and interest-rate guarantee risks on the other. Risks of changes in interest rates would result from the discounting of the provision for future policy benefits and of parts of the provision for outstanding claims. In accordance with accounting valuation rules, the discount rate is fixed at contract commencement and will generally not be adjusted during the term of the contract. To this extent, the accounting valuation of these technical provisions does not depend directly on the level of the market interest rates. Economically, however, an interest-rate risk derives in principle from the need to earn a return on the investments covering the provision that is commensurate with the discount rate used in measuring the provision.
In reinsurance, we use the following discount rates for the provision for future policy benefits and the provision for outstanding claims:
Disclosures on risks from insurance contracts and financial instruments Munich Re’s reporting is based on various legal regulations governing risks it is exposed to as a result of its business operations:
In the Notes to the financial statements, risks from insurance contracts must be reported in accordance with IFRS 4 and risks from financial instruments in accordance with IFRS 7. Further disclosures on risks are required in the management report under Section 315 (2) no. 2 of the German Commercial Code (HGB) and German Accounting Standard no. 20 (DRS 20) for management reports.
Since risk reporting concerns not only accounting but also the activities of integrated risk management (IRM) at Munich Re, information on risks is provided in the risk report within the management report, in the disclosures on risks from insurance contracts, and in the disclosures on technical provisions and financial instruments in the Notes to the financial statements. Where necessary, we refer to the relevant information in the risk report and information on the respective items.
The disclosures in the risk report largely adopt a purely economic view. The report provides an account of the organisation of risk management and Munich Re’s risk strategy, briefly outlines the main risks we are exposed to, and describes the economic risk capital calculated by means of our internal risk model. The report also contains information on specific risk complexes.
The provision – stipulated by the requirements of IFRS 4 – of quantitative data on the effects of changes in the assumptions underlying the measurement of insurance contracts and/or in the market environment is also covered by information about economic risk capital stated in the risk report.
In the Notes to the financial statements, we describe in detail uncertainties involved in measuring insurance contracts. For risks from financial instruments, IFRS 7 stipulates that the disclosures must comprise information on the remaining terms and the rating.

Consolidated financial statementsNotes
160
Discount rates used for provisions – Reinsurance (gross)
€m 31.12.2018 Prev. yearWithout discount rate 3,967 3,760Discount rate ≤ 2.0% 780 6062.0% < discount rate ≤ 3.0% 252 6813.0% < discount rate ≤ 4.0% 5,245 4,4314.0% < discount rate ≤ 5.0% 4,391 3,3285.0% < discount rate ≤ 6.0% 1,498 2,3266.0% < discount rate ≤ 7.0% 97 1247.0% < discount rate ≤ 8.0% 423 433Discount rate > 8.0% 215 220Covered by deposits retained on assumed reinsurance 4,277 3,630Total 21,145 19,538
If provisions are covered by deposits retained on assumed reinsurance, the interest is directly secured by an inflow of investment income generally guaranteed by the cedants. Consequently, for provisions for which at least the discount rate is guaranteed by the cedants, there is no interest-rate risk.
In life primary insurance, an implicit or explicit interest-rate guarantee is granted for the majority of contracts
8400
Besides this, in German health primary insurance, discount rates of 1.5–3.5% are applied for calculating the provision for premium loadings and the provision for future premium reductions, which are both part of the provision for premium refunds and total €5,255m (5,148m). These discount rates can be altered in the event of a premium adjustment.
Other market risks are of particular importance to unit-linked life insurance policies, the lump-sum option in the case of deferred annuity policies and derivatives embedded in variable annuities.
For the unit-linked life insurance contracts in our portfolios, the investments are held for the benefit of life insurance policyholders who bear the investment risk, meaning that there is no direct market risk. Appropriate product design ensures that the necessary premium portions for payment of a guaranteed minimum benefit on occurrence of death are based on the current fund assets.
over their whole duration, based on a fixed interest rate applying at the time the contract is concluded. This exposes the insurance to an interest-guarantee risk. The discount rate used to calculate the provision for future policy benefits is identical with the guaranteed interest rate for the majority of contracts in our portfolios. An appropriate minimum return needs to be earned in the long term from the investment result (possibly also with assistance from the technical result) for the contractually guaranteed benefits. Given that the investments, as a rule, have a shorter duration than the insurance commitments, there is a reinvestment risk. As regards premiums yet to be received, the investment of these amounts involves a certain amount of risk. We counter these risks using our asset-liability management. In long-term health primary insurance, a discount rate is also used for calculating the provision for future policy benefits. However, this rate can generally be altered by way of premium adjustment. For short-term business, there is no direct interest-rate risk.
In primary insurance, the discount rates relevant for the portfolio in calculating the provision for future policy benefits and the provision for outstanding claims are as follows:
The lump-sum option in the case of deferred annuity policies gives policyholders the option of having their annuity paid out in a single payment at a fixed date. As a result, there is a potential risk of an unexpectedly large number of policyholders exercising their option at an interest-rate level markedly higher than the discount rate used for the annuity calculation. But there is no direct interest-rate sensitivity or market sensitivity, since the exercise of the option by the policyholder is determined to a crucial extent by individual factors and relates to the insurance components.
Some primary insurance and reinsurance contracts contain derivative components of variable annuities. These are measured separately from the underlying contract and their changes in value are recognised in the insurance-related investment result. The valuation of these embedded derivatives is sensitive to share prices, exchange rates, commodity prices and interest rates, but these sensitivities are nearly fully compensated for by the fact that such derivatives are for the most part directly matched by financial derivatives for hedging purposes.
Discount rates used for provisions – Primary insurance (gross)
Life Health Total€m 31.12.2018 Prev. year 31.12.2018 Prev. year 31.12.2018 Prev. yearWithout discount rate 4,422 4,271 1,568 1,540 5,990 5,811Discount rate ≤ 2.0% 6,057 5,528 842 4 6,898 5,5322.0% < discount rate ≤ 3.0% 21,803 21,983 13,315 12,055 35,118 34,0383.0% < discount rate ≤ 4.0% 31,929 32,962 11,387 8,617 43,316 41,5794.0% < discount rate ≤ 5.0% 1,006 1,034 9,072 12,563 10,078 13,597Discount rate > 5.0% 2 2 2 1 3 3Total 65,219 65,779 36,184 34,781 101,403 100,560

161Consolidated financial statementsNotes
Munich Re Group Annual Report 2018
40 Disclosures on risks from property-casualty insurance business
Of particular importance for property-casualty insurance contracts is the estimation risk with regard to the amount of the expected claims expenditure for future claims from current insurance contracts (premium risk) and for claims already incurred (reserve risk). There is an interest-rate risk for parts of the portfolio. Besides this, the liquidity risk has to be taken into account.
Premium risk The degree of exposure to premium risks differs according to class of business and also between primary insurance and reinsurance. On the basis of the loss ratios and combined ratios of past years shown in the following table, conclusions can be drawn about the historical volatilities in the different classes of business and about possible interdependencies. The differences in volatility are due equally to fluctuations in claims expenditure and fluctuations in the respective market-price level for the covers granted.
Liquidity risk For Munich Re, there could be a liquidity risk if the cash outflow for insurance claims payments and the costs related to the business were to exceed the cash inflow from premiums and investments. For our mainly long-term business, we therefore analyse the expected future balance from cash inflows due to premium payments and outflows for payment of insurance claims and benefits plus costs.
At the balance sheet date, this results in the expected future technical payment balances (including variable annuities) shown in the following table according to duration bands. As only the technical payment flows are considered, inflows from investment income and investments that become free are not included in the quantifications.
Expected future technical cash flow (gross)1
€m 31.12.2018 Prev. yearUp to one year –3,458 –3,401Over one year and up to five years –9,651 –10,431Over five years and up to ten years –16,146 –16,690Over ten years and up to 20 years –38,305 –40,157Over 20 years –101,376 –103,567
1 Premiums less benefits guaranteed at the balance sheet date and costs (excluding unit-linked products).
With these numerical estimates, it should be borne in mind that this forward-looking data may involve considerable uncertainty.
8406

Consolidated financial statementsNotes
162
In the pricing of risks assumed in the accident, fire and marine lines of business, and also in sections of engineering reinsurance and in primary insurance, there is a high degree of sensitivity regarding the underlying
assumptions about natural catastrophes. The following table therefore shows the combined ratios for property-casualty reinsurance including and excluding natural catastrophe losses.
Premiums, loss ratios and combined ratios by class of business
2018 2017 2016 2015 2014Gross premiums written in €m Reinsurance
Liability 3,384 3,013 2,911 2,869 2,473Accident 372 393 316 274 282Motor 5,367 3,978 3,943 3,707 3,557Marine, aviation, space 1,388 1,268 1,308 1,546 1,596Fire 4,761 4,308 4,375 4,238 4,247Engineering 1,315 1,311 1,438 1,550 1,476Credit and surety 657 634 641 617 644Other classes of business 3,192 2,938 2,895 2,877 2,455
Primary insurance 6,694 6,531 6,135 5,985 5,755Loss ratio in % Reinsurance
Liability 71.3 84.8 73.2 71.0 65.4Accident 10.4 58.0 74.2 83.3 67.1Motor 71.4 77.0 72.3 69.3 72.5Marine, aviation, space 40.8 50.3 56.7 46.7 50.8Fire 69.9 109.5 59.7 42.2 49.9Engineering 48.5 60.1 48.3 44.8 57.1Credit and surety 46.0 59.7 71.1 65.7 56.2Other classes of business 69.2 71.0 55.1 57.0 62.1
Primary insurance 58.7 59.8 59.7 63.6 60.0Combined ratio in % Reinsurance
Liability 105.7 119.3 107.4 104.3 97.1Accident 51.0 94.2 99.2 121.7 107.4Motor 103.3 107.9 100.9 99.7 104.9Marine, aviation, space 75.1 81.8 92.3 80.2 84.0Fire 98.5 137.8 86.3 70.2 76.9Engineering 95.1 107.8 93.1 89.2 101.9Credit and surety 89.0 101.8 110.8 109.0 98.7Other classes of business 107.4 105.9 90.3 88.6 92.3
Primary insurance 95.2 96.0 97.5 100.1 95.7
1 In 2012, our segment reporting was modified and no longer has a consolidation column. The figures for the previous year have been adjusted accordingly. Comparability with the years up to and including 2010 is thus limited.
2 The figure for 2011 is not adjusted for relief of 1.4 percentage points from economic risk transfer to the capital markets.
Combined ratio in reinsurance for the last ten years1
% 2018 2017 2016 2015 2014 2013 2012 2011 2010 2009 Including natural catastrophes2 99.4 114.1 95.7 89.7 92.7 92.1 91.0 113.8 100.5 95.3Excluding natural catastrophes 92.6 92.1 90.2 88.8 89.4 87.4 83.3 84.4 89.5 93.9

163Consolidated financial statementsNotes
Munich Re Group Annual Report 2018
Major losses, by which we mean individual losses exceeding €10m, are of particular relevance for the volatility of property-casualty business in reinsurance. The analysis below shows that the volatility of the
individual years in this loss category is mainly attributable to the respective intensity of natural catastrophe losses, whilst the other accumulation risks exhibit a distinctly less volatile pattern.
Further information on risks from large and accumulation losses can be found in the section on business performance, and in the risk report.
Reserve risk The provision for outstanding claims is subject to the risk that actual claims settlement may be less than or exceed the amount reserved.
A particular sensitivity to reserve risks exists in the case of contracts with long run-off periods. This characteristic applies especially to casualty insurance, where liabilities may manifest themselves after a considerable latency period. Particularly with regard to asbestos insurance liabilities, we cover losses from policies taken out decades ago that manifest themselves after a latency period of as long as 30–50 years. In response, we have posted provisions for claims under long-cancelled general liability policies which provided coverage according to the legal environment applicable at that time.
The development of our claims reserves and the corresponding run-off results are shown in the Notes to the consolidated balance sheet – Equity and liabilities (22) Provision for outstanding claims.
Large losses in reinsurance according to individual calendar years (net)
€m 2018 2017 2016 2015 2014Large losses –2,152 –4,314 –1,542 –1,046 –1,162
Thereof losses from natural catastrophes –1,256 –3,678 –929 –149 –537Thereof other accumulation losses –896 –636 –613 –897 –625
Provisions for asbestos and environmental claims
31.12.2018 Prev. year€m1 Gross Net Gross NetAsbestos 1,270 1,109 1,319 1,142Environ- mental 382 308 403 327
1 The previous year’s figures have been adjusted to eliminate currency translation effects.

Consolidated financial statementsNotes
164
Interest-rate risks Economically, an interest-rate risk derives from the need to earn a return on the investments covering the provision that is commensurate with the discount rate used in measuring the provision. In balance sheet terms, the interest-rate risk affects only those
parts of the technical provisions that are discounted and for which an inflow of investment income from deposits retained is not secured from cedants in at least the same amount. For discounting technical provisions, we use the interest rates shown in the table below.
The major part of the discounted provisions in reinsurance is for US workers’ compensation business, for which the discount rates are governed by supervisory law and are determined prospectively per accident year. The discounting of the provisions in primary insurance is also largely governed by supervisory law.
Liquidity risk For Munich Re, liquidity risks could arise if the cash outflow for insurance claims payments and the costs related to the business were to exceed the cash inflow from premiums and investments. The following table shows that in the past calendar years the liquidity situation in underwriting has always been positive. Besides this, we also have extensive, sufficiently liquid investments available to fulfil our liquidity obligations.
Discounted technical provisions according to discount rates (gross)
Reinsurance Primary insurance Total€m 31.12.2018 Prev. year 31.12.2018 Prev. year 31.12.2018 Prev. yearDiscount rate ≤ 2.0% 64 39 385 315 448 3542.0% < discount rate ≤ 3.0% 167 225 292 288 459 5133.0% < discount rate ≤ 4.0% 70 95 388 415 458 5104.0% < discount rate ≤ 5.0% 897 1,022 0 0 897 1,022Discount rate > 5.0% 0 0 0 0 0 0Total 1,197 1,381 1,065 1,018 2,262 2,399
Payment flows and liquid funds in the individual calendar years (gross)
€m 2018 2017 2016 2015 2014Premiums received 27,130 24,293 23,786 23,511 22,335Claims payments for financial year –5,901 –5,360 –5,882 –5,659 –5,495Claims payments for previous years –8,873 –6,675 –8,545 –7,619 –8,193Costs –9,234 –8,093 –7,719 –7,501 –7,298Balance 3,122 4,165 1,639 2,731 1,349

165Consolidated financial statementsNotes
Munich Re Group Annual Report 2018
Other information
41 Parent
The Group parent is Münchener Rückversicherungs-Gesellschaft Aktiengesellschaft in München (Munich Reinsurance Company Joint-Stock Company in Munich), Königinstrasse 107, 80802 München.
Its registered seat is Munich, Germany (Commercial register number: HRB 42039, Registrar of Companies: Local Court [Amtsgericht] in Munich).
In addition to its function as a reinsurer, the parent also fulfils the function of holding company for the Group.
42 Related parties
Information on the remuneration of Board members and transactions with these persons can be found in the management report under the remuneration report, and under (45) Remuneration report. Transactions between Munich Reinsurance Company and subsidiaries that are to be deemed related parties have been eliminated in consolidation and are not disclosed in the Notes. Business relations with unconsolidated subsidiaries are of subordinate importance as a whole; this also applies to business relations with associates and joint ventures.
Munich Reinsurance Company has established a contractual trust agreement in the form of a two-way trust for its unfunded company pension obligations. The Munich Re pension scheme is considered a related party in accordance with IAS 24. Contributions to the pension scheme are recognised as expenses for defined contribution plans; see Notes to the consolidated balance sheet – Equity and liabilities (25) Other provisions. For transactions of related parties with Munich Reinsurance Company shares, please refer to Notes to the consolidated balance sheet – Equity and liabilities (17) Equity.
43 Personnel expenses
The following personnel expenses are included in the operating expenses, in the expenses for claims and benefits (for claims adjustment) and in the investment result:
Breakdown of personnel expenses
€m 2018 Prev. yearWages and salaries –2,832 –2,763Social security contributions and employee assistance –489 –501Expenses for employees’ pensions –238 –199Total –3,559 –3,463
44 Mid-Term Incentive Plan
Since 1 January 2009, Munich Reinsurance Company has set up medium-term incentive plans, each with a term of three years. Eligible for participation in these cash-settled share-based remuneration plans are senior management in Munich. The participants receive performance share units (PSUs). In the fourth year after plan commencement, participants are entitled to a bonus payment dependent on the achievement of value-based performance targets and the increase in the total shareholder return (TSR).
The value-based performance targets are set in the form of an average target to be achieved over the following three years of the plan and are allocated according to responsibilities.
The basis for the full and partial allocation of the PSUs is the first plan year.
The final number of PSUs is calculated by multiplying the number of PSUs at plan commencement by the percentage achievement of the performance target at plan termination. The number of PSUs may fluctuate between 0 and 1.5 times the initially allocated number. Payment is capped if the TSR doubles. The maximum amount payable is limited to 300%.
The Mid-Term Incentive Plan at the reporting date is valued indirectly at the fair value of the liabilities. The fair value takes account of the value-based performance target and the total shareholder return (TSR) during the performance period. To this end, the TSR index value observable in the market is updated with the current dividend yield of Munich Re shares at the termination date and discounted with appropriate market interest rates.
In 2018, expenses of €23m (income of 0.2m) were recognised for the Mid-Term Incentive Plan. The provision at the reporting date amounted to €42m (25m).

Consolidated financial statementsNotes
166
All other disclosures on the remuneration and structure of the remuneration system for the Board of Management can be found in the management report under the remuneration report. Information on share trading and shares held by Board members is provided in the corporate governance report.
46 Number of staff
The number of staff employed by the Group at year-end totalled 19,191 (19,960) in Germany and 22,219 (22,450) in other countries.
Breakdown of number of staff
31.12.2018 Prev. yearReinsurance 12,324 12,117ERGO 29,086 30,293Total 41,410 42,410
47 Auditor’s feesFor services rendered to the parent and consolidated subsidiaries by the Group auditor (KPMG Bayerische Treuhandgesellschaft AG Wirtschaftsprüfungsgesellschaft Steuerberatungsgesellschaft, Munich, and its affiliated companies within the meaning of Section 271(2) of the German Commercial Code – HGB), the following fees have been recognised as an expense in the financial year:
45 Remuneration report
The members of Munich Reinsurance Company’s Board of Management received remuneration totalling €20.5m (19.8m). The total remuneration of Munich Reinsurance Company’s Supervisory Board amounted to a total of €2.8m (2.8m); this figure includes €0.2m (0.2m) for reported remuneration for membership of supervisory boards at other Group companies.
Payments to retired members of the Board of Management or their surviving dependants totalled €10.9m (8.6m). Included in this amount is compensation in the amount of €2.3m paid to a former member of the Board of Management for a post-contractual non-competition agreement.
Former members of the Board of Management did not accrue any further pension entitlements with an impact on personnel expenses. After deducting plan assets for existing pension commitments held by a separate entity (under a contractual trust agreement), there were no surplus pension provisions or provisions for comparable benefits for retired members of the Board of Management or their surviving dependants.
There are no pension commitments for former members of the Supervisory Board or their surviving dependants.
The Board members did not receive any cash advances or loans in the 2017 financial year. For their service as employees of the Group, Supervisory Board members received remuneration in the amount of €1.3m (1.3m). The Board members hold insurance policies with companies belonging to Munich Re, and have small MEAG fund holdings. There were no significant notifiable transactions between Board members and Munich Re.
Munich Re’s Mid-Term Incentive Plans 2015–2018
Incentive Incentive Incentive Incentive Plan 2015 Plan 2016 Plan 2017 Plan 2018Plan commencement 1.1.2015 1.1.2016 1.1.2017 1.1.2018Plan end 31.12.2017 31.12.2018 31.12.2019 31.12.2020Fair value 2018 for one right 0.00 € 483.01 € 508.77 € 535.76 €Number of rights (for 100% achievement of objectives) on 1 January 2015 0 0 0 0
Additions 38,217 0 0 0Number of rights (for 100% achievement of objectives) on 31 December 2015 38,217 0 0 0Number of rights (for 100% achievement of objectives) on 1 January 2016 38,217 0 0 0
Additions 0 32,525 0 0Forfeited 213 0 0 0
Number of rights (for 100% achievement of objectives) on 31 December 2016 38,004 32,525 0 0Number of rights (for 100% achievement of objectives) on 1 January 2017 38,004 32,525 0 0
Additions 0 120 30,814 0Forfeited 1,322 1,136 0 0
Number of rights (for 100% achievement of objectives) on 31 December 2017 36,682 31,509 30,814 0Number of rights (for 100% achievement of objectives) on 1 January 2018 36,682 31,509 30,814 0
Additions 0 0 0 27,390Exercised 36,682 0 0 0
Number of rights (for 100% achievement of objectives) on 31 December 2018 0 31,509 30,814 27,390
Breakdown of auditor’s fees
€k 2018Audit services –9,874Other assurance and appraisal services –111Tax consultancy services 0Other services –3,391Total –13,376
167Consolidated financial statementsNotes
Munich Re Group Annual Report 2018
ERGO companies have assumed unlimited liability for the sale of insurance products by insurance intermediaries acting exclusively on their behalf. In this respect, there is a risk of a claim being made by customers. In case of a claim, there is a general possibility of recourse against the insurance intermediary or the latter’s fidelity guarantee insurance carrier.
The application of fiscal regulations may yet be unresolved at the time of calculation of tax refund claims and tax liabilities. The calculation of tax items is based on the regulations most likely to be applied in each case. Regardless of this, the tax authorities may take a different view, which may give rise to additional tax liabilities.
In accordance with the German Insurance Supervision Act (VAG), all German life and health insurers of our Group are obliged to be members of a protection fund. For life insurers, the protection fund can levy special contributions of up to one per mille of total net technical provisions, in addition to a regular contribution of 0.2 per mille of total net technical provisions. For the health insurers, there is no pre-financing, but the fund may levy special contributions of up to two per mille of net technical provisions to fulfil its functions. This could give rise to a potential payment obligation of €166m (161m) at Group level. The functions and powers of the statutory protection fund for life insurance rest with Protektor Lebensversicherungs-AG, and those of the statutory protection fund for health insurance with Medicator AG.
Munich Re is a member of the German Nuclear Reactor Insurance Association (DKVG) and the Pharma Reinsurance Community. If other members of these pools are not able to meet their payment obligations, we may be held liable for a proportional share of their obligations. However, we consider the risk of such a liability arising to be remote.
Besides this, Munich Re has entered into various other financial obligations amounting to €701m (395m) for work and service contracts and €2,629m (1,821m) for investment obligations, of which €13m (74m) is from our investments in joint ventures. At the reporting date, there were loan commitments amounting to €1,753m (1,093m). These figures represent undiscounted nominal amounts. There are other financial commitments amounting to €15m (7m).
There are no other financial commitments of significance for the assessment of Munich Re’s financial position. No contingent liabilities have been entered into for the benefit of Board members.
Of the auditor’s fees, €9,459k (8,957k) is attributable to KPMG Bayerische Treuhandgesellschaft AG Wirtschafts-prüfungsgesellschaft Steuerberatungsgesellschaft, Munich. All other services were rendered mostly by their affiliated companies.
The auditor’s fees mainly relate to the audits of the consolidated financial statements and the annual financial statements of Munich Reinsurance Company, and to various audits of our subsidiaries’ annual financial statements, including statutory extensions of the audit assignment (in particular the audit of the solvency balance sheet). In addition, reviews of interim financial statements and project-related IT audits, and contractual reviews of the effectiveness of a service company’s controls, were carried out.
Other assurance and appraisal services concern statutory or contractual audit services, voluntary audit services, and mandatory assurance and appraisal services for submission to the competent authorities.
Other services essentially relate to quality assurance support and consulting services in connection with accounting issues, the introduction of regulatory requirements or of new accounting standards, each based on solutions and concepts produced by us. In addition, the auditor provided administrative support.
48 Contingent liabilities, other financial commitments
Munich Re enters into contingent liabilities in connection with its normal business operations. At the reporting date, the obligations from guarantees are insignificant. The obligations from legal disputes total €31m (31m). Moreover, there is a letter of support in the amount of €3m (0m) issued to a non-consolidated subsidiary. There are other contingent liabilities amounting to €28m (8m). Furthermore, there is a contingent liability of £26m (20m) from our investments in associates and joint ventures. These concerned a payment obligation in the event of an associate’s over-indebtedness.
Estimates and judgements are necessary for contingent liabilities where the likely impact cannot be clearly determined. This is the case, for example, with respect to contingent liabilities in legal disputes. Like the evaluation process for other provisions, the assessment is made by experts in the affected units on the basis of the best estimate. Contingent liabilities are stated unless the experts estimate that the possibility of an outflow of resources is remote.

Consolidated financial statementsNotes
168
49 Significant restrictions
Regulatory, legal or contractual restrictions and protective rights of non-controlling interests may restrict the Group’s ability to access or use assets, and settle liabilities.
The carrying amounts of Group assets with restrictions on title can be found in the Notes to the consolidated balance sheet – Assets. The restrictions primarily result from contractual agreements, including pledged securities deposits to collateralise payment obligations from insurance business, the collateralisation of derivative transactions with securities and cash collateral or of bank liabilities with non-financial assets.
Individual national regulations require that assets held to cover insurance liabilities be managed separately. In principle, there are special supervisory regulations governing access to these assets and their use.
In addition, we are subject to supervisory requirements that may restrict dividend payments or other capital distributions, loans and advance payments within the Group.
Our subsidiary Munich American Reassurance Company reported a negative earned surplus in its local financial statements as at 31 December 2018 (Statutory Accounting Principles). For this reason, the company can only pay dividends or transfer capital to the parent company with the approval of the competent US regulatory authority.
Our companies based in Greece are subject to the capital controls introduced in 2015 and loosened in 2018, and are required to go through the relevant approval processes when transferring assets.
50 Leasing
Munich Re as lessee The operating leases mainly concern offices and business premises of the Group, IT infrastructure, and land. They include extension options as well as restrictions regarding the agreement of subleases. In the period under review, minimum lease payments of €97m (91m) and contingent lease payments of €6m (10m) were recognised as an expense.
Munich Re as lessor Operating leases mainly involve leased property.
There were several finance leases for property at the balance sheet date, which are listed in the following table:
Future minimum lease payments under operating leases
€m 31.12.2018 Prev. yearUp to one year 95 92Over one year and up to five years 181 184Over five years 161 133Total 438 409
Future minimum lease payments under operating leases
€m 31.12.2018 Prev. yearUp to one year 264 255Over one year and up to five years 772 691Over five years 682 574Total 1,718 1,520
Due dates
31.12.2018 Prev. year Gross Interest Net Gross Interest Net€m investment element investment investment element investmentMinimum lease payments up to one year 0 0 0 0 0 0Minimum lease payments of over one year and up to five years 2 1 1 2 1 1Minimum lease payments of over five years 71 56 15 71 56 15Total minimum lease payments 74 57 17 74 57 17Unguaranteed residual values 41 32 9 41 33 8Total 115 89 25 115 90 25

169Consolidated financial statementsNotes
Munich Re Group Annual Report 2018
51 Events after the balance sheet date
Under the share buy-back programme decided on by Munich Reinsurance Company’s Board of Management in March 2018, we repurchased a further 0.7 million Munich Re shares with a volume of €138m from the balance sheet date to the end of February 2019.
52 Earnings per share
There were no diluting effects to be disclosed for the calculation of earnings per share either in the financial year or in the previous year. Earnings per share can potentially be diluted in future through the issue of shares or subscription rights from amounts authorised for increasing the share capital and from contingent capital.
Earnings per share
2018 Prev. yearConsolidated result attributable to Munich Reinsurance Company equity holders €m 2,310 375Weighted average number of outstanding shares 148,703.565 154,060.991Earnings per share € 15.53 2.44
The retrospective adjustment of the previous year’s figures did not result in a change to the earnings per share in the previous year (see Recognition and measurement – Changes in accounting policies and other adjustments).
The number of outstanding shares decreased by 5,462,053 (5,642,862) over the course of the 2018 financial year, essentially owing to the share buy-back programme.
8527
53 Proposal for appropriation of profit
Munich Reinsurance Company’s net retained profits for 2018 according to its financial statements prepared on the basis of German GAAP accounting amount to €1,383,230,912.25. The Board of Management will propose to shareholders at the Annual General Meeting that these net retained profits be used for payment of a dividend of €9.25 per dividend-bearing share, with the remaining amount being carried forward to new account.

Consolidated financial statementsNotes
170
List of shareholdings as at 31 December 2018 pursuant to Section 313(2) of the German Commercial Code (HGB)
The following disclosures relate to our aggregated directly and indirectly held shareholdings (pursuant to Section 16(2) and (4) of the German Stock Corporation Act – AktG) in entities included in consolidation pursuant to Section 315a of the German Commercial Code, and in participating interests as defined in Section 271(1) of the German Commercial Code.
% shareCompany and registered seat of capital
% shareCompany and registered seat of capital
Consolidated subsidiaries13th & F Associates Limited Partnership, Washington, D.C.4 98.00001440 New York Ave. Associates LP, Dover, Delaware 100.000040, Rue Courcelles SAS, Paris 100.0000Adelfa Servicios a Instalaciones Fotovoltaicas S.L., Santa Cruz de Tenerife 100.0000AEVG 2004 GmbH i. L., Frankfurt am Main4 0.0000AGRA Gesellschaft für landwirtschaftliche Entwicklung und Beteiligung mbH, Vienna 100.0000ALICE GmbH, Düsseldorf 100.0000ALLYSCA Assistance GmbH, Munich 100.0000American Alternative Insurance Corporation, Wilmington, Delaware 100.0000American Family Home Insurance Company, Jacksonville, Florida 100.0000American Modern Home Insurance Company, Amelia, Ohio 100.0000American Modern Home Service Company, Amelia, Ohio 100.0000American Modern Insurance Company of Florida Inc., Jacksonville, Florida 100.0000American Modern Insurance Group Inc., Amelia, Ohio 100.0000American Modern Lloyds Insurance Company, Dallas, Texas 100.0000American Modern Property & Casualty Insurance Company, Cincinnati, Ohio 100.0000American Modern Select Insurance Company, Amelia, Ohio 100.0000American Modern Surplus Lines Insurance Company, Amelia, Ohio 100.0000American Southern Home Insurance Company, Jacksonville, Florida 100.0000American Western Home Insurance Company, Oklahoma City, Oklahoma 100.0000Amicus Legal Ltd., Bristol 100.0000ArztPartner almeda AG, Munich 100.0000Atena Uslugi Informatyczne i Finansowe S.A., Sopot 100.0000ATU Landbau GmbH & Co. KG, Munich11 94.9000Bagmoor Holdings Limited, London 100.0000Bagmoor Wind Limited, London 100.0000Beaufort Dedicated No.1 Ltd., London 100.0000Beaufort Dedicated No.2 Ltd., London 100.0000Beaufort Dedicated No.5 Ltd., London 100.0000
Beaufort Underwriting Agency Limited, London 100.0000Bell & Clements (Bermuda) Ltd., Hamilton, Bermuda 100.0000Bell & Clements (London) Ltd., London 100.0000Bell & Clements (USA) Inc., Reston, Virginia 100.0000Bell & Clements Inc., Reston, Virginia 100.0000Bell & Clements Ltd., London 100.0000Cannock Chase B.V., Leidschendam 100.0000Cannock Chase Holding B.V., Amsterdam 100.0000Cannock Chase Purchase B.V., The Hague 100.0000Cannock Connect Center B.V., Brouwershaven 100.0000Ceres Demetra GmbH, Munich 100.0000Closed Joint Stock Company «ERGO» Insurance Company, Minsk 92.3114Comino Beteiligungen GmbH, Grünwald 100.0000Consumer Loan Underlying Bond (CLUB) Certificate Issuer Trust I Series 2018-17, San Francisco, California 95.0000Consumer Loan Underlying Bond (CLUB) Certificate Issuer Trust I Series 2018-24, San Francisco, California 95.0000Consumer Loan Underlying Bond (CLUB) Certificate Issuer Trust I Series 2018-31, San Francisco, California 95.0000Corion Pty Ltd, Sydney 100.0000Cornwall Power (Polmaugan) Limited, London 100.0000Countryside Renewables (Forest Heath) Limited, London 100.0000D.A.S. Defensa del Automovilista y de Siniestros – Internacional S.A. de Seguros y Reaseguros, Barcelona 100.0000D.A.S. Hellas Insurance Company of Legal Protection S.A., Athens 100.0000D.A.S. Jogvédelmi Biztosíto Részvénytársaság, Budapest 100.0000D.A.S. Rechtsschutz Aktiengesellschaft, Vienna 100.0000D.A.S. Société anonyme belge d’assurances de Protection Juridique, Brussels 100.0000D.A.S. Towarzystwo Ubezpieczen Ochrony Prawnej S.A., Warsaw 100.0000Daman Health Insurance – Qatar LLC, Doha 100.0000Dansk Demetra ApS, Frederiksberg C 100.0000DAS Assistance Limited, Bristol 100.0000DAS Holding N.V., Amsterdam 51.0000DAS Law Limited, Bristol 100.0000DAS Legal Expenses Insurance Co., Ltd., Seoul 100.0000DAS Legal Expenses Insurance Company Limited, Bristol 100.0000

171Consolidated financial statementsNotes
Munich Re Group Annual Report 2018
% shareCompany and registered seat of capital
% shareCompany and registered seat of capital
ERGO Neunte Beteiligungsgesellschaft mbH, Düsseldorf 100.0000ERGO osiguranje d.d., Zagreb 100.0000ERGO Partners N.V., Brussels 100.0000ERGO Pensionsfonds Aktiengesellschaft, Düsseldorf 100.0000ERGO Pensionskasse AG, Düsseldorf 100.0000ERGO Poist’ovna a.s., Bratislava 100.0000ERGO pojišt’ovna, a.s., Prague 100.0000ERGO Private Capital Dritte GmbH & Co. KG, Düsseldorf 100.0000ERGO Private Capital Gesundheit GmbH & Co. KG, Düsseldorf 100.0000ERGO Private Capital Komposit GmbH & Co. KG, Düsseldorf 100.0000ERGO Private Capital Leben GmbH & Co. KG, Düsseldorf 100.0000ERGO Private Capital Vierte GmbH & Co. KG, Düsseldorf 100.0000ERGO Private Capital Zweite GmbH & Co. KG, Düsseldorf 100.0000ERGO Sigorta A.Ş., Istanbul 100.0000ERGO Versicherung Aktiengesellschaft, Düsseldorf 100.0000ERGO Versicherung Aktiengesellschaft, Vienna 100.0000ERGO Vida Seguros y Reaseguros S.A., Zaragoza 100.0000ERGO Vorsorge Lebensversicherung AG, Düsseldorf 100.0000ERGO Zivotno osiguranje d.d., Zagreb 100.0000ERV Evropská pojišt’ovna, a.s., Prague 90.0000Euro-Center Holding SE, Prague 83.3332Europaeiske Rejseforsikring A/S, Copenhagen 100.0000EUROPÄISCHE Reiseversicherung Aktiengesellschaft, Munich 100.0000Everything Legal Ltd., Bristol 100.0000FAIRANCE GmbH, Düsseldorf 100.0000Faunus Silva LLC, Wilmington, Delaware 100.0000Flexitel Telefonservice GmbH, Berlin 100.0000Forst Ebnath AG, Ebnath 100.0000FOTOUNO S.r.l., Brixen 100.0000FOTOWATIO ITALIA GALATINA S.r.l., Brixen 100.0000FREE MOUNTAIN SYSTEMS S.L., Barcelona 100.0000FS Louisiana I LLC, Wilmington, Delaware 100.0000FS Louisiana II LLC, Wilmington, Delaware 100.0000FS San Augustine LLC, Wilmington, Delaware 100.0000Fundo Invest Exclusivo referenciado di Munich Re Brasil, São Paulo4 98.2000Gaucheret S.A., Brussels 100.0000GF 65, Vienna4 100.0000Global Standards LLC, Dover, Delaware 100.0000Globality S.A., Munsbach 100.0000Great Lakes Insurance SE, Munich 100.0000Groves, John & Westrup Limited, Liverpool 100.0000Habiriscos – Investimentos Imobiliarios e Turisticos S.A., Lisbon 100.0000Hartford Steam Boiler (M) SDN BHD, Kuala Lumpur 100.0000Hartford Steam Boiler (Singapore) Pte. Ltd., Singapore 100.0000Hartford Steam Boiler International GmbH, Rheine 100.0000HMV GFKL Beteiligungs GmbH, Düsseldorf 100.0000HSB Brasil Servicos de Engenharia e Inspecao Ltda, São Paulo 100.0000HSB Engineering Finance Corporation, Dover, Delaware 100.0000HSB Engineering Insurance Limited, London 100.0000HSB Engineering Insurance Services Limited, London 100.0000
DAS Legal Finance B.V., Amsterdam 100.0000DAS MEDICAL ASSIST LIMITED, Bristol 100.0000DAS Nederlandse Rechtsbijstand Verzekeringmaatschappij N.V., Amsterdam 100.0000DAS Services Limited, Bristol 100.0000DAS UK Holdings Limited, Bristol 100.0000DB Platinum IV SICAV (Subfonds Institutional Fixed Income, Inhaber-Anteile I4D), Luxembourg 100.0000DB Platinum IV SICAV (Subfonds Institutional Fixed Income, Inhaber-Anteile I5D), Luxembourg 100.0000DB Platinum IV SICAV (Subfonds Institutional Fixed Income, Inhaber-Anteile I6D o.N.), Luxembourg 100.0000DB Platinum IV SICAV (Subfonds Institutional Fixed Income, Inhaber-Anteile I7D o.N.), Luxembourg 100.0000DB Platinum IV SICAV (Subfonds Institutional Fixed Income, Inhaber-Anteile I8D o.N.), Luxembourg 100.0000Digital Advantage Insurance Company, Providence, Rhode Island 100.0000Digital Affect Insurance Company, New York City, New York 100.0000Digital Porte Inc., Toronto, Ontario 100.0000DKV BELGIUM S.A., Brussels 100.0000DKV Deutsche Krankenversicherung Aktiengesellschaft, Cologne 100.0000DKV Pflegedienste & Residenzen GmbH, Cologne 100.0000DKV Seguros y Reaseguros S.A. Española, Zaragoza 100.0000DMS QIAIF Platform ICAV (FIVE LABS Subfonds), Dublin 100.0000E&S Claims Management Inc., Reston, Virginia 100.0000EIG Co., Wilmington, Delaware 100.0000ERGO ASIGURARI DE VIATA S.A., Bucharest 100.0000ERGO ASIGURARI S.A., Bucharest 100.0000ERGO Austria International AG, Vienna 100.0000ERGO Beratung und Vertrieb AG, Düsseldorf 100.0000ERGO Deutschland AG, Düsseldorf 100.0000ERGO Digital Ventures AG, Düsseldorf 100.0000ERGO Direkt Krankenversicherung AG, Fürth 100.0000ERGO Direkt Lebensversicherung AG, Fürth 100.0000ERGO Direkt Versicherung AG, Fürth 100.0000ERGO Életbiztosító Zrt, Budapest 100.0000ERGO Elfte Beteiligungsgesellschaft mbH, Düsseldorf 100.0000ERGO Fund I LP, Dover, Delaware11 100.0000ERGO Generales Seguros y Reaseguros S.A., Madrid 100.0000ERGO Group AG, Düsseldorf 100.0000ERGO Grubu Holding A.Ş., Istanbul 100.0000ERGO Grundstücksverwaltung GbR, Düsseldorf11 100.0000ERGO Insurance Company S.A., Athens 100.0000ERGO Insurance Company, Moscow 100.0000ERGO Insurance N.V., Brussels 100.0000ERGO Insurance Pte. Ltd., Singapore 100.0000ERGO Insurance SE, Tallinn 100.0000ERGO International Aktiengesellschaft, Düsseldorf 100.0000ERGO International Services GmbH, Düsseldorf 100.0000ERGO Invest SIA, Riga 100.0000ERGO Lebensversicherung Aktiengesellschaft, Hamburg 100.0000ERGO Life Insurance SE, Vilnius 100.0000ERGO Life S.A., Grevenmacher 100.0000

Consolidated financial statementsNotes
172
% shareCompany and registered seat of capital
% shareCompany and registered seat of capital
MEAG Euro 1, Munich4 100.0000MEAG Euro 2, Munich4 100.0000MEAG EURO-FONDS, Munich4 100.0000MEAG European Prime Opportunities, Munich4 56.5871MEAG Eurostar, Munich4 100.0000MEAG EURO-Yield, Munich4 100.0000MEAG FlexConcept – Basis, Luxembourg4 100.0000MEAG FlexConcept – Eurobond, Luxembourg4 100.0000MEAG FlexConcept – Wachstum, Luxembourg4 100.0000MEAG GBP Global-STAR, Munich4 100.0000MEAG German Prime Opportunities (GPO), Munich4 100.0000MEAG HBG 1, Munich4 100.0000MEAG HM Sach Rent 1, Munich4 100.0000MEAG HMR 1, Munich4 100.0000MEAG HMR 2, Munich4 100.0000MEAG Hyperion Fund, Munich4 100.0000MEAG IREN, Munich4 100.0000MEAG Janus, Munich4 100.0000MEAG Kapital 2, Munich4 100.0000MEAG Kapital 5, Munich4 100.0000MEAG Kubus 1, Munich4 100.0000MEAG Lambda EUR EM Local, Grünwald4 100.0000MEAG Lambda EUR, Grünwald4 100.0000MEAG Lambda GBP Grünwald4 100.0000MEAG Lambda USD Grünwald4 100.0000MEAG Multi Life, Munich4 100.0000MEAG Multi Sach 1, Munich4 100.0000MEAG MUNICH ERGO AssetManagement GmbH, Munich 100.0000MEAG MUNICH ERGO Kapitalanlagegesellschaft mbH, Munich 100.0000MEAG Munich Re Placement, Grünwald4 100.0000MEAG New York Corporation, Wilmington, Delaware 100.0000MEAG PEGASUS, Munich4 100.0000MEAG Pension Invest, Munich4 100.0000MEAG Pensionskasse Nord, Munich4 100.0000MEAG Pensionskasse West, Munich4 100.0000MEAG PREMIUM, Munich4 100.0000MEAG PROF III Beteiligungsgesellschaft mbH, Düsseldorf 100.0000MEAG Property Fund I, Munich4 100.0000MEAG Property Fund III, Munich4 100.0000MEAG RenditePlus, Munich4 100.0000MEAG REVO, Munich4 100.0000MEAG Tandem, Munich4 100.0000MEAG US Fonds, Munich4 100.0000MEAG Venus, Munich4 100.0000MEAG Vidas Rent 3, Munich4 100.0000MEAG VLA, Munich4 100.0000MedNet Holding GmbH, Munich 100.0000MedWell Gesundheits-AG, Cologne 100.0000Merkur Grundstücks- und Beteiligungs-Gesellschaft mit beschränkter Haftung, Düsseldorf 100.0000Meshify Inc., Dover, Delaware 100.0000MFI Munich Finance and Investment Holding Ltd.,Ta’ Xbiex 100.0000
HSB Fund I LP, Dover, Delaware11 100.0000HSB Group Inc., Dover, Delaware 100.0000HSB International (India) Private Limited, Gujarat 100.0000HSB Japan K.K., Minato-KU, Tokyo 100.0000HSB Secure Services Inc., Hartford, Connecticut 100.0000HSB Solomon Associates Canada Ltd., Saint John, New Brunswick 100.0000HSB Solomon Associates LLC, Dover, Delaware 100.0000HSB Specialty Insurance Company, Hartford, Connecticut 100.0000HSB Technical Consulting & Service (Shanghai) Co. Ltd., Shanghai 100.0000Ibero Property Portugal – Investimentos Imobiliarios S.A., Lisbon 100.0000Ibero Property Trust S.A., Madrid 100.0000IDEENKAPITAL Financial Engineering GmbH, Düsseldorf 100.0000IDEENKAPITAL Financial Service GmbH i. L., Düsseldorf 100.0000IDEENKAPITAL GmbH, Düsseldorf 100.0000IDEENKAPITAL Media Finance GmbH, Düsseldorf 50.1000IDEENKAPITAL Metropolen Europa GmbH & Co. KG, Düsseldorf 72.3477iii, Munich4 100.0000IK Einkauf Objekt Eins GmbH & Co. KG, Düsseldorf 100.0000IK Einkauf Objektmanagement GmbH, Düsseldorf 100.0000IK Einkaufsmärkte Deutschland GmbH & Co. KG, Düsseldorf 52.0387IK Premium Fonds GmbH & Co. KG, Düsseldorf 100.0000IK Premium Fonds zwei GmbH & Co. KG, Düsseldorf 100.0000IKFE Properties I AG, Zurich 63.5708Imofloresmira – Investimentos Imobiliarios S.A., Lisbon 100.0000ITERGO Informationstechnologie GmbH, Düsseldorf 100.0000JSC “ERV Travel Insurance”, Moscow 100.0000K & P Pflegezentrum Uelzen IMMAC Renditefonds GmbH & Co. KG, Düsseldorf 84.8445KA Köln.Assekuranz Agentur GmbH, Cologne 100.0000Kapdom-Invest GmbH, Moscow 100.0000KS SPV 23 Limited, London 100.0000LEGIAL AG, Munich 100.0000Lietuva Demetra GmbH, Munich 100.0000Lloyds Modern Corporation, Dallas, Texas 100.0000Longial GmbH, Düsseldorf 100.0000Lynt Farm Solar Limited, London 100.0000MAGAZ FOTOVOLTAICA S.L.U., Alcobendas 100.0000Mandaat B.V., Druten 100.0000Marina Salud S.A., Alicante 65.0000Marina Sp.z.o.o., Sopot 100.0000MEAG Anglo Celtic Fund, Munich4 100.0000MEAG ATLAS, Munich4 100.0000MEAG Benedict, Munich4 100.0000MEAG Cash Management GmbH, Munich 100.0000MEAG EDK Quantum, Munich4 100.0000MEAG EDL CurryGov, Munich4 100.0000MEAG EDS AGIL, Munich4 100.0000MEAG ERGO Belgium Equities, Munich4 100.0000MEAG ESUS 1, Munich4 100.0000MEAG EUR Global 1, Munich4 100.0000

173Consolidated financial statementsNotes
Munich Re Group Annual Report 2018
% shareCompany and registered seat of capital
% shareCompany and registered seat of capital
Munich Re New Ventures Inc., Toronto, Ontario 100.0000Munich Re of Bermuda Ltd., Hamilton, Bermuda 100.0000Munich Re of Malta Holding Limited, Ta’ Xbiex 100.0000Munich Re of Malta p.l.c., Ta’ Xbiex 100.0000Munich Re PCC Limited, Ta’ Xbiex 100.0000Munich Re Reserve Risk Financing Inc., Dover, Delaware 100.0000Munich Re Specialty Group Ltd., London 100.0000Munich Re Syndicate Labuan Limited, Labuan 100.0000Munich Re Syndicate Limited, London 100.0000Munich Re Syndicate Middle East Ltd., Dubai 100.0000Munich Re Syndicate Singapore Ltd., Singapore 100.0000Munich Re Trading LLC, Wilmington, Delaware 100.0000Munich Re UK Services Limited, London 100.0000Munich Re US Life Corporation, Minneapolis, Minnesota 100.0000Munich Re Ventures Inc., Dover, Delaware 100.0000Munich Re Ventures LLC, Dover, Delaware 100.0000Munich Re Weather & Commodity Risk Holding Inc., Wilmington, Delaware 100.0000Munich Reinsurance America Inc., Wilmington, Delaware 100.0000Munich Reinsurance Company of Africa Ltd, Johannesburg 100.0000Munich Reinsurance Company of Australasia Ltd, Sydney 100.0000Munich Reinsurance Company of Canada, Toronto, Ontario 100.0000MunichFinancialGroup GmbH, Munich 100.0000Munichre New Zealand Service Ltd., Auckland 100.0000Neokami GmbH, Munich 100.0000Neokami Inc., Wilmington, Delaware 100.0000New Reinsurance Company Ltd., Zurich 100.0000nexible Versicherung AG, Nuremberg 100.0000Nightingale Legal Services Ltd., Bristol 100.0000NMU Specialty Ltd., Leeds 100.0000OIK Mediclin, Wiesbaden4 70.7073Pan Estates LLC, Wilmington, Delaware 100.0000Pegasos Holding GmbH, Munich 100.0000Picus Silva Inc., Wilmington, Delaware 100.0000Prosper Pass-Thru Trust I Series 2018-1, Wilmington, North Carolina 95.0000Prosper Pass-Thru Trust I Series 2018-2, Wilmington, North Carolina 95.0000Proximetry LLC, Wilmington, Delaware 100.0000Proximetry Poland Sp. Z o.o, Katowice 100.0000PS Louisiana I LLC, Wilmington, Delaware 100.0000PS Louisiana II LLC, Wilmington, Delaware 100.0000Relayr Gmbh, Pullach i. Isartal 100.0000Relayr Inc., Wilmington, Delaware 100.0000Relayr Limited, Watford 100.0000Renaissance Hotel Realbesitz GmbH, Vienna 60.0000Roanoke Group Inc., Schaumburg, Illinois 100.0000Roanoke Insurance Group Inc., Schaumburg, Illinois 100.0000Roanoke International Brokers Limited, London 100.0000Scout Moor Group Limited, London 100.0000Scout Moor Holdings (No. 1) Limited, London 100.0000Scout Moor Holdings (No. 2) Limited, London 100.0000Scout Moor Wind Farm (No. 2) Limited, London 100.0000Scout Moor Wind Farm Limited, London 100.0000
MFI Munich Finance and Investment Ltd., Ta’ Xbiex 100.0000Midland-Guardian Co., Amelia, Ohio 100.0000Midwest Enterprises Inc., Miami, Florida 100.0000MR Bazos LP, Dover, Delaware 100.0000MR Beteiligungen 1. GmbH, Munich3 100.0000MR Beteiligungen 2. EUR AG & Co. KG, Grünwald2 100.0000MR Beteiligungen 3. EUR AG & Co. KG, Grünwald2 100.0000MR Beteiligungen 16. GmbH, Munich3 100.0000MR Beteiligungen 17. GmbH, Munich 100.0000MR Beteiligungen 18. GmbH & Co. Immobilien KG, Grünwald2 100.0000MR Beteiligungen 18. GmbH & Co. Real Estate KG, Grünwald 100.0000MR Beteiligungen 19. GmbH, Munich 100.0000MR Beteiligungen EUR AG & Co. KG, Grünwald2 100.0000MR Beteiligungen GBP AG & Co. KG, Grünwald2 100.0000MR Beteiligungen USD AG & Co. KG, Grünwald2 100.0000MR Debt Finance GmbH, Munich 100.0000MR Electra LP, Dover, Delaware 100.0000MR ERGO Beteiligungen GmbH, Grünwald 100.0000MR Infrastructure Investment GmbH, Munich 100.0000MR Investment Inc., Dover, Delaware 100.0000MR Jordan LP, Dover, Delaware 100.0000MR RENT UK Investment Limited, London 100.0000MR RENT-Investment GmbH, Munich3 100.0000MR Solar GmbH & Co. KG, Düsseldorf 100.0000MR SOLAR SAS DER WELIVIT SOLAR ITALIA S.r.l., Bolzano 100.0000MSP Underwriting Ltd., London 100.0000MU068 MR Placem (FCP), Paris4 100.0000Munich American Holding Corporation, Wilmington, Delaware 100.0000Munich American Life Reinsurance Company, Atlanta, Georgia 100.0000Munich American Reassurance Company, Atlanta, Georgia 100.0000Munich Health Alpha GmbH, Munich3 100.0000Munich Health Daman Holding Ltd., Abu Dhabi 51.0000Munich Health Holding AG, Munich3 100.0000Munich Holdings Ltd., Toronto, Ontario 100.0000Munich Holdings of Australasia Pty Ltd, Sydney 100.0000Munich Life Holding Corporation, Wilmington, Delaware 100.0000Munich Life Management Corporation Ltd., Toronto, Ontario 100.0000Munich Re America Corporation, Wilmington, Delaware 100.0000Munich Re America Services Inc., Wilmington, Delaware 100.0000Munich Re Automation Solutions Limited, Dublin 100.0000Munich Re Capital Limited, London 100.0000Munich Re CVC Investment Corp., Dover, Delaware 100.0000Munich Re Digital Partners US Holding Corporation, Dover, Delaware 100.0000Munich Re do Brasil Resseguradora SA, São Paulo 100.0000Munich Re Fund I LP, Dover, Delaware11 100.0000Munich Re Innovation Systems Inc., Toronto, Ontario 100.0000Munich Re Life Insurance Company of Vermont, Burlington, Vermont 100.0000

Consolidated financial statementsNotes
174
% shareCompany and registered seat of capital
% shareCompany and registered seat of capital
Victoria US Property Investment GmbH, Düsseldorf 100.0000Victoria Vierte Beteiligungsgesellschaft mbH, Düsseldorf 100.0000Victoria Vierter Bauabschnitt GmbH & Co. KG, Düsseldorf 100.0000Vorsorge Service GmbH, Düsseldorf 100.0000welivit GmbH, Düsseldorf 100.0000welivit Solarfonds GmbH & Co. KG, Düsseldorf 100.0000welivit Solarfonds S.a.s. di welivit Solar Italia S.r.l., Bolzano 100.0000WFB Stockholm Management AB, Stockholm 100.0000Wind Farm Jenasen AB, Hässleholm 100.0000Wind Farms Götaland Svealand AB, Hässleholm 100.0000Windpark MR-B GmbH & Co. KG, Bremen2 100.0000Windpark MR-D GmbH & Co. KG, Bremen2 100.0000Windpark MR-N GmbH & Co. KG, Bremen2 100.0000Windpark MR-S GmbH & Co. KG, Bremen2 100.0000Windpark MR-T GmbH & Co. KG, Bremen2 100.0000wse Solarpark Spanien 1 GmbH & Co. KG, Düsseldorf 75.1243X-Pact B.V., The Hague 62.5000 Unconsolidated subsidiaries Aleama 150015 S.L., Valencia 100.0000ANOVA GmbH, Rostock 100.0000Arridabra 130013 S.L., Valencia 100.0000ARTES Assekuranzservice GmbH, Düsseldorf 100.0000B&D Business Solutions B.V., Utrecht 100.0000Backpack Insurance Agency Inc., Dover, Delaware 100.0000Badozoc 1001 S.L., Valencia 100.0000Bank Austria Creditanstalt Versicherungsdienst GmbH, Vienna 100.0000Baqueda 7007 S.L., Valencia 100.0000Beaufort Dedicated No.3 Ltd., London 100.0000Beaufort Dedicated No.4 Ltd., London 100.0000Beaufort Dedicated No.6 Ltd., London 100.0000Beaufort Underwriting Services Limited, London 100.0000Bobasbe 6006 S.L., Valencia 100.0000Botedazo 8008 S.L., Valencia 100.0000Callopio 5005 S.L., Valencia 100.0000Camcichu 9009 S.L., Valencia 100.0000Cannock Chase Incasso II B.V., The Hague 100.0000CAPITAL PLAZA Holding GmbH, Düsseldorf 100.0000Caracuel Solar Catorce S.L., Valencia 100.0000Caracuel Solar Cinco S.L., Valencia 100.0000Caracuel Solar Cuatro S.L., Valencia 100.0000Caracuel Solar Dieciocho S.L., Valencia 100.0000Caracuel Solar Dieciseis S.L., Valencia 100.0000Caracuel Solar Diecisiete S.L., Valencia 100.0000Caracuel Solar Diez S.L., Valencia 100.0000Caracuel Solar Doce S.L., Valencia 100.0000Caracuel Solar Dos S.L., Valencia 100.0000Caracuel Solar Nueve S.L., Valencia 100.0000Caracuel Solar Ocho S.L., Valencia 100.0000Caracuel Solar Once S.L., Valencia 100.0000Caracuel Solar Quince S.L., Valencia 100.0000Caracuel Solar Seis S.L., Valencia 100.0000
Silvanus Vermögensverwaltungsges. mbH, Munich3 100.0000Solarpark Fusion 3 GmbH, Düsseldorf 100.0000Solomon Associates Limited, Farnborough 100.0000Sopockie Towarzystwo Ubezpieczen Ergo Hestia Spolka Akcyjna, Sopot 100.0000Sopockie Towarzystwo Ubezpieczen na Zycie Ergo Hestia Spolka Akcyjna, Sopot 100.0000Specialty Insurance Services Corp., Amelia, Ohio 100.0000SunEnergy & Partners S.r.l., Brixen 100.0000Temple Insurance Company, Toronto, Ontario 100.0000The Atlas Insurance Agency Inc., Amelia, Ohio 100.0000The Boiler Inspection and Insurance Company of Canada, Toronto, Ontario 100.0000The Hartford Steam Boiler Inspection and Insurance Company of Connecticut, Hartford, Connecticut 100.0000The Hartford Steam Boiler Inspection and Insurance Company, Hartford, Connecticut 100.0000The Midland Company, Cincinnati, Ohio 100.0000The Polytechnic Club Inc., Hartford, Connecticut 100.0000The Princeton Excess and Surplus Lines Insurance Company, Wilmington, Delaware 100.0000Tir Mostyn and Foel Goch Limited, London 100.0000UAB Agra Aurata, Vilnius 100.0000UAB Agra Corp., Vilnius 100.0000UAB Agra Optima, Vilnius 100.0000UAB Agrofondas, Vilnius 100.0000UAB Agrolaukai, Vilnius 100.0000UAB Agrora, Vilnius 100.0000UAB Agrovalda, Vilnius 100.0000UAB Agrovesta, Vilnius 100.0000UAB G.Q.F., Vilnius 100.0000UAB Lila, Vilnius 100.0000UAB Sietuve, Vilnius 100.0000UAB Terra Culta, Vilnius 100.0000UAB Ukelis, Vilnius 100.0000UAB Vasaros Brizas, Vilnius 100.0000UAB VL Investment Vilnius 1, Vilnius 100.0000UAB VL Investment Vilnius 2, Vilnius 100.0000UAB VL Investment Vilnius 3, Vilnius 100.0000UAB VL Investment Vilnius 4, Vilnius 100.0000UAB VL Investment Vilnius 5, Vilnius 100.0000UAB VL Investment Vilnius 6, Vilnius 100.0000UAB VL Investment Vilnius 7, Vilnius 100.0000UAB VL Investment Vilnius 8, Vilnius 100.0000UAB VL Investment Vilnius 9, Vilnius 100.0000UAB VL Investment Vilnius 10, Vilnius 100.0000UAB VL Investment Vilnius, Vilnius 100.0000UK Wind Holdings Ltd., London 100.0000Unión Médica La Fuencisla S.A., Compañía de Seguros, Zaragoza 100.0000US PROPERTIES VA GmbH & Co. KG i.L., Düsseldorf4 46.0939VHDK Beteiligungsgesellschaft mbH, Düsseldorf 100.0000VICTORIA Asien Immobilienbeteiligungs GmbH & Co. KG, Munich 100.0000Victoria Italy Property GmbH, Düsseldorf 100.0000Victoria Lebensversicherung Aktiengesellschaft, Düsseldorf 100.0000

175Consolidated financial statementsNotes
Munich Re Group Annual Report 2018
% shareCompany and registered seat of capital
% shareCompany and registered seat of capital
ERGO Versicherungs- und Finanzierungs-Vermittlung GmbH, Hamburg 100.0000ERGO Vorsorgemanagement GmbH, Vienna 100.0000ERGO Zehnte Beteiligungsgesellschaft mbH, Düsseldorf 100.0000ERGO Zwölfte Beteiligungsgesellschaft mbH, Munich 100.0000ERV Services Ltd., London 100.0000ERV Sigorta Aracilik Hizmetleri Ltd. Şti., Istanbul 99.9980Etics, s.r.o., Prague 100.0000Etoblete 160016 S.L., Valencia 100.0000Euro-Center (Cyprus) Ltd., Larnaca 100.0000Euro-Center (Thailand) Co., Ltd., Bangkok 100.0000Euro-Center Cape Town (Pty) Ltd, Cape Town 100.0000Euro-Center Holding North Asia (HK) Pte. Ltd., Hong Kong 100.0000Euro-Center Ltda, São Paulo 100.0000Euro-Center North Asia Consulting Services (Beijing) Co., Ltd., Beijing 100.0000Euro-Center Prague, s.r.o., Prague 100.0000EUROCENTER S.A., Palma de Mallorca 100.0000Euro-Center USA, Inc., New York City, New York 100.0000Euro-Center Yerel Yardim Hizmetleri Ltd. Şti., Istanbul 100.0000European Assistance Holding GmbH, Munich 100.0000Evaluación Médica TUW S.L., Barcelona 100.0000Exolvo GmbH, Hamburg 100.0000Gamaponti 140014 S.L., Valencia 100.0000GBG Vogelsanger Straße GmbH, Cologne 94.7826Gebäude Service Gesellschaft Überseering 35 mbH, Hamburg 100.0000goDentis – Gesellschaft für Innovation in der Zahnheilkunde mbH, Cologne 100.0000Great Lakes (Gibraltar) Plc, Gibraltar 100.0000Guanzu 2002 S.L., Valencia 100.0000Hamburger Hof Management GmbH, Hamburg 100.0000Hamburg-Mannheimer ForsikringService A/S, Copenhagen 100.0000Hansekuranz Kontor GmbH, Münster 51.0000Hartford Steam Boiler Colombia Ltda, Bogota 100.0000Hartford Steam Boiler UK Limited, Salford 100.0000Hestia Loss Control Sp.z.o.o., Sopot 100.0000Horbach GmbH Versicherungsvermittlung und Finanzdienstleistungen, Düsseldorf 70.1000HSB Associates Inc., New York City, New York 100.0000HSB Ventures Inc., Dover, Delaware 100.0000IDEENKAPITAL Anlagebetreuungs GmbH, Düsseldorf 100.0000Ideenkapital Client Service GmbH, Düsseldorf 100.0000Ideenkapital erste Investoren Service GmbH, Düsseldorf 100.0000Ideenkapital Fonds Treuhand GmbH, Düsseldorf 100.0000Ideenkapital Media Treuhand GmbH, Düsseldorf 100.0000IDEENKAPITAL Metropolen Europa Verwaltungsgesellschaft mbH, Düsseldorf 100.0000IDEENKAPITAL PRORENDITA EINS Treuhandgesellschaft mbH, Düsseldorf 100.0000IDEENKAPITAL Schiffsfonds Treuhand GmbH, Düsseldorf 100.0000IDEENKAPITAL Treuhand US Real Estate eins GmbH, Düsseldorf 100.0000
Caracuel Solar Siete S.L., Valencia 100.0000Caracuel Solar Trece S.L., Valencia 100.0000Caracuel Solar Tres S.L., Valencia 100.0000Caracuel Solar Uno S.L., Valencia 100.0000Centrum Pomocy Osobom Poszkodowanym Sp.z.o.o., Gdansk 100.0000Copper Leaf Research, Bingham Farms, Michigan 100.0000Cotatrillo 100010 S.L., Valencia 100.0000D.A.S. Prawo i Finanse Sp.z.o.o., Warsaw 100.0000D.A.S. Rechtsschutz Leistungs-GmbH, Munich 100.0000D.A.S., Tomasz Niedzinski Kancelaria Prawna Spolka komandytowa, Warsaw 95.0000DAS Incasso Arnhem B.V., Elst 100.0000DAS Incasso Eindhoven B.V., ‚s-Hertogenbosch 100.0000DAS Incasso Rotterdam B.V., Rotterdam 100.0000DAS Legal Protection Inc., Toronto, Ontario 100.0000DAS Legal Services B.V., Amsterdam 100.0000DAS Lex Assistance S.L., L’Hospitalet de Llobregat 100.0000DEAX Õigusbüroo OÜ, Tallinn 100.0000Digital Edge Insurance Company, Wilmington, Delaware 100.0000DKV Beteiligungs- und Vermögensverwaltungs GmbH & Co. KG, Cologne 100.0000DKV Erste Beteiligungsgesellschaft mbH, Cologne 100.0000DKV Servicios S.A., Zaragoza 100.0000DKV-Residenz am Tibusplatz gGmbH, Münster 100.0000DKV-Residenz in der Contrescarpe GmbH, Bremen 100.0000DRA Debt Recovery Agency B.V., The Hague 100.0000Economic Data Resources B.V., The Hague 100.0000ERGO (China) Consulting Ltd., Beijing 100.0000ERGO Alpha GmbH, Düsseldorf 100.0000ERGO Asia Management Pte. Ltd. (In Member’s Voluntary Liquidation), Singapore 100.0000ERGO Digital IT GmbH, Berlin 100.0000ERGO Direkt AG, Fürth 100.0000ERGO Fund Golden Aging, Brussels4 100.0000ERGO Fünfzehnte Beteiligungs AG, Düsseldorf 100.0000ERGO Gourmet GmbH, Düsseldorf 100.0000ERGO Infrastructure Investment Gesundheit GmbH, Düsseldorf 100.0000ERGO Infrastructure Investment Komposit GmbH, Düsseldorf 100.0000ERGO Infrastructure Investment Leben GmbH, Düsseldorf 100.0000ERGO Infrastructure Investment Pensionskasse GmbH, Düsseldorf 100.0000ERGO Infrastructure Investment Victoria Leben GmbH, Düsseldorf 100.0000ERGO LatAm S.A.S., Bogota 100.0000ERGO Leben Asien Verwaltungs GmbH, Munich 100.0000ERGO Mobility Solutions GmbH, Düsseldorf 100.0000ERGO Private Capital GmbH, Düsseldorf 100.0000ERGO PRO S.r.l., Verona 100.0000ERGO Pro Sp.z.o.o., Warsaw 100.0000ERGO Pro, spol.s.r.o., Prague 100.0000ERGO Vermögensmanagement Flexibel A, Munich4 38.4468

Consolidated financial statementsNotes
176
% shareCompany and registered seat of capital
% shareCompany and registered seat of capital
MedNet Europa GmbH, Munich 100.0000MedNet Global Healthcare Solutions LLC, Dubai 100.0000MedNet Greece S.A., Athens 78.1419Mednet Jordan Co. W.L.L., Amman 100.0000MedNet Saudi Arabia LLC, Jeddah 100.0000MedNet UAE FZ LLC, Dubai 100.0000miCura Pflegedienste Berlin GmbH, Berlin 100.0000miCura Pflegedienste Bremen GmbH, Bremen 100.0000miCura Pflegedienste Düsseldorf GmbH, Düsseldorf 100.0000miCura Pflegedienste GmbH, Cologne 100.0000miCura Pflegedienste Hamburg GmbH, Hamburg 100.0000miCura Pflegedienste Krefeld GmbH, Krefeld 100.0000miCura Pflegedienste München/Dachau GmbH, Dachau 51.0000miCura Pflegedienste München GmbH i. L., Munich 100.0000miCura Pflegedienste München Ost GmbH, Munich 65.0000miCura Pflegedienste Münster GmbH, Münster 100.0000miCura Pflegedienste Nürnberg GmbH, Nuremberg 51.0000MR Beteiligungen 2. GmbH, Munich 100.0000MR Beteiligungen 3. GmbH, Munich 100.0000MR Beteiligungen 15. GmbH, Munich 100.0000MR Beteiligungen 18. GmbH, Grünwald 100.0000MR Beteiligungen AG, Grünwald 100.0000MR Digital Innovation Partners Insurance Agency LLC, Columbus, Ohio4 0.0000MR Financial Group GmbH, Munich 100.0000MR Forest GmbH, Munich 100.0000MR HealthTech Ltd., Nicosia 100.0000MR Infrastructure Inc., Dover, Delaware 100.0000MR RENT-Management GmbH, Munich 100.0000MRHCUK Dormant No.1 Limited, London 100.0000Münchener Consultora Internacional SRL, Santiago de Chile 100.0000Münchener de Argentina Servicios Técnicos S.R.L., Buenos Aires 100.0000Münchener de Mexico S.A., Mexico 100.0000Münchener de Venezuela C.A. Intermediaria de Reaseguros, Caracas 100.0000Münchener Finanzgruppe AG Beteiligungen, Munich 100.0000Münchener Vermögensverwaltung GmbH, Munich 100.0000Münchener, ESCRITÓRIO DE REPRESENTACAO DO BRASIL Ltda, São Paulo 100.0000Munich American Reassurance Company PAC Inc., Atlanta, Georgia4 0.0000Munich Atlanta Financial Corporation, Atlanta, Georgia 100.0000Munich Canada Systems Corporation, Toronto, Ontario 100.0000Munich Columbia Square Corp., Wilmington, Delaware 100.0000Munich Management Pte. Ltd., Singapore 100.0000Munich Mauritius Reinsurance Co. Ltd., Port Louis 100.0000Munich Re America Brokers Inc., Wilmington, Delaware 100.0000Munich Re America Management Ltd., London 100.0000Munich Re Automation Solutions GmbH, Munich 100.0000Munich Re Automation Solutions Inc., Wilmington, Delaware 100.0000Munich Re Automation Solutions K.K., Tokyo 100.0000Munich Re Automation Solutions Pte. Ltd., Singapore 100.0000
IK Einkauf Objektverwaltungsgesellschaft mbH, Düsseldorf 100.0000IK Einkaufsmärkte Deutschland Verwaltungsgesellschaft mbH, Düsseldorf 100.0000IK FE Fonds Management GmbH, Düsseldorf 100.0000IK Komp GmbH, Düsseldorf 100.0000IK Objekt Bensheim GmbH, Düsseldorf 100.0000IK Objekt Frankfurt Theodor-Heuss-Allee GmbH i. L., Düsseldorf 100.0000IK Pflegezentrum Uelzen Verwaltungs-GmbH, Düsseldorf 100.0000IK Property Eins Verwaltungsgesellschaft mbH, Hamburg 100.0000IK Property Treuhand GmbH, Düsseldorf 100.0000IK US Portfolio Invest DREI Verwaltungs-GmbH i. L., Düsseldorf 100.0000IK US Portfolio Invest Verwaltungs-GmbH i. L., Düsseldorf 100.0000IK US Portfolio Invest ZWEI Verwaltungs-GmbH i. L., Düsseldorf 100.0000ITERGO Service GmbH, Düsseldorf 100.0000Jogszerviz Kft, Budapest 100.0000Junos Verwaltungs GmbH, Munich 100.0000K & P Objekt Hamburg Hamburger Straße GmbH, Düsseldorf 100.0000K & P Objekt Hamburg Hamburger Straße Immobilienfonds GmbH & Co. KG, Düsseldorf4 36.6889K & P Objekt München Hufelandstraße GmbH i. L., Düsseldorf 100.0000KQV Solarpark Franken 1 GmbH & Co. KG, Düsseldorf 100.0000Larus Vermögensverwaltungsgesellschaft mbH, Munich 100.0000Legal Net GmbH, Munich 100.0000Leggle B.V., Amsterdam 100.0000m:editerran Power S.a.s. di welivit Solar Italia S.r.l., Bolzano 100.0000Marbury Agency Inc., Amelia, Ohio 100.0000MAYFAIR Financing GmbH, Munich 100.0000MAYFAIR Holding GmbH i. L., Düsseldorf 100.0000MEAG Center House S.A., Brussels 100.0000MEAG EM Rent Nachhaltigkeit (A+I Tranche), Munich4 63.5771MEAG FlexConcept – EuroGrowth, Luxembourg4 100.0000MEAG GlobalRent (A+I Tranche), Munich4 99.4703MEAG Hong Kong Limited, Hong Kong 100.0000MEAG Luxembourg S.à r.l., Luxembourg 100.0000MEAG MultiSmart (A+I), Munich4 38.8576MEAG Pension Rent, Munich4 100.0000MEAG Pension Safe, Munich4 100.0000MEAG Real Estate Erste Beteiligungsgesellschaft mbH i.L., Munich 100.0000MEAG RealReturn Inhaber-Anteile A, Munich4 46.2665MEAG Vermögensanlage Komfort, Munich4 35.9083MEAG Vermögensanlage Return (A+I Tranche), Munich4 53.3549Mediastream Consulting GmbH, Grünwald 100.0000Mediastream Dritte Film GmbH i. L., Grünwald 100.0000Mediastream Film GmbH, Grünwald 100.0000Mediastream Zweite Film GmbH, Grünwald 100.0000MedNet Bahrain W.L.L., Manama 100.0000MedNet Egypt LLC, Cairo 100.0000

177Consolidated financial statementsNotes
Munich Re Group Annual Report 2018
% shareCompany and registered seat of capital
% shareCompany and registered seat of capital
Victoria Vierter Bauabschnitt Management GmbH, Düsseldorf 100.0000Viwis GmbH, Munich 100.0000VV-Consulting Gesellschaft für Risikoanalyse, Vorsorge-beratung und Versicherungsvermittlung GmbH, Vienna 100.0000VV-Consulting Többesügynöki Kft, Budapest 100.0000welivit New Energy GmbH, Düsseldorf 100.0000welivit Solar España GmbH, Düsseldorf 100.0000welivit Solar Italia s.r.l., Bolzano 100.0000Windpark Langengrassau Infrastruktur GbR, Bremen11 83.3300WNE Solarfonds Süddeutschland 2 GmbH & Co. KG, Düsseldorf 100.0000Wohnungsgesellschaft Brela mbH, Hamburg 100.0000WP Kladrum/ Dargelütz GbR, Bremen11 55.0000Zacobu 110011 S.L., Valencia 100.0000Zacuba 6006 S.L., Valencia 100.0000Zacubacon 150015 S.L., Valencia 100.0000Zafacesbe 120012 S.L., Valencia 100.0000Zapacubi 8008 S.L., Valencia 100.0000Zarzucolumbu 100010 S.L., Valencia 100.0000Zetaza 4004 S.L., Valencia 100.0000Zicobucar 140014 S.L., Valencia 100.0000Zucaelo 130013 S.L., Valencia 100.0000Zucampobi 3003 S.L., Valencia 100.0000Zucarrobiso 2002 S.L., Valencia 100.0000Zucobaco 7007 S.L., Valencia 100.0000Zulazor 3003 S.L., Valencia 100.0000Zumbicobi 5005 S.L., Valencia 100.0000Zumcasba 1001 S.L., Valencia 100.0000Zuncabu 4004 S.L., Valencia 100.0000Zuncolubo 9009 S.L., Valencia 100.0000
Associates and joint ventures accounted for using the equity method 1818 Acquisition LLC, Dover, Delaware 20.6400Apollo Munich Health Insurance Co. Ltd., Hyderabad 48.6157Bazos CIV L.P., Dover, Delaware7 100.0000Consorcio Internacional de Aseguradores de Crédito S.A., Madrid5 15.0353Consortia Versicherungs-Beteiligungsgesellschaft mbH, Nuremberg 33.7027D.A.S. Difesa Automobilistica Sinistri S.p.A. di Assicurazione, Verona 49.9920DAMAN – National Health Insurance Company, Abu Dhabi 20.0000EGM Wind SAS, Paris 40.0000ERGO China Life Insurance Co., Ltd., Jinan, Shandong Province 50.0000Europai Utazasi Biztosito Rt, Budapest 26.0000Europäische Reiseversicherungs-Aktiengesellschaft, Vienna 25.0100Global Aerospace Underwriting Managers Ltd., London7 51.0000Global Insurance Corporation, Ho Chi Minh City 43.7500Group Health Group Holdings Inc., Surrey, British Columbia 40.0000HDFC ERGO General Insurance Company Ltd., Mumbai 48.2642
Munich Re Automation Solutions Pty Ltd, Sydney 100.0000Munich Re Capital Markets GmbH, Munich 100.0000Munich Re Capital No.2 Limited, London 100.0000Munich Re Digital Partners Limited, London 100.0000Munich Re India Services Private Limited, Mumbai 100.0000Munich Re Risk Solution Ireland Limited, Dublin 100.0000Munich Re Service GmbH, Munich 100.0000Munich Re Underwriting Agents (DIFC) Ltd., Dubai 100.0000Munich ReThink GmbH, Munich 100.0000Munich-American Risk Partners GmbH, Munich 100.0000Munich-Canada Management Corp. Ltd., Toronto, Ontario 100.0000MunichFinancialGroup AG Holding, Munich 100.0000MunichFinancialServices AG Holding, Munich 100.0000Munichre Service Limited, Hong Kong 100.0000Naretoblera 170017 S.L., Valencia 100.0000Nerruze 120012 S.L., Valencia 100.0000nexible GmbH, Düsseldorf 100.0000Orrazipo 110011 S.L., Valencia 100.0000P.A.N. Verwaltungs GmbH, Grünwald 100.0000PLATINIA Verwaltungs-GmbH, Munich 100.0000PRORENDITA DREI Verwaltungsgesellschaft mbH, Hamburg 100.0000PRORENDITA EINS Verwaltungsgesellschaft mbH, Hamburg 100.0000PRORENDITA FÜNF Verwaltungsgesellschaft mbH, Hamburg 100.0000PRORENDITA VIER Verwaltungsgesellschaft mbH, Hamburg 100.0000PRORENDITA ZWEI Verwaltungsgesellschaft mbH, Hamburg 100.0000Reaseguradora de las Américas S.A., Havana 100.0000Roanoke Trade Insurance Inc., Schaumburg, Illinois 100.0000SAINT LEON ENERGIE S.A.R.L., Sarreguemines 100.0000Schloss Hohenkammer GmbH, Hohenkammer 100.0000Schrömbgens & Stephan GmbH Versicherungsmakler, Düsseldorf 100.0000Smart Thinking Consulting (Beijing) Co. Ltd., Beijing 100.0000Solarfonds Göttelborn 2 GmbH & Co. KG, Düsseldorf4 34.4234Sopockie Towarzystwo Doradcze Sp.z.o.o., Sopot 100.0000Stichting Aandelen Beheer D.A.S. Holding, Amsterdam 100.0000Sustainable Finance Risk Consulting GmbH, Munich 100.0000Sydney Euro-Center Pty Ltd, Sydney 100.0000TAS Assekuranz Service GmbH i. L., Frankfurt am Main 100.0000TAS Touristik Assekuranz-Service GmbH, Frankfurt am Main 100.0000Three Lions Underwriting Ltd., London 100.0000TIERdirekt GmbH, Munich 75.0000Tillobesta 180018 S.L., Valencia 100.0000Triple IP B.V., Culemborg 100.0000US PROPERTIES VA Verwaltungs-GmbH, Düsseldorf 100.0000Vectis Claims Services Ltd., Tel Aviv 75.0000VICTORIA Immobilien Management GmbH, Munich 100.0000Victoria Immobilien-Fonds GmbH, Düsseldorf 100.0000VICTORIA US Property Zwei GmbH i. L., Munich 100.0000

Consolidated financial statementsNotes
178
Munich Re Group Annual Report 2018
% shareCompany and registered seat of capital
% shareCompany and registered seat of capital
Invesco MEAG US Immobilien Fonds IV B, Luxembourg 37.1375KarstadtQuelle Finanz Service GmbH i. L., Düsseldorf 50.0000King Price Financial Services (Pty) Ltd, Pretoria5 15.0000Marchwood Power Limited, Southampton 50.0000MEAG Pacific Star Holdings Ltd., Hong Kong 50.0000MEDICLIN Aktiengesellschaft, Offenburg 35.0042Rendite Partner Gesellschaft für Vermögensverwaltung mbH i. L., Frankfurt am Main 33.3333RP Vilbeler Fondsgesellschaft mbH i. L., Frankfurt am Main 40.0000Sana Kliniken AG, Munich 22.4904SAS Le Point du Jour, Paris 50.0000SEBA Beteiligungsgesellschaft mbH, Nuremberg 48.9966SEIF II Texas Wind Holdings 1 LLC, Dover, Delaware 49.0000SNIC Insurance B.S.C. (c), Manama 22.5000STEAG Fernwärme GmbH, Essen 49.0000Storebrand Helseforsikring AS, Oslo 50.0000Suramericana S.A., Medellin5 18.8672Taunus Holding B.V., Rotterdam 23.1913Thaisri Insurance Public Company Limited, Bangkok 40.2576T-Solar Global Operating Assets S.L., Madrid 37.0000Vier Gas Investments S.à r.l., Luxembourg 43.7516 Associates and joint ventures accounted for at fair value “PORT ELISABETH” GmbH & Co. KG, Bramstedt 31.9660“PORT LOUIS” GmbH & Co. KG, Bramstedt 26.0495Agricultural Management Services S.r.l., Verona 33.3333Allianz Pegasus Fonds, Frankfurt am Main 46.0000Assistance Partner GmbH & Co. KG, Munich 21.6600Augury Inc., Wilmington, Delaware5 12.7500carexpert Kfz-Sachverständigen GmbH, Walluf 25.0000Fernkälte Geschäftsstadt Nord Gesellschaft bürgerlichen Rechts, Hamburg11 36.5609Finsure Investments (Private) Limited, Harare 24.5000GIG City Nord GmbH, Hamburg 20.0000Hartford Research LLC, Lewes, Delaware 41.7500IK Objektgesellschaft Frankfurt Theodor-Heuss-Allee GmbH & Co. KG, Düsseldorf 47.4000Inshur Holdings Corp, Wilmington, Delaware5 16.0400LCM Logistic Center Management GmbH, Hamburg 50.0000MCAF Management GmbH i. L., Düsseldorf 50.0000Mnubo Inc., Montreal, Quebec5 15.5800Neos Ventures Limited, London5 9.7800PERILS AG, Zurich5 10.0000POOL Sp.z.o.o., Warsaw 33.7500Residential Builders Underwriting Agency Pty Ltd, Sydney 20.0000SIP Social Impact Partners GmbH, Munich 50.0000Spruce Holdings Inc., Wilmington, Delaware5 11.9500Super Home Inc., Wilmington, Delaware5 17.0100Teko – Technisches Kontor für Versicherungen Gesellschaft mit beschränkter Haftung, Düsseldorf 30.0000T-Solar Luxembourg GP S.à.r.l., Luxembourg 37.0000vers.diagnose GmbH, Hanover 49.0000
Verwaltungsgesellschaft “PORT ELISABETH” mbH, Bramstedt 50.0000Verwaltungsgesellschaft “PORT KELANG” mbH, Bramstedt 50.0000Verwaltungsgesellschaft “PORT LOUIS” mbH, Bramstedt 50.0000Verwaltungsgesellschaft “PORT MAUBERT” mbH, Bramstedt 50.0000Verwaltungsgesellschaft “PORT MELBOURNE” mbH, Bramstedt 50.0000Verwaltungsgesellschaft “PORT MENIER” mbH, Bramstedt 50.0000Verwaltungsgesellschaft “PORT MOODY” mbH, Bramstedt 50.0000Verwaltungsgesellschaft “PORT MORESBY” mbH, Bramstedt 50.0000Verwaltungsgesellschaft “PORT MOUTON” mbH, Bramstedt 50.0000Verwaltungsgesellschaft “PORT NELSON” mbH, Bramstedt 50.0000Verwaltungsgesellschaft “PORT RUSSEL” mbH, Bramstedt 50.0000Verwaltungsgesellschaft “PORT SAID” mbH, Bramstedt 50.0000Verwaltungsgesellschaft “PORT STANLEY” mbH, Bramstedt 50.0000Verwaltungsgesellschaft “PORT STEWART” mbH, Bramstedt 50.0000Verwaltungsgesellschaft “PORT UNION” mbH, Bramstedt 50.0000VisEq GmbH, Grünwald 34.0000Volksbanken-Versicherungsdienst GmbH, Vienna 25.2319VV Immobilien Verwaltungs GmbH i.L., Munich 30.0000VV Immobilien Verwaltungs und Beteiligungs GmbH, Munich 30.0000We Predict Limited, Swansea5 17.5900Windpark Osterhausen-Mittelhausen Infrastruktur GbR, Bremen7, 11 58.9400WISMA ATRIA Holding GmbH i. L., Düsseldorf 50.0000 Companies included on a pro-rata basis (joint operation pursuant to IFRS 11) “Pensionsfonds” des Versorgungswerks MetallRente bei der Allianz Pensionsfonds AG, Stuttgart 17.5000 Shareholdings exceeding 5% of the voting rights in large companies as defined in Section 271(1) of the German Commercial Code (HGB) Admiral Group plc, Cardiff(equity: €140,494k; result for year: €322,825k) 10.1030Extremus Versicherungs-Aktiengesellschaft, Cologne(equity: €63,940k; result for year: €200k) 16.0000Protektor Lebensversicherungs-AG, Berlin(equity: €105,796k; result for year: €384k) 10.7631Saudi Enaya Cooperative Insurance Company, Jeddah(equity: €36,128k; result for year: –€3,278k) 15.0000Wataniya Insurance Company, Jeddah(equity: €54,586k; result for year: €10,093k) 10.0000

179Consolidated financial statementsNotes
Munich Re Group Annual Report 2018
% shareCompany and registered seat of capital
% shareCompany and registered seat of capital
PRORENDITA VIER GmbH & Co. KG, Hamburg(equity: €8,682k; result for year: €88k) 0.0029PRORENDITA Zwei GmbH & Co. KG, Hamburg(equity: €4,449k; result for year: –€436k) 0.0100Ridecell Inc., Wilmington, Delaware(equity: €12,879k; result for year: €0k) 3.2300RMS Forest Growth International L.P., Grand Cayman, Cayman Islands8 (equity: €85,291k; result for year: –€4,816k) 43.4700Slice Labs Inc., Ottawa, Ontario(equity: €3,953k; result for year: –€6,295k) 9.0400Solarpark 1000 Jahre Fürth GmbH & Co. KG, Düsseldorf(equity: €662k; result for year: €107k) 0.9091T&R MLP GmbH, Bonn(equity: €24k; result for year: –€2k) 10.0020T&R Real Estate GmbH, Bonn(equity: €140,827k; result for year: –€15k) 10.0020Team8 Partners II L.P., George Town, Grand Cayman, Cayman Islands (equity: €2,539k; result for year: €0k) 8.5300Trov Inc., Dover, Delaware(equity: €34,929k; result for year: –€18,305k) 4.7359Umspannwerk Hellberge GmbH & Co. KG, Treuenbrietzen(equity: €0k; result for year: –€132k) 6.9000welivit TOP SOLAR GmbH & Co. KG, Düsseldorf(equity: €71k; result for year: €49k) 0.0000Zeguro Inc., Wilmington, Delaware(equity: –€730k; result for year: €0k) 4.5000
1 Not currently utilised.2 This fully consolidated German subsidiary with the legal form of a partnership,
as defined in Section 264a of the German Commercial Code (HGB), intends to fulfil the conditions required pursuant to Section 264b of the Commercial Code and, in the 2018 financial year, to avail itself of the relevant provision exempting it from preparing annual financial statements.
3 This fully consolidated German subsidiary intends to fulfil the conditions required in Section 264(3) of the German Commercial Code (HGB) and, in the 2018 financial year, to avail itself of the relevant provision exempting it from preparing annual financial statements.
4 Control due to voting majority or other control pursuant to IFRS 10.5 Significant influence owing to representation of Munich Re on the board of
directors and/or supervisory body or an equivalent governing body of the associate.
6 Not currently utilised. 7 No control, since the articles of association or another agreement bind the relevant operations to a quorum which cannot be achieved by Munich Re.8 No control and/or no significant influence, as it is a purely financial investment
under the managerial responsibility of an external asset manager. 9 Not currently utilised. 10 Not currently utilised.11 Munich Reinsurance Company or one of its consolidated subsidiaries is a fully
liable partner in this company.
Drawn up and released for publication,Munich, 6 March 2019.
The Board of Management
Other shareholdings as defined in Section 271(1) of the German Commercial Code (HGB) Asia Property Fund II GmbH & Co. KG, Munich(equity: €109,164k; result for year: €7,370k) 5.8889Autobahn T&R Management GmbH, Bonn(equity: €25k; result for year: €1k) 10.0020Autobahn Tank & Rast Gruppe GmbH & Co. KG, Bonn(equity: €371,387k; result for year: –€106,819k) 9.9980B3i Services AG, Zurich(equity: €6,300k; result for year: €0k) 7.9400Bought by Many Limited “BBM”, London(equity: €5,756k; result for year: –€3,952k) 11.4000CBRE U.S. Core Partners Parallel Limited Partnership, Wilmington, Delaware8 (equity €28,603k; result for year: €2,334k) 99.9000Equidate Inc., Wilmington, Delaware(equity: €4,000k; result for year: €3,591k) 4.9400FIA Timber Partners II LP, Wilmington, Delaware8
(equity: €148,385k; result for year: €1,893k) 39.0800Fraugster Limited, London(equity: €469k; result for year: –€2,551k) 5.7300Green Acre LLC, Wilmington, Delaware8
(equity: €216,466k; result for year: €31,761k) 31.9361Hancock Timberland XII LP, Wilmington, Delaware(equity: €315,349k; result for year: €1,841k) 15.1500Helium Systems Inc., Dover, Delaware(equity: €12,201k; result for year: –€4,366) 5.4600Hines India Fund LP, Houston, Texas(equity: €40,961k; result for year: –€142) 11.8333Hippo Analytics Inc., Wilmington, Delaware(equity: €25,454k; result for year: –€6,393k) 2.1000IK Australia Property Eins GmbH & Co. KG, Hamburg(equity: €4,830k; result for year: –€1,240k) 10.6438IK Objekt Bensheim Immobilienfonds GmbH & Co. KG, Düsseldorf (equity: €17,655k; result for year: €3,416k) 16.2445IK US PORTFOLIO INVEST Drei GmbH & Co. KG, Düsseldorf (equity: €3,301k; result for year: –€693k) 0.0024IK US Portfolio Invest GmbH & Co. KG, Düsseldorf(equity: €8,132k; result for year: –€1,987k) 0.0026IK US Portfolio Invest ZWEI GmbH & Co. KG i.L., Düsseldorf(equity: €6,200k; result for year: –€2,664k) 0.0016Jasper Services Limited, London(equity: €3,968k; result for year: €0k) 18.0700K & P Objekt München Hufelandstraße Immobilienfonds GmbH & Co. KG, Düsseldorf (equity: €7,848k; result for year: €1,536k) 0.0489M 31 Beteiligungsgesellschaft mbH & Co. Energie KG, Düsseldorf (equity: €1,089,549k; result for year: €71,307k) 18.6246m:solarPOWER GmbH & Co. KG, Düsseldorf(equity: €430k; result for year: €145k) 0.0000Next Insurance Inc., Wilmington, Delaware(equity: €35,487k; result for year: –€7,854k) 6.7400PRORENDITA DREI GmbH & Co. KG, Hamburg(equity: €4,024k; result for year: €43k) 0.0260PRORENDITA EINS GmbH & Co. KG, Hamburg(equity: €6,986k; result for year: –€232k) 0.0590PRORENDITA FÜNF GmbH & Co. KG, Hamburg(equity: €12,991k; result for year: –€196k) 0.0384

180Independent auditor’s report
Basis for the opinionsWe conducted our audit of the consolidated financial statements and of the Group management report in accordance with Section 317 HGB and the EU Audit Regulation No. 537/2014 (referred to subsequently as “EU Audit Regulation”) and in compliance with German Generally Accepted Standards for Financial Statement Audits promulgated by the Institut der Wirtschaftsprüfer [Institute of Public Auditors in Germany] (IDW). Our responsibilities under those requirements and principles are further described in the “Auditor’s Responsibilities for the Audit of the Consolidated Financial Statements and of the Combined Management Report” section of our auditor’s report. We are independent of the Group entities in accordance with the requirements of European law and German commercial and professional law, and we have fulfilled our other German professional responsibilities in accordance with these requirements. In addition, in accordance with Article 10(2)(f) of the EU Audit Regulation, we declare that we have not provided non-audit services prohibited under Article 5(1) of the EU Audit Regulation. We believe that the evidence we have obtained is sufficient and appropriate to provide a basis for our opinions on the consolidated financial statements and on the combined management report.
Key audit matters in the audit of the consolidated financial statementsKey audit matters are those matters that, in our professional judgement, were of most significance in our audit of the consolidated financial statements for the financial year from 1 January to 31 December 2018. These matters were addressed in the context of our audit of the consolidated financial statements as a whole, and in forming our opinion thereon, we do not provide a separate opinion on these matters.
Valuation of the provision for outstanding claims in property-casualty businessFor information on the accounting and valuation policies used, please see the notes to the consolidated financial statements on page 114, and details about the estimates and assumptions used on page 99. Further information about the line items in the financial statements can be found on pages 145–148. Risk information can be found on pages 161–164 of the Notes to the financial statements, and on pages 68–70 of the combined management report.
The financial statement riskThe provision for outstanding claims at the reporting date was €46,919m in the property-casualty reinsurance segment and €4,670m in the property-casualty German primary insurance segment. In the ERGO International segment, a major part of the provision for outstanding claims of €2,848m refers to property-casualty business. Major losses from natural catastrophes had an impact of €1,256m on the Group in the financial year.
Independent auditor’s report
To Münchener Rückversicherungs-Gesellschaft Aktiengesellschaft in München, Munich
Report on the audit of the consolidated financial statements and of the combined management report
OpinionsWe have audited the consolidated financial statements of Münchener Rückversicherungs-Gesellschaft Aktien-gesellschaft in München, Munich, and its subsidiaries (the Group), which comprise the consolidated balance sheet as at 31 December 2018, and the consolidated income statement, the statement of recognised income and expense, the Group statement of changes in equity and the consolidated cash flow statement for the financial year from 1 January to 31 December 2018, and notes to the consolidated financial statements, including a summary of significant accounting policies. In addition, we have audited the combined management report of Münchener Rückversicherungs-Gesellschaft Aktien gesellschaft in München, Munich, for the financial year from 1 January to 31 December 2018.
In our opinion, on the basis of the knowledge obtained in the audit,
− the accompanying consolidated financial statements comply, in all material respects, with the IFRSs as adopted by the EU, and the additional requirements of German commercial law pursuant to Section 315e(1) of the German Commercial Code [Handelsgesetzbuch: HGB] and, in compliance with these requirements, give a true and fair view of the assets, liabilities, and financial position of the Group as of 31 December 2018, and of its financial performance for the financial year from 1 January to 31 December 2018, and
− the accompanying combined management report as a whole provides an appropriate view of the Group’s position. In all material respects, this combined management report is consistent with the consolidated financial statements, complies with German legal requirements and appropriately presents the opportunities and risks of future development.
Pursuant to Section 322(3) sentence 1 HGB, we declare that our audit has not led to any reservations relating to the legal compliance of the consolidated financial statements and of the combined management report.

181
Munich Re Group Annual Report 2018
Independent auditor’s report
− For selected Group entities, we carried out our own reserve calculations for certain segments based on our assessment of risk considerations. We determined a best estimate as well as an appropriate range based on statistical probabilities, and compared these with the Company’s calculations.
− We assessed the level of reserves at the reporting date with that in previous years. We assessed the appropriateness of any adjustments made to expected values determined using actuarial methods by inspecting and critically assessing the documentation of the underlying calculations or qualitative grounds. We also made enquiries of each of the actuaries responsible.
− We assessed the appropriateness of provisions for asbestos and environmental claims on the basis of statistics and key figures.
− We assessed the actual development of the provision for outstanding claims set for the previous year on the basis of run-off results in order to draw conclusions about the reliability of the estimates.
− We assessed whether the disclosures in the notes, particularly the run-off triangles, were correctly derived from the accounting system and evaluated them for completeness.
Our observationsThe valuation process for the provision for outstanding claims in property-casualty business is appropriate, and the valuation assumptions applied, including those for major losses, are appropriately derived. The explanatory notes and disclosures in the Notes to the consolidated financial statements are complete and appropriate.
Valuation of the provision for future policy benefits, the provision for outstanding claims, and deferred acquisition costs in life and health
With respect to the accounting policies, we refer to explanations in the Notes to the consolidated financial statements on pages 113–114, and to the explanations about the use of estimates and assumptions on page 99. Further information about the line items in the financial statements can be found on pages 137 and 145. Risk information can be found on pages 159–161 of the Notes to the financial statements, and on pages 69–70 of the combined management report.
The provision for outstanding claims is reported on the basis of an expected value that is calculated on the basis of actuarial procedures and statistical methods. The expected value takes account of assumptions about premium, ultimate loss ratios, run-off periods, factors and speed of settlement that are based on past experience. Management bases the final amount of the provision for outstanding claims on the results of actuarial procedures and other information about calculating associated uncertainties. Major losses are viewed separately when measuring provisions.
Estimation of the provision for outstanding claims is subject to uncertainty and depends on the exercise of judgement. Uncertainties in estimation arise in particular from the occurrence, amount and speed of settlement of large claims, long-term claims development (especially in third-party liability) and in relation to the estimation of special loss scenarios, such as provisions for asbestos and environmental claims. With major losses in particular – such as for hurricane events – it can take a long time before all claims notifications are received from cedants. Where no adequate claims notifications are available, provisions for these major losses are estimated on the basis of internal analyses of market loss and the company’s own losses on the basis of cover it has provided.
The Notes to the financial statements must include extensive information about the provision for outstanding claims, including run-off triangles in particular.
Our audit approachIn auditing the provision for outstanding claims, we engaged actuaries as part of the audit team. In particular, we carried out the following key audit procedures:
− We assessed the process for setting aside provisions, identified key controls, and tested their design and effectiveness. The controls include the completeness and accuracy of the data used, and the qualitative and quantitative aspects of valuation.
− We requested explanations on the derivation of key assumptions used – including loss ratios and assumptions about run-off patterns – and assessed those assumptions.
− Substantive audit procedures on major losses were mainly made on the basis of selected specific items, whereby we drew conclusions about the appropriateness of key assumptions used on the basis of available external information.

182Independent auditor’s report
The financial statement riskProvisions in life and health mainly comprise the provision for future policy benefits and the provision for outstanding claims. The provision for future policy benefits excluding unit-linked life insurance in the ERGO Life and Health Germany segment is €88,950m, and amounts to €12,107m in the life and health reinsurance segment. In ERGO International, most of the provision for future policy benefits of €9,641m is for life and health business. The provision for outstanding claims in the life and health reinsurance segment is €9,034m and amounts to €2,886m in ERGO Life and Health.
The Group’s deferred acquisition costs amount to €9,212m (net), and most of this refers to life and health business.
Valuation of the provision for future policy benefits is necessarily dependent on a number of assumptions. These refer in particular to discount rates, mortality and morbidity assumptions, acquisition and administration expenses, and calculated lapse rates. In accordance with applicable accounting regulations, these assumptions are determined at the start of a contract and are only adjusted if there is a significant deterioration. As the assumptions are generally not observable in the market, the determination or adjustment of these assumptions are subject to uncertainty and judgement.
In life and health reinsurance, the provision for outstanding claims is mainly accounted for on the basis of information from the cedant. In primary insurance, the provision for outstanding claims is mainly calculated on the basis of expected claims.
Deferred acquisition costs are amortised over the duration of the contracts. Depending on the type of contract, this is made proportionally to the premium or proportionally to the expected gross profit margins.
An annual liability adequacy test checks at the level of uniformly managed portfolios whether the balance from the aggregate policy reserves and the deferred acquisition costs is appropriate as a whole to satisfy the liabilities incurred. The test is based on expected future gross profit margins, calculated on the basis of current realistic actuarial assumptions, and is dependent on the same assumptions as the provision for future policy benefits. If the liability adequacy test should determine a deficit, acquisition costs will be impaired. If a deficit still remains, the provision for future policy benefits will be increased.
With regard to the technical provisions in life and health business, disclosures in the Notes must be taken into account (especially information about uncertainty of estimates and sensitivities).
Our audit approachIn auditing the provisions in life and health business, we engaged actuaries as part of the audit team. In particular, we carried out the following key audit procedures:
− We assessed the process for setting aside provisions and the valuation of deferred acquisition costs, identified key controls, and tested their design and effectiveness. Our particular focus was on controls to ensure that changes to assumptions were correctly implemented in the systems.
− We assessed the appropriateness of key assumptions by analysing the actuarial methods used to derive those assumptions. We placed particular emphasis on the reasonable and standard compliant use of discount rates.
− We assessed the derivation and appropriateness of interest-rate assumptions used in calculating the provision for future policy benefits or in adequacy tests. For this purpose, we took account of relevant data from the capital markets.
− We compared forecast and actual results of individual operating entities with market developments, thus deriving assessments about the reliability of the estimates.
− We analysed development of the provisions for future policy benefits and deferred acquisition costs compared to the previous year, and made an assessment taking into account current business developments and our expectations from market observations.
− We then assessed whether the accounting policies and methods used in the adequacy test were properly applied. Where market interest rates were used for valuation, we checked the adequacy of discount rates used by making a comparison with inputs observable in the market.
− In German life primary insurance, we independently determined the provision for future policy benefits on the basis of a random selection of tariffs, and compared our results with those of the Company.
− We assessed whether impairment of acquisition costs and reserve increases in the ERGO Life and Health Germany and ERGO International segments triggered by the liability adequacy test were correct.
− We valued provisions for outstanding claims that had been valued using statistical processes in various segments using our own methods, and compared our results with those of the Company.
− We checked whether the disclosures in the Notes correspond with accounting standards, and paid particular attention to whether uncertainty about estimates and sensitivities had been adequately shown.

183
Munich Re Group Annual Report 2018
Independent auditor’s report
Our observationsThe valuation method used for the provision for future policy benefits, the provision for outstanding claims in life and health, and deferred acquisition costs in life and health is appropriate. The valuation assumptions used were derived appropriately. The explanatory notes and disclosures in the Notes to the consolidated financial statements are complete and appropriate.
Valuation of investments
With respect to the accounting policies, we refer to explanations in the Notes to the consolidated financial statements on pages 109–111, and to the explanations about the use of estimates and assumptions on page 99. We also refer to the notes on the valuation hierarchy on pages 126–131, and to the individual instruments on pages 132–136. Information about market risk and credit risk can be found in the combined management report on pages 70–72.
The financial statement riskThe carrying amount of total investments was €216,852m, and the fair value was €231,876m.
The valuation of investments whose fair values are determined on the basis of valuation models or values assessed by third parties is subject to uncertainty. Measurement carried out on the basis of valuation methods that use inputs observable in the market particularly affects non-listed securities, infrastructure loans, other loans and derivatives. The greater the number of input factors used that are not observable in the market but are based on internal estimates, the greater the scope for judgement. Judgement is especially necessary in measuring land and buildings, real estate funds, private equity funds, and investments in affiliated companies and associates. The fair value of investments determined on the basis of valuation models or values assessed by third parties is allocated to valuation categories level 2 and level 3 of the fair value hierarchy of IFRS 13.
Comprehensive disclosures regarding valuation methods and scope of judgement are required to be made in the notes in connection with the valuation of investments.
Our audit approachOur audit of the investments essentially comprised the following procedures:
− We assessed the adequacy of the internal controls set up for the valuation process and are convinced of their effectiveness after carrying out functional tests. Our focus was on controls on use of market inputs and quality assurance.
− For investments measured by means of a valuation model, we assessed the adequacy of the respective model and of the methods used to determine the assumptions and inputs underlying the valuation for a risk-based sample.
− For parts of direct and indirect real estate investments, private equity funds, and risk-based samples of unlisted loans, structured products and derivatives, we checked the fair values determined by Munich Re based on our own valuations or by making comparisons with external information.
− Revaluations for unlisted securities and derivatives were carried out using our own valuation software and inputs derived from market data to compute our own fair values. The comparison with Munich Re’s fair values took account of an expected range that was determined depending on the type of financial instrument involved.
− On the basis of the fair values determined by Munich Re, we have ascertained that the subsequent accounting measurement and the impact on profit or loss are correct. In this context, we have assessed whether write-ups and write-downs were appropriate and whether the result from the fair value measurement and disposals of derivatives was appropriately determined.
− We have reviewed the disclosures in the Notes to the financial statements to determine whether they comply with accounting standards and, in particular, whether the accounting policies are presented appropriately.
Our observationsThe methods used to calculate the fair values of investments are appropriate. The valuation assumptions are reasonable. Subsequent accounting measurements and determination of the impact on profit or loss are appropriate. The explanatory notes and disclosures in the Notes to the consolidated financial statements are complete and appropriate.

184Independent auditor’s report
Other information Management is responsible for the other information. The other information comprises the remaining parts of the annual report, with the exception of the audited consolidated financial statements and combined management report and our auditor’s report.
Our opinions on the consolidated financial statements and on the combined management report do not cover the other information, and consequently we do not express an opinion or any other form of assurance conclusion thereon.
In connection with our audit, our responsibility is to read the other information and, in so doing, to consider whether the other information
− is materially inconsistent with the consolidated financial statements, with the combined management report or our knowledge obtained in the audit, or
− otherwise appears to be materially misstated.
If, based on the work we have performed, we conclude that there is a material misstatement of this other information, we are required to report that fact. We have nothing to report in this regard.
Responsibilities of management and the Supervisory Board for the consolidated financial statements and the combined management reportManagement is responsible for the preparation of the consolidated financial statements that comply, in all material respects, with IFRSs as adopted by the EU and the additional requirements of German commercial law pursuant to Section 315e(1) HGB and that the consolidated financial statements, in compliance with these requirements, give a true and fair view of the assets, liabilities, financial position, and financial performance of the Group. In addition, management is responsible for such internal control as they have determined necessary to enable the preparation of consolidated financial statements that are free from material misstatement, whether due to fraud or error.
In preparing the consolidated financial statements, management is responsible for assessing the Group’s ability to continue as a going concern. They also have the responsibility for disclosing, as applicable, matters related to going concern. In addition, they are responsible for financial reporting based on the going concern basis of accounting unless there is an intention to liquidate the Group or to cease operations, or there is no realistic alternative but to do so.
Furthermore, management is responsible for the preparation of the combined management report that, as a whole, provides an appropriate view of the Group’s position and is, in all material respects, consistent with the consolidated financial statements, complies with German legal requirements, and appropriately presents the opportunities and risks of future development. In addition, management is responsible for such arrangements and measures (systems) as they have considered necessary to enable the preparation of a combined management report that is in accordance with the applicable German legal requirements, and to be able to provide sufficient appropriate evidence for the assertions in the combined management report.
The Supervisory Board is responsible for overseeing the Group’s financial reporting process for the preparation of the consolidated financial statements and of the combined management report.
Auditor’s responsibilities for the audit of the consolidated financial statements and of the combined management reportOur objectives are to obtain reasonable assurance about whether the consolidated financial statements as a whole are free from material misstatement, whether due to fraud or error, and whether the combined management report as a whole provides an appropriate view of the Group’s position and, in all material respects, is consistent with the consolidated financial statements and the knowledge obtained in the audit, complies with the German legal requirements and appropriately presents the opportunities and risks of future development, as well as to issue an auditor’s report that includes our opinions on the consolidated financial statements and on the combined management report.
Reasonable assurance is a high level of assurance, but is not a guarantee that an audit conducted in accordance with Section 317 HGB and the EU Audit Regulation and in compliance with German Generally Accepted Standards for Financial Statement Audits promulgated by the Institut der Wirtschaftsprüfer (IDW) will always detect a material misstatement. Misstatements can arise from fraud or error and are considered material if, individually or in the aggregate, they could reasonably be expected to influence the economic decisions of users taken on the basis of these consolidated financial statements and this combined management report.
We exercise professional judgement and maintain professional scepticism throughout the audit. We also:
− Identify and assess the risks of material misstatement of the consolidated financial statements and of the

185
Munich Re Group Annual Report 2018
Independent auditor’s report
combined management report, whether due to fraud or error; design and perform audit procedures responsive to those risks; and obtain audit evidence that is sufficient and appropriate to provide a basis for our opinions. The risk of not detecting a material misstatement resulting from fraud is higher than for one resulting from error, as fraud may involve collusion, forgery, intentional omissions, misrepresentations, or the override of internal control.
− Obtain an understanding of internal control relevant to the audit of the consolidated financial statements and of arrangements and measures (systems) relevant to the audit of the combined management report in order to design audit procedures that are appropriate in the circumstances, but not for the purpose of expressing an opinion on the effectiveness of these systems.
− Evaluate the appropriateness of accounting policies used by management and the reasonableness of estimates made by management and related disclosures.
− Conclude on the appropriateness of management’s use of the going concern basis of accounting and, based on the audit evidence obtained, whether a material uncertainty exists related to events or conditions that may cast significant doubt on the Group’s ability to continue as a going concern. If we conclude that a material uncertainty exists, we are required to draw attention in the auditor’s report to the related disclosures in the consolidated financial statements and in the combined management report or, if such disclosures are inadequate, to modify our respective opinions. Our conclusions are based on the audit evidence obtained up to the date of our auditor’s report. However, future events or conditions may cause the Group to cease to be able to continue as a going concern.
− Evaluate the overall presentation, structure and content of the consolidated financial statements, including the disclosures, and whether the consolidated financial statements present the underlying transactions and events in a manner that the consolidated financial statements give a true and fair view of the assets, liabilities, financial position and financial performance of the Group in compliance with IFRSs as adopted by the EU and the additional requirements of German commercial law pursuant to Section 315e(1) HGB.
− Obtain sufficient appropriate audit evidence regarding the financial information of the entities or business activities within the Group to express opinions on the consolidated financial statements and on the combined management report. We are responsible for the direction, supervision and performance of the Group audit. We remain solely responsible for our opinions.
− Evaluate the consistency of the combined management report with the consolidated financial statements, its conformity with (German) law, and the view of the Group’s position it provides.
− Perform audit procedures on the prospective information presented by management in the combined management report. On the basis of sufficient appropriate audit evidence we evaluate, in particular, the significant assumptions used by management as a basis for the prospective information, and evaluate the proper derivation of the prospective information from these assumptions. We do not express a separate opinion on the prospective information and on the assumptions used as a basis. There is a substantial unavoidable risk that future events will differ materially from the prospective information.
We communicate with those charged with governance regarding, among other matters, the planned scope and timing of the audit and significant audit findings, including any significant deficiencies in internal control that we identify during our audit.
We also provide those charged with governance with a statement that we have complied with the relevant independence requirements, and communicate with them all relationships and other matters that may reasonably be thought to bear on our independence, and where applicable, the related safeguards.
From the matters communicated with those charged with governance, we determine those matters that were of most significance in the audit of the consolidated financial statements of the current period and are therefore the key audit matters. We describe these matters in our auditor’s report unless law or regulation precludes public disclosure about the matter.

186Independent auditor’s report
Other legal and regulatory requirements
Further information pursuant to Article 10 of the EU Audit RegulationWe were selected as Group auditor by the Supervisory Board on 14 March 2018. We were engaged by the Chair of the Audit Committee of the Supervisory Board on 3 August 2018. We have been the Group auditor of Münchener Rückversicherungs-Gesellschaft Aktien gesellschaft in München, Munich, for more than 25 consecutive years.
We declare that the opinions expressed in this auditor’s report are consistent with the additional report to the Audit Committee pursuant to Article 11 of the EU Audit Regulation (long-form audit report).
German public auditor responsible for the engagementThe German public auditor responsible for the engagement is Dr. Frank Ellenbürger.
Munich, 8 March 2019
KPMG Bayerische Treuhandgesellschaft AktiengesellschaftWirtschaftsprüfungsgesellschaftSteuerberatungsgesellschaft
Dr. Ellenbürger Voß Wirtschaftsprüfer Wirtschaftsprüferin (German Public Auditor) (German Public Auditor)

187
Munich Re Group Annual Report 2018
Responsibility statement
Responsibility statement
“To the best of our knowledge, and in accordance with the applicable reporting principles, the consolidated financial statements give a true and fair view of the assets, liabilities, financial position and profit or loss of the Group, and the combined management report for the Company and the Group includes a fair review of the development and performance of the business and the position of the Group, together with a description of the material opportunities and risks associated with the expected development of the Group.”
Munich, 19 March 2019
Greenhouse gas emissions from paper production for this annual report are offset through Munich Re’s carbon-neutral strategy.
www.munichre.com/geschaeftsbericht2018
www.munichre.com/annualreport2018
188
Munich Re Group Annual Report 2018
© 2019Münchener Rückversicherungs-GesellschaftKöniginstrasse 10780802 MünchenGermanywww.munichre.com
www.twitter.com/munichrewww.munichre.com/facebook
Münchener Rückversicherungs-Gesellschaft (Munich Reinsurance Company) is a reinsurance company organised under the laws of Germany. In some countries, including the United States, Munich Reinsurance Company holds the status of an unauthorised reinsurer. Policies are underwritten by Munich Reinsurance Company or its affiliated insurance and reinsurance subsidiaries. Certain coverages are not available in all jurisdictions.
Any description in this document is for general information purposes only and does not constitute an offer to sell or a solicitation of an offer to buy any product.
Responsible for contentFinancial and Regulatory Reporting
Editorial deadline: 1 March 2019Online publication date: 20 March 2019Print publication date: 3 April 2019
Imprint/Service
Picture creditsAndreas Pohlmann
Printed by Gotteswinter und Aumaier GmbHJoseph-Dollinger-Bogen 2280807 München Germany
The official German original of this report is also available from the Company. In addition, you can find our Annual Report and interim reports, along with further information about Munich Re, on the internet at www.munichre.com.
Service for private investorsAlexander RapplTel.: +49 89 38 91-22 55Fax: +49 89 38 91-45 [email protected]
Service for investors and analystsChristian Becker-HussongTel.: +49 89 38 91-39 10Fax: +49 89 38 91-98 [email protected]
Service for mediaDr. Jörg AllgäuerTel.: +49 89 38 91-8202Fax: +49 89 38 91-35 [email protected]

Quarterly figures
31.12.2018 30.9.2018 30.6.2018 31.3.2018Balance sheetInvestments (incl. insurance-related investments) €m 225,276 226,289 226,918 225,534Equity €m 26,500 27,117 26,899 27,191Net technical provisions €m 208,270 208,098 208,249 206,096Balance sheet total €m 270,168 269,352 268,847 267,399SharesShare price € 190.55 190.75 181.05 188.85Munich Reinsurance Company’s market capitalisation €bn 28.5 28.5 27.1 29.3OtherCombined ratio
Reinsurance property-casualty % 99.4 97.3 95.5 88.6ERGO Property-casualty Germany % 96.0 95.3 95.6 101.7ERGO International % 94.6 94.7 95.4 95.3
Number of staff 41,410 42,159 41,939 42,050
€m Total Q4 2018 Q3 2018 Q2 2018 Q1 2018Gross premiums written 49,064 11,960 12,790 11,188 13,126 1. Earned premiums Gross 48,019 12,634 12,203 11,497 11,685 Ceded –2,284 –657 –655 –541 –431 Net 45,735 11,976 11,548 10,956 11,2542. Income from technical interest 4,747 839 1,255 1,410 1,2423. Expenses for claims and benefits
Gross –36,366 –9,422 –9,208 –9,217 –8,519 Ceded share 1,250 470 351 342 87 Net –35,116 –8,953 –8,857 –8,875 –8,431 4. Operating expenses Gross –13,105 –3,643 –3,245 –3,068 –3,149 Ceded share 518 123 146 146 104 Net –12,587 –3,520 –3,099 –2,922 –3,045 5. Technical result (1– 4) 2,779 343 847 569 1,020 6. Investment result 6,526 1,661 1,311 1,759 1,796 Thereof:
Income from associates accounted for using the equity method 187 91 0 78 187. Insurance-related investment result –685 –653 120 85 –237
8. Other operating income 827 233 245 187 163 9. Other operating expenses –976 –340 –227 –193 –216 10. Deduction of income from technical interest –4,747 –839 –1,255 –1,410 –1,242 11. Non-technical result (6–10) 946 61 193 428 263 12. Operating result 3,725 404 1,040 997 1,283 13. Other non-operating result –672 –56 –272 –151 –194 14. Impairment losses on goodwill –6 0 –6 0 0 15. Net finance costs –196 –49 –45 –50 –51 16. Taxes on income –576 –61 –235 –68 –212 17. Consolidated result 2,275 238 483 728 827 Thereof:
Attributable to Munich Reinsurance Company equity holders 2,310 255 505 724 826Attributable to non-controlling interests –34 –18 –22 5 1
€ Total Q4 2018 Q3 2018 Q2 2018 Q1 2018Earnings per share 15.53 1.74 3.41 4.84 5.49

Important dates 2019 20 March 2019 Balance sheet press conference for 2018 financial statements
30 April 2019 Annual General Meeting
8 May 2019 Quarterly Statement as at 31 March 2019
7 August 2019 Half-Year Financial Report as at 30 June 2019
7 November 2019 Quarterly Statement as at 30 September 2019
Important dates 2020 18 March 2020 Balance sheet press conference for 2019 financial statements
29 April 2020 Annual General Meeting
7 May 2020 Quarterly Statement as at 31 March 2020
6 August 2020 Half-Year Financial Report as at 30 June 2020
5 November 2020 Quarterly Statement as at 30 September 2020
© 2019Münchener Rückversicherungs-GesellschaftKöniginstrasse 107, 80802 München, Germany
Order number 302-09122
Group A
nnual Report 2018M
unich Re