Munich Re Group
88
25 February 2021 Munich Re Group 25 February 2021 1 Please note: Presentation based on 2020 preliminary figures
Transcript of Munich Re Group

25 February 2021
Munich Re Group
25 February 2021
1
Please note: Presentation based on 2020 preliminary figures

03 Additional information
25 February 2021
Agenda
01
02
Munich Re
Group finance and risk
2
Joachim Wenning
Christoph Jurecka

3
Munich Re provides resilience in a challenging yearFinancial highlights 2020
Figures as at 31.12.2020 (31.12.2019). 1 Subject to the approval of the Supervisory Board and the Annual General Meeting.
208% (237%)
Strong capitalisation close to the upper end of our target range
Solvency II ratio
9.801(
Maintaining a high pay-out to our shareholders
Dividend per share
1.2bn (
Adjusted for COVID-19 claims, meeting guidance of
IFRS net income
5.3% (11.7%)
Exceeding cost of equity when adjusted for COVID-19 claims
Return on Equity
25 February 2021

Delivering on our Ambition 20201
Based on good underlying performance
Net income targets achieved1
1 Normalised for COVID-19 claims.
2018 2019 20201
2.3
2.7 2.8
2.32.5
2.8
4
High large losses in 2020
1
P-C RI markets only started selectively firming from 2018 onwards
2
Volatile capital markets in 2020 and declining interest rates since 2018
3
25 February 2021
Improved organisational effectiveness and business impact
Growing Re-insurance and turning around ERGO
Leveraging data and technology to drive automation and disruption
Guidance
Actual
COVID-19 normalisation
Actual in excess of guidance

▪ New climate ambition with science-based, logical, concrete, binding and measurable targets, compatible with Paris Agreement
▪ Scientifically proven path to net-zero carbon emissions until 2050, with clearly defined, traceable interim goals along the way, facilitating the transition from fossil fuels to renewable energy
▪ Net-zero target not abstract promise for distant future, -setting
High large losses in 2020Losses from natural catastrophes on the rise
Nat cats in 2020 once again highlight
25 February 2021 5
US$ 210bn economic losses from nat cats
1
▪ Risk management, underwriting excellence and strong capitalisation remain key to providing nat cat coverage
Record hurricane season brought30 storms, more than ever before
Drought fueled record-breakingwildfires in the US

6
High large losses in 2020COVID-19 pandemic causes severe economic and industry losses
▪ COVID-19 pandemic causes
severe impact on society, economy
and capital markets
▪ Enormous costs arising Munich Re
fulfils its mission by covering claims
and supporting business partners
▪ Strong IT facilitates protection of
employees around 90% work from
any friction
▪ Provisions for COVID-19-related claims in 2020 cautiously assessed and confirmed projection of claims costs for 2021 still holds true1, while high uncertainty remains
▪ ERGO proves particularly resilient, with stable sales production and manageable amount of COVID-19-related claims and business impact
▪ Strong capital position maintained, facilitating dividend continuity and further business growth in a hardening market
▪ Prudent risk management helps us to protect our investment result in a challenging capital market environment
1 Compared to public disclosure as at 1 December 2020. 25 February 2021
COVID-19 on Munich Re
1

7
Continuation of market hardening in P-C reinsuranceOutcome of January renewals fully supports our combined ratio ambition in 2021
Price change
Volumechange
0.80.3
1.8
2018 2019 2020
%
22.0
7.4 7.6
2018 2019 2020
Renewals 2018 2020 January renewals 2021
+2.4%
+10.9%
25 February 2021
Optimistic for April and July renewals
Well-positioned for further business growth
January only 0.0% 1.2%
January only 6.3% 4.4%
2
▪ High loss experience especially
in nat cat, including secondary perils
▪ Low interest rates/
insufficient industry RoE
▪ Claims/social inflation impact long-tail
business
▪ (Alternative) capacity currently rather
stable, disciplined competition
▪ COVID-19 triggers flight to quality
▪ Introduction of contagious disease
exclusions where necessary
Market drivers
8
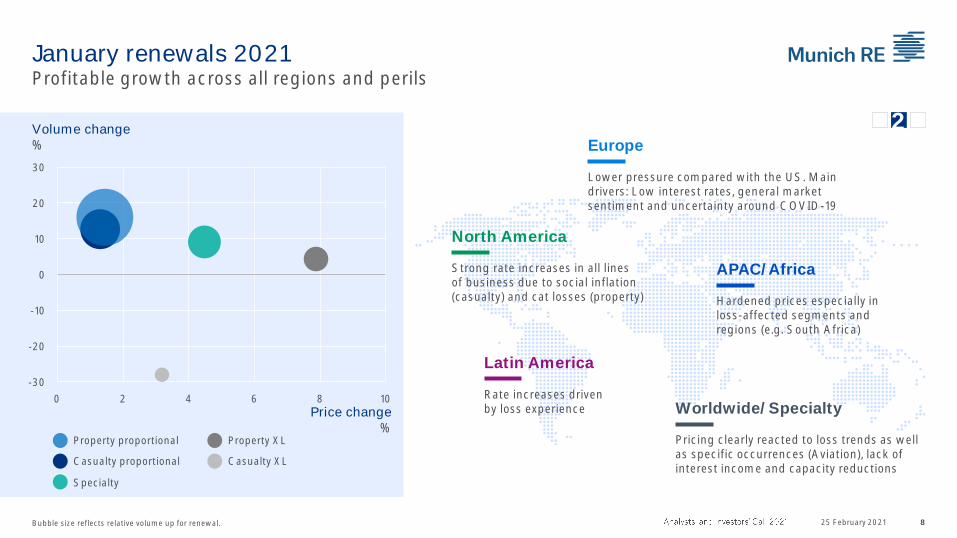
January renewals 2021Profitable growth across all regions and perils
Price change%
Volume change %
North America
Strong rate increases in all lines of business due to social inflation (casualty) and cat losses (property)
Latin America
Rate increases driven by loss experience
Europe
Lower pressure compared with the US. Main drivers: Low interest rates, general market sentiment and uncertainty around COVID-19
APAC/Africa
Hardened prices especially in loss-affected segments and regions (e.g. South Africa)
Worldwide/Specialty
Pricing clearly reacted to loss trends as well as specific occurrences (Aviation), lack of interest income and capacity reductions
Casualty proportional
Specialty
Property proportional Property XL
Casualty XL
Bubble size reflects relative volume up for renewal. 25 February 2021
-30
-20
-10
0
10
20
30
0 2 4 6 8 10
2

Challenging capital market environmentSuccessfully managed increased volatility and persistently low interest rates
Return on investment
2.83.2 3.0
2018 2019 2020
%
-1%
0%
1%
2%
2018 2019 20202018 2019 2020
USAGermany
Low interest rates 10-year governments
Capital market volatilityVDAX
Mitigating yield attrition without increasing risk
Portfolio resilienceand market opportunities
0
50
100
2018 2019 20202018 2019 2020
9
Investment strategy partially counterbalances yield erosion
25 February 2021
3

Superior total shareholder return (TSR)Accelerated earnings/dividend growth to further drive attractive performance
TSR 1.1.2018 31.12.20202
%
1 Subject to the approval of the Supervisory Board and the Annual General Meeting.2 Source: Datastream. Peers: Allianz, Axa, Generali, Hannover Re, Scor, Swiss Re, Zurich.
8.3
8.7
13.4
21.1
53.750.8
40.3
10.2
Peer Peer Peer Peer PeerPeerPeerMunich Re
10
Dividend-per-share (DPS)
1
▪
▪
high large losses and volatile capital markets
▪ Share buy-backs remain a flexible instrument to manage excess capital
25 February 2021
8.6
9.8
2016 2017 2018 2019 2020

Outlook 2021 unchanged to 1 December communicationOn the way to achieving our Group Ambition 2025
ERGO
Group
ReinsuranceGross written premiums
~ 37bn
Net result
~ 2.3bn
Combined ratioP-C
~ 96%2
Technical result, incl. fee income Life and Health
~ 400m
Gross written premiums
~ 17.5bn
Combined ratio
P-C Germany
~ 92%1
International
~ 93%
Net result
~ 0.5bn
Gross written premiums
~ 55bn
Net result
~ 2.8bn
Return on investment
>2.5%
1 ~ 91% without COVID-19 impact. 2 ~ 95% without COVID-19 impact. 1125 February 2021

Munich Re Group Ambition 2025Levers to excel
Create additional business
Monetise digital business investments
Create new strategic options
Expansion of core
Preference for organic growth
Leverage superior underwriting
Uplift asset performance
Shareholders Growing earnings and RoE
ClientsLong-term partner superior
products, experience and capacity
Employees Employer of choice: skill-driven,
fostering digital culture, risk entrepreneurs
CommunitiesComprehensive climate
strategy matching Paris Agreement
SucceedScale
Shape
1225 February 2021

Munich Re Group Ambition 2025Financial targets
1 CAGR compound annual growth rate 2020-
Decarbonisation targets in coal, oil and gas
EPS growth1Improved RoE, 2025 Solvency II ratio in optimal range
DPS growth1,2
5%12 14% 175 220%5%
We will deliver
Succeed
1325 February 2021

Group finance and riskChristoph Jurecka

1525 February 2021
Financial results 2020 Pleasing earnings considering heavy large losses and volatile capital markets
Figures as at 31.12.2020 (31.12.2019). 1 Comprehensive disclosure on economic earnings will be available on 17 March 2021.
IFRS
Capital
Economic
▪ Reinsurance: Dynamic business growth, pleasing underlying performance, COVID-19-related claims of ~
▪ ERGO: Strong net result of
▪ Prudent risk management supports investment result in a very challenging capital market environment (RoI: 3.0%)
1.2bn (
IFRS net income
208% (237%)
Solvency II ratio
3.2bn (
HGB result ▪ Increase in HGB result driven by high investment result (including positive one-offs) and lower tax expenses
▪ Distributable earnings support continuation of attractive capital repatriation
▪ Close to the upper end of target capitalisation
▪ Negative economic earnings1 of ~ -19 claims and adverse capital market effects, incl. FX
▪ Increase in required capital due to business expansion and further decline in interest rates
Group finance and risk

Re-insurance(pre-tax)1
ERGO(after tax)
Claims 57
Other 8
Result impact from lost premiums 15
1625 February 2021
FY 2020 COVID-19-related financial impact2020 provisions marginally increased, largely unchanged expectation for 2021
Reinsurance
▪ FY 2020 COVID-19-related claims increased
marginally2 by -C) and
▪ P-C: 78% of the COVID-19 loss estimates are IBNR
ERGO
▪ Increase in claims (+ 2
▪ Decrease in other areas (
overcompensate for lower investment result)2
Expected COVID-19-related claims in 2021
▪ P-C RI: ~ -tax)
▪ L&H RI: ~ -tax)
▪ ERGO: ~ -100m (after tax) slightly down2
1 Total incurred losses, including paid claims and reserves. 2 Compared with the external outlook presented as of 1 December.
Contingency 1,652
Property/BI 1,001
Life and Health 370
Marine 16
D&O/WC 196
Credit 201
Total
64m
Total
~ 3.4bn
IFRS
Group finance and risk

1725 February 2021
Result Q4 2020 Major drivers
Figures as at Q4 2020 (Q4 2019). 1 Basic losses from prior years, already adjusted for directly corresponding sliding-scale and profit-commission effects.
Reinsurance: 75m ERGO: 136mP-C: Apart from COVID-19 related claims of
L&H: Driven by COVID-19 (and IBNR for disability), negative US experience beyond COVID-19, single large claim in Asia
Very pleasing result above run-rate of FY guidance despite COVID-19 impact
FX losses: 266m
Tax income: 91m212m
(
Net income
P-C RI C/R: 104.2%
Major-loss ratio: 20.2%
Reserve releases1: 4.6%
Normalised C/R: 96.6%
L&H RI
Technical result including fee income:
63m
ERGO P-C
Germany C/R: 92.8%
ERGO International
C/R: 93.0%
1m(
Technical result
Return on investment
3.3%
Derivative losses from hedging overcompensated for by disposal gains (incl. ZZR funding)
Reinvestment yield largely stable vs. Q3 at 1.3%2,090m(
Investment result
IFRS
Group finance and risk

25 February 2021
RoE in 2020
2 Average of end-of-year figures.
23.1bn Equity 31.12.20191
+ 1.2bn Net result 2020
1.7bn Dividend/share buy-back in 2020
0.3bn Other
22.3bn Equity 31.12.20201
18
Net result Equity1,2 RoE
Group RoE of ~12% adjusted for COVID-19
Group1.2bn 22.7bn 5.3%/ =
ERGO0.5bn 5.9bn 8.8%/ =
Reinsurance0.7bn 16.8bn 4.1%/ =
IFRS
Group finance and risk

1925 February 2021
Group investment resultResilient performance given volatile capital markets
▪ Attrition of running yield
following sharp decline in
interest rates and portfolio
derisking slowdown to
~10 bps expected from
2021 onwards
▪ Successfully managed
capital market volatility
with well-diversified
investment portfolio
and effective hedging
▪ Disposal gains mainly
driven by tactical asset
allocation and ZZR
financing
2.5 0.8
1.5 0.0 0.3 3.0
Regular income
Write-ups/write-downs
Disposalgains and losse
Derivatives Other income/expenses
Investmentresult
2.8 0.1
1.1 0.30.3 3.2
Regular income
Write-ups/write-downs
Disposalgains and losse
Derivatives Other income/expenses
Investmentresult
2020%
2019%
IFRS
Group finance and risk

2025 February 2021
ERGO IFRS key financials 2020ERGO Strategy Programme successfully concluded
P-C Germany International
92.3 92.4
2019 2020
94.3 92.7
2019 2020
Combined ratio%
Combined ratio%
Figures as at 31.12.2020 (31.12.2019). 1 Merger of HDFC ERGO General Insurance and HDFC ERGO Health Insurance.
ERGO L&H Germany
3.7bn (Strong growth driven by increase in commercial and retail lines
4.9bn (Stable premium development despite portfolio streamlining, run-down in Belgium and COVID-19
GWP 17.6bn ( 9.0bn (COVID-19 driven decrease in Travel, growth in Life and Health new book compensates for ordinary back-book attrition
Return on investment%
130m (Decrease driven by Health and Travel due to COVID-19, good result in Life
157m (Strong operating performance, COVID-19 impact mitigated by lower amount of large losses
230m (Improved operating performance and positive accounting effect from merger in India1 prior year impacted by
portfolio streamlining
Net result 517m (
Return on equity
7.4%8.8%
2019 2020
3.1 2.8
2019 2020
+1.4pp. 0.3pp. +0.1pp. 1.5pp.
IFRS
Group finance and risk

21
Net profit ERGO Group
41
20172016 2018 2019 2020
273
412 440517
30
91
174
234
299
2016 2017 20192018 2020
Cost savings1
cumulative,
Combined ratioP-C Germany%
Combined ratio International%
ERGO Strategy Programme (ESP) 2016 2020Main KPIs show success of ESP
+476
25 February 2021
Group finance and risk
97.0 97.596.0
92.3 92.4
2016 2017 2018 2019 2020
98.095.3 94.6 94.3 92.7
2016 2017 2018 2019 2020
4.6 pp.
5.3 pp.
1 After policyholder participation and tax.

Reinsurance IFRS key financials 2020Strong organic growth, high COVID-19-related losses
Reinsurance P-C Reinsurance L&H Reinsurance
GWP 37.3bn ( 24.6bn (Strong organic growth in almost all lines of business, taking advantage of hardening markets and new business opportunities
12.7bn (Growth across all core markets, in particular Continental Europe and Asia
100.2105.6
2019 2020
Combined ratio%
Net result
571m (COVID-19 losses of ~the combined ratio, below-average nat cat losses normalised combined ratio improved
123m (Dominated by COVID-19 mortality claims (incl. IBNR for disability) and excess mortality beyond COVID-19 in the US pleasing new business and fee income
694m (
25 February 2021 22
493
97
2019 2020
Technical result incl. fee incomeReturn on equity
Normalised C/R%
98.6 96.9
2019 2020
13.3
4.1
2019 2020
Figures as at 31.12.2020 (31.12.2019).
9.1pp. +5.4pp. 1.7pp. 80.3%
IFRS
Group finance and risk

2325 February 2021
Risk SolutionsStrong organic growth, increased profitability
IFRS
Group finance and risk
▪ Strong organic growth across all units, taking advantage of profitable business opportunities in a hardening market
▪ MR Specialty Insurance: Succeeding growth strategy with excellent opportunities
▪ Facultative & Corporate Direct: Strong growth particularly in property/engineering and energy
▪ Munich Re Syndicate: Better market conditions and diversification in new specialty lines supporting sustainable growth path
▪ Improved profitability despite elevated nat cat experience for US Risk Solutions carriers (very active hurricane, tornado and wildfire season)
▪ Normalised for large losses, combined ratio in line with mid-nineties ambition
▪ Hartford Steam Boiler: Commercial book continues to drive pleasing performance
▪ Facultative & Corporate Direct: Benign man-made losses and favourable market conditions
▪ Aerospace: Low outlier events
100.7 96.8
2019 2020
5.06.1
2019 2020
+22%
Gross written premiums
Combined ratio
3.9pp.

2425 February 2021
Unchanged reserve prudency Protect balance sheet against negative surprises
Group finance and risk
IFRS
1 Property-casualty reinsurance, in % of net earned premiums, basic losses after sliding scale commissions.
Managing industry hot spots Munich Re impact
5.55.2
4.6
5.6
4.2%
2016 2017 2018 2019 2020
Ongoing reserve releases1
Again, significant reserve releases,
which more than offset adverse
development in selected hot spot areas
US liabilityHigh litigation risk and increasing social-inflation trends
Continuation of adverse loss trends in selected portfolios; pro-active strengthening of reserves to ensure unchanged high prudence level
COVID-19Loss complex affects multiple lines with challenging loss assessment in a situation where pandemic is still evolving
Thorough claims assessment; solid reserve position with 78% IBNR; uncertainties remain to be high
AsbestosComplex litigation, changes in legal and regulatory environment
Derisking with large claims settlements in the past and further increased survival ratio in 2020 at a very strong level

25
Solvency II ratio Sound capitalisation continues to support our capital management strategy
1 Parallel shift until last liquid point, extrapolation to unchanged UFR. 2 Based on 200-year event. 25 February 2021
2016 2017 2018 2019 2020 Q4 2020 vs. Q3 (SII ratio: 216%)
EOF 40.7 35.1 36.0 41.5 39.9bn ▪ Positive operating economic earnings despite COVID-19 offset by SCR increase, including January renewals
▪ Impact from market variances largely neutral muted participation in rising equity markets (derisking in early 2020) and reduced VA
▪ Proposed dividend of ~ 7%-pp.)SCR 15.3 14.4 14.7 17.5 19.2bn
267
244 245237
208219 216
194 199 196 202185
Interest rates+/-50bps
Equity markets+/-30%
Spread GOV +50bps
Spread CORP +50bps
Atlantic Hurricane
SII sensitivities%
1 1 2
Development of Solvency II ratio%
175
220
Optimal range
Economic
Group finance and risk

2625 February 2021
SCR development Balanced risk profile between insurance and investment risks maintained
17.5
19.2
2019 2020
Total SCR(incl. diversification)
+1.6
SCR increase largely driven by business growth, low interest rates and volatile capital marketsbn
Property-casualty Life and HealthInsurancerisks
4.25.2
2019 2020
10.1 10.7
2019 2020
▪ Global decline in interest rates
and volatile capital markets
drive increase in market and
credit risk
Market
+0.7
Credit
+1.0Investmentrisks
▪ P-C: Substantial growth in
Reinsurance (esp. nat cat)
▪ L&H: Growth in Reinsurance
and effect of lower interest
rates, slightly offset by
depreciation of US$
8.8 9.4
2019 2020
+0.6 6.4 7.0
2019 2020
+0.6
Economic
Group finance and risk

Average 2011 2020
3.0 1.4
0.3
3.2 0.1 4.3
Distributableearnings
31.12.2019
Dividend Sharebuy-back
HGB result2020
Other Distributableearnings
31.12.2020
9.3
10.0
2019 2020
27
German GAAP (HGB) result 2020 supported by one-offsCapital repatriation well-funded
Equalisation provision
HGB result 20191.5
Underwriting result
0.6
Investment result +1.8
Other +0.5
HGB result 2020 3.2
2
1 Buy-back programme 2019/20. 2 Changes in restrictions on distribution.
+0.8
25 February 2021
bn
bn
1.3 0.7 2.3 3.5
Capital
Group finance and risk
1

Additional information

Reinsurance
L/H1
ReinsuranceP-C
ERGO L/H Germany
ERGO P-C Germany
ERGO International
TotalQ4 2020
Gross written premiums 3,169 6,136 2,312 735 1,278 13,629Net earned premiums 2,886 5,898 2,323 935 1,193 13,235
Income from technical interest 165 270 1,174 17 194 1,819
Net expenses for claims and benefits 2,637 4,233 3,132 612 1,011 11,625
Net operating expenses 523 1,925 338 282 363 3,431
Technical result 109 10 26 57 13 1Investment result 207 513 1,152 53 165 2,090
Insurance-related investment result 36 3 300 0 146 479
Other operating result 19 72 131 42 41 267
Deduction of income from technical interest 165 270 1,174 17 194 1,819
Non-technical result 96 169 147 6 76 482
Operating result 13 179 173 52 89 481Other non-operating result 0 1 16 16 1 34
Currency result 41 164 70 7 1 266
Net finance costs 11 34 6 1 7 59
Taxes on income 34 126 50 4 15 91
Net result 30 105 31 38 68 212Tax rate 53.4% 607.7% 61.9% 9.6% 18.3% 75.2%
Segment income statement Q4 2020
Additional information: Group finance and risk
1 Technical result, incl. fee income: 25 February 2021 29

Segment income statement 2020
Additional information: Group finance and risk
Reinsurance
L/H1
ReinsuranceP-C
ERGO L/H Germany
ERGO P-C Germany
ERGO International
Total2020
Gross written premiums 12,707 24,615 9,030 3,677 4,861 54,890Net earned premiums 11,461 22,566 9,066 3,570 4,560 51,223
Income from technical interest 666 1,107 3,180 68 249 5,270
Net expenses for claims and benefits 10,128 16,866 10,511 2,254 3,318 43,077
Net operating expenses 2,077 6,978 1,382 1,089 1,289 12,815
Technical result 78 171 353 294 202 600Investment result 846 2,347 3,605 175 425 7,398
Insurance-related investment result 69 45 24 0 57 105
Other operating result 53 263 354 147 137 848
Deduction of income from technical interest 666 1,107 3,180 68 249 5,270
Non-technical result 303 931 95 39 96 1,386
Operating result 225 759 448 255 298 1,986Other non-operating result 1 11 48 28 4 83
Currency result 46 6 161 1 2 200
Net finance costs 40 128 22 6 27 223
Taxes on income 16 55 86 64 48 269
Net result 123 571 130 157 230 1,211Tax rate 11.8% 8.8% 39.7% 29.0% 17.2% 18.2%
1 Technical result, incl. fee income: 25 February 2021 30

Capital position
Additional information: Group finance and risk
Equity
Subordinated debt
Senior and other debt
Equity
Capitalisation
1 Strategic debt (senior, subordinated and other debt) divided by total capital (strategic debt + equity).
Debt leverage1 (%)
Equity 31.12.2019 30,576 Change in Q4
Consolidated result 1,211 212
Changes
Dividend 1,373 0
Unrealised gains/losses 1,654 496
Exchange rates 1,392 461
Share buy-backs 359 0
Other 321 108
Equity 31.12.2020 29,994 353
Unrealised gains/losses Exchange rates
Fixed-interest securities
2020: 2,121m Q4: 235m
Non-fixed-interest securities
2020: 495m Q4: 248m
Devaluation of various currencies,
mainly USD
25 February 2021 31
28.2 26.5 30.6 29.6 30.0
2.8 3.7
3.8 5.0 5.00.3 0.3
0.3 0.3 0.3
10.0
13.212.0
15.1 15.1
2017 2018 2019 30.9.2020 31.12.2020

Premium development
Additional information: Group finance and risk
2019 51,457
Foreign exchange
620
Divestments/investments
103
Organic change
4,157
2020 54,890
Gross written premiums Segmental breakdown
ERGO Property-casualty Germany 3,677 (7%) (p 5.1%)
ERGO Life and Health Germany 9,030 (16%) (p 2.3%)
ERGO International 4,861 (9%) (p 1.0%)
Reinsurance Property-casualty 24,615 (45%) (p 11.4%)
Reinsurance Life and Health 12,707 (23%) (p 8.5%)
Total
54.9bn
25 February 2021 32

33
Very strong reserve position Actual basic losses continue to be consistently below actuarial expectations
1 Reinsurance group losses as at Q4 2020, not including parts of Risk Solutions, special liabilities and major losses (i. e. events of over 25 February 2021
Additional information: Group finance and risk
Reinsurance group Comparison of incremental expected losses with actual reported losses1
Legend: Green actuals below expectation Red actuals above expectation Solid line actuals equal expectation Dotted line actuals 50% above/below expectations
By exposure year By line of business
Actuals below expectation for all exposure years overall picture consistent with previous years
Also on a line-of-business view all actuals are below expectations
2019
2018
2017
2016
2015
20142013
2012 and prior
100
1,000
10,000
100 1,000 10,000
Expected reported loss
Actual reported loss
Aviation
Credit
Engineering
Fire
Marine
Motor
Personal accident
Risks other propertyThird-party liability
100
1,000
10,000
100 1,000 10,000
Expected reported loss
Actual reported loss

Accident year (AY)
2011 2012 2013 2014 2015 2016 2017 2018 2019 2020 Total
31.12.2010 52,015
31.12.2011 51,373 16,847
31.12.2012 50,174 16,950 13,845
31.12.2013 49,777 16,688 13,604 13,739
31.12.2014 48,890 16,305 13,423 13,935 13,646
31.12.2015 47,804 16,176 13,228 13,905 13,673 12,927
31.12.2016 47,257 15,725 13,194 13,629 13,667 12,977 13,791
31.12.2017 46,964 15,703 13,094 13,560 13,462 12,780 13,642 16,696
31.12.2018 46,130 15,427 12,847 13,277 13,211 12,572 13,689 16,710 16,979
31.12.2019 44,974 15,169 12,627 13,129 13,029 12,429 13,515 16,598 17,800 17,936
31.12.2020 44,265 15,019 12,440 12,773 12,821 12,318 13,174 16,523 18,155 18,421 21,022
CY 2020 run-off change
708 150 187 356 208 111 341 74 355 484 1,295CY 2020 run-off change (%)
1.6 1.0 1.5 2.7 1.6 0.9 2.6 0.4 2.0 2.6 0.7
34
Positive run-off result despite reserve strengthening in selected portfolios without weakening resilience against future volatility
Ultimate losses1 Favourable actual vs. expected comparison facilitates ultimate reductions for prior years
▪ Again very favourable overall run-off, in particular for basic losses
▪ Negative run-off in AYs 2018 and 2019 impacted by cautious positioning in US liability as a reaction to ongoing social inflation trends
▪ 2019 run-off includes COVID-19 related losses for ERGO where a strict AY separation is not feasible; without COVID-19 impact ERGO run-off positive
▪ Reserve position remains strong
Reinsurance2 1,338m
ERGO 43m
1 Basic and major losses; accident-year split partly based on approximations. Adjusted to exchange rates as at 31.12.2020. 2 Basic losses:
25 February 2021
Additional information: Group finance and risk

Property
35
Response to benign emergence of basic losses in line with considered judgement
Actual vs. expected Business rationaleChanges in projection
Favourable loss development leads to releases▪ Favourable indications across all lines▪ Short-tail lines develop relatively quickly▪ Releases spread across various property lines of business
Small overall release despite favourable indications▪ Deliberately small reserve release, despite favourable overall
actual-versus-expected development▪ Releases in motor and third-party liability▪ Cautious reaction to ongoing social inflation trends in selected
casualty portfolios
Releases follow favourable indications▪ Positive actual-versus-expected indications across all lines▪ Reserve release primarily in marine▪ Cautious reaction to favourable indications in aviation and credit
1 Aviation, credit and marine.
Additional information: Group finance and risk Reserves Property-casualty Reinsurance
25 February 2021
Specialty1
Casualty
Reserve release
Reserve release
Reserve release

36
Property-casualty provision for outstanding claims
Additional information: Group finance and risk Non-life reinsurance reserves
25 February 2021
By line of business
Credit 3 (3)
Other 8 (6)
Third-party liability 37 (37)
Fire 16 (17)
Engineering 5 (6)
Personal accident 4 (4)
Marine 3 (3)
Total
51.4bn
Motor 21 (22)
Aviation 2 (3)
%
Fair values (gross) as at 31.12.2020 (31.12.2019).
By maturity
5 10 years 13 (12)
>15 years 4 (4)
0 1 years 34 (35)
10 15 years 3 (3)
%
1 2 years 19 (20)
2 3 years 12 (12)
3 4 years 8 (8)
4 5 years 6 (5)
Total
51.4bn

37
Asbestos and environmental survival ratioMunich Re
Additional information: Group finance and risk Reserves
25 February 2021
Net definitive as at 31 December 20201
Asbestos Environmental A&E total
Paid 3,093 929 4,022
Case reserves 407 127 534
IBNR 534 187 721
Total reserves 941 314 1,255
3-year average annual paid losses 45 13 59
Survival ratio 3-year average 20.8 23.8 21.4
1 Non-euro currencies converted at rate of exchange year-end 2020

38
Investment result
Additional information: Group finance and risk Investments
3-month reinvestment yield
Q4 2020 1.3%
Q3 2020
1.3%
Q2 2020
1.6%
Q4 2020Write-ups/
write-downsDisposal
gains/losses Derivatives
Fixed income 2 802 46
Equities 79 526 503
Commodities/Inflation 2 0 15
Other 46 161 22
2020Write-ups/
write-downsDisposal
gains/losses Derivatives
Fixed income 20 2,160 559
Equities 1,750 1,077 425
Commodities/Inflation 37 0 53
Other 224 462 113
Q4 2020 Return1 2020 Return1 2019 Return1
Regular income 1,472 2.3% 6,273 2.5% 6,751 2.8%
Write-ups/write-downs 125 0.2% 1,957 0.8% 309 0.1%
Disposal gains/losses 1,488 2.4% 3,698 1.5% 2,779 1.1%
Derivatives2 555 0.9% 74 0.0% 717 0.3%
Other income/expenses 190 0.3% 690 0.3% 681 0.3%
Investment result 2,090 3.3% 7,398 3.0% 7,822 3.2%
Total return 5.3% 4.6% 7.8%
1 Annualised return on quarterly weighted investments (market values) in %. 2 Result from derivatives without regular income and other income/expenses. 25 February 2021
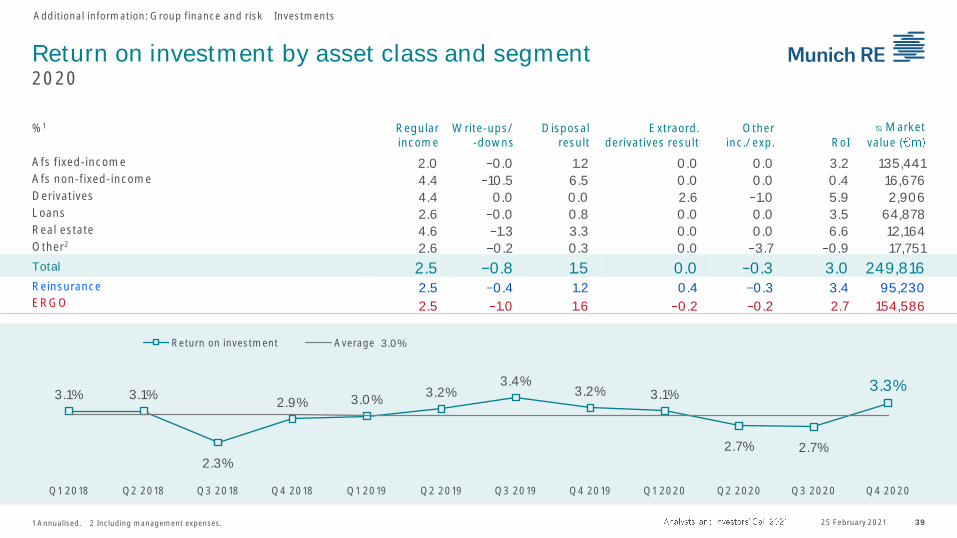
Return on investment by asset class and segment2020
Additional information: Group finance and risk Investments
1 Annualised. 2 Including management expenses. 25 February 2021 39
%1 Regular income
Write-ups/-downs
Disposal result
Extraord. derivatives result
Other inc./exp. RoI
ᴓ Market
value (
Afs fixed-income 2.0 0.0 1.2 0.0 0.0 3.2 135,441Afs non-fixed-income 4.4 10.5 6.5 0.0 0.0 0.4 16,676Derivatives 4.4 0.0 0.0 2.6 1.0 5.9 2,906Loans 2.6 0.0 0.8 0.0 0.0 3.5 64,878Real estate 4.6 1.3 3.3 0.0 0.0 6.6 12,164Other2 2.6 0.2 0.3 0.0 3.7 0.9 17,751
Total 2.5 0.8 1.5 0.0 0.3 3.0 249,816Reinsurance 2.5 0.4 1.2 0.4 0.3 3.4 95,230ERGO 2.5 1.0 1.6 0.2 0.2 2.7 154,586
3.1% 3.1%
2.3%
2.9% 3.0%3.2%
3.4%3.2% 3.1%
2.7% 2.7%
3.3%
3.0%
Q1 2018 Q2 2018 Q3 2018 Q4 2018 Q1 2019 Q2 2019 Q3 2019 Q4 2019 Q1 2020 Q2 2020 Q3 2020 Q4 2020
Return on investment Average

Investment portfolio
Additional information: Group finance and risk Investments
25 February 2021 401 Approximation not fully comparable with IFRS figures. Fair values as at 31.12.2020 (31.12.2019). 2 Incl. derivatives: 6.0 (6.4%). 3 Deposits retained on assumed reinsurance, deposits with banks, investment funds (excl. equities), derivatives and investments in renewable energies and gold. 4 Non-fixed derivatives. 5 Non-fixed property funds and non-fixed bond funds
Investment portfolio
Total
253bn
Miscellaneous3 7.9 (8.1)
Land and buildings 4.8 (4.7)
Shares, equity funds and participating interests2 6.4 (7.1)
%
Fixed-interest securities 55.3 (53.9)
Loans 25.6 (26.1)
Fixed-interest securities1 (%) 31.12.2020 31.12.2019
Governments/semi-governments 64 63
Pfandbriefe/covered bonds 10 13
Cash/other 1 1
Corporates 19 18
Banks 3 2
Structured products 4 4
Loans1
Governments/semi-governments 43 41
Pfandbriefe/covered bonds 38 41
Loans to policyholders/mortgage loans 13 13
Corporates 5 4
Banks 1 1
Miscellaneous
Deposits on reinsurance 40 40
Bank deposits 17 19
Investment funds5 10 11
Derivatives4 7 6
Other 26 25

Fixed-income portfolioTotal
Additional information: Group finance and risk Investments
Approximation not fully comparable with IFRS figures. Fair values as at 31.12.2020 (31.12.2019).
Fixed-income portfolio%
Structured products 2 (2)
Loans to policyholders/mortgage loans 4 (4)Governments/semi-governments 55 (53)
Pfandbriefe/covered bonds 18 (21)
Cash/other 5 (5)
Bank bonds 2 (1)Corporates 14 (13)
Total
215bn
25 February 2021 41

Fixed-income portfolioTotal
Additional information: Group finance and risk Investments
25 February 2021 42Approximation not fully comparable with IFRS figures. Fair values as at 31.12.2020 (31.12.2019).1 Mainly loans to policyholders, mortgage loans and bank deposits.
Rating structure
Maturity structure
Regional breakdownWithout With Total
policyholder participation
policyholder participation
31.12.2020 31.12.2019
Germany 4.5 21.4 25.9 26.8
US 14.0 1.7 15.7 15.6
France 2.1 5.1 7.2 7.3
Canada 4.2 0.7 4.9 4.7
UK 2.6 2.0 4.6 5.1
Netherlands 1.5 3.0 4.5 4.3
Supranationals 0.7 2.9 3.7 3.6
Australia 3.1 0.4 3.5 3.1
Spain 0.8 2.1 2.8 3.1
Austria 0.5 2.1 2.6 2.6
Belgium 0.7 1.8 2.5 2.4
Ireland 0.8 1.6 2.4 2.2
Poland 1.3 0.4 1.8 1.8
Luxembourg 0.4 1.0 1.5 1.3
Italy 0.6 0.7 1.3 1.3
Other 6.9 8.3 15.2 14.7
Total 44.6 55.4 100.0 100.0
%%
%
Averagematurity
9.7 years
7 10 years 13 (15)
>10 years 35 (34)
n.a. 3 (3)
0 1 years 9 (9)
1 3 years 13 (13)
3 5 years 14 (13)
5 7 years 12 (13)
Total
214.6bn A 12 (13) NR1 5 (5)
BB 3 (3)
BBB 13 (12)
AAA 41 (43)
AA 24 (24) <BB 1 (0)
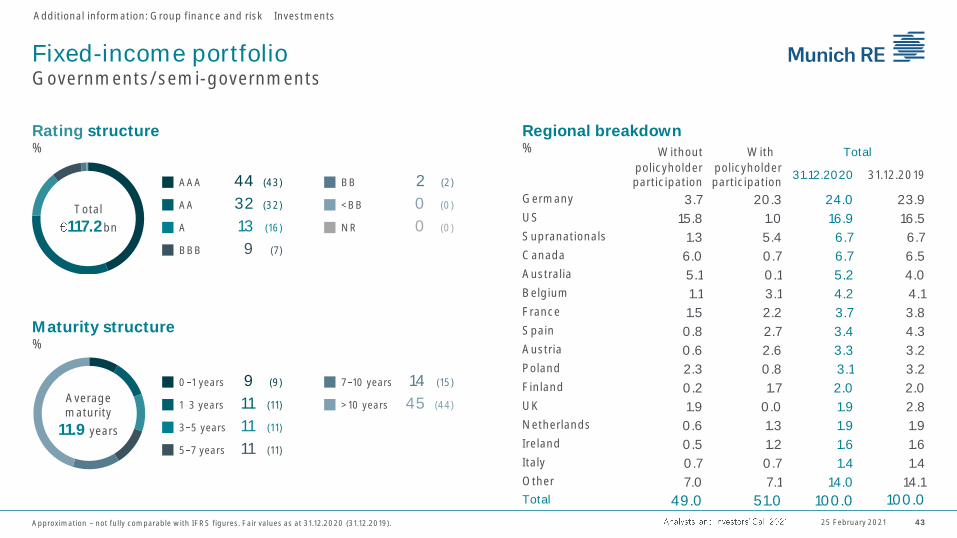
Fixed-income portfolioGovernments/semi-governments
Additional information: Group finance and risk Investments
Approximation not fully comparable with IFRS figures. Fair values as at 31.12.2020 (31.12.2019). 25 February 2021 43
Without With Total
policyholder participation
policyholder participation
31.12.2020 31.12.2019
Germany 3.7 20.3 24.0 23.9
US 15.8 1.0 16.9 16.5
Supranationals 1.3 5.4 6.7 6.7
Canada 6.0 0.7 6.7 6.5
Australia 5.1 0.1 5.2 4.0
Belgium 1.1 3.1 4.2 4.1
France 1.5 2.2 3.7 3.8
Spain 0.8 2.7 3.4 4.3
Austria 0.6 2.6 3.3 3.2
Poland 2.3 0.8 3.1 3.2
Finland 0.2 1.7 2.0 2.0
UK 1.9 0.0 1.9 2.8
Netherlands 0.6 1.3 1.9 1.9
Ireland 0.5 1.2 1.6 1.6
Italy 0.7 0.7 1.4 1.4
Other 7.0 7.1 14.0 14.1
Total 49.0 51.0 100.0 100.0
7 10 years 14 (15)
>10 years 45 (44)Averagematurity
11.9 years
0 1 years 9 (9)
1 3 years 11 (11)
3 5 years 11 (11)
5 7 years 11 (11)
Rating structure
Maturity structure
Regional breakdown%
BB 2 (2)
BBB 9 (7)
A 13 (16)
AA 32 (32)Total
117.2bn
AAA 44 (43)
<BB 0 (0)
NR 0 (0)
%
%

Fixed-income portfolioPfandbriefe/covered bonds
Additional information: Group finance and risk Investments
Approximation not fully comparable with IFRS figures. Fair values as at 31.12.2020 (31.12.2019). 25 February 2021 44
%Cover pools
Total
39.0bn
Mortgage 61 (61)
Public 29 (29)
Mixed and other 10 (10)
31.12.2020 31.12.2019
Germany 32.2 35.4France 20.9 19.5UK 10.2 9.8Netherlands 8.3 8.4Sweden 5.8 5.9Norway 5.7 5.4Spain 1.9 1.8Italy 1.1 1.1Ireland 0.3 0.3Other 13.5 12.5
Total
39.0bn
NR 1 (1)
BBB 1 (0)
A 2 (2)
AA 22 (20)
Averagematurity
6.2 years
AAA 75 (77)
0 1 years 8 (5)
1 3 years 16 (15)
3 5 years 20 (17)
5 7 years 18 (20)
7 10 years 20 (21)
>10 years 19 (21)
Rating structure
Maturity structure
Regional breakdown%%
%

Fixed-income portfolioCorporate bonds (excluding bank bonds)
Additional information: Group finance and risk Investments
Approximation not fully comparable with IFRS figures. Fair values as at 31.12.2020 (31.12.2019). 25 February 2021 45
Total
29.1bn NR 1 (0)
<BB 3 (2)
BB 17 (11)
BBB 54 (61)
Averagematurity
7.6 years
>10 years 26 (24)
7 10 years 12 (12)
5 7 years 17 (15)
A 19 (19)
AA 5 (5)
AAA 2 (2)
3 5 years 20 (20)
1 3 years 18 (19)
0 1 years 8 (10)
31.12.2020 31.12.2019
Utilities 13.9 13.6
Industrial goods and services 12.9 14.2
Financial services 11.8 9.6
Oil and gas 11.2 10.9
Telecommunications 8.5 8.0
Healthcare 6.9 7.5
Technology 5.8 6.0
Automobiles 5.3 3.9
Food and beverages 4.0 4.0
Personal and household goods 3.0 3.1
Media 3.0 3.6
Construction 2.9 2.8
Basic resources 2.5 3.5
Other 8.3 9.2
Sector breakdown%
Rating structure
Maturity structure
%
%

Fixed-income portfolioStructured products
Additional information: Group finance and risk Investments
Structured products portfolio (at market values): Breakdown by rating and region
1 Consumer loans, auto, credit cards, student loans. 2 Asset-backed CPs, business and corporate loans, commercial equipment. Approximation not fully comparable with IFRS figures. Fair values as at 31.12.2020 (31.12.2019).
25 February 2021 46
Rating Region
TotalMarket-
to-parAAA AA A BBB <BBB NR USA + RoW Europe
ABS Consumer-related ABS1 207 152 65 0 0 0 314 110 424 101%
Corporate-related ABS2 63 25 414 61 0 0 100 463 563 100%
Subprime HEL 0 1 0 0 0 0 1 0 1 100%
CDO/ CLN
Subprime-related 0 0 0 0 0 0 0 0 0 0%
Non-subprime-related 870 1,628 31 1 0 0 634 1,895 2,530 100%
MBS Agency 846 20 0 0 0 0 866 0 866 108%
Non-agency prime 14 13 0 0 0 0 1 26 27 100%
Non-agency other (not subprime) 230 20 0 0 0 0 11 239 251 100%
Commercial MBS 528 51 44 0 0 5 536 93 628 107%
Total 31.12.2020 2,759 1,909 554 63 0 5 2,463 2,826 5,289 102%
In % 52% 36% 10% 1% 0% 0% 47% 53% 100%
Total 31.12.2019 2,876 1,527 303 58 0 9 2,870 1,904 4,774 101%

Fixed-income portfolioBank bonds
Additional information: Group finance and risk Investments
1 Classified as Tier 1 and upper Tier 2 capital for Solvency purposes. 2 Classified as lower Tier 2 and Tier 3 capital for Solvency purposes. Approximation not fully comparable with IFRS figures. Fair values as at 31.12.2020 (31.12.2019).
25 February 2021 47
Total
4.3bn NR 1 (1)
<BB 0 (0)
BB 4 (4)
BBB 28 (38)
Averagematurity
3.6 years
>10 years 4 (2)
7 10 years 3 (7)
5 7 years 10 (8)
A 50 (38)
AA 16 (17)
AAA 1 (1)
3 5 years 33 (30)
1 3 years 37 (40)
0 1 years 13 (13)
TotalSenior bonds
Sub-ordinated
Loss-bearing 31.12.2020 31.12.2019
US 26.6 4.7 0.3 31.6 35.4UK 10.4 0.7 0.3 11.4 7.2Canada 8.9 0.0 0.0 8.9 11.4Germany 6.8 0.1 1.5 8.4 10.2Ireland 6.4 0.0 0.0 6.4 8.8France 5.5 0.7 0.0 6.2 5.0Netherlands 4.7 0.1 0.0 4.7 2.6Japan 2.1 0.0 0.0 2.1 0.2Switzerland 2.0 0.0 0.0 2.0 1.3Other 17.5 0.8 0.0 18.3 17.9
Total
4.3bn
Senior 91 (82)
Subordinated2 7 (12)
Loss-bearing1 2 (6)
%Cover pools
Rating structure
Maturity structure
%
%
Regional breakdown%

Sensitivities to interest rates, spreads and equities1
1 Rough calculation with limited reliability assuming unchanged portfolio as at 31.12.2020. After rough estimation of policyholder participation and deferred tax; linearity of relations cannot be assumed. Approximation not fully comparable with IFRS figures. 2 Sensitivities to changes of spreads are calculated for every category of fixed income portfolio, except government securities with AAA ratings. 3 Sensitivities to change in share prices are calculated for listed shares only; assumptions: equity impairments as soon as market value drops below acquisition cost and best-estimate calculation of hedging impact.
Sensitivity to risk-free interest in (change in basis points) 50bps 25bps +50bps +100bps
Change in market value, gross +9.9 +4.8 8.9 16.8Change in on-balance-sheet reserves, net +2.6 +1.3 2.4 4.6Change in off-balance-sheet reserves, net +0.5 +0.2 0.4 0.8P&L (investment result), gross +0.3 +0.2 0.3 0.6P&L, net +0.1 +0.1 0.1 0.3
Sensitivity to spreads2 in (change in basis points) +50bps +100bps
Change in market value, gross 6.2 11.7Change in on-balance-sheet reserves, net 1.5 2.8Change in off-balance-sheet reserves, net 0.3 0.6P&L (investment result), gross 0.2 0.4P&L, net 0.1 0.2
Sensitivity to share prices3 in (change in %) 30% 10% +10% +30%
Change in market value, gross 2.3 0.9 +1.0 +3.0Change in on-balance-sheet reserves, net 0.7 0.3 +0.4 +1.2P&L (investment result), gross 1.0 0.4 0.0 +0.0P&L, net 0.5 0.1 +0.0 +0.1
Additional information: Group finance and risk Investments
25 February 2021 48

On- and off-balance-sheet reserves
Additional information: Group finance and risk Investments
1 Unrealised gains/losses from unconsolidated affiliated companies, valuation at equity and cash-flow hedging. 2 Excluding reserves from owner-occupied property. 3 Excluding insurance-related loans.
31.12.2018
31.12.2019
30.9.2020
31.12.2020
p
in Q4
Market value of investments 231,876 247,310 251,928 252,789 861
Total reserves 22,002 33,120 36,040 37,269 1,229
On-balance-sheet reserves
Fixed-interest securities 4,953 10,738 13,867 14,426 559
Non-fixed-interest securities 1,817 3,632 2,366 2,866 500
Other on-balance-sheet reserves1 207 203 130 137 7
Subtotal 6,977 14,574 16,364 17,430 1,066
Off-balance-sheet reserves
Real estate2 4,769 5,600 5,668 5,592 76
Loans3 9,453 12,147 13,079 12,778 301
Associates 803 799 930 1,469 539
Subtotal 15,024 18,546 19,676 19,839 163
Reserve ratio 9.5% 13.4% 14.3% 14.7% 0.4pp.
25 February 2021 49

On- and off-balance-sheet reserves
Additional information: Group finance and risk Investments
1 Excluding reserves for owner-occupied property and insurance-related loans.
On-balance-sheet reserves Off-balance-sheet reserves1
Total reserves (gross) 17,430 19,839
Provision for deferred premium refunds 7,047 11,401
Deferred tax 2,382 2,505
Minority interests 11
Consolidation and currency effects 15
Shareholders' stake 7,975 5,932
25 February 2021 50
51
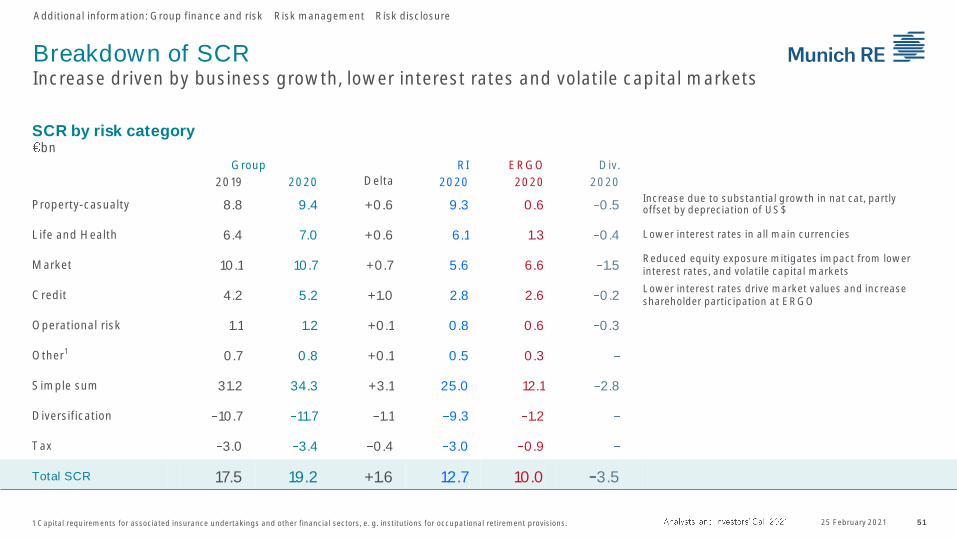
Breakdown of SCR Increase driven by business growth, lower interest rates and volatile capital markets
Additional information: Group finance and risk Risk management Risk disclosure
1 Capital requirements for associated insurance undertakings and other financial sectors, e. g. institutions for occupational retirement provisions.
Group
Delta
RI ERGO Div.
2019 2020 2020 2020 2020
Property-casualty 8.8 9.4 +0.6 9.3 0.6 0.5Increase due to substantial growth in nat cat, partly offset by depreciation of US$
Life and Health 6.4 7.0 +0.6 6.1 1.3 0.4 Lower interest rates in all main currencies
Market 10.1 10.7 +0.7 5.6 6.6 1.5Reduced equity exposure mitigates impact from lower interest rates, and volatile capital markets
Credit 4.2 5.2 +1.0 2.8 2.6 0.2Lower interest rates drive market values and increase shareholder participation at ERGO
Operational risk 1.1 1.2 +0.1 0.8 0.6 0.3
Other1 0.7 0.8 +0.1 0.5 0.3
Simple sum 31.2 34.3 +3.1 25.0 12.1 2.8
Diversification 10.7 11.7 1.1 9.3 1.2
Tax 3.0 3.4 0.4 3.0 0.9
Total SCR 17.5 19.2 +1.6 12.7 10.0 3.5
25 February 2021
SCR by risk category bn

1
2
3
4
5
6
7
8
52
Property-casualty risk
Additional information: Group finance and risk Risk management Solvency II
25 February 20211 Munich Re. Return period 200 years, pre-tax. 2 Natural catastrophes, man-made accumulations and major single losses.
Top scenario exposures (net of retrocession) AggVaR1
▪ Exploiting opportunities in an improving market environment exposure growth in all major scenarios in accordance with higher risk-bearing capacity
▪ Superior diversification of cat portfolio across perils and regions even strengthened via stronger growth in mid-sized scenarios
2020 2019
Basic losses 4.0
Major losses2 8.3
Diversification 3.5
Total 8.8
Top exposures
1 Atlantic Hurricane
2 Earthquake North America
3 Earthquake Japan
4 Storm Europe
5 IT Virus
2020 2019
4.1
8.9
3.7
9.4
1 2 3 4 5 6 7 8 9 10 11 12 13 14 15

53
Life and Health risk
Additional information: Group finance and risk Risk management
25 February 20211 Munich Re Group. Return period 200 years, pre-tax.
Life and Health VaR1
Longevity
Mortality
Morbidity
Health
Other
Total
1.81.6
4.84.3
3.83.4
0.90.9
0.50.5
7.06.4
2020
2019 Reinsurance
▪ Business growth, esp. US mortality and UK longevity business
▪ Lower interest rates of main currencies
ERGO
▪ Lower
Overall increase driven by

54
Market risk
Additional information: Group finance and risk Risk management
Group RI ERGO Div.
2019 2020 2020 2020 2020
Equity 4.2 4.1 2.4 1.7 0.1 Exposure decrease in the context of the COVID-19 crisis
General interest rate 3.0 3.1 1.5 2.5 0.9
Credit spread 4.1 5.0 1.8 3.8 0.6Increase driven by higher capital market volatility and reduced interest rates, driving market values and increase shareholder participation at ERGO
Real estate 2.2 2.3 1.6 0.8 0.1
Currency 4.6 3.4 3.4 0.2 0.1 Decrease of FX mismatch position
Simple sum 18.1 18.0 10.7 9.0 1.8
Diversification 8.0 7.3 5.1 2.4
Total market risk SCR 10.1 10.7 5.6 6.6 1.5
25 February 2021
SCR by risk category bn

Munich Re2
Reinsurance
ERGO
ERGO
80
100
120
140
160
2015 2016 2017 2018 2019 2020
Fixed income assets Economic liabilities
0
20
40
60
2015 2016 2017 2018 2019 2020
Fixed-income assets Economic liabilities
6 ( 13)
11 (12)
5 ( 1)
55
Market risk Asset-liability mismatch
Additional information: Group finance and risk Risk management
Assets Liabilities
8.9 (8.4)
6.6 (6.5)
10.1 (9.4)
9.3 (9.0)
6.7 (6.3)
10.3 (10.1)
Assets Liabilities
190 (172)
49 (46)
141 (126)
184 (173)
38 (34)
146 (139)
Portfolio durationDV011
Net DV01
1 Fair values as at 31.12.2020 (31.12.2019): Market value change due to a parallel downward shift in yield curve by one basis point, considering the portfolio size of assets and liabilities (pre-tax). Negative net DV01 means rising interest rates are beneficial. 2 Liabilities comprise technical provisions according to Solvency II. 3 Figures for ERGO and consequently Munich Re Group include VA.
Reinsurance
DV01 development
25 February 2021
Asset-liability
mismatchAsset-liability
mismatch

56
Sensitivities of SII ratio
Additional information: Group finance and risk Risk management
25 February 2021
208%
219
194
196
202
216
199
203
205
185
206
220175
1 Parallel shift until last liquid point, extrapolation to unchanged UFR. 2 Based on CPI inflation. 3 Based on 200-year event.
Target capitalisation
Ratio as at 31.12.2020
Interest rate +50bps1
Interest rate 50bps1
Spread +50bps GOV
Spread +50bps CORP
Equity markets +30%
Equity markets 30%
FX 20%
Inflation +100bps2
Atlantic Hurricane3
UFR 50bps

57
Preliminary SII ratios Munich Re and solo entities1
1 Entities with internal model and selected companies with standard formula application. 2 Transitional measures. 3 EOF including transitional measures: 4 EOF including transitional measures:
EOF(without TM2)
SCR(without TM2)
S-II Ratio(without TM2)
S-II Ratio(incl. TM2)
Munich Re 39.9 19.2 208% 240%
Munich Reinsurance Company 40.3 19.2 210% 242%
Munich Re of Malta 3.0 0.8 359%
GLISE 0.5 0.3 177%
ERGO Versicherung AG 2.7 0.7 382%
DKV 3.9 1.5 256%
Standard Formula
ERGO Leben 1.73 2.8 62% 309%
Victoria Leben 1.34 0.5 257% 728%
ERGO Vorsorge Leben 0.9 0.1 621%
ERGO Austria 0.55 0.3 141% 275%
ERGO Belgium Life 0.8 0.3 238%
ERGO Poland P-C (PLN bn) 2.8 1.8 152%
Additional information: Group finance and risk Risk management
25 February 2021
Internal modelbn

2019 9,238
Foreign exchange 1
Divestments/investments 0
Organic change 207
2020 9,030
Gross written premiums Major result drivers
ERGO Life and Health Germany
Additional information: ERGO
Q4 2020 Q4 2019 p 2020 2019 p
Technical result 26 40 14 353 287 66
Non-technical result 147 143 4 95 102 7
thereof investment result 1,152 932 220 3,605 3,916 311
Other 142 139 4 -318 202 116
Net result 31 44 13 130 187 56
25 February 2021 58
Investment resultQ4 2020 Return1 2020 Return1 2019 Return1
Regular income 807 2.5% 3,394 2.7% 3,571 2.8%
Write-ups/write-downs 38 0.1% 1,464 1.1% 249 0.2%
Disposal gains/losses 983 3.0% 2,263 1.8% 1,439 1.1%
Derivatives2 502 1.6% 257 0.2% 499 0.4%
Other income/expenses 98 0.3% 330 0.3% 345 0.3%
Investment result 1,152 3.6% 3,605 2.8% 3,916 3.1%
Average market value 129,005 127,596 125,982
1 Return on quarterly weighted investments (market values) in % p.a. 2 Result from derivatives without regular income and other income/expenses.

59
ERGO Life and Health Germany Key figures
Additional information: ERGO
1 German GAAP figures. 2 Actuarial interest rate incl. effect from ZZR. 3 Market data as at 2019. 25 February 2021
Key figures1 2018 2019 2020
Reinvestment yield 1.6 1.8 1.9
Average yield 2.9 2.9 2.7
Average guarantee2 2.1 1.9 1.7
Key financials1 2018 2019 2020
Free RfB 1.3 1.6 1.6
Terminal bonus fund 0.9 0.8 0.8
Unrealised gains 9.4 13.3 14.8
Accumulated ZZR 5.4 6.2 7.0
5.7
3.72.9 2.9 2.4
Peer 1 ERGO Peer 2 Peer 3 Peer 4
1.7
0.7 0.7 0.6 0.5
ERGO Peer 1 Peer 2 Peer 3 Peer 4
Life Germany Health Germany GWP Market view3
Comprehensive insurance ERGO number 2 in German market
Supplementary insurance ERGO clear market leader
%
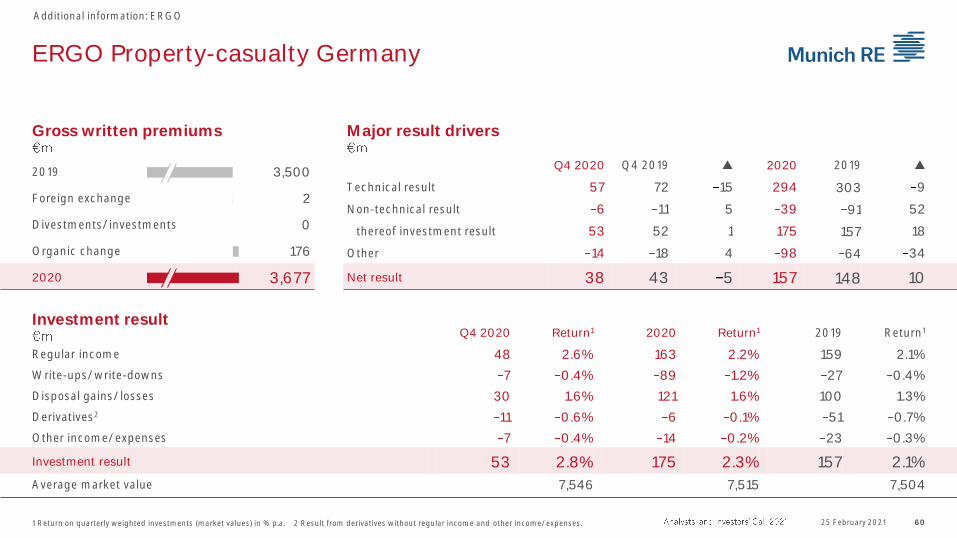
2019 3,500
Foreign exchange 2
Divestments/investments 0
Organic change 176
2020 3,677
60
ERGO Property-casualty Germany
Additional information: ERGO
Gross written premiums Major result drivers
Q4 2020 Q4 2019 p 2020 2019 p
Technical result 57 72 15 294 303 9
Non-technical result 6 11 5 39 91 52
thereof investment result 53 52 1 175 157 18
Other 14 18 4 98 64 34
Net result 38 43 5 157 148 10
25 February 20211 Return on quarterly weighted investments (market values) in % p.a. 2 Result from derivatives without regular income and other income/expenses.
Investment resultQ4 2020 Return1 2020 Return1 2019 Return1
Regular income 48 2.6% 163 2.2% 159 2.1%
Write-ups/write-downs 7 0.4% 89 1.2% 27 0.4%
Disposal gains/losses 30 1.6% 121 1.6% 100 1.3%
Derivatives2 11 0.6% 6 0.1% 51 0.7%
Other income/expenses 7 0.4% 14 0.2% 23 0.3%
Investment result 53 2.8% 175 2.3% 157 2.1%
Average market value 7,546 7,515 7,504
ERGO Property-casualty Germany
Combined ratio
Additional information: ERGO
%◼ Expense ratio◼ Loss ratio
2018 96.0
2019 92.3
2020 92.4
Q4 2020 92.8
Gross written premiums in 2020 (2019)
25 February 2021 61
98.1
86.2
92.1 93.2 93.4 92.5 90.9 92.8
Q1
2019
Q2
2019
Q3
2019
Q4
2019
Q1
2020
Q2
2020
Q3
2020
Q4
2020
Total
3,677m
( 3,500m)
Personal accident 596 (605)
Fire/property 731 (684)
Other 331 (278)
Motor 707 (680)
Liability 626 (599)
Legal protection 409 (410)
Marine 277 (243)
62.5
60.3
61.9
62.6
33.4
32.0
30.5
30.2
1 ESP operating cost ratio target for 2020 (German GAAP, excluding investments): 29.8%, Actual 2020: 28.7%
1

Gross written premiums Major result drivers
ERGO International
Additional information: ERGO
2019 4,912
Foreign exchange 56
Divestments/investments 103
Organic change 109
2020 4,861
Q4 2020 Q4 2019 p 2020 2019 p
Technical result 13 20 33 202 171 31
Non-technical result 76 44 32 96 45 51
thereof investment result 165 132 33 425 430 5
Other 22 11 10 69 111 42
Net result 68 13 54 230 105 124
25 February 2021 621 Return on quarterly weighted investments (market values) in % p.a. 2 Result from derivatives without regular income and other income/expenses.
Investment result Q4 2020 Return1 2020 Return1 2019 Return1
Regular income 76 1.5% 335 1.7% 368 2.0%
Write-ups/write-downs 15 0.3% 10 0.1% 40 0.2%
Disposal gains/losses 104 2.0% 132 0.7% 112 0.6%
Derivatives2 24 0.5% 7 0.0% 65 0.4%
Other income/expenses 7 0.1% 25 0.1% 25 0.1%
Investment result 165 3.2% 425 2.2% 430 2.4%
Average market value 20,429 19,475 18,186

ERGO International
Additional information: ERGO
25 February 2021 63
LifeThereof: 2020 2019
Austria 336 367
Belgium 146 161
HealthThereof: 2020 2019
Spain 877 820
Belgium 632 604
Total
4,861m( 4,912m) Health 1,509 (1,424)
Property-casualty 2,714 (2,791)
Life 639 (698)
P-CThereof: 2020 2019
Poland 1,442 1,463
Legal protection 690 647
Greece 246 240
Baltics 194 193
Austria 103 96
Combined ratio%
95.4 95.091.8
94.8 95.2
90.192.5 93.0
Q1
2019
Q2
2019
Q3
2019
Q4
2019
Q1
2020
Q2
2020
Q3
2020
Q4
2020
92.9 89.9 90.6 93.7 86.597.2 92.7
Poland Spain Austria Baltics Greece Legal
protection
Total
2020
Gross written premiums in 2020 (2019)

64
Strong footprint in traditional business supplemented by established initiatives and data-driven services
Additional information: Reinsurance Life and Health Overview of major markets
25 February 2021Gross written premiums 2020/share of total (core regions).
Asia / MENA ( 3.4bn / 27%)▪ Growing book of business building on
growth of underlying markets and strong foundation
▪ Market- and client-specific strategies
▪ Strong demand for FinMoRe solutions ▪ Largest health reinsurance book of all
regions▪ Expansion of financial markets
business
▪ Development of data-driven services
Canada ( 1.8bn / 14%)▪ Leading position in traditional
business ▪ Attractive margins despite
competitive environment
▪ Major contributor to global IFRS result
▪ Develop footprint in group business
Continental Europe ( 1.8bn / 14%)▪ Sound but stagnating traditional business overall ▪ Demand for tailor-made FinMoRe solutions
▪ Grow financial markets business▪ Promote digital services
Australia ( 0.8bn / 6%)▪ Rehabilitation of in-force top priority,
good progress being made ▪ However, state of disability market
remains an area of concern
▪ Highly selective new business proposition
USA ( 2.9bn / 23%)▪ Positioned amongst market leaders▪ Further develop FinMoRe business
and predictive analytics to foster growth
▪ Attractive risk-return profile of new business
▪ Develop financial markets business ▪ Successful in-force management
UK / Ireland ( 1.5bn / 12%)▪ Successful FinMoRe proposition▪ Longevity book continues to grow, top line >
▪ Margins in protection business remain unattractive▪ Organisational set-up not affected by Brexit
20%
80%
Australia
65
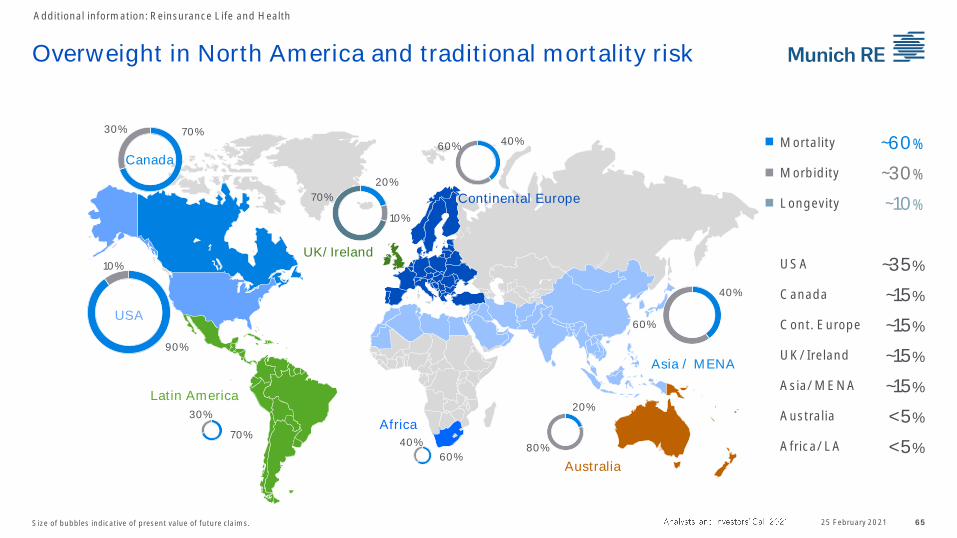
Overweight in North America and traditional mortality risk
Additional information: Reinsurance Life and Health
25 February 2021Size of bubbles indicative of present value of future claims.
Mortality ~60%
Morbidity ~30%
Longevity ~10%
USA ~35%
Canada ~15%
Cont. Europe ~15%
UK/Ireland ~15%
Asia/MENA ~15%
Australia <5%
Africa/LA <5%
90%
10%
USA
70%
30%
Latin America
60%
40%
Africa
70%30%
Canada
40%60%
Continental Europe
20%
10%
70%
UK/Ireland
40%
60%
Asia / MENA

66
Reinsurance Life and Health
Additional information: Reinsurance Life and Health
25 February 20211 Return on quarterly weighted investments (market values) in % p.a. 2 Result from derivatives without regular income and other income/expenses.
Investment resultQ4 2020 Return1 2020 Return1 2019 Return1
Regular income 171 2.3% 743 2.5% 791 2.8%
Write-ups/write-downs 6 0.1% 23 0.1% 14 0.0%
Disposal gains/losses 48 0.7% 178 0.6% 322 1.1%
Derivatives2 1 0.0% 18 0.1% 9 0.0%
Other income/expenses 8 0.1% 71 0.2% 21 0.1%
Investment result 207 2.8% 846 2.9% 1,097 3.9%
Average market value 29,309 29,428 28,205
Gross written premiums Major result drivers
2019 11,716
Foreign exchange 187
Divestments/investments 0
Organic change 1,178
2020 12,707
Q4 2020 Q4 2019 p 2020 2019 p
Technical result 109 43 152 78 365 443
Non-technical result 96 115 19 303 484 182
thereof investment result 207 232 25 846 1,097 252
Other 17 69 52 102 144 42
Net result 30 89 119 123 706 583

67
IFRS result below expectations Driven by COVID-19 strong development of fee income
Additional information: Reinsurance Life and Health
25 February 2021
2020 2019
Gross written premiums 12,707 11,716
Mortality 6,293 5,975
Morbidity 5,206 4,935
Other 1,208 806
Technical result 78 365
Mortality 113 429
Morbidity 38 114
Other 73 50
Fee income 175 128
Gross written premiums
▪ Growth driven by Europe and Asia, and to a lesser extent by North America
Technical result
▪ COVID-19 claims amount to
address reporting lags particularly in disability business
▪ Negative effects beyond direct COVID-19 claims in North America,
particularly excess US mortality caused indirectly by COVID-19
▪ Australia adjusted for COVID-19 slightly better than expected, but
concerns about disability block prevail
▪ Good result overall from Europe
▪ Asia in line with expectations, large life claim offset by pleasing health result
▪ Strong contribution from new business
Fee income
▪ Strong growth particularly in Asia and the US
▪ Portfolio is performing as expected, unaffected by COVID-19

68
Financially motivated reinsurance Strong demand prevails
Additional information: Reinsurance Life and Health
25 February 2021
Gross written premiums1 Technical result1
Portfolio development
89
127
68
154
200
1630
1231
>100
2016 2017 2018 2019 2020
% of total
Expectations going forward
New business contribution1, 2
▪ Demand expected to remain high
▪ Opportunities mainly in Asia and US
▪ Execution power supported by strong balance sheet and tailor-made structuring ability
▪ Number and size of transactions will vary on an annual basis
▪ New business opportunities arising mainly from Asia and the US
▪ 2018 drop in top line due to scheduled termination/restructuring
▪ 2018 result negatively impacted by one large financing transaction
▪ Top line stagnating since 2018 as majority of new business recognised as fee income
4,3064,793
1,264 1,201 1,26732 35
12 10 10
2016 2017 2018 2019 2020
% of total
257
205178
231
277
2219 17 18 18
2016 2017 2018 2019 2020
% of total
1 From 2017 including Health. 2 Present value of future profits from new business net of cost of capital (pre-tax).

69
AsiaSuccess through tailor-made market and client strategies
Additional information: Reinsurance Life and Health
25 February 2021
Gross written premiums1 Technical result1 New business contribution1, 2
▪ Growth path in the region prevails
▪ High demand for solvency relief and financing solutions
▪ Competition increasing
▪ Product trends and emerging experience to be monitored closely, particularly in critical illness and dismemberment business
Expectations going forward
▪ Strong organisational set-up throughout the region
▪ Sustained growth path
▪ Particularly strong development of fee income
▪ New business contribution volatile on amount of FinMoRe written in a particular year
Portfolio development
108 100
162 156
202
19 23 28 32
>100
2016 2017 2018 2019 2020
% of total
1 From 2017 including Health. 2 Present value of future profits from new business net of cost of capital (pre-tax).
1,9092,182 2,338
3,0453,392
14 1622 26 27
2016 2017 2018 2019 2020
% of total
180
244
190
315289
15
2318
24 25
2016 2017 2018 2019 2020
% of total

70
LongevityStrong growth path execution of first transaction outside the UK
Additional information: Reinsurance Life and Health
25 February 2021
Gross written premiums Liability p.a.1
Expectations going forwardPortfolio development
▪ No change to risk appetite and prudent underwriting and valuation approach
▪ Prepared to write higher volumes of new business if opportunities are attractive and meet our risk appetite
▪ Carefully consider expansion beyond UK (initial step taken in 2020) and extension of product offering
▪ Market entry in 2011 after in-depth research, focus on UK market
▪ Growing contribution to top line, also in relative terms
▪ Accretive to earnings, claims prove better than assumed in pricing
▪ Positive hedge against adverse mortality proven in case of COVID-19
▪ 2020: two transactions executed, including first outside the UK
484417
614685
1,072
4 36 6
8
2016 2017 2018 2019 2020
% of total
1,884
697
3,292
2,020
5,072
2016 2017 2018 2019 2020
1 Present value of future claims at the time the business was written.

7125 February 2021
Financial marketsComprehensive market risk solutions for the financial services industry
Additional information: Reinsurance Life and Health
IFRS earnings contribution1
1 Excluding management expenses, recognised in non-technical result, 2019 figure restated by +
44
37
59
106
79
2016 2017 2018 2019 2020
Strategic proposition
▪ Offer comprehensive solutions to globally manage market risks and returns
▪ Innovate new business, optimise in-force business, and boost asset returns of insurers, pension providers and other investors
▪ Capitalise on growth and consolidation opportunities in the global savings, retirement and investment industry
▪ Support the digitalisation of the end customer offering of clients
▪ Transfer and transform financial risks to markets via state-of-the-art platform
Expectations going forward
▪ Intensify coverage of existing markets and expand into further markets
▪ Support growth by further scaling up the organisation
▪ Broaden product, service and regulatory scope
▪ Grow contribution to IFRS earnings and new business contribution
Portfolio development
▪ Initial focus on Europe and Asia (mainly Japan); now expansion across Europe, Asia, and North America as well as market exploration in Latin America and Australia
▪ Portfolio has gained stand-alone significance
▪ Asset-liability hedging has successfully irrigated the volatile capital market environment of 2020

72
Reinsurance Property-casualty
Additional information: Reinsurance Property-casualty
25 February 20211 Return on quarterly weighted investments (market values) in % p.a. 2 Result from derivatives without regular income and other income/expenses.
Investment resultQ4 2020 Return1 2020 Return1 2019 Return1
Regular income 369 2.2% 1,637 2.5% 1,862 2.9%
Write-ups/write-downs 89 0.5% 371 0.6% 87 0.1%
Disposal gains/losses 323 2.0% 1,005 1.5% 807 1.3%
Derivatives2 19 0.1% 327 0.5% 94 0.1%
Other income/expenses 70 0.4% 251 0.4% 268 0.4%
Investment result 513 3.1% 2,347 3.6% 2,220 3.5%
Average market value 66,070 65,803 63,786
Gross written premiums Major result drivers
2019 22,091
Foreign exchange 378
Divestments/investments 0
Organic change 2,901
2020 24,615
Q4 2020 Q4 2019 p 2020 2019 p
Technical result 10 296 306 171 1,157 1,328
Non-technical result 169 266 97 931 607 324
thereof investment result 513 648 135 2,347 2,220 126
Other 74 57 131 188 202 13
Net result 105 27 78 571 1,562 991

73
Reinsurance Property-casualty Combined ratio
Additional information: Reinsurance Property-casualty
25 February 2021
2018 99.4
2019 100.2
2020 105.6
Q4 2020 104.2
◼ Expense ratio◼ Basic losses ◼ Major losses
Major losses Nat cat Man-made
Reservereleases1
Normalised combined
ratio2
2020 20.8 4.0 16.8 4.2 96.9
Q4 2020 20.2 1.0 19.2 4.6 96.6
Ø Annual expectation ~12.0 ~8.0 ~4.0 ~ 4.0
1 Basic losses prior years, already adjusted for directly corresponding sliding-scale and profit-commission effects. 2 Based on reserve releases of 4pp.
%
53.6
51.4
53.9
51.4
11.6
15.2
20.8
20.2
34.2
33.6
30.9
32.697.3
86.9
103.9
111.6
106.0
99.9
112.2
104.2
Q1
2019
Q2
2019
Q3
2019
Q4
2019
Q1
2020
Q2
2020
Q3
2020
Q4
2020

74
Core P-C reinsuranceRetrocession Continuity despite a difficult market
Additional information: Reinsurance Property-casualty Risk trading
25 February 20211 Including indemnity retrocession, ILW/derivatives, risk swaps, cat bonds and the sidecars including Eden Re. Selection of main scenarios.
Retrocession Maximum in-force protection per nat cat scenario1
▪ Protection against peak risks mainly via traditional retrocession
(CXL) and sidecars
▪ Well-balanced buying strategy reflects
▪ strong Munich Re capital base and risk-bearing capacity,
▪ expected IFRS result stabilisation and market terms
▪ Multi format programme providing material scalability and
access to rated-paper capacity as well as multiple, diverse
investment buckets
Traditional retrocession▪ Munich Re still has one of the largest retrocession
programmes worldwide
▪ Munich Re placement well received despite some
capacity constraints in the broader market
Sidecar program▪ QS cessions of certain lines of business, in 2021 collateralised
by US$ 635m
▪ Targeting long-term partnerships with institutional investors,
predominantly pension funds
Munich Re key channels
0
500
1,000
1,500
2016 2017 2018 2019 2020 2021
Australia Cyclone US Windstorm NE US Windstorm SE

75
Core P-C reinsuranceMunich Re's maximum in-force nat cat protection
Additional information: Reinsurance Property-casualty Risk trading
25 February 2021
500
1,000
Australia
Cyclone
US Windstorm
Northeast
US Windstorm
Southeast
US
Earthquake
EU
Windstorm
EU
Other perils
Japan
Earthquake
Risk swaps
Sidecars
Indemnity retro
Nat cat protection before reinstatement premiums, as at January 2021

Total Property Casualty Specialty lines
Line of business Prop. XL Prop. XL Marine Credit Aviation
Premium split1 11.6bn 24% 9% 48% 3% 8% 5% 3%
76
Overall portfolio profitability increasedJanuary renewals 2021
Munich Re portfolio Price and volume change in major lines of business
1 Relative premium share in relation to total renewable business in January.
Price change
▪ Proportional casualty and property business slightly increased▪ Property XL with substantial rate increases in all markets▪ Price increases in aviation and marine supported by primary market rate increases
Price change
Volumechange
Additional information: Reinsurance Property-casualty
25 February 2021
10.9% 12.7%4.3%
16.0%
28.0%
10.3% 4.1%14.4%
2.4% 1.3%7.9%
1.4% 3.2% 6.1%
0.6%
9.8%~

77
Split by line of business and regionJanuary renewals 2021
Split by line of business%
Additional information: Reinsurance Property-casualty
Split by region%
51
51
33
33
8
8
5
5
3
3
2020
2021
33
33
27
30
12
12
25
23
3
3
2020
2021
AviationCreditMarineCasualty Property
25 February 2021
Latin AmericaNorth AmericaAsia/Pacific/AfricaEurope Worldwide

%
1 Gross written premiums as at 31.12.2020. Economic view not fully comparable with IFRS figures. 2 Total refers to total P-C book, incl. remaining business. 78
January renewals 2021
Total property-casualty book1
%
Remaining business 35
July renewals 15
January renewals 42
April renewals 8
Regional allocation of January renewals
Nat cat shares of renewable portfolio2
Total
25bn Asia/Pacific/Africa 12
Worldwide 27
Europe 33
North America 26
Latin America 3
Additional information: Reinsurance Property-casualty
9
31
21
15
91
69
79
85
January
April
July
Total
Nat cat Other perils
25 February 2021
%
Total
10.5bn
79
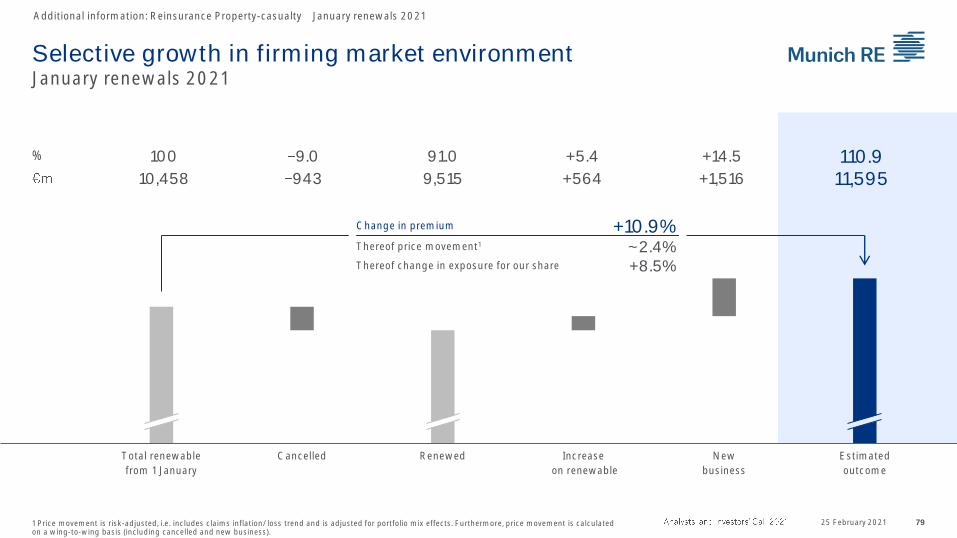
Selective growth in firming market environmentJanuary renewals 2021
1 Price movement is risk-adjusted, i.e. includes claims inflation/loss trend and is adjusted for portfolio mix effects. Furthermore, price movement is calculated on a wing-to-wing basis (including cancelled and new business).
Additional information: Reinsurance Property-casualty January renewals 2021
% 100 9.0 91.0 +5.4 +14.5 110.910,458 943 9,515 +564 +1,516 11,595
Total renewable
from 1 January
Cancelled Renewed Increase
on renewable
New
business
Estimated
outcome
Change in premium +10.9%Thereof price movement1 ~ 2.4%Thereof change in exposure for our share +8.5%
25 February 2021

80
Optimistic outlook for upcoming renewals
Total P-C book1
%
1 Gross written premiums. Economic view not fully comparable with IFRS figures.
Treaty business
April July
Total
3.6bn
Claims experience in individual market segments will play a major role
Focus: USA, LA, Australia
Nat cat share: 20%
Focus: USA, Europe
Nat cat share: 11%
Price increase of ~2.4%
Total
10.5bn
Focus: Japan
Nat cat share: 32%
Total
2.0bn
Total
25bn
Nat cat share: 15%
Rest of Asia/Pacific/Africa
Europe
WorldwideNorth America
Latin America
Australia/New ZealandJanuary 42
Worldwide
Latin America
Europe
North AmericaRest of Asia/Pacific/Africa
Europe
Latin America
North America
Worldwide
Japan
Remaining 35
April 8
July 15
Asia/Pacific/Africa
January
Additional information: Reinsurance Property-casualty
25 February 2021

81
Increased top line Well-balanced diversified portfolio
Additional information: Reinsurance Property-casualty Portfolio
25 February 2021Rounded figures. 1 Gross written premiums. Economic view not fully comparable with IFRS figures, as at 31.12.2020 (31.12.2019).2 Aviation, marine and credit.
▪ Strong proportion of US business, spread across all lines of business
Stable portfolio composition
Total P-C book%
%Risk SolutionsTailor-made solutions 19 (25)
Other traditional business 56 (52)
Risk Solutions 25 (23)
Total1
25bn
Total
6bnMR Specialty Insurance 23 (22)
American Modern 19 (21)
Facultative & Corporate Direct 19 (15)
Hartford Steam Boiler 19 (22)
Aerospace 7 (8)
Munich Re Syndicate 12 (12)
▪ Well-balanced traditional portfolio
▪ Slight move towards nat cat XL and specialty
Core P-C Reinsurance
Total
19bn
Casualty 48 (49)
Specialty2 9 (8)
Other property 32 (34)
Nat cat XL 11 (9)
%
82
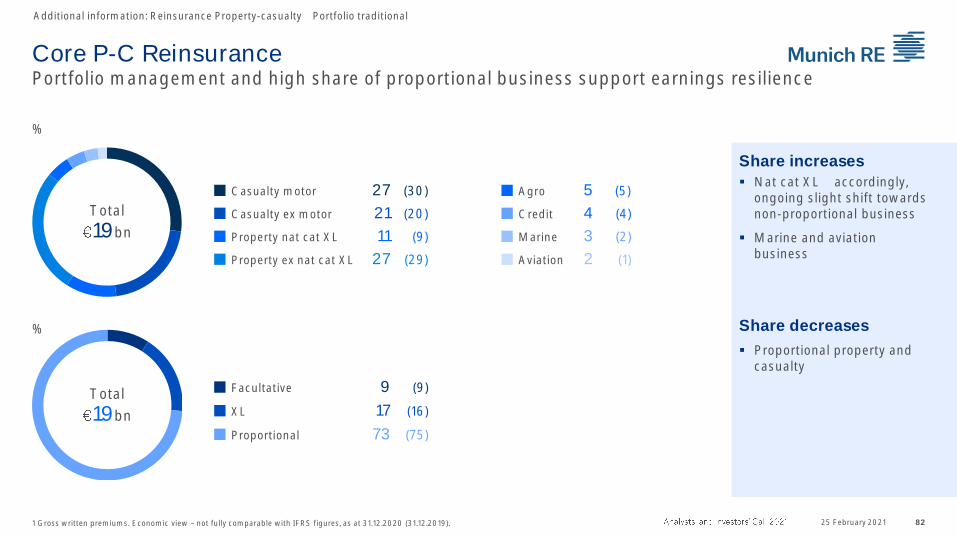
Core P-C Reinsurance Portfolio management and high share of proportional business support earnings resilience
Additional information: Reinsurance Property-casualty Portfolio traditional
25 February 20211 Gross written premiums. Economic view not fully comparable with IFRS figures, as at 31.12.2020 (31.12.2019).
Total
19bn
Facultative 9 (9)
XL 17 (16)
Proportional 73 (75)
Total
19bn
Aviation 2 (1)
Marine 3 (2)
Credit 4 (4)
Agro 5 (5)Casualty motor 27 (30)
Property ex nat cat XL 27 (29)
Casualty ex motor 21 (20)
Property nat cat XL 11 (9)
%
▪ Nat cat XL accordingly, ongoing slight shift towards non-proportional business
▪ Marine and aviation business
▪ Proportional property and casualty
Share increases
Share decreases %

8325 February 2021
US casualtyPortfolio quality further improved, while benefiting from favourable market conditions
Additional information: Reinsurance Property-casualty
Global traditional casualty book
%
Total1
7.5bn
US traditional casualty book
Total1
2.7bn
%
1 Expected yearly premiums without motor-own damage and cyber; business incepting 2.1.2020 1.1.2021, i. e. incl. 2021 January renewals. 2 Includes personal accident.
Total1
2.7bn
5
Financial lines 32
Motor liability 24
General liability 39
5
Personal lines2 18
Commercial liability prop. 74
Commercial liability XL 4
2 5
Financial lines 17
Motor liability 52
General liability 26
▪ Additional casualty premium of ~(thereof ~
▪ Taking advantage of market momentum and selectively growing the book at
▪
commercial and personal lines
▪ US traditional casualty book less than 40% of global traditional casualty book
▪ Enhanced portfolio quality through continued structural refinements (e.g. reduction of XL and motor business) and improved technical margins
▪ Social inflation risk mitigated through well-defined risk appetite, coverage restrictions and pricing adjustments
▪ Ability to benefit from improved primary market conditions through high share of proportional reinsurance (>90% of portfolio)
▪ Personal lines business provides stability due to limited social inflation exposure and an attractive rate environment
Risk Solutions

8425 February 2021
Further long-term growth in cyber (re)insurance targetedMunich Re with cutting-edge expertise and leading market presence
Additional information: Reinsurance Property-casualty
Gross written premiums in P-C reinsurance cyber portfolio US$ m
▪ Early and full commitment to cyber allows us to shape the market, resulting in a leading position
▪ Increasing demand for cyber solutions driven by regulatory changes in more than 125 countries and constantly growing awareness
▪ Growth of digital business models and technology developments (e.g. Cloud, 5G) will further leverage demand for cyber insurance, security measures and services
▪ Accelerated digitalisation due to COVID-19 confirms our approach and strategy also emphasising the complexity of adequate cyber insurability
▪ Continuously changing risks and loss scenarios require a clearly defined risk appetite and top-class cyber teams cooperating across industries and markets
▪ Investments in partnerships and leading cyber expertise further enhanced (~130 FTEs)
▪ Cyber a strategic pillar of Munich Re continued profitable growth in line with strategy and ambition
▪ With approx. 10% market share further participation in a growing market, while actively balancing growth and effective risk management
263354
473
604
855
2016 2017 2018 2019 2020

Changes to shares in circulation
Additional information: Shareholder information
Shares (millions)31.12.2019
Acquisition of own shares in
2020
Retirement of own shares in
202031.12.2020
Shares in circulation 141.5 1.4 140.1
Treasury shares
2.9 1.4 4.2
Total 144.3 4.2 140.1
Weighted average number of shares in circulation (millions)
148.7 143.6 140.3 140.1
2018 2019 2020 Q4 2020
25 February 2021 85

Balance sheet media conferencefor 2020 financial statements
Analysts' and Investors' call
Annual report (Group),
Annual report (Company)
Annual GeneralMeeting 2021
Quarterly statementas at 31 March 2021
Half-year financial reportas at 30 June 2021
Quarterly statementas at 30 September 2021
8625 February 2021
Financial calendar 2021
25 FEBRUARY
17 MARCH
28 APRIL
6 MAY
10 AUGUST
9 NOVEMBER

Christian Becker-HussongHead of Investor & Rating Agency Relations
Tel.: +49 (89) 3891-3910Email: [email protected]
Thorsten Dzuba
Tel.: +49 (89) 3891-8030Email: [email protected]
Christine Franziszi
Tel.: +49 (89) 3891-3875Email: [email protected]
Ralf Kleinschroth
Tel.: +49 (89) 3891-4559Email: [email protected]
Andreas Silberhorn (Rating agencies)
Tel.: +49 (89) 3891-3366Email: [email protected]
Ingrid Grunwald (ESG)
Tel.: +49 (89) 3891-3517Email: [email protected]
Maximiliane Gerstner (ERGO)
Tel.: +49 (211) 477-7483Email: [email protected]
Münchener Rückversicherungs-Gesellschaft | Investor & Rating Agency Relations | Königinstraße 107 | 80802 München, GermanyFax: +49 (89) 3891-9888 | Email: [email protected] | Internet: www.munichre.com
8725 February 2021
For information, please contact
Investor Relations Team

88
Disclaimer
25 February 2021
This presentation contains forward-looking statements that are based on current assumptions and
forecasts of the management of Munich Re. Known and unknown risks, uncertainties and other
factors could lead to material differences between the forward-looking statements given here and
the actual development, in particular the results, financial situation and performance of our
Company. Obvious fluctuations in the incidence of major losses as well as pronounced volatility of the
capital markets and exchange rates as well as the special features of IFRS accounting make an
accurate forecast of results impossible. Moreover, there is considerable uncertainty regarding the
further development of the coronavirus pandemic. The Company assumes no liability to update these
forward-looking statements or to make them conform to future events or developments. Figures from
Q1 2019 onwards are restated reflecting the new cost-allocation method. Due to rounding, there may
be minor deviations in summations and in the calculation of percentages in this presentation.