Analysts' conference 2017 - Munich Re
162
Shaping change in insurance Analysts' conference 2017 Munich, 15 March 2017 Image: Getty Images/fStop
Transcript of Analysts' conference 2017 - Munich Re
Shaping change in insuranceAnalysts' conference 2017
Munich, 15 March 2017
Image: Getty Images/fStop
2Analysts' conference 2017
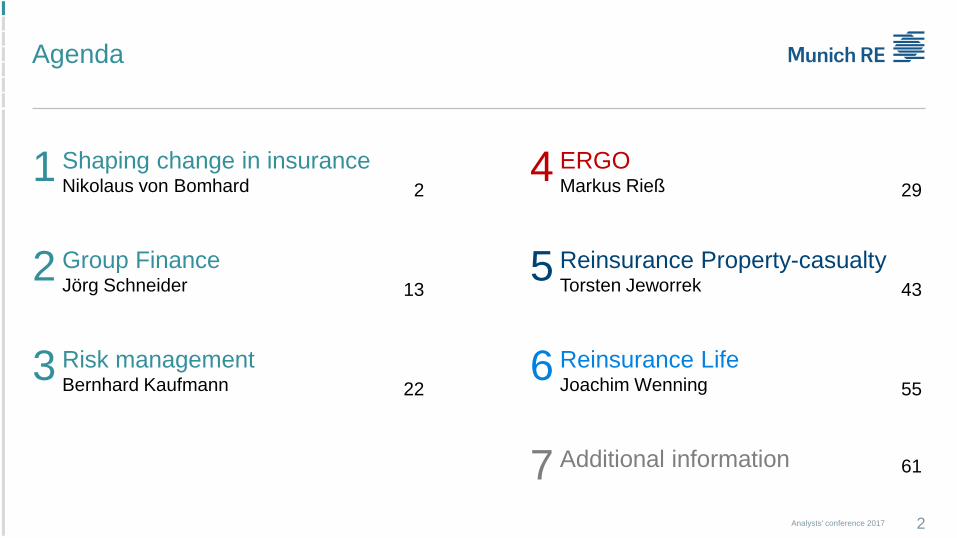
1 Shaping change in insuranceNikolaus von Bomhard 2
2 Group Finance Jörg Schneider 13
3 Risk management Bernhard Kaufmann 22
4 ERGOMarkus Rieß 29
5 Reinsurance Property-casualtyTorsten Jeworrek 43
6 Reinsurance LifeJoachim Wenning 55
Agenda
7 Additional information 61
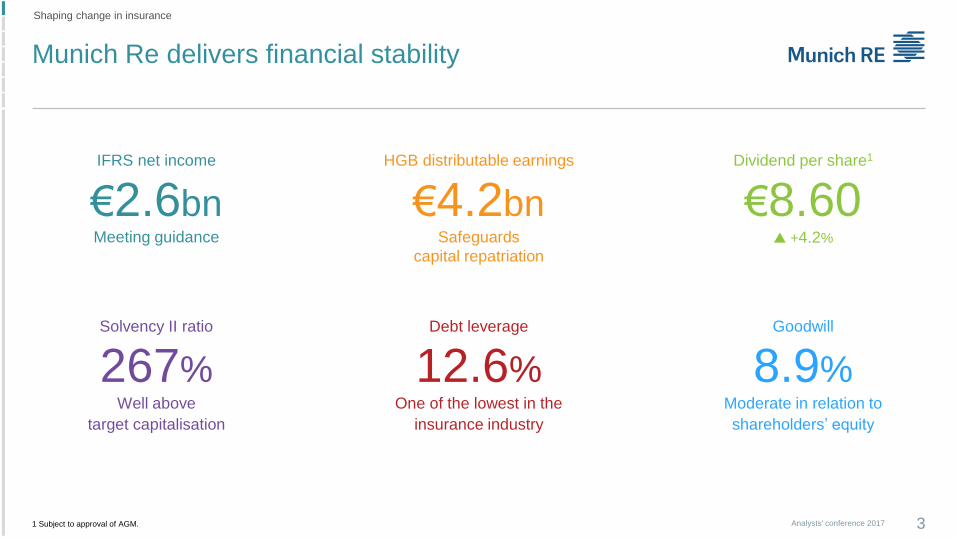
Munich Re delivers financial stability
3Analysts' conference 2017
IFRS net income
€2.6bnMeeting guidance
Solvency II ratio
267%Well above
target capitalisation
Dividend per share1
€8.60 +4.2%
HGB distributable earnings
€4.2bnSafeguards
capital repatriation
Debt leverage
12.6%One of the lowest in the
insurance industry
Goodwill
8.9%Moderate in relation to
shareholders’ equity
Shaping change in insurance
1 Subject to approval of AGM.
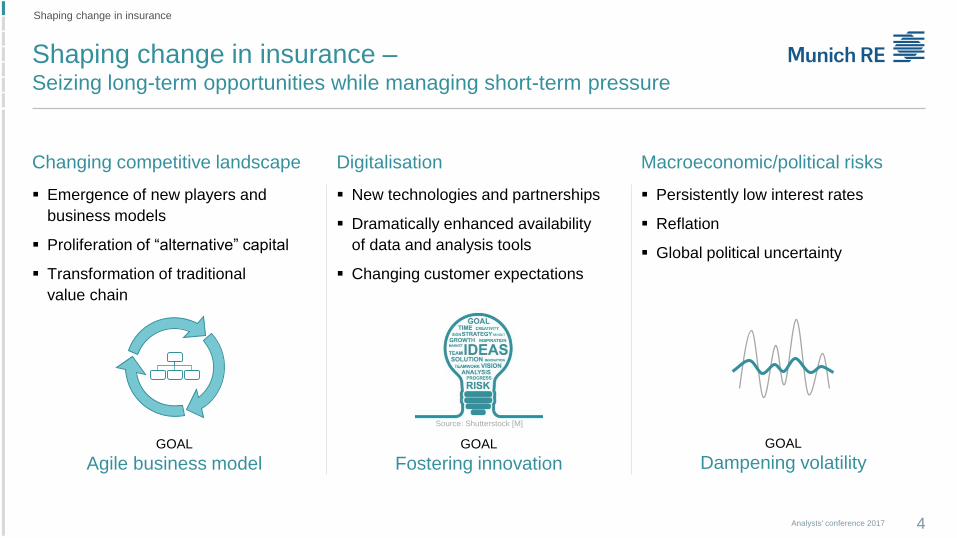
Shaping change in insurance –Seizing long-term opportunities while managing short-term pressure
4Analysts' conference 2017
Shaping change in insurance
Macroeconomic/political risks
Persistently low interest rates
Reflation
Global political uncertainty
Digitalisation
New technologies and partnerships
Dramatically enhanced availability
of data and analysis tools
Changing customer expectations
Changing competitive landscape
Emergence of new players and
business models
Proliferation of “alternative” capital
Transformation of traditional
value chain
GOAL
Dampening volatilityGOAL
Fostering innovationGOAL
Agile business model
Source: Shutterstock [M]
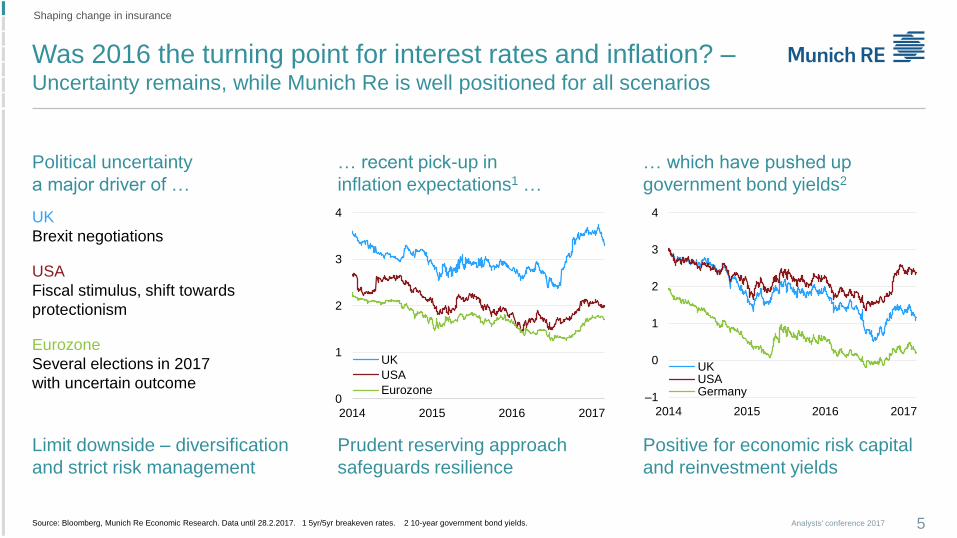
Was 2016 the turning point for interest rates and inflation? –Uncertainty remains, while Munich Re is well positioned for all scenarios
5Analysts' conference 2017
… recent pick-up in
inflation expectations1 …
… which have pushed up
government bond yields2
Political uncertainty
a major driver of …
UK
Brexit negotiations
USA
Fiscal stimulus, shift towards
protectionism
Eurozone
Several elections in 2017
with uncertain outcome
Prudent reserving approach
safeguards resilience
Positive for economic risk capital
and reinvestment yields
Limit downside – diversification
and strict risk management
0
1
2
3
4
2014 2015 2016 2017
UK
USA
Eurozone
Source: Bloomberg, Munich Re Economic Research. Data until 28.2.2017. 1 5yr/5yr breakeven rates. 2 10-year government bond yields.
–1
0
1
2
3
4
2014 2015 2016 2017
UKUSAGermany
Shaping change in insurance
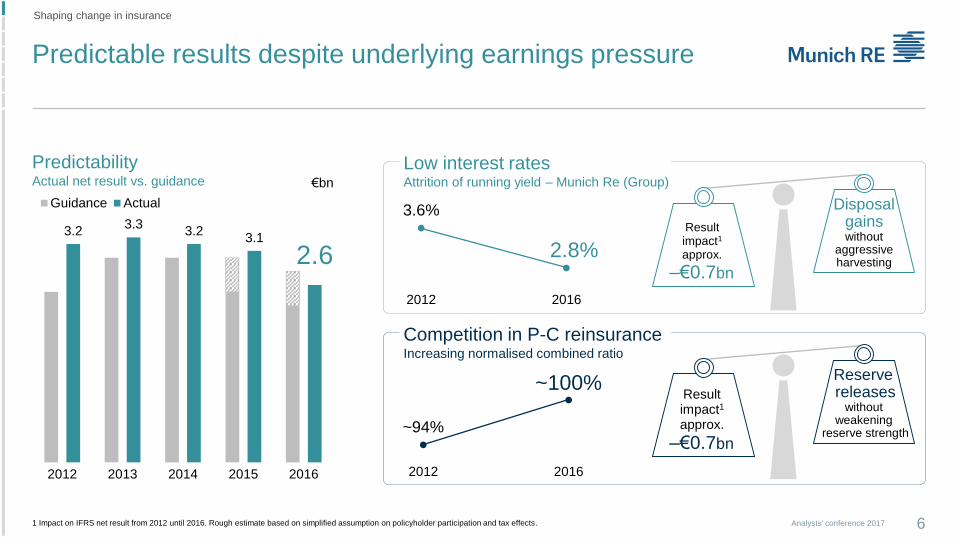
3.23.3
3.23.1
2.6
2012 2013 2014 2015 2016
Guidance Actual
Predictable results despite underlying earnings pressure
6Analysts' conference 2017
Low interest ratesAttrition of running yield – Munich Re (Group)
Result impact1
approx.
–€0.7bn
Reserve releases
without weakening
reserve strength
3.6%
2.8%
2012 2016
~94%
~100%
2012 2016
Disposal gains without
aggressive harvesting
Result impact1
approx.
–€0.7bn
Competition in P-C reinsuranceIncreasing normalised combined ratio
€bn
Predictability Actual net result vs. guidance
1 Impact on IFRS net result from 2012 until 2016. Rough estimate based on simplified assumption on policyholder participation and tax effects.
Shaping change in insurance
2005 2016
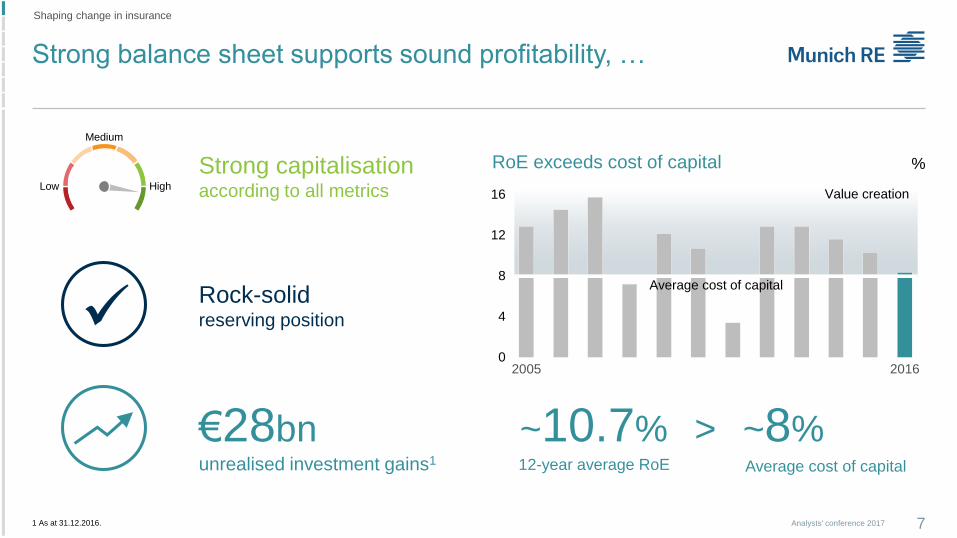
Strong balance sheet supports sound profitability, …
7Analysts' conference 20171 As at 31.12.2016.
Strong capitalisation according to all metrics
Medium
Low High
€28bnunrealised investment gains1
Rock-solid reserving position
RoE exceeds cost of capital
~10.7% > ~8%
16
12
8
4
0
Average cost of capital
Value creation
12-year average RoE Average cost of capital
Shaping change in insurance
%
Peer 5
Peer 3
Peer 2
Peer 4Peer 6
Peer 1
Index
–3
0
3
6
9
12
15
18
20 25 30 35 40 45
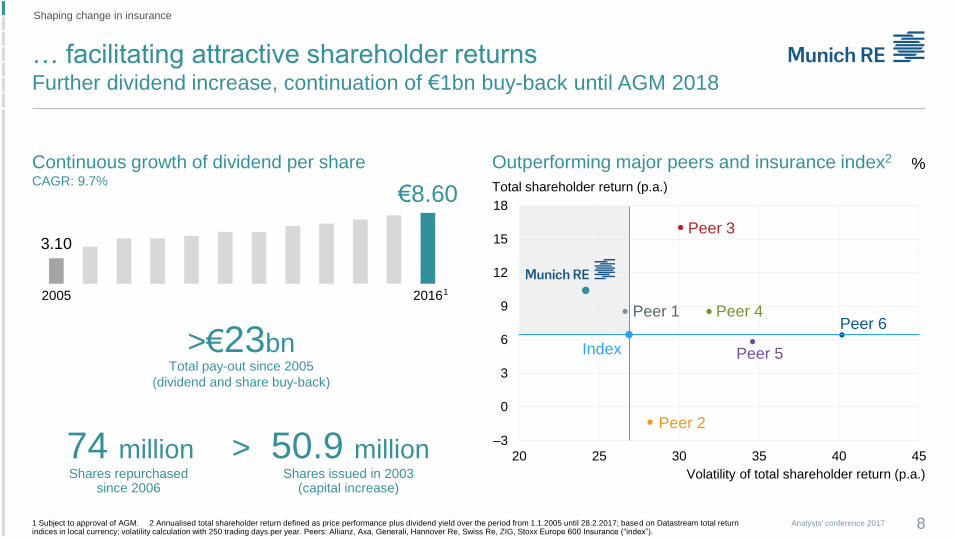
… facilitating attractive shareholder returnsFurther dividend increase, continuation of €1bn buy-back until AGM 2018
8Analysts' conference 2017
Outperforming major peers and insurance index2 %
Total shareholder return (p.a.)
Volatility of total shareholder return (p.a.)
1 Subject to approval of AGM. 2 Annualised total shareholder return defined as price performance plus dividend yield over the period from 1.1.2005 until 28.2.2017; based on Datastream total return indices in local currency; volatility calculation with 250 trading days per year. Peers: Allianz, Axa, Generali, Hannover Re, Swiss Re, ZIG, Stoxx Europe 600 Insurance (“index”).
Continuous growth of dividend per shareCAGR: 9.7%
Total pay-out since 2005
(dividend and share buy-back)
>€23bn
50.9 millionShares issued in 2003
(capital increase)
>
Shaping change in insurance
3.10
€8.60
2005 20161
74 millionShares repurchased
since 2006
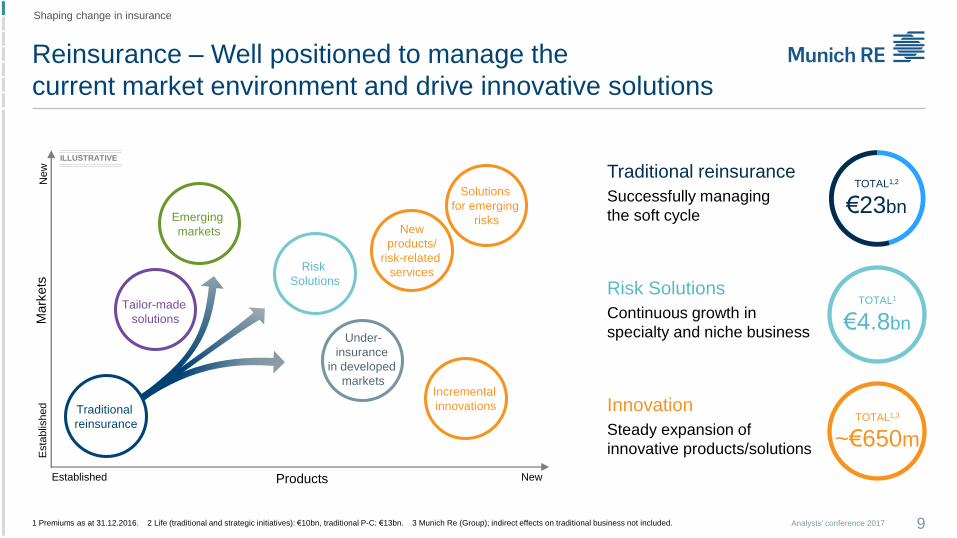
Reinsurance – Well positioned to manage the
current market environment and drive innovative solutions
9Analysts' conference 2017
Mark
ets
Products
New
Esta
blis
hed
Established New
Emerging
markets
Solutions
for emerging
risksNew
products/
risk-related
servicesRisk
Solutions
Incremental
innovations
Tailor-made
solutions
Under-
insurance
in developed
markets
Traditional
reinsurance
ILLUSTRATIVE
Traditional reinsurance
Successfully managing
the soft cycle
Risk Solutions
Continuous growth in
specialty and niche business
Innovation
Steady expansion of
innovative products/solutions
TOTAL1
€4.8bn
TOTAL1,3
~€650m
1 Premiums as at 31.12.2016. 2 Life (traditional and strategic initiatives): €10bn, traditional P-C: €13bn. 3 Munich Re (Group); indirect effects on traditional business not included.
TOTAL1,2
€23bn
Shaping change in insurance

ERGO – Turnaround initiated, well on track
to become a significant earnings contributor
10Analysts' conference 2017
Shaping change in insurance
–40
150–200
530~600+
2016 2017 … 2020 2021
€m
Leaner and
more efficient
structures
Transforming
the business
model
Convincing solutions,
committed to
profitable growth
Fit Digital Successful!
Increasing IFRS net profit1ERGO Strategy Programme/International Strategy
1 From 2017, figures include primary insurance business of Munich Health.
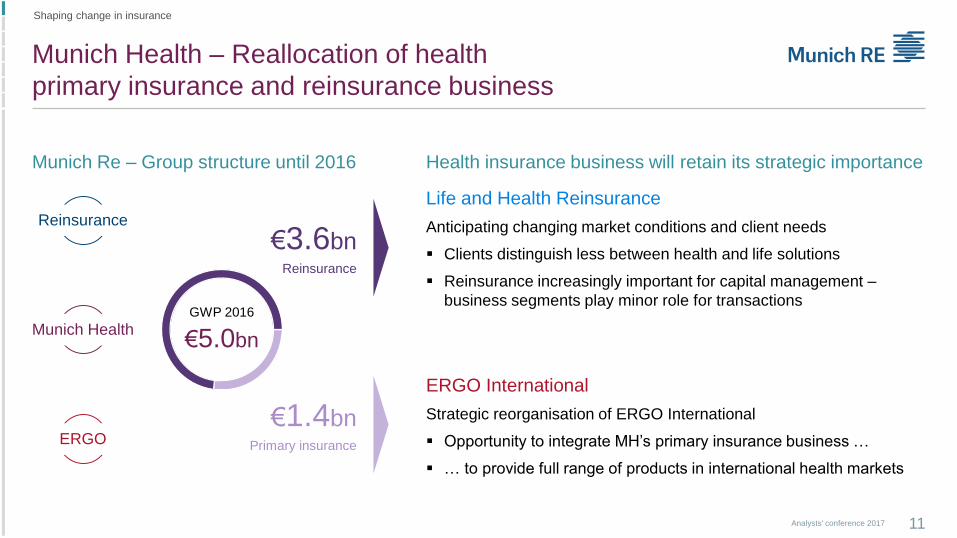
Munich Health – Reallocation of health
primary insurance and reinsurance business
11Analysts' conference 2017
ERGO
Munich HealthGWP 2016
€5.0bn
Munich Re – Group structure until 2016 Health insurance business will retain its strategic importance
€3.6bnReinsurance
Life and Health Reinsurance
Anticipating changing market conditions and client needs
Clients distinguish less between health and life solutions
Reinsurance increasingly important for capital management –
business segments play minor role for transactions
€1.4bnPrimary insurance
ERGO International
Strategic reorganisation of ERGO International
Opportunity to integrate MH’s primary insurance business …
… to provide full range of products in international health markets
Reinsurance
Shaping change in insurance
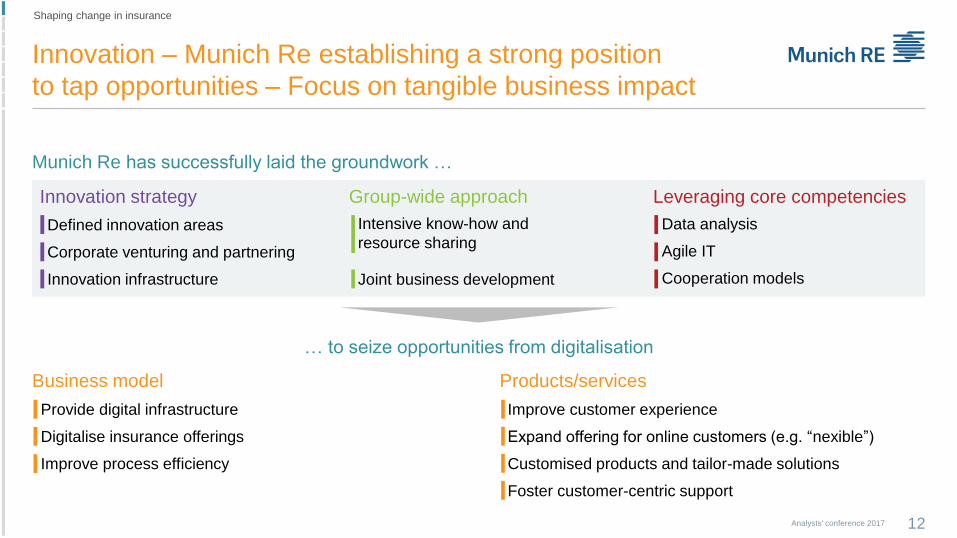
Innovation – Munich Re establishing a strong position
to tap opportunities – Focus on tangible business impact
12Analysts' conference 2017
Munich Re has successfully laid the groundwork …
… to seize opportunities from digitalisation
Business model
Defined innovation areas
Corporate venturing and partnering
Innovation infrastructure
Data analysis
Agile IT
Cooperation models
Intensive know-how and
resource sharing
Joint business development
Innovation strategy Leveraging core competencies Group-wide approach
Products/services
Provide digital infrastructure
Digitalise insurance offerings
Improve process efficiency
Improve customer experience
Expand offering for online customers (e.g. “nexible”)
Customised products and tailor-made solutions
Foster customer-centric support
Shaping change in insurance

Analysts' conference 2017 13
Group Finance
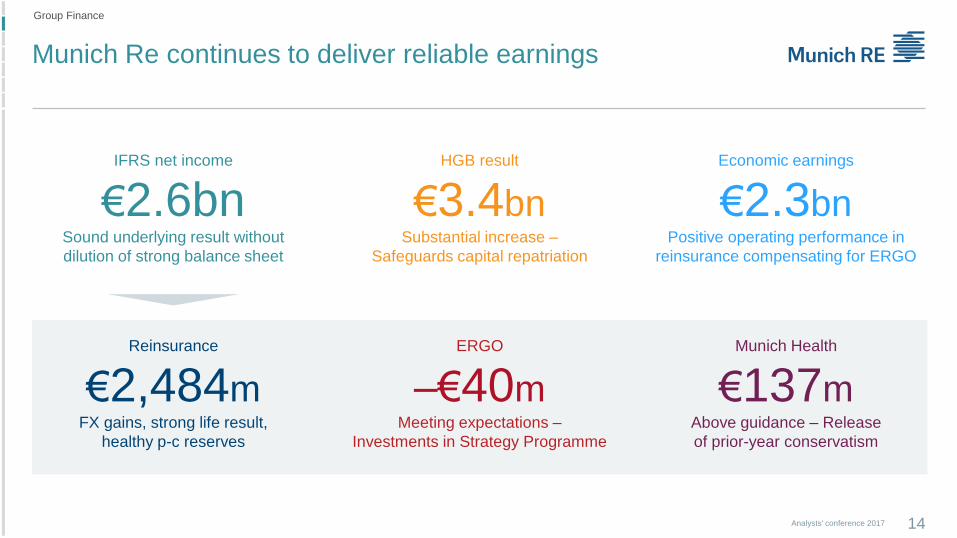
Munich Re continues to deliver reliable earnings
14Analysts' conference 2017
IFRS net income
€2.6bnSound underlying result without
dilution of strong balance sheet
HGB result
€3.4bnSubstantial increase –
Safeguards capital repatriation
Economic earnings
€2.3bnPositive operating performance in
reinsurance compensating for ERGO
Reinsurance
€2,484mFX gains, strong life result,
healthy p-c reserves
ERGO
–€40mMeeting expectations –
Investments in Strategy Programme
Munich Health
€137mAbove guidance – Release
of prior-year conservatism
Group Finance

≤2006 2007 2008 2009 2010 2011 2012 2013 2014 2015 Total
Prudent approach allows for reserve releases
without weakening resilience against future volatility
15Analysts' conference 2017
Group Finance
Prudent reserving approach
Cautious initial loss picks for new
underwriting year
Positive run-off responds to benign
loss emergence, …
… while at least preserving
confidence level
Strong reserving position mitigates
underlying earnings pressure
1 Accident year split is partly based on approximations. 2 Basic losses (€1,148m), adjusted for commission effects (–€128m), FX effects (different reference date between accident-year triangle and financial statements) and minor effects from reclassification of Munich Health business (both in total –€96m).
Reserve release
P-C reinsurance2
5.5%
€1.4bnRun-off change of ultimate basic and major losses1
AY
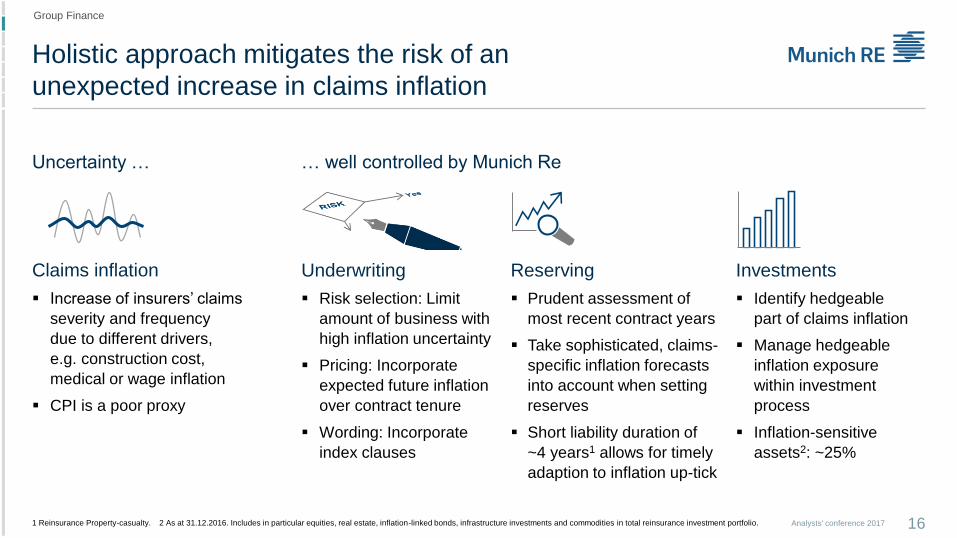
Holistic approach mitigates the risk of an
unexpected increase in claims inflation
16Analysts' conference 2017
Group Finance
1 Reinsurance Property-casualty. 2 As at 31.12.2016. Includes in particular equities, real estate, inflation-linked bonds, infrastructure investments and commodities in total reinsurance investment portfolio.
… well controlled by Munich ReUncertainty …
Claims inflation InvestmentsUnderwriting Reserving
Risk selection: Limit
amount of business with
high inflation uncertainty
Pricing: Incorporate
expected future inflation
over contract tenure
Wording: Incorporate
index clauses
Prudent assessment of
most recent contract years
Take sophisticated, claims-
specific inflation forecasts
into account when setting
reserves
Short liability duration of
~4 years1 allows for timely
adaption to inflation up-tick
Identify hedgeable
part of claims inflation
Manage hedgeable
inflation exposure
within investment
process
Inflation-sensitive
assets2: ~25%
Increase of insurers’ claims
severity and frequency
due to different drivers,
e.g. construction cost,
medical or wage inflation
CPI is a poor proxy
17Analysts' conference 2017
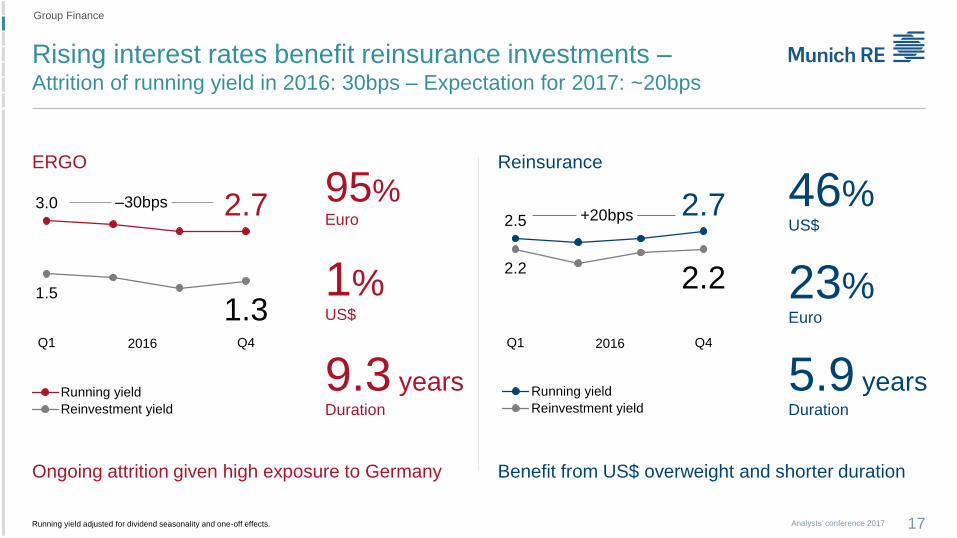
Rising interest rates benefit reinsurance investments –Attrition of running yield in 2016: 30bps – Expectation for 2017: ~20bps
Group Finance
3.0 2.7
1.5
1.3Q1 Q4
Running yield
Reinvestment yield
2.52.7
2.22.2
Q1 Q4
Running yield
Reinvestment yield
Running yield adjusted for dividend seasonality and one-off effects.
9.3 yearsDuration
Benefit from US$ overweight and shorter durationOngoing attrition given high exposure to Germany
1%US$
95%Euro
5.9 yearsDuration
23%Euro
46%US$
20162016
ERGO Reinsurance
–30bps+20bps
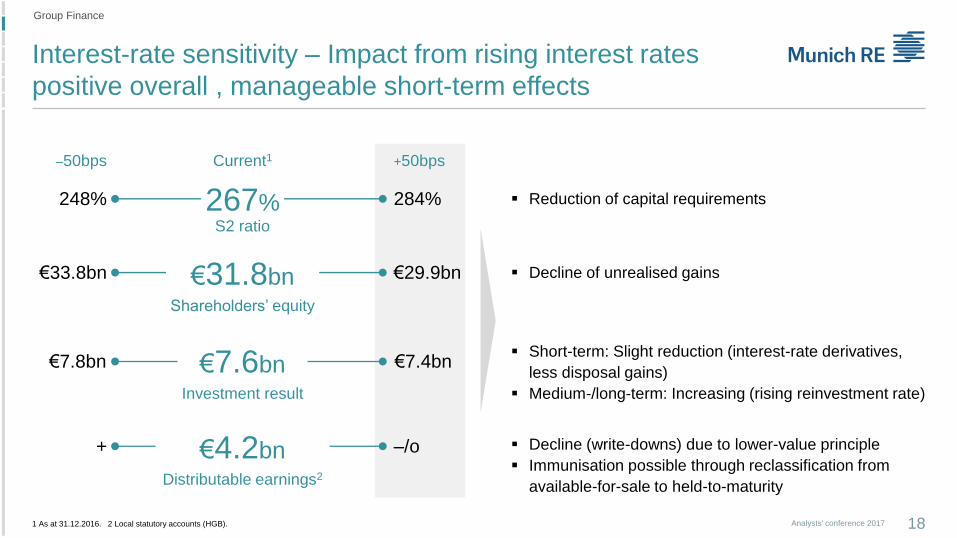
Interest-rate sensitivity – Impact from rising interest rates
positive overall , manageable short-term effects
18Analysts' conference 20171 As at 31.12.2016. 2 Local statutory accounts (HGB).
Group Finance
267%S2 ratio
248% 284% Reduction of capital requirements
€31.8bnShareholders’ equity
€33.8bn €29.9bn Decline of unrealised gains
€7.6bnInvestment result
€7.8bn €7.4bn Short-term: Slight reduction (interest-rate derivatives,
less disposal gains)
Medium-/long-term: Increasing (rising reinvestment rate)
€4.2bnDistributable earnings2
+ –/o Decline (write-downs) due to lower-value principle
Immunisation possible through reclassification from
available-for-sale to held-to-maturity
–50bps Current1 +50bps
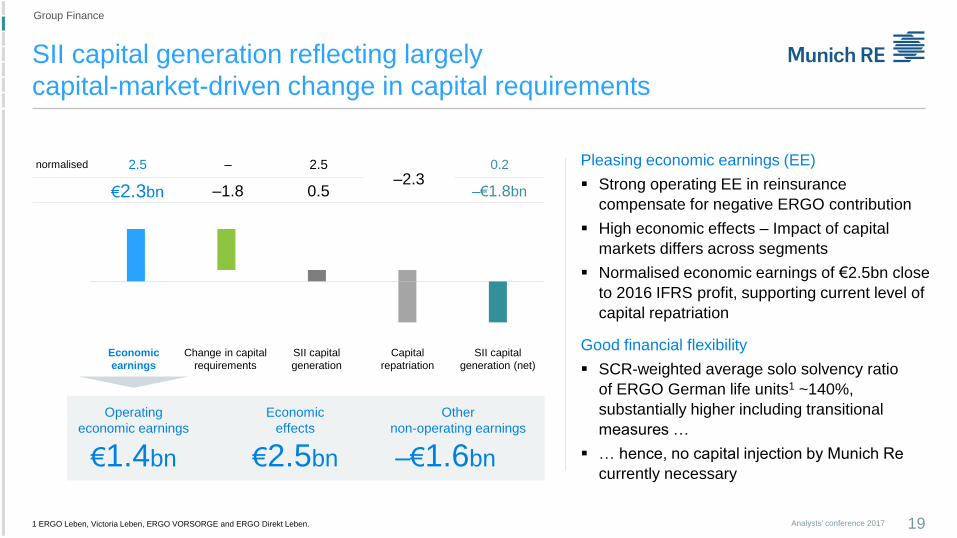
SII capital generation reflecting largely
capital-market-driven change in capital requirements
19Analysts' conference 2017
Pleasing economic earnings (EE)
Strong operating EE in reinsurance
compensate for negative ERGO contribution
High economic effects – Impact of capital
markets differs across segments
Normalised economic earnings of €2.5bn close
to 2016 IFRS profit, supporting current level of
capital repatriation
Good financial flexibility
SCR-weighted average solo solvency ratio
of ERGO German life units1 ~140%,
substantially higher including transitional
measures …
… hence, no capital injection by Munich Re
currently necessary
Group Finance
Economic
earnings
Change in capital
requirements
SII capital
generation
Capital
repatriation
SII capital
generation (net)
Operating
economic earnings
€1.4bn
Economic
effects
€2.5bn
Other
non-operating earnings
–€1.6bn
normalised 2.5 – 2.5–2.3
0.2
€2.3bn –1.8 0.5 –€1.8bn
1 ERGO Leben, Victoria Leben, ERGO VORSORGE and ERGO Direkt Leben.
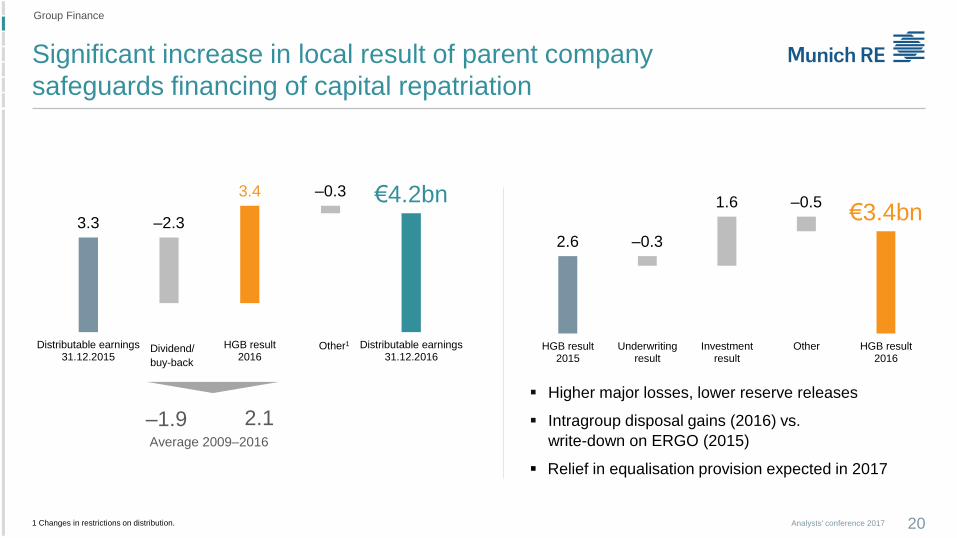
Significant increase in local result of parent company
safeguards financing of capital repatriation
20Analysts' conference 20171 Changes in restrictions on distribution.
Group Finance
3.3 –2.3
3.4 –0.3 €4.2bn
Distributable earnings31.12.2015
HGB result2016
Distributable earnings31.12.2016
2.6 –0.3
1.6 –0.5€3.4bn
HGB result2015
Underwritingresult
Investmentresult
Other HGB result2016
Average 2009–2016
–1.9 2.1
Dividend/
buy-back
Other1
Higher major losses, lower reserve releases
Intragroup disposal gains (2016) vs.
write-down on ERGO (2015)
Relief in equalisation provision expected in 2017
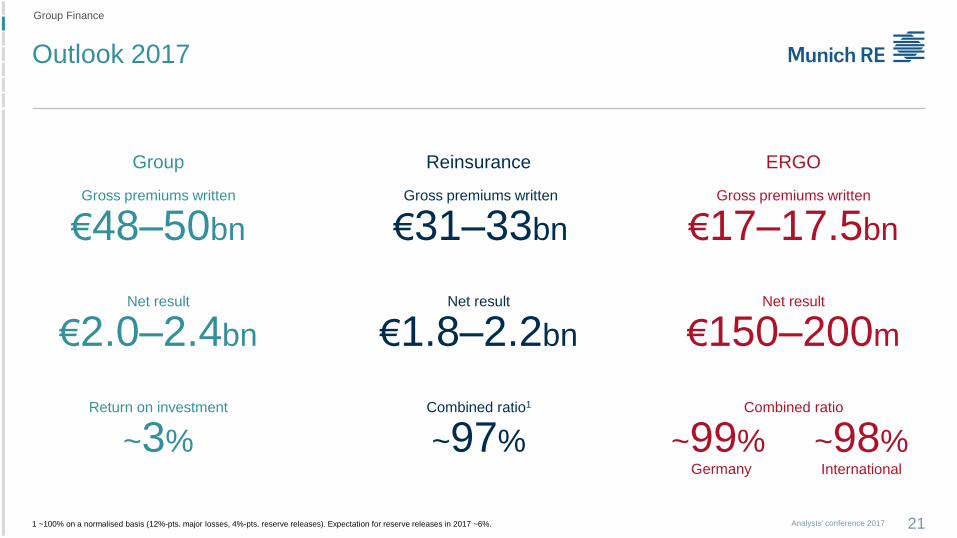
Outlook 2017
21Analysts' conference 2017
Group Finance
1 ~100% on a normalised basis (12%-pts. major losses, 4%-pts. reserve releases). Expectation for reserve releases in 2017 ~6%.
Combined ratio1
~97%
Reinsurance
Combined ratio
~99%Germany
~98%International
ERGO
Gross premiums written
€48–50bn
Return on investment
~3%
Net result
€1.8–2.2bn
Net result
€150–200m
Net result
€2.0–2.4bn
Group
Gross premiums written
€31–33bn
Gross premiums written
€17–17.5bn

Analysts' conference 2017 22
Risk management

Current global risk landscape
leads to perception of great uncertainty
23Analysts' conference 2017
Preparedness and resilience
GOAL
Dampening volatility
Business-enabling with attractive risk-return profile
GOAL
Turning uncertainty into business opportunities
Risk assessment based on forward-looking scenarios
Active exposure management, e.g. for financial sector,
country risk and emerging markets
Review of hedging strategy, e.g. FX and inflation risks
Increasing risk appetite for complex and large risks
Property-casualty single risks
Emerging risks (e.g. cyber)
Structured, tailored solutions
Risk management
Source: Shutterstock [M]

Given high levels of uncertainty,
risk profile remains relatively stable
24Analysts' conference 2017
Breakdown of solvency capital requirement (SCR)
302% 267%2
38.240.7 €40.7bn
13.8 13.5 €15.3bn
2014 2015 2016
EOF SCR
Munich Re’s SII ratio1
SII ratio in a very comfortable range, with flexibility for
additional risk taking
Increase largely driven by FX, low interest rates, business
growth in Life Reinsurance and model refinements
Risk management
277%€6.8bn
5.2
9.9
4.0
1.4
0.6
Property-casualty
Life and Health
Market
Credit
Operational risk
Other
2016
2015
2014
1 All figures do not include effects of transitionals or long-term-guarantee (LTG) measures, e.g. volatility adjustment. 2 Ratio after dividend of ~€1.3bn for 2016 to be paid in April 2017: 258%. SII ratio considering transitionals for ERGO Leben and Victoria Leben: 316%.
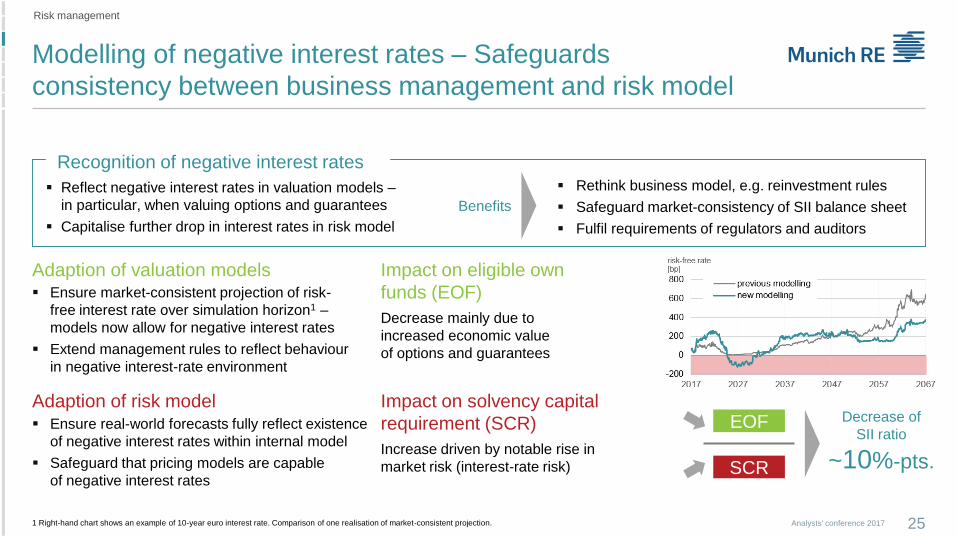
Modelling of negative interest rates – Safeguards
consistency between business management and risk model
25Analysts' conference 2017
Reflect negative interest rates in valuation models –
in particular, when valuing options and guarantees
Capitalise further drop in interest rates in risk model
Rethink business model, e.g. reinvestment rules
Safeguard market-consistency of SII balance sheet
Fulfil requirements of regulators and auditors
Benefits
Recognition of negative interest rates
Adaption of valuation models Ensure market-consistent projection of risk-
free interest rate over simulation horizon1 –
models now allow for negative interest rates
Extend management rules to reflect behaviour
in negative interest-rate environment
Impact on eligible own
funds (EOF)
Decrease mainly due to
increased economic value
of options and guarantees
Adaption of risk model Ensure real-world forecasts fully reflect existence
of negative interest rates within internal model
Safeguard that pricing models are capable
of negative interest rates
Impact on solvency capital
requirement (SCR)
Increase driven by notable rise in
market risk (interest-rate risk)
1 Right-hand chart shows an example of 10-year euro interest rate. Comparison of one realisation of market-consistent projection.
Decrease of
SII ratio
~10%-pts.SCR
EOF
Risk management
26Analysts' conference 2017
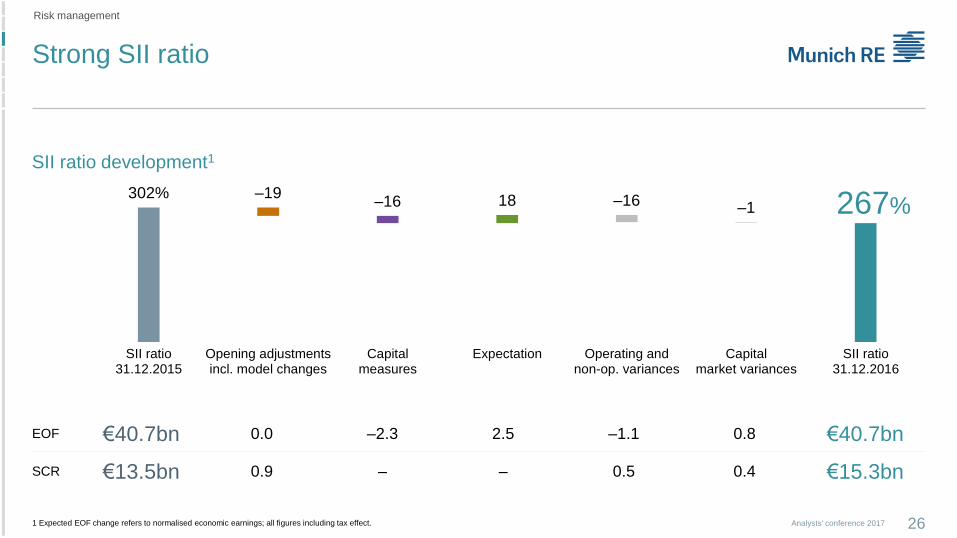
Strong SII ratio
1 Expected EOF change refers to normalised economic earnings; all figures including tax effect.
Risk management
SII ratio development1
302% –19–16 18 –16 –1
SII ratio31.12.2015
Opening adjustmentsincl. model changes
Capitalmeasures
Expectation Operating andnon-op. variances
Capitalmarket variances
SII ratio31.12.2016
EOF €40.7bn 0.0 –2.3 2.5 –1.1 0.8 €40.7bn
SCR €13.5bn 0.9 – – 0.5 0.4 €15.3bn
267%
27Analysts' conference 2017
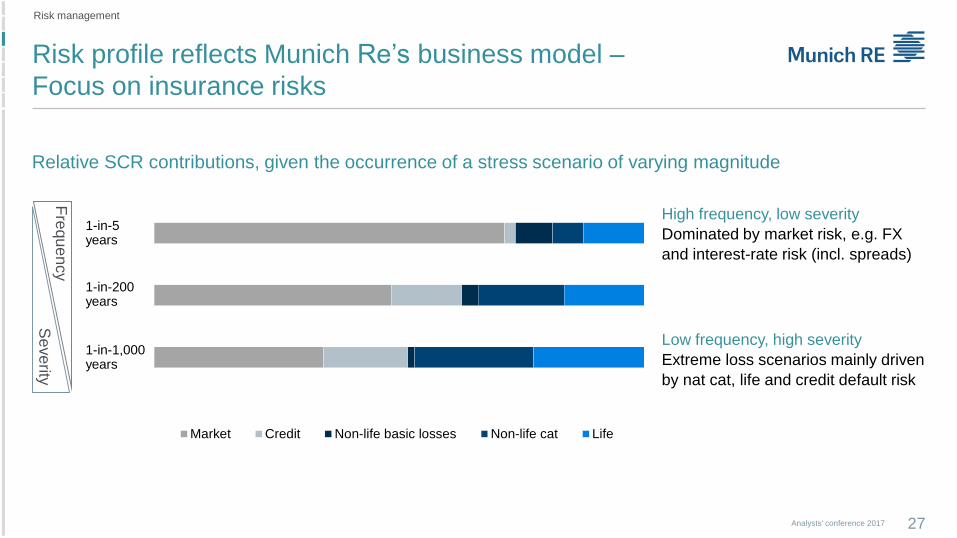
High frequency, low severity
Dominated by market risk, e.g. FX
and interest-rate risk (incl. spreads)
Relative SCR contributions, given the occurrence of a stress scenario of varying magnitude
Fre
qu
en
cy
Se
ve
rity
Risk profile reflects Munich Re’s business model –
Focus on insurance risks
Risk management
Market Credit Non-life basic losses Non-life cat Life
Low frequency, high severity
Extreme loss scenarios mainly driven
by nat cat, life and credit default risk
1-in-5years
1-in-200years
1-in-1,000years

SII ratio remains comfortable in typical stress scenarios
28Analysts' conference 2017
SII ratio sensitivity1
1 All shown figures do not include transitionals or long-term-guarantee (LTG) measures. As at 31.12.2016. 2 Parallel shift until last liquid point, extrapolation to unchanged UFR. 3 Based on CPI inflation. 4 Based on 200-year event. 5 Due to diversification, spread sensitivity simultaneously stressing GOV and CORP spreads (226%) is lower than sum of separate sensitivities shown.
Risk management
Sensitivity
SII ratio
Target
capitalisation
Reduced interest rates and
recognition of negative interest
rates in internal model contribute
equally to increased interest and
spread sensitivity
Use of LTG measures would
additionally reduce other
sensitivities (e.g. spread,
equity sensitivity)
Spread Gov +100bps
(246%)5
Spread Corporates
+100bps
(240%)5
Volatility
adjustment
(279%)
Atlantic
Hurricane4
(247%)
Equity markets –30%
(251%)
Inflation
+100bps3
(265%)
Interest rates
+50bps2
(284%)
Interest rates
–50bps2
(248%)

Analysts' conference 2017 29
ERGO
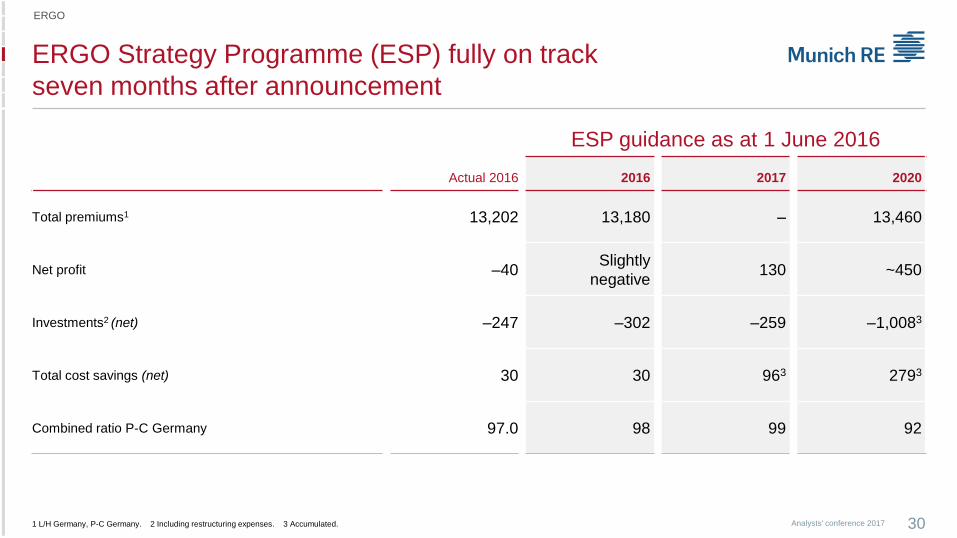
ERGO Strategy Programme (ESP) fully on track
seven months after announcement
30Analysts' conference 2017
ERGO
ESP guidance as at 1 June 2016
Actual 2016 2016 2017 2020
Total premiums1 13,202 13,180 – 13,460
Net profit –40Slightly
negative130 ~450
Investments2 (net) –247 –302 –259 –1,0083
Total cost savings (net) 30 30 963 2793
Combined ratio P-C Germany 97.0 98 99 92
1 L/H Germany, P-C Germany. 2 Including restructuring expenses. 3 Accumulated.

ESP – Timeline
31Analysts' conference 2017
ERGO
Q2 2016 Q3 2016 Q4 2016 H1 2017 H2 2017 H1 2018
Workers´
council has
agreed on
major topics
30 June
More than
90% of re-
structuring
expenses
booked
Product innovation:
Personal accident
Household
ERGO Mobility Solutions
GmbH started
Q3: nexible to start with
first product (motor)
Go-live of separate
organisational entity
“Traditional Life”
Product innovation:
Personal liability
Motor
IT workers´
council has
agreed on
major topics
Fit
Digital
Successful!
Launch of new MEAG funds
End of Q4: New
term-life and new
annuity product life
Life Germany:
Launch of new
pension products
Sales:
New organisational
setup implemented
New IT
organisational
structure
implemented
New Sourcing
organisation
implemented
Digital IT fully
established
Products innovation:
Residential building
Legal protection
Commercial liability online
Implementation of
new structures in
admin and central
functions
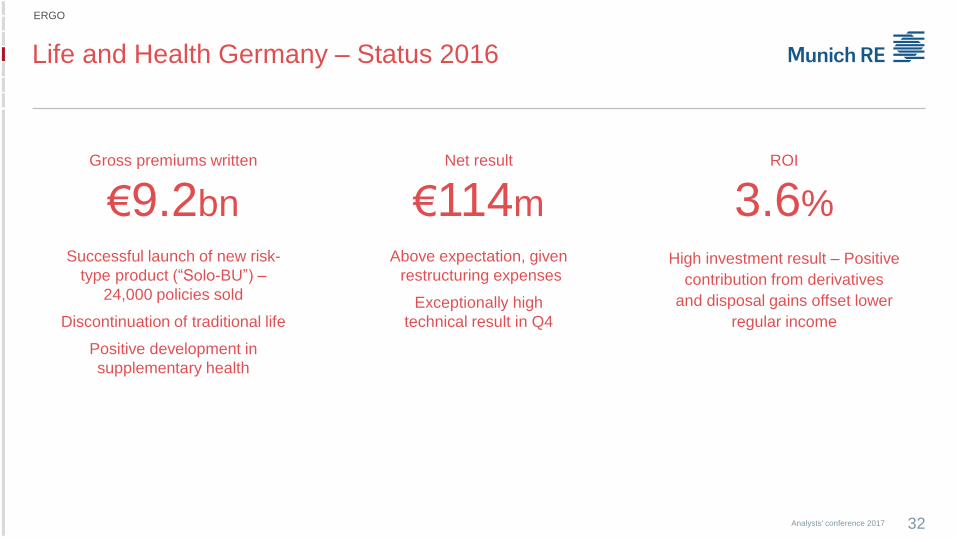
Life and Health Germany – Status 2016
32Analysts' conference 2017
ERGO
Gross premiums written
€9.2bn
Successful launch of new risk-
type product (“Solo-BU”) –
24,000 policies sold
Discontinuation of traditional life
Positive development in
supplementary health
ROI
3.6%
High investment result – Positive
contribution from derivatives
and disposal gains offset lower
regular income
Net result
€114m
Above expectation, given
restructuring expenses
Exceptionally high
technical result in Q4
Life Germany – New organisational setup to support
comprehensive management of back book
33Analysts' conference 2017
ERGO
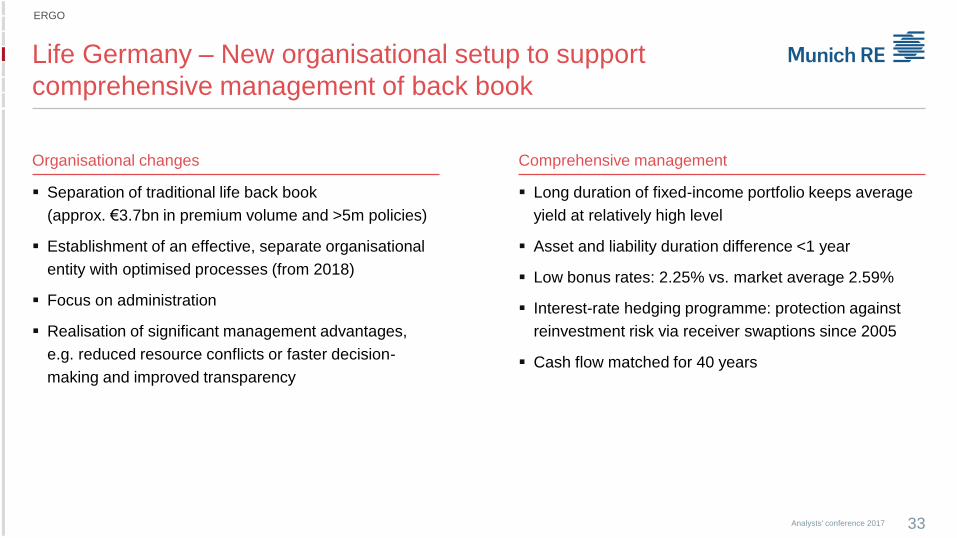
Organisational changes Comprehensive management
Separation of traditional life back book
(approx. €3.7bn in premium volume and >5m policies)
Establishment of an effective, separate organisational
entity with optimised processes (from 2018)
Focus on administration
Realisation of significant management advantages,
e.g. reduced resource conflicts or faster decision-
making and improved transparency
Long duration of fixed-income portfolio keeps average
yield at relatively high level
Asset and liability duration difference <1 year
Low bonus rates: 2.25% vs. market average 2.59%
Interest-rate hedging programme: protection against
reinvestment risk via receiver swaptions since 2005
Cash flow matched for 40 years
Property-casualty Germany – Status 2016
34Analysts' conference 2017
ERGO
1 ERGO Strategy Programme.
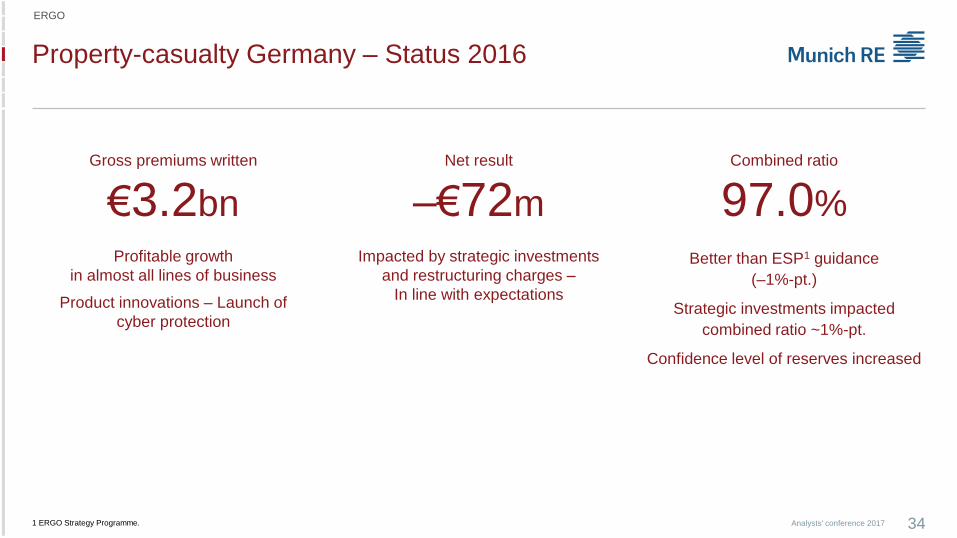
Gross premiums written
€3.2bn
Profitable growth
in almost all lines of business
Product innovations – Launch of
cyber protection
Combined ratio
97.0%
Better than ESP1 guidance
(–1%-pt.)
Strategic investments impacted
combined ratio ~1%-pt.
Confidence level of reserves increased
Net result
–€72m
Impacted by strategic investments
and restructuring charges –
In line with expectations
Property-casualty Germany – Attractive portfolio for
customers, consistent cost reduction
35Analysts' conference 2017
ERGO
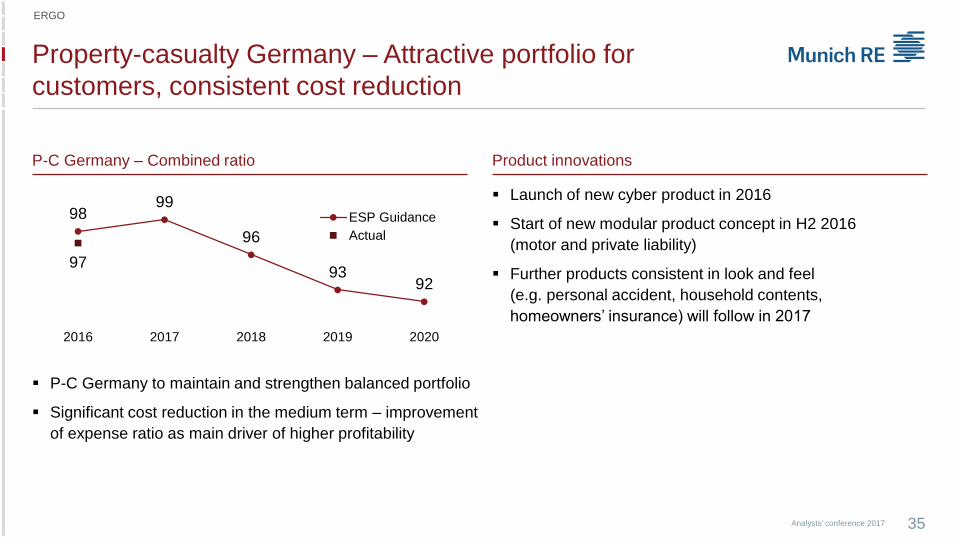
Launch of new cyber product in 2016
Start of new modular product concept in H2 2016
(motor and private liability)
Further products consistent in look and feel
(e.g. personal accident, household contents,
homeowners’ insurance) will follow in 2017
Product innovations
9899
96
9392
97
2016 2017 2018 2019 2020
ESP Guidance
Actual
P-C Germany – Combined ratio
P-C Germany to maintain and strengthen balanced portfolio
Significant cost reduction in the medium term – improvement
of expense ratio as main driver of higher profitability
International – Status 2016
36Analysts' conference 2017
ERGO
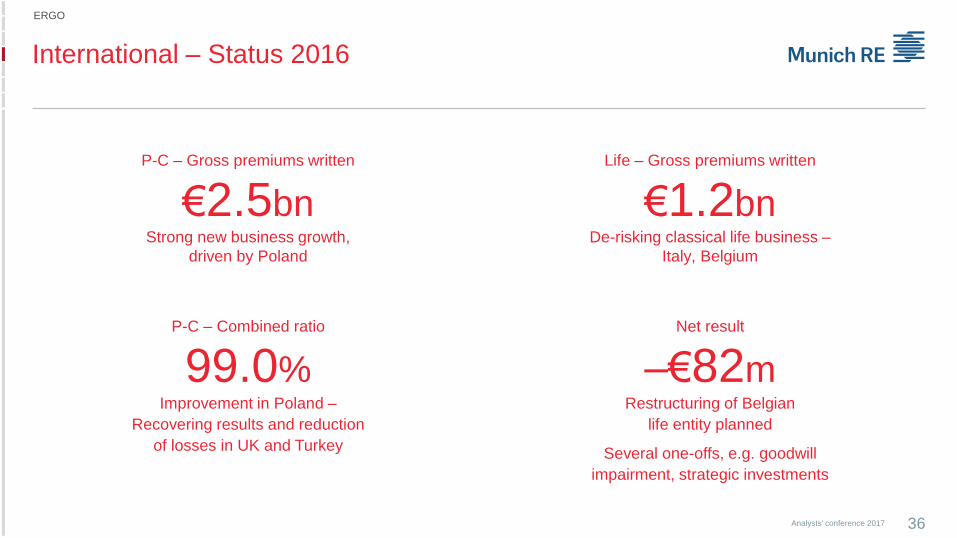
Life – Gross premiums written
€1.2bnDe-risking classical life business –
Italy, Belgium
Net result
–€82mRestructuring of Belgian
life entity planned
Several one-offs, e.g. goodwill
impairment, strategic investments
P-C – Combined ratio
99.0%Improvement in Poland –
Recovering results and reduction
of losses in UK and Turkey
P-C – Gross premiums written
€2.5bnStrong new business growth,
driven by Poland
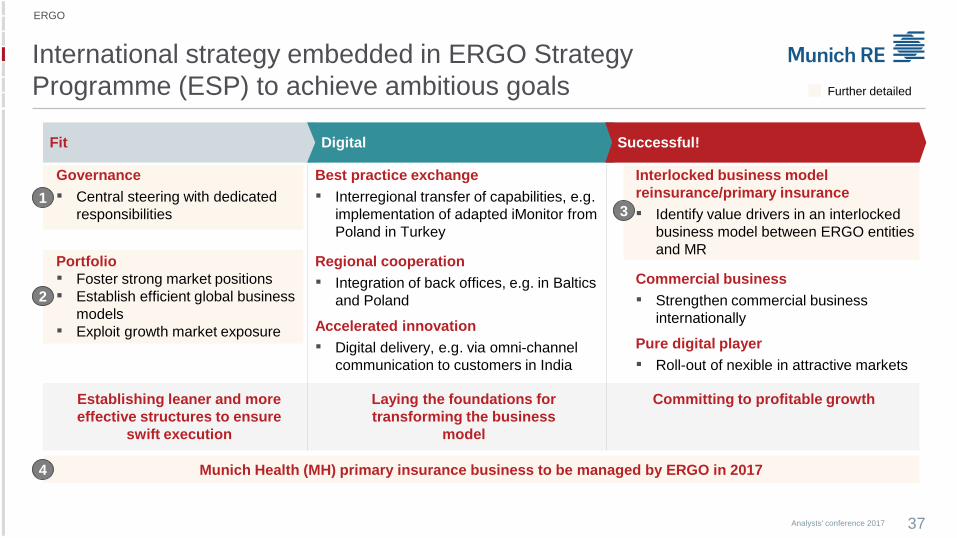
International strategy embedded in ERGO Strategy
Programme (ESP) to achieve ambitious goals
37Analysts' conference 2017
Further detailed
ERGO
Munich Health (MH) primary insurance business to be managed by ERGO in 2017
Establishing leaner and more
effective structures to ensure
swift execution
Laying the foundations for
transforming the business
model
Committing to profitable growth
Fit Digital Successful!
Governance
▪ Central steering with dedicated
responsibilities
Portfolio
▪ Foster strong market positions
▪ Establish efficient global business
models
▪ Exploit growth market exposure
Interlocked business model
reinsurance/primary insurance
▪ Identify value drivers in an interlocked
business model between ERGO entities
and MR
Commercial business
▪ Strengthen commercial business
internationally
Pure digital player
▪ Roll-out of nexible in attractive markets
Best practice exchange
▪ Interregional transfer of capabilities, e.g.
implementation of adapted iMonitor from
Poland in Turkey
Regional cooperation
▪ Integration of back offices, e.g. in Baltics
and Poland
Accelerated innovation
▪ Digital delivery, e.g. via omni-channel
communication to customers in India
31
2
4
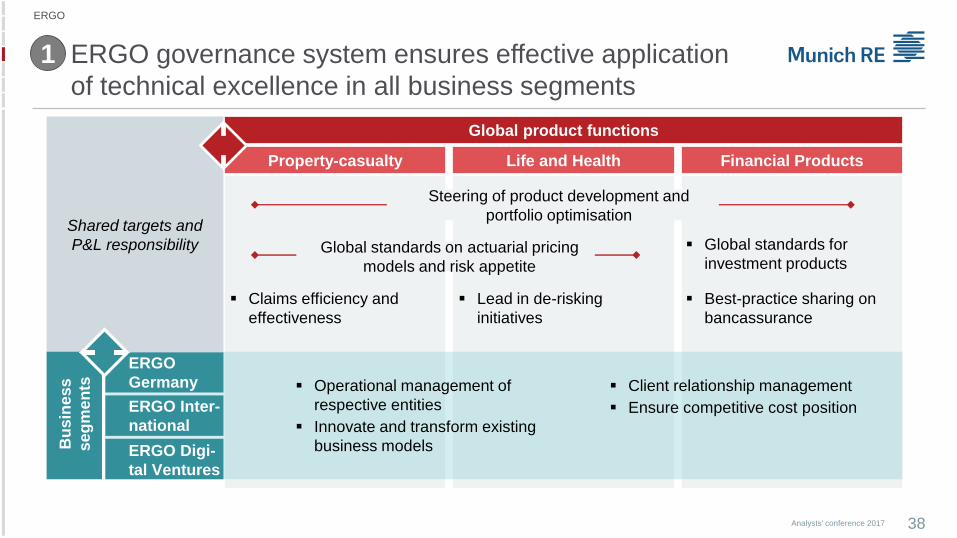
ERGO governance system ensures effective application
of technical excellence in all business segments
38Analysts' conference 2017
Property-casualty
Claims efficiency and
effectiveness
Life and Health Financial Products
Lead in de-risking
initiatives
Global product functions
Steering of product development and
portfolio optimisation
Global standards on actuarial pricing
models and risk appetite
Operational management of
respective entities
Innovate and transform existing
business models
Global standards for
investment products
Best-practice sharing on
bancassurance
Shared targets and
P&L responsibility
Bu
sin
es
s
se
gm
en
ts Client relationship management
Ensure competitive cost position
ERGO
Germany
ERGO Inter-
national
ERGO Digi-
tal Ventures
1
ERGO
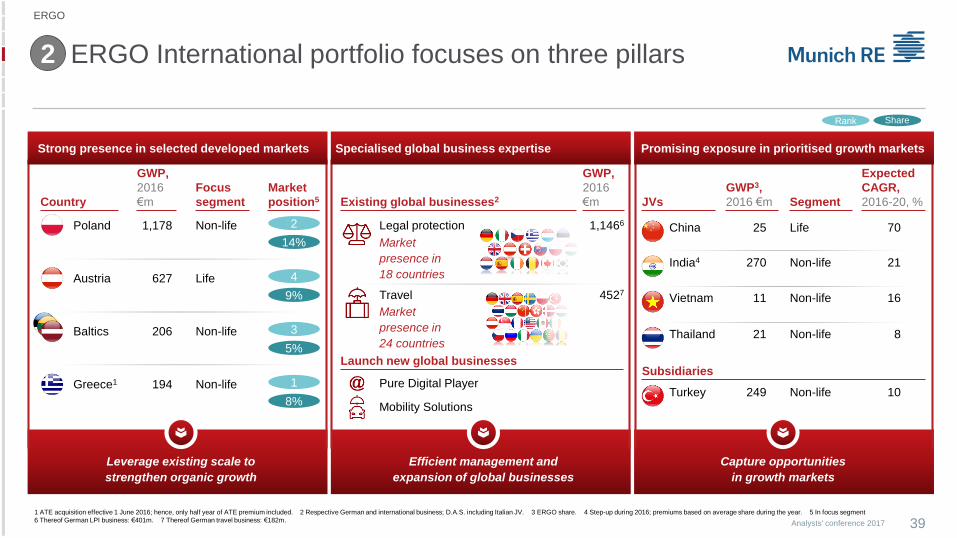
ERGO International portfolio focuses on three pillars
39Analysts' conference 2017
Rank Share
2
ERGO
1 ATE acquisition effective 1 June 2016; hence, only half year of ATE premium included. 2 Respective German and international business; D.A.S. including Italian JV. 3 ERGO share. 4 Step-up during 2016; premiums based on average share during the year. 5 In focus segment
6 Thereof German LPI business: €401m. 7 Thereof German travel business: €182m.
Leverage existing scale to
strengthen organic growth
Capture opportunities
in growth markets
GWP,
2016
€m JVs
Expected
CAGR,
2016-20, %
Promising exposure in prioritised growth markets
Market
position5
GWP,
2016
€mExisting global businesses2
1,1466Legal protection
Market
presence in
18 countries
4527Travel
Efficient management and
expansion of global businesses
Specialised global business expertise
GWP3,
2016 €m Segment
Focus
segmentCountry
India4 21270 Non-life
China 7025 Life
Thailand 821 Non-life
Vietnam 1611 Non-life
627
9%
4LifeAustria
1,178
14%
2Non-lifePoland
194
8%
1Non-lifeGreece1
206
5%
3Non-lifeBaltics
Strong presence in selected developed markets
Market
presence in
24 countries
Subsidiaries
Turkey 10249 Non-lifePure Digital Player
Mobility Solutions
Launch new global businesses

ESP facilitates an interlocked business model between
primary insurance and reinsurance
40Analysts' conference 2017
3
Leverage
Munich Re’s
presence for
market
entries
Regional
market
committees
to coordinate
strategic
initiatives
Link
innovation
labs and
development
processes
Bundled
product
solutions
International
broker
management
Cooperation
in commercial
lines
Facilitation of
cross-selling
(white
labelling)
Automated
underwriting
Leverage
technical
skills from RI
and PI –
establish
business
lines expert
groups
Group-wide
churn rate
analysis
Joint policy
administration
Group-wide
fraud
analytics tool
Data
analytics to
identify
claims
prevention
and risk
mitigation
Leverage
MEAG's
investment
expertise
Monitor
investment
risks centrally
MEAG to
support
financial
product
initiatives
Employee
rotation to
exchange
RI and PI
skills
Joint
approach to
FinTech and
InsurTech
start-ups,
combining
RI and PI
capabilities
Common
data
analytics
metho-
dologies
PI sales
skills to
support RI
services
Strategy
developmentInnovation
Product
development
Sales and
distribution
Risk analysis/
underwriting
Policy
administration
Claims
management
Asset
managementHR
ERGO
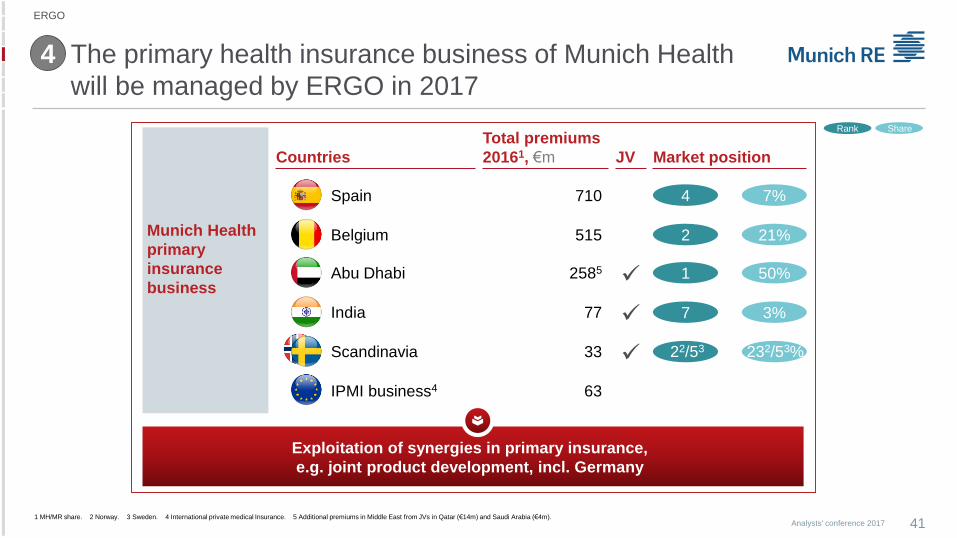
The primary health insurance business of Munich Health
will be managed by ERGO in 2017
41Analysts' conference 2017
Munich Health
primary
insurance
business
1 MH/MR share. 2 Norway. 3 Sweden. 4 International private medical Insurance. 5 Additional premiums in Middle East from JVs in Qatar (€14m) and Saudi Arabia (€4m).
JV
Exploitation of synergies in primary insurance,
e.g. joint product development, incl. Germany
4
Rank Share
Total premiums
20161, €m
710
515
2585
77
63
33
Spain
Belgium
Abu Dhabi
India
IPMI business4
Countries
Scandinavia
Market position
7%4
21%2
50%1
3% 7
232/53%22/53
ERGO

190
International business to contribute substantially to ERGO’s
results by 2020
42Analysts' conference 2017
International and MH PI to contribute
~€190m to overall profit in 2020
▪ Reduction of
traditional back
book in
international Life
business between
2016 and 2020 of
more than €300m
GWP (Italy,
Belgium)
▪ Required capital
will be financed
within ERGO
Group, i.e. there
will be no capital
injection from
Munich Re
-82
340
42
78
~600+
530
P2020A2016
39
A2016
~+€900m
P2020
19,500
13,600
5,900
CAGR
4,032
18,589
1,354
13,203 ~1%
~2%
Ambition
2021
Total premium, €mNet profit, €m Total premium incl. JVs, €m
International and MH PI premiums
amount to ~€5,900m in 2020
Premiums generated by JVs amount
to ~€1,400m in 2020
P2020
20,900
7,300
13,600
A2016
~+€1,800m
13,203
19,061
4,393
1,465
~1%
~6%
Germany1 International Munich Health PI
1 Includes segments “Life and Health Germany” as well as “Property-casualty Germany”, hence including German share of LPI business as well as German and international travel business
CAGR
Total
13,60013,600340
ERGO

43Analysts' conference 2017
Reinsurance
Property-casualty
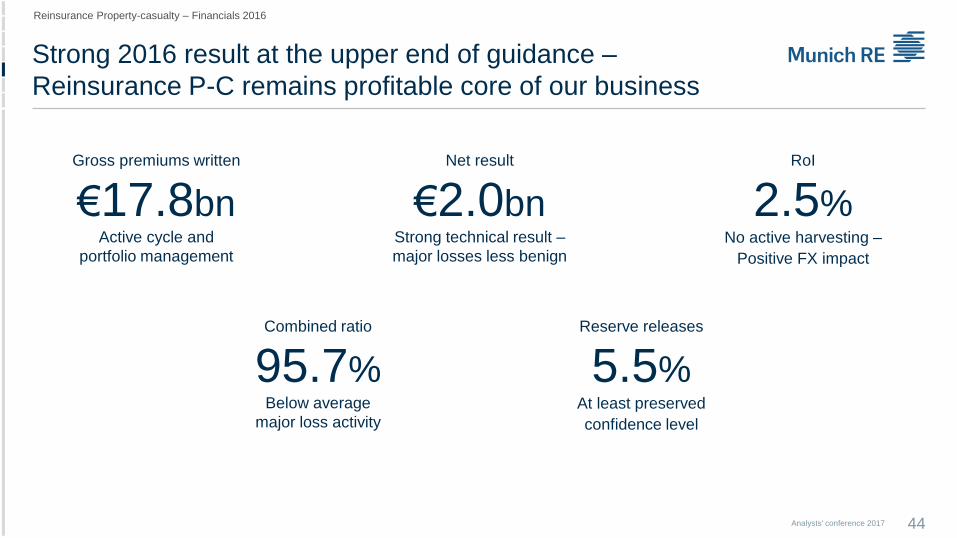
Strong 2016 result at the upper end of guidance –
Reinsurance P-C remains profitable core of our business
44Analysts' conference 2017
Gross premiums written
€17.8bnActive cycle and
portfolio management
Reserve releases
5.5%At least preserved
confidence level
Combined ratio
95.7%Below average
major loss activity
Net result
€2.0bnStrong technical result –
major losses less benign
RoI
2.5%No active harvesting –
Positive FX impact
Reinsurance Property-casualty – Financials 2016
€4.8bnContinuous growth in
specialty and niche business
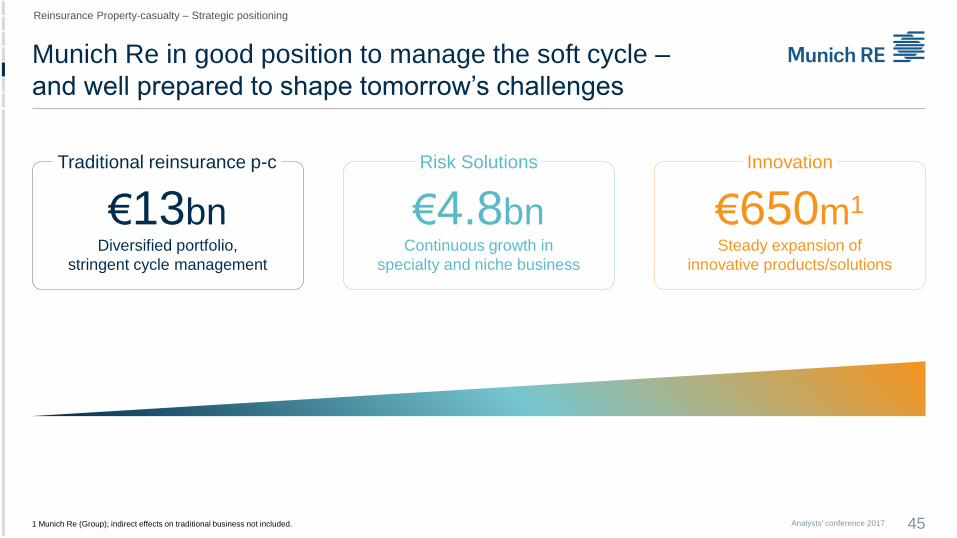
Munich Re in good position to manage the soft cycle –
and well prepared to shape tomorrow’s challenges
Reinsurance Property-casualty – Strategic positioning
Analysts' conference 2017 45
€650m1
Steady expansion of
innovative products/solutions
€13bnDiversified portfolio,
stringent cycle management
1 Munich Re (Group); indirect effects on traditional business not included.
Traditional reinsurance p-c Risk Solutions Innovation
Munich Re
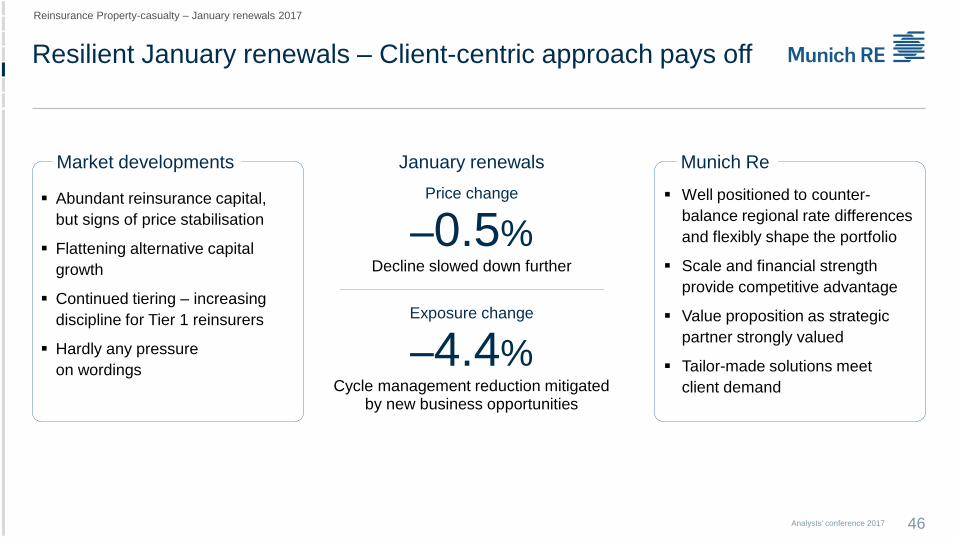
Resilient January renewals – Client-centric approach pays off
46Analysts' conference 2017
Reinsurance Property-casualty – January renewals 2017
Well positioned to counter-
balance regional rate differences
and flexibly shape the portfolio
Scale and financial strength
provide competitive advantage
Value proposition as strategic
partner strongly valued
Tailor-made solutions meet
client demand
Abundant reinsurance capital,
but signs of price stabilisation
Flattening alternative capital
growth
Continued tiering – increasing
discipline for Tier 1 reinsurers
Hardly any pressure
on wordings
January renewals
Price change
–0.5%Decline slowed down further
Exposure change
–4.4%Cycle management reduction mitigated
by new business opportunities
Market developments
MARKETS
Sample
deals/opportunities
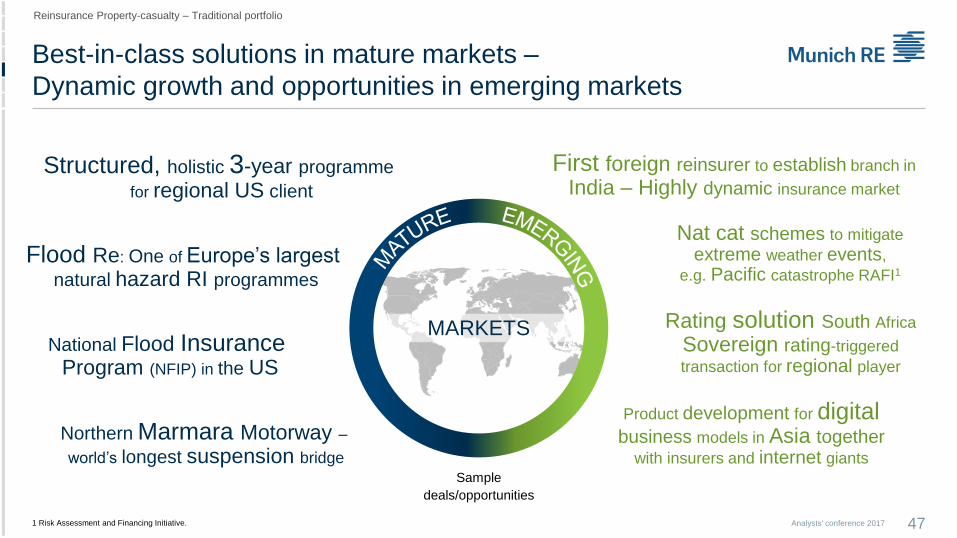
Best-in-class solutions in mature markets –
Dynamic growth and opportunities in emerging markets
47Analysts' conference 2017
Reinsurance Property-casualty – Traditional portfolio
Northern Marmara Motorway –world’s longest suspension bridge
Structured, holistic 3-year programme
for regional US client
National Flood Insurance Program (NFIP) in the US
Flood Re: One of Europe’s largest natural hazard RI programmes
Nat cat schemes to mitigate
extreme weather events,
e.g. Pacific catastrophe RAFI1
Rating solution South Africa
Sovereign rating-triggered
transaction for regional player
Product development for digital business models in Asia together
with insurers and internet giants
First foreign reinsurer to establish branch in
India – Highly dynamic insurance market
1 Risk Assessment and Financing Initiative.

Rigorous portfolio and cycle management
ensures portfolio profitability above cost of capital
48Analysts' conference 2017
Reinsurance Property-casualty – Traditional portfolio
1 Bubble size reflects gross premiums written in 2013 (grey) – 2016 (blue). 2 Economic profit.
2013 2016
Other
Casualty
Property
Property
Continuous reduction
as economic profitability
declined
Casualty
Less pricing pressure –
increased relative
contribution to value
generation
CAGR: ~–6%
CAGR: ~+11%
CAGR: ~–3%
0% Share in value generation2 100%
Low
P
ricin
g p
ressure
Hig
h
Other
ILLUSTRATIVE
Casualty
Property
Premium development
Portfolio management based on economic management principles1
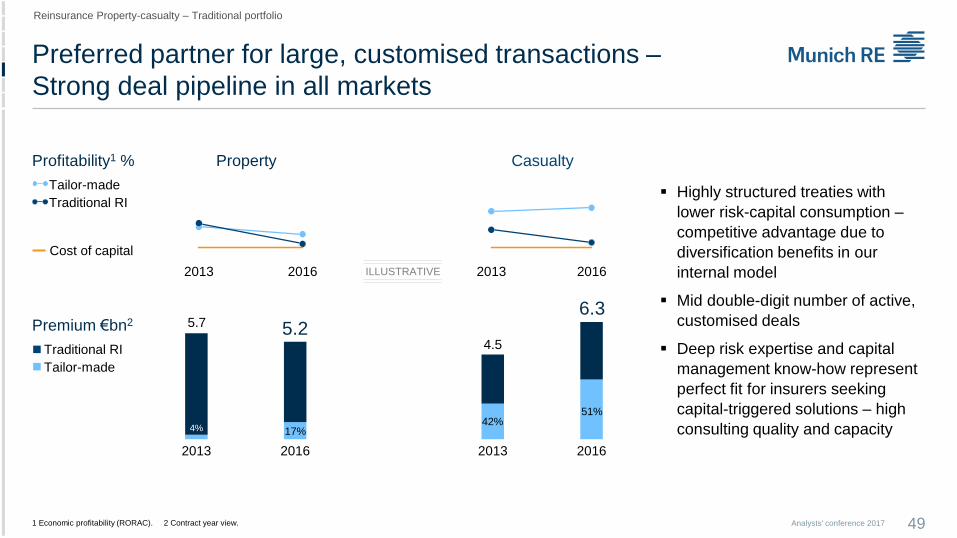
Preferred partner for large, customised transactions –
Strong deal pipeline in all markets
49Analysts' conference 2017
Reinsurance Property-casualty – Traditional portfolio
1 Economic profitability (RORAC). 2 Contract year view.
2013 2016
Cost of capital
Tailor-made
Traditional RI
Profitability1 %
2013 2016 ILLUSTRATIVE
Highly structured treaties with
lower risk-capital consumption –
competitive advantage due to
diversification benefits in our
internal model
Mid double-digit number of active,
customised deals
Deep risk expertise and capital
management know-how represent
perfect fit for insurers seeking
capital-triggered solutions – high
consulting quality and capacity
2013 2016 2013 2016
Traditional RI
Tailor-made
Premium €bn2 5.7 5.24.5
6.3
4% 17%42%
51%
Property Casualty
0
100
200
2013 2014 2015 2016
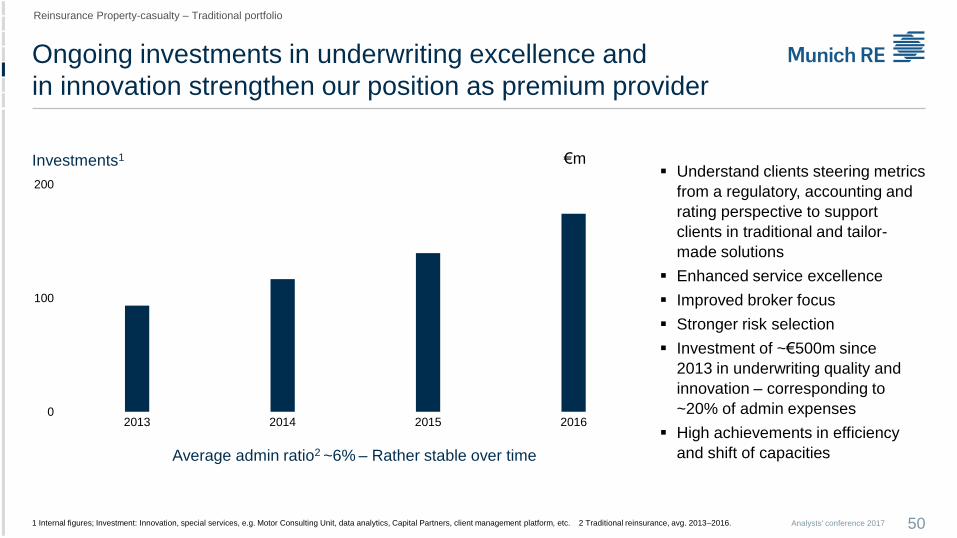
Understand clients steering metrics
from a regulatory, accounting and
rating perspective to support
clients in traditional and tailor-
made solutions
Enhanced service excellence
Improved broker focus
Stronger risk selection
Investment of ~€500m since
2013 in underwriting quality and
innovation – corresponding to
~20% of admin expenses
High achievements in efficiency
and shift of capacities
Ongoing investments in underwriting excellence and
in innovation strengthen our position as premium provider
50Analysts' conference 2017
Reinsurance Property-casualty – Traditional portfolio
1 Internal figures; Investment: Innovation, special services, e.g. Motor Consulting Unit, data analytics, Capital Partners, client management platform, etc. 2 Traditional reinsurance, avg. 2013–2016.
Investments1
Average admin ratio2 ~6% – Rather stable over time
€m
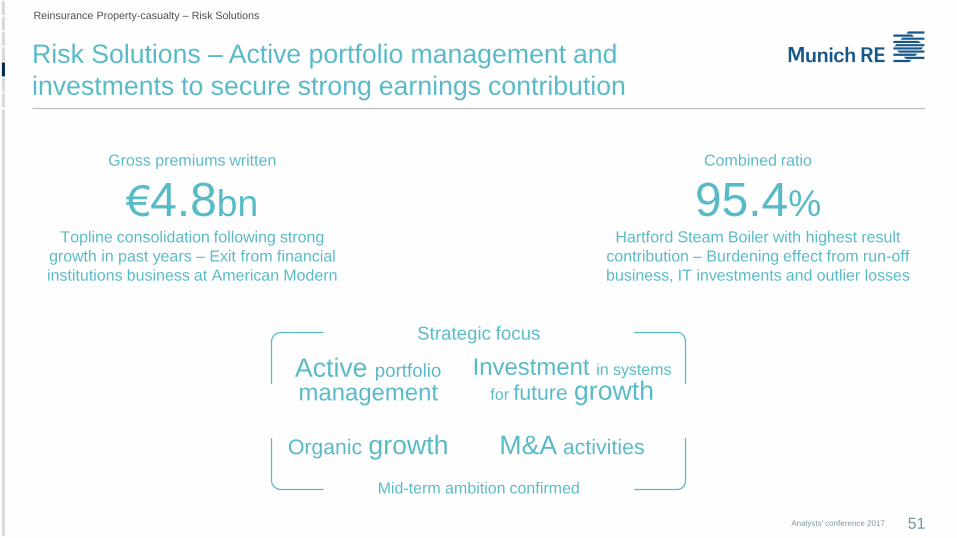
Combined ratio
95.4%Hartford Steam Boiler with highest result
contribution – Burdening effect from run-off
business, IT investments and outlier losses
Risk Solutions – Active portfolio management and
investments to secure strong earnings contribution
51Analysts' conference 2017
Reinsurance Property-casualty – Risk Solutions
Active portfolio
management
Organic growth
Investment in systems
for future growth
M&A activities
Mid-term ambition confirmed
Gross premiums written
€4.8bnTopline consolidation following strong
growth in past years – Exit from financial
institutions business at American Modern
Strategic focus
Significant focus on innovation … … with significant impact on business already today
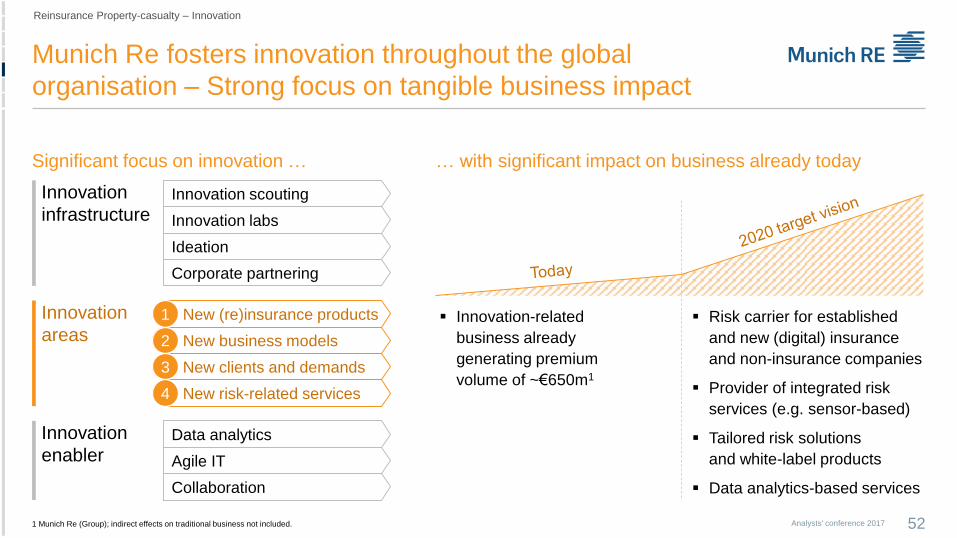
Munich Re fosters innovation throughout the global
organisation – Strong focus on tangible business impact
52Analysts' conference 20171 Munich Re (Group); indirect effects on traditional business not included.
Innovation
infrastructureInnovation scouting
Innovation labs
Ideation
Corporate partnering
Innovation
enablerData analytics
Agile IT
Collaboration
Innovation-related
business already
generating premium
volume of ~€650m1
Risk carrier for established
and new (digital) insurance
and non-insurance companies
Provider of integrated risk
services (e.g. sensor-based)
Tailored risk solutions
and white-label products
Data analytics-based services
Innovation
areas New (re)insurance products
New business models
New clients and demands
New risk-related services
1
2
3
4
Reinsurance Property-casualty – Innovation

Strong long-term growth in cyber (re)insurance expected –
Munich Re with leading-edge expertise and market presence
53Analysts' conference 2017
GWP global cyber insurance market1
1 Estimates based on different external sources (Marsh & McLennan, Barbican Insurance, Allianz).
GWP Munich Re cyber portfolio US$ mUS$ bn
Reinsurance: First mover and global market leader
Dynamic growth through joint projects with cedents
Steady growth in the US
Strong accumulation models
Primary insurance: Specialised single-risk taker
Hartford Steam Boiler: Established player in US
for SMEs and individuals
Corporate Insurance Partner: Focus on larger corporate
clients – Cooperation with IT providers and Beazley
Reinsurance Property-casualty – Innovation areas: Cyber (re)insurance
New (re)insurance products1
0
5
10
2015 2016 2019 2020
RoWUS
126 135
191
263
2013 2014 2015 2016
Reinsurance
Primary insurance
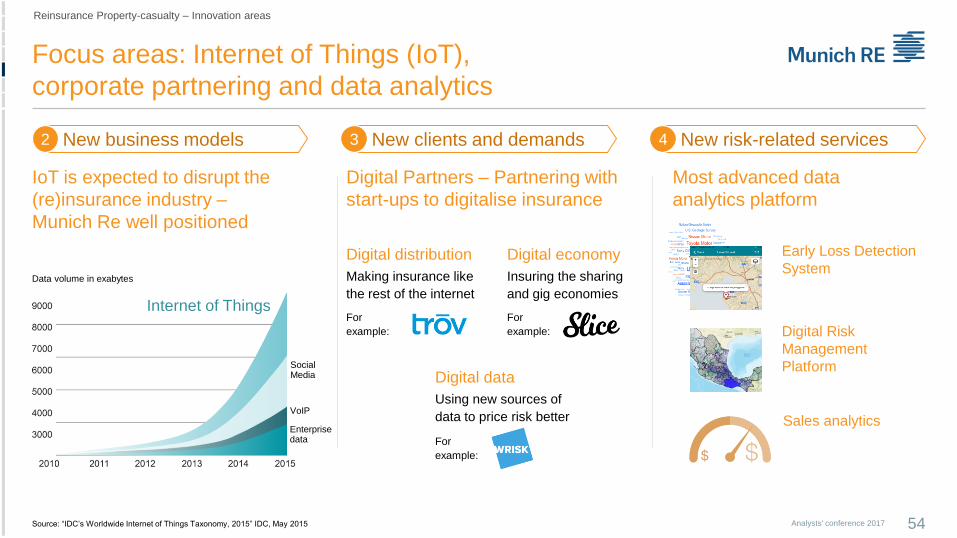
Focus areas: Internet of Things (IoT),
corporate partnering and data analytics
54Analysts' conference 2017
Data volume in exabytes
IoT is expected to disrupt the
(re)insurance industry –
Munich Re well positioned
Digital Partners – Partnering with
start-ups to digitalise insurance
Most advanced data
analytics platform
Sales analytics
Early Loss Detection
System
Digital Risk
Management
Platform
Reinsurance Property-casualty – Innovation areas
Internet of Things
New business models2 New clients and demands3 New risk-related services4
Digital distribution
Making insurance like
the rest of the internet
For
example:
Digital economy
Insuring the sharing
and gig economies
For
example:
Digital data
Using new sources of
data to price risk better
For
example:
Source: “IDC’s Worldwide Internet of Things Taxonomy, 2015” IDC, May 2015
SocialMedia
VoIP
Enterprise data

55Analysts' conference 2017
Reinsurance
Life
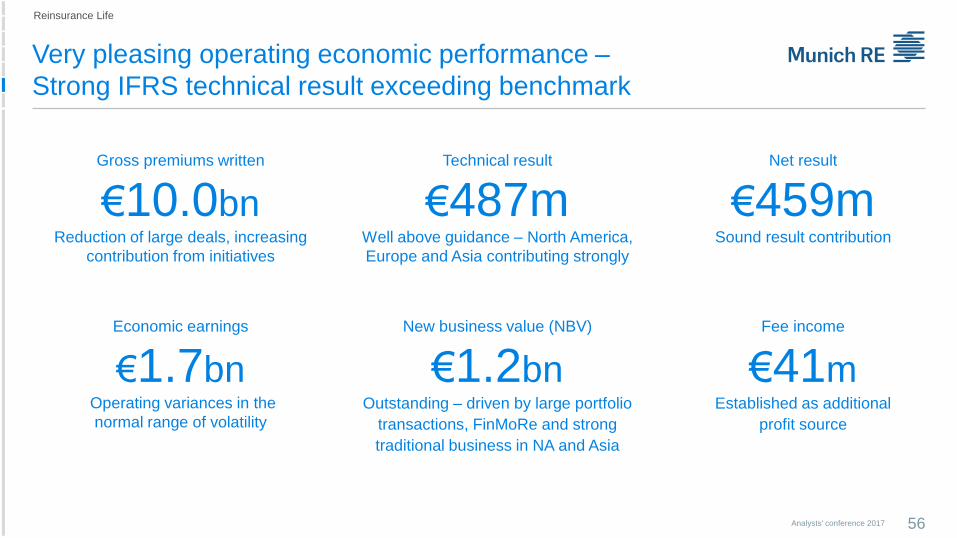
Very pleasing operating economic performance –
Strong IFRS technical result exceeding benchmark
56Analysts' conference 2017
Reinsurance Life
Gross premiums written
€10.0bnReduction of large deals, increasing
contribution from initiatives
Economic earnings
€1.7bnOperating variances in the
normal range of volatility
Net result
€459mSound result contribution
Technical result
€487mWell above guidance – North America,
Europe and Asia contributing strongly
New business value (NBV)
€1.2bnOutstanding – driven by large portfolio
transactions, FinMoRe and strong
traditional business in NA and Asia
Fee income
€41mEstablished as additional
profit source
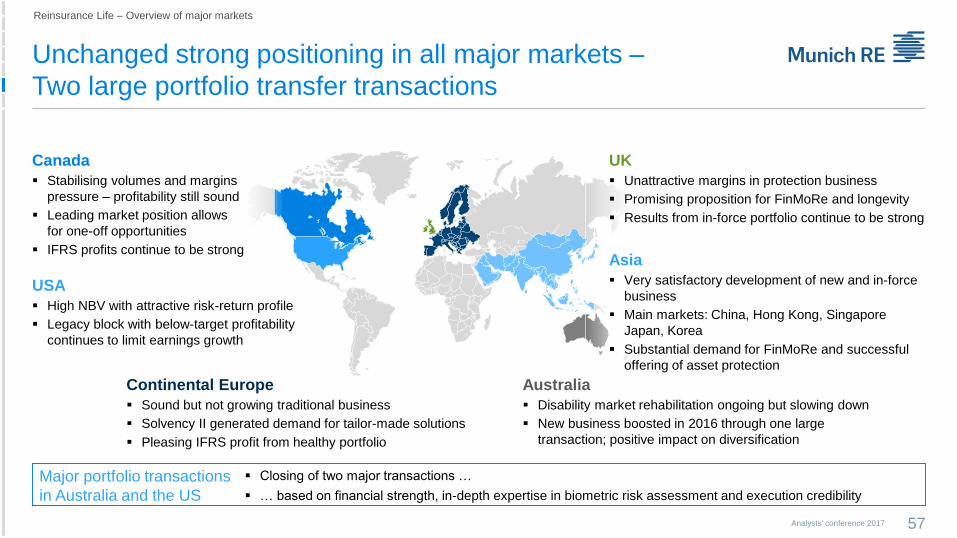
Unchanged strong positioning in all major markets –
Two large portfolio transfer transactions
57Analysts' conference 2017
Reinsurance Life – Overview of major markets
Major portfolio transactions
in Australia and the US
Closing of two major transactions …
… based on financial strength, in-depth expertise in biometric risk assessment and execution credibility
UK
Unattractive margins in protection business
Promising proposition for FinMoRe and longevity
Results from in-force portfolio continue to be strong
Asia
Very satisfactory development of new and in-force
business
Main markets: China, Hong Kong, Singapore
Japan, Korea
Substantial demand for FinMoRe and successful
offering of asset protection
Canada
Stabilising volumes and margins
pressure – profitability still sound
Leading market position allows
for one-off opportunities
IFRS profits continue to be strong
USA
High NBV with attractive risk-return profile
Legacy block with below-target profitability
continues to limit earnings growth
Continental Europe
Sound but not growing traditional business
Solvency II generated demand for tailor-made solutions
Pleasing IFRS profit from healthy portfolio
Australia
Disability market rehabilitation ongoing but slowing down
New business boosted in 2016 through one large
transaction; positive impact on diversification

Initiative portfolio – Important IFRS profit pool and
significant contribution to economic earnings
58Analysts' conference 2017
Reinsurance Life – Initiative portfolio
Retu
rnLow
er Overweight
Neutral
Underweight
Unique
Compared to competitors
Mortality
Asset protection
Asia
Longevity
FinMoRe
Morbidity
Hig
her
ILLUSTRATIVE
RiskHigher Lower
Initiative portfolio
Asset protectionGaining significance
AsiaSustained growth supported by services
LongevityBook developed carefully
FinMoReWell established value proposition

Innovation has top priority – Concrete projects underway
59Analysts' conference 2017
Reinsurance Life – Innovation
Focus on innovation projects
Clients outsource parts of
services to us
Clients engage us for our
broader scope, lack of legacy
and channel conflicts
Clients share data to benefit
from benchmarking services
and predictive capabilities
Asset protection
Asia
Longevity
FinMoRe
Successful set of
well established initiatives
Efficiently
managed
traditional
business
Established New
New ILLUSTRATIVE
SII
Solutions
New (re)insurance products and business models
Efficient business processes and new risk-related services
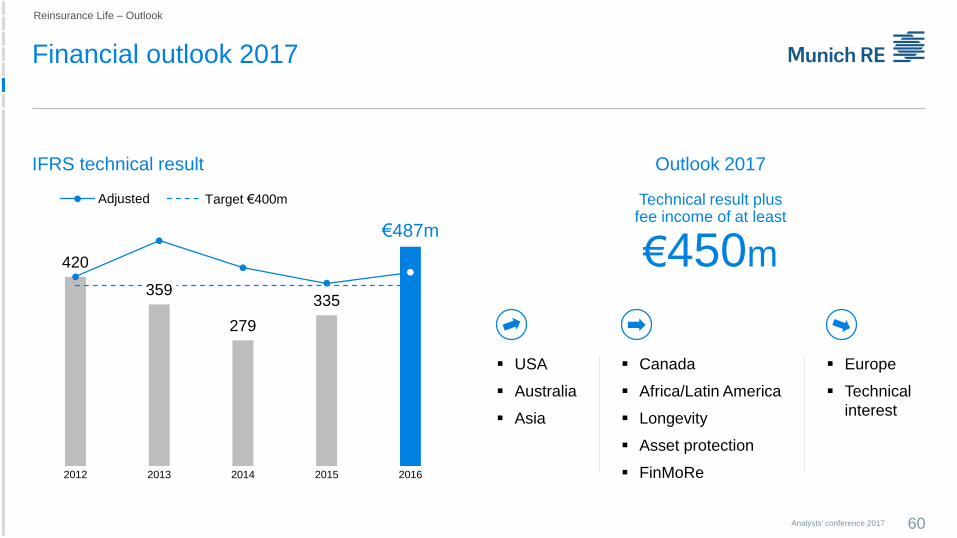
Technical result plus fee income of at least
€450m
Financial outlook 2017
Reinsurance Life – Outlook
Analysts' conference 2017 60
IFRS technical result
USA
Australia
Asia
Canada
Africa/Latin America
Longevity
Asset protection
FinMoRe
Europe
Technical
interest
Outlook 2017
420
359
279
335
€487m
2012 2013 2014 2015 2016
Adjusted Target €400m

Analysts' conference 2017 61
Additional
information
Turning risk into sustainable value –
Company success through responsibility
62Analysts' conference 2017
… implementation … … external recognitionCommitments…
1 Additional information: Corporate Responsibility
Environmental, Social, Governance (ESG)
Group-wide carbon-neutrality since 2015; shared-
value projects closely related to our core business;
high corporate governance standards
Corporate responsibility in insurance
Integration of ESG aspects into core business
(process, guidelines, tools); prudent Group-wide
control, support and training
Corporate responsibility in investment
Sustainability one criterion for investment decision;
incorporated in our Group-wide investment guideline
We actively embrace ESG factors along the value chain in our insurance business operations and asset management
Innovation: Munich Re has established a strong position
to tap opportunities – focus on tangible business impact
63Analysts' conference 2017
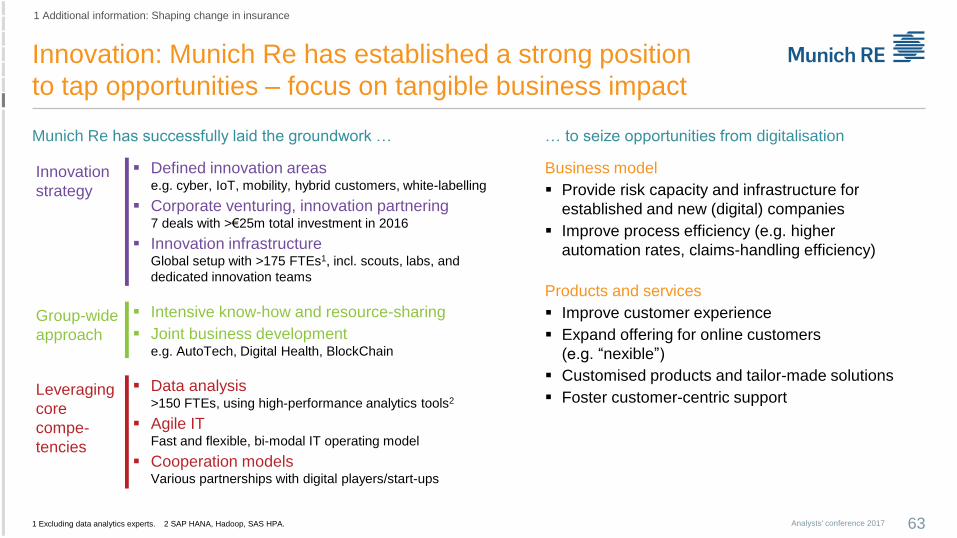
1 Additional information: Shaping change in insurance
Munich Re has successfully laid the groundwork … … to seize opportunities from digitalisation
1 Excluding data analytics experts. 2 SAP HANA, Hadoop, SAS HPA.
Business model
Provide risk capacity and infrastructure for
established and new (digital) companies
Improve process efficiency (e.g. higher
automation rates, claims-handling efficiency)
Products and services
Improve customer experience
Expand offering for online customers
(e.g. “nexible”)
Customised products and tailor-made solutions
Foster customer-centric support
Defined innovation areas e.g. cyber, IoT, mobility, hybrid customers, white-labelling
Corporate venturing, innovation partnering 7 deals with >€25m total investment in 2016
Innovation infrastructure Global setup with >175 FTEs1, incl. scouts, labs, and
dedicated innovation teams
Data analysis>150 FTEs, using high-performance analytics tools2
Agile IT Fast and flexible, bi-modal IT operating model
Cooperation modelsVarious partnerships with digital players/start-ups
Intensive know-how and resource-sharing
Joint business developmente.g. AutoTech, Digital Health, BlockChain
Innovation
strategy
Leveraging
core
compe-
tencies
Group-wide
approach
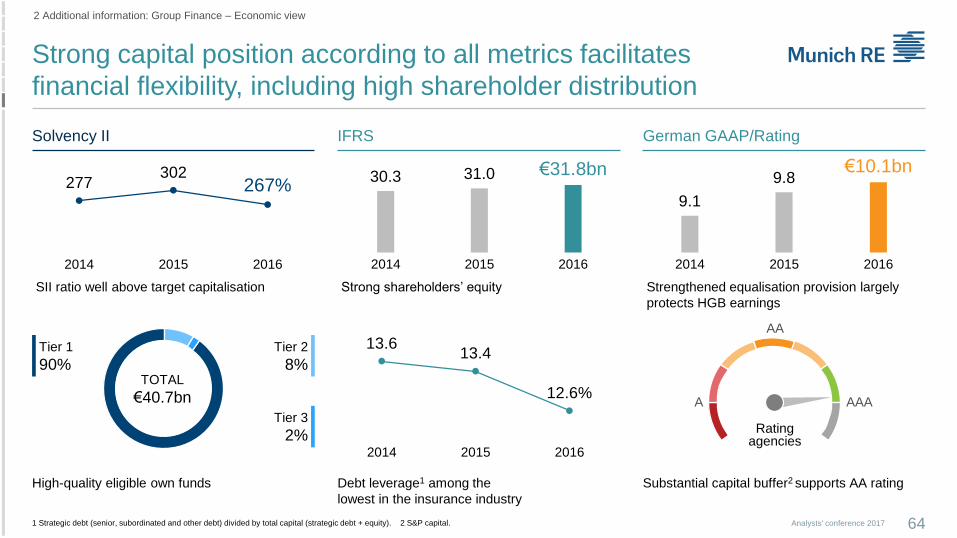
Strong capital position according to all metrics facilitates
financial flexibility, including high shareholder distribution
Solvency II IFRS German GAAP/Rating
277302
267%
2014 2015 2016
30.3 31.0 €31.8bn
2014 2015 2016
9.1
9.8€10.1bn
2014 2015 2016
High-quality eligible own funds
Tier 2
8%Tier 1
90%
Tier 3
2%
TOTAL
€40.7bn
SII ratio well above target capitalisation Strong shareholders’ equity
Debt leverage1 among the
lowest in the insurance industry
13.613.4
12.6%
2014 2015 2016
Strengthened equalisation provision largely
protects HGB earnings
Substantial capital buffer2 supports AA rating
AA
A AAA
Ratingagencies
1 Strategic debt (senior, subordinated and other debt) divided by total capital (strategic debt + equity). 2 S&P capital. Analysts' conference 2017 64
2 Additional information: Group Finance – Economic view
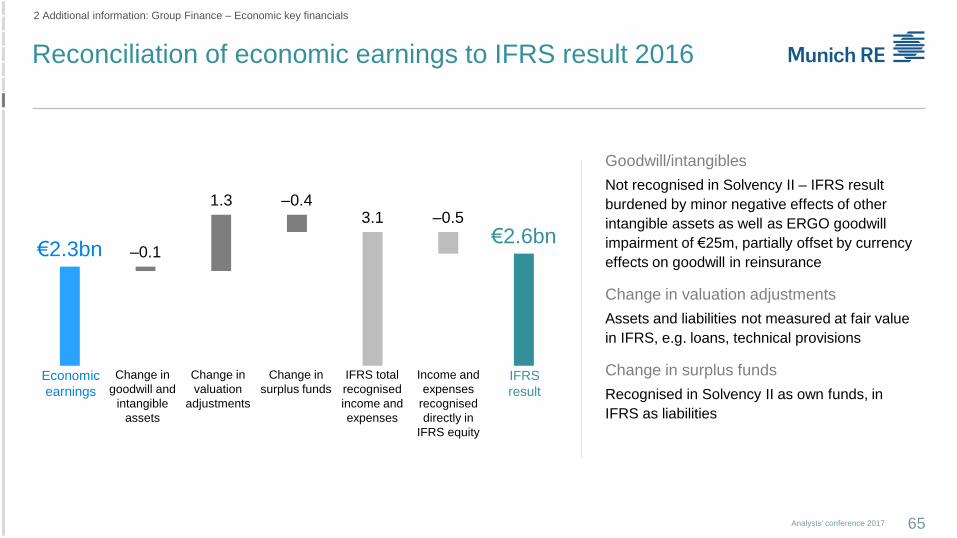
Reconciliation of economic earnings to IFRS result 2016
65Analysts' conference 2017
2 Additional information: Group Finance – Economic key financials
Goodwill/intangibles
Not recognised in Solvency II – IFRS result
burdened by minor negative effects of other
intangible assets as well as ERGO goodwill
impairment of €25m, partially offset by currency
effects on goodwill in reinsurance
Change in valuation adjustments
Assets and liabilities not measured at fair value
in IFRS, e.g. loans, technical provisions
Change in surplus funds
Recognised in Solvency II as own funds, in
IFRS as liabilities
€2.3bn –0.1
1.3 –0.43.1 –0.5
€2.6bn
Economic
earnings
Change in
goodwill and
intangible
assets
Change in
valuation
adjustments
Change in
surplus fundsIFRS
result
Income and
expenses
recognised
directly in
IFRS equity
IFRS total
recognised
income and
expenses
€2.6bn –0.3 0.1
1.0 €3.4bn
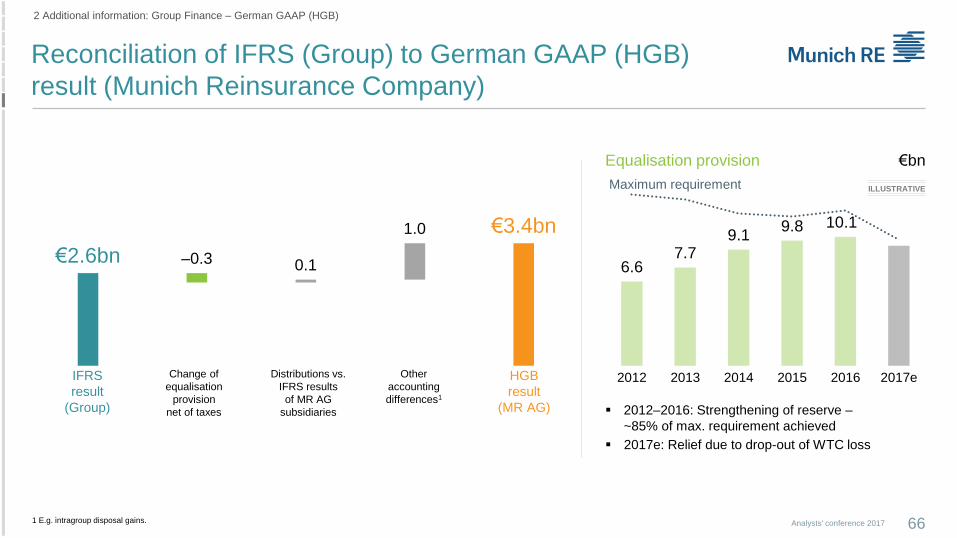
Reconciliation of IFRS (Group) to German GAAP (HGB)
result (Munich Reinsurance Company)
66Analysts' conference 2017
2 Additional information: Group Finance – German GAAP (HGB)
Equalisation provision €bn
6.67.7
9.19.8 10.1
2012 2013 2014 2015 2016 2017eDistributions vs.
IFRS results
of MR AG
subsidiaries
Other
accounting
differences1
Change of
equalisation
provision
net of taxes
HGB
result
(MR AG)
IFRS
result
(Group)
Maximum requirement
2012–2016: Strengthening of reserve –
~85% of max. requirement achieved
2017e: Relief due to drop-out of WTC loss
ILLUSTRATIVE
1 E.g. intragroup disposal gains.

Economic earnings 2016 – Munich Re (Group)
Outlook 2017: In the range of IFRS result target
67Analysts' conference 2017
2 Additional information: Group Finance – Results reconciliation
€bn Actual Normalised
Operating economic earnings 1.4 2.0
Expected return existing business 0.6
New business value 1.0
Operating variances existing business –0.2
Economic effects 2.5 1.6
Interest rate 0.0
Equity 0.3
Credit 0.9
Currency 0.8
Other1 0.5
Other non-operating earnings –1.6 –1.1
Total economic earnings 2016 2.3 2.5
Total economic earnings 2015 5.3 2.6
Operating economic earnings
High operating economic earnings in reinsurance compensate
for negative ERGO contribution; normalised for reinsurance
P-C prudency margin of €0.7bn, new business value amounts
to €1.7bn
Normalisation: Operating economic earnings adjusted for
variances in new and existing business
Economic effects
Effects from development of capital market parameters very
pleasing overall, however diverse across segments:
Reinsurance with high economic gains on risk-free interest
rates, credit spreads, FX and equities; economic losses at
ERGO driven by further interest-rate decline over the year
Normalisation: Adjusted to lower expectation in reinsurance
and higher at ERGO
Other non-operating earnings
Normalisation: Other non-operating earnings adjusted to
expected tax rate (all other line items pre-tax) and other items
1 Primarily related to illiquid investments: Property, infrastructure, forestry, hedge funds, private equity.
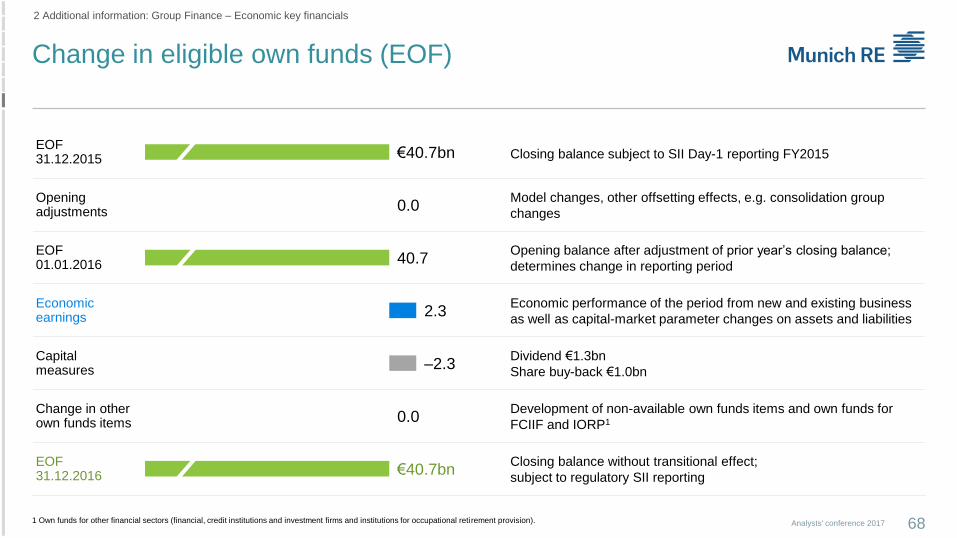
Change in eligible own funds (EOF)
68Analysts' conference 2017
2 Additional information: Group Finance – Economic key financials
EOF 31.12.2015 Closing balance subject to SII Day-1 reporting FY2015
Opening adjustments
Model changes, other offsetting effects, e.g. consolidation group
changes
EOF 01.01.2016
Opening balance after adjustment of prior year’s closing balance;
determines change in reporting period
Economicearnings
Economic performance of the period from new and existing business
as well as capital-market parameter changes on assets and liabilities
Capitalmeasures
Dividend €1.3bn
Share buy-back €1.0bn
Change in other own funds items
Development of non-available own funds items and own funds for
FCIIF and IORP1
EOF 31.12.2016
Closing balance without transitional effect;
subject to regulatory SII reporting
€40.7bn
0.0
40.7
2.3
–2.3
0.0
€40.7bn
1 Own funds for other financial sectors (financial, credit institutions and investment firms and institutions for occupational reti rement provision).
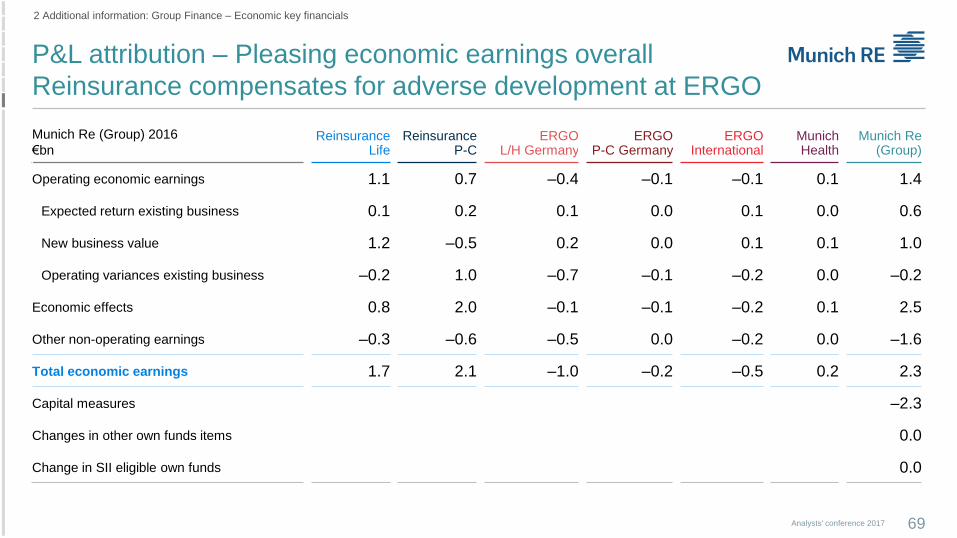
P&L attribution – Pleasing economic earnings overall
Reinsurance compensates for adverse development at ERGO
69Analysts' conference 2017
2 Additional information: Group Finance – Economic key financials
Munich Re (Group) 2016
€bnReinsurance
LifeReinsurance
P-CERGO
L/H GermanyERGO
P-C GermanyERGO
InternationalMunichHealth
Munich Re(Group)
Operating economic earnings 1.1 0.7 –0.4 –0.1 –0.1 0.1 1.4
Expected return existing business 0.1 0.2 0.1 0.0 0.1 0.0 0.6
New business value 1.2 –0.5 0.2 0.0 0.1 0.1 1.0
Operating variances existing business –0.2 1.0 –0.7 –0.1 –0.2 0.0 –0.2
Economic effects 0.8 2.0 –0.1 –0.1 –0.2 0.1 2.5
Other non-operating earnings –0.3 –0.6 –0.5 0.0 –0.2 0.0 –1.6
Total economic earnings 1.7 2.1 –1.0 –0.2 –0.5 0.2 2.3
Capital measures –2.3
Changes in other own funds items 0.0
Change in SII eligible own funds 0.0

IFRS equity 31.12.2016 €31.8bn
Goodwill and intangible assets –3.6
Valuation adjustments 5.6 6.9
Surplus funds (‘free RfB’) 2.3
Excess of assets over liabilities 37.4
Subordinated liabilities 4.8
Foreseeable dividends, distributions and own shares1 –1.1
Restrictions2 –1.0
Basic own funds 40.1
Ancillary own funds 0.0
Restrictions from tiering 0.0
Own funds for FCIIF and IORP3 0.6
Eligible own funds 31.12.2016 €40.7bn
Reconciliation of IFRS equity to eligible own funds
1 Foreseeable distributions from share buy-backs (–€0.3bn), foreseeable dividends (€0.0bn) and own shares (–€0.7bn). 2 Deduction of non-available own funds items of (€0.4bn) (e.g. non-available surplus funds) and deduction of own funds from participations in other financial sectors. 3 Own funds for other financial sectors (financial, credit institutions and investment firms and institutions for occupational retirement provision).
2 Additional information: Group Finance – Solvency II and Rating
Analysts' conference 2017 70
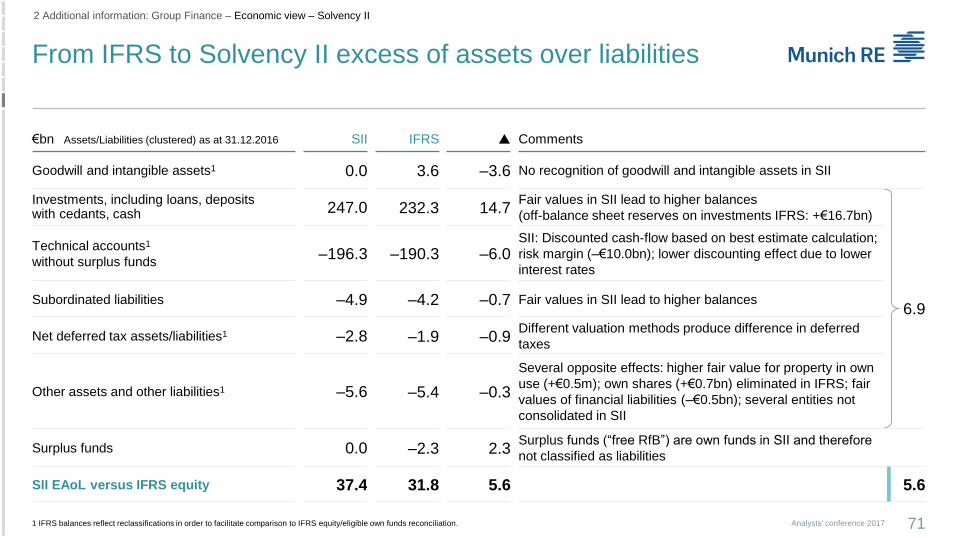
From IFRS to Solvency II excess of assets over liabilities
2 Additional information: Group Finance – Economic view – Solvency II
€bn Assets/Liabilities (clustered) as at 31.12.2016 SII IFRS Comments
Goodwill and intangible assets1 0.0 3.6 –3.6 No recognition of goodwill and intangible assets in SII
Investments, including loans, deposits with cedants, cash 247.0 232.3 14.7
Fair values in SII lead to higher balances
(off-balance sheet reserves on investments IFRS: +€16.7bn)
6.9
Technical accounts1
without surplus funds–196.3 –190.3 –6.0
SII: Discounted cash-flow based on best estimate calculation;
risk margin (–€10.0bn); lower discounting effect due to lower
interest rates
Subordinated liabilities –4.9 –4.2 –0.7 Fair values in SII lead to higher balances
Net deferred tax assets/liabilities1 –2.8 –1.9 –0.9Different valuation methods produce difference in deferred
taxes
Other assets and other liabilities1 –5.6 –5.4 –0.3
Several opposite effects: higher fair value for property in own
use (+€0.5m); own shares (+€0.7bn) eliminated in IFRS; fair
values of financial liabilities (–€0.5bn); several entities not
consolidated in SII
Surplus funds 0.0 –2.3 2.3Surplus funds (“free RfB”) are own funds in SII and therefore
not classified as liabilities
SII EAoL versus IFRS equity 37.4 31.8 5.6 5.6
1 IFRS balances reflect reclassifications in order to facilitate comparison to IFRS equity/eligible own funds reconciliation. Analysts' conference 2017 71
3,1222,581
731 486
2015 2016 Q42015
Q42016
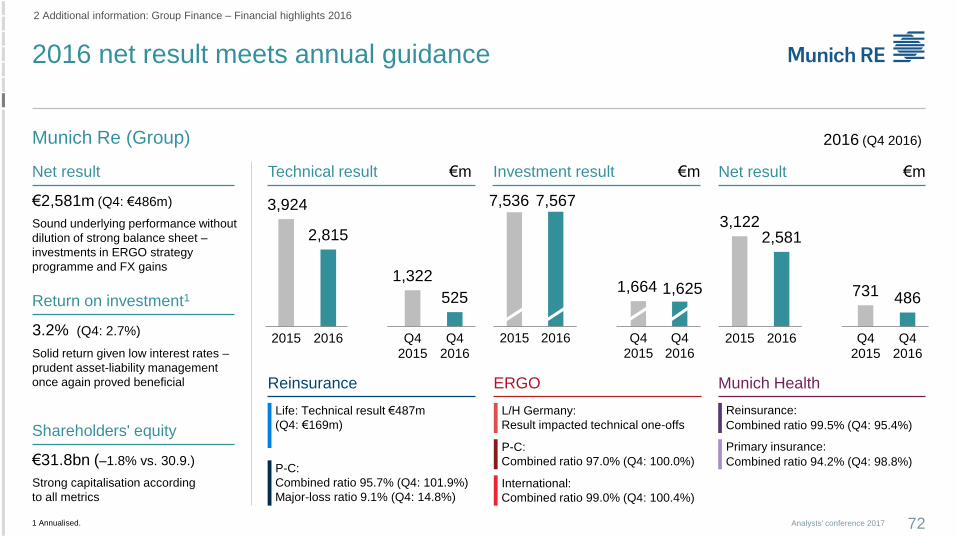
2016 net result meets annual guidance
Analysts' conference 2017 72
2 Additional information: Group Finance – Financial highlights 2016
1 Annualised.
€2,581m (Q4: €486m)
Munich Re (Group)
Net result Technical result €m Investment result €m
Reinsurance
Life: Technical result €487m
(Q4: €169m)
ERGO
L/H Germany:
Result impacted technical one-offs
Reinsurance:
Combined ratio 99.5% (Q4: 95.4%)
Munich Health
P-C:
Combined ratio 95.7% (Q4: 101.9%)
Major-loss ratio 9.1% (Q4: 14.8%)International:
Combined ratio 99.0% (Q4: 100.4%)
P-C:
Combined ratio 97.0% (Q4: 100.0%)
Primary insurance:
Combined ratio 94.2% (Q4: 98.8%)
Net result €m
Sound underlying performance without
dilution of strong balance sheet –
investments in ERGO strategy
programme and FX gains
Return on investment1
3.2% (Q4: 2.7%)
Solid return given low interest rates –
prudent asset-liability management
once again proved beneficial
Shareholders' equity
€31.8bn (–1.8% vs. 30.9.)
Strong capitalisation according
to all metrics
3,924
2,815
1,322
525
2015 2016 Q42015
Q42016
7,536 7,567
1,664 1,625
2015 2016 Q42015
Q42016
2016 (Q4 2016)
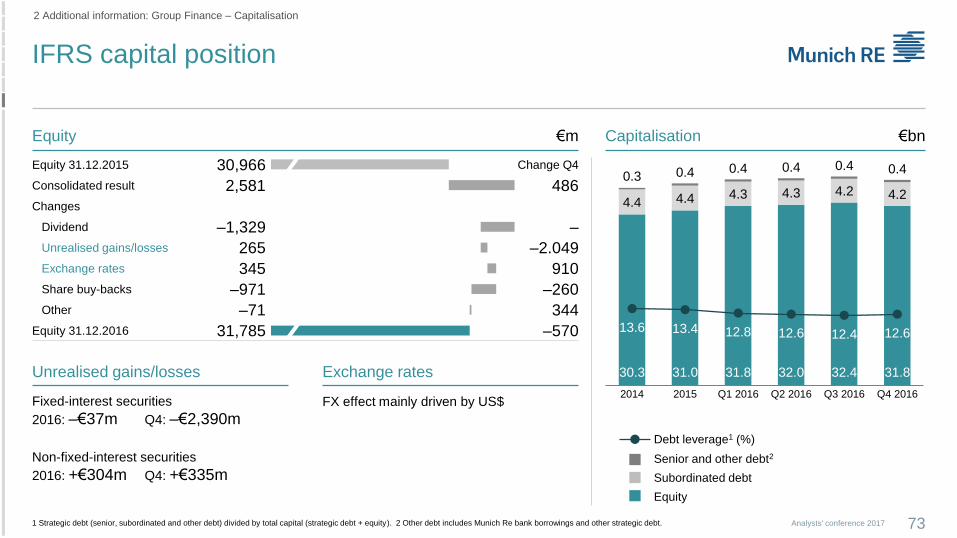
IFRS capital position
Analysts' conference 2017
2 Additional information: Group Finance – Capitalisation
Unrealised gains/losses Exchange rates
Equity €m
Equity 31.12.2015 30,966 Change Q4
Consolidated result 2,581 486
Changes
Dividend –1,329 –
Unrealised gains/losses 265 –2.049
Exchange rates 345 910
Share buy-backs –971 –260
Other –71 344
Equity 31.12.2016 31,785 –570
Subordinated debt
Senior and other debt2
Equity
Fixed-interest securities
2016: –€37m Q4: –€2,390m
Non-fixed-interest securities
2016: +€304m Q4: +€335m
FX effect mainly driven by US$
Capitalisation €bn
1 Strategic debt (senior, subordinated and other debt) divided by total capital (strategic debt + equity). 2 Other debt includes Munich Re bank borrowings and other strategic debt. 73
30.3 31.0 31.8 32.0 32.4 31.8
4.4 4.4 4.3 4.3 4.2 4.2
0.3 0.4 0.4 0.4 0.4 0.4
13.6 13.4 12.8 12.6 12.4 12.6
2014 2015 Q1 2016 Q2 2016 Q3 2016 Q4 2016
Debt leverage1 (%)
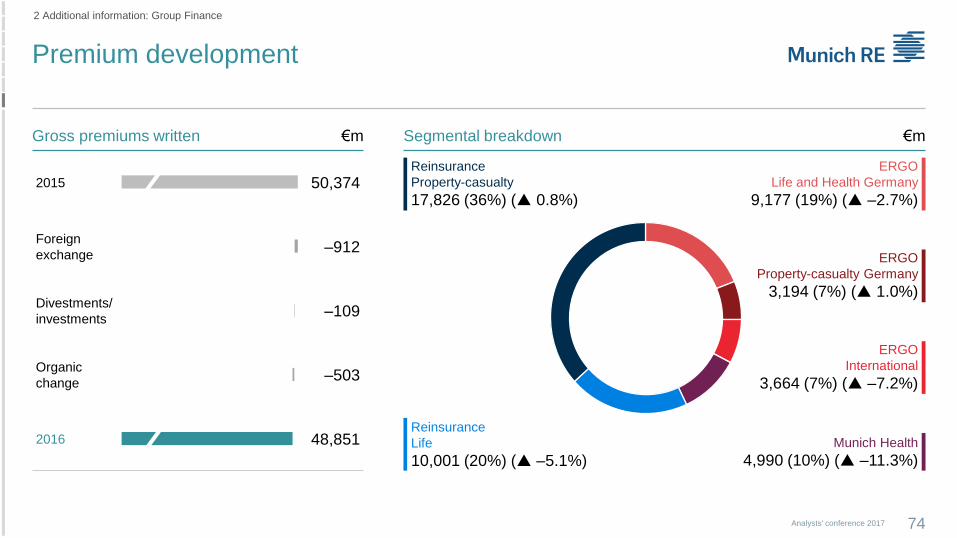
Premium development
Analysts' conference 2017
2 Additional information: Group Finance
Gross premiums written €m
74
2015 50,374
Foreign
exchange–912
Divestments/
investments–109
Organic
change–503
2016 48,851
Segmental breakdown €m
ERGO
Property-casualty Germany
3,194 (7%) ( 1.0%)
ERGO
Life and Health Germany
9,177 (19%) ( –2.7%)
ERGO
International
3,664 (7%) ( –7.2%)
Reinsurance
Property-casualty
17,826 (36%) ( 0.8%)
Reinsurance
Life
10,001 (20%) ( –5.1%)
Munich Health
4,990 (10%) ( –11.3%)
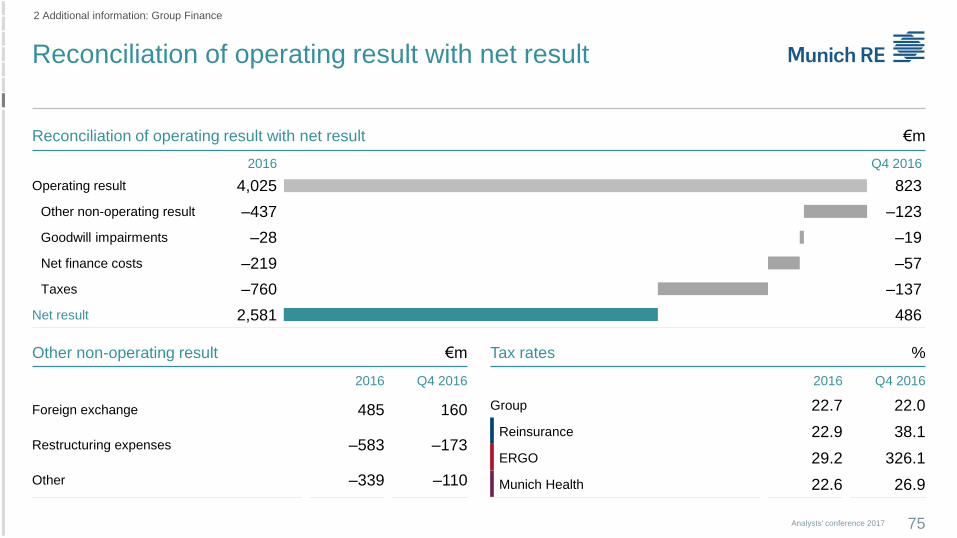
Reconciliation of operating result with net result
Analysts' conference 2017
2 Additional information: Group Finance
Reconciliation of operating result with net result €m
75
Other non-operating result %
2016 Q4 2016
Operating result 4,025 823
Other non-operating result –437 –123
Goodwill impairments –28 –19
Net finance costs –219 –57
Taxes –760 –137
Net result 2,581 486
Tax rates€m
2016 Q4 2016
Foreign exchange 485 160
Restructuring expenses –583 –173
Other –339 –110
2016 Q4 2016
Group 22.7 22.0
Reinsurance 22.9 38.1
ERGO 29.2 326.1
Munich Health 22.6 26.9
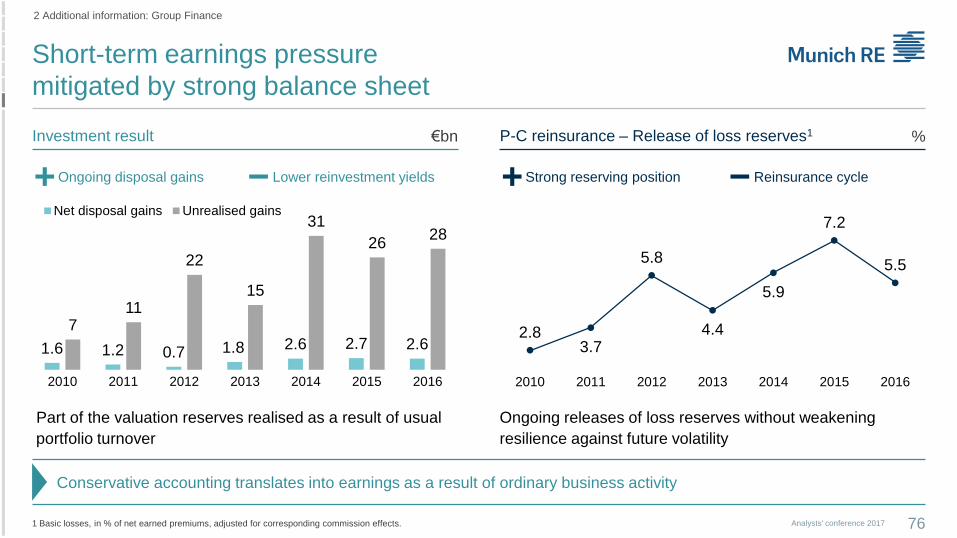
Short-term earnings pressure
mitigated by strong balance sheet
Part of the valuation reserves realised as a result of usual
portfolio turnover
Ongoing releases of loss reserves without weakening
resilience against future volatility
1 Basic losses, in % of net earned premiums, adjusted for corresponding commission effects.
Investment result
Lower reinvestment yieldsOngoing disposal gains
P-C reinsurance – Release of loss reserves1
Reinsurance cycleStrong reserving position
2.83.7
5.8
4.4
5.9
7.2
5.5
2010 2011 2012 2013 2014 2015 2016
1.6 1.2 0.7 1.8 2.6 2.7 2.6
711
22
15
31
2628
2010 2011 2012 2013 2014 2015 2016
Net disposal gains Unrealised gains
€bn %
Conservative accounting translates into earnings as a result of ordinary business activity
Analysts' conference 2017 76
2 Additional information: Group Finance
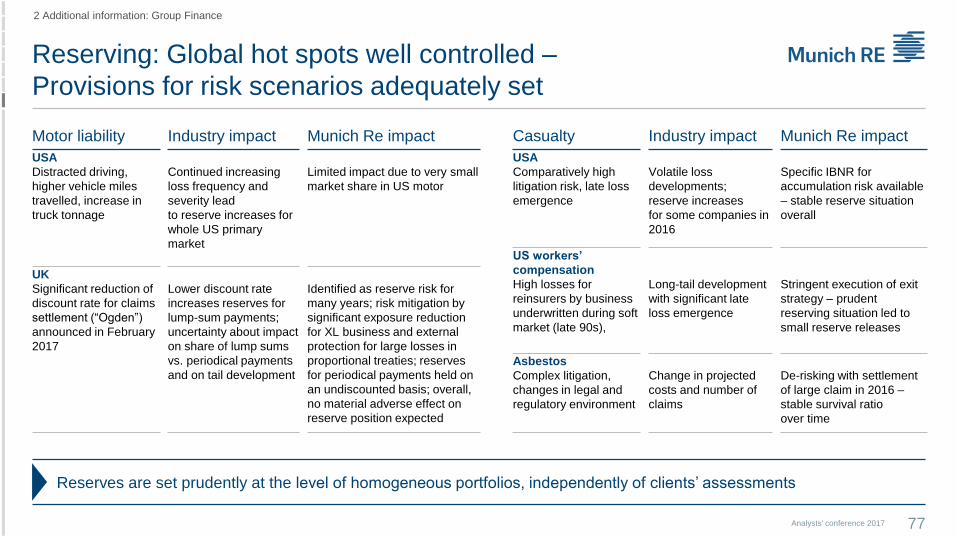
Reserving: Global hot spots well controlled –
Provisions for risk scenarios adequately set
Motor liability Industry impact Munich Re impact
USA
Distracted driving,
higher vehicle miles
travelled, increase in
truck tonnage
Continued increasing
loss frequency and
severity lead
to reserve increases for
whole US primary
market
Limited impact due to very small
market share in US motor
UK
Significant reduction of
discount rate for claims
settlement (“Ogden”)
announced in February
2017
Lower discount rate
increases reserves for
lump-sum payments;
uncertainty about impact
on share of lump sums
vs. periodical payments
and on tail development
Identified as reserve risk for
many years; risk mitigation by
significant exposure reduction
for XL business and external
protection for large losses in
proportional treaties; reserves
for periodical payments held on
an undiscounted basis; overall,
no material adverse effect on
reserve position expected
Casualty Industry impact Munich Re impact
USA
Comparatively high
litigation risk, late loss
emergence
Volatile loss
developments;
reserve increases
for some companies in
2016
Specific IBNR for
accumulation risk available
– stable reserve situation
overall
US workers’
compensation
High losses for
reinsurers by business
underwritten during soft
market (late 90s),
Long-tail development
with significant late
loss emergence
Stringent execution of exit
strategy – prudent
reserving situation led to
small reserve releases
Asbestos
Complex litigation,
changes in legal and
regulatory environment
Change in projected
costs and number of
claims
De-risking with settlement
of large claim in 2016 –
stable survival ratio
over time
Analysts' conference 2017 77
2 Additional information: Group Finance
Reserves are set prudently at the level of homogeneous portfolios, independently of clients’ assessments
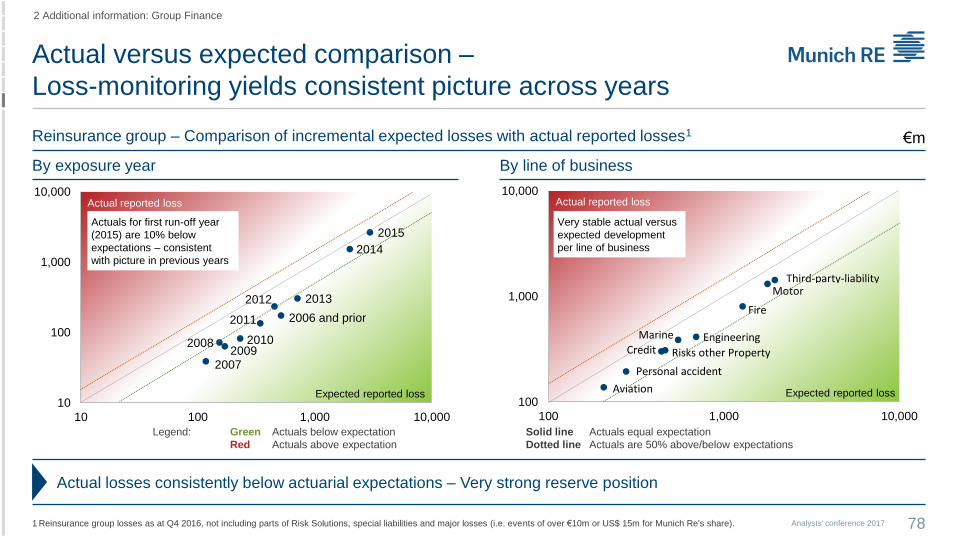
Actual versus expected comparison –
Loss-monitoring yields consistent picture across years
Reinsurance group – Comparison of incremental expected losses with actual reported losses1 €m
Legend: Green Actuals below expectation Solid line Actuals equal expectation
Red Actuals above expectation Dotted line Actuals are 50% above/below expectations
By exposure year By line of business
1 Reinsurance group losses as at Q4 2016, not including parts of Risk Solutions, special liabilities and major losses (i.e. events of over €10m or US$ 15m for Munich Re's share). Analysts' conference 2017 78
Actual losses consistently below actuarial expectations – Very strong reserve position
2 Additional information: Group Finance
2015
2014
20132012
2011
20102009
2008
2007
2006 and prior
10
100
1,000
10,000
10 100 1,000 10,000
Expected reported loss
Actual reported loss
Aviation
CreditEngineering
Fire
Marine
Motor
Personal accident
Risks other Property
Third-party-liability
100
1,000
10,000
100 1,000 10,000
Expected reported loss
Actual reported loss
Actuals for first run-off year
(2015) are 10% below
expectations – consistent
with picture in previous years
Very stable actual versus
expected development
per line of business

Positive run-off result without weakening resilience against
future volatility
2 Additional information: Group Finance – IFRS view – Reserving position
Ultimate losses1 (adjusted to exchange rates as at 31.12.2016) €m
Accident year (AY)
Date ≤2006 2007 2008 2009 2010 2011 2012 2013 2014 2015 2016 Total
31.12.2006 51,505
31.12.2007 51,659 12,711
31.12.2008 51,145 12,928 14,191
31.12.2009 50,478 12,824 14,440 13,936
31.12.2010 49,900 12,742 14,383 13,891 14,335
31.12.2011 49,694 12,704 14,083 13,385 14,522 18,544
31.12.2012 49,193 12,320 13,924 13,243 14,388 18,646 15,168
31.12.2013 49,125 12,064 13,751 13,216 14,475 18,307 14,972 15,076
31.12.2014 48,894 11,978 13,471 12,890 14,512 17,901 14,742 15,325 15,089
31.12.2015 48,588 11,744 13,330 12,663 14,318 17,771 14,519 15,270 15,128 14,361
31.12.2016 48,339 11,771 13,241 12,618 14,081 17,298 14,482 14,953 15,089 14,408 15,336
CY 2016 run-
off change248 –27 89 45 237 473 37 317 39 -48 – 1,412
CY 2016 run-
off change (%) 0.5 –0.2 0.7 0.4 1.7 2.7 0.3 2.1 0.3 –0.3 – 0.8
Prior-year releases of €1.4bn
driven by reinsurance portfolio
Favourable actual vs.
expected comparison
facilitates ultimate
reductions for prior years
Reserve position remains
strong
Reinsurance2 €1,268m
ERGO €144m
Ultimate reduction
1 Basic and major losses; accident year split partly based on approximations. 2 Thereof €1,148m basic and €120m major losses. Analysts' conference 2017 79
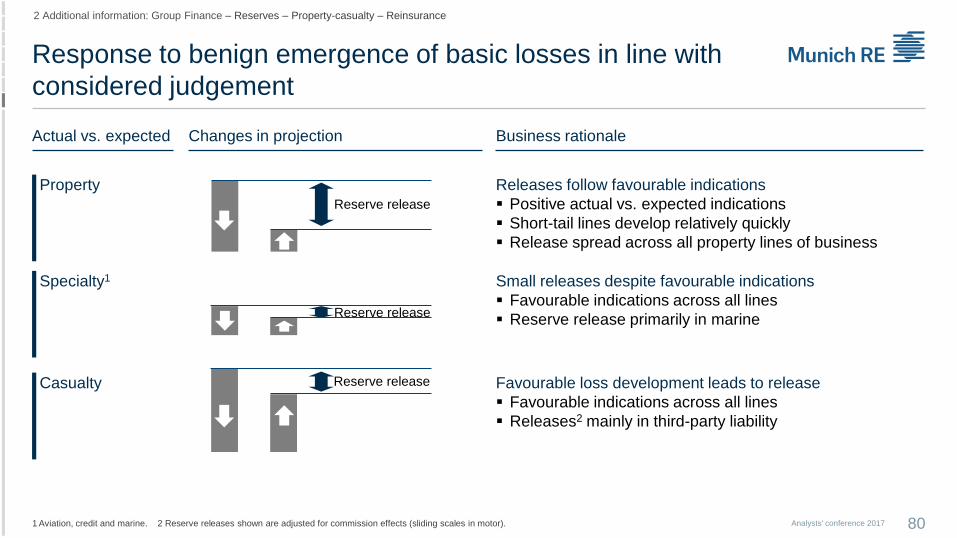
Reserve release
Response to benign emergence of basic losses in line with
considered judgement
Casualty
Specialty1
Property
Actual vs. expected Business rationaleChanges in projection
Reserve release
Reserve release
Releases follow favourable indications
Positive actual vs. expected indications
Short-tail lines develop relatively quickly
Release spread across all property lines of business
Favourable loss development leads to release
Favourable indications across all lines
Releases2 mainly in third-party liability
Small releases despite favourable indications
Favourable indications across all lines
Reserve release primarily in marine
1 Aviation, credit and marine. 2 Reserve releases shown are adjusted for commission effects (sliding scales in motor).
2 Additional information: Group Finance – Reserves – Property-casualty – Reinsurance
Analysts' conference 2017 80
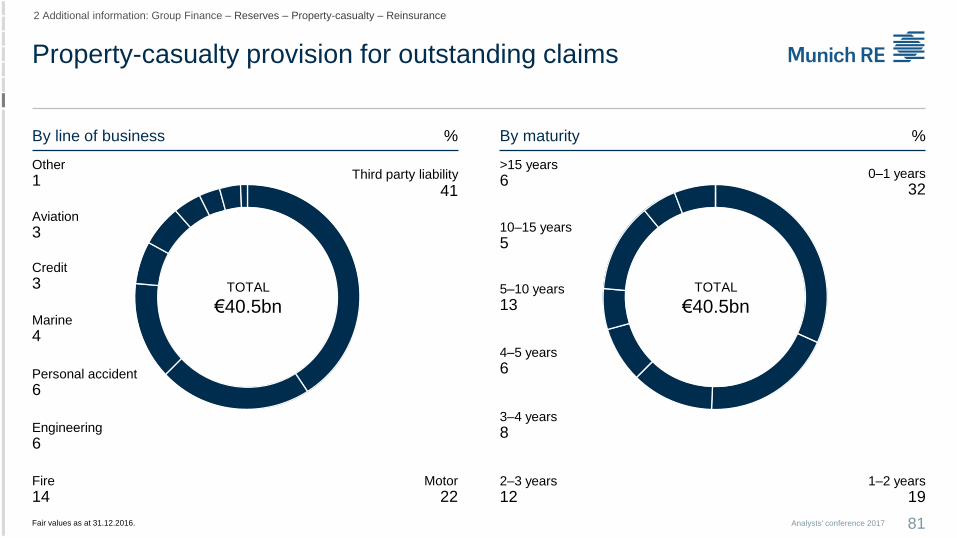
Property-casualty provision for outstanding claims
By line of business
2 Additional information: Group Finance – Reserves – Property-casualty – Reinsurance
Credit
3
Other
1 Third party liability
41
Fire
14
Engineering
6
Personal accident
6
Marine
4
TOTAL
€40.5bn
Motor
22
Aviation
3
%
Fair values as at 31.12.2016.
By maturity
5–10 years
13
>15 years
60–1 years
32
TOTAL
€40.5bn
10–15 years
5
%
Analysts' conference 2017 81
1–2 years
192–3 years
12
3–4 years
8
4–5 years
6

Asbestos and environmental
survival ratio 31 December 2016
Munich Re (Group) – Net definitive as at 31 December 20161 €m
1 Non-euro currencies converted at rate of exchange year-end 2016. 2 Adjusted for a major asbestos claim settlement in 2016.
2 Additional information: Group Finance – Reserves
Asbestos Environmental A&E total
Paid 3,353 1,001 4,353
Case reserves 486 148 634
IBNR 821 238 1,059
Total reserves 1,307 386 1,693
3-year average annual paid losses2 115 19 135
Survival ratio 3-year average2 % 11.3 20.0 12.6
Analysts' conference 2017 82
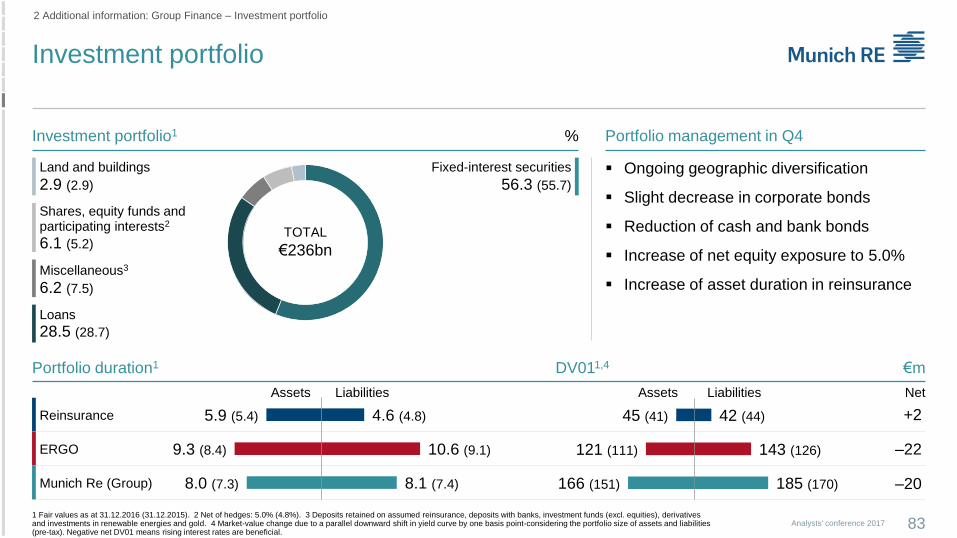
Investment portfolio
Analysts' conference 2017
2 Additional information: Group Finance – Investment portfolio
Portfolio management in Q4
Ongoing geographic diversification
Slight decrease in corporate bonds
Reduction of cash and bank bonds
Increase of net equity exposure to 5.0%
Increase of asset duration in reinsurance
831 Fair values as at 31.12.2016 (31.12.2015). 2 Net of hedges: 5.0% (4.8%). 3 Deposits retained on assumed reinsurance, deposits with banks, investment funds (excl. equities), derivatives and investments in renewable energies and gold. 4 Market-value change due to a parallel downward shift in yield curve by one basis point-considering the portfolio size of assets and liabilities (pre-tax). Negative net DV01 means rising interest rates are beneficial.
Portfolio duration1 DV011,4 €m
Investment portfolio1 %
Land and buildings
2.9 (2.9)
Fixed-interest securities
56.3 (55.7)
Shares, equity funds andparticipating interests2
6.1 (5.2)
Loans
28.5 (28.7)
TOTAL
€236bn
Miscellaneous3
6.2 (7.5)
Reinsurance
ERGO
Munich Re (Group)
Assets Liabilities
5.9 (5.4)
9.3 (8.4)
8.0 (7.3)
4.6 (4.8)
10.6 (9.1)
8.1 (7.4)
Assets NetLiabilities
45 (41)
121 (111)
166 (151)
42 (44)
143 (126)
185 (170)
+2
–22
–20

Investment result
Analysts' conference 2017
2 Additional information: Group Finance – Investment result
3-month reinvestment yield
Q4 2016 1.8%
Q3 2016 1.8%
Q2 2016 1.6%
84
Q4 2016Write-ups/
write-downsDisposal
gains/losses Derivatives
Fixed income3 –10 643 –286
Equities –26 105 –243
Commodities/Inflation –51 13
Other –29 31 –1
2016Write-ups/
write-downsDisposal
gains/losses Derivatives
Fixed income3 –23 2,263 70
Equities –323 440 –777
Commodities/Inflation 27 –2
Other –69 –99 4
1 Annualised return on quarterly weighted investments (market values) in %. 2 Result from derivatives without regular income and other income/expenses. 3 Thereof interest-rate hedging ERGO: Q4 2016 (–€261m gross/–€34m net) and 2016 (€233m gross/€25m net).
Investment result (€m) Q4 2016 Return1 2016 Return1 2015 Return1
Regular income 1,662 2.8% 6,663 2.8% 7,370 3.1%
Write-ups/write-downs –115 –0.2% –400 –0.2% –754 –0.3%
Disposal gains/losses 779 1.3% 2,603 1.1% 2,693 1.1%
Derivatives2 –517 –0.9% –713 –0.3% –1,226 –0.5%
Other income/expenses –184 –0.3% –586 –0.2% –548 –0.2%
Investment result 1,625 2.7% 7,567 3.2% 7,536 3.2%
Total return –10.5% 4.3% 0.9%

Breakdown of regular income
85Analysts' conference 2017
2 Additional information: Group Finance – Investments
€m
Investment result – Regular income (€m) Q4 2016 2016 2015 Change
Afs fixed-interest 773 3,200 3,528 –328
Afs non-fixed-interest 113 556 618 –62
Derivatives 27 114 137 –23
Loans 548 2,063 2,098 –35
Real estate 103 405 393 12
Deposits retained on assumed reinsurance and other investments 99 325 597 –272
Total 1,662 6,663 7,370 –707
1,697
1,907
1,773
1,826 1,801
2,062
1,725
1,782
1,628
1,823
1,5501,662
€1,770m
Q1 2014 Q2 2014 Q3 2014 Q4 2014 Q1 2015 Q2 2015 Q3 2015 Q4 2015 Q1 2016 Q2 2016 Q3 2016 Q4 2016
Regular income Average
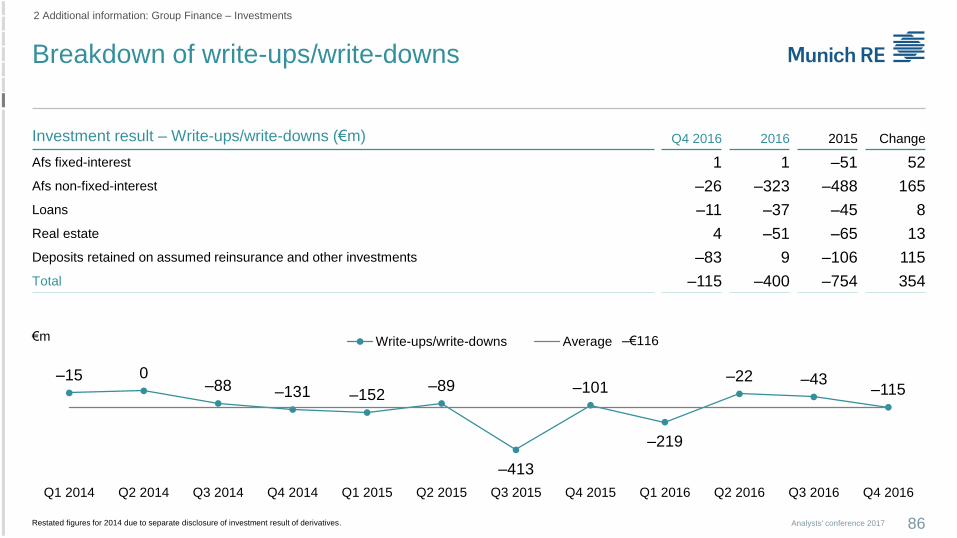
Breakdown of write-ups/write-downs
86Analysts' conference 2017
2 Additional information: Group Finance – Investments
€m
Restated figures for 2014 due to separate disclosure of investment result of derivatives.
Investment result – Write-ups/write-downs (€m) Q4 2016 2016 2015 Change
Afs fixed-interest 1 1 –51 52
Afs non-fixed-interest –26 –323 –488 165
Loans –11 –37 –45 8
Real estate 4 –51 –65 13
Deposits retained on assumed reinsurance and other investments –83 9 –106 115
Total –115 –400 –754 354
–15 0–88 –131 –152
–89
–413
–101
–219
–22 –43–115
–€116
Q1 2014 Q2 2014 Q3 2014 Q4 2014 Q1 2015 Q2 2015 Q3 2015 Q4 2015 Q1 2016 Q2 2016 Q3 2016 Q4 2016
Write-ups/write-downs Average
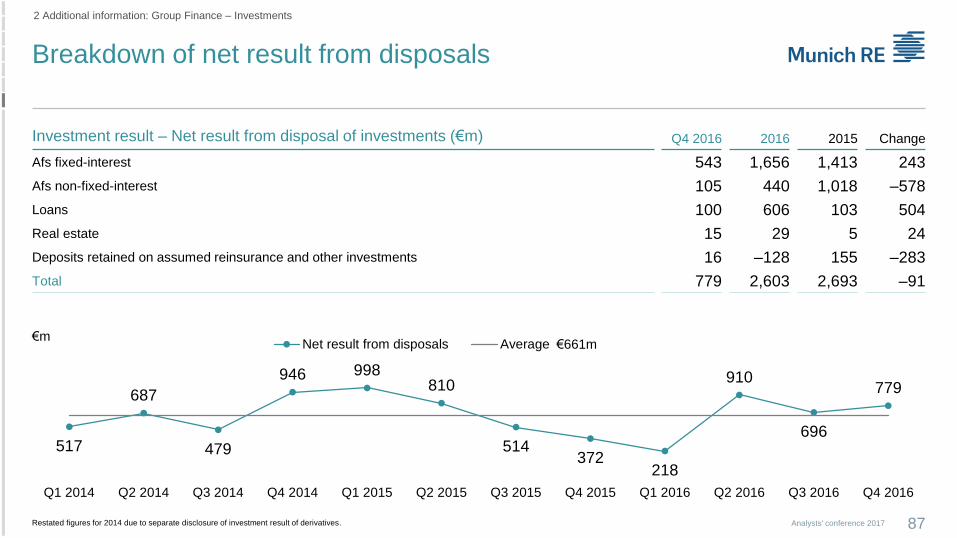
Breakdown of net result from disposals
87Analysts' conference 2017
2 Additional information: Group Finance – Investments
€m
Investment result – Net result from disposal of investments (€m) Q4 2016 2016 2015 Change
Afs fixed-interest 543 1,656 1,413 243
Afs non-fixed-interest 105 440 1,018 –578
Loans 100 606 103 504
Real estate 15 29 5 24
Deposits retained on assumed reinsurance and other investments 16 –128 155 –283
Total 779 2,603 2,693 –91
517
687
479
946 998810
514372
218
910
696
779
€661m
Q1 2014 Q2 2014 Q3 2014 Q4 2014 Q1 2015 Q2 2015 Q3 2015 Q4 2015 Q1 2016 Q2 2016 Q3 2016 Q4 2016
Net result from disposals Average
Restated figures for 2014 due to separate disclosure of investment result of derivatives.
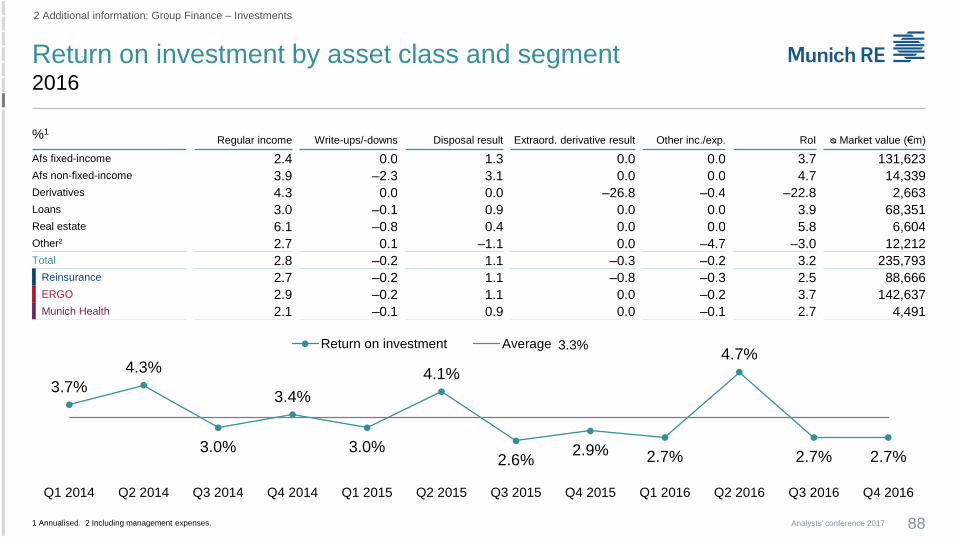
Return on investment by asset class and segment2016
88Analysts' conference 2017
2 Additional information: Group Finance – Investments
1 Annualised. 2 Including management expenses.
%1Regular income Write-ups/-downs Disposal result Extraord. derivative result Other inc./exp. RoI ᴓ Market value (€m)
Afs fixed-income 2.4 0.0 1.3 0.0 0.0 3.7 131,623
Afs non-fixed-income 3.9 –2.3 3.1 0.0 0.0 4.7 14,339
Derivatives 4.3 0.0 0.0 –26.8 –0.4 –22.8 2,663
Loans 3.0 –0.1 0.9 0.0 0.0 3.9 68,351
Real estate 6.1 –0.8 0.4 0.0 0.0 5.8 6,604
Other2 2.7 0.1 –1.1 0.0 –4.7 –3.0 12,212
Total 2.8 –0.2 1.1 –0.3 –0.2 3.2 235,793
Reinsurance 2.7 –0.2 1.1 –0.8 –0.3 2.5 88,666
ERGO 2.9 –0.2 1.1 0.0 –0.2 3.7 142,637
Munich Health 2.1 –0.1 0.9 0.0 –0.1 2.7 4,491
3.7%
4.3%
3.0%
3.4%
3.0%
4.1%
2.6%2.9% 2.7%
4.7%
2.7% 2.7%
3.3%
Q1 2014 Q2 2014 Q3 2014 Q4 2014 Q1 2015 Q2 2015 Q3 2015 Q4 2015 Q1 2016 Q2 2016 Q3 2016 Q4 2016
Return on investment Average
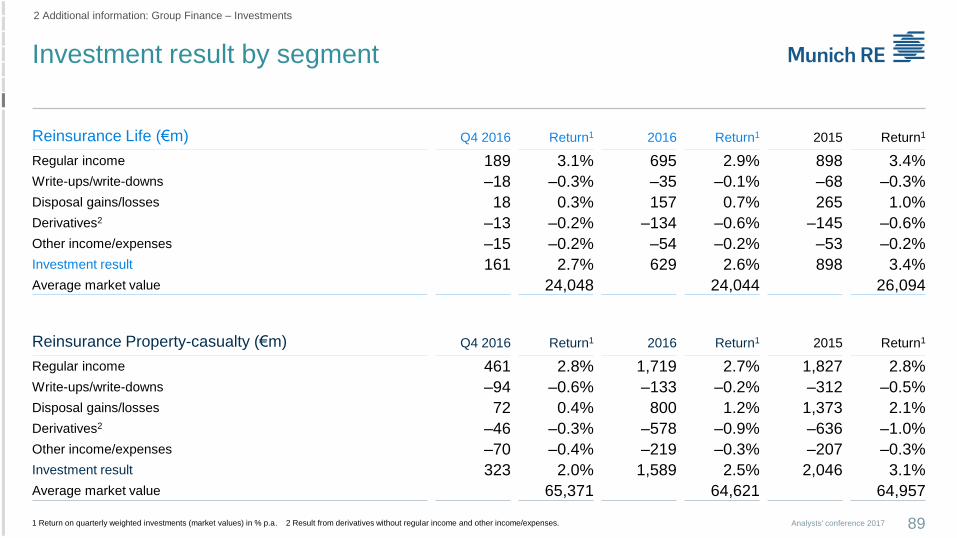
Investment result by segment
89Analysts' conference 2017
2 Additional information: Group Finance – Investments
Reinsurance Life (€m) Q4 2016 Return1 2016 Return1 2015 Return1
Regular income 189 3.1% 695 2.9% 898 3.4%
Write-ups/write-downs –18 –0.3% –35 –0.1% –68 –0.3%
Disposal gains/losses 18 0.3% 157 0.7% 265 1.0%
Derivatives2 –13 –0.2% –134 –0.6% –145 –0.6%
Other income/expenses –15 –0.2% –54 –0.2% –53 –0.2%
Investment result 161 2.7% 629 2.6% 898 3.4%
Average market value 24,048 24,044 26,094
Reinsurance Property-casualty (€m) Q4 2016 Return1 2016 Return1 2015 Return1
Regular income 461 2.8% 1,719 2.7% 1,827 2.8%
Write-ups/write-downs –94 –0.6% –133 –0.2% –312 –0.5%
Disposal gains/losses 72 0.4% 800 1.2% 1,373 2.1%
Derivatives2 –46 –0.3% –578 –0.9% –636 –1.0%
Other income/expenses –70 –0.4% –219 –0.3% –207 –0.3%
Investment result 323 2.0% 1,589 2.5% 2,046 3.1%
Average market value 65,371 64,621 64,957
1 Return on quarterly weighted investments (market values) in % p.a. 2 Result from derivatives without regular income and other income/expenses.
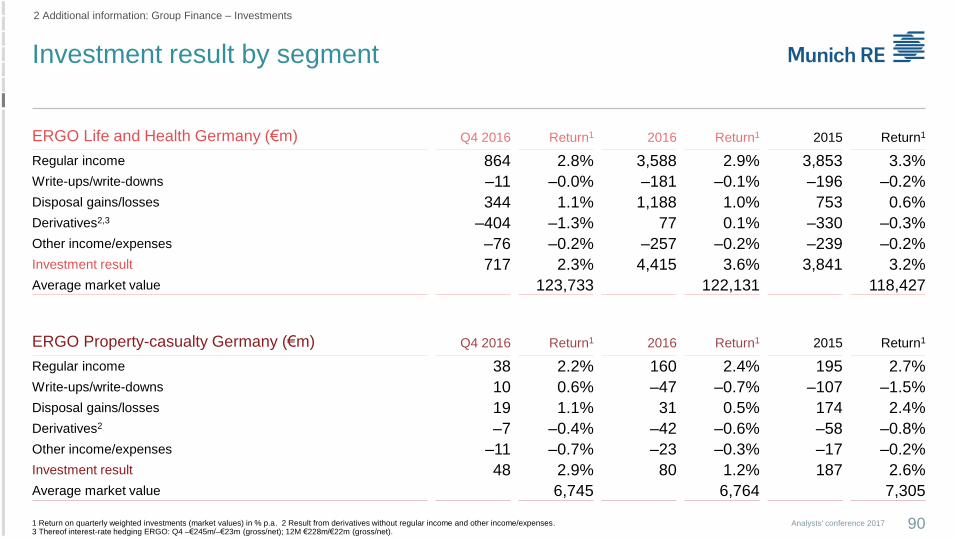
Investment result by segment
90Analysts' conference 2017
2 Additional information: Group Finance – Investments
ERGO Life and Health Germany (€m) Q4 2016 Return1 2016 Return1 2015 Return1
Regular income 864 2.8% 3,588 2.9% 3,853 3.3%
Write-ups/write-downs –11 –0.0% –181 –0.1% –196 –0.2%
Disposal gains/losses 344 1.1% 1,188 1.0% 753 0.6%
Derivatives2,3 –404 –1.3% 77 0.1% –330 –0.3%
Other income/expenses –76 –0.2% –257 –0.2% –239 –0.2%
Investment result 717 2.3% 4,415 3.6% 3,841 3.2%
Average market value 123,733 122,131 118,427
ERGO Property-casualty Germany (€m) Q4 2016 Return1 2016 Return1 2015 Return1
Regular income 38 2.2% 160 2.4% 195 2.7%
Write-ups/write-downs 10 0.6% –47 –0.7% –107 –1.5%
Disposal gains/losses 19 1.1% 31 0.5% 174 2.4%
Derivatives2 –7 –0.4% –42 –0.6% –58 –0.8%
Other income/expenses –11 –0.7% –23 –0.3% –17 –0.2%
Investment result 48 2.9% 80 1.2% 187 2.6%
Average market value 6,745 6,764 7,305
1 Return on quarterly weighted investments (market values) in % p.a. 2 Result from derivatives without regular income and other income/expenses.3 Thereof interest-rate hedging ERGO: Q4 –€245m/–€23m (gross/net); 12M €228m/€22m (gross/net).
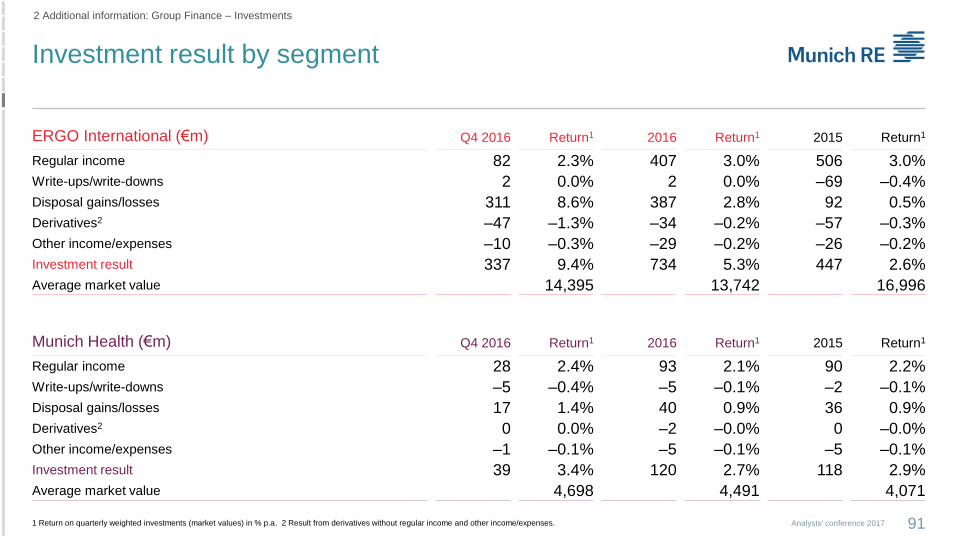
Investment result by segment
91Analysts' conference 2017
2 Additional information: Group Finance – Investments
ERGO International (€m) Q4 2016 Return1 2016 Return1 2015 Return1
Regular income 82 2.3% 407 3.0% 506 3.0%
Write-ups/write-downs 2 0.0% 2 0.0% –69 –0.4%
Disposal gains/losses 311 8.6% 387 2.8% 92 0.5%
Derivatives2 –47 –1.3% –34 –0.2% –57 –0.3%
Other income/expenses –10 –0.3% –29 –0.2% –26 –0.2%
Investment result 337 9.4% 734 5.3% 447 2.6%
Average market value 14,395 13,742 16,996
Munich Health (€m) Q4 2016 Return1 2016 Return1 2015 Return1
Regular income 28 2.4% 93 2.1% 90 2.2%
Write-ups/write-downs –5 –0.4% –5 –0.1% –2 –0.1%
Disposal gains/losses 17 1.4% 40 0.9% 36 0.9%
Derivatives2 0 0.0% –2 –0.0% 0 –0.0%
Other income/expenses –1 –0.1% –5 –0.1% –5 –0.1%
Investment result 39 3.4% 120 2.7% 118 2.9%
Average market value 4,698 4,491 4,071
1 Return on quarterly weighted investments (market values) in % p.a. 2 Result from derivatives without regular income and other income/expenses.
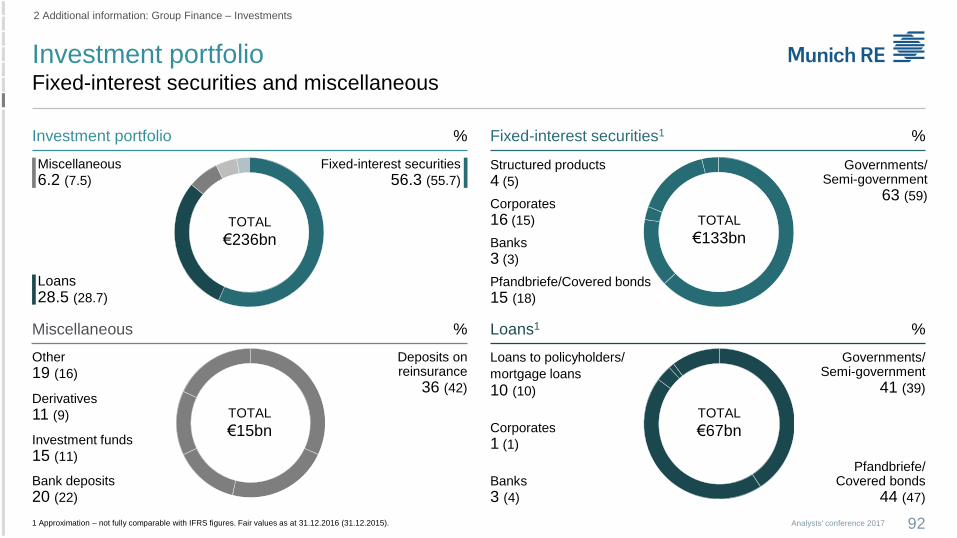
Investment portfolioFixed-interest securities and miscellaneous
92Analysts' conference 2017
2 Additional information: Group Finance – Investments
1 Approximation – not fully comparable with IFRS figures. Fair values as at 31.12.2016 (31.12.2015).
Investment portfolio %
Miscellaneous %
% Fixed-interest securities1
% Loans1
Fixed-interest securities
56.3 (55.7)
Loans
28.5 (28.7)
TOTAL
€236bn
Miscellaneous
6.2 (7.5)
Pfandbriefe/Covered bonds
15 (18)
Corporates
16 (15)
Banks
3 (3)
Governments/Semi-government
63 (59)
TOTAL
€133bn
Structured products
4 (5)
TOTAL
€15bn
Deposits on reinsurance
36 (42)
Bank deposits
20 (22)
Investment funds
15 (11)
Derivatives
11 (9)
Other
19 (16)
Loans to policyholders/
mortgage loans
10 (10)
Pfandbriefe/Covered bonds
44 (47)
Banks
3 (4)
Governments/Semi-government
41 (39)
TOTAL
€67bnCorporates
1 (1)
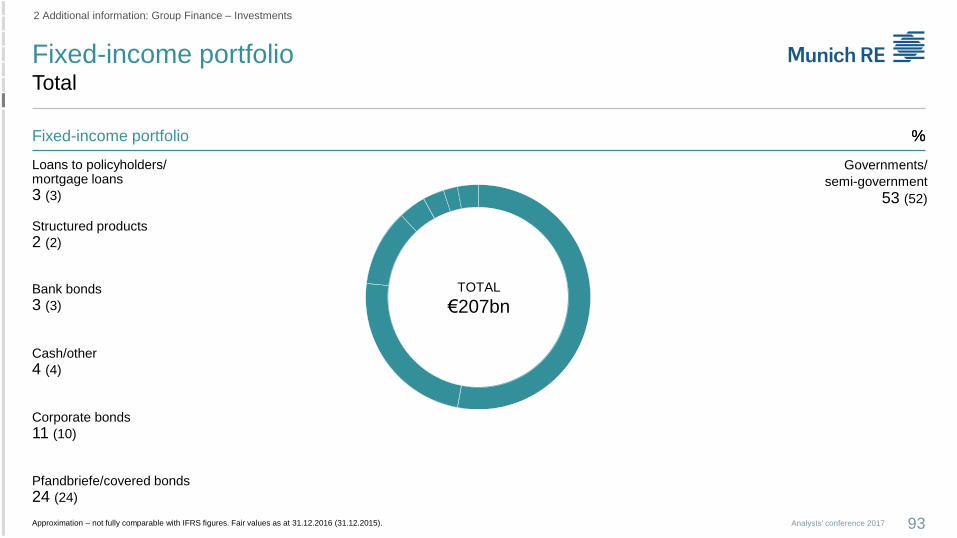
Fixed-income portfolioTotal
2 Additional information: Group Finance – Investments
Fixed-income portfolio %
Approximation – not fully comparable with IFRS figures. Fair values as at 31.12.2016 (31.12.2015). Analysts' conference 2017 93
%
Structured products
2 (2)
Loans to policyholders/mortgage loans
3 (3)
Governments/
semi-government
53 (52)
Pfandbriefe/covered bonds
24 (24)
Corporate bonds
11 (10)
Cash/other
4 (4)
Bank bonds
3 (3)
TOTAL
€207bn
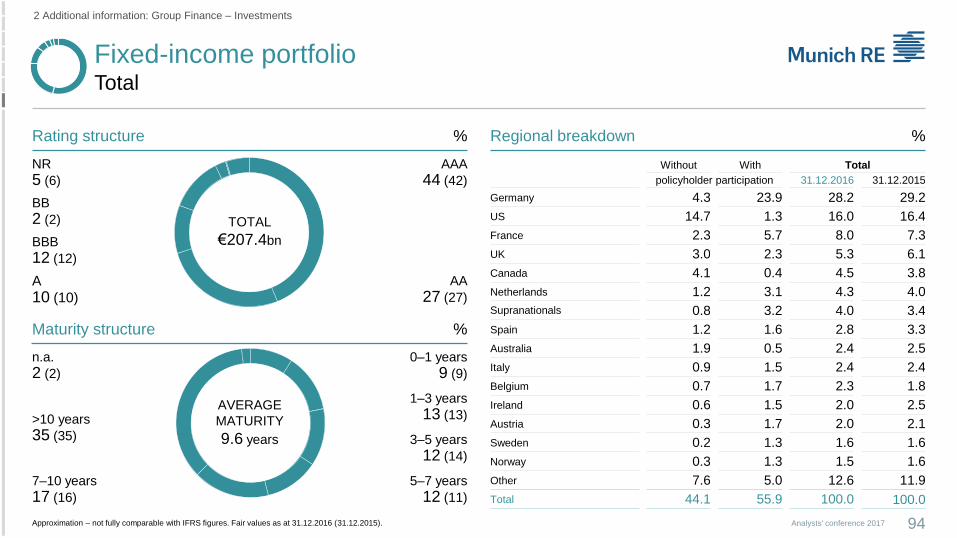
Fixed-income portfolioTotal
94Analysts' conference 2017
2 Additional information: Group Finance – Investments
Approximation – not fully comparable with IFRS figures. Fair values as at 31.12.2016 (31.12.2015).
Rating structure %
Maturity structure
% Regional breakdown
%
TOTAL
€207.4bn
AVERAGE
MATURITY
9.6 years
Without With Total
policyholder participation 31.12.2016 31.12.2015
Germany 4.3 23.9 28.2 29.2
US 14.7 1.3 16.0 16.4
France 2.3 5.7 8.0 7.3
UK 3.0 2.3 5.3 6.1
Canada 4.1 0.4 4.5 3.8
Netherlands 1.2 3.1 4.3 4.0
Supranationals 0.8 3.2 4.0 3.4
Spain 1.2 1.6 2.8 3.3
Australia 1.9 0.5 2.4 2.5
Italy 0.9 1.5 2.4 2.4
Belgium 0.7 1.7 2.3 1.8
Ireland 0.6 1.5 2.0 2.5
Austria 0.3 1.7 2.0 2.1
Sweden 0.2 1.3 1.6 1.6
Norway 0.3 1.3 1.5 1.6
Other 7.6 5.0 12.6 11.9
Total 44.1 55.9 100.0 100.0
AAA
44 (42)
A
10 (10)
NR
5 (6)
BB
2 (2)
BBB
12 (12)
AA
27 (27)
0–1 years
9 (9)
7–10 years
17 (16)
>10 years
35 (35)
n.a.
2 (2)
1–3 years
13 (13)
3–5 years
12 (14)
5–7 years
12 (11)
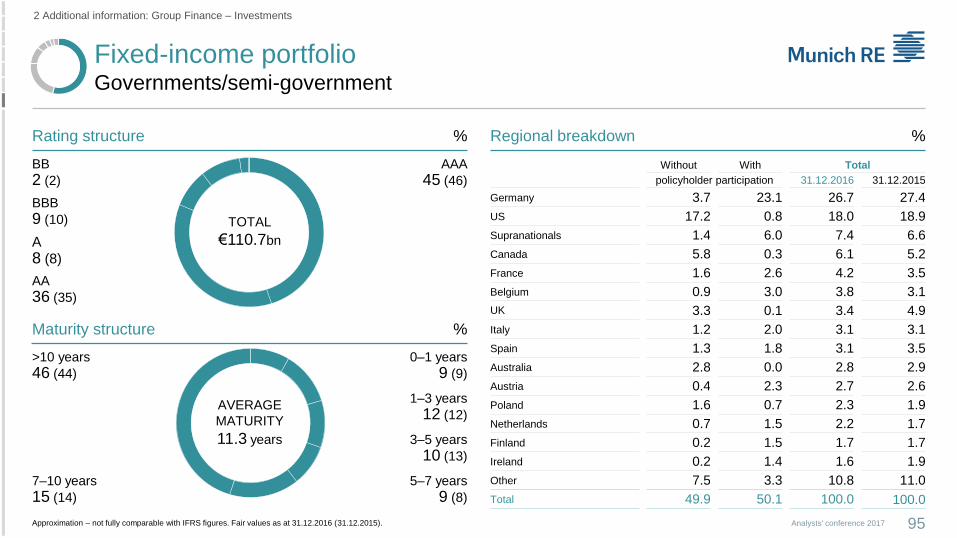
Fixed-income portfolioGovernments/semi-government
95Analysts' conference 2017
2 Additional information: Group Finance – Investments
Approximation – not fully comparable with IFRS figures. Fair values as at 31.12.2016 (31.12.2015).
Rating structure %
Maturity structure
% Regional breakdown
%
BB
2 (2)
BBB
9 (10)
A
8 (8)
AA
36 (35)
AAA
45 (46)
0–1 years
9 (9)
7–10 years
15 (14)
>10 years
46 (44)
1–3 years
12 (12)
3–5 years
10 (13)
5–7 years
9 (8)
Without With Total
policyholder participation 31.12.2016 31.12.2015
Germany 3.7 23.1 26.7 27.4
US 17.2 0.8 18.0 18.9
Supranationals 1.4 6.0 7.4 6.6
Canada 5.8 0.3 6.1 5.2
France 1.6 2.6 4.2 3.5
Belgium 0.9 3.0 3.8 3.1
UK 3.3 0.1 3.4 4.9
Italy 1.2 2.0 3.1 3.1
Spain 1.3 1.8 3.1 3.5
Australia 2.8 0.0 2.8 2.9
Austria 0.4 2.3 2.7 2.6
Poland 1.6 0.7 2.3 1.9
Netherlands 0.7 1.5 2.2 1.7
Finland 0.2 1.5 1.7 1.7
Ireland 0.2 1.4 1.6 1.9
Other 7.5 3.3 10.8 11.0
Total 49.9 50.1 100.0 100.0
AVERAGE
MATURITY
11.3 years
TOTAL
€110.7bn

Fixed-income portfolioPfandbriefe/covered bonds
96Analysts' conference 2017
2 Additional information: Group Finance – Investments
Approximation – not fully comparable with IFRS figures. Fair values as at 31.12.2016 (31.12.2015).
Rating structure %
Maturity structure
% Regional breakdown
%
TOTAL
€48.7bn
AVERAGE
MATURITY
8.0 years
31.12.2016 31.12.2015
Germany 35.2 34.2
France 19.9 18.5
UK 8.6 8.5
Netherlands 7.4 7.1
Sweden 6.0 5.9
Norway 5.9 5.7
Spain 3.4 4.8
Italy 1.0 1.2
Ireland 1.0 2.9
Other 11.6 11.1
NR
2 (0)
BBB
1 (3)
A
4 (5)
AA
23 (26)
AAA
70 (66)
0–1 years
6 (5)
1–3 years
10 (10)
3–5 years
13 (13)
5–7 years
17 (14)
7–10 years
25 (22)
>10 years
30 (35)
%Cover pools
TOTAL
€48.7bn
Mortgage
59 (57)
Public
30 (32)
Mixed and other
10 (11)
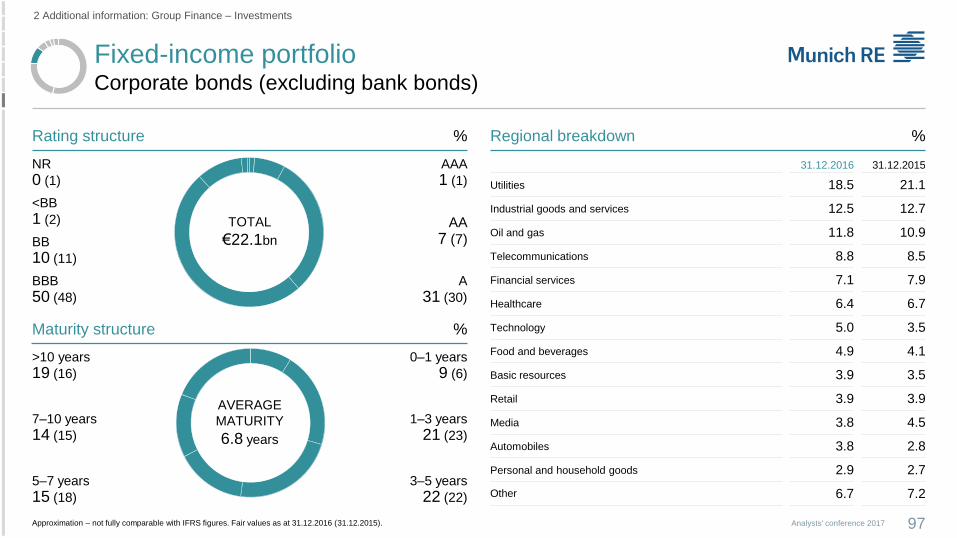
Fixed-income portfolioCorporate bonds (excluding bank bonds)
97Analysts' conference 2017
2 Additional information: Group Finance – Investments
Approximation – not fully comparable with IFRS figures. Fair values as at 31.12.2016 (31.12.2015).
Rating structure %
Maturity structure
% Regional breakdown
%
TOTAL
€22.1bn
AVERAGE
MATURITY
6.8 years
31.12.2016 31.12.2015
Utilities 18.5 21.1
Industrial goods and services 12.5 12.7
Oil and gas 11.8 10.9
Telecommunications 8.8 8.5
Financial services 7.1 7.9
Healthcare 6.4 6.7
Technology 5.0 3.5
Food and beverages 4.9 4.1
Basic resources 3.9 3.5
Retail 3.9 3.9
Media 3.8 4.5
Automobiles 3.8 2.8
Personal and household goods 2.9 2.7
Other 6.7 7.2
NR
0 (1)
<BB
1 (2)
BB
10 (11)
BBB
50 (48)
A
31 (30)
AA
7 (7)
AAA
1 (1)
>10 years
19 (16)
7–10 years
14 (15)
5–7 years
15 (18)
3–5 years
22 (22)
1–3 years
21 (23)
0–1 years
9 (6)
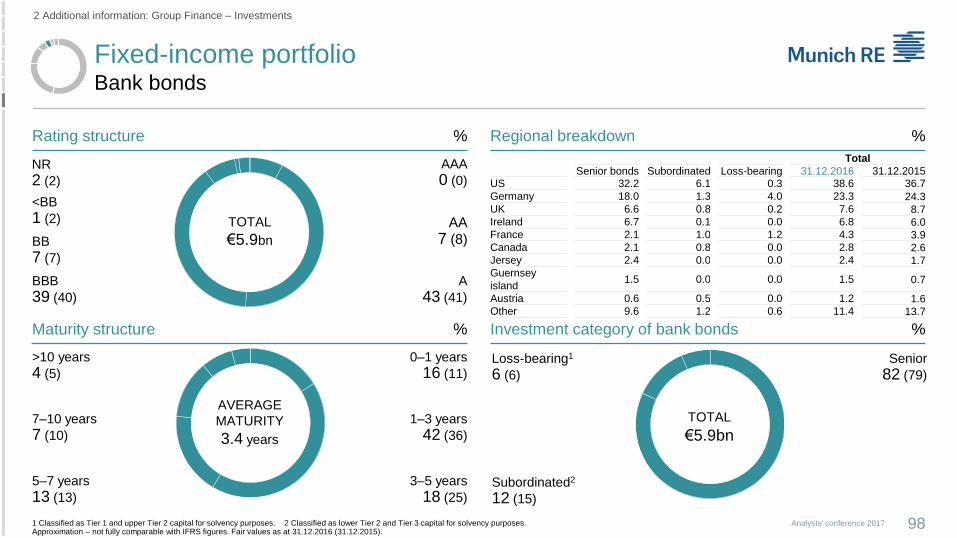
Fixed-income portfolioBank bonds
98Analysts' conference 2017
2 Additional information: Group Finance – Investments
1 Classified as Tier 1 and upper Tier 2 capital for solvency purposes. 2 Classified as lower Tier 2 and Tier 3 capital for solvency purposes. Approximation – not fully comparable with IFRS figures. Fair values as at 31.12.2016 (31.12.2015).
%Regional breakdown
%Investment category of bank bonds
TOTAL
€5.9bn
Senior
82 (79)
Subordinated2
12 (15)
Loss-bearing1
6 (6)
Rating structure
Maturity structure
%
%
TOTAL
€5.9bn
AVERAGE
MATURITY
3.4 years
Total
Senior bonds Subordinated Loss-bearing 31.12.2016 31.12.2015US 32.2 6.1 0.3 38.6 36.7
Germany 18.0 1.3 4.0 23.3 24.3UK 6.6 0.8 0.2 7.6 8.7Ireland 6.7 0.1 0.0 6.8 6.0France 2.1 1.0 1.2 4.3 3.9Canada 2.1 0.8 0.0 2.8 2.6Jersey 2.4 0.0 0.0 2.4 1.7Guernsey
island1.5 0.0 0.0 1.5 0.7
Austria 0.6 0.5 0.0 1.2 1.6Other 9.6 1.2 0.6 11.4 13.7
NR
2 (2)
<BB
1 (2)
BB
7 (7)
BBB
39 (40)
A
43 (41)
AA
7 (8)
AAA
0 (0)
>10 years
4 (5)
7–10 years
7 (10)
5–7 years
13 (13)
3–5 years
18 (25)
1–3 years
42 (36)
0–1 years
16 (11)
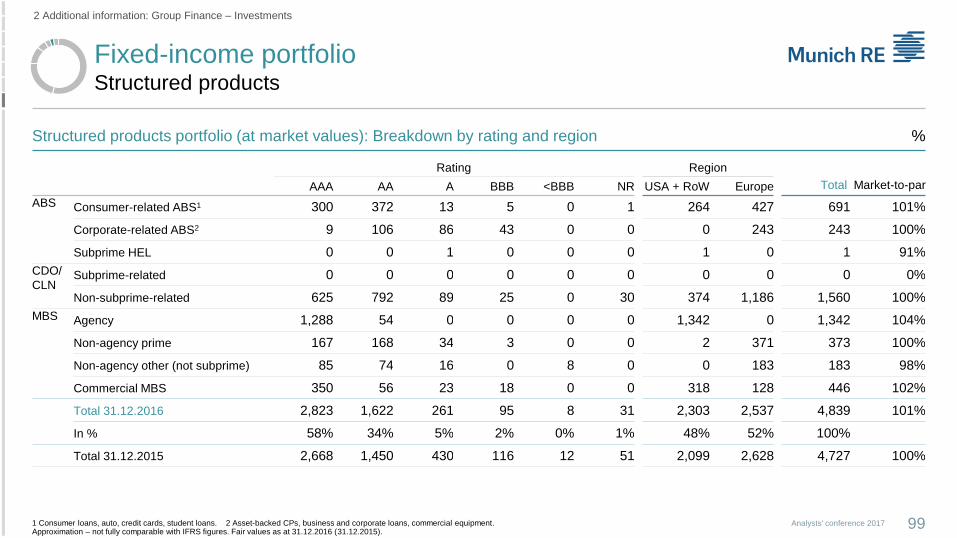
Fixed-income portfolioStructured products
99Analysts' conference 2017
2 Additional information: Group Finance – Investments
%
1 Consumer loans, auto, credit cards, student loans. 2 Asset-backed CPs, business and corporate loans, commercial equipment.Approximation – not fully comparable with IFRS figures. Fair values as at 31.12.2016 (31.12.2015).
Structured products portfolio (at market values): Breakdown by rating and region
Rating Region
Total Market-to-parAAA AA A BBB <BBB NR USA + RoW Europe
ABS Consumer-related ABS1 300 372 13 5 0 1 264 427 691 101%
Corporate-related ABS2 9 106 86 43 0 0 0 243 243 100%
Subprime HEL 0 0 1 0 0 0 1 0 1 91%
CDO/
CLNSubprime-related 0 0 0 0 0 0 0 0 0 0%
Non-subprime-related 625 792 89 25 0 30 374 1,186 1,560 100%
MBS Agency 1,288 54 0 0 0 0 1,342 0 1,342 104%
Non-agency prime 167 168 34 3 0 0 2 371 373 100%
Non-agency other (not subprime) 85 74 16 0 8 0 0 183 183 98%
Commercial MBS 350 56 23 18 0 0 318 128 446 102%
Total 31.12.2016 2,823 1,622 261 95 8 31 2,303 2,537 4,839 101%
In % 58% 34% 5% 2% 0% 1% 48% 52% 100%
Total 31.12.2015 2,668 1,450 430 116 12 51 2,099 2,628 4,727 100%
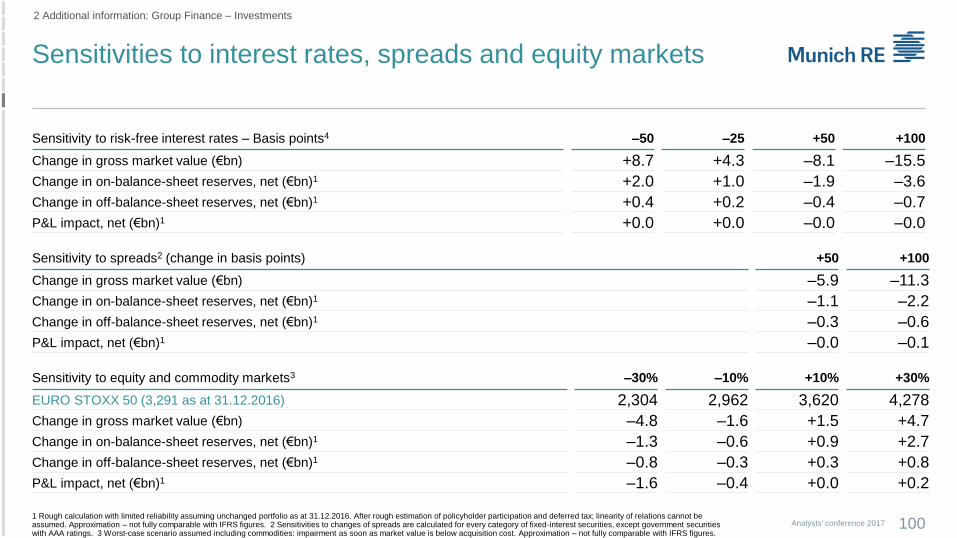
Sensitivities to interest rates, spreads and equity markets
100Analysts' conference 2017
2 Additional information: Group Finance – Investments
1 Rough calculation with limited reliability assuming unchanged portfolio as at 31.12.2016. After rough estimation of policyholder participation and deferred tax; linearity of relations cannot be assumed. Approximation – not fully comparable with IFRS figures. 2 Sensitivities to changes of spreads are calculated for every category of fixed-interest securities, except government securities with AAA ratings. 3 Worst-case scenario assumed including commodities: impairment as soon as market value is below acquisition cost. Approximation – not fully comparable with IFRS figures.
Sensitivity to risk-free interest rates – Basis points4 –50 –25 +50 +100
Change in gross market value (€bn) +8.7 +4.3 –8.1 –15.5
Change in on-balance-sheet reserves, net (€bn)1 +2.0 +1.0 –1.9 –3.6
Change in off-balance-sheet reserves, net (€bn)1 +0.4 +0.2 –0.4 –0.7
P&L impact, net (€bn)1 +0.0 +0.0 –0.0 –0.0
Sensitivity to spreads2 (change in basis points) +50 +100
Change in gross market value (€bn) –5.9 –11.3
Change in on-balance-sheet reserves, net (€bn)1 –1.1 –2.2
Change in off-balance-sheet reserves, net (€bn)1 –0.3 –0.6
P&L impact, net (€bn)1 –0.0 –0.1
Sensitivity to equity and commodity markets3 –30% –10% +10% +30%
EURO STOXX 50 (3,291 as at 31.12.2016) 2,304 2,962 3,620 4,278
Change in gross market value (€bn) –4.8 –1.6 +1.5 +4.7
Change in on-balance-sheet reserves, net (€bn)1 –1.3 –0.6 +0.9 +2.7
Change in off-balance-sheet reserves, net (€bn)1 –0.8 –0.3 +0.3 +0.8
P&L impact, net (€bn)1 –1.6 –0.4 +0.0 +0.2
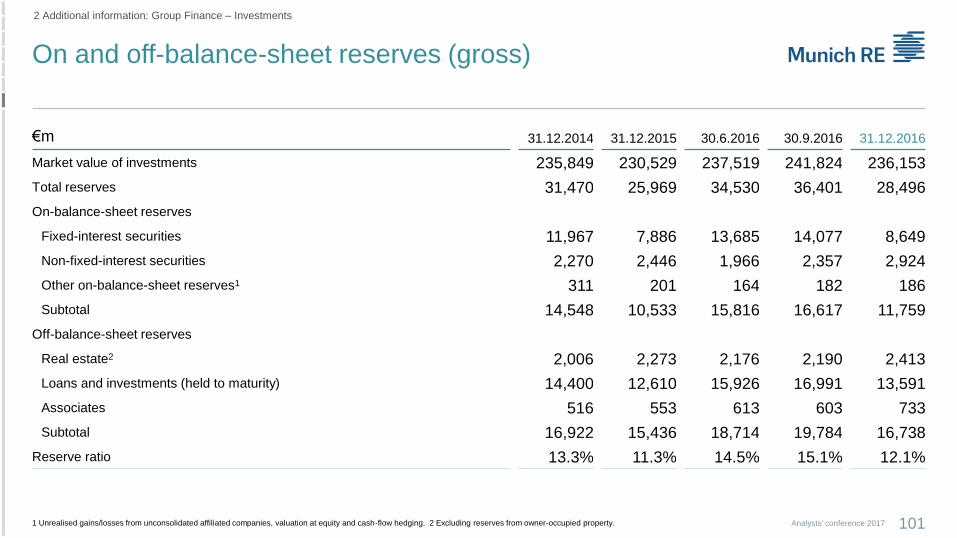
On and off-balance-sheet reserves (gross)
101Analysts' conference 2017
2 Additional information: Group Finance – Investments
€m 31.12.2014 31.12.2015 30.6.2016 30.9.2016 31.12.2016
Market value of investments 235,849 230,529 237,519 241,824 236,153
Total reserves 31,470 25,969 34,530 36,401 28,496
On-balance-sheet reserves
Fixed-interest securities 11,967 7,886 13,685 14,077 8,649
Non-fixed-interest securities 2,270 2,446 1,966 2,357 2,924
Other on-balance-sheet reserves1 311 201 164 182 186
Subtotal 14,548 10,533 15,816 16,617 11,759
Off-balance-sheet reserves
Real estate2 2,006 2,273 2,176 2,190 2,413
Loans and investments (held to maturity) 14,400 12,610 15,926 16,991 13,591
Associates 516 553 613 603 733
Subtotal 16,922 15,436 18,714 19,784 16,738
Reserve ratio 13.3% 11.3% 14.5% 15.1% 12.1%
1 Unrealised gains/losses from unconsolidated affiliated companies, valuation at equity and cash-flow hedging. 2 Excluding reserves from owner-occupied property.

On-balance-sheet reserves
102Analysts' conference 2017
2 Additional information: Group Finance – Investments
€mOn-balance-sheet reserves
31.12.2016 Change Q4
Investments afs 11,573 –4,862
Valuation at equity 80 4
Unconsolidated affiliated enterprises 90 5
Cash flow hedging 16 –6
Total on-balance-sheet reserves (gross) 11,759 –4,858
Provision for deferred premium refunds –5,634 1,932
Deferred tax –1,383 967
Minority interests –16 2
Consolidation and currency effects –294 –89
Shareholders' stake 4,432 –2,046
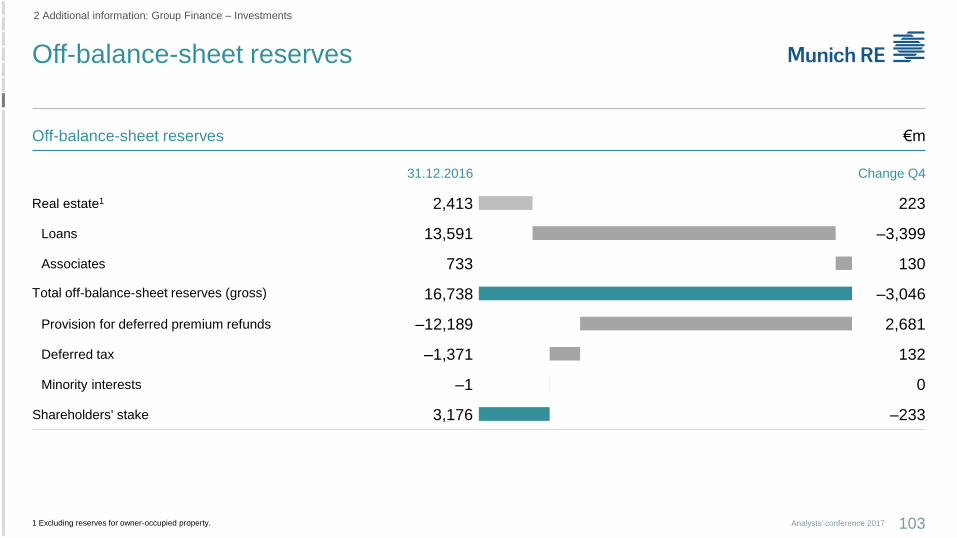
Off-balance-sheet reserves
103Analysts' conference 2017
2 Additional information: Group Finance – Investments
1 Excluding reserves for owner-occupied property.
€mOff-balance-sheet reserves
31.12.2016 Change Q4
Real estate1 2,413 223
Loans 13,591 –3,399
Associates 733 130
Total off-balance-sheet reserves (gross) 16,738 –3,046
Provision for deferred premium refunds –12,189 2,681
Deferred tax –1,371 132
Minority interests –1 0
Shareholders' stake 3,176 –233
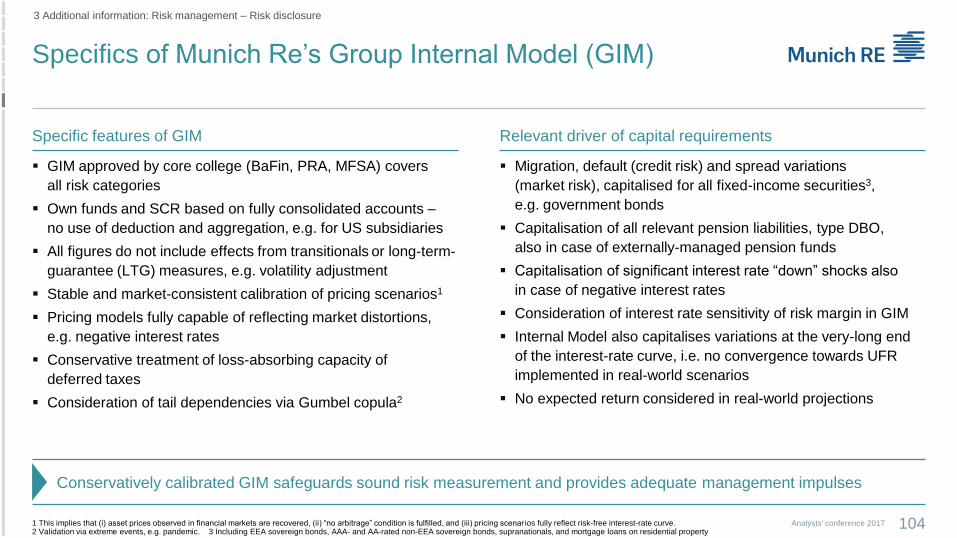
Specifics of Munich Re’s Group Internal Model (GIM)
104Analysts' conference 2017
3 Additional information: Risk management – Risk disclosure
Relevant driver of capital requirementsSpecific features of GIM
GIM approved by core college (BaFin, PRA, MFSA) covers
all risk categories
Own funds and SCR based on fully consolidated accounts –
no use of deduction and aggregation, e.g. for US subsidiaries
All figures do not include effects from transitionals or long-term-
guarantee (LTG) measures, e.g. volatility adjustment
Stable and market-consistent calibration of pricing scenarios1
Pricing models fully capable of reflecting market distortions,
e.g. negative interest rates
Conservative treatment of loss-absorbing capacity of
deferred taxes
Consideration of tail dependencies via Gumbel copula2
Migration, default (credit risk) and spread variations
(market risk), capitalised for all fixed-income securities3,
e.g. government bonds
Capitalisation of all relevant pension liabilities, type DBO,
also in case of externally-managed pension funds
Capitalisation of significant interest rate “down” shocks also
in case of negative interest rates
Consideration of interest rate sensitivity of risk margin in GIM
Internal Model also capitalises variations at the very-long end
of the interest-rate curve, i.e. no convergence towards UFR
implemented in real-world scenarios
No expected return considered in real-world projections
1 This implies that (i) asset prices observed in financial markets are recovered, (ii) “no arbitrage” condition is fulfilled, and (iii) pricing scenar ios fully reflect risk-free interest-rate curve. 2 Validation via extreme events, e.g. pandemic. 3 Including EEA sovereign bonds, AAA- and AA-rated non-EEA sovereign bonds, supranationals, and mortgage loans on residential property
Conservatively calibrated GIM safeguards sound risk measurement and provides adequate management impulses
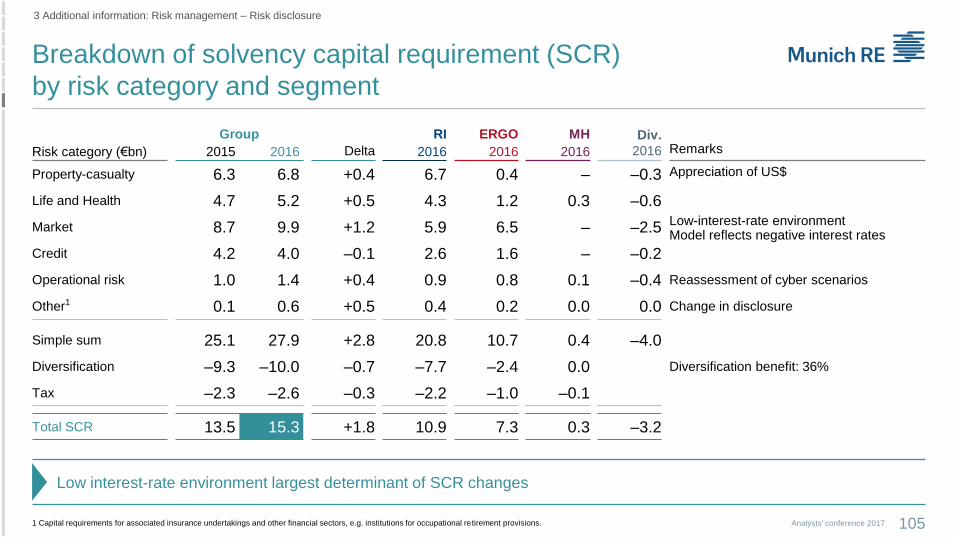
Breakdown of solvency capital requirement (SCR)
by risk category and segment
105Analysts' conference 2017
3 Additional information: Risk management – Risk disclosure
1 Capital requirements for associated insurance undertakings and other financial sectors, e.g. institutions for occupational retirement provisions.
Group
Delta
RI ERGO MH Div.
2016 RemarksRisk category (€bn) 2015 2016 2016 2016 2016
Property-casualty 6.3 6.8 +0.4 6.7 0.4 – –0.3 Appreciation of US$
Life and Health 4.7 5.2 +0.5 4.3 1.2 0.3 –0.6
Market 8.7 9.9 +1.2 5.9 6.5 – –2.5 Low-interest-rate environmentModel reflects negative interest rates
Credit 4.2 4.0 –0.1 2.6 1.6 – –0.2
Operational risk 1.0 1.4 +0.4 0.9 0.8 0.1 –0.4 Reassessment of cyber scenarios
Other1 0.1 0.6 +0.5 0.4 0.2 0.0 0.0 Change in disclosure
Simple sum 25.1 27.9 +2.8 20.8 10.7 0.4 –4.0
Diversification –9.3 –10.0 –0.7 –7.7 –2.4 0.0 Diversification benefit: 36%
Tax –2.3 –2.6 –0.3 –2.2 –1.0 –0.1
Total SCR 13.5 15.3 +1.8 10.9 7.3 0.3 –3.2
Low interest-rate environment largest determinant of SCR changes
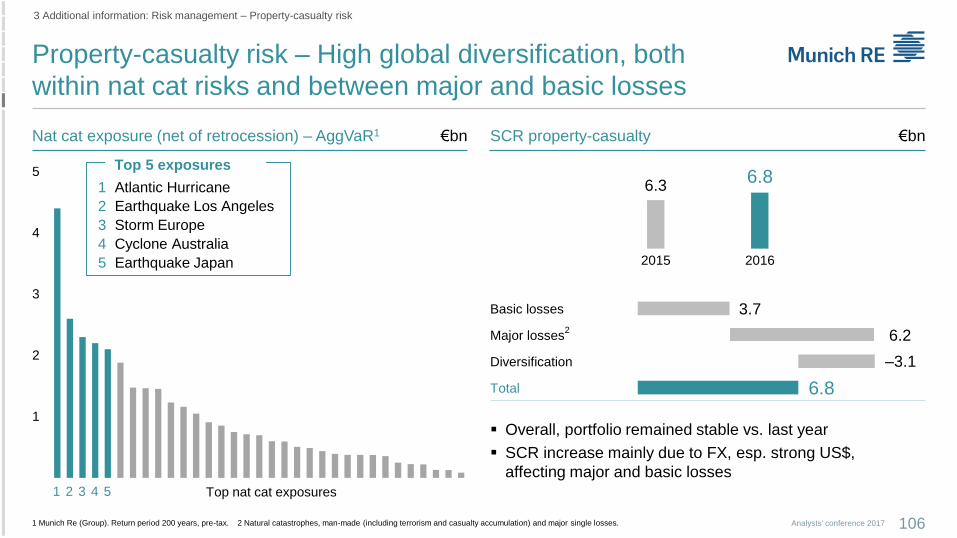
Property-casualty risk – High global diversification, both
within nat cat risks and between major and basic losses
106Analysts' conference 2017
3 Additional information: Risk management – Property-casualty risk
1 Munich Re (Group). Return period 200 years, pre-tax. 2 Natural catastrophes, man-made (including terrorism and casualty accumulation) and major single losses.
Nat cat exposure (net of retrocession) – AggVaR1 €bn SCR property-casualty €bn
1
2
3
4
5
Top nat cat exposures
1 Atlantic Hurricane
2 Earthquake Los Angeles
3 Storm Europe
4 Cyclone Australia
5 Earthquake Japan
Top 5 exposures
1 2 3 4 5
6.36.8
2015 2016
Basic losses
Major losses2
Diversification
Total
3.7
6.2
–3.1
6.8
Overall, portfolio remained stable vs. last year
SCR increase mainly due to FX, esp. strong US$,
affecting major and basic losses

4.75.2
2015 2016
Life and Health risk
Slight increase mainly driven by Reinsurance Life
107Analysts' conference 2017
3 Additional information: Risk management – Life and Health risk
Life and Health – VaR1 €bn SCR Life and Health €bn
Longevity
Mortality
Morbidity
Health
1.7
3.6
2.7
0.6
1.5
3.2
2.6
0.6
2016
2015
Slight increase equally driven by ERGO L/H and
Reinsurance Life
Reinsurance Life: mainly due to growth in
UK business
ERGO L/H: effects of lower euro interest
rates largely offset by the implementation
of the Strategy Programme
Longevity2 Mortality
Slight increase mainly driven by Reinsurance Life
Business growth particularly in Asia and USA
FX effects, appreciation of CAD and US$
Morbidity
Slight increase mainly driven by Reinsurance Life
Mostly due to business growth in Canada,
Australia and Asia
1 Munich Re (Group). Return period 200 years, pre-tax. 2 ERGO L/H has a share of ~60% in this risk category.
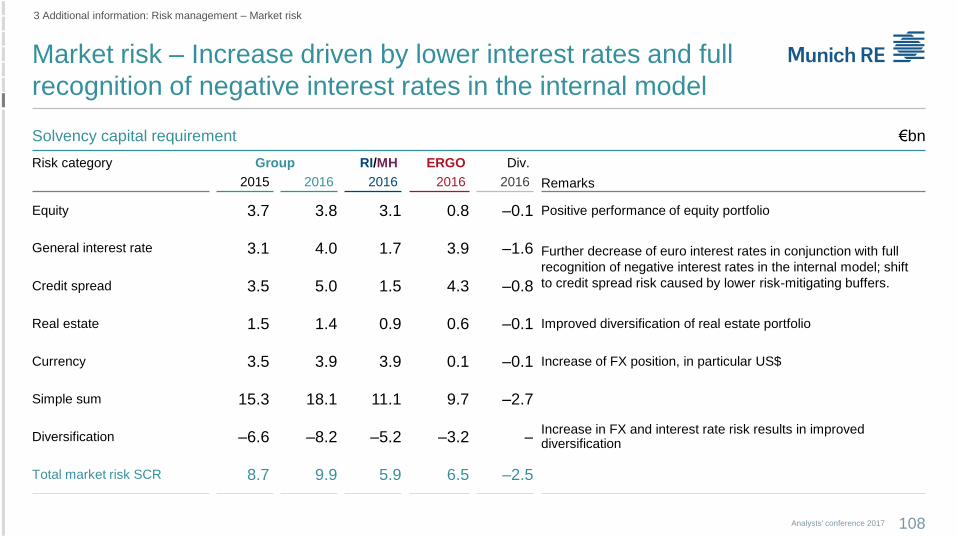
Market risk – Increase driven by lower interest rates and full
recognition of negative interest rates in the internal model
108Analysts' conference 2017
3 Additional information: Risk management – Market risk
Risk category Group RI/MH ERGO Div.
Remarks2015 2016 2016 2016 2016
Equity 3.7 3.8 3.1 0.8 –0.1 Positive performance of equity portfolio
General interest rate 3.1 4.0 1.7 3.9 –1.6 Further decrease of euro interest rates in conjunction with full
recognition of negative interest rates in the internal model; shift
to credit spread risk caused by lower risk-mitigating buffers.Credit spread 3.5 5.0 1.5 4.3 –0.8
Real estate 1.5 1.4 0.9 0.6 –0.1 Improved diversification of real estate portfolio
Currency 3.5 3.9 3.9 0.1 –0.1 Increase of FX position, in particular US$
Simple sum 15.3 18.1 11.1 9.7 –2.7
Diversification –6.6 –8.2 –5.2 –3.2 –Increase in FX and interest rate risk results in improved diversification
Total market risk SCR 8.7 9.9 5.9 6.5 –2.5
Solvency capital requirement €bn
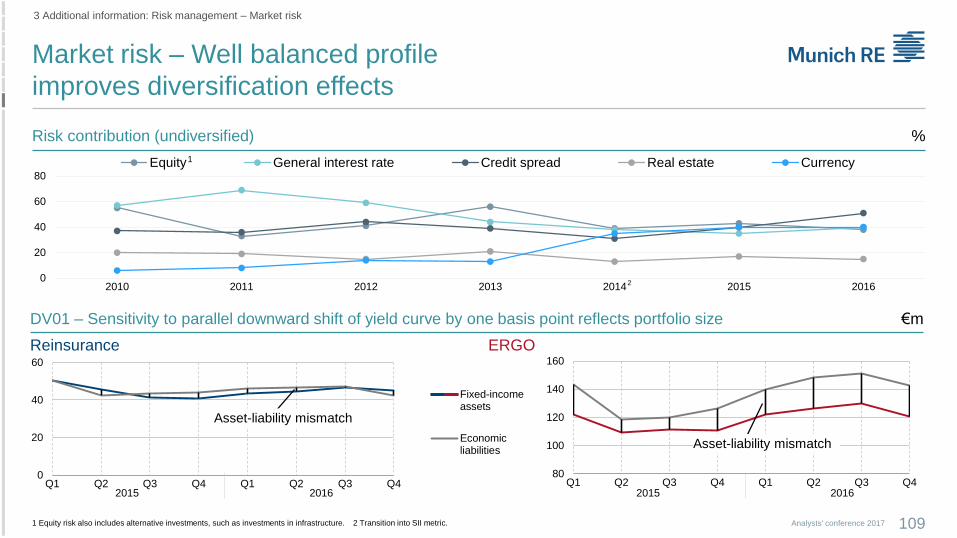
0
20
40
60
80
2010 2011 2012 2013 2014 2015 2016
Equity General interest rate Credit spread Real estate Currency
Market risk – Well balanced profile
improves diversification effects
109Analysts' conference 2017
3 Additional information: Risk management – Market risk
1 Equity risk also includes alternative investments, such as investments in infrastructure. 2 Transition into SII metric.
Risk contribution (undiversified) %
1
2
Reinsurance ERGO
DV01 – Sensitivity to parallel downward shift of yield curve by one basis point reflects portfolio size €m
80
100
120
140
160
Q1 Q2 Q3 Q4 Q1 Q2 Q3 Q40
20
40
60
Q1 Q2 Q3 Q4 Q1 Q2 Q3 Q4
Fixed-incomeassets
Economicliabilities
2015 2016
Asset-liability mismatch
Asset-liability mismatch
2015 2016
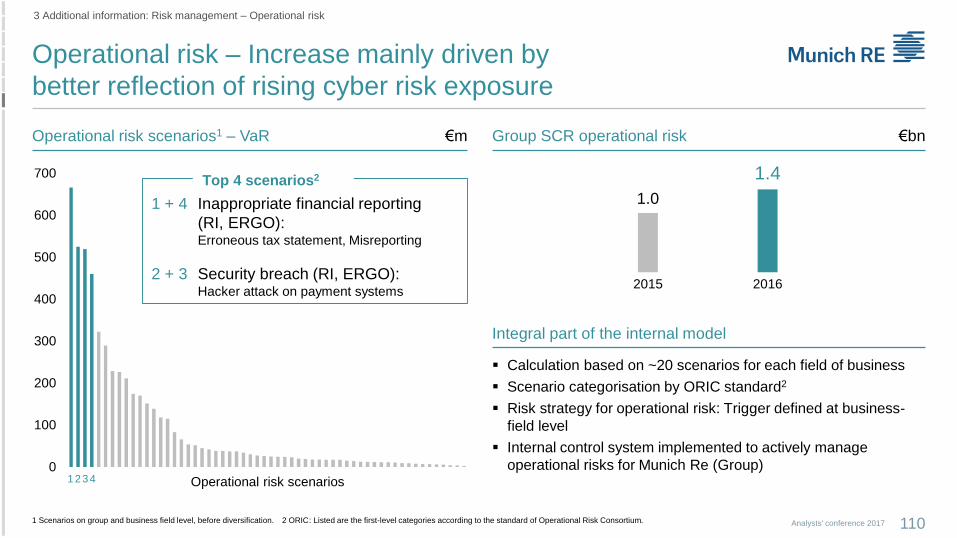
0
100
200
300
400
500
600
700
Operational risk scenarios
Operational risk – Increase mainly driven by
better reflection of rising cyber risk exposure
110Analysts' conference 2017
3 Additional information: Risk management – Operational risk
1 Scenarios on group and business field level, before diversification. 2 ORIC: Listed are the first-level categories according to the standard of Operational Risk Consortium.
Operational risk scenarios1 – VaR €m Group SCR operational risk €bn
1 + 4 Inappropriate financial reporting
(RI, ERGO):Erroneous tax statement, Misreporting
2 + 3 Security breach (RI, ERGO):Hacker attack on payment systems
Top 4 scenarios2
Calculation based on ~20 scenarios for each field of business
Scenario categorisation by ORIC standard2
Risk strategy for operational risk: Trigger defined at business-
field level
Internal control system implemented to actively manage
operational risks for Munich Re (Group)
Integral part of the internal model
1234
1.0
1.4
2015 2016
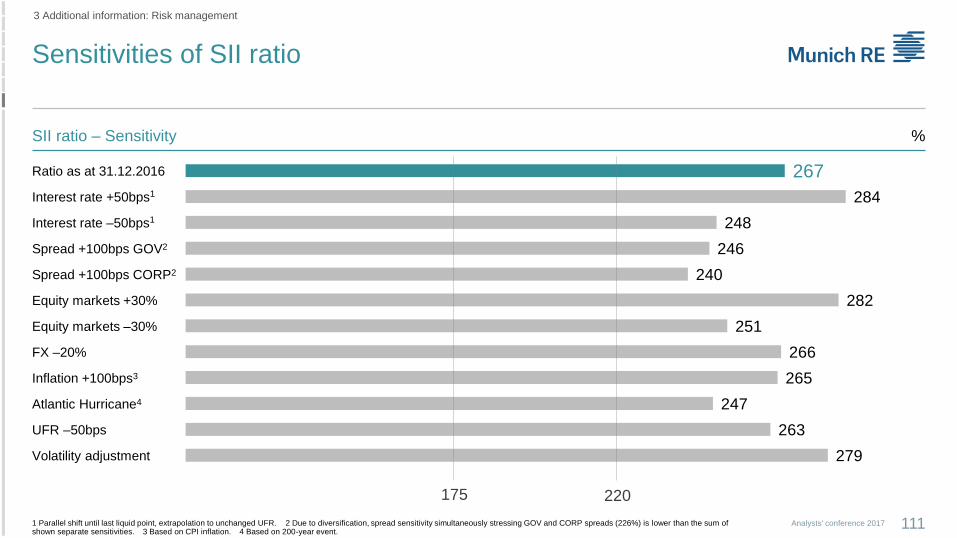
267
284
248
246
240
282
251
266
265
247
263
279
Sensitivities of SII ratio
111Analysts' conference 2017
3 Additional information: Risk management
SII ratio – Sensitivity %
Ratio as at 31.12.2016
Interest rate +50bps1
Interest rate –50bps1
Spread +100bps GOV2
Spread +100bps CORP2
Equity markets +30%
Equity markets –30%
FX –20%
Inflation +100bps3
Atlantic Hurricane4
UFR –50bps
Volatility adjustment
220175
1 Parallel shift until last liquid point, extrapolation to unchanged UFR. 2 Due to diversification, spread sensitivity simultaneously stressing GOV and CORP spreads (226%) is lower than the sum of shown separate sensitivities. 3 Based on CPI inflation. 4 Based on 200-year event.
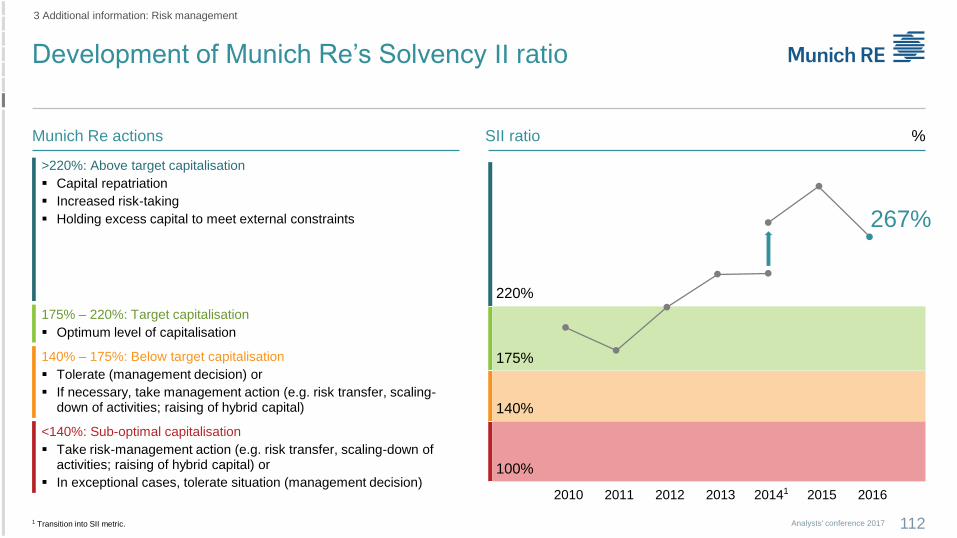
Development of Munich Re’s Solvency II ratio
112Analysts' conference 2017
3 Additional information: Risk management
SII ratio %Munich Re actions
>220%: Above target capitalisation
Capital repatriation
Increased risk-taking
Holding excess capital to meet external constraints
140% – 175%: Below target capitalisation
Tolerate (management decision) or
If necessary, take management action (e.g. risk transfer, scaling-down of activities; raising of hybrid capital)
<140%: Sub-optimal capitalisation
Take risk-management action (e.g. risk transfer, scaling-down of activities; raising of hybrid capital) or
In exceptional cases, tolerate situation (management decision)
175% – 220%: Target capitalisation
Optimum level of capitalisation
220%
175%
140%
100%
2010 2011 2012 2013 20141 2015 2016
267%
1 Transition into SII metric.
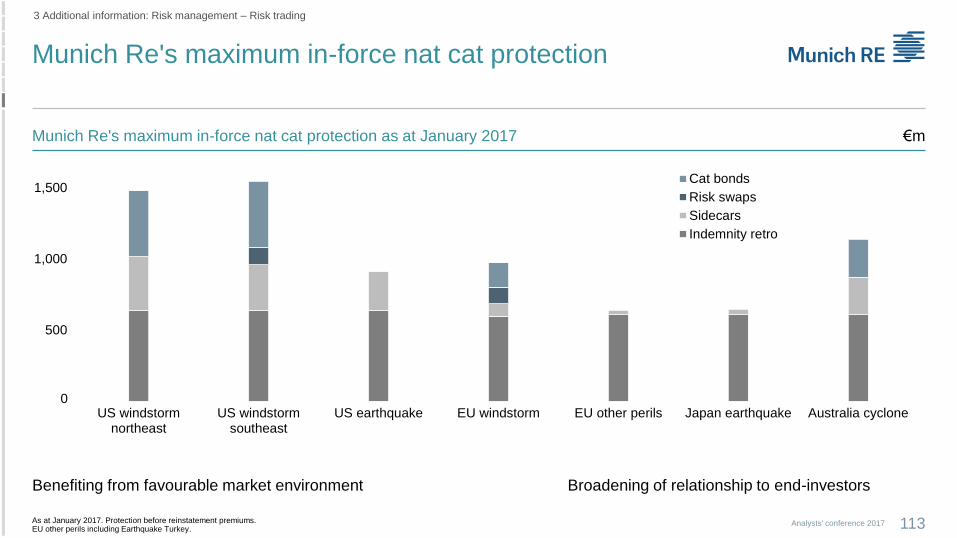
Munich Re's maximum in-force nat cat protection
113Analysts' conference 2017
Munich Re's maximum in-force nat cat protection as at January 2017 €m
As at January 2017. Protection before reinstatement premiums.EU other perils including Earthquake Turkey.
500
1,000
1,500
US windstormnortheast
US windstormsoutheast
US earthquake EU windstorm EU other perils Japan earthquake Australia cyclone
Cat bonds
Risk swaps
Sidecars
Indemnity retro
0
Benefiting from favourable market environment Broadening of relationship to end-investors
3 Additional information: Risk management – Risk trading

ESP – Update “Fit, Digital & Successful!”
114Analysts' conference 2017
4 Additional information: ERGO
Elements Achievements 2016
F1 Sales
F3 Governance
International
F2 Administration
F4 Life Germany
Bundling of sales forces into one tied-agent organisation
Despite restructuring, sales volume exceeded forecast (+12%)
Workers’ council has agreed on major topics
D5 Foundational IT
D7 Processes
D6 Digital IT Establishment of new IT organisation
Incorporation of new ERGO Digital IT GmbH
Improvement of “Straight Through Processing” rate
S8 Product portfolio
S10 Online customers
S12 Mobility Solutions
S9 Hybrid customers
S11 Commercial/
industrial business
S13 Strategy International
New modular product design and start of new modular policies (motor and
liability)
Re-design of ERGO.de website
Legal establishment of pure digital player “nexible”
Start of “ERGO Vorteilswelt” (ERGO Direkt)
Starting full digital underwriting of term insurance policies (ERGO Direkt)
ERGO International strategy and organisational structure finalised
Fit
Digital
Successful!
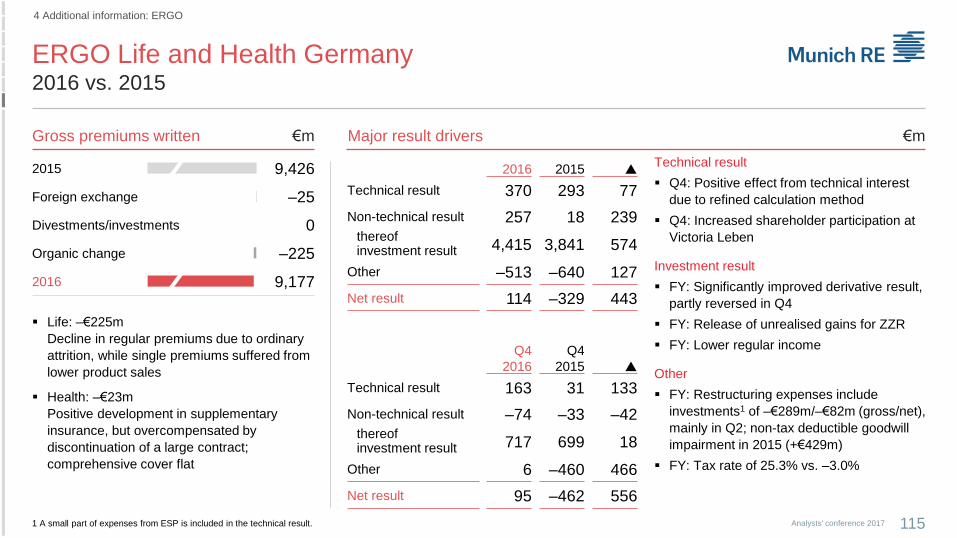
2015 9,426
Foreign exchange –25
Divestments/investments 0
Organic change –225
2016 9,177
Gross premiums written €m Major result drivers €m
ERGO Life and Health Germany2016 vs. 2015
115Analysts' conference 2017
4 Additional information: ERGO
Life: –€225m
Decline in regular premiums due to ordinary
attrition, while single premiums suffered from
lower product sales
Health: –€23m
Positive development in supplementary
insurance, but overcompensated by
discontinuation of a large contract;
comprehensive cover flat
Technical result
Q4: Positive effect from technical interest
due to refined calculation method
Q4: Increased shareholder participation at
Victoria Leben
Investment result
FY: Significantly improved derivative result,
partly reversed in Q4
FY: Release of unrealised gains for ZZR
FY: Lower regular income
Other
FY: Restructuring expenses include
investments1 of –€289m/–€82m (gross/net),
mainly in Q2; non-tax deductible goodwill
impairment in 2015 (+€429m)
FY: Tax rate of 25.3% vs. –3.0%
2016 2015
Technical result 370 293 77
Non-technical result 257 18 239thereof investment result 4,415 3,841 574
Other –513 –640 127
Net result 114 –329 443
Q4
2016
Q4
2015
Technical result 163 31 133
Non-technical result –74 –33 –42thereof investment result 717 699 18
Other 6 –460 466
Net result 95 –462 556
1 A small part of expenses from ESP is included in the technical result.

3.92
2.54
0.00
0.25
0.50
0.75
1.00
1.25
1.50
1.75
2.00
2.25
2.50
2.75
3.00
3.25
3.50
3.75
4.00
2011 2013 2015 2017 2019 2021
Reference rate
Increase
Stable
Decrease
1.00
3.00
4.00
2.00
Guarantee level
Life Germany – Key figures and ZZR
4 Additional information: ERGO
1 German GAAP figures for ERGO Leben, Victoria Leben and ERGO Direkt Leben. 2 Based on interest-rate scenarios. 3 German GAAP figures.
Key figures1
0%
2%
4%
2016 2020
Average yield vs. average guarantee
Reinvestment
yield
Average
yield
Average
guarantee
2016 ~1.3 ~3.4 ~2.4
2015 ~1.8 ~3.4 ~2.7
2014 ~2.6 ~3.6 ~3.0
%
ILLUSTRATIVE
ZZR reference rate – Projection2 %
Key financials3 – €bn Free RfB Terminal bonus fund Unrealised gains Accumulate ZZR
2016 1.2 1.1 13.7 3.6
2015 0.9 1.6 12.2 2.5
2014 1.0 1.7 14.6 1.5
ZZR – Low interest-rate reserve
Local GAAP reserve against low
interest rates
Expected accumulated ZZR
in 2017: ~€5bn
Partly financed through unrealised
gains – positive impact on IFRS
earnings when realised
Effect on IFRS net income
in 2016: +€22m
avg. yield
avg. guarantee
Analysts' conference 2017 116
ILLUSTRATIVE
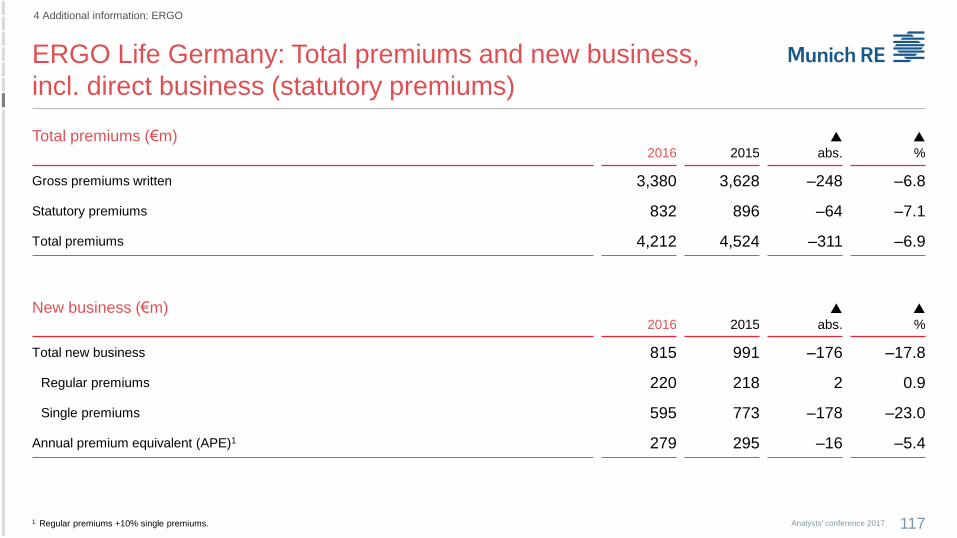
ERGO Life Germany: Total premiums and new business,
incl. direct business (statutory premiums)
117Analysts' conference 2017
4 Additional information: ERGO
1 Regular premiums +10% single premiums.
Total premiums (€m)2016 2015
abs.
%
Gross premiums written 3,380 3,628 –248 –6.8
Statutory premiums 832 896 –64 –7.1
Total premiums 4,212 4,524 –311 –6.9
New business (€m)2016 2015
abs.
%
Total new business 815 991 –176 –17.8
Regular premiums 220 218 2 0.9
Single premiums 595 773 –178 –23.0
Annual premium equivalent (APE)1 279 295 –16 –5.4
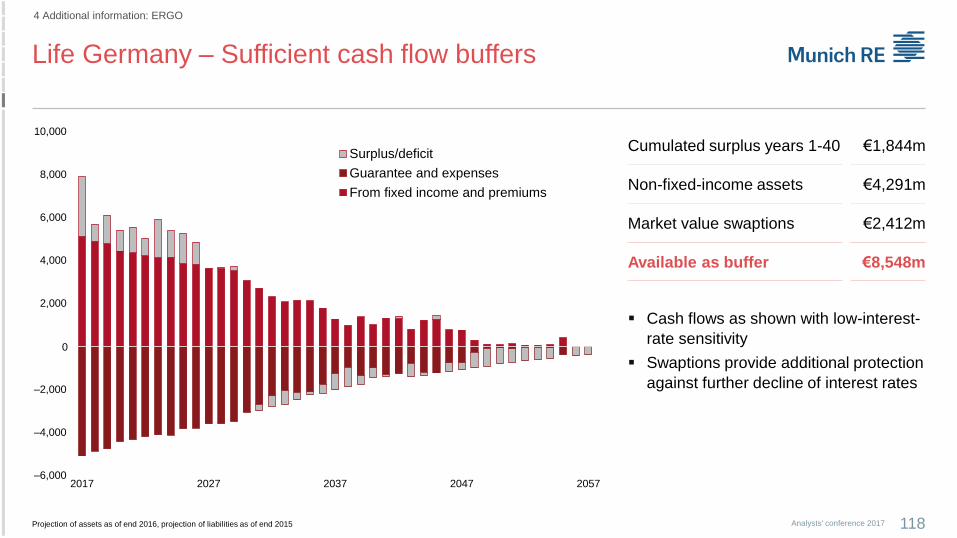
Life Germany – Sufficient cash flow buffers
118Analysts' conference 2017
4 Additional information: ERGO
Cash flows as shown with low-interest-
rate sensitivity
Swaptions provide additional protection
against further decline of interest rates
Cumulated surplus years 1-40 €1,844m
Non-fixed-income assets €4,291m
Market value swaptions €2,412m
Available as buffer €8,548m
Projection of assets as of end 2016, projection of liabilities as of end 2015
–6,000
–4,000
–2,000
–
2,000
4,000
6,000
8,000
10,000
2017 2027 2037 2047 2057
Surplus/deficit
Guarantee and expenses
From fixed income and premiums
0
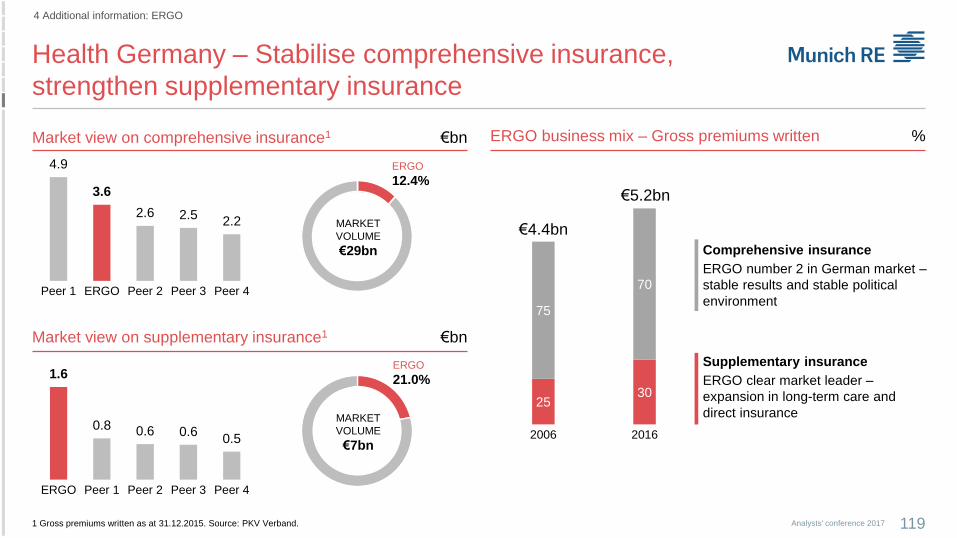
4.9
3.6
2.6 2.52.2
Peer 1 ERGO Peer 2 Peer 3 Peer 4
Health Germany – Stabilise comprehensive insurance,
strengthen supplementary insurance
119Analysts' conference 2017
4 Additional information: ERGO
1.6
0.8 0.6 0.60.5
ERGO Peer 1 Peer 2 Peer 3 Peer 4
MARKET
VOLUME
€7bn
ERGO
21.0%
Comprehensive insurance
ERGO number 2 in German market –
stable results and stable political
environment
Market view on comprehensive insurance1
1 Gross premiums written as at 31.12.2015. Source: PKV Verband.
Market view on supplementary insurance1
ERGO business mix – Gross premiums written
MARKET
VOLUME
€29bn
ERGO
12.4%
€bn
€bn
2530
75
70
2006 2016
%
€5.2bn
€4.4bn
Supplementary insurance
ERGO clear market leader –
expansion in long-term care and
direct insurance
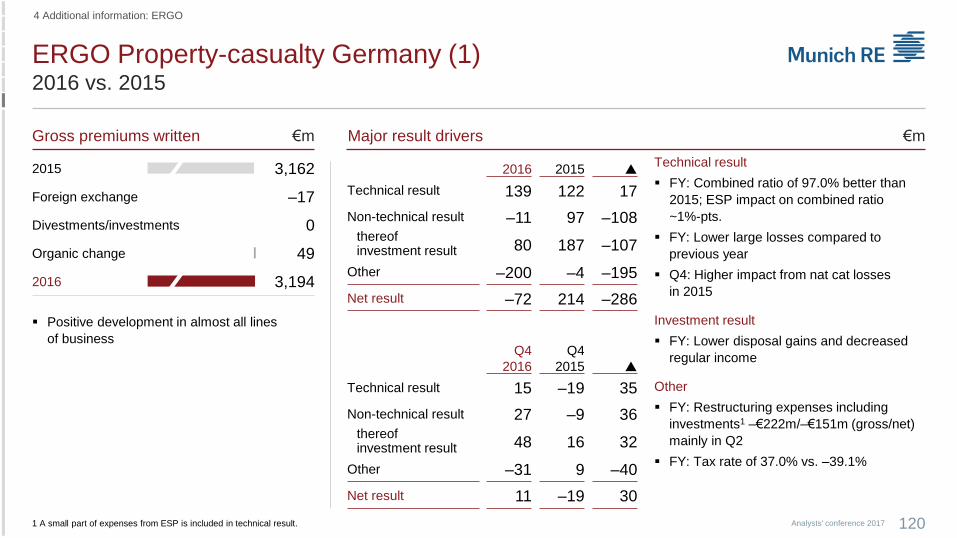
2015 3,162
Foreign exchange –17
Divestments/investments 0
Organic change 49
2016 3,194
Gross premiums written €m Major result drivers €m
ERGO Property-casualty Germany (1)2016 vs. 2015
120Analysts' conference 2017
4 Additional information: ERGO
Positive development in almost all lines
of business
2016 2015
Technical result 139 122 17
Non-technical result –11 97 –108thereof investment result 80 187 –107
Other –200 –4 –195
Net result –72 214 –286
Q4
2016
Q4
2015
Technical result 15 –19 35
Non-technical result 27 –9 36thereof investment result 48 16 32
Other –31 9 –40
Net result 11 –19 30
Technical result
FY: Combined ratio of 97.0% better than
2015; ESP impact on combined ratio
~1%-pts.
FY: Lower large losses compared to
previous year
Q4: Higher impact from nat cat losses
in 2015
Investment result
FY: Lower disposal gains and decreased
regular income
Other
FY: Restructuring expenses including
investments1 –€222m/–€151m (gross/net)
mainly in Q2
FY: Tax rate of 37.0% vs. –39.1%
1 A small part of expenses from ESP is included in technical result.

ERGO Property-casualty Germany (2)
4 Additional information: ERGO
Analysts' conference 2017 121
98.1
93.496.1
103.9
98.6
93.396.1
100.0
Q12015
Q22015
Q32015
Q42015
Q12016
Q22016
Q32016
Q42016
2014 95.3
2015 97.9
2016 97.0
Q4 2016 100.0
63.1
64.7
61.9
63.7
32.2
33.2
35.1
36.2
Combined ratio %
Expense ratio Loss ratio
€mGross premiums written1
Personal accident
638 (654)
Liability
545 (536)
TOTAL
€3,194m(€3,162m)
Other
379 (336)
Motor
671 (663)
Fire/property
559 (577)
Legal protection
401 (395)
1 Fair values as at 31.12.2016 (31.12.2015).
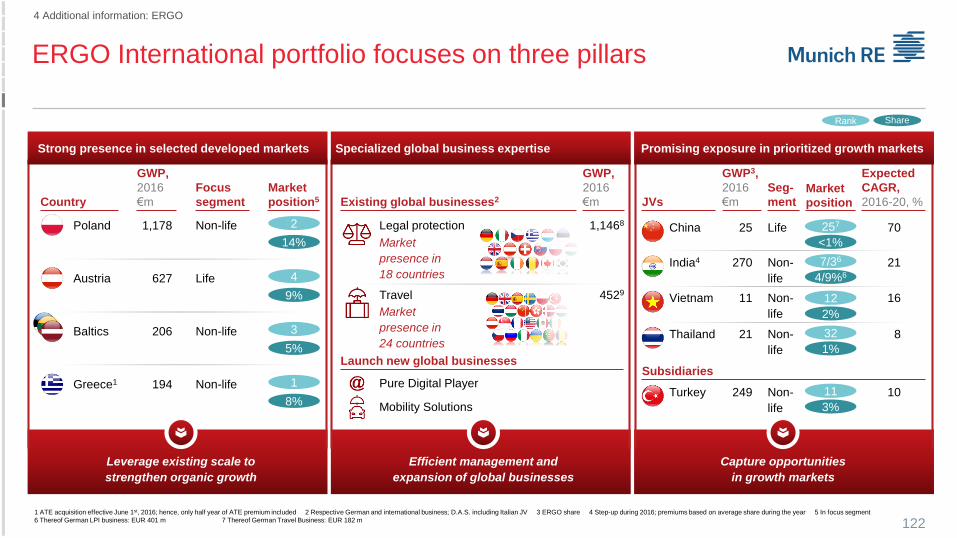
ERGO International portfolio focuses on three pillars
122
Leverage existing scale to
strengthen organic growth
Capture opportunities
in growth markets
GWP,
2016
€m JVs
Expected
CAGR,
2016-20, %
Promising exposure in prioritized growth markets
Market
position5
GWP,
2016
€mExisting global businesses2
1,1468Legal protection
Market
presence in
18 countries
4529Travel
Efficient management and
expansion of global businesses
Specialized global business expertise
Rank Share
GWP3,
2016
€m
Seg-
ment
Focus
segmentMarket
positionCountry
India4 21270 Non-
life 4/9%6
7/36
China 7025 Life
<1%
257
Thailand 821 Non-
life 1%
32
Vietnam 1611 Non-
life 2%
12
627
9%
4LifeAustria
1,178
14%
2Non-lifePoland
194
8%
1Non-lifeGreece1
206
5%
3Non-lifeBaltics
Strong presence in selected developed markets
Market
presence in
24 countries
Subsidiaries
Turkey 10249 Non-
life 3%
11Pure Digital Player
Mobility Solutions
Launch new global businesses
4 Additional information: ERGO
1 ATE acquisition effective June 1st, 2016; hence, only half year of ATE premium included 2 Respective German and international business; D.A.S. including Italian JV 3 ERGO share 4 Step-up during 2016; premiums based on average share during the year 5 In focus segment
6 Thereof German LPI business: EUR 401 m 7 Thereof German Travel Business: EUR 182 m
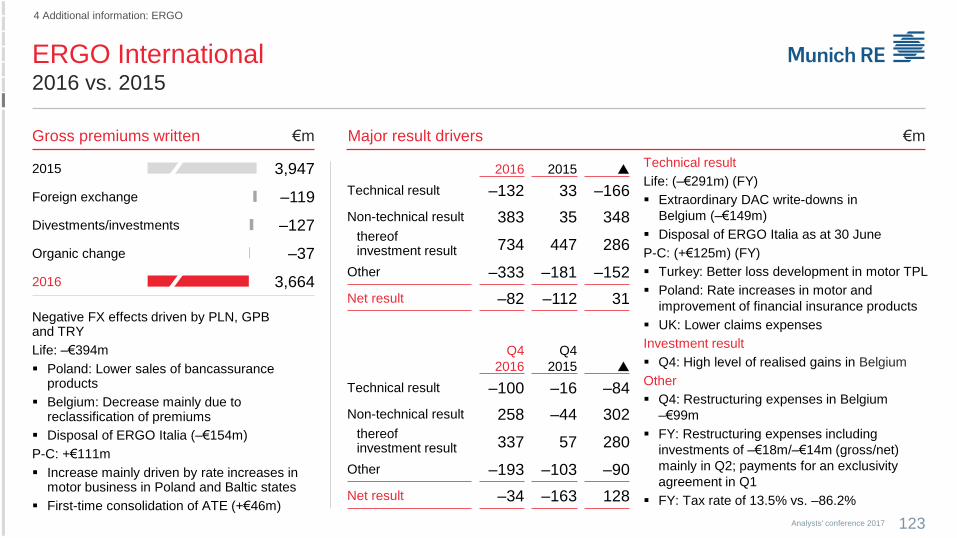
Gross premiums written €m Major result drivers €m
ERGO International2016 vs. 2015
123Analysts' conference 2017
4 Additional information: ERGO
2015 3,947
Foreign exchange –119
Divestments/investments –127
Organic change –37
2016 3,664
2016 2015
Technical result –132 33 –166
Non-technical result 383 35 348thereof investment result 734 447 286
Other –333 –181 –152
Net result –82 –112 31
Q4
2016
Q4
2015
Technical result –100 –16 –84
Non-technical result 258 –44 302thereof investment result 337 57 280
Other –193 –103 –90
Net result –34 –163 128
Negative FX effects driven by PLN, GPB and TRY
Life: –€394m
Poland: Lower sales of bancassurance products
Belgium: Decrease mainly due to reclassification of premiums
Disposal of ERGO Italia (–€154m)
P-C: +€111m
Increase mainly driven by rate increases in motor business in Poland and Baltic states
First-time consolidation of ATE (+€46m)
Technical result
Life: (–€291m) (FY)
Extraordinary DAC write-downs in
Belgium (–€149m)
Disposal of ERGO Italia as at 30 June
P-C: (+€125m) (FY)
Turkey: Better loss development in motor TPL
Poland: Rate increases in motor and
improvement of financial insurance products
UK: Lower claims expenses
Investment result
Q4: High level of realised gains in Belgium
Other
Q4: Restructuring expenses in Belgium
–€99m
FY: Restructuring expenses including
investments of –€18m/–€14m (gross/net)
mainly in Q2; payments for an exclusivity
agreement in Q1
FY: Tax rate of 13.5% vs. –86.2%
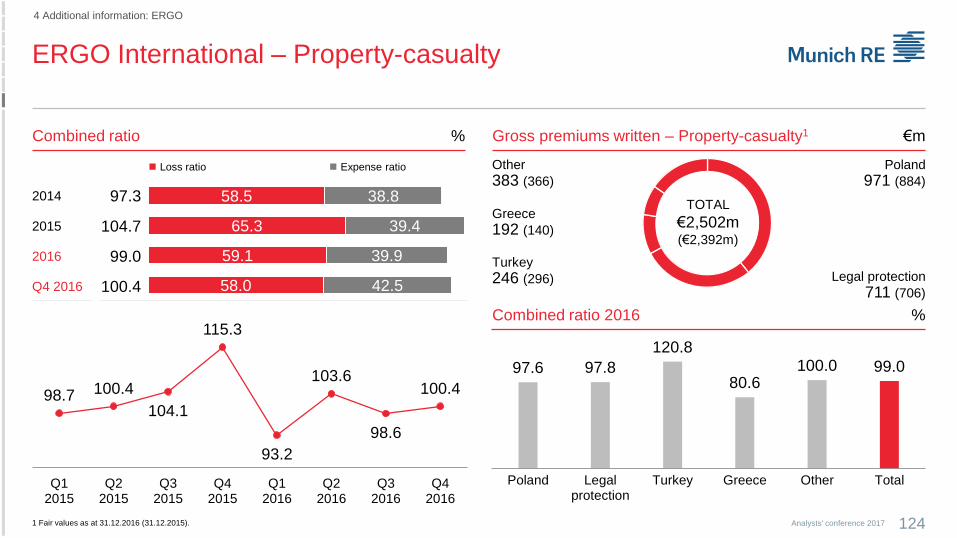
ERGO International – Property-casualty
4 Additional information: ERGO
Analysts' conference 2017 124
98.7 100.4
104.1
115.3
93.2
103.6
98.6
100.4
Q12015
Q22015
Q32015
Q42015
Q12016
Q22016
Q32016
Q42016
€m
2014 97.3
2015 104.7
2016 99.0
Q4 2016 100.4
58.5
65.3
59.1
58.0
38.8
39.4
39.9
42.5
Combined ratio % Gross premiums written – Property-casualty1
Legal protection
711 (706)
Turkey
246 (296)
TOTAL
€2,502m(€2,392m)
Other
383 (366)
Poland
971 (884)
Greece
192 (140)
%Combined ratio 2016
97.6 97.8
120.8
80.6100.0 99.0
Poland Legalprotection
Turkey Greece Other Total
Expense ratio Loss ratio
1 Fair values as at 31.12.2016 (31.12.2015).
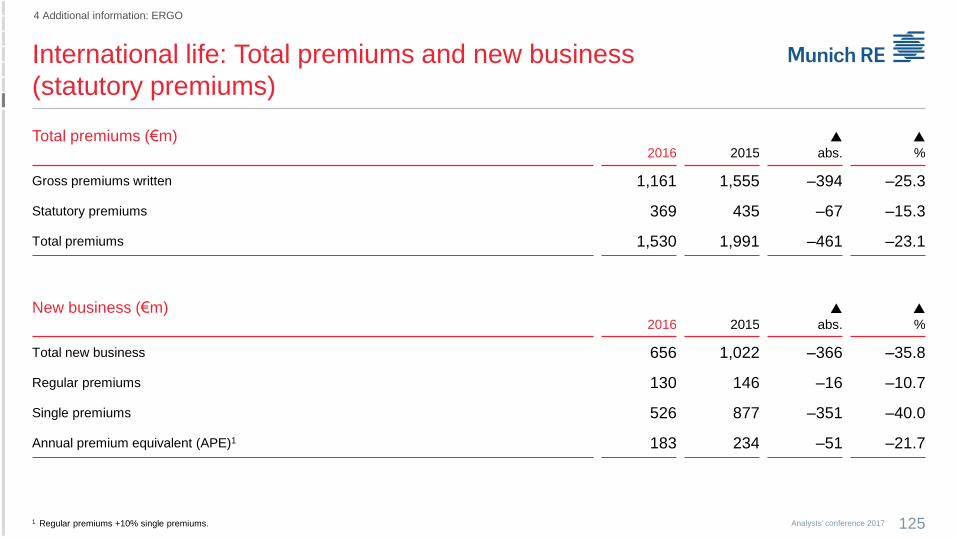
International life: Total premiums and new business
(statutory premiums)
125Analysts' conference 2017
4 Additional information: ERGO
1 Regular premiums +10% single premiums.
Total premiums (€m)2016 2015
abs.
%
Gross premiums written 1,161 1,555 –394 –25.3
Statutory premiums 369 435 –67 –15.3
Total premiums 1,530 1,991 –461 –23.1
New business (€m)2016 2015
abs.
%
Total new business 656 1,022 –366 –35.8
Regular premiums 130 146 –16 –10.7
Single premiums 526 877 –351 –40.0
Annual premium equivalent (APE)1 183 234 –51 –21.7
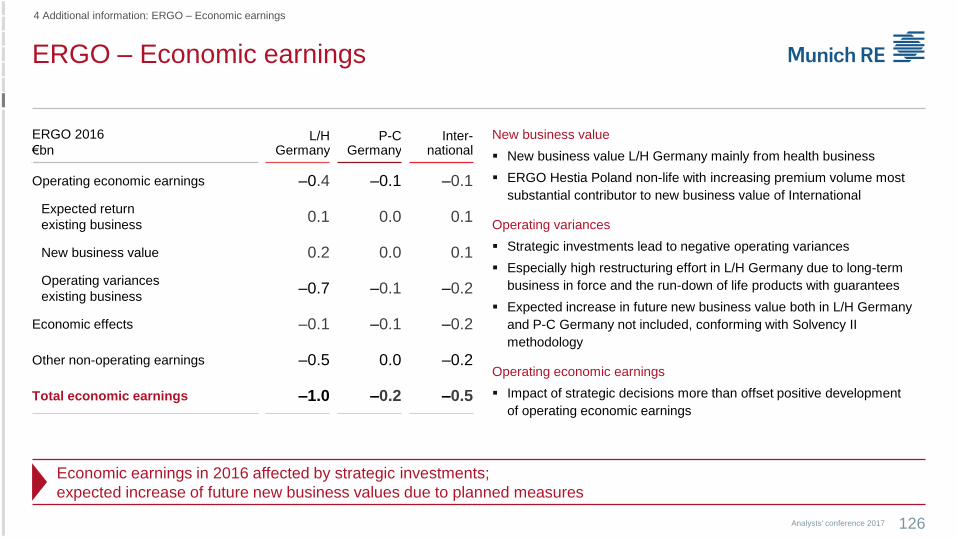
ERGO – Economic earnings
4 Additional information: ERGO – Economic earnings
126
ERGO 2016
€bnL/H
GermanyP-C
GermanyInter-
national
Operating economic earnings –0.4 –0.1 –0.1
Expected return
existing business 0.1 0.0 0.1
New business value 0.2 0.0 0.1
Operating variances
existing business–0.7 –0.1 –0.2
Economic effects –0.1 –0.1 –0.2
Other non-operating earnings –0.5 0.0 –0.2
Total economic earnings –1.0 –0.2 –0.5
Economic earnings in 2016 affected by strategic investments;
expected increase of future new business values due to planned measures
New business value
New business value L/H Germany mainly from health business
ERGO Hestia Poland non-life with increasing premium volume most
substantial contributor to new business value of International
Operating variances
Strategic investments lead to negative operating variances
Especially high restructuring effort in L/H Germany due to long-term
business in force and the run-down of life products with guarantees
Expected increase in future new business value both in L/H Germany
and P-C Germany not included, conforming with Solvency II
methodology
Operating economic earnings
Impact of strategic decisions more than offset positive development
of operating economic earnings
Analysts' conference 2017
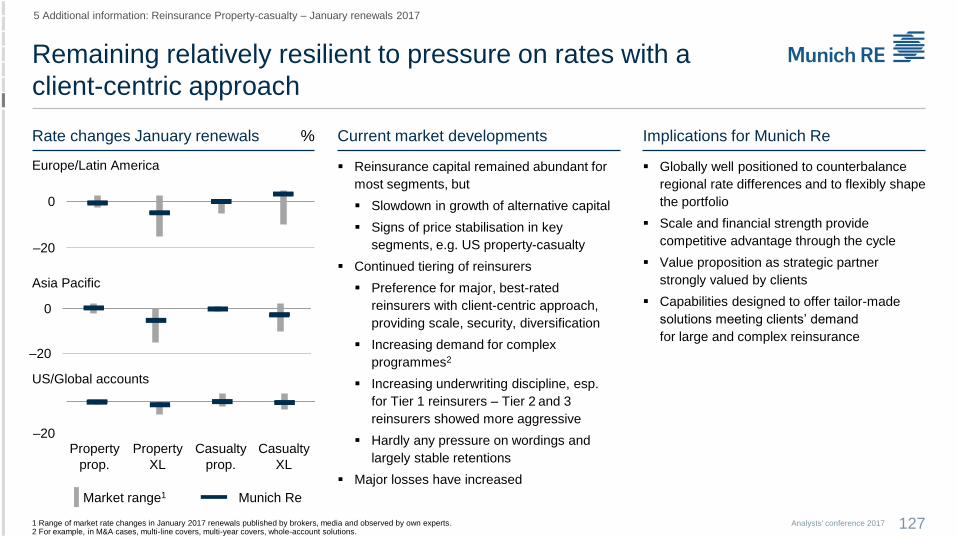
–20
0
Remaining relatively resilient to pressure on rates with a
client-centric approach
127Analysts' conference 2017
Rate changes January renewals % Current market developments Implications for Munich Re
5 Additional information: Reinsurance Property-casualty – January renewals 2017
Reinsurance capital remained abundant for
most segments, but
Slowdown in growth of alternative capital
Signs of price stabilisation in key
segments, e.g. US property-casualty
Continued tiering of reinsurers
Preference for major, best-rated
reinsurers with client-centric approach,
providing scale, security, diversification
Increasing demand for complex
programmes2
Increasing underwriting discipline, esp.
for Tier 1 reinsurers – Tier 2 and 3
reinsurers showed more aggressive
Hardly any pressure on wordings and
largely stable retentions
Major losses have increased
Globally well positioned to counterbalance
regional rate differences and to flexibly shape
the portfolio
Scale and financial strength provide
competitive advantage through the cycle
Value proposition as strategic partner
strongly valued by clients
Capabilities designed to offer tailor-made
solutions meeting clients’ demand
for large and complex reinsurance
Europe/Latin America
US/Global accounts
Property
prop.
Property
XL
Casualty
prop.
Casualty
XL
Market range1 Munich Re
–20
0
–20
1 Range of market rate changes in January 2017 renewals published by brokers, media and observed by own experts. 2 For example, in M&A cases, multi-line covers, multi-year covers, whole-account solutions.
Asia Pacific
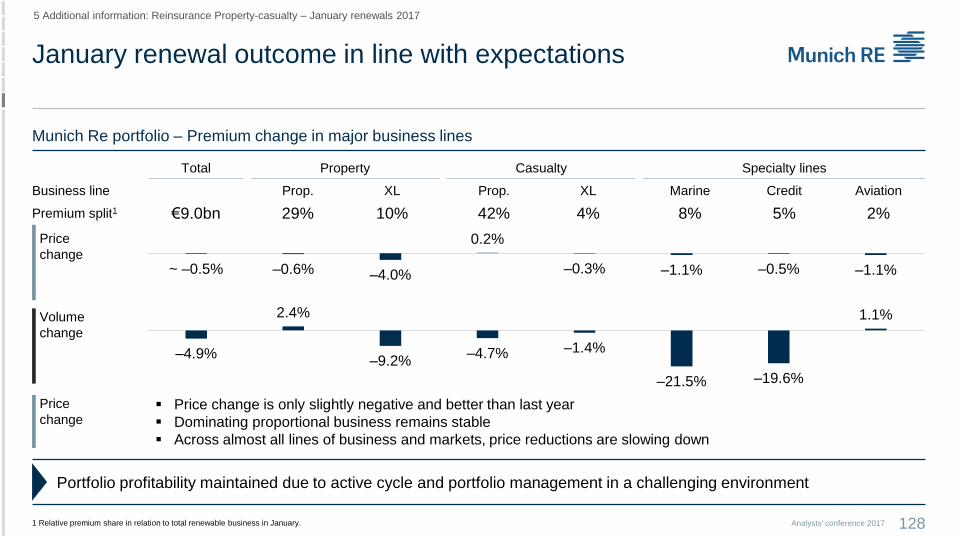
January renewal outcome in line with expectations
128Analysts' conference 2017
Munich Re portfolio – Premium change in major business lines
5 Additional information: Reinsurance Property-casualty – January renewals 2017
1 Relative premium share in relation to total renewable business in January.
Total Property Casualty Specialty lines
Business line Prop. XL Prop. XL Marine Credit Aviation
Premium split1 €9.0bn 29% 10% 42% 4% 8% 5% 2%
Price
change Price change is only slightly negative and better than last year
Dominating proportional business remains stable
Across almost all lines of business and markets, price reductions are slowing down
Price
change
Volume
change
Portfolio profitability maintained due to active cycle and portfolio management in a challenging environment
–4.9%
2.4%
–9.2%–4.7% –1.4%
–21.5% –19.6%
1.1%
~ –0.5% –0.6% –4.0%
0.2%
–0.3% –1.1% –0.5% –1.1%
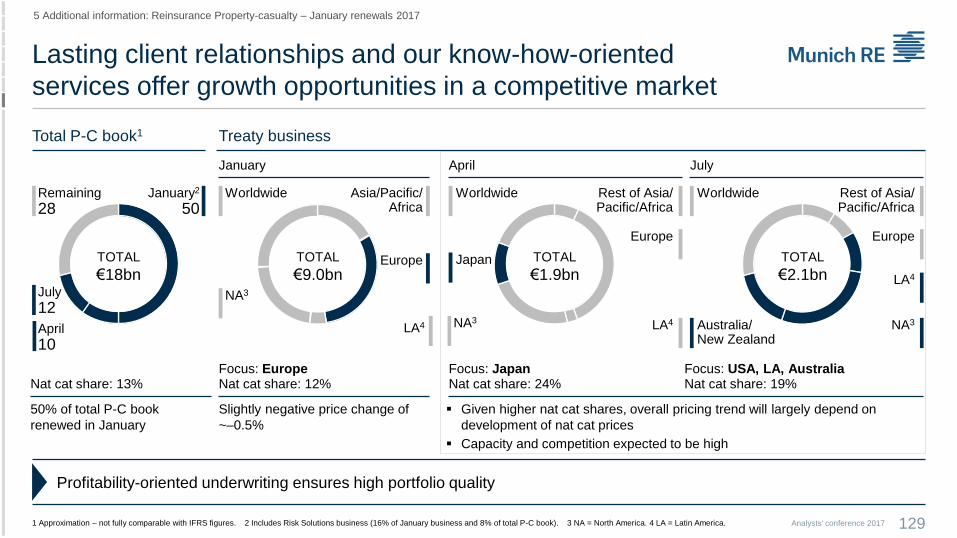
Lasting client relationships and our know-how-oriented
services offer growth opportunities in a competitive market
129Analysts' conference 2017
Total P-C book1
5 Additional information: Reinsurance Property-casualty – January renewals 2017
1 Approximation – not fully comparable with IFRS figures. 2 Includes Risk Solutions business (16% of January business and 8% of total P-C book). 3 NA = North America. 4 LA = Latin America.
Profitability-oriented underwriting ensures high portfolio quality
Treaty business
April July
Rest of Asia/ Pacific/Africa
Europe
Worldwide
NA3
LA4
Rest of Asia/Pacific/Africa
Europe
LA4NA3
Worldwide
Japan
Australia/New Zealand
January2
50Worldwide
LA4
Europe TOTAL
€2.1bn
NA3
Given higher nat cat shares, overall pricing trend will largely depend on
development of nat cat prices
Capacity and competition expected to be high
Focus: JapanNat cat share: 24%
Focus: USA, LA, AustraliaNat cat share: 19%
Focus: EuropeNat cat share: 12%
Slightly negative price change of
~–0.5%
TOTAL
€9.0bnTOTAL
€1.9bnTOTAL
€18bn
Remaining
28
April
10
July
12
Nat cat share: 13%
50% of total P-C book
renewed in January
Asia/Pacific/Africa
January
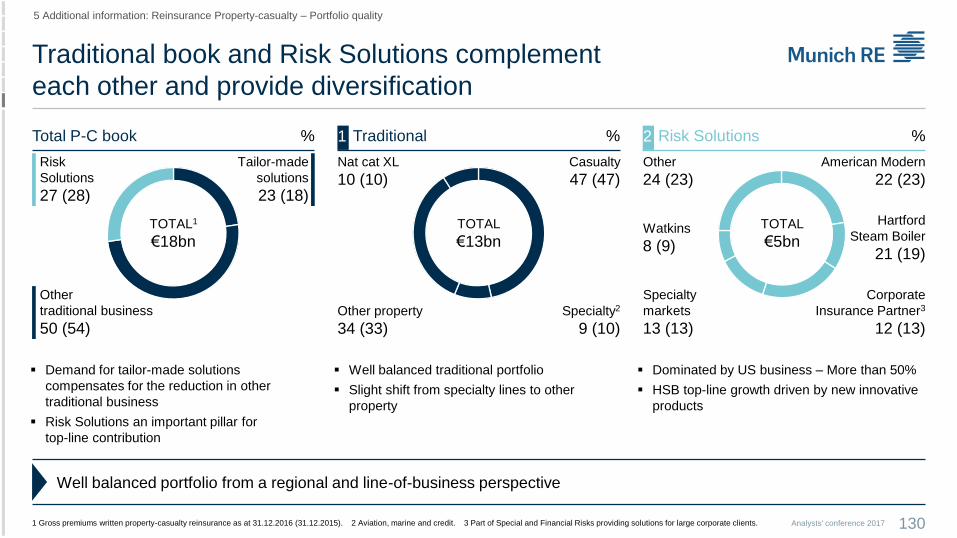
Traditional book and Risk Solutions complement
each other and provide diversification
130Analysts' conference 2017
Total P-C book % Traditional Risk Solutions
5 Additional information: Reinsurance Property-casualty – Portfolio quality
1 Gross premiums written property-casualty reinsurance as at 31.12.2016 (31.12.2015). 2 Aviation, marine and credit. 3 Part of Special and Financial Risks providing solutions for large corporate clients.
%
Tailor-made
solutions
23 (18)
Other
traditional business
50 (54)
Risk
Solutions
27 (28)
TOTAL1
€18bnTOTAL
€13bn
Casualty
47 (47)
Specialty2
9 (10)Other property
34 (33)
Nat cat XL
10 (10)
Watkins
8 (9)
Specialty
markets
13 (13)
American Modern
22 (23)
Corporate
Insurance Partner3
12 (13)
Hartford
Steam Boiler
21 (19)
Other
24 (23)
TOTAL
€5bn
Well balanced portfolio from a regional and line-of-business perspective
Well balanced traditional portfolio
Slight shift from specialty lines to other
property
Dominated by US business – More than 50%
HSB top-line growth driven by new innovative
products
Demand for tailor-made solutions
compensates for the reduction in other
traditional business
Risk Solutions an important pillar for
top-line contribution
1 2 %
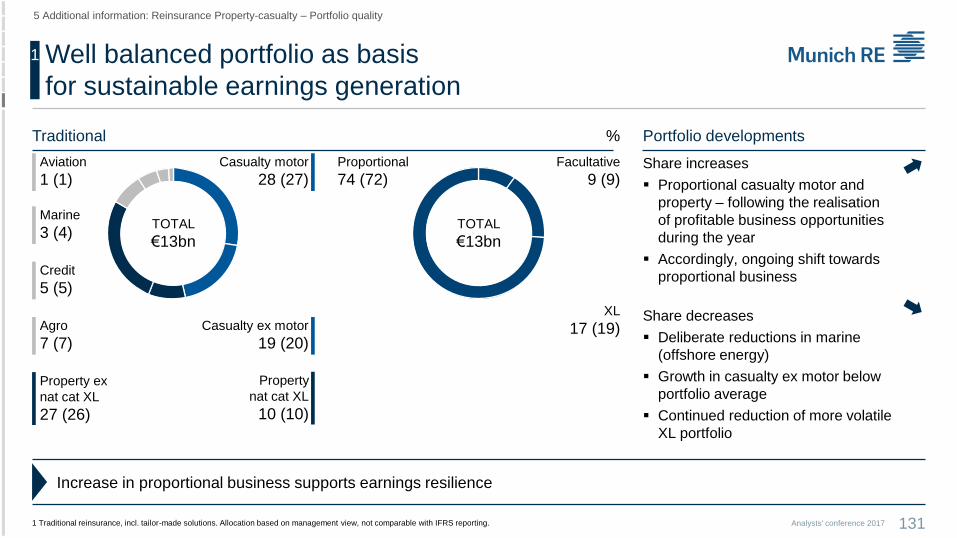
Well balanced portfolio as basis
for sustainable earnings generation
131Analysts' conference 2017
Traditional Portfolio developments
5 Additional information: Reinsurance Property-casualty – Portfolio quality
1 Traditional reinsurance, incl. tailor-made solutions. Allocation based on management view, not comparable with IFRS reporting.
%
Casualty motor
28 (27)Aviation
1 (1)
Property ex
nat cat XL
27 (26)
TOTAL
€13bn
Facultative
9 (9)
XL
17 (19)
Proportional
74 (72)
Increase in proportional business supports earnings resilience
Share increases
Proportional casualty motor and
property – following the realisation
of profitable business opportunities
during the year
Accordingly, ongoing shift towards
proportional business
Share decreases
Deliberate reductions in marine
(offshore energy)
Growth in casualty ex motor below
portfolio average
Continued reduction of more volatile
XL portfolio
TOTAL
€13bn
Marine
3 (4)
Credit
5 (5)
Agro
7 (7)Casualty ex motor
19 (20)
Property
nat cat XL
10 (10)
1
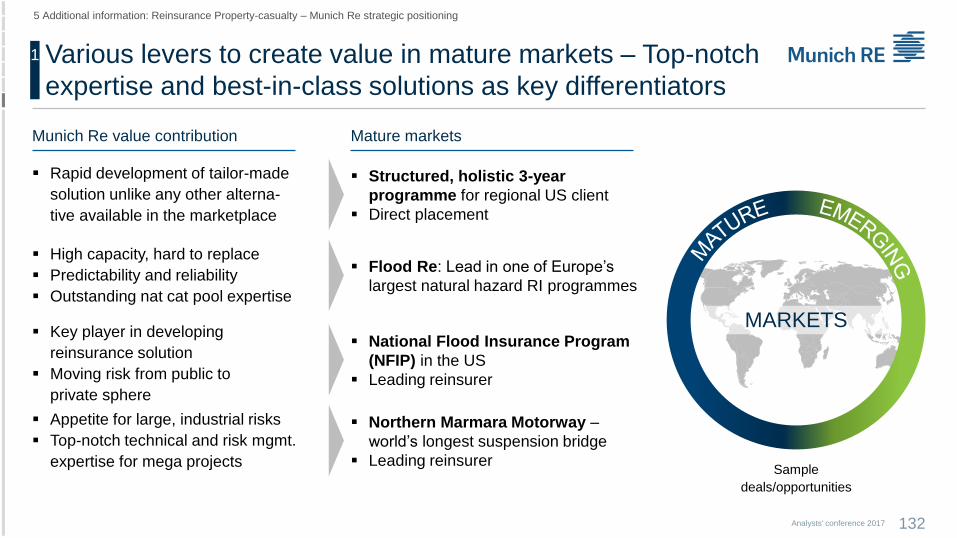
Various levers to create value in mature markets – Top-notch
expertise and best-in-class solutions as key differentiators
132Analysts' conference 2017
5 Additional information: Reinsurance Property-casualty – Munich Re strategic positioning
1
Appetite for large, industrial risks
Top-notch technical and risk mgmt.
expertise for mega projects
Northern Marmara Motorway –
world’s longest suspension bridge
Leading reinsurer
Mature marketsMunich Re value contribution
Structured, holistic 3-year
programme for regional US client
Direct placement
Rapid development of tailor-made
solution unlike any other alterna-
tive available in the marketplace
National Flood Insurance Program
(NFIP) in the US
Leading reinsurer
Key player in developing
reinsurance solution
Moving risk from public to
private sphere
Flood Re: Lead in one of Europe’s
largest natural hazard RI programmes
High capacity, hard to replace
Predictability and reliability
Outstanding nat cat pool expertise
MARKETS
Sample
deals/opportunities
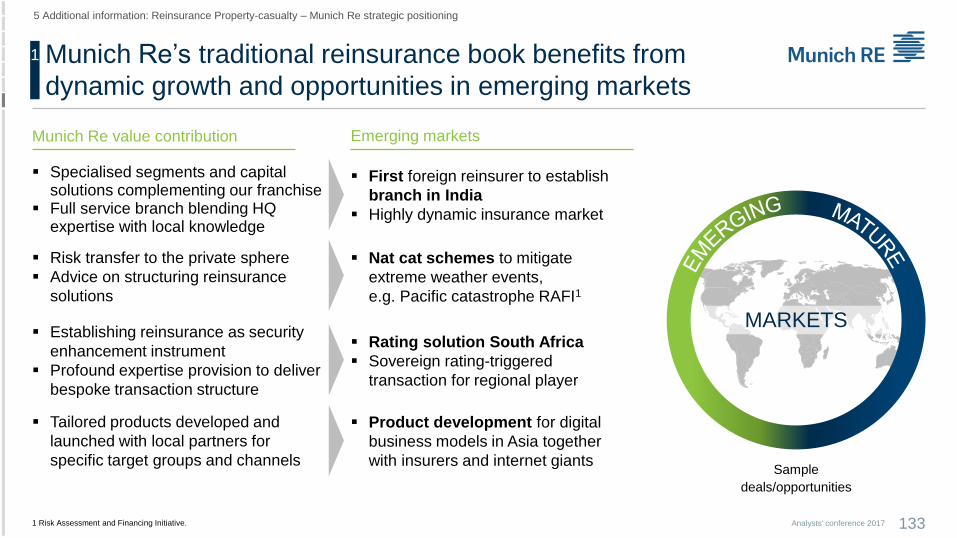
Munich Re’s traditional reinsurance book benefits from
dynamic growth and opportunities in emerging markets
133Analysts' conference 2017
5 Additional information: Reinsurance Property-casualty – Munich Re strategic positioning
1
Tailored products developed and
launched with local partners for
specific target groups and channels
Product development for digital
business models in Asia together
with insurers and internet giants
Emerging marketsMunich Re value contribution
First foreign reinsurer to establish
branch in India
Highly dynamic insurance market
Specialised segments and capital solutions complementing our franchise
Full service branch blending HQ expertise with local knowledge
Rating solution South Africa
Sovereign rating-triggered
transaction for regional player
Establishing reinsurance as security
enhancement instrument
Profound expertise provision to deliver
bespoke transaction structure
Nat cat schemes to mitigate
extreme weather events,
e.g. Pacific catastrophe RAFI1
Risk transfer to the private sphere
Advice on structuring reinsurance
solutions
MARKETS
Sample
deals/opportunities
1 Risk Assessment and Financing Initiative.

94.1
87.9
83.8
88.6
90.3
95.4
2011 2012 2013 2014 2015 2016
3.43.8 4.0 4.2
5.0 4.8
22 23 24 2528 27
2011 2012 2013 2014 2015 2016
Share in % of totalP-C book
0.2
0.5
0.70.5 0.5
0.2
26
42
32
25 23
2011 2012 2013 2014 2015 2016
Share in% of totalP-C book
Risk Solutions: Sustainable earnings contribution
134Analysts' conference 2017
Gross earned premiums1 €bn Combined ratio1 Underwriting result1
5 Additional information: Reinsurance Property-casualty – Risk Solutions
1 Management view, not comparable with IFRS reporting.
%
Active portfolio management to keep level of profitability – Medium term ambition confirmed
Top-line driven by FX and exit from Financial Institutions Division (FID) business at American Modern
Bottom line negatively influenced by run-off business, IT investments and outlier losses
Hartford Steam Boiler with highest result contribution
€bn
2
Drivers in 2016
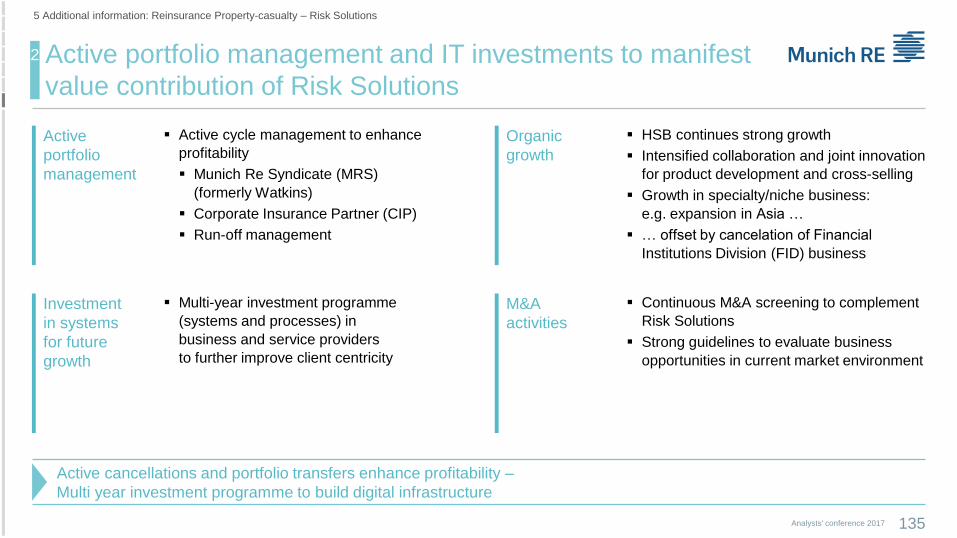
Active portfolio management and IT investments to manifest
value contribution of Risk Solutions
135Analysts' conference 2017
2
5 Additional information: Reinsurance Property-casualty – Risk Solutions
Active
portfolio
management
Investment
in systems
for future
growth
Organic
growth
M&A
activities
Active cycle management to enhance
profitability
Munich Re Syndicate (MRS)
(formerly Watkins)
Corporate Insurance Partner (CIP)
Run-off management
HSB continues strong growth
Intensified collaboration and joint innovation
for product development and cross-selling
Growth in specialty/niche business:
e.g. expansion in Asia …
… offset by cancelation of Financial
Institutions Division (FID) business
Multi-year investment programme
(systems and processes) in
business and service providers
to further improve client centricity
Continuous M&A screening to complement
Risk Solutions
Strong guidelines to evaluate business
opportunities in current market environment
Active cancellations and portfolio transfers enhance profitability –
Multi year investment programme to build digital infrastructure
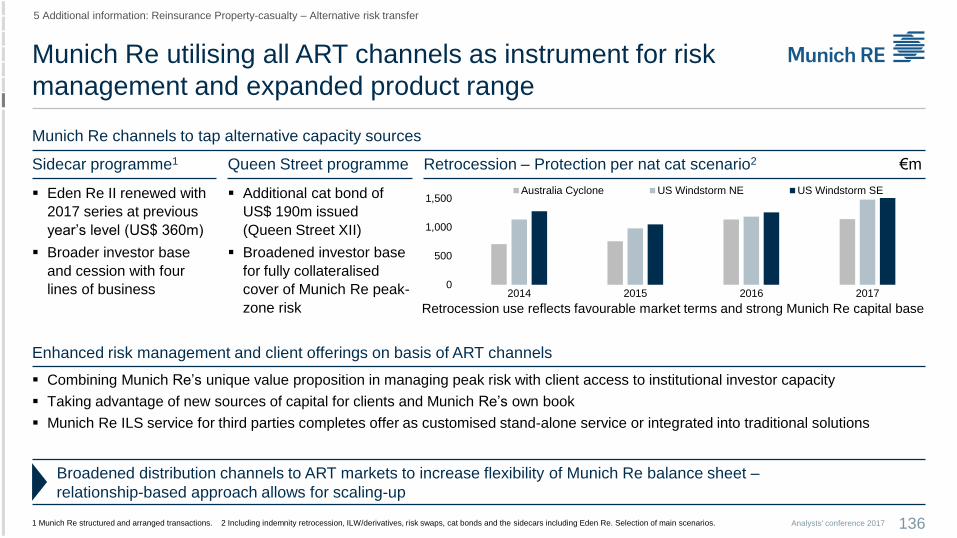
Munich Re utilising all ART channels as instrument for risk
management and expanded product range
136Analysts' conference 2017
Munich Re channels to tap alternative capacity sources
5 Additional information: Reinsurance Property-casualty – Alternative risk transfer
1 Munich Re structured and arranged transactions. 2 Including indemnity retrocession, ILW/derivatives, risk swaps, cat bonds and the sidecars including Eden Re. Selection of main scenarios.
Broadened distribution channels to ART markets to increase flexibility of Munich Re balance sheet –
relationship-based approach allows for scaling-up
Additional cat bond of
US$ 190m issued
(Queen Street XII)
Broadened investor base
for fully collateralised
cover of Munich Re peak-
zone risk
Eden Re II renewed with
2017 series at previous
year’s level (US$ 360m)
Broader investor base
and cession with four
lines of business
Queen Street programmeSidecar programme1 Retrocession – Protection per nat cat scenario2 €m
Retrocession use reflects favourable market terms and strong Munich Re capital base
0
500
1,000
1,500
2014 2015 2016 2017
Australia Cyclone US Windstorm NE US Windstorm SE
Combining Munich Re’s unique value proposition in managing peak risk with client access to institutional investor capacity
Taking advantage of new sources of capital for clients and Munich Re’s own book
Munich Re ILS service for third parties completes offer as customised stand-alone service or integrated into traditional solutions
Enhanced risk management and client offerings on basis of ART channels
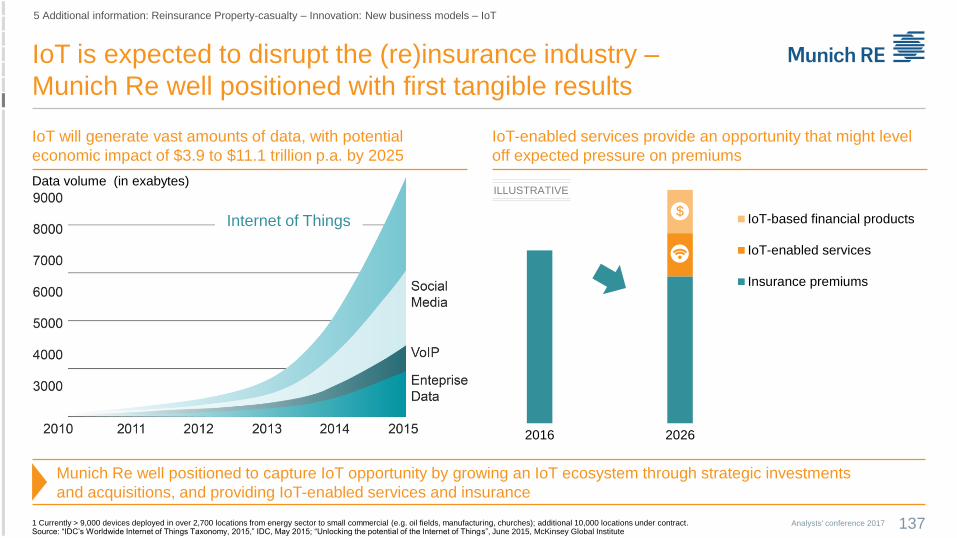
2016 2026
IoT-based financial products
IoT-enabled services
Insurance premiums
IoT is expected to disrupt the (re)insurance industry –
Munich Re well positioned with first tangible results
137Analysts' conference 2017
IoT will generate vast amounts of data, with potential
economic impact of $3.9 to $11.1 trillion p.a. by 2025
IoT-enabled services provide an opportunity that might level
off expected pressure on premiums
Data volume (in exabytes)
Internet of Things
1 Currently > 9,000 devices deployed in over 2,700 locations from energy sector to small commercial (e.g. oil fields, manufacturing, churches); additional 10,000 locations under contract.Source: “IDC’s Worldwide Internet of Things Taxonomy, 2015,” IDC, May 2015; “Unlocking the potential of the Internet of Things”, June 2015, McKinsey Global Institute
5 Additional information: Reinsurance Property-casualty – Innovation: New business models – IoT
$
ILLUSTRATIVE
Munich Re well positioned to capture IoT opportunity by growing an IoT ecosystem through strategic investments
and acquisitions, and providing IoT-enabled services and insurance
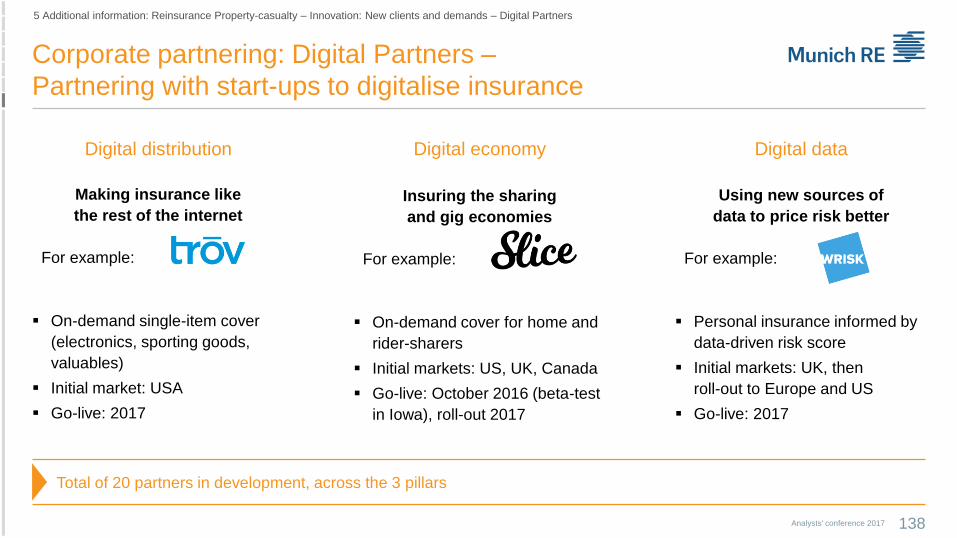
Making insurance like
the rest of the internet
For example:
On-demand single-item cover
(electronics, sporting goods,
valuables)
Initial market: USA
Go-live: 2017
Insuring the sharing
and gig economies
For example:
On-demand cover for home and
rider-sharers
Initial markets: US, UK, Canada
Go-live: October 2016 (beta-test
in Iowa), roll-out 2017
Using new sources of
data to price risk better
For example:
Personal insurance informed by
data-driven risk score
Initial markets: UK, then
roll-out to Europe and US
Go-live: 2017
Corporate partnering: Digital Partners –
Partnering with start-ups to digitalise insurance
138Analysts' conference 2017
Digital distribution Digital economy Digital data
5 Additional information: Reinsurance Property-casualty – Innovation: New clients and demands – Digital Partners
Total of 20 partners in development, across the 3 pillars
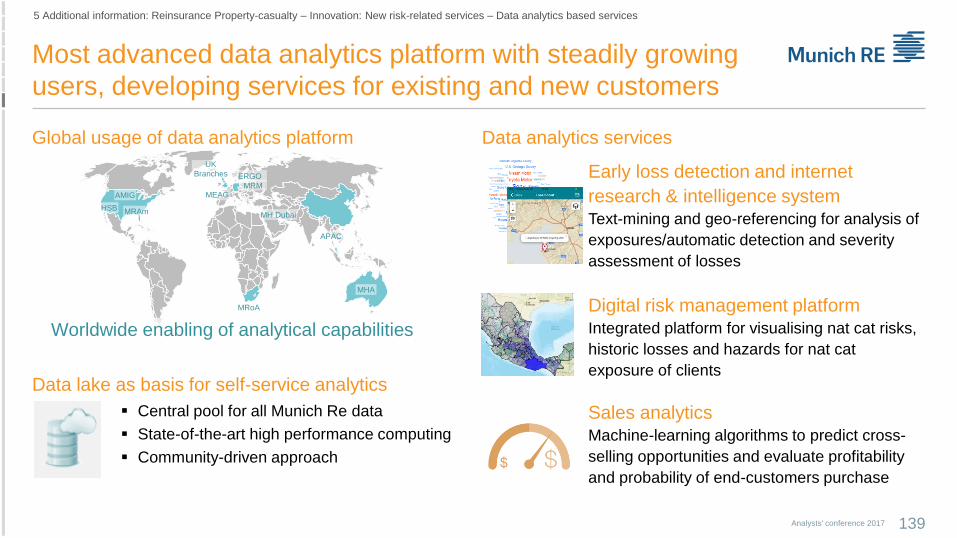
Most advanced data analytics platform with steadily growing
users, developing services for existing and new customers
139
Global usage of data analytics platform Data analytics services
Early loss detection and internet
research & intelligence system Text-mining and geo-referencing for analysis of
exposures/automatic detection and severity
assessment of losses
Digital risk management platform Integrated platform for visualising nat cat risks,
historic losses and hazards for nat cat
exposure of clients
Analysts' conference 2017
5 Additional information: Reinsurance Property-casualty – Innovation: New risk-related services – Data analytics based services
Data lake as basis for self-service analytics
Central pool for all Munich Re data
State-of-the-art high performance computing
Community-driven approach
Sales analytics Machine-learning algorithms to predict cross-
selling opportunities and evaluate profitability
and probability of end-customers purchase
Worldwide enabling of analytical capabilities
MRAm
AMIG
HSB
UK
Branches ERGO
MRMMEAG
MH Dubai
MRoA
MHA
APAC
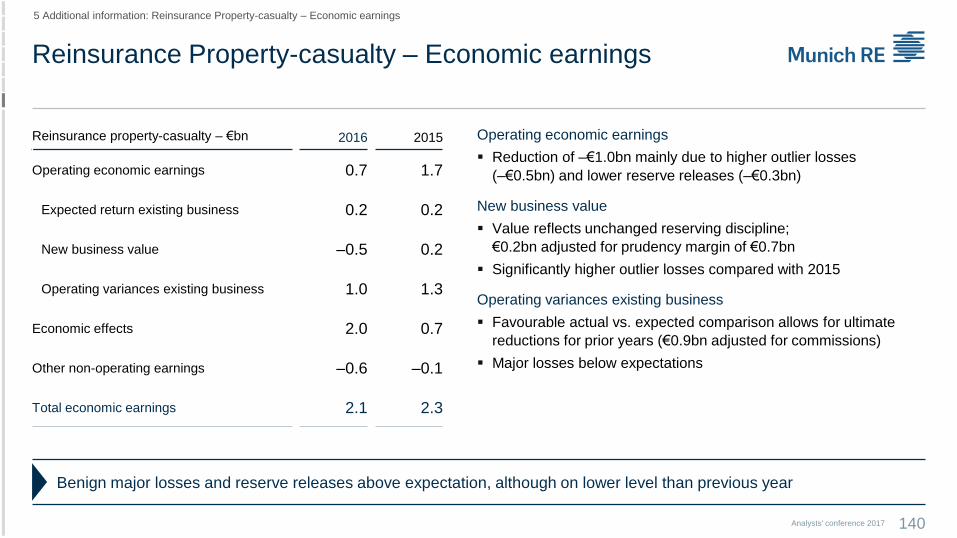
Reinsurance Property-casualty – Economic earnings
5 Additional information: Reinsurance Property-casualty – Economic earnings
Analysts' conference 2017 140
Operating economic earnings
Reduction of –€1.0bn mainly due to higher outlier losses
(–€0.5bn) and lower reserve releases (–€0.3bn)
New business value
Value reflects unchanged reserving discipline;
€0.2bn adjusted for prudency margin of €0.7bn
Significantly higher outlier losses compared with 2015
Operating variances existing business
Favourable actual vs. expected comparison allows for ultimate
reductions for prior years (€0.9bn adjusted for commissions)
Major losses below expectations
Reinsurance property-casualty – €bn 2016 2015
Operating economic earnings 0.7 1.7
Expected return existing business 0.2 0.2
New business value –0.5 0.2
Operating variances existing business 1.0 1.3
Economic effects 2.0 0.7
Other non-operating earnings –0.6 –0.1
Total economic earnings 2.1 2.3
Benign major losses and reserve releases above expectation, although on lower level than previous year
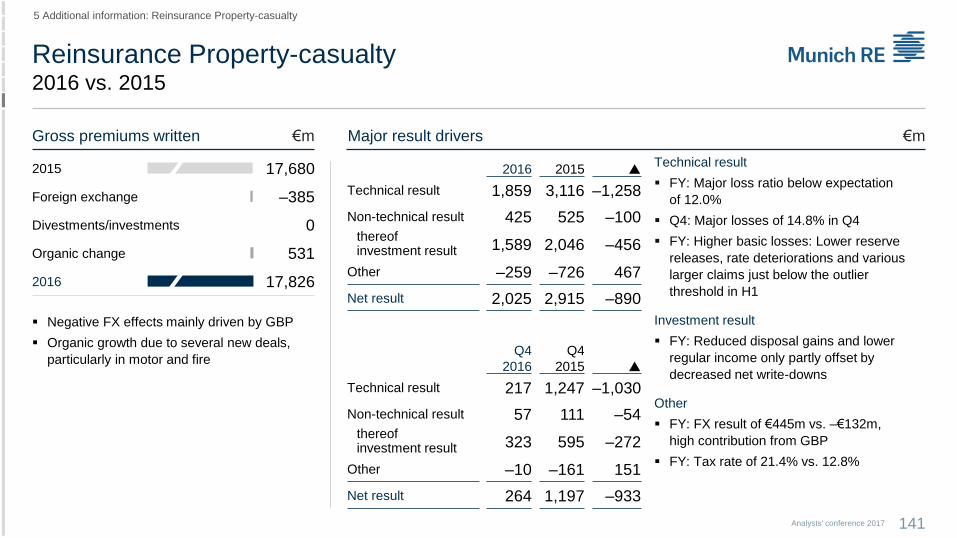
Reinsurance Property-casualty2016 vs. 2015
141Analysts' conference 2017
5 Additional information: Reinsurance Property-casualty
Gross premiums written €m Major result drivers €m
2015 17,680
Foreign exchange –385
Divestments/investments 0
Organic change 531
2016 17,826
2016 2015
Technical result 1,859 3,116 –1,258
Non-technical result 425 525 –100thereof investment result 1,589 2,046 –456
Other –259 –726 467
Net result 2,025 2,915 –890
Q4
2016
Q4
2015
Technical result 217 1,247 –1,030
Non-technical result 57 111 –54thereof investment result 323 595 –272
Other –10 –161 151
Net result 264 1,197 –933
Negative FX effects mainly driven by GBP
Organic growth due to several new deals,
particularly in motor and fire
Technical result
FY: Major loss ratio below expectation
of 12.0%
Q4: Major losses of 14.8% in Q4
FY: Higher basic losses: Lower reserve
releases, rate deteriorations and various
larger claims just below the outlier
threshold in H1
Investment result
FY: Reduced disposal gains and lower
regular income only partly offset by
decreased net write-downs
Other
FY: FX result of €445m vs. –€132m,
high contribution from GBP
FY: Tax rate of 21.4% vs. 12.8%

Combined ratio
5 Additional information: Reinsurance Property-casualty
Analysts' conference 2017 142
%Combined ratio
2014 92.7
2015 89.7
2016 95.7
Q4 2016 101.9
Expense ratio Basic losses Major losses
53.0
50.8
54.2
51.1
7.2
6.2
9.1
14.8
32.5
32.6
32.4
35.9
Major losses Nat cat Man-made
Reservereleases1
Normalised combined ratio2
2016 9.1 5.5 3.6 –5.5 100.0
Q4 2016 14.8 10.9 3.9 –5.7 100.4
Ø Annual
expectation~12.0 ~8.0 ~4.0 ~–4.02
92.3 93.394.5
78.6
88.4
99.8
92.5
101.9
Q12015
Q22015
Q32015
Q42015
Q12016
Q22016
Q32016
Q42016
1 Basic losses prior years, incl. asbestos, environmental, workers’ compensation discount amortisation and retrocession effects adjusted for corresponding commission effects (sliding scale offset and other commission effects), reserve release not taking commission effects into account amounts to –6.2% for 2016 and –8.7% for Q4 2016. 2 Based on 4%-pts. reserve releases.
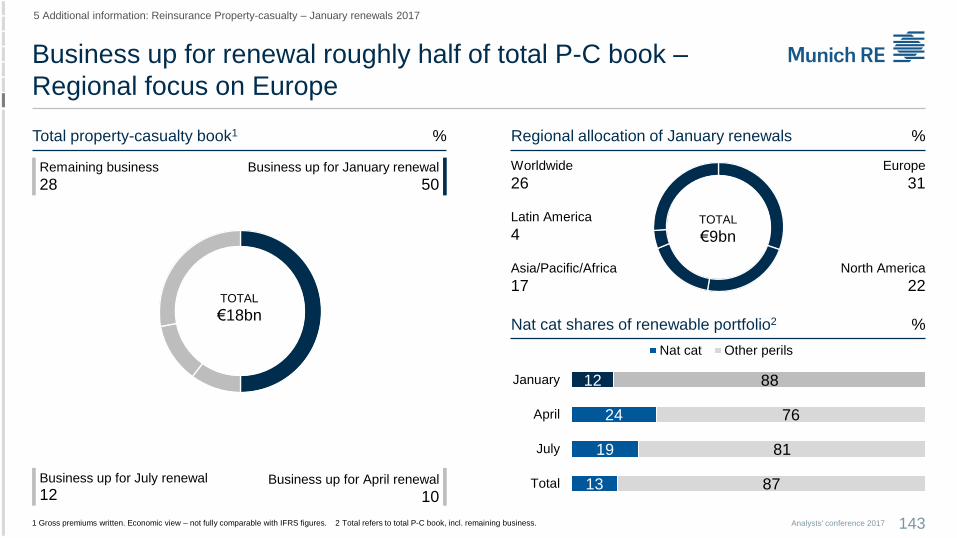
%
1 Gross premiums written. Economic view – not fully comparable with IFRS figures. 2 Total refers to total P-C book, incl. remaining business.
Business up for renewal roughly half of total P-C book –
Regional focus on Europe
Total property-casualty book1
5 Additional information: Reinsurance Property-casualty – January renewals 2017
143
%
Remaining business
28
Business up for July renewal
12
Business up for January renewal
50
Business up for April renewal
10
Regional allocation of January renewals
TOTAL
€9bn
%Nat cat shares of renewable portfolio2
TOTAL
€18bn
12
24
19
13
88
76
81
87
January
April
July
Total
Nat cat Other perils
Worldwide
26
Asia/Pacific/Africa
17North America
22
Europe
31
Latin America
4
Analysts' conference 2017
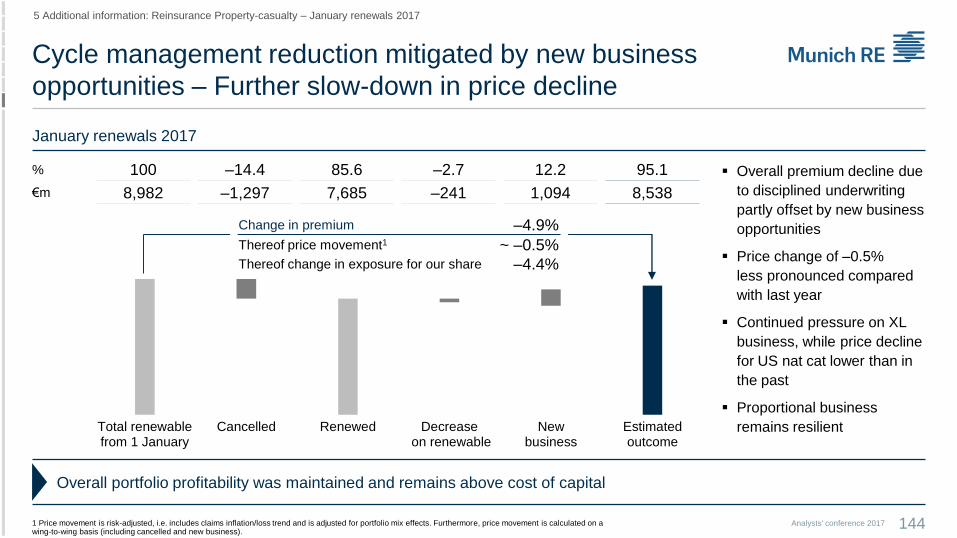
Cycle management reduction mitigated by new business
opportunities – Further slow-down in price decline
144
5 Additional information: Reinsurance Property-casualty – January renewals 2017
January renewals 2017
% 100 –14.4 85.6 –2.7 12.2 95.1
€m 8,982 –1,297 7,685 –241 1,094 8,538
Change in premium –4.9%
Thereof price movement1 ~ –0.5%Thereof change in exposure for our share –4.4%
Overall portfolio profitability was maintained and remains above cost of capital
Total renewablefrom 1 January
Cancelled Renewed Decrease on renewable
Newbusiness
Estimatedoutcome
Overall premium decline due
to disciplined underwriting
partly offset by new business
opportunities
Price change of –0.5%
less pronounced compared
with last year
Continued pressure on XL
business, while price decline
for US nat cat lower than in
the past
Proportional business
remains resilient
1 Price movement is risk-adjusted, i.e. includes claims inflation/loss trend and is adjusted for portfolio mix effects. Furthermore, price movement is calculated on a wing-to-wing basis (including cancelled and new business).
Analysts' conference 2017
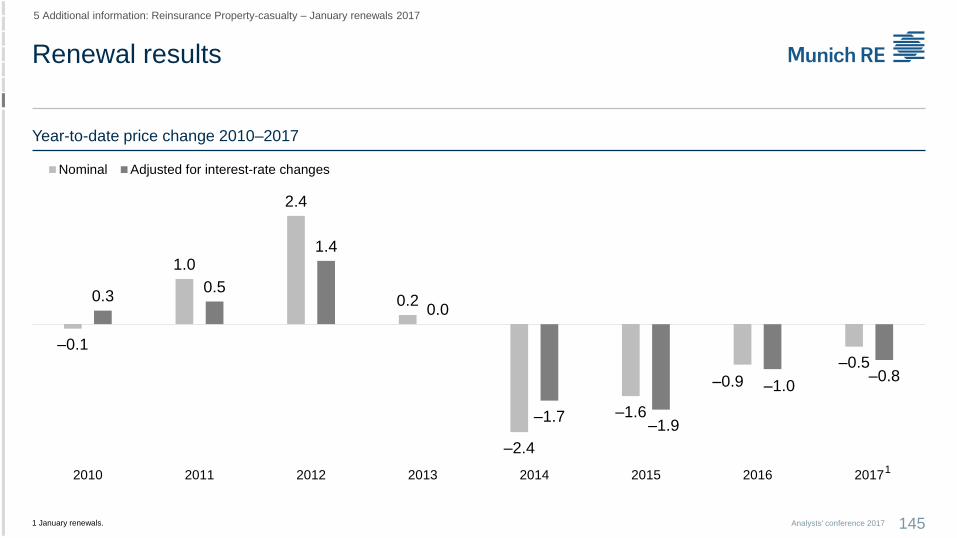
Renewal results
145Analysts' conference 2017
Year-to-date price change 2010–2017
1 January renewals.
5 Additional information: Reinsurance Property-casualty – January renewals 2017
–0.1
1.0
2.4
0.2
–2.4
–1.6
–0.9
–0.5
0.30.5
1.4
0.0
–1.7–1.9
–1.0–0.8
2010 2011 2012 2013 2014 2015 2016 2017
Nominal Adjusted for interest-rate changes
1
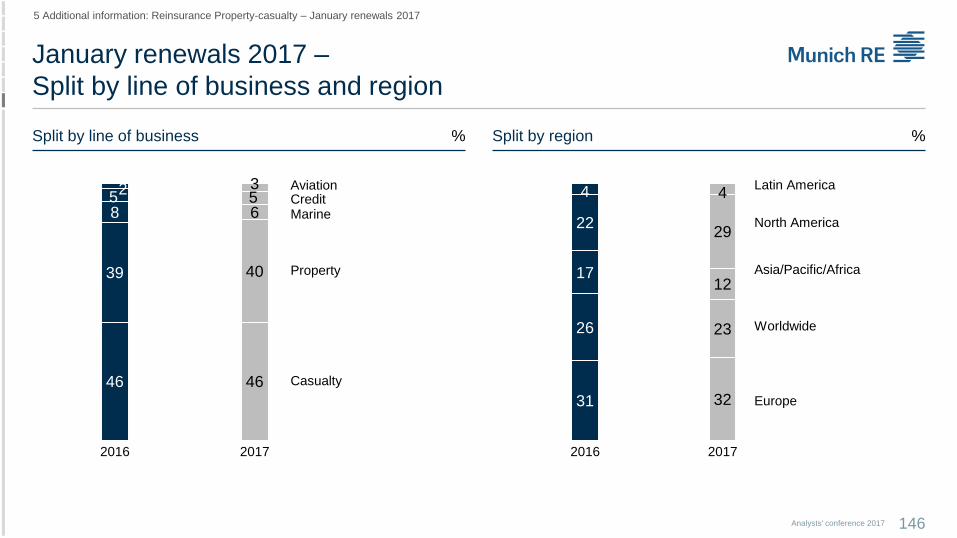
%
January renewals 2017 –
Split by line of business and region
Split by line of business
5 Additional information: Reinsurance Property-casualty – January renewals 2017
Analysts' conference 2017 146
% Split by region
46 46
39 40
8 65 5
2 3
2016 2017
31 32
26 23
1712
2229
4 4
2016 2017
AviationCreditMarine
Casualty
Property
Worldwide
Latin America
Asia/Pacific/Africa
North America
Europe

Reinsurance Life – Economic earnings
6 Additional information: Reinsurance Life – Economic earnings
Analysts' conference 2017 147
New business value
Exceeding expectations, even stronger than last year
Ongoing very strong contribution from North America and Asia
Financially-motivated reinsurance: Again a successful year with around 25
new transactions, including 8 innovative SII solutions
Large portfolio transactions in Australia and Canada
Traditional reinsurance: Resilient overall to mounting pressure on volumes
and margins
Operating variances
Large claims lead to negative experience variances
One-off data updates and recapture of one profitable treaty have negative
impact on economic earnings
Variety of largely balancing model and assumption changes
Reinsurance Life – €bn 2016 2015
Operating economic earnings 1.1 1.5
Expected return existing business 0.1 0.2
New business value 1.2 0.9
Operating variances existing business –0.2 0.4
Economic effects 0.8 0.3
Other non-operating earnings –0.3 0.1
Total economic earnings 1.7 1.8
Outstanding new business value generation – Aggregate in-force development within normal range of volatility
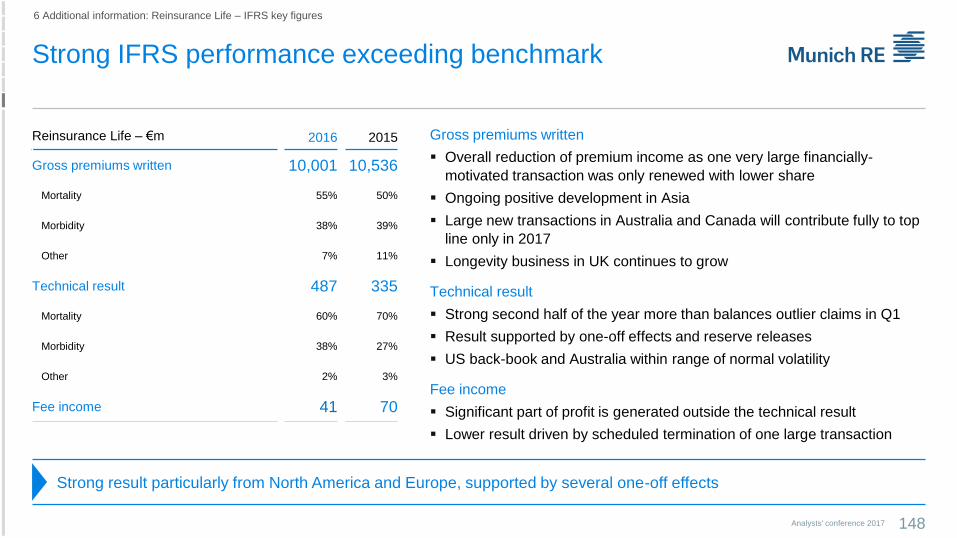
Strong IFRS performance exceeding benchmark
6 Additional information: Reinsurance Life – IFRS key figures
Analysts' conference 2017 148
Reinsurance Life – €m 2016 2015
Gross premiums written 10,001 10,536
Mortality 55% 50%
Morbidity 38% 39%
Other 7% 11%
Technical result 487 335
Mortality 60% 70%
Morbidity 38% 27%
Other 2% 3%
Fee income 41 70
Strong result particularly from North America and Europe, supported by several one-off effects
Gross premiums written
Overall reduction of premium income as one very large financially-
motivated transaction was only renewed with lower share
Ongoing positive development in Asia
Large new transactions in Australia and Canada will contribute fully to top
line only in 2017
Longevity business in UK continues to grow
Technical result
Strong second half of the year more than balances outlier claims in Q1
Result supported by one-off effects and reserve releases
US back-book and Australia within range of normal volatility
Fee income
Significant part of profit is generated outside the technical result
Lower result driven by scheduled termination of one large transaction
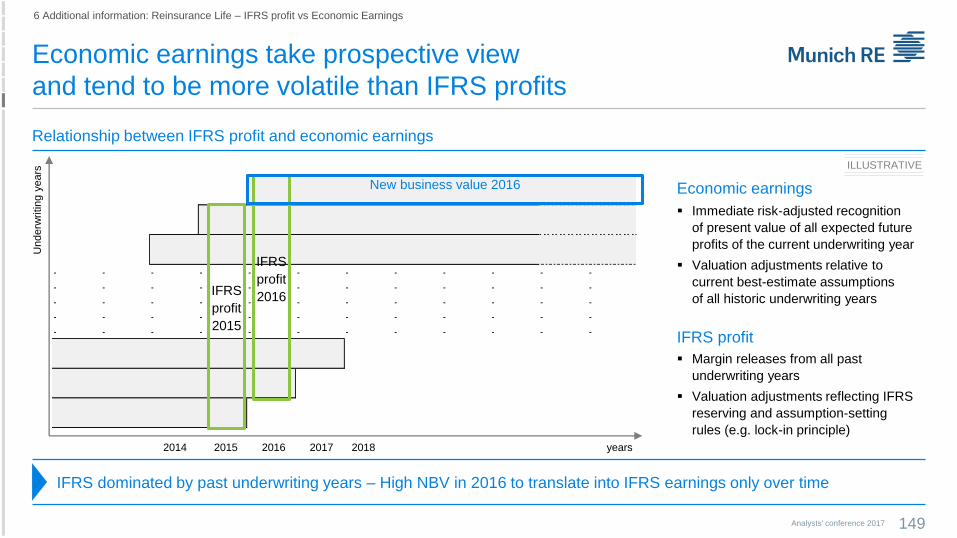
Economic earnings take prospective view
and tend to be more volatile than IFRS profits
149Analysts' conference 2017
6 Additional information: Reinsurance Life – IFRS profit vs Economic Earnings
Underw
ritin
gyears
ILLUSTRATIVE
years
Relationship between IFRS profit and economic earnings
IFRS dominated by past underwriting years – High NBV in 2016 to translate into IFRS earnings only over time
2014 2015 2016 2017 2018
- - - - - - - - - - - -
- - - - - - - - - - - -
- - - - - - - - - - - -
- - - - - - - - - - - -
- - - - - - - - - - - -
IFRS
profit
2016IFRS
profit
2015
New business value 2016
Immediate risk-adjusted recognition
of present value of all expected future
profits of the current underwriting year
Valuation adjustments relative to
current best-estimate assumptions
of all historic underwriting years
Economic earnings
IFRS profit
Margin releases from all past
underwriting years
Valuation adjustments reflecting IFRS
reserving and assumption-setting
rules (e.g. lock-in principle)

FinMoRe
Longevity
Morbidity
Mortality
IFRS profit an image of the unwinding of NBVs
150Analysts' conference 2017
6 Additional information: Reinsurance Life – IFRS profit vs Economic Earnings
NB
V
years
Translation of NBV into IFRS earnings
Diversified portfolio supports strong IFRS profit – Long duration overall
10 20 30
IFRS profit reflects the structure of the
portfolio as built in all preceding
underwriting years
IFRS profit sluggish towards changes in
the level of NBV
IFRS profit grows if
annual contribution from current
underwriting year exceeds the loss
of earnings from business that has
ceased, and
valuation adjustments are non-
negative
IFRS profit vs NBVILLUSTRATIVE
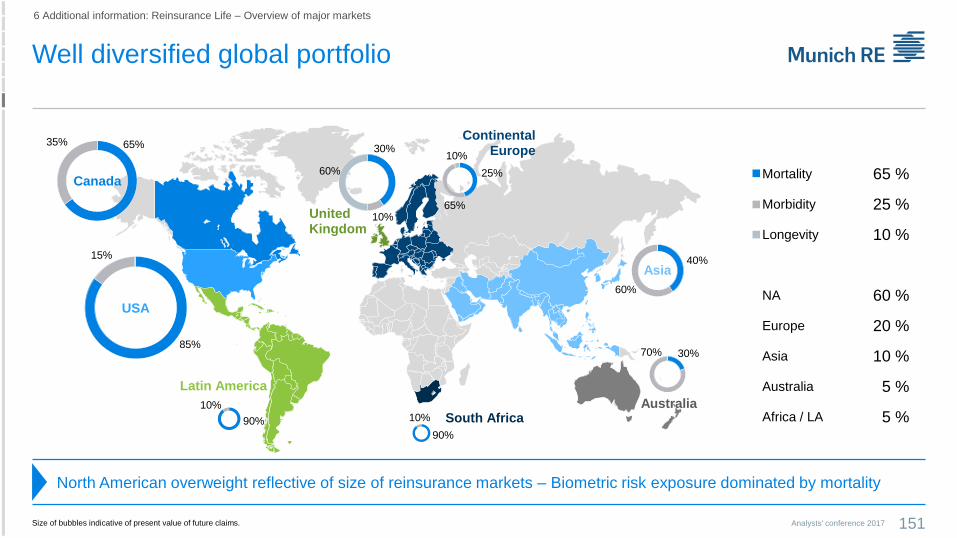
Well diversified global portfolio
151Analysts' conference 2017
6 Additional information: Reinsurance Life – Overview of major markets
North American overweight reflective of size of reinsurance markets – Biometric risk exposure dominated by mortality
90%
10%
Latin America
30%70%
Australia
90%
10% South Africa
40%
60%
Asia
30%
10%
60%
United Kingdom
65%35%
Canada
85%
15%
USA
25%
65%
10%
Continental Europe
Size of bubbles indicative of present value of future claims.
Mortality 65 %
Morbidity 25 %
Longevity 10 %
NA 60 %
Europe 20 %
Asia 10 %
Australia 5 %
Africa / LA 5 %
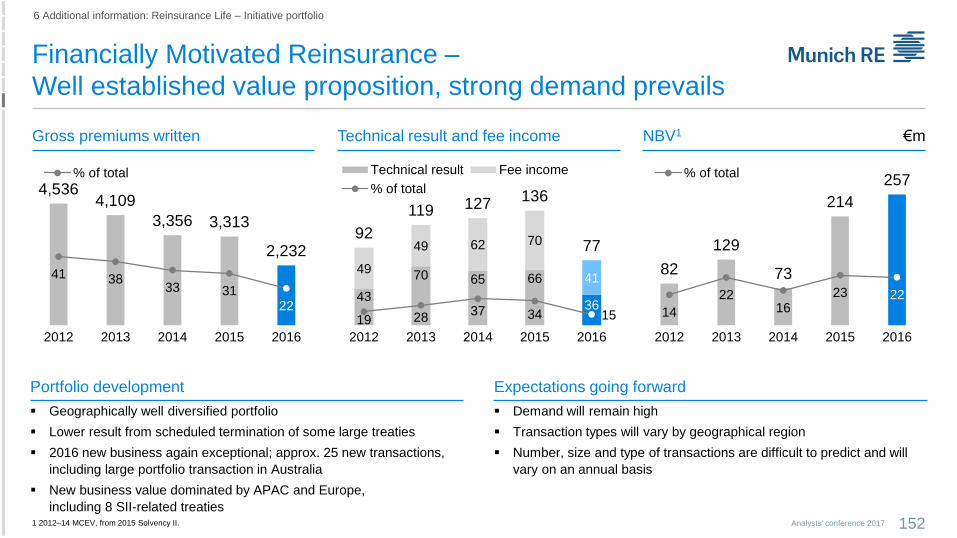
Financially Motivated Reinsurance –
Well established value proposition, strong demand prevails
152Analysts' conference 2017
6 Additional information: Reinsurance Life – Initiative portfolio
€mGross premiums written Technical result and fee income NBV1
Demand will remain high
Transaction types will vary by geographical region
Number, size and type of transactions are difficult to predict and will
vary on an annual basis
Expectations going forward
Geographically well diversified portfolio
Lower result from scheduled termination of some large treaties
2016 new business again exceptional; approx. 25 new transactions,
including large portfolio transaction in Australia
New business value dominated by APAC and Europe,
including 8 SII-related treaties
Portfolio development
1 2012–14 MCEV, from 2015 Solvency II.
4,5364,109
3,356 3,313
2,232
41 3833 31
22
2012 2013 2014 2015 2016
% of total
43
70 65 66
36
49
49 62 70
41
92
119 127136
77
19 2837 34 15
2012 2013 2014 2015 2016
Technical result Fee income
% of total
82
129
73
214
257
14
2216
23 22
2012 2013 2014 2015 2016
% of total
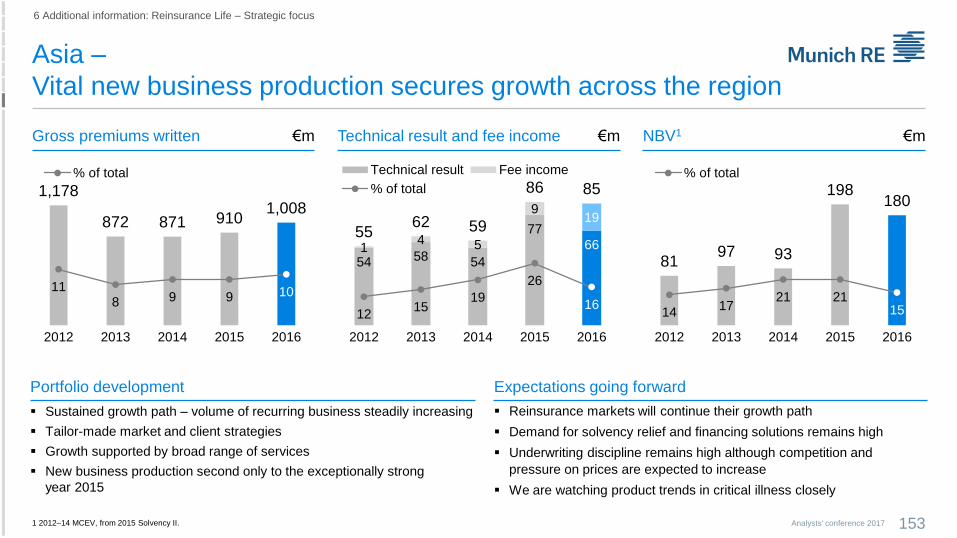
Asia –
Vital new business production secures growth across the region
153Analysts' conference 2017
€mGross premiums written Technical result and fee income NBV1
Reinsurance markets will continue their growth path
Demand for solvency relief and financing solutions remains high
Underwriting discipline remains high although competition and
pressure on prices are expected to increase
We are watching product trends in critical illness closely
Expectations going forward
Sustained growth path – volume of recurring business steadily increasing
Tailor-made market and client strategies
Growth supported by broad range of services
New business production second only to the exceptionally strong
year 2015
Portfolio development
1 2012–14 MCEV, from 2015 Solvency II.
6 Additional information: Reinsurance Life – Strategic focus
1,178
872 871 9101,008
118 9 9 10
2012 2013 2014 2015 2016
% of total
54 58 54
77
6614 5
919
5562 59
86 85
1215
19
26
16
2012 2013 2014 2015 2016
Technical result Fee income
% of total
8197 93
198180
1417
21 2115
2012 2013 2014 2015 2016
% of total
€m€m
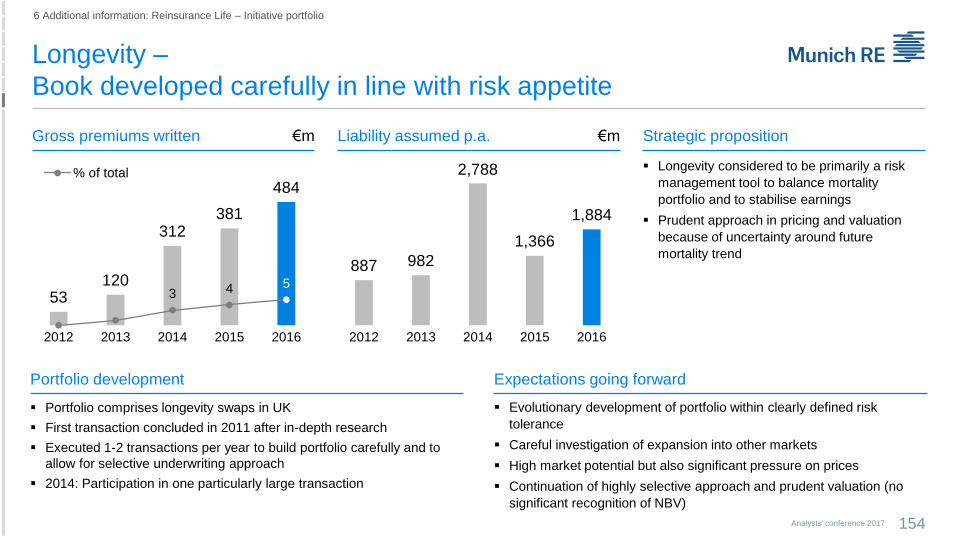
Longevity –
Book developed carefully in line with risk appetite
154Analysts' conference 2017
Gross premiums written Liability assumed p.a. Strategic proposition
Evolutionary development of portfolio within clearly defined risk
tolerance
Careful investigation of expansion into other markets
High market potential but also significant pressure on prices
Continuation of highly selective approach and prudent valuation (no
significant recognition of NBV)
Expectations going forward
Portfolio comprises longevity swaps in UK
First transaction concluded in 2011 after in-depth research
Executed 1-2 transactions per year to build portfolio carefully and to
allow for selective underwriting approach
2014: Participation in one particularly large transaction
Portfolio development
Longevity considered to be primarily a risk
management tool to balance mortality
portfolio and to stabilise earnings
Prudent approach in pricing and valuation
because of uncertainty around future
mortality trend
6 Additional information: Reinsurance Life – Initiative portfolio
€m€m
53120
312381
484
3 4 5
2012 2013 2014 2015 2016
% of total
887 982
2,788
1,366
1,884
2012 2013 2014 2015 2016
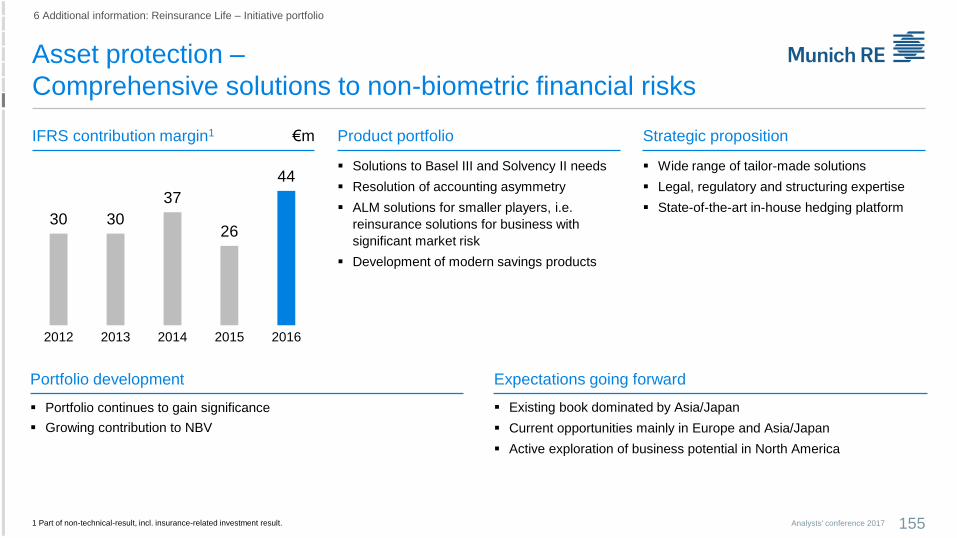
Asset protection –
Comprehensive solutions to non-biometric financial risks
155Analysts' conference 2017
€mIFRS contribution margin1 Product portfolio Strategic proposition
Existing book dominated by Asia/Japan
Current opportunities mainly in Europe and Asia/Japan
Active exploration of business potential in North America
Expectations going forward
Portfolio continues to gain significance
Growing contribution to NBV
Portfolio development
Wide range of tailor-made solutions
Legal, regulatory and structuring expertise
State-of-the-art in-house hedging platform
Solutions to Basel III and Solvency II needs
Resolution of accounting asymmetry
ALM solutions for smaller players, i.e.
reinsurance solutions for business with
significant market risk
Development of modern savings products
1 Part of non-technical-result, incl. insurance-related investment result.
6 Additional information: Reinsurance Life – Initiative portfolio
30 30
37
26
44
2012 2013 2014 2015 2016
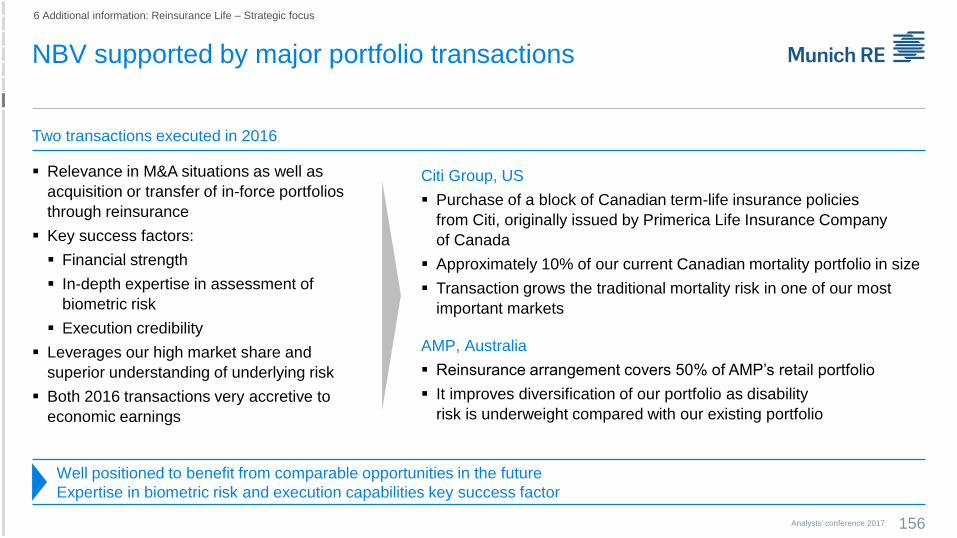
NBV supported by major portfolio transactions
156Analysts' conference 2017
6 Additional information: Reinsurance Life – Strategic focus
Two transactions executed in 2016
Citi Group, US
Purchase of a block of Canadian term-life insurance policies
from Citi, originally issued by Primerica Life Insurance Company
of Canada
Approximately 10% of our current Canadian mortality portfolio in size
Transaction grows the traditional mortality risk in one of our most
important markets
AMP, Australia
Reinsurance arrangement covers 50% of AMP’s retail portfolio
It improves diversification of our portfolio as disability
risk is underweight compared with our existing portfolio
Well positioned to benefit from comparable opportunities in the future
Expertise in biometric risk and execution capabilities key success factor
Relevance in M&A situations as well as
acquisition or transfer of in-force portfolios
through reinsurance
Key success factors:
Financial strength
In-depth expertise in assessment of
biometric risk
Execution credibility
Leverages our high market share and
superior understanding of underlying risk
Both 2016 transactions very accretive to
economic earnings
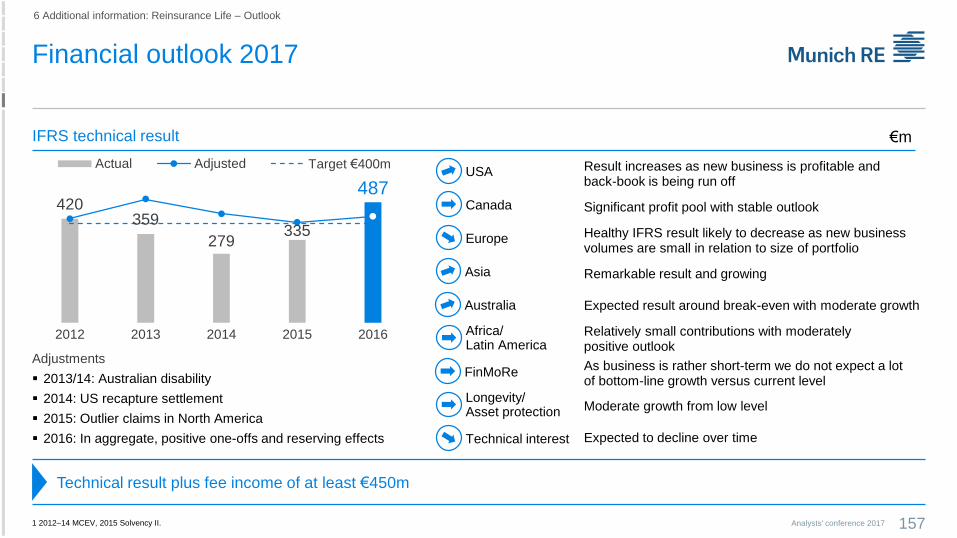
Financial outlook 2017
6 Additional information: Reinsurance Life – Outlook
Analysts' conference 2017 157
IFRS technical result €m
Technical result plus fee income of at least €450m
1 2012–14 MCEV, 2015 Solvency II.
420359
279335
487
2012 2013 2014 2015 2016
Actual Adjusted Target €400m
Adjustments
2013/14: Australian disability
2014: US recapture settlement
2015: Outlier claims in North America
2016: In aggregate, positive one-offs and reserving effects
Result increases as new business is profitable and back-book is being run off
Significant profit pool with stable outlook
Healthy IFRS result likely to decrease as new business volumes are small in relation to size of portfolio
Remarkable result and growing
Expected result around break-even with moderate growth
Relatively small contributions with moderately positive outlook
As business is rather short-term we do not expect a lot of bottom-line growth versus current level
Moderate growth from low level
Expected to decline over time
USA
Asia
FinMoRe
Canada
Australia
Longevity/Asset protection
Europe
Africa/ Latin America
Technical interest
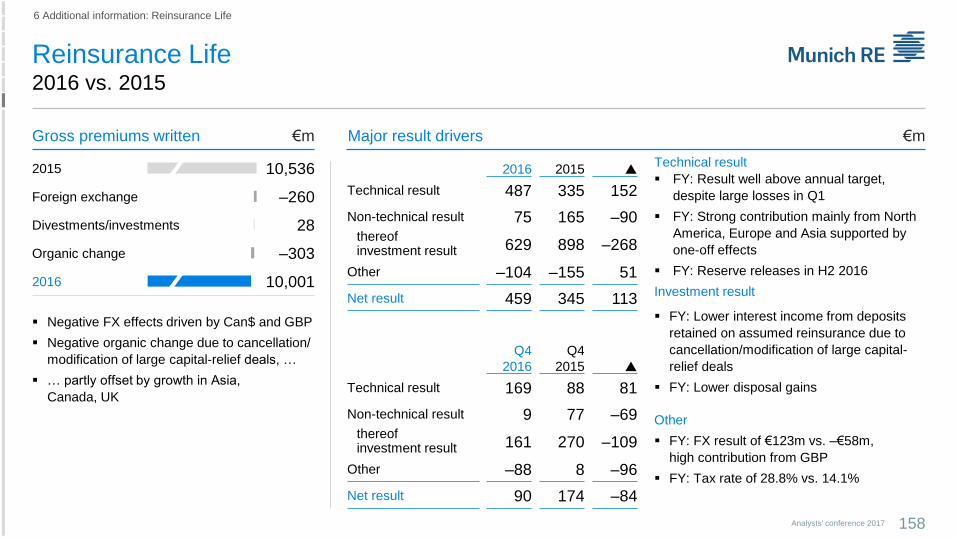
Reinsurance Life 2016 vs. 2015
158Analysts' conference 2017
6 Additional information: Reinsurance Life
Gross premiums written Major result drivers €m
2015 10,536
Foreign exchange –260
Divestments/investments 28
Organic change –303
2016 10,001
2016 2015
Technical result 487 335 152
Non-technical result 75 165 –90thereof investment result 629 898 –268
Other –104 –155 51
Net result 459 345 113
Q4
2016
Q4
2015
Technical result 169 88 81
Non-technical result 9 77 –69thereof investment result 161 270 –109
Other –88 8 –96
Net result 90 174 –84
Negative FX effects driven by Can$ and GBP
Negative organic change due to cancellation/
modification of large capital-relief deals, …
… partly offset by growth in Asia,
Canada, UK
Technical result
FY: Result well above annual target,
despite large losses in Q1
FY: Strong contribution mainly from North
America, Europe and Asia supported by
one-off effects
FY: Reserve releases in H2 2016
Investment result
FY: Lower interest income from deposits
retained on assumed reinsurance due to
cancellation/modification of large capital-
relief deals
FY: Lower disposal gains
Other
FY: FX result of €123m vs. –€58m,
high contribution from GBP
FY: Tax rate of 28.8% vs. 14.1%
€m
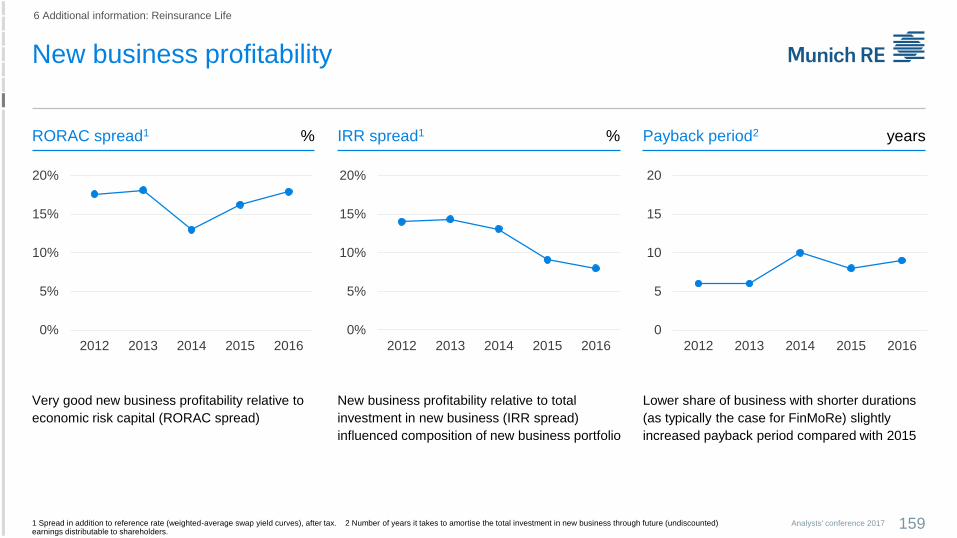
New business profitability
159Analysts' conference 2017
6 Additional information: Reinsurance Life
yearsRORAC spread1 IRR spread1 Payback period2
1 Spread in addition to reference rate (weighted-average swap yield curves), after tax. 2 Number of years it takes to amortise the total investment in new business through future (undiscounted) earnings distributable to shareholders.
%%
0
5
10
15
20
2012 2013 2014 2015 2016
0%
5%
10%
15%
20%
2012 2013 2014 2015 2016
0%
5%
10%
15%
20%
2012 2013 2014 2015 2016
Lower share of business with shorter durations
(as typically the case for FinMoRe) slightly
increased payback period compared with 2015
Very good new business profitability relative to
economic risk capital (RORAC spread)
New business profitability relative to total
investment in new business (IRR spread)
influenced composition of new business portfolio
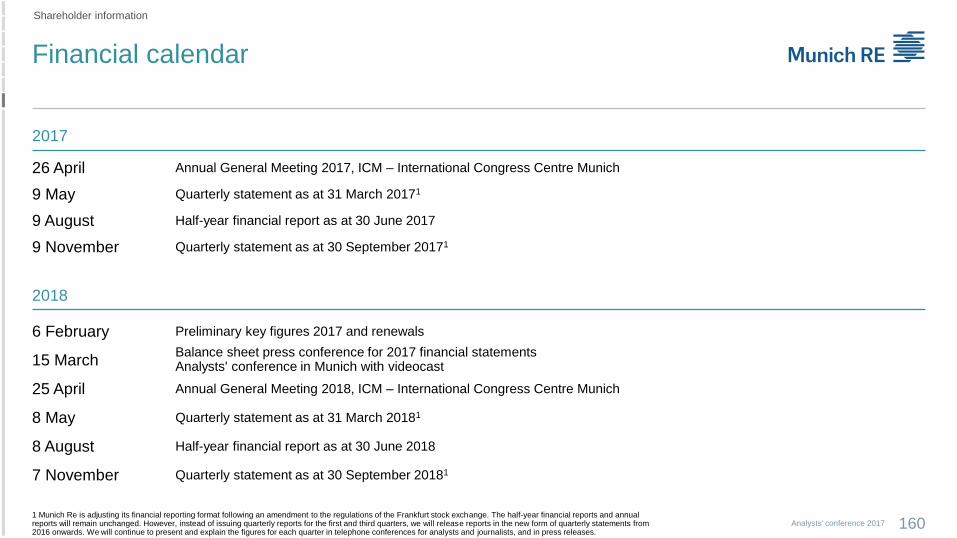
Financial calendar
160Analysts' conference 2017
Shareholder information
2017
1 Munich Re is adjusting its financial reporting format following an amendment to the regulations of the Frankfurt stock exchange. The half-year financial reports and annual reports will remain unchanged. However, instead of issuing quarterly reports for the first and third quarters, we will release reports in the new form of quarterly statements from 2016 onwards. We will continue to present and explain the figures for each quarter in telephone conferences for analysts and journalists, and in press releases.
26 April Annual General Meeting 2017, ICM – International Congress Centre Munich
9 May Quarterly statement as at 31 March 20171
9 August Half-year financial report as at 30 June 2017
9 November Quarterly statement as at 30 September 20171
2018
6 February Preliminary key figures 2017 and renewals
15 MarchBalance sheet press conference for 2017 financial statementsAnalysts' conference in Munich with videocast
25 April Annual General Meeting 2018, ICM – International Congress Centre Munich
8 May Quarterly statement as at 31 March 20181
8 August Half-year financial report as at 30 June 2018
7 November Quarterly statement as at 30 September 20181
For information, please contact
161Analysts' conference 2017
Shareholder information
Investor Relations Team
Christian Becker-Hussong
Head of Investor & Rating Agency Relations
Tel.: +49 (89) 3891-3910
E-mail: [email protected]
Britta Hamberger
Tel.: +49 (89) 3891-3504
E-mail: [email protected]
Angelika Rings
Tel.: +49 (211) 4937-7483
E-mail: [email protected]
Thorsten Dzuba
Tel.: +49 (89) 3891-8030
E-mail: [email protected]
Ralf Kleinschroth
Tel.: +49 (89) 3891-4559
E-mail: [email protected]
Andreas Hoffmann
Tel.: +49 (211) 4937-1573
E-mail: [email protected]
Christine Franziszi
Tel.: +49 (89) 3891-3875
E-mail: [email protected]
Andreas Silberhorn
Tel.: +49 (89) 3891-3366
E-mail: [email protected]
Sebastian Hein
Tel.: +49 (211) 4937-5171
E-mail: [email protected]
Ingrid Grunwald
Tel.: +49 (89) 3891-3517
E-mail: [email protected]
Münchener Rückversicherungs-Gesellschaft | Investor & Rating Agency Relations | Königinstraße 107 | 80802 München, Germany
Fax: +49 (89) 3891-9888 | E-mail: [email protected] | Internet: www.munichre.com
Disclaimer
162Analysts' conference 2017
This presentation contains forward-looking statements that are based on current assumptions and forecasts of the
management of Munich Re. Known and unknown risks, uncertainties and other factors could lead to material differences
between the forward-looking statements given here and the actual development, in particular the results, financial situation and
performance of our Company. The Company assumes no liability to update these forward-looking statements or to make them
conform to future events or developments.