GREENHOUSE GAS INVENTORY AND CORPORATE CLIMATE STRATEGY ...
148
GREENHOUSE GAS INVENTORY AND CORPORATE CLIMATE STRATEGY FOR OCEAN SPRAY CRANBERRIES, INC. Report No. CSS21-08 April 30, 2021 Shannon Blair, Renhui (Lola) Chen, Stephanie Hefelfinger, Heeseung Kim, Catherine Mullin, Erin Seguin
Transcript of GREENHOUSE GAS INVENTORY AND CORPORATE CLIMATE STRATEGY ...

GREENHOUSE GAS INVENTORY AND CORPORATE CLIMATE STRATEGY FOR OCEAN SPRAY CRANBERRIES, INC.
Report No. CSS21-08April 30, 2021
Shannon Blair, Renhui (Lola) Chen, Stephanie Hefelfinger, Heeseung Kim, Catherine Mullin, Erin Seguin

Greenhouse Gas Inventory and Corporate Climate Strategy for
Ocean Spray Cranberries, Inc.
By: Shannon Blair, Renhui (Lola) Chen, Stephanie Hefelfinger, Heeseung Kim,
Catherine Mullin, Erin Seguin
A project submitted
in partial fulfillment of the requirements
for the degree of
Master of Science
(Environment and Sustainability)
in the University of Michigan
May 2021
Faculty Advisor:
Dr. Gregory A. Keoleian, School for Environment and Sustainability, University of Michigan

Acknowledgements
We wish to thank the many people who aided us in the completion of this project: our faculty advisor Dr. Gregory Keoleian, for providing counsel, expertise and championing our team;
Ocean Spray Cranberries, Inc., Jennifer Bowe (Associate Manager, Global Impact & Sustainability), Emily O’Halloran (Assistant Manager, Sustainable Agriculture and ESG), Jeff Hanoff (Senior Manager, Engineering), Corporate Finance department and the Manufacturing
and Receiving facilities’ staff for their time, knowledge and encouragement for our work, especially during the COVID-19 pandemic; and our families and friends for their support in our
pursuit of the MS degree

I
TABLE OF CONTENTS
LIST OF TABLES .............................................................................................................. IV LIST OF FIGURES ............................................................................................................. IV LIST OF APPENDICES ....................................................................................................... IV LIST OF ABBREVIATIONS, ACRONYMS, SYMBOLS ........................................................... VI EXECUTIVE SUMMARY .................................................................................................. VII
1. INTRODUCTION AND BACKGROUND................................................................. 1
1.1 PROJECT OBJECTIVE AND SCOPE................................................................................. 1 1.2 OCEAN SPRAY HISTORY AND BACKGROUND .............................................................. 2 1.3 CLIMATE CHANGE AND RISK TO CRANBERRY PRODUCTION ....................................... 2
1.3.1 The IPCC and NCA ............................................................................................. 2 1.3.2 Climate Impacts on Agriculture .......................................................................... 3
1.3.2.1 Climate Impacts on the Northeast............................................................... 3 1.3.2.1 Climate Impacts on the Midwest ................................................................. 3 1.3.2.1 Climate Impacts on the Northwest .............................................................. 4 1.3.2.1 Climate Impacts on the Chile ...................................................................... 4
1.3.3 Cranberries and Climate Change ....................................................................... 4 1.3.3.1 Introduction to Cranberries ........................................................................ 4 1.3.3.2 Temperature Increases and Variability ...................................................... 4 1.3.3.3 Pests ............................................................................................................ 5 1.3.3.4 Changes in Precipitation ............................................................................ 5
1.3.4 Landscape of Climate Mitigation ........................................................................ 6 1.3.4.1 Corporate Carbon Neutrality and Related Definitions .............................. 6 1.3.4.2 Companies and Climate Action .................................................................. 7 1.3.4.3 Popular Mitigation Strategies..................................................................... 8 1.3.4.4 Climate Justice and Climate Mitigation Strategies .................................... 9
2. METHODOLOGY ....................................................................................................... 9
2.1 ACCUVIO GREENHOUSE GAS SOFTWARE ..................................................................... 9 2.2 EMISSIONS SCOPES AND BOUNDARY DELINEATION .................................................. 11 2.3 OCEAN SPRAY RECEIVING FACILITIES AND MANUFACTURING FACILITIES ............... 12
2.3.1 Receiving Facilities ........................................................................................... 12 2.3.2 Manufacturing Facilities ................................................................................... 13
2.3.2.1 Manufacturing Facilities Interviews Summary and Trends ...................... 14 2.4 FARMS AND THE FARM STEWARDSHIP ASSESSMENT ................................................ 15
2.4.1 Farm Survey Analysis Methodology ................................................................. 15

II
3. GREENHOUSE GAS INVENTORY ........................................................................ 17
3.1 GHG INVENTORY FINDINGS ..................................................................................... 17 3.2 RECEIVING FACILITIES FINDINGS .............................................................................. 19 3.3 MANUFACTURING FACILITIES FINDINGS ................................................................... 21 3.4 FARM FINDINGS ........................................................................................................ 22 3.5 FARM DATA ACCURACY CONCERNS ......................................................................... 24 3.6 CORPORATE OFFICES FINDINGS ................................................................................ 24
4. GREENHOUSE GAS TARGET-SETTING TOOLS ............................................. 25
4.1 SCIENCE BASED TARGETS INITIATIVE....................................................................... 26 4.2 CORPORATE COMPETITIVE ANALYSIS ...................................................................... 27
5. MITIGATION PLAN ................................................................................................. 29
5.1 CASE STUDY 1: PPAS AND RECS AT FACILITY J ...................................................... 31 5.1.1 The Electricity Grid ........................................................................................... 31 5.1.2 Deregulated Versus Regulated Energy Markets ............................................... 31
5.1.2.1 History of Energy Markets ........................................................................ 31 5.1.2.2 Regulated Energy Markets ........................................................................ 31 5.1.2.3 Deregulated Energy Markets .................................................................... 32
5.1.3 Power Purchase Agreement .............................................................................. 32 5.1.3.1 Physical Power Purchase Agreement ....................................................... 32 5.1.3.2 Solar Power Purchase Agreements .......................................................... 32 5.1.3.3 Virtual Power Purchase Agreements ........................................................ 22 5.1.3.4 Renewable Energy Certificates ................................................................. 33
5.1.4 Facility J Background ....................................................................................... 34 5.1.4.1 Utility A ..................................................................................................... 34 5.1.4.2 Utility B ..................................................................................................... 36
5.2 CASE STUDY 2: ENERGY STORAGE AND PPAS AT FACILITY D ................................. 37 5.2.1 Onsite Battery Energy Storage System.............................................................. 38 5.2.2 Power Purchase Agreement .............................................................................. 39
6. BUSINESS CASE FOR SUSTAINABILITY ........................................................... 40
6.1 RISKS ASSOCIATED WITH UNSUSTAINABLE PRACTICES ............................................ 41 6.1.1 Regulatory Risks ................................................................................................ 41 6.1.2 Economic Risks. ................................................................................................ 43 6.1.3 Reputational Risks ............................................................................................. 43
6.2 FINANCING STRATEGIES ........................................................................................... 44 6.2.1 Internal Carbon Pricing .................................................................................... 44 6.2.2 Green Bonds ...................................................................................................... 45

III
6.3 CASE STUDY 3: APPLYING FINANCIAL INCENTIVES TO COMBINED HEAT AND POWER
PROJECT AT FACILITY A ................................................................................................ 46
7. COMMUNCIATIONS PLAN.................................................................................... 47
7.1 INTERNAL COMMUNICATIONS STRATEGY ................................................................. 49 7.2 EXTERNAL COMMUNICATIONS STRATEGY ................................................................ 49
8. CONCLUSION ........................................................................................................... 49
8.1 KEY FINDINGS .......................................................................................................... 49 8.2 RECOMMENDATIONS ................................................................................................. 50
8.2.1 Data Processing and Collection Improvements ................................................ 50 8.2.2 Additional Data Collection ............................................................................... 51
8.2.2.1 Possible Composting Practices at Facility E............................................ 51 8.3 FUTURE WORK: SCOPE 3 EMISSIONS ........................................................................ 51
8.3.1 Farm Data Collection ....................................................................................... 52 8.4 CORPORATE CULTURAL SHIFT .................................................................................. 53 8.5 SCIENCE BASED TARGETS INITIATIVE....................................................................... 54
REFERENCES ................................................................................................................ 55
APPENDICIES ............................................................................................................... 66

IV
LIST OF TABLES TABLE 1: IPCC DEFINITIONS FOR EMISSION GOAL RELATED GLOSSARIES ........................ 6 TABLE 2: SCOPE 1, 2, AND 3 DELINEATION INCLUDING ACTIVITY AND METRICS ............. 10 TABLE 3: OCEAN SPRAY RECEIVING FACILITIES ............................................................. 13 TABLE 4: OCEAN SPRAY MANUFACTURING FACILITIES ................................................... 13 TABLE 5: ESTIMATED 2019 REGIONAL AVERAGES OF RESOURCE USE FOR ALL OCEAN SPRAY GROWER-MEMBERS ............................................................................................. 16 TABLE 6: TOTAL 2019 EMISSIONS OF MANUFACTURING AND RECEIVING FACILITIES ...... 18 TABLE 7: CORPORATE LANDSCAPE OVERVIEW ............................................................... 27 TABLE 8: 2019 SCOPE 1 AND 2 EMISSIONS ...................................................................... 30 TABLE 9: UTILITY A PRICING OPTIONS AND ALTERNATIVES ........................................... 35 TABLE 10: UTILITY B PRICING OPTIONS AND ALTERNATIVES ......................................... 37 TABLE 11: FINANCIAL AND EMISSIONS ANALYSIS OF NV ENERGY GREENENERGY RIDER OPTIONS COMPARED AGAINST CURRENT BASELINE SCENARIO AT FACILITY D ..... 39 TABLE 12: CHP SCENARIO WITH AECS, ITC, AND NEITHER .......................................... 48
LIST OF FIGURES
FIGURE 1: SCOPE BOUNDARY DESIGNATIONS FOR ORGANIZATIONAL ACTIVITIES WITHIN OSC ............................................................................................................................... 12 FIGURE 2: 2019 COMBINED EMISSIONS OF OSC MANUFACTURING AND RECEIVING FACILITIES ...................................................................................................................... 18 FIGURE 3: 2019 EMISSIONS OF ALL OSC RECEIVING FACILITIES ..................................... 20 FIGURE 4: 2019 MANUFACTURING FOOD FACILITIES EMISSIONS INTENSITY .................... 21 FIGURE 5: 2019 EMISSIONS OF ALL OSC MANUFACTURING FACILITIES .......................... 21 FIGURE 6: 2019 MANUFACTURING BEVERAGE FACILITIES EMISSIONS INTENSITY ............ 22 FIGURE 7: 2019 EMISSIONS OF ALL OSC CRANBERRY FARMS ......................................... 23 FIGURE 8: 2019 CO2 INTENSITY BY FARMING REGION .................................................... 23 FIGURE 9: 2019 CORPORATE OFFICE EMISSIONS SCOPE 2 AND SCOPE 3 .......................... 25 FIGURE 10: 2019 CORPORATE OFFICE EMISSIONS SCOPE 3 BREAKDOWN ........................ 25 FIGURE 11: MEDIAN EMISSION REDUCTION GOALS FOR DIFFERENT SECTORS WITHIN 13 YEARS ........................................................................................................................ 29 FIGURE 12: 2019 MANUFACTURING FACILITIES SCOPE 1 EMISSIONS BREAKDOWN BY FUEL TYPE ....................................................................................................................... 30 FIGURE 13: FACILITY J SCOPE 2 EMISSION REDUCTION SCENARIOS ................................ 36
LIST OF APPENDICES
APPENDIX A: EMISSIONS SOURCES FOR EMISSION FACTORS USED IN ACCUVIO .............. 66 APPENDIX B: GREENHOUSE GAS INVENTORY METHODOLOGY ...................................... 67 APPENDIX C: GLOSSARY OF EMISSIONS ACTIVITIES ....................................................... 77 APPENDIX D: MANUFACTURING FACILITIES INTERVIEW SUMMARIES ............................ 82 APPENDIX E: 2019 EMISSIONS: MANUFACTURING FACILITIES, RECEIVING FACILITIES, AND FARMS .................................................................................................................... 86 APPENDIX F: EMISSIONS ACTIVITY BREAKDOWNS: MANUFACTURING FACILITIES ...... 105 APPENDIX G: EMISSIONS ACTIVITY BREAKDOWNS: RECEIVING FACILITIES ................ 116

V
APPENDIX H: OUTLINE OF PRESENTATION FOR LEADERSHIP DECISION MEETING ........ 123 APPENDIX I: COMPANY GHG MITIGATION EXAMPLES................................................. 126 APPENDIX J: DRAFT PRESS RELEASE ............................................................................ 130

VI
List of Abbreviations, Acronyms, Symbols AEC: Alternative Energy Credits APS: Alternative Portfolio Standard BCG: Boston Consulting Group (°C): Degrees Celsius CDP: Carbon Disclosure Project CH4: Methane CHP: Combined Heat and Power CO2: Carbon Dioxide CO2e: Carbon Dioxide Equivalents COP:: Conference of Parties CPG: Consumer-Packaged Goods DJSI: Dow Jones Sustainability Index (°F): Degrees Fahrenheit GDP: Gross Domestic Product GHG: Greenhouse Gas GHG Protocol: Greenhouse Gas Protocol GRI: Global Reporting Initiative GWP: Global Warming Potential HFCs: Hydrofluorocarbons HVAC: Heating, Ventilation, and Air Conditioning ICP: Internal Carbon Pricing IPCC: Intergovernmental Panel on Climate Change ITC: Investment Tax Credit IWG: Interagency Working Group on the Social Cost of Greenhouse Gases kW: kilowatt kWh: kilowatt-hour LED: Light-Emitting Diode MMBTU: Million British Thermal Units MP: Master’s Project MW: megawatt MWh: megawatt-hour N2O: Nitrous Oxide NCA: National Climate Assessment NCI: Nevada Climate Initiative NGR: Nevada GreenEnergy Rider NREL: National Renewable Energy Laboratory OSC: Ocean Spray Cranberries PCCN: President’s Commission on Carbon Neutrality PFCs: Fluorinated Gases PPA: Power Purchase Agreement PPPA: Physical Power Purchase Agreement PSC: Public Service Commission REC: Renewable Energy Certificate ROI: Return on Investment

VII
SBT: Science-Based Target SBTi: Science-Based Target Initiative SDA: Sectoral Decarbonization Approach SDC: Sweetened Dried Cranberries SEAS: School for Environment and Sustainability SF6: Sulfur Hexafluoride SPPA: Solar Power Purchase Agreement TCFD: Task Force on Climate-Related Financial Disclosures TOU: Time of Use UNGC: United Nations Global Compact USGCRP: U.S. Global Change Research Program VPPA: Virtual Power Purchase Agreement WAGES: Water, Air, Gas, Electricity, Steam WBCSD: World Business Council for Sustainable Development WRI: World Resources Institute WWF: World Wide Fund for Nature

VIII
Executive Summary Background Ocean Spray Cranberries, Inc. (OSC) is a farmer-owned cranberry cooperative with over 700 grower-owners throughout the United States, Canada, and Chile. As the company builds out a comprehensive climate strategy, OSC enlisted the support of a graduate student team at University of Michigan’s School for Environment and Sustainability to:
i. Conduct a Scope 1 and Scope 2 greenhouse gas (GHG) emissions accounting of OSC’s operations in 2019 to determine its baseline carbon footprint and preliminary Scope 3 data collection and analysis of OSC Farms
ii. Research emissions reduction target-setting options and develop a business case for adopting such commitments
iii. Identify and benchmark competitor climate commitments and public communications iv. Identify potential GHG emissions mitigation opportunities and implementation strategies
Cranberries are a specialty crop and are relatively sensitive to changes in weather and
climate. Climate change will lead to earlier and warmer spring temperatures (particularly in North America), which will lead to earlier flowering of the cranberry bud. This will increase risk of crop destruction from a late frost. Although there is currently a surplus in the cranberry market, premature flowering could become a consistent issue which could ultimately impact entire regions of OSC farmers. Hotter summers can lead to berry scalding, which leads to a less marketable and less attractive product. Pests will become more resilient with warmer temperatures, and this could lead to an increased infestation of insects such as False Armyworm caterpillars and cranberry weevils. This may lead to lower crop yields and greater pesticide expenses. Precipitation is also expected to become more variable. Intense summer rains could lead to fruit rot, and the increased risk of drought could lead to requiring more irrigation and water consumption, which will lead to greater costs incurred by the farmers. Some regions are already experiencing these impacts, but these experiences are expected to be commonplace in North America by 2045.
Methods
Data for the GHG inventory was collected and stored in the Ireland based sustainability software, Accuvio. Within Accuvio, each facility (manufacturing, receiving, farm) was assigned a node and all applicable emissions activities (i.e., waste, water, fuel) were assigned to each node. Data were collected and uploaded to the software for each emissions activity using 2019 as the baseline year. From there, Accuvio automatically calculates the GHG emissions for each activity using a database of scientifically proven and proved GHG emissions factors. The software applies the most accurate emissions factor based on the geographic location of each source. To delineate the Scope boundaries of all of OSC’s methods, the GHG Corporate Standard was used. Scope 1 emissions are characterized by direct GHG emissions and include onsite mobile and stationary combustion. Scope 2 emissions include indirect electricity-related emissions from purchased and used electricity or steam. Scope 3 emissions include other indirect GHG emissions that OSC does not own or control. This includes transportation from between the facilities. Using the GHG Protocol's Agriculture Guidance, we characterized the farmers and their emissions as Scope 3 as they are not in the organization but rather can be thought of as an

IX
upstream supplier of cranberries. Additionally, using the GHG Protocol’s Corporate Accounting and Reporting Standard documents, we characterized the purchased electricity in OSC’s corporate offices as Scope 2, and all other activities in the corporate offices as Scope 3. While we relied on the operational control approach when determining emissions scope, and the OSC corporate office facilities are under an operational lease, interviews with OSC management led us to conclude that operational management of the corporate office buildings does not substantially fall under OSC’s purview, and thus an exception to the operational control approach was applied to these facilities in accordance with the GHG Protocol guidelines. Results The final GHG inventory was focused on Scopes 1 and 2 with a little focus on Scope 3. In 2019, total Scope 1, 2, 3, and biomass emissions from all manufacturing and receiving facilities totaled 184,000 tonnes of CO2 equivalent (CO2 e). Scope 1 emissions accounted for roughly 49% of the total emissions at roughly 91,000 tonnes of CO2 e. Scope 2 emissions were 79,000 CO2 e or 42%. Scope 3 accounted for 9,000 tonnes of CO2 e (5%) and biomass emissions accounted for 7,000 (4%). See Figure ES 1. For the purposes of this report, Scope 3 categories only included wastewater, water, and solid waste and are not a complete representation of OSC Scope 3 emissions.
Figure ES 1: 2019 Combined Emissions of OSC Manufacturing and Receiving Facilities. Emissions are reported in tonnes of CO2e. *Scope 3 emission activities are limited to waste, water usage, wastewater, and ammonia and nitrogen usage. In 2019, the eight receiving facilities emitted a total of roughly 3,000 tonnes of CO2 e. This is significantly fewer emissions compared with the manufacturing facilities mostly because the receiving facilities operate on a seasonal basis and have significantly fewer operational activities outside of the harvest season. Of the total emissions, Scope 2 was the largest, accounting for 1,300 tonnes of CO2e, Scope 1 emissions the next largest at roughly 800 tonnes of CO2e, and Scope 3 emissions were the smallest at 500 tonnes of CO2e. See Figure ES 2.

X
Figure ES 2: 2019 Emissions of all OSC Receiving Facilities. Emissions are reported in tonnes of CO2e.
In 2019, the ten manufacturing facilities in OSC emitted a total of 184,000 tonnes of CO2e. Of the total emissions, Scope 1 was the largest, accounting for 90,000 tonnes of CO2e (50%), Scope 2 emissions was the next largest at roughly 78,000 tonnes of CO2e (42%), Scope 3 emissions were 9,000 tonnes of CO2e (4%), and biomass accounted for roughly 7,000 tonnes of CO2e (4%). See Figure ES 3.
Figure ES 3: 2019 Emissions of all OSC Manufacturing Facilities. Emissions are reported in tonnes of CO2e.

XI
Analysis Research was conducted to determine potential target setting initiatives that OSC could
employ for their mitigation goals. An analysis was also done on sustainability goal setting by companies in cross sector industries like agriculture, food and beverage processing, and retailing. After investigating various goal setting commitment organizations, it was concluded that the Science Based Targets initiative was the most comprehensive, empirical, and supportive group for a company to engage with. The SBT requires companies to determine emission reduction goals that align with climate science and support the goals of the Paris Agreement. This ensures that companies set reputable targets that contribute to the global reduction of GHGs. SBT also works directly with companies that are setting targets, aiding them with the latest resources and data. Over 1,000 companies are working with the SBT to date and the company analysis done showed that all companies that were on target or had achieved targets with intensity metrics had also reduced absolute emissions, proving that targeting setting was an effective tactic to reduce emissions.
We researched Power Purchase Agreement (PPA) and Renewable Energy Certificate (REC) scenarios for Facility J from two different utilities. We considered three primary options: a PPA from a solar farm, bulk-purchasing wind RECs, and purchasing RECs from the existing fuel mix. We concluded that bulk-purchasing wind RECs was the most cost-effective option, increasing purchased electricity costs in a range of 2.3-6.2%. This would also allow Facility J to remain with their existing utility but still reap the benefits of RECs.
We investigated the possibility of installing on-site solar energy generation and an energy storage system to increase renewable energy use at Facility D, which was chosen for the climate conditions and politically friendly environment in Nevada. When it became apparent that on-site solar was not currently viable, we considered utilizing an energy storage system only to take advantage of peak shaving, in which batteries are charged during off-peak hours; the cost savings could be applied toward the purchase of more renewable energy. The energy storage system decoupled from on-site solar was not feasible due to an extended payback period and minimal savings, which did not achieve the goal of facilitating the procurement of more renewable energy. We reviewed a rejected proposal for development of a combined heat and power (CHP) installation at one of OSC’s manufacturing facilities. The stated reason for rejecting the investment was that the state program that subsidized such projects using Alternative Energy Credits (AECs) was under review, and CHP projects were expected to be removed from AEC eligibility. Our analysis of the financials of the project discovered that, absent any financing plans, the time to payoff for the CHP project without AECs was less than a year longer than the time to payoff with AECs. Slight modifications of OSC’s capital project approval guidelines could have made these emissions- and cost-cutting investments more attractive.
Implementing a mitigation strategy will support OSC’s viability and growth as a business. Multiple business challenges, such as regulation and reputation can also be opportunities for OSC to not only improve their sustainability practices, but to also benefit economically if the company moves quickly to implement sustainable programs. There is a strong likelihood that emission regulations at the federal and state level will be introduced in the near future. The Biden Harris administration has made fighting climate change a central part of their goals and have focused on decarbonizing the agriculture industry in particular. With the regulation there also is the potential for incentives that OSC could take advantage of if prepared

XII
to apply for programs that work within their supply chain. The economic risks that climate change poses are clear, and in order for OSC to ensure crops for future generations of farmers, they must implement mitigation strategies to ensure their supply chain is resilient. OSC may also soon find itself in need of helping larger retailers meet their Scope 3 reduction goals. By implementing a mitigation plan, OSC will reduce not only its own emissions, but also retailers’ Scope 3 emissions and ensure it remains on shelves nationally. In addition, many of OSC’s competitors have already made public commitments around sustainability goals such as emission reductions. Consumers are increasingly looking for sustainability products and are willing to pay more for those items, therefore OSC has the potential to capture a share of the growing market for sustainable food products if it moves quickly to establish a clear mitigation plan that it can share with consumers. Financing sustainability projects and implementing a mitigation plan will require upfront investment from OSC. The company’s current return on investment (ROI) requirements typically disqualifies sustainability projects due to their longer payback periods. There are multiple ways to fund these projects and determine their economic benefit, and recent sustainable financing tools can aid OSC in reaching their goals. One tool that has become popular to fund major projects are green bonds. Similar in many ways to traditional bonds, green bond proceeds must be used to support climate or environment sustainability projects. Often looked upon favorably by investors and consumers, green bonds can allow a company more flexibility in funding by setting their own terms for the bond issuance, as long as they are willing to disclose the use of the funds. Internal carbon pricing (ICP), a strategy of placing a monetary value on greenhouse gas emissions to help guide decision-making by including hidden costs, is another green financing tool. The most common form of ICP is shadow pricing, in which a theoretical price is attached to tonnes of greenhouse gas emissions. Prices can vary vastly depending on the policies of the jurisdiction. ICP can also take the form of an internal carbon fee, a voluntary tax that is levied within the company per tonne of carbon emissions, or implicit price, which considers the amount of money a company spends to reduce its emissions or comply with regulations.
Communications were prepared for both internal and external audiences. The internal communication focused on providing one presentation slide and one presentation outline for OSC senior leadership. The goal of the slide and outline is to convey how to determine mitigation goals and ROI strategy for OSC to pursue to reduce its emissions. The external communication provides a draft press release on OSC’s commitment to SBTi, if the company decides to pursue that course of action. Recommendations
In order to improve the data collection process in Accuvio, we recommend that a team member from the Sustainability Team be designated to help the data managers from the receiving and manufacturing facilities upload data to Accuvio. In addition, we recommend providing yearly or twice yearly Accuvio training for the data managers. We further suggest that within Accuvio, data is collected by what is utilizing fuel (e.g., forklifts, builders, trucks) instead of more general categories like diesel, propane, and natural gas. This will help facilities track how much fuel individual pieces of equipment are using. Data collection would be improved further by requiring more detailed information on waste such as weight of waste being disposed and installing meters on well water connections for a more accurate reading of how much water

XIII
is being used. Yearly audits of Accuvio data should be conducted by a third party to help ensure there are no data gaps in the inventory. The initial hope of this team was to conduct a full GHG emissions accounting, inclusive of Scope 3, for OSC. Our early exploratory research led us to conclude that data collection efforts were not sufficient to conduct an accurate, complete Scope 3 accounting at the time of this project. We recommend that OSC focus its efforts on developing a standardized data collection process for Scope 3 emissions, particularly its grower-owners. Data currently available to OSC pertaining to grower-owner emissions activity is non-standardized in both units and scope, and OSC does not require its grower-owners to report this data. A clearly defined data collection process, conducted at least annually and supported by documentation, will be critical for OSC to accurately understand the activities occurring on its grower-owners’ farms that contribute to its GHG emissions footprint.
To achieve emissions reductions at a significant scale will require company-wide participation and top-level support for sustainability investments. While sustainability projects have been explored in the past, they have not been able to clear the three-year ROI threshold that originates from OSC corporate; as a result, such projects are not prioritized over competing demands. This not only prevents those projects from being completed but slows down future sustainability efforts as such projects are seen as not feasible. To signal clear support for sustainability projects, OSC must reconsider the criteria by which it judges capital investment proposals. We recommend using an ICP to achieve this. An internal carbon price will reorient incentives when the company and individual facilities are considering investment projects, leading to greater overall energy efficiency and fewer emissions.
The Science Based Targets initiative has become an industry recognized norm for setting responsible emissions reduction goals. OSC should commit to a Science Based Targets-approved emissions reduction targets in order to maintain standing as an industry sustainability leader. At this time, if OSC were to commit to the SBTs, it would be the first fruit cooperative to commit, making it stand out among farming competitors. With regulation and buyers reporting requests on the horizon, setting an SBT and getting it approved will ensure OSC is following the strictest standards and will be in line with requests from governments or buyers. Ultimately, publicly committing to SBTs will continue to signal to OSC’s value chain and customers that as a company it is continuing to prioritize the sustainable health of people and the planet, while providing top-quality products consumers know and love.

1
1. Introduction and Background 1.1 Project Objective and Scope
Ocean Spray Cranberries, Inc. (OSC) is a farmer-owned cranberry cooperative with farms throughout the United States, Canada, and Chile. With more than 700 family farmers, OSC holds a majority market share of the world’s cranberries. With a global agricultural supply chain, OSC simultaneously contributes to and is highly vulnerable to the climate change impacts. As such, it is critical to protect the cranberry supply chain and OSC brand with a strategy to address and mitigate climate change. OSC is in the early stages of developing a comprehensive strategy to address climate change. This project is organized into the four tasks and with the following goals:
(1) Greenhouse Gas Inventory. Assess the company’s Scope 1 and 2 greenhouse gas emissions to determine its baseline carbon footprint and preliminary Scope 3 data collection and analysis of OSC Farms,
(2) Target Setting. Determine GHG emissions reduction target options including a Science Based Target option,
(3) Mitigation Plan. Identify and analyze mitigation options, (4) Communications Plan. Develop a communications plan to publicize OSC’s
commitment to climate change mitigation.
Climate change will have increasingly deleterious effects on the agricultural sector and CPG companies. Some of these consequences are already apparent. For example, in 2012, premature budding due to an unseasonably warm winter led to $220 million in losses of cherries in Michigan (“Climate Impacts,” 2017). The 2016 Paris Agreement aims to limit global warming to below 2 degrees Celsius (°C) above pre-industrial levels, with further goals to limit warming to 1.5°C. Doing so can reduce intensity and frequency of climate and weather extremes, which not only pose challenges to farming, but impact the entire value chain for businesses (“IPCC,” 2018 and “The Paris Agreement,” n.d.).
It is therefore important for OSC to have a plan in place to mitigate rising emissions and address the business risks associated with a changing climate. In order to determine the company’s environmental impact, we assessed its Scope 1 and 2 emissions and conducted a preliminary analysis of Scope 3 emissions. The GHG inventory used data provided by OSC as well as our own data collection. Once OSC’s s baseline emissions were determined, we examined what reduction plans would be needed if OSC chose to set Science Based Targets (SBTs) for absolute reduction of emissions (“SBTi Call to Action Guidelines,” 2018). In addition, we recommend mitigation options, while considering possible environmental, social, and economic costs and benefits of each. Finally, we developed an external communications plan to publicize OSC's emissions reduction target and underscore the company’s commitment to climate change mitigation. Not only will external communications allow for greater transparency and accountability but making the ambitious strategy public will encourage others in the sector to follow suit.

2
1.2 Ocean Spray History and Background OSC was founded in 1930 by three New England cranberry growers who formed a cooperative to share marketing resources for their first product, cranberry sauce. Today, OSC comprises over 700 grower-members, with farms located in Massachusetts, Wisconsin, New Jersey, Washington, Oregon, British Columbia, Eastern Canada, and Chile. OSC is headquartered in Lakeville, Massachusetts. In addition to the grower members, OSC employs approximately 2,000 people world-wide, with roughly 200 employees working full time at the corporate offices. OSC’s product portfolio is divided into four categories: beverages, Craisins® or sweetened dried cranberries, sauce, and fresh fruit. They operate juice bottling facilities in Nevada, Wisconsin, Pennsylvania, and Texas; dried cranberry and concentrate facilities in Washington, Massachusetts, Wisconsin, Chile, and Quebec; and a cranberry sauce manufacturing facility in Wisconsin (Ocean Spray Cranberries, 2020). OSC’s cranberries and related products are included in over 1,000 products sold in over 100 countries. OSC operates within calendar, fiscal, and pool years. Its fiscal year ends August 31, and the pool year, which is used when referring to fruit inventories and pools of proceeds returned to growers, ends June 30. One unique aspect of OSC’s operations is its cooperative structure. Cranberry growers become cooperative members upon approval of a contract. Per the contract growers agree to deliver a set number of cranberries in exchange for the benefit of stock ownership, cooperative marketing benefits, voting rights, and technical support. OSC has a small corporate sustainability department consisting, at the time of our research, of two full-time employees, one undergraduate part-time intern, and a Ph.D. candidate conducting research on carbon sequestration on member farms. Historically, OSC implemented an efficiency program called WAGES (water, air, gas, electric and steam). While the program continues, the scope has diminished, and WAGES receives limited funds for new projects. The intent of the project was to collect data from OSC’s facilities to evaluate cost, efficiency, and demonstrate feasibility of emissions reduction or other sustainability-related projects. Data collection and organization was managed by one person using Excel. Eventually the initiative was absorbed by the engineering and sustainability departments and transitioned into the Accuvio sustainability software (Bowe, 2020). However, since then, OSC has made renewed attempts to understand and manage its carbon footprint, and this report builds on that initiative. 1.3 Climate Change and Risk to Cranberry Production 1.3.1 The IPCC and NCA
The Intergovernmental Panel on Climate Change (IPCC) is a leading scientific body that develops comprehensive, science-based summaries to explain the drivers of climate change (IPCC, n.d.). In 2019, the IPCC prepared a Special Report to discuss the impacts of warming above 1.5°C from pre-industrial levels. Pre-industrial levels are considered to be the Earth’s average temperature before 1850 (Allen et al., 2019). The report states that “if the current warming rate continues the world would reach human-induced global warming of 1.5°C around 2040 (Allen et al., 2019). Regarding impacts to food and agriculture, “climate-related risks to health, livelihoods, food security, water supply, human security, and economic growth are projected to increase with global warming of 1.5°C and increase further with 2°C” (Masson-Delmotte et al., 2018).
The National Climate Assessment (NCA) is an American report that was established by the Global Change Research Act of 1990. The report is published at least every four years by the

3
U.S. Global Change Research Program (USGCRP). The most recent report is the fourth NCA (NCA4), which describes the “human welfare, societal, and environmental elements of climate change and variability” for ten regions in the United States, and eighteen topics and sectors that operate in the United States (Reidmiller et al., 2018). Similar to the IPCC, the NCA assesses peer-reviewed scientific literature and “carefully evaluate[s] observational and modeling datasets, technical input reports...and a suite of scenario products” (Reidmiller et al., 2018). Of particular importance to our report are Chapter 10: Agriculture & Rural Communities, Chapter 18. Northeast, Chapter 21: Midwest, and Chapter 24: Northwest. 1.3.2 Climate Impacts on Agriculture
The NCA4 states that climate change will have various consequences, including: reduced agricultural productivity, degradation of soil and water resources, health challenges to rural populations and livestock, and vulnerability and adaptive capacity of rural communities. More frequent and longer droughts, as well as changing precipitation patterns “will intensify wildfires...accelerate the depletion of water supplies for irrigation, and expand the distribution and incidence of pests and diseases for crops and livestock” (Gowda et al., 2018). This will reduce the productivity of agricultural lands. Crop production will be impacted in areas with excessive rain, as flooding and soil runoff may occur (Gowda et al., 2018). Finally, rural communities “often have limited capacity to respond to climate change impacts, due to poverty and limitations in community resources” (Gowda et al., 2018). 1.3.2.1 Climate Impacts on the Northeast
The Northeast region of the United States has four distinct seasons, which is important for farming communities. Climate change puts these rural communities and industries at risk from changes to forests, wildlife, and water resources (Dupigny-Giroux et al., 2018). The NCA4 states that “by 2035...the Northeast is projected to be more than 3.6°F (2°C) warmer on average than during the preindustrial era. This would be the largest increase in the contiguous United States” (Dupigny-Giroux et al., 2018). These temperatures will lead to shorter freeze periods. By 2050, there will be two to three less weeks of frost annually. By 2100 this is expected to increase to at least three less weeks in the Northeastern United States (Dupigny-Giroux et al., 2018). Similarly, snowfall will occur later, and snow will melt earlier in the spring. This will impact land and water ecosystems as well as “forest productivity, agriculture land use, and other resource-based industries” (Dupigny-Giroux et al., 2018). 1.3.2.2 Climate Impacts on the Midwest
The NCA is clear about the risks to the Midwest due to climate change, stating that “projected changes in precipitation, coupled with rising extreme temperatures before mid-century will reduce Midwest agricultural productivity to levels of the 1980s without major technological advances (Angel et al., 2018).” In general, temperature increases will be the largest factor in decreased agricultural productivity (Angel et al., 2018). The Great Lakes are an extremely important freshwater resource, and temperature increases could lead to habitat loss, pollution, nutrient inputs, and nonnative invasive species. The Midwest is also a major transportation and commerce hub for the United States, and increased precipitation and heavier rain events will increase the risk of flooding which will impact transportation of goods. The Midwest is also a major consumer of coal, which leads to increased carbon emissions. In 2015,

4
coal provided 56% of the electricity consumed in the region, and for 32% of the entire country’s coal consumption. This has decreased over time, since renewable energy is becoming increasingly common with wind energy becoming more common in the Midwest. 1.3.2.3 Climate Impacts on the Northwest
Extreme weather events such as wildfires, droughts, and floods, will become increasingly common in the Northwest United States. This part of the United States has warmed almost 2°F since 1900 (May et al., 2018). The NCA states that “strong climate variability is likely to persist for the Northwest, owing in part to the year-to-year and decade-to-decade climate variability associated with the Pacific Ocean (May et al., 2018).” This will lead to negative impacts on agriculture, if there is a drought coupled with reduced snowpack/precipitation. Reduced snowpack will also lead to less natural protection from wildfires, which could easily ravage agricultural lands. 1.3.2.4 Climate Impacts in Chile Ponce et al. states that “climate change impacts on the Chilean agricultural sector are widespread, with considerable distributional consequences across regions, and with fruits producers being worst-off [sic] than crops producers” (Ponce, Blanco, and Giupponi, 2014). Climate change is expected to worsen natural disasters that Chile already experiences, including wildfires, floods and landslides, droughts, and the threat of sea level rise (World Bank, 2020). Across the country, the average annual temperature is expected to rise by more than 1.5°C between 2040 to 2059 (World Bank, n.d.). This has an impact on frost levels, as well, with the frequency of frost days expected to decrease by an estimated 12 to 42 days by 2040 to 2059 and 37 to 69 days the year 2100 (World Bank, n.d.). 1.3.3 Cranberries and Climate Change 1.3.3.1 Introduction to Cranberries
Cranberries (Vaccinium macrocarpon) are native to North America and grow well in wetlands (Armstrong, 2016). Cranberries are more tolerant to flooding than other fruits but require adequate drainage from March through October in the active growing season. In commercial cranberry bogs, intentional flooding occurs to protect the crop from frost in the winter and to reduce pests. Cranberries are grown across the U.S., as well as in Canada and South America. OSC has farmers in almost all of the states in which cranberries are grown in the U.S.
Cranberries have a 16-month life cycle, in which they grow during the summer and fall months, then become dormant in the winter until the following spring (for Northern Hemisphere cranberries).
Harvest season for Northern Hemisphere cranberries is mid-September to mid-November. In Chile, cranberries are harvested from March to May (Ocean Spray, n.d.). Bees pollinate the cranberries in the summer before harvest, and farmers typically use one to two beehives per acre of cranberry bog (Cranberries.org, n.d.). Cranberries require pollination from bees or other pollinators, as cranberry flowers are unable to self-pollinate. 1.3.3.2 Temperature Increases and Variability
Earlier and warmer springs, a potential consequence of climate change, could lead to cranberries prematurely leaving their dormant stage and as a result flowering earlier than normal.

5
If a frost or freeze were to then occur, as would be expected in the winter but due to climate change may occur after an increase in temperature as a result of a change in weather patterns, a farmer’s entire crop could be destroyed. In addition, certain pollinators, such as the bog copper butterfly (Lycaena epixanthe), may no longer pollinate the cranberries if their biological timeline no longer coincides with the “normal” flowering period (Ellwood et al., 2013). There is currently a surplus of cranberries on the market, so this would begin to impact farmers first on a local scale. If premature flowering became a consistent issue, it could end up having significant impacts on an entire growing region, which would begin to impact OSC farmers on an aggregate level, as well as the company as a whole. Hotter summers could lead to berry scalding, already a known issue in New Jersey and Massachusetts (Cranberries.org, n.d.). Scalding results in a lower-quality color, as well as “less nutritious fruit and reduced marketability (Cranberries.org, n.d.).” There is also a temperature threshold where it is “too hot for bees,” which is generally in excess of 90°F/32°C. This means that fewer crops could be pollinated, which would also reduce harvest yields (Cranberries.org, n.d.). 1.3.3.3 Pests
There are two main pests to which cranberries, especially in the northeastern United States, are susceptible. False Armyworm caterpillars, or Xylena nupera, eat the terminal bud of the cranberry before it can flower and grow. Flooding the fields is very effective pest control for this insect (Armstrong, 2016). Cranberry weevils, or Anthonomus musculus, drill holes into old leaves and in terminal buds. They also deposit eggs into unopened buds, which either infects the bud or causes the bud to fall off the crop entirely (Cranberries.org, n.d.). Flooding is not effective management against these pests. Milder winters could lead to more frequent infestations and easier survivability for these pests, which could reduce crop yields. 1.3.3.4 Changes in Precipitation
More rain, or more intense rains, will have a significant impact on cranberry production. If there is more rain in the winter and less snow, it will be harder for farmers to keep a layer of ice intact to protect the plants from excess frost. More intense rains in the summer could lead to fruit rot infection. It could also lead to flowers being knocked off the plant by hard rain or hail, and pollen could be washed away, which would make it more difficult (or impossible) for bees to pollinate the flowers (Armstrong, 2016). Climate change is also expected to lead to more extreme weather events, which could also lead to a lack of precipitation during a drought event. This could lead to increased water consumption and irrigation, leading to increased costs to farmers. Non-OSC growers in New Brunswick, Canada, experienced this during the summer of 2020, and are anticipating similar events in the near future (Silberman, 2020).
The Earth has seen changes in its climate throughout history, with temperatures increasing and decreasing even before humans were present. But the increasing speed at which our climate has undergone significant variations to its average weather conditions has been cause for major worry to scientists, governments and citizens worldwide. The rapid warming of the earth’s temperature, which can be largely attributed to anthropogenic actions, is leading to an increase in the following effects: extreme weather, air pollution, health risks (including illness and death), rising seas, warming oceans and endangered ecosystems (Denchak, 2017). The concern about survival on earth in the wake of climate change has led to groups studying the effects above, but also how to slow climate change to allow for ecosystems to survive.

6
1.3.4 Landscape Analysis of Climate Mitigation 1.3.4.1 Corporate Carbon Neutrality and Related Definitions An increasing number of companies are making sustainability claims, with glossaries such as: “carbon neutral,” “net zero,” “climate positive”, etc. advertised to consumers. In our research on 40 companies across six sectors (see Appendix I), 16 companies were found to claim “carbon neutral,” “net zero,” “carbon negative,” “climate neutral,” and “climate positive” in their mitigation goal statements. It is important to first understand the definitions of these statements before taking action on new sustainability goals. While some terms like “carbon neutral” and “net zero carbon emissions” can be used interchangeably, others contain slight nuances despite their similar naming conventions. The IPCC definitions for “carbon neutral,” “net zero,” “carbon negative,” “climate neutral,” and “climate positive” are listed in Table 1 for reference.
Table 1: IPCC Definitions for Emission Goal Related Glossaries
Glossary IPCC Definition
Carbon neutrality, Net Zero Carbon Dioxide Emissions, Net Zero Carbon Emissions
Net zero carbon dioxide (CO2) emissions are achieved when anthropogenic CO2 emissions are balanced globally by anthropogenic CO2 removals over a specified period. Net zero CO2 emissions are also referred to as carbon neutrality.
Net Zero Emissions Net zero emissions are achieved when anthropogenic emissions of greenhouse gases to the atmosphere are balanced by anthropogenic removals over a specified period. Where multiple greenhouse gases are involved, the quantification of net zero emissions depends on the climate metric chosen to compare emissions of different gases (such as global warming potential, global temperature change potential, and others, as well as the chosen time horizon).
Climate Neutrality Concept of a state in which human activities result in no net effect on the climate system. Achieving such a state would require balancing of residual emissions with emission (CO2) removal as well as accounting for regional or local biogeophysical effects of human activities that, for example, affect surface albedo or local climate.
Net Negative Emissions, Climate Positive
A situation of net negative emissions is achieved when, as result of human activities, more greenhouse gases are removed from the atmosphere than are emitted into it. Where multiple greenhouse gases are involved, the quantification of negative emissions depends on the climate metric chosen to compare emissions of different gases (such as global warming potential, global temperature change potential, and others, as well as the chosen time horizon).

7
It should be noted that the above definitions have been used interchangeably by companies and organizations regardless of their differences. For example, even though carbon neutrality in IPCC’s definition only refers to the emission neutrality of carbon dioxide, the University of Michigan President's Commission on Carbon Neutrality (PCCN) still set carbon neutrality goals that encompass the reduction of other GHGs. Due to this commonplace misuse of reduction terms to describe general climate change goals , it is important to both clarify one’s detailed emission reduction goals and use the most accurate name for the goal to ensure publicly set goals are truly met. 1.3.4.2 Companies and Climate Action
Corporations have a key role in accelerating carbon neutrality given that corporate climate actions can be taken faster than country-level climate negotiations (Krabbe, Linthorst, Blok et. al., 2015). The popularization of initiatives — such as SBTi, the Transition Pathway Initiative, Arabesque S-Ray tool, and CDP (Carbon Disclosure Project) “temperature ratings” investor benchmarking tool — have resulted in more companies taking actions to pursue climate goals aligned with the Paris Agreement. More than 1,200 companies have already committed to SBT, with no end to that trend expected. According to a 2018 survey conducted by CDP, 12% of the 5,600 companies anticipated setting SBTs in the next two years (Carbon Disclosure Project, 2019). However, there are critics and concerns of corporate climate actions. There has been some concern whether corporate climate goal settings truly lead to significant absolute emission reduction. Some evidence showed that in general, absolute targets, longer target timeframes, and greater levels of target ambitiousness are associated with improvements in environmental performance (Dahlmann et al., 2019). Criticism also points at current voluntary emission reduction reporting practices that are often variable and of poor quality, and ultimately are deemed as closer to “greenwashing” than to real transparency. However, studies have revealed that this notion is only partially true both because of low-quality reporting caused by the pressured voluntary nature of reporting (Liesen et al., 2015), as well as that standardization and professionalization of environmental reporting still is burgeoning (Dragomir, 2012).
Giesekam, Norman, Garvey and Betts-Davies (2021) analyzed whether 81 companies that already committed to SBTs were on track for their goals. They found that the majority of companies assessed were on track for their targets, though just under half of the companies were falling behind on one or more targets. The study also found that all companies on track for their targets had also reduced their absolute emissions, suggesting that SBTi’s current approach to setting emission intensity targets also led to absolute emission reductions. However, the analysis found that the majority of achieved targets were short-term and that Scope 3 targets had a significantly lower rate of completion or schedule adherence than commitments that only included Scope 1 and 2 targets.
Corporations may also be taking climate actions due to increasing customer attention to climate change. Setting carbon reduction goals and norms has become a way to improve a corporation’s image and attract sustainability-minded customers. However, some companies with sustainability goals and claims are only “greenwashing” their brandings by giving misleading information and false claims to make people believe that a company is doing more to protect the environment than it actually is (Delmas and Burbano, 2011). Customers have

8
increased skepticism towards “green products” (Aji and Sutikno, 2015), and only a hint of greenwashing is enough for consumers to mistrust a corporate climate claim (Smithers, 2011). Therefore, it is increasingly important for a company to have a transparent and participatory process involving various stakeholders to keep customer trust, as well as to avoid “greenwashing” accusations from NGOs, activists, and the media (Pinkse and Busch, 2013). 1.3.4.3 Popular Mitigation Strategies
Improving energy efficiency has been one of the most frequently adopted mitigation strategies by corporations because of its effectiveness in addressing sustainability goals, as well as increasing profitability and/or cost savings (Nurunnabi et al., 2020). Energy efficiency, or using less energy to produce the same product or outcomes, has often been recognized as “low hanging fruit for any company” for its short-term and cost-effective investments (Bergmann, et al., 2017). A survey in 2009 found that corporations conducting energy-efficiency strategies had an average energy savings target of 20%, or 2.2% on an annualized basis (Prindle and de Fontaine, 2009). In addition, the energy-efficiency gap or, “investment inefficiencies in energy efficiency cause an increase in energy use in various settings” is a potential downside to energy-efficiency projects (Allcott and Greenstone, 2012). The energy-efficiency gap can be avoided by being informed on energy-efficiency policies that best target a corporations’ specific energy-efficiency projects (Allcott and Greenstone, 2012).
Renewable energy is another popular mitigation strategy that has been supported by the US government and adopted by many corporations (EPA, 2021). Renewable energy sources include hydropower, biomass, geothermal, solar, wind, wave and tidal (Owusu and Asumadu-Sarkodie, 2016). Renewable energy is very effective in reducing emissions. According to EPA, electricity production (26.9% of 2018 greenhouse gas emissions) generates the second largest share of greenhouse gas emissions in the US (EPA, 2018). However, renewable energy only accounts for 20% of the electricity generation in 2020 (EIA, 2020). 60% of the electricity generation still comes from burning fossil fuels, mostly coal and natural gas (EIA, 2020). Therefore, dramatically increasing the share of renewable energy in electricity generation can contribute to a significant reduction in greenhouse gas emissions. Meanwhile, renewable energy has also become more financially attractive due to its price dropping below fossil fuels in 2019 (Marcacci, 2020; Tan, 2019).
Carbon offsets are another tool to reduce GHG emissions. A company can purchase offsets to compensate for emissions produced in or out of their value chain, ultimately “offsetting” those emissions. Companies offset their carbon emissions by funding verifiable GHG reductions achieved domestically or internationally in sectors or sources not otherwise covered by the cap-and-trade program (e.g., soil and forest carbon sequestration, capturing fugitive methane emissions, renewable energy, energy efficiency, and reforestation and clean fuel) (Tatsutani and Pizer, 2008). The market for voluntary carbon offsets has been growing since 2005 (Lovell, Bulkeley, and Liverman, 2009) and still holds strong in 2020 (Zwick, 2020). Clean Development Mechanism (CDM), one of the flexible mechanisms defined in the 1997 Kyoto Protocol, identified carbon offsets as a strategy that helps firms to achieve emission reduction targets with less effort (Lee, 2012). One of the biggest advantages of carbon offsetting is its lower costs per unit of GHG mitigation and flexibility to help address short-term cost risks (Anderson and Bernauer, 2016).

9
There are concerns about the effectiveness of carbon offsetting projects due to the lack of accountability of additional emissions. Research has shown that a typical carbon offset buyer reduces Scope 1 emission by 17% while a non-buyer might reduce Scope 1 emissions by less than 5% (Goldstein, 2015). In addition, carbon offsets have been criticized for not reducing the demand for GHG use, but instead increasing the market demand for carbon offsets (Anderson, 2012). With the differing types of carbon offsets, it can be difficult to determine impactful offsets. For example, reforestation projects have been accused of causing human rights related issues in underdeveloped areas, which will be specifically discussed in the next section. But tools like third party verifiers and carbon registries including the American Carbon Registry, Verified Carbon Standard, and The Gold Standard can help companies identify offsets that have measurable environmental benefit and are retired once used.
Climate-smart agriculture practices are farming practices that aim to tackle three main objectives: sustainably increasing agricultural productivity and incomes, adapting and building resilience to climate change, and reducing and/or removing greenhouse gas emissions, where possible (FAO, 2018). These practices have not been popular to date as few farmers have participated in formal carbon farming policy schemes, mainly due to a lack of information and policy uncertainties (Kragt, Dumbrell and Blackmore, 2017). Demonstrating environmental, socio-economic and financial benefits could help increase engagement. These benefits could help to overcome cranberry farmers’ general attitudes of climate skepticism so that cranberry production may continue in the future (Gareau, Huang and Gareau, 2018). 1.3.4.4 Climate Justice and Climate Mitigation Strategies
It is also important for companies to carefully analyze the social impact of collaborative projects around carbon emission mitigation, especially when investing internationally in carbon offsetting projects. For example, some forestry carbon offsetting projects that took place in Tanzania, have come under heavy criticism for violating environmental justice and human rights expectations (Bachram, 2004; Beymer-Farris and Bassett, 2012). This is because selling and creating biological sinks in a market requires full control and management of the assigned lands. These carbon sinks and pools often require and result in the dispossession of Indigenous land and displacement of Indigenous communities. Related carbon offsetting strategies may therefore be under scrutinization by customers and accused of “greenwashing.” Therefore, it is important for companies to carefully specify the mitigation strategies that do not disregard environmental justice concerns. The risk of backlash related to negative impacts on local communities and lands in the course of implementing mitigation strategies must be taken seriously. As noted previously, there are many different types of carbon offsets and other strategies to reduce emissions. Considering the potential negative consequences of specific carbon reduction projects is necessary for future investment surrounding GHG emissions and public communication.
2. Methodology 2.1 Accuvio Greenhouse Gas Software Data for OSC’s GHG inventory were collected and stored in the sustainability software, Accuvio. Accuvio, an Ireland-based software company, is utilized by companies around the world to track and analyze their greenhouse gas emissions. It can track data in the following areas: GHG emissions, energy, waste, water, and water treatment. Categories of emissions and activity metrics align with the Greenhouse Gas Protocol (GHG Protocol) of corporate

10
accounting. Accuvio can also help aggregate data for various reporting frameworks including CDP, Global Reporting Initiative (GRI), and the Dow Jones Sustainability Index (DJSI). OSC has used Accuvio since late summer 2019 to aggregate their emissions data and create their GHG inventory across their business operations. Each facility (manufacturing, receiving, farm) in OSC was assigned a node in Accuvio. This allows Accuvio users to specify who the owner of each node is (i.e., OSC owned versus leased) and assign an appropriate electricity grid region. From there, appropriate emissions activity (i.e., waste, water use, purchased and electricity) were assigned to each node (Table 2). Data were collected and uploaded to the software for each emissions activity. For more information regarding the methodology and data including documented data gaps, please refer to Appendix B and C. An in-depth list of all activities and definitions can be found in Appendix D. Table 2: Scope 1, 2, and 3 delineation including activity and metrics.
Scope Activity Metrics Measured 1 Company Facilities Stationary Combustion (Natural Gas, Propane, Fuel Oil #2, Fuel
Oil #5, Fuel Oil #6)
1 Company Vehicles Mobile Combustion (Gasoline, Diesel, Propane)
2 Purchased Electricity Facility Electricity Supply 2 Purchased Steam Facility Heating 3 Purchased Water Water Usage 3 Wastewater Discharge Wastewater Discharge 3 Waste Waste (Recycling, Composting, Incineration, to Biodigester, to
Land Application, to Animal Feed, Universal, Hazardous, Mixed Municipal Waste)
3 Corporate Social Responsibility
Nitrogen, Ammonia
Accuvio accepts inputs in the form of fossil fuel and energy consumption data, and calculates the GHG emissions for each activity. Accuvio employs a database of scientifically proven and approved GHG emissions factors and applies the most accurate emissions factor based on the geographical location of each emissions source. See Appendix A for a complete breakdown of emission factors sources. Emissions factors for a variety of GHGs — CO2, CH4 and N2O — are applied by multiplying the emissions factor by the quantity of fuel used or activity completed, then converting the total emissions from all GHGs to CO2e (Accuvio User Manual).
GHGs, which include carbon dioxide (CO2), methane (CH4), nitrous oxide (N2O), hydrofluorocarbon (HFCs), fluorinated gases (PFCs), and sulfur hexafluoride (SF6), are gases that trap heat in the atmosphere and as a result warm the planet (Dencharck, 2019). GHGs have various lifespans and abilities to absorb energy. Global warming potential (GWP) is used to compare GHGs, with those that have longer lifespans and stronger energy absorption having a higher GWP (EPA, n.d.). CO2 is used as a reference gas for GWP and has a rating of 1 over any

11
time period. In contrast, the IPCC’s 5th Assessment Report noted that N2O has a “GWP 265–298 times that of CO2 over a 100-year time horizon scale” (EPA, n.d.) (Greenhouse Gas Protocol, 2016). CO2e is used to normalize all emissions into one unit.
To conduct the inventory, leading scientific guidance documents were consulted to ensure the most robust and appropriate inventory was conducted. The GHG Protocol provides specific guidance to conduct inventories specifically within the agriculture sector (Greenhouse Gas Protocol, 2020). In particular, we consulted the GHG Protocol’s Corporate Standard and Agriculture Guidance documents. 2.2 Emissions Scopes and Boundary Delineation
According to the GHG Corporate Standard, Scope 1 emissions are direct greenhouse gas emissions. In this case, they are sources of emissions that are owned or controlled by OSC. This includes on site mobile and stationary combustion. Onsite transportation including diesel or gasoline trucks and diesel or gasoline forklifts are included in Scope 1. Refrigeration activities are limited to the four manufacturing facilities that have onsite refrigeration. All other manufacturing facilities utilize offsite refrigeration which falls under Scope 3. Scope 2 emissions are indirect electricity-related emissions, such as purchased and used electricity or heat. Scope 3 emissions are all other indirect greenhouse gas emissions from sources OSC does not own or control. Scope 3 encompasses a wide range of emissions including, but not limited to: purchased goods and services, business travel, upstream and downstream leased assets, and use of sold products. OSC does not own its transportation fleet. All transportation from farm to receiving facility, receiving facility to manufacturing facility, and manufacturing facility to consumer falls under Scope 3 emissions.
Due to the complexity of Scope 3 emissions and the organization's cooperative structure, there was some ambiguity about whether OSC farmers fall into Scope 1 or Scope 3. It could be argued that farmers are suppliers, and therefore are Scope 3. However, as a cooperative, the farmers own the company and therefore could be viewed as falling under Scope 1. We concluded through the GHG Protocol’s Agriculture Guidance and Scope 3 GHG Inventory Guidance for U.S. Dairy Cooperatives and Processors documents that OSC Cooperative farmers fall into Scope 3 emissions. From the perspective of the cooperative-run processing and manufacturing facilities, the farmers represent an upstream supplier. While those same farmers have an ownership stake in the corporate activities of the cooperative, their on-farm activities are considered indirect emissions to OSC and therefore are categorized in this analysis to be Scope 3. (Greenhouse Gas Protocol, 2020).
In addition to determining the scope designation of various cooperative activities, developing organizational boundaries was necessary to conduct a complete GHG accounting. GHG Protocol’s Corporate Accounting and Reporting Standard document outlines three standard approaches for boundary setting: equity share, financial control, and operational control. In collaboration with the OSC corporate sustainability team, we determined that the operational control approach, which entails accounting for 100% of emissions for entities where the company directs any operational policies, and 0% of emissions for entities outside of that operational control (Greenhouse Protocol, 2020), was the most appropriate method for OSC. This boundary-setting method helped solidify OSC’s grower-members as Scope 3, since farm operations lie outside the control of OSC corporate. Similarly, emissions-generating activities at OSC’s corporate headquarters were determined to fall under Scope 3, with the exception of

12
purchased electricity, which falls under Scope 2. While OSC’s corporate office buildings are under an operational lease, interviews with OSC management led us to conclude that operational management of the corporate office buildings does not substantially fall under OSC’s purview, and thus an exception to the operational control approach was applied to these facilities in accordance with the GHG Protocol guidelines. See Figure 1 for a visual breakdown of OSC Scope delineations.
Figure 1: Scope boundary destinations for organizational activities within OSC. Boundary delineations were determined using the operational control approach from the GHG Protocol. 2.3 Ocean Spray Receiving Facilities and Manufacturing Facilities
Owned company facilities include ten manufacturing facilities and eight receiving facilities across North America and Chile. Manufacturing facilities are further divided into two types: beverage and food. 2.3.1 Receiving Facilities
The majority of the fruit received through OSC facilities is received via company owned receiving facilities, while some additional fruit is received by local grower-screeners. This amounts to approximately 7.5 million barrels in total yearly harvest in North America and Chile. The receiving facilities are owned by OSC; thus, the majority of their activities fall into Scope 1 and 2 emissions. In order to keep receiving facilities anonymous, all receiving facilities have been randomly assigned a letter K-R (Table 3). There are three receiving facilities located onsite with manufacturing facilities Facility A, Facility E, and Facility H. Unlike the manufacturing facilities, receiving facilities are not operated year-round, with most of their activity occurring during harvest, typically mid- September to mid-October.
A general operation schedule of the receiving facilities is as follows: ● December – September: Skeleton crews for site maintenance, cleaning after harvest, and
prepping for next harvest. Relatively little utility use during these months. ● September – November: Harvest. High/majority of utility use during this time.

13
Table 3: Ocean Spray Receiving Facilities. Some values are not applicable due to a facility’s international location and lack of information to specific grid information.
Facility Name Standalone Location Electricity Grid (eGRID) Region
Average CO2 Emissions in Grid
(lbs/MWh)
Facility K Yes NEWE 522
Facility L Yes RFCW 1166
Facility M Yes N/A N/A
Facility N Yes- Separate Building
MROE 1678
Facility O Yes N/A N/A
Facility P Yes NWPP 639
Facility Q Yes RFCW 1166
Facility R Yes NWPP 639 2.3.2 Manufacturing Facilities
OSC owns and operates ten manufacturing facilities, as seen in table 4 below. These facilities produce the cranberry products that OSC sells. The food manufacturing facilities produce sweetened dried cranberries (SDC) and cranberry concentrate, while the beverage manufacturing facilities produce various juices and other drinks. One beverage facility also produces cranberry sauces. For the purposes of this report, facilities have been randomly assigned a letter from A-J (Table 4). For anonymity, facilities will not be designated as food or beverage.
Table 4: Ocean Spray Manufacturing Facilities. Some values are not applicable due to a facility’s international location and lack of information to specific grid information. Grid intensity is from the EPA’s Power Profiler website (EPA, 2020).
Facility Name Standalone Location Electricity Grid (eGrid) Region
Average CO2 Emissions in Grid
(lbs/MWh)
Facility A Yes NEWE 522
Facility B Yes N/A N/A
Facility C Yes RFCW 1166

14
Facility D Yes AZNM 1022
Facility E Connected to receiving facility
NWPP 639
Facility F Yes MROE 1678
Facility G Yes ERCT 932
Facility H Connected to receiving facility
MROE 1678
Facility I Yes N/A N/A
Facility J Yes RFCE 716 The manufacturing facilities are one of the largest sources of Scope 1 and 2 emissions for the company. As a result, we focused on getting detailed data from these facilities. We interviewed all ten facilities and asked them the following questions:
1) Has your facility completed any projects in the last three years (2017-2019) to improve energy efficiency?
1) How many moving pieces of equipment are at the facility (ex. Forklifts, golf carts, trucks, etc.)?
2) How do you prioritize spending at this facility? Do you have requirements for return on investment?
3) What challenges do you have in making your facility more sustainable? Have these challenges prevented you from making upgrades?
4) What support does your facility need to complete efficiency projects in the future? 5) Are there any future efficiency or mitigation projects you have discussed for your
facility? 6) What is your utility supplier’s fuel mix? 7) Please confirm your emission activities from Accuvio. (We confirmed where they were
missing data and offered assistance to complete data collection) 2.3.2.1 Manufacturing Facilities Interviews Summary and Trends
After interviewing all ten manufacturing facilities, we identified some common trends. The three most common challenges for completing sustainability projects were: (1) access to capital; (2) ROI requirements set by corporate leadership; and (3) issues applying to tax credits and subsidies due to the cooperative structure of OSC. Many of the manufacturing facilities had previously completed sustainability projects and upgrades at their facilities. Common sustainability projects that had been completed in the last ten years include installing Light-Emitting Diode (LED) lighting (either full or partial plan projects), upgrading boilers to more efficient fuel sources (commonly diesel to propane or propane to natural gas), installing variable-frequency drives (VFD) on air compressors, and recovering and reusing waste heat, especially

15
for heating juice bottles. All of the manufacturing facilities expressed strong interest in continuing to prioritize sustainability projects. Disregarding capital and ROI constraints, common ideas for future sustainability projects included water and wastewater reduction, combined heat and power (CHP) for the facility, installing onsite solar panels for charging electric forklifts, improving recycling and composting practices, and increasing the efficiency of refrigerators and/or dryers onsite. Appendix E contains full summaries of each manufacturing interview. 2.4 Farms and the Farm Stewardship Assessment Over 700 farms are members in OSC’s cooperative. As previously noted, control of the operations and processes of these farms lies outside of OSC’s purview, so their activities are treated as Scope 3 emissions. Prior to this study, OSC had minimal data relating to the emissions-generating activities of its growers. In the spring of 2020, OSC issued an optional survey to its grower-members, called the Farm Stewardship Assessment, that included a variety of open-ended questions regarding farm size, land use, energy and water consumption, and business owner attributes. The survey concluded in June 2020, with 307 responses in total. These 307 farmers delivered a total of 5.53 million barrels of cranberries to OSC in 2019, representing 76% of OSC’s total cranberry production in that year. (Those findings were extrapolated to estimate emissions of 100% of OSC farm production.) Respondents were asked to report data for the calendar year 2019. These data were self-reported, unsupported by documentation, and varied in terms of units and metrics. For example, irrigation flow rates were reported in a number of denominations, including inches per hour, gallons per minute, and gallons per minute per acre. As a result, our team normalized the data to develop a baseline for some of the emissions-generating activities conducted by OSC’s grower-members. To do this, we calculated per-barrel averages for each region in the categories of irrigated water, non-renewable electricity use, renewable electricity use, propane use, diesel use, biodiesel use, heating oil use, recycled motor oil use, and wood/solid organic fuel use. 2.4.1 Farm Survey Analysis Methodology Before providing the survey responses to our research team, OSC anonymized the data to protect the identities of participating farmers. Farmers were assigned a random two-digit ID number, and binned into one of eight regions: Quebec/New Brunswick/Nova Scotia; Massachusetts/Rhode Island/New Hampshire; New Jersey/Delaware; Wisconsin/Michigan/Minnesota; British Columbia/Northern Washington; Washington/Northern Oregon; Oregon; and Chile. Next, an OSC employee on the sustainability team normalized the irregularities in units for irrigation flow rates by converting all provided responses to gallons of water. Our team normalized other discrepancies in units — particularly in the diesel, biodiesel, heating oil, and recycled motor oils categories — by converting all units to U.S. gallons. Once this normalization was completed, our team calculated regional averages for each of the nine usage categories on a per-barrel basis. Because not all survey respondents responded to every survey question, we calculated these averages by summing the total usage reported by all responding farms for each category and dividing it by the sum total of barrels each of these responding farms delivered to OSC. We also created a per-barrel average for all firms that responded to each category. In a small number of cases, major outliers were discovered in this

16
process. For example, one farm in the Oregon region reported renewable energy use that was orders of magnitude higher than the other six respondents who provided renewable energy data, resulting in a per-barrel average of 231.55 kWh (kilowatt-hour) of renewable electricity use, compared to the average among all reporting growers of 2.17 kWh per barrel delivered. In this case, our team replaced the regional per-barrel average with the per-barrel average calculated for the Washington/Northern Oregon region. Next, we extrapolated the per-barrel regional averages to estimate resource use for all of OSC’s grower-members. This was done by multiplying per-barrel averages by the total cranberry barrels delivered from each region in 2019. The resulting output can be seen in Table 5 below. Table 5: Estimated 2019 regional averages of resource use for all OSC grower-members.
Region Total barrels delivered, All Farms (2019)
Total Water Irrigated (gal)
Total Electricity Use (kWh)
Total Propane Use (gal)
Total Gasoline Use (gal)
Total Diesel Use (gal)
Total Heating Oil Use (gal)
Total Recycled Motor Oil Use (gal)
Total Wood/Soil Organic Fuel Use (cord)
QC, NB, NS
778,156 688 2,856,014 791,274 520,767 3,142,451 2,279 29,861 2,753
MA, RI, NH
1,594,634 15,078 3,504,203 3,504,204 257,937 383,400 34,335 9,031 2,186
NJ, DE 500,217 3,252 1,823,276 16,988 42,9943 286,302 45,364 2,825 421
WI, MN, MI
2,908,658 4,343 6,613,851 303,247 292,472 905,758 1,211,941 21,054 3,431
BC, N-WA 641,751 3,0133 17,491,646 1,552 833,574 3,253,367 105,298 105,298 540
WA, N-OR 153,040 3,809 1,431,616 6,277 52,141 5,614 7,8291 6,939 13
OR 201,485 2,545 3,482,155 26,152 52,527 22,395 10,308 576 217
Chile 498,750 3,242 391,673 10,11 12,255 3,356,111 25,515 60,361 222
Total* 7,286,691.41 35,970 53,325,763 1,341,422 2,064,666 11,355,397 1,442,870 235,943 9,903
Per-barrel average
- 0.0049 7.32 0.18 0.28 1.558 0.198 0.032 0.00136
*Total values may not add up due to rounding.
From there, the data were converted to a format that was compatible with Accuvio. Each farming region was assigned a node in Accuvio with applicable activities listed. Renewable and nonrenewable electricity use were combined and total electricity consumption in kWh was uploaded. Our rationale for combining renewable and nonrenewable electricity generation into one overarching electricity consumption activity stems from the wording used to collect electricity use data on the farm stewardship assessment. Farmers were asked to report their annual usage in kWh of “electricity from non-renewable energy sources (e.g., coal, natural gas, etc.)” and “electricity from renewable energy sources (e.g., solar, wind, etc.).” Without clear guidance for how to populate this section of the survey, we expect that farmers who completed

17
the survey responded to these questions based on the estimated or actual fuel mix of their local utility. We chose to upload the total kWh usage under both renewable and nonrenewable electricity categories as one lump sum of electricity, and let Accuvio determine the emissions based on the fuel mix of the grid in each farm’s region.
Total wood/solid organic fuel was reported in cords and converted to tons. According to one source, one cord of wood weighs between 2.15 to 2.6 tons depending on the type of wood (New Hampshire Department of Revenue, n.d.) As it is unknown what type of wood was used, the upper limit of 2.6 tons was multiplied by the total number of cords to get tons of wood. Heating oil was assumed to be Fuel Oil #2 in farm regions in the United States (Barber, 2018). In farm regions outside of the United States, Fuel Oil #2 was not a choice in Accuvio, and diesel was used instead. There was no option in Accuvio for “Recycled Motor Oil Use” and it was therefore entered under the mineral oil activity. The team reached out to Accuvio Support for guidance on how to enter the data for recycled motor oil use. Accuvio support suggested that we put that under the activity of “Mineral Oil.” Note that engine motor oil is a synthetic lubricant with additives that may have a different carbon intensity than mineral oil which is a less processed product derived from petroleum. It was assumed that one gallon of motor oil weighs 3.34 kilograms. 3. Greenhouse Gas Inventory 3.1 GHG Inventory Findings
The final scope of the GHG inventory is primarily focused on Scopes 1 and 2 with little focus on Scope 3. Due to the sheer number of OSC facilities coupled with the COVID-19 pandemic, it was difficult for the team to access all of the data necessary to complete a full Scopes 1, 2, and 3 GHG inventory. As such, the team focused our efforts on characterizing Scope 1 and 2 emissions to provide OSC as complete of an understanding of their Scope 1 and 2 emissions as possible.
Presently, the Scope 3 inventory is limited by data that falls within Scope 3 at receiving and manufacturing facilities (e.g., waste, water, wastewater), OSC corporate offices and corporate travel with the exception of Scope 2 purchased and used electricity, and self-reported data from the OSC farmers. While not complete, the current inventory of Scope 3 emissions provides OSC with a starting point to begin to determine their Scope 3 emissions. We recommend that a complete inventory of Scope 3 emissions be conducted to provide a complete GHG inventory of the entire company.
In 2019, Scope 1, 2, 3, and biomass emissions from all manufacturing facilities and receiving facilities totaled 184,341 tonnes of CO2 equivalent (CO2e) (Figure 2 and Table 6). Please refer to Appendix F and G for a breakdown of emissions activities by location. Scope 1 emissions estimated at 91,283 tonnes of CO2e made up the largest share of emissions, accounting for 49% of the total emissions. Scope 2 emissions were 79,313 tonnes of CO2e accounting for 42% of total and. Scope 3 emissions were 9,056 tonnes of CO2e, approximately 5% of total. Biomass emissions were 6,688 tonnes of CO2e approximately 4% of total. It is important to note that the value for Scope 3 emissions is incomplete. This value is only for the manufacturing and receiving facilities, and it only includes categories such as wastewater, water, and solid waste. It does not include other Scope 3 categories such as purchased goods and services, employee commuting, or end-of-life treatment of sold products. It also does not include upstream or

18
downstream transportation and distribution of the products between manufacturing and receiving facilities.
Figure 2: 2019 Combined Emissions of OSC Manufacturing and Receiving Facilities. Emissions are reported in tonnes of CO2e. *Scope 3 emission activities are limited to waste, water usage, wastewater, and ammonia and nitrogen usage. See Table 2 for more information. Table 6: Total 2019 emissions of manufacturing and receiving facilities. Manufactur-ing Facilities
Scope 1 Emissions (CO2e)
Scope 2 Emissions (CO2e)
Scope 3 Emissions (CO2e)
Biomass (CO2e)
Total Emissions (CO2e)
Facility A 20,196 6,526 892 0 27,614
Facility B 7,242 4,887 956 0 13,085
Facility C 8,739 9,235 1,858 0 19,833
Facility D 112 9,277 607 0 9,997
Facility E 3,637 3,646 459 0 7,741
Facility F 13,142 8,310 557 0 22,009
Facility G 4,225 4,702 653 0 9,581
Facility H 10,614 15,327 1,397 6,688 34,028
Facility I 5,149 8.0 283 0 5,440
Facility J 17,409 16,043 1,263 0 34,715

19
Total: Manufactur-ing Facilities
90,465 77,961 8,827 6,688 183,943
Receiving Facilities
Scope 1 Emissions (CO2e)
Scope 2 Emissions (CO2e)
Scope 3 Emissions (CO2e)
---
Total Emissions (CO2e)
Facility K 172 224 161 0 557
Facility L 161 577 60 0 798
Facility M 102 3.3 114 0 219
Facility N 186 408 19 0 614
Facility O 56 2.1 71 0 128
Facility P 15 17 5.8 0 38
Facility Q 105 80 39 0 225
Facility R 21 40 14 0 76
Total: Receiving Facilities
818 1,351 484 0 2,655
Total: Manufactur-ing and Receiving
91,283.9
79,313.4 9,055.9 6,688 186,341.2
*Total values may not add up due to rounding. 3.2 Receiving Facilities Findings
In 2019, the eight receiving facilities in OSC emitted a total of 2,653 tonnes of CO2e. This is significantly fewer emissions compared with the manufacturing facilities mostly because the receiving facilities operate on a seasonal basis and have significantly fewer operational activities outside of the harvest season. Of the total emissions, Scope 2 was the largest, accounting for 1,351tonnes of CO2e, Scope 1 emissions the next largest at roughly 818 tonnes of

20
CO2e, and Scope 3 emissions were the smallest at 484 tonnes of CO2e (Figure 3). For a breakdown of emissions by facility, see Appendix F.
Figure 3: 2019 Emissions of all OSC Receiving Facilities. Emissions are reported in tonnes of CO2e.
Facility B has the highest emissions intensity of all the food manufacturing facilities, with an average of 0.0006 tonnes of CO2e per pound of SDCs. The peak seen in Figure 4 for this facility is likely attributed to their switch to Fuel Oil #5, which is extremely potent, as well as a decrease in production during the month of May. It is not surprising that both Facility H and Facility F have the second highest average of 0.0004 tonnes of CO2e per pound of SDCs, as they are both in MROE the highest-emitting grid that OSC operates in, which is also the “dirtiest” grid in the United States (Table 4). This is followed by Facility I and Facility A, which have an average of 0.0003 tonnes of CO2e per pound of SDCs. Facility I’s emissions intensity is likely skewed, considering that they were acquired by OSC around this time and lack production data. The lowest intensity facility is Facility E. Although this is one of OSC’s oldest facilities, it operates in grid NWPP, one of the cleanest grids that OSC operates in and one of the cleanest grids in the country (Table 4).

21
Figure 4: 2019 Manufacturing food facilities emissions intensity. The values are reported per pound of Sweetened Dried Cranberries (SDC). 3.3 Manufacturing Facilities Findings
In 2019, the ten manufacturing facilities in OSC emitted a total of 184,000 tonnes of CO2e. Of the total emissions, Scope 1 was the largest, accounting for 90,465 tonnes of CO2e, Scope 2 emissions was the next largest at roughly 77,962 tonnes of CO2e, Scope 3 emissions accounted for 8,899 tonnes of CO2e, and biomass emissions were smallest at 6,688 tonnes of CO2e (Figure 5). For a breakdown of emissions by facility, see Appendix E, F, and G.
Figure 5: 2019 Emissions of all OSC Manufacturing Facilities. Emissions are reported in tonnes of CO2e.

22
Facility C has the highest emissions intensity of all beverage facilities, with an average of 0.0015 tonnes of CO2e per beverage case (Figure 6). This is likely due to its location in the RFCW grid, which is the second dirtiest grid that OSC operates in (Table 4). It is interesting to note that Facility J has the second-highest emissions intensity of 0.0012 tonnes of CO2e per beverage case, as it is the newest facility and is the most energy-efficient. It is in a lower energy-intensity grid by comparison, and has a lower intensity than the grids that Facility G and Facility D are located in. We are unsure as to why it has a higher energy intensity and suggest further research to determine the cause. Facility G has the third-highest intensity at an average of 0.0009 tonnes of CO2e per beverage case, and Facility D has the lowest intensity at an average of 0.0006 tonnes of CO2e per beverage case.
Figure 6: 2019 Manufacturing beverage facilities emissions intensity. The values are reported per beverage case. 3.4 Farms Findings
The OSC cranberry farms emitted an estimated total 328,601 tonnes of CO2e in 2019. Of that, roughly 129,994 tonnes of CO2e are characterized as Scope 3 emissions while the remaining 198,614 tonnes of CO2e is emissions from biomass from wood fuel and wood waste. This figure includes extrapolation of the data provided by farmers who completed the farm stewardship assessment to all cooperative members who sold berries to OSC in 2019. Figure 7 shows the percentage of Scope 3 emissions from eight different farms regions, excluding emissions from Biomass. The Eastern Canada cranberry farms region has the highest emissions at 41,852 tonnes of CO2e. Figure 8 displays per barrel produced carbon intensity of the 8 farming regions. Eastern Canada has the highest carbon intensity at 0.051 tonnes of CO2e.

23
Figure 7: 2019 Scope 3 emissions of all OSC cranberry farms. For the purposes of reporting, farms were lumped together into their general geographic location. Emissions are reported in tonnes of CO2 e. Preliminary data based on self-reported survey and accuracy is a concern.
Figure 8: 2019 Emissions of all OSC cranberry farms. For the purposes of reporting, farms were lumped together into their general geographic location. Emissions are reported in tonnes of CO2e. Preliminary data based on self-reported survey and accuracy is a concern.

24
3.5 Farm Data Accuracy Concerns
Due to the undocumented and self-reported nature of the data that was used to generate the estimated farm emissions, we believe these figures likely do not accurately reflect the reality of emissions generated by OSC’s member farms. As mentioned in our methods section, the survey was optional and completed by fewer than 50% of member farmers. Minimal guidance was provided to clarify the data sought by each question, leaving the answers up to individual interpretation and sometimes resulting in a wide variety of units used in responses. Each farm or region of farmers likely took a different approach to completing the survey, making the resultant data difficult to meaningfully compare. These factors could explain why, based on our data, OSC’s Eastern Canada regional farms may account for 32% of OSC’s farmer-generated emissions, when they only grew 11% of OSC’s total cranberry yield in 2019. Additionally, usage information for some potentially significant sources of emissions from farms, such as fertilizer application, were collected using the Farm Stewardship Assessment, but these data were not shared with our team, and thus we were not able to quantify emissions from these sources.
One other element to resolve in the farm data is what portion of farmer emissions are attributable to OSC. Many of OSC’s member farms have other non-cranberry crops and operations on-site. Future research is needed to determine how to allocate emissions-generating activities to appropriately reflect how those activities contribute to growth and harvesting of cranberries that are ultimately sold to OSC from each farm.
3.6 Corporate Offices Findings
The Lakeville, Massachusetts, corporate office emitted 896 tonnes of CO2e in 2019 (Figure 9). Scope 2 emissions accounted for 598 tonnes of CO2e or 67% of total Corporate Office emissions. The rest were characterized as Scope 3 emissions at 298 tonnes of CO2e accounting for the remaining 33%. The majority of Scope 3 emissions were from natural gas consumption, which was 258 tonnes of CO2e. The emissions designated as “other” emitted 9.8 tonnes of CO2e and consisted of water supply, distillate Fuel Oil #2, propane, motor gasoline, and diesel. The remaining 31 tonnes of CO2e came from fuel and energy related activities not included in Scope 2 (Figure 10).

25
Figure 9: A graph of the Lakeville corporate office’s Scope 2 and 3 2019 emissions.
Figure 10: A graph of the Lakeville corporate office’s Scope 3 2019 emissions. Emissions designated as ‘other’ comprised less than 3% of the total emissions. *The full name of this category is “fuel-and energy- related activities not included in Scope 1 or Scope 2. It was shortened in the graph for clarity and formatting. 4. Greenhouse Gas Target-Setting Tools
As the impact of GHGs has become better understood, alarm has rapidly grown at their deleterious effects as well as urgency for quick action to curb their emissions. This effort to measure and cut emissions has taken hold across industries. Inventories have proven effective to

26
determine a baseline of emissions for an organization, the first step to understanding the organization’s carbon footprint. An inventory also aids in the identification of the largest contributors to emissions within its value chain and then set goals for reduction. Inventories can be used at national, state, municipal or corporate levels (Metzger, 2008).
Corporate inventories can help companies not only track emissions over time, but also inform strategies and prioritize actions for emission reduction (Metzger, 2008). Comprehensive corporate GHG inventories must include Scope 1 and 2 emissions, but Scope 3 data is still considered optional by many reporting agencies. For this project, we created a GHG inventory for OSC’s Scope 1 and 2 emissions only, as the current inventory of Scope 3 emissions is not complete.
Once a company knows its footprint and is ready to set reduction goals, there are a range of options for how to do so. Goals are set internally and may be shared publicly depending on a company’s preference. Public goals can boost a company’s public profile and reputation, and appeal to consumers, customers and investors looking for transparency and companies taking action to reduce their environmental footprints. However, there are also potential downsides, with negative PR resulting from missing goals or being accused of “greenwashing” as previously noted.
4.1 Science Based Targets Initiative
One way to prevent accusations of “greenwashing” is to engage third parties to help set goals and validate them. Perhaps the best regarded third-party organization with which a company can publicly align their reduction goals is the Science Based Targets initiative. Founded in 2014, SBTi is a collaboration between CDP, the United Nations Global Compact (UNGC), World Resources Institute (WRI), and the World Wide Fund for Nature (WWF) (Science Based Targets, n.d.). The goal of the SBTi is to help corporations’ transition to a low carbon economy: “by 2020, science-based target setting will become standard business practice and corporations will play a major role in driving down global greenhouse gas emissions” (Science Based Targets, n.d.). A Science Based Target (SBT) is defined as being “in line with what the latest climate science says is necessary to meet the goals of the Paris Agreement—to limit global warming to well-below 2°C above pre-industrial levels and pursue efforts to limit warming to 1.5°C” (Science Based Targets, n.d.). As noted earlier in this report, the IPCC identified capping the temperature increase at those levels as imperative to reduce the risks of irreversible damage due to global warming.
As of October 2020, 1,017 companies had either set or committed to SBTs that directly support the Paris Agreement. The SBTi can aid companies throughout the target-setting process, even providing reduction tools for companies to model what reductions would look like over time. As noted by its name, a SBT requires emission cutting goals based on science approved methods to keep the earth from warming no more than 1.5°C or 2°C. In addition, SBTi requires a company to set a timeline to achieve their commitments, such as ten or 15 years to reach their identified emission reductions, and specific techniques for companies to reach their goals. For example, purchasing carbon offsets is not an approved technique for a company to use to reach their SBTi approved targets, though they may be used to go above those targets. It should be noted that market-based renewable energy instruments are not considered offsets by the SBTi and therefore can be used to reduce scope 2 emissions achieve SBTs, as long as a company is

27
retaining or retiring the energy attribute and using market-based scope 2 emissions accounting to set and track progress against its target (SBTi, 2020).
As a result, a company must commit to SBTs and then within two years of that commitment, they must submit their proposed emission reduction targets to SBTi for potential approval. SBTi reviews targets within 30 business days of submission and informs a company of approval, or feedback if a target is not approved. Only after approval will the company be able to say they have set a target through SBTi, not just committed. After a company’s targets are approved, they set out to alter their operations as needed to make their goals. Progress can be reported through a company’s annual sustainability reporting; no official disclosure to SBTi is needed. If a company falls short in achieving their targets, there is no consequence from SBTi directly, but it runs the risk of public damage to their brand.
There is also a growing number of coalitions that companies are joining to support their target-setting. The World Business Council for Sustainable Development (WBCSD), We Mean Business Coalition, UN Global Compact, and The Climate Pledge all have members working toward various sustainability goals. Often their initiatives overlap with other target-setting organizations, so companies may be members of multiple coalitions depending on their goals. These coalitions offer members knowledge-sharing opportunities, best practices, and support for achieving their sustainability goals. But, as with any public commitments, a company must be sure to weigh the risks and costs of associating with a coalition or goal. This includes potential accusations of “greenwashing” if the commitment is judged to be ineffectual and allotting resources to manage those commitments.
4.2 Corporate Competitive Analysis
Our competitive analysis examined 40 companies in six sectors of food and beverage processing, retail, textiles and apparel, pharmaceuticals and biotech, logistics/delivery, and technology. The companies selected are either competitors (20) in the same sector as OSC or businesses with a range of revenues in other sectors (20) that showcase the current interests and actions in climate mitigation from businesses of different sectors and sizes (See Table 7).
Table 7. Corporate Landscape Overview
Sector Number of Companies
Have GHG
Target
Average Baseline Year for Scope 1
& 2
Average Carbon Neutral
Goal Year
Average Year Gap
Have SBTi Goals
Have SBTi status
(verified)
SBTi status
(committed)
Median Reduction Rate for
Scope 1 & 2
Median Reduction Rate for Scope 3
No Goal for
Scope 3
Food & Bev.
Process-ing
20 10 2017 2031 14 11 6 5 45% 33% 3
Retail- ing
7 7 2016 2028 12 6 3 3 54% 26% 0
Textiles, Apparel, Luxury Goods
6 5 2015 2027 12 6 5 1 46% 41% 3

28
Pharma-ceutical
& Biotech
3 3 2016 2030 14 3 3 0 52% 41% 1
Logis- tics/Del-
ivery
1 0 - - - 0 0 0 - 0 0
Techno- logy
3 3 2015 2027 12 1 1 0 64% 48% 0
Total # of
Compa-nies
40 28 2016 2028 13 27 18 9 - - 7
The data for this analysis was collected by searching through companies’ sustainability
reports and press releases. One challenge of this analysis was with the exception of companies that have worked with SBTi to set up mitigation goals, it was hard to find consistent details on a company’s GHG mitigation goals. One difficulty in comparing absolute emission reductions goals is that different companies have different composition of absolute Scope 1, 2, and 3 emissions. The current analysis could only address this problem by grouping companies in sectors and assume that emission compositions are similar within the same sector.
In the analyzed companies, 70% already have GHG targets and 67.5% of companies have SBT goals. The SBT status for two-thirds of the companies are verified and one-third of the companies are committed. Of all the companies that are engaged with SBTi, corporate profit ranges from $10 million to greater than $100,000 million. Specifically in the food and beverage sector, half of the companies analyzed are working with SBTi to implement and verify their climate mitigation plans. One-quarter of the food and beverage companies analyzed (Valio, RxBar from Kellogg Company, Chobani, Dairy Farmers of America, Inc., and Starbucks) have already committed to SBTi goals for climate mitigation. Therefore, it could be concluded that currently a majority of the world’s leading companies in the five sectors we analyzed have contributed to climate mitigation by working with the SBTi and setting up SBTs, regardless of company size and sectors.
Most companies analyzed began committing to GHG targets in 2015 and aim to achieve their goals in 12 to 13 years (target years of 2027 to 2028). Sixteen companies researched have already publicly announced mitigation goals including carbon neutrality or carbon positive even as they are in initial stages of verifying and committing to SBTs. In terms of setting SBTi approved targets, all companies analyzed have ambitious goals for reducing Scope 1 and Scope 2 emissions. However, one-third of the companies do not have any emission reduction goals for Scope 3, according to their press releases and other online open resources. This is allowable under the SBTi rules which only require a Scope 3 target “if a company’s relevant and mandatory scope 3 emissions are 40% or more of total scope 1, 2, and 3 emissions” (SBTi, 2020).
In order to analyze the overall trend in setting GHG reduction rates for the selected companies, companies were first grouped by sectors because different sectors have different emission compositions and emission strategies. The median reduction rate within each sector is defined as the median yearly reduction rate multiplied by the average mitigation year gap (13

29
years is calculated and used as average mitigation year gap for all sectors). The committed reduction rates for Scopes 1 and 2 for the majority of companies researched across sectors fall into the range of 45-64%. The average reduction rate for Scope 3 across sectors falls into the range of 26-48% (Figure 11). In the food and beverage processing sector, the average reduction rate of Scope 1 and Scope 2 for companies that have already had their SBTs verified or committed is 28%. This is lower than other sectors such as retailing and textiles.
Figure 11: Median Emission Reduction Goals for Different Sectors within 13 years
As discussed previously, utilizing renewable energy and improving energy efficiency are still the two most popular emission reduction strategies for most sectors except for the logistics/delivery and technology sectors. These two latter sectors favor carbon offsetting as the top strategy for climate mitigation. The actions most companies reported for climate mitigation are to improve energy efficiency by reusing resources, reducing energy use (e.g., using square bottles to more efficiently transport products, reducing water use), recycling, and using energy alternatives to fossil fuels. 5. Mitigation Plan When looking at the manufacturing and receiving facilities, Scope 1 and 2 emissions overwhelmingly are generated by manufacturing facilities. (Table 8). Of the manufacturing facilities, the Scope 1 emissions were dominated by the use of natural gas to produce steam and heat in facilities (Figure 12). Scope 2 emissions were the result of purchased electricity and, in the case of one manufacturing facility, purchased steam.

30
Figure 12: A graph of the percentage breakdown of all 2019 Scope 1 emissions from Ocean Spray’s Manufacturing Facilities. Diesel, Landfill Gas (LFG), and Motor Gasoline were condensed into one category because their total comprises 0.2% of all total Scope 1 emissions. Table 8: 2019 Scope 1 and 2 emissions.
OSC Unit Scope 1 (tonnes CO2e)
Scope 2 (tonnes CO2e)
Total Scopes 1 and 2 (tonnes CO2e)
Manufacturing Facilities
90,445 75,846 166,291
Receiving Facilities
819 1,351 2,170
Given the scale of OSC and the individualized nature of its facilities that span eight
states, two Canadian provinces, and three countries, it is difficult to develop a one-size-fits-all emissions mitigation strategy across the company. Different states and countries offer distinct incentives to encourage emissions reductions, which impacts the payback of projects, making a project that is attractive at one location less so at another. When considering the costs of a project, it is important to consider both those that impact the company’s bottom line as well as hidden, external costs, such as those associated with climate change. The impacts of climate change, which have been previously discussed, are borne and felt by all people, businesses, and governments. Thus, it is important to factor in these costs when considering capital investments and long-term strategy.
When assessing reduction strategies, we sought out high-impact projects that could reduce emissions at a proportionately high rate given the capital investment required for the intervention. We considered the area of impact (e.g., fuel, energy, waste, water), the reduction potential of the intervention would have given the level of emissions, and the availability of data to be able to accurately assess the impact of the intervention. Following this assessment, we determined across the company, there were significant opportunities in energy, especially when

31
considering incentives at the state and national level to decarbonize the grid. Additionally, given the large footprint of natural gas among the manufacturing facilities, we also saw an opportunity to reduce emissions in this area. To help illustrate interventions, we developed three case studies, completing a cost-benefit analysis at three different facilities. 5.1 Case Study 1: PPAs and RECs at Facility J
Facility J is OSC’s largest manufacturer. It produces over 40% of OSC’s product. Even though it is the newest and most efficient facility, being the largest producer also means that they are the largest emitter. In 2019, Facility J used 35,217,498 kWh of electricity and 96,056,597 kWh of natural gas. In comparison, the average consumption of the other manufacturing facilities is 13,118,089 kWh of electricity and 52,581,392 kWh of natural gas, respectively. The following information provides background necessary for the case study.
5.1.1 The Electricity Grid The electricity grid is made up of smaller grids across the United States. There are three large power grids, or interconnects, and they mostly operate independently of each other, which helps prevent blackouts from spreading across the entire country. The Western Interconnect consists of states west of Colorado and New Mexico. The Texas Interconnect is almost all of Texas. The Eastern Interconnect consists of states from Oklahoma and North Dakota eastward (EPA, n.d.). The United States grid is also connected to Canada, so OSC’s receiving facilities in British Columbia are on the Western Interconnect, and Facility I is located in the Eastern Interconnect (EIA, n.d.).
There are 26 subregions that the EPA created, called eGRIDs. These eGRIDS reflect the emissions rates of the power plants within those subregions and provide a clearer depiction of electricity use within eGRIDs (EPA 2018, 2020). The carbon intensity of each grid is calculated by the pounds of CO2 for each Megawatt-hour (MWh) of energy (lbs CO2/MWh). Table 3 (in section 2.3.1) lists each facility that OSC owns, along with its eGRID and the carbon intensity of that grid.
5.1.2 Deregulated Versus Regulated Energy Markets 5.1.2.1 History of Energy Markets Up until the late 1980s, most electric utilities worldwide operated under a regulated energy market, in which the utility company “operated the generation, transmission, and distribution systems in a fixed geographic area” (Christie, Wollenberg, and Wangensteen 2000). By the end of the 20th century, deregulation had become popular in other industries, allowing for increased competition between companies. The trend of deregulation would have an impact on the energy markets. 5.1.2.2 Regulated Energy Markets In a regulated energy market, consumers are limited in renewable energy products their utilities offer (EPA, 2020). Some options in these markets include “green tariffs, which are bundled green power products from specific renewable energy projects procured through special utility tariff rates.” There are also “green pricing products,” which are “bundled products that include RECs with electricity service (EPA, 2020).” If their utility offers no or limited renewable energy options, the consumers do not have the option to switch to a different energy provider.

32
5.1.2.3 Deregulated Energy Markets Deregulated energy markets are also called “restructured competitive markets” (EPA, 2020). The idea is that deregulated energy markets allow for companies to compete for customers, thus reducing costs to electricity consumers. In the United States, the transaction-based model is used. Because most utilities in the United States are privately owned, the federal government has limited control over their actions. The goal of the transaction-based model is to “impose the minimum set of requirements that would create competition and to encourage regions to develop more complex structures” (Christie, Wollenberg, and Wangensteen, 2000). The following states have competitive energy markets: California, Connecticut, Delaware, Illinois, Maine, Maryland, Massachusetts, Michigan, Montana, New Hampshire, New Jersey, New York, Ohio, Oregon, Pennsylvania, Rhode Island, and Texas (EPA, 2020). OSC has five facilities located in deregulated markets. In a deregulated energy market, electricity consumers can choose their power provider and purchase from any utility in their service region (EPA 2020). These markets also allow for the option of Power Purchase Agreements (PPAs). 5.1.3 Power Purchase Agreements There are two main types of Power Purchase Agreements (PPAs): Physical Power Purchase Agreements (PPPAs) and Virtual Power Purchase Agreements (VPPAs). 5.1.3.1 Physical Power Purchase Agreement A PPPA is direct and “physical” because “power is ‘physically’ delivered to [the] buyer” (Kent, 2016). With a PPPA, the purchaser “takes ownership of the electrons produced by the renewable energy project” (Kansal, 2019). In general, this means that a company that enters a PPPA owns the renewable energy being produced from the project and uses that energy to power their facility. The purchaser receives “stable and often low-cost electricity with no upfront cost…” (Better Buildings Solution Center, n.d.). These are often 20-year contracts, and the company also receives the RECs from the energy generation (Kent, 2016). With a PPPA, the purchaser “takes ownership of the electrons produced by the renewable energy project” (Kansal, 2019). PPPAs are most effective for a company that: Wants to reduce energy costs, hedge against energy price increases, or improve the resiliency of [their] operations without spending [their] own capital; wants a third party to own, install, and maintain an energy system; is unable to take direct advantage of renewable energy tax incentives; is located in a state or jurisdiction where third-party ownership of generation equipment is permitted (Better Buildings Solution Center, n.d.).
There are various costs involved with a PPPA, including fixed costs, variable charges, and risk premiums. The capacity payment is a fixed cost. It is a “guaranteed payment to cover the capital cost” of the new renewable energy facility (or to help cover capital cost from an existing facility). The energy charge is a variable charge, as it “covers variable costs of day-ahead scheduled generation.” A day-ahead schedule is a five-minute interval schedule of how much energy the buyer expects to need the next day. In general, the energy provider handles the transactions, so the company purchasing the energy does not need to do any negotiations after the PPPA has been finalized. There is also a risk premium that is often rolled into the contract. It
33
is “based on the perceived risks about future costs and prices” (Regulatory Assistant Project 2018). Often a price increase of 1-5% per year of the contract occurs “to account for gradual decreases in system operational efficiency, operating and maintenance costs, and increases in the retail rate of electricity” (Better Buildings Solution Center, n.d.). If a company entered a PPPA, it would offset their Scope 2 emissions (Sotos, 2015). 5.1.3.2 Solar Power Purchase Agreements A subcategory under PPPAs are Solar PPAs (SPPAs). With a SPPA the investors act as a third party to directly sell electricity from their rooftop PVs to customers at a lower rate than the utility’s retail rate. The proposed rates of the SPPA are generally divided into the two options of a fixed rate and a discount on the utility’s retail rate (Prapanukool and Chaitusaney 2020). SPPAs are nearly identical to a PPPA, except that they are specific to an agreement with solar energy. Although similar, some states have explicit restrictions against PPPAs, SPPAs or the capacity of the system. The states that OSC operates in that do not allow PPPAs but allow SPPAs include: Oregon with no limitations and Nevada with system size limitations. In general, 26 states allow for SPPAs, compared to only 17 that allow for PPPAs (DSIRE, 2015). 5.1.3.3 Virtual Power Purchase Agreements Virtual Power Purchase Agreements (VPPAs), also known as financial or synthetic PPAs, are a “financially-settled arrangement between [a] renewable energy project and buyer, with [the] buyer owning RECs (Kent, 2016).” VPPAs differ from PPPAs because with a VPPA, the consumer can be anywhere in the United States, even if they reside in a regulated market (EPA, 2020). Also, the buyer does not own the physical electrons generated by the project (Kansal, 2019). This means that the purchaser cannot use this energy for their facility, and therefore are considered indirect PPAs. Companies that enter VPPAs help fund renewable energy projects, resulting in positive public appearance and increased renewable energy generation, even if the company does not use the energy directly. VPPAs can be beneficial for smaller companies and help “companies to make quick and significant progress toward ambitious renewable energy goals (Kansal, 2019).” Similar to PPPAs, VPPAS are often ten- to 20-year agreements between a purchaser and a renewable energy generator. These agreements are relatively symbolic in terms of renewable energy usage, since the facility never receives electricity from renewable sources, but can help a facility achieve carbon neutrality. They are also an option to companies that exist in regulated markets and are unable to utilize PPPAs, since there is never a transfer of electrons—it is just a monetary transaction (Kansal, 2019). 5.1.3.4 Renewable Energy Certificates RECs are “attributes’ of electricity generated from renewable resources,” where 1 REC = 1 Megawatt-hour (MWh) (Kent, 2016). These certificates are tradable, nonphysical commodities and are a way for businesses to verify carbon reductions and count towards organization targets (Better Buildings Solution Center, n.d.). The owner of the REC “has exclusive rights to make claims about using or being powered with the renewable electricity associated with that REC,” which prevents double counting of a certificate (EPA, 2017). The owner retires the RECs to show that they have been claimed. Since RECs are often owned by the purchaser of a VPPA, it is important for the company to “avoid giving the impression that they are using the renewable electricity associated with the project,” since they do not own the electricity, just the certificate

34
(EPA, 2017). Since the company purchasing RECs would own the certificate, RECs, as a market-based renewable energy instrument, can be used to offset a company’s Scope 2 emissions (EPA, 2017). 5.1.4 Facility J Background Facility J is located in the RFCE grid. The average carbon intensity of the RFCE grid is 716 pounds of CO2/MWh, which is lower than the national average of 947.2 pounds of CO2/MWh (EPA, 2020). This grid has a high percentage of natural gas, as well as the highest percentage of nuclear in the country, which is a non-renewable resource due to its consumption of uranium (American Petroleum Institute, n.d.). This grid also has the fifth lowest percentage of renewable energy compared to all other 26 grids. Renewable energy accounts for 5.2% of the grid’s fuel mix, while the national average is 17.0% (EPA, 2020). Only five of OSC’s facilities are located in deregulated markets, as mentioned above. Although PPAs are possible in regulated markets, there are extraneous costs and work involved to go through a third-party vendor to obtain the energy, including finding a third-party who has the ability to purchase electricity in the wholesale market within a deregulated market (Penndorf, 2018). When considering a PPA intervention, we only considered the facilities located within deregulated grids. Given Facility J’s scale of production and energy consumption, in addition to their existing long-term contract with an energy technology firm, we felt the firm would be able to support Facility J in implementing an emissions reduction intervention since they are familiar with the relationship and the process. We also analyzed and considered offsetting Facility J’s Scope 2 emissions with RECs. This would allow the facility to offset their emissions without changing utilities. It is also a more feasible option across the entire company, as a facility does not need to be in a deregulated market to take advantage of RECs. We compared quotes from two different utilities which will be named Utility A and Utility B for anonymity, as we did not receive consent to publicize their rates. 5.1.4.1 Utility A Utility A provided a PPA estimate, in which Facility J would receive 4,600 MWh from a solar farm located near Washington D.C. This represents approximately 13% of Facility J’s 2019 Scope 2 emissions. The developer of the solar farm would be willing to expand the farm if OSC were interested in purchasing more renewable energy. This expansion would be necessary because the existing solar panels already have RECs claimed. New panels would allow OSC to claim the solar RECs from the 4,600 MWh that OSC would receive. The estimate we received was based on existing capacity from the solar farm and would likely be different if OSC sponsored new capacity to claim the RECs. An estimate from a representative puts the cost from this solar farm at approximately $0.05 per kWh, or $50 per MWh. The total yearly cost for 4,600,000 kWh would total to approximately $230,000 (Table 9). This would only cover Facility J’s electricity consumption. For reference, Facility J currently pays 1-2 cents per kWh under their existing contract. Utility A also provided a scenario for Facility J to purchase various amounts of wind RECs. Facility J could purchase 25%, 50%, 75%, or 100% wind RECs to offset their Scope 2 emissions. Utility A has the option to include this cost into the monthly electricity bill, and it would add approximately 1 to 2 cents per kWh to the total cost of electricity. This would ultimately cost Facility J between $88,000 and $176,000 for 25% wind RECs, and between $352,100 and $704,350 for 100% wind RECs. A cheaper option would be to purchase a batch of

35
wind RECs all at once (Table 9). A one-time purchase of 40,000 MWh would cost between $30,000 and $80,000 to offset their Scope 2 emissions. Even though wind RECs would lead to the same amount of carbon emissions generated by OSC, since RECs help support renewable energy projects but do not lead to purchasing actual electrons. Purchasing RECs would allow OSC to own and retire the wind RECs at a more reasonable price. These cost estimates would be on top of the approximately $1.29 million that Facility J already spends on purchased electricity annually. A comparison of emission reductions between scenarios is shown in Figure 13 below. Table 9: A breakdown of various alternatives with cost estimates that Utility A offers to offset Facility J’s Scope 2 emissions.

36
Figure 13: Estimate of potential Scope 2 emission reductions with Utility A partnership based on 2019 emission data assuming a constant fraction reduced each month.
Based on 2019 Scope 2 emissions, the PPA provided by Utility A would reduce Facility J’s emissions by 13% annually. On an aggregate level, it would reduce all company Scope 2 emissions by about 2.8% annually. If a bulk purchase of 40,000 MWh wind RECs were purchased, it would reduce Facility J’s Scope 2 emissions by 113%. It would reduce all company 2 emissions by 22% annually. 5.1.4.2 Utility B REC options were also considered from the provider Utility B, but a PPA was not available from this utility at the time of this research. In this scenario, Facility J would change utility companies to Utility B when their current contract ends in approximately 18 months. An estimated cost for electricity and no RECs is approximately 5 cents per kWh. This electricity would be coming from the regular fuel mix (no increase in renewable energy). Adding RECs would offset 100% of Facility J’s 2019 Scope 2 emissions, as seen in Table 10. It would cost 5.04 cents per kWh (Table 10). Currently, Facility J spends $1.29 million on purchased electricity. The non-REC option would increase spending to $1.76 million, and adding RECs would cost an additional $14,000, totaling purchased electricity costs to $1.77 million. This is a 37% increase in purchased electricity costs.

37
Table 10: A breakdown of cost estimates that Utility B offers to offset Facility J’s Scope 2 emissions.
Switching to Utility B would significantly increase energy costs. Entering a PPA with Utility A would also significantly increase costs. We recommend that Facility J bulk purchase 40,000 MWh of RECs from Utility A. Purchasing RECs would not require leaving the current utility and would only increase purchased electricity costs by a low estimate of 2.3% and a high estimate of 6.2%, depending on the cost per REC. It would cost Facility J between $30,000 and $80,000 to reduce their Scope 2 emissions by 113%, or their total (all scope) emissions by 30.4%. 5.2 Case Study 2: Energy Storage and PPAs at Facility D
In 2019, Facility D used 8,931,329 kWh or the equivalent of roughly 4,250 tonnes of CO2e. This facility has a strong history of sustainable investment in infrastructure and an interest in exploring other sustainable options (see Appendix E for more information).
Before 2018, the state of Nevada, where Facility D is located, was behind in many climate and energy related policies. However, after the passage of both Nevada S.B. 358 and Nevada S.B. 254, the state now has some of the most aggressive emissions reduction goals in the country. Nevada S.B. 358, signed into law in April 2019, includes the requirement that Nevada’s state renewable portfolio standard (RPS) to be 50% by 2030 (Kalla, 2019). Notably, this is one of highest RPS in the country, making Nevada a leader in renewable energy policies. Nevada S.B. 254 was signed into law in May 2019 and requires the state to do a complete GHG inventory every year with the goal of developing policies that support the long-term goal of state-wide net zero emissions by 2050 (S.B. 254, 2019). More recently, the current Governor Steve Sisolak developed the State of Nevada Climate Initiative (NCI), further solidifying Nevada’s commitment to sustainable energy and climate action throughout the state (Delaney, 2020).

38
Because of the changing political climate in Nevada, it is the ideal time for OSC to invest in sustainable infrastructure at Facility D. Two different options were explored to help offset electricity consumption at the facility: onsite battery storage and a PPA.
5.2.1 Onsite Battery Energy Storage System
As the driest and one of the sunniest states in the country, Nevada has an ideal climate for solar electricity generation. However, after an initial investigation with an OSC engineer, Facility D does not have the roof capacity necessary for rooftop solar. It is currently unknown whether installation of a non-rooftop solar system, which would be able to produce approximately 300 kW, is possible at Facility D. As this scenario is currently under evaluation, we have conducted our analysis of an onsite energy storage system without the assumption of onsite solar generation.
We explored a battery energy storage system as a possibility to encourage greater use of renewable energy, in particular to offset the premium associated with the purchase of renewable energy. Large-scale battery storage systems have grown rapidly in functionality and popularity in recent years as the cost per-unit of energy capacity has decreased. Between 2010 and 2018, the United States went from seven large-scale battery energy storage systems to 125, increasing power capacity from 59 MW (Megawatt) to 869 MW (EIA, 2020). While such a system is most beneficial when paired with renewable energy generation, battery storage systems offer a potential win-win solution. The use of batteries allows for peak shaving, a form of load management in which the battery is strategically charged during the electricity grid’s off-peak demand periods and discharged during peak periods. This causes less strain on the grid while reducing costs; it also creates the opportunity to smooth out energy consumption, which addresses a challenge of renewable energy such as solar or wind, which have inconsistent production levels. We considered the possibility of a 1 MW energy storage system based on the needs described to us by an Ocean Spray engineer. After assessing five options, we identified two primary battery candidates, a 250 kW Dynapower battery and a 168 kW Tesla battery. These systems were chosen due to cost and number of units required to attain 1 MW. We estimated the costs of the batteries and installation, resulting in a total cost of $5,850,000 for the Dynapower battery system and $5,896,000 for the Tesla battery system. We did not factor in maintenance and operation costs over lifetime of the batteries, which was assumed to be 10 years. We assumed disposal was included in installation costs.
To understand the ROI of the battery system, we looked at the impact of peak shaving. Facility D operates on a time-of-use (TOU) utility rate structure, in which peak prices are charged at different times of day and throughout the year depending on demand. Between September 2019 and August 2020, Facility D used more than 26 MW during peak or mid-peak periods, resulting in demand charges of over $150,000. Implementing peak shaving with an energy storage system in which the batteries are charged during off-peak times (such as weekends or at night) would result in savings of $144,000. This calculation incorporates loss that results from round-trip efficiency. Over the 10-year lifespan of the battery, the savings from demand charges accumulates to almost $1.5 million saved. However, due to the high costs associated with installing the energy storage system, the savings provided by the battery system would not exceed its cost over the course of its lifetime, and the estimated payback is approximately 40 years.

39
We did not factor in state or federal incentives in the financial analysis of the energy storage unit because we assumed Facility D is unable to install its own renewable energy generation system, given limited capacity for rooftop solar. When battery storage systems are combined with on-site renewable energy generation, they qualify for financial incentives. In Nevada, NV Energy offers commercial energy storage incentives when energy storage systems are used to store energy produced by solar generation. While the installation of batteries is permitted without generating renewable power, this eliminates eligibility of the incentive program, which would help offset the cost of the intervention. At the federal level, the Investment Tax Credit (ITC) requires that the battery system is charged at least 75% via solar generation. Doing so qualifies the project for a deduction of the cost of the system (22% in 2021 and 10% beginning in 2022). However, this scenario does not apply to Facility D given the amount of renewable energy Facility D receives.
Facility D is reliant on the mix of renewable energy as delivered by the utility company NV Energy. Currently, the Renewable Portfolio Standard for NV Energy is 27.5%, surpassing the utility’s 20% renewable energy requirement for 2020. With its current energy plan and without its own renewable energy system, Facility D cannot guarantee increased renewable energy usage as a result of battery installation. As a result, the battery storage system is an unattractive solution, having minimal impact on renewable energy usage while simultaneously being financially unviable given the return. 5.2.2 Power Purchase Agreement
Rather than purchasing an energy storage system, Facility D could consider participating in NV Energy’s NV GreenEnergy Rider (NGR), a program that permits large customers to shift 50% or 100% of their electricity usage to renewable energy. While NGR is not currently open for enrollment, this is an ongoing program that is worth further exploration. NGR is a PPA: NV Energy brokers a long-term deal between a renewable energy generator and the participating business, in which the business agrees to purchase a set amount of renewable energy over the span of the contract (typically 20–25 years). Participation in NGR requires a small premium tied to kWh consumed (“NV GreenEnergy Rider program”, 2020). For 50% renewable, this is estimated to be 0.28 cents per kWh, while for 100% renewable, the premium is estimated to be 0.47 cents per kWh (Trabish, 2016). Given 2019 electricity consumption levels, participating in NGR would result in a slightly increased annual cost; however, this would achieve a substantial impact on emissions, as shown in Table 11.
Table 11: Financial and emissions analysis of NV Energy GreenEnergy Rider options compared against current baseline scenario at Facility D. Scenario % Renewable
Energy Annual Change in Cost ($)
Annual Change in Emissions (tonnes CO2e)
% Reduction of Facility Scope 1 and 2 Emissions
% Reduction of OSC Scope 1 and 2 Emissions
Baseline (RPS)
27.5 0 0 0 0

40
Scenario 1 (NGR)
50 1,366.61 -1,415.39 15.07 0.8
Scenario 2 (NGR)
100 2,293.95 -4,560.71 48.57 2.7
Participating in NGR would yield a large impact on Facility D’s emissions. This further
supports the emissions reduction goals of Nevada, which will ultimately rebound positively to Facility D on both environmental and financial levels. For example, in 2019, Facility D was charged more than net $2,000, more than the cost of purchasing 50% renewable energy through NGR, as part of the Renewable Energy Program, which supports the development of renewable energy programs (“How to Read Your Bill”, 2020). As electricity generation in Nevada relies increasingly on renewables, costs to participate in the Renewable Energy Program and similar initiatives can be expected to decrease. While there is a small financial cost of a couple thousand dollars associated with participating in NGR, the environmental impact is considerable. Purchasing 50% renewable energy reduces the facility’s emissions by 22.1%, while 100% renewable reduces emissions by 44.2%. In addition, moving to 100% renewable energy at only Facility D decreases OSC’s total Scope 1 and 2 emissions by 2.7%, while 50% renewable energy decreases OSC’s total Scope 1 and 2 emissions by 0.8%, contributing not only to OSC’s reduction goals but also helping to solidify OSC’s public image as a climate-conscious company. To further underscore the impact of purchasing greater renewable energy, we recommend considering an internal carbon cost, which accounts for factors associated with carbon emissions to help with decision-making. Internal carbon pricing is discussed in more detail in Section 6.
6. Business Case for Sustainability
OSC is a fiscally conservative company. In our discussions with management at the cooperative’s manufacturing and receiving facilities, we learned that investments are expected to payoff within three years or fewer to gain approval, and access to capital for efficiency improvement projects is limited and competitive between facilities. Under OSC’s current project finance framework, justifying investment in sustainable business ventures will be challenging, due to typical ROI on sustainability projects exceeding three years. Key to successful and strategic decision-making is ensuring that all costs are considered. At OSC, the ROI calculation is based strictly on capital costs and overlooks externalities namely those associated with the cost of climate change. Assigning a price to carbon is a powerful strategy used to factor in hidden costs. In 2009, the federal government established the Interagency Working Group on the Social Cost of Greenhouse Gases (IWG, 2016) to determine the social cost of carbon, which was intended to be applied consistently to governmental decision-making. While the group was disbanded in 2017, prior to its disbandment, the IWG’s estimate of the social cost of carbon per metric ton of carbon dioxide for the year 2020 was $52.71 (inflated to 2020 dollars). This price is the result of three integrated assessment models that consider the wide-ranging impacts of climate change on the global economy (Interagency Working Group on Social Cost of Greenhouse Gases). Using a carbon price allows for a more comprehensive understanding of the impacts of carbon emissions and facilitates a more

41
comprehensive decision-making process. This can be applied when calculating ROI, making external costs internal.
Companies tend to account for conventional costs that directly affect their bottom lines, but the true costs associated with a business’s environmental footprint tend to be much larger. While businesses are not financially responsible for externalities that they generate, these hidden costs have an impact on the environment and society, and can result in costs for those businesses (ICF, 1995). These costs can be intangible and difficult to measure, and can take many forms: negative health effects and decreased quality of life; damaged ecosystems; weakened supply chains; and more. As attention on these costs grows, the risks of inaction increase. These risks, which range from regulatory, economic, and reputational risks, will be discussed in the following section.
6.1 Risks Associated with Unsustainable Practices 6.1.1 Regulatory Risks
Without preemptive action on reducing emissions, OSC will most likely find itself reacting to regulation in the future. Though the changing landscape and expectations of regulatory bodies, industry, and customers cannot be perfectly predicted, OSC will most likely face climate regulation at the state, federal and international levels in the future.
Climate change was a central topic in the 2020 presidential election. The Biden-Harris administration has identified central goals including achieving a 100% clean energy economy and reaching net-zero emissions no later than 2050 (Biden-Harris Administration, 2020). In order to reach those goals, President Biden outlined a plan across sectors during his campaign. One aspect is to require “public companies to disclose climate risks and the greenhouse gas emissions in their operations and supply chains” (Biden-Harris Administration, 2020). Though OSC is not a public company, this call for transparency should be noted. If it becomes the norm, the expectation for these disclosures may exceed government and investor inquiries and become industry norms that consumers expect as well. Without preemptively disclosing its climate data, and displaying that it is working toward decreasing its footprint, OSC risks falling behind new norms.
The agriculture sector is also mentioned multiple times in the Biden-Harris administration climate goals. There is a focus on both lowering emissions from agriculture, as well as incentivizing innovation for how to do so. The administration’s plan calls for “decarbonizing the food and agriculture sector, and leveraging agriculture to remove carbon dioxide from the air and store it in the ground” (Biden-Harris Administration, 2020) as well as “federal investments and enhance tax incentives for CCUS [carbon capture, utilization and storage]... [and] to bring new carbon capture technologies to market, Biden will continue to fund carbon capture research, development, and demonstration” (Biden-Harris Administration, 2020). OSC should be prepared to take advantage of the various incentives the Biden administration will create. The coming four years will present OSC with opportunities for financial support of technological innovation, which can also help OSC’s comply with the administration’s expectations for decarbonizing the agriculture sector.
The Food and Agriculture Climate Alliance (FACA) is also actively lobbying the federal government across six issue topics regarding climate policy including soil health, energy policy, and food loss and waste (The Food and Agriculture Climate Alliance, 2020). Some of FACA’s recommendations echo the Biden administration’s plan to incentivize farmers to implement tools

42
such as renewable energy and carbon sequestration (The Food and Agriculture Climate Alliance, 2020). It is important for OSC to be prepared for climate legislation being passed on the federal level that may impact their operations. There is also indication that Congress may begin to look at taking on climate change in the coming decade. In a first-of-its-kind study by the U.S. Commodity Futures Trading Commission, it advised that a nationwide carbon price should be implemented by Congress. The report argues:
...financial markets will only be able to channel resources efficiently to activities that reduce greenhouse gas emissions if an economy-wide price on carbon is in place at a level that reflects the true social cost of those emissions. Addressing climate change will require policy frameworks that incentivize the fair and effective reduction of greenhouse gas emissions. In the absence of such a price, financial markets will operate suboptimally, and capital will continue to flow in the wrong direction, rather than toward accelerating the transition to a net-zero emissions economy… (U.S. Commodity Futures Trading Commission, 2020).
This finding, of the high risk the U.S. financial markets face due to climate change, will be hard for Congress to ignore, and the report puts the onus on Congress, rather than financial regulators, to act. In the wake of the 2008 crisis and the current COVID-19 pandemic, representatives are keenly aware of the nationwide effects of market failure as their constituents begin to push their representatives to acknowledge climate change (Funk and Kennedy, 2020). All of these trends indicate that it is reasonable to believe that Congress may join in the bodies requesting emission disclosure and reduction in the near future.
The study goes on to close with a list of recommendations, the first one being a national price on carbon: “It must be fair, economy-wide, and effective in reducing emissions consistent with the Paris Agreement. This is the single most important step to manage climate risk and drive the appropriate allocation of capital” (U.S. Commodity Futures Trading Commission, 2020) This is one of the most explicit calls to establish a regulated price carbon. Though this report is the first to so explicitly link the financial sector, climate change, and carbon pricing, it is another indicator of the path the U.S. Government may be headed down.
At the state level, “eleven U.S. states and two Canadian provinces currently have an [Emissions Trading System]” (U.S. Commodity Futures Trading Commission, 2020). States with Emissions Trading Systems (ETS) include Massachusetts, Pennsylvania, Virginia and Washington (The World Bank, 2021). The Regional Greenhouse Gas Initiative (RGGI), which includes Massachusetts as a member, also caps emissions from power production. In addition, for competitors with international footprints, they are already facing “carbon taxes in place in jurisdictions, including Canada, Chile, Colombia, Mexico, South Africa, Sweden, and the United Kingdom'' (U.S. Commodity Futures Trading Commission, 2020). ETS are also present or scheduled in China, Japan, Australia, Chile, Colombia, Indonesia, Ukraine and the EU (The World Bank, 2021). Even if federal legislation lags behind state or international regulations, if OSC may be held to state level or international regulations where they produce and sell products.

43
6.1.2 Economic Risks Climate change also poses significant economic risks for OSC. As a reminder of the previously noted NCA4’s findings: if the effort is not taken to “reduce the impacts of increasing droughts, heatwaves, and catastrophic wildfires, by 2050 American agriculture is projected to lose the last 30 years of progress, returning to the productivity levels of the 1980s” (May et al., 2018). This reduction in productivity is only amplified with the cost of damages farmers must pay, which is estimated to be equivalent to approximately 5% of the annual GDP in the agricultural sector (USDA Economic Research Service, 2020). All of these stressors are expected to lead to “farmers and ranchers [facing] steep competition for access to water resources, while requiring more water to ensure the same level of productivity—a major challenge for consistent profitability” (Senate Democrats Special Committee on the Climate Crisis, 2020). Between change in climate, damage due to natural disasters, and increasingly limited access to water, the general economic forecast for OSC farmers and their peers in agriculture cannot be ignored.
On top of the predicted impacts to the agriculture sector in general due to climate change, OSC faces specific economic stressors due to its reliance on its staple product- cranberries. As noted previously in this report, there are explicit risks to both cranberry crops and the other ingredients OSC sources from agriculture across the U.S. due to climate change. Growers would face change in temperature, precipitation, and pests, in addition to the risks to soil and agricultural growth environments. Unchecked climate change could result in OSC not having tenable crops for its products year to year. As a generational farmer-owned co-op that has been a steward of the land, if OSC does not act to mitigate and adapt to climate change, it would be contributing to the potential economic decline of future farmer owners. 6.1.3 Reputational Risks Intertwined with OSC’s economic success is its ability to maintain and improve its reputation as a sustainable and transparent company. Within the beverage and agriculture industries, if OSC wants to hold a sustainability leadership position, it must commit to programming that helps to mitigate climate change to not fall behind its competitors. Nestle’s December 2019 commitment to net zero emissions by 2050 and The Coca-Cola Company’s August 2019 decision to set SBTs have put those companies at the forefront of climate commitments in the beverage space (Nestle, 2020; The Coca-Cola Company, 2019). Their public commitments signal to consumers and suppliers that they are not only taking on climate change, but are willing to be held accountable if they fall short of their goals.
Major retailers like Walmart are also asking their supply chains to help them with climate goals. Though OSC already fills out Walmart’s annual THESIS sustainability KPI survey, as well as reporting to “Project Gigaton,” Walmart’s newly announced goal in 2020 to reach zero emissions by 2040 will require companies in its supply chain to take drastic measures to help them reach their goals across their value chain (Walmart, 2020). In a similar move, Target set not only a 30% reduction for Scope 1 and 2 reduction targets, but also a 30% reduction for Scope 3 goal for retail purchased goods and services (Target, 2019). Target also went a step further to “committing that 80 percent of our suppliers will set science-based reduction targets on their Scope 1 and 2 emissions by 2023” (Target, 2019). These examples of major retailers setting goals that rely on supplier participation makes clear that if OSC continues to be stocked at major retailers across the U.S., they will be asked to reduce and report their own emissions in order to continue to be a part of retailers’ supply chains.

44
OSC’s recent marketing campaign "In Collaboration" with Nature and announcements about certified sustainably grown cranberries and packaging recycling program partnership with TerraCycle have all highlighted to consumers the importance OSC places on preserving the environment and investing in sustainability. But those programs will need to be further built upon to prove to consumers that OSC is continuing to take its sustainability programming seriously. Consumers are becoming better educated and informed on the brands they purchase. With that awareness comes buying power: 50% of consumer-packaged goods (CPG) growth from 2013 to 2018 came from sustainability-marketed products (Kronthal-Sacco and Whelan, 2019). And not only do consumers want sustainable products from sustainable businesses, but they are also willing to pay more for sustainable products (Reints, 2019). Brands like PepsiCo and Unilever have taken the bet on sustainability, at times against the wishes of their investors, because they see the future of consumer expectations and gaining brand loyalty as first movers (Reints, 2019).
The COVID-19 pandemic has only highlighted the importance of these investments. As Boston Consulting Group (BCG) noted in their 2020 survey that examined the effect of the pandemic on consumer attitudes toward environmental issues:
“[Consumer company executives] know that consumer and investor pressure to embrace sustainability is not going away. They know that abandoning their efforts now could pose serious risks to the business in the future and make picking up the sustainability agenda later impractical or unaffordable. And they are looking for pragmatic ways in which to advance their goals (Biggs, Umnikrishnan and Singh, 2020).” On the consumer side, the survey found that 90% of respondents were “equally or more
concerned about these issues after the COVID-19 outbreak” (Biggs, Umnikrishnan and Singh, 2020). Consumers are doubling down on sustainability expectations and it is therefore even more important that OSC meets expectations, if it would like to capture growing market share of sustainable products. Brand value is priceless and OSC should not risk the negative press on such an important issue, instead increasing brand value and potential sales with a robust mitigation strategy.
6.2 Financing Strategies 6.2.1 Internal Carbon Pricing
Of course, taking action to implement sustainability practices requires capital investments. To help justify the cost of these projects, we recommend implementing internal carbon pricing (ICP), a strategy of placing a monetary value on greenhouse gas emissions to help guide decision-making by including hidden costs. As of 2019, 1,600 companies worldwide were using or planning to implement ICP within two years (The World Bank, 2020). The World Bank identified eight key reasons companies adopt ICP: to incentivize low-carbon investments; increase energy efficiency; shift behaviors internally; identify low-carbon opportunities; respond to regulations; react to stakeholder demands; protect future investments; and respond to supplier expectations. Different forms of ICP can be used to advance discrete goals.
There are three forms of ICP (“Internal Carbon Pricing”, 2020). The most common is shadow pricing, in which a theoretical price is attached to tonnes of greenhouse gas emissions. Although shadow pricing does not immediately reduce emissions, it is a tool that helps

45
companies make strategic decisions around capital investments by incorporating risks around future regulation. Prices can vary vastly depending on the policies of the jurisdiction, and the goals and strategies of the company, from as little as $0.01 per tonne of CO2e to as much as $909 per tonne of CO2e (“What is Carbon Pricing?”, 2020). In the U.S. government, the Interagency Working Group on the Social Cost of Carbon (IWG) was established during the Obama administration in 2010 to generate the first federal social cost of carbon, which estimated the economic impact of climate change damages (“The Social Cost of Carbon”, 2017) and was applied for decision-making among government agencies. This cost was $45 per tonne of CO2. Although the IWG was disbanded during the Trump administration and the federal social cost of carbon was decreased to $1 to $6 per tonne of CO2, recent research estimates the social cost of carbon to start between $100 and $200 (Nuccitelli, 2020). Stricter emissions reduction policies or more ambitious mitigation goals could result in a higher shadow price. The United Nations Global Compact encourages the adoption of a minimum corporate carbon price of $100 per tonne of CO2e (“Carbon Pricing”, 2020).
ICP can also take the form of an internal carbon fee, a voluntary tax that is levied within the company per tonne of carbon emissions. The fee, which can be set across a business or within specific units, creates a dedicated revenue stream for emissions reduction projects. As a result, an internal carbon fee encourages the short-term reduction of emissions, as well as incentivizes investments in energy efficiency and decarbonization. Internal carbon fees should be set low enough that they are not burdensome, yet high enough to incentivize change and generate a sufficient funding stream.
The third form is an implicit price, which considers the amount of money a company spends to reduce its emissions or comply with regulations. While this is a retroactive examination of the price of carbon, this price can help illustrate a truer cost of carbon. An implicit price can also act as a benchmark for an internal carbon fee moving forward. Companies may utilize a hybrid of the different ICP mechanisms. 6.2.2 Green Bonds
Green bonds are another mechanism to finance sustainability projects. First introduced in 2007 by The World Bank, their popularity with corporations has grown in recent years. A green bond is similar to a standard bond in terms of the issuing process, ratings, and pricing, but it differs in the use of proceeds. The capital raised by a green bond must be used in projects or activities with specific climate or environmental sustainability purposes (IFC, 2016). In an effort to standardize definitions and transparency of what qualifies as having a climate or sustainability purpose, the Green Bond Principles from the International Capital Market Association “specify sectors in which green bond proceeds can be invested, including in renewable energy, energy efficiency, sustainable waste management, sustainable land use, biodiversity conservation, clean transportation, and clean water” (Alliance 54, 2015).
Thus far, green bonds have shown positive impacts for companies and their sustainability efforts. Considered to be a safe investment and attractive for investors looking to diversify their portfolios, there is a growing market for the bonds. There has also been evidence of issuers’ stock prices increasing “around the announcement of green bond offering, indicating that investors expect the bonds to contribute to shareholder value” (Flammer, 2018). The potential for positive publicity around a green bond does not stop with investors but also can signal to sustainability conscious consumers that a brand is investing in solutions to their environmental

46
impacts. Green bonds also give a company flexibility in how to fund sustainability projects. The lower cost of capital associated with the bonds, combined with the issuer being able to set its own terms for maturity and interest, can also make the green bond a more attractive option than a bank loan.
Not only beneficial to the issuer, there also appear to be real environmental results associated with companies that issue green bonds. In one study, companies that issued green bonds saw both their Thomson Reuters ASSET4 scale score improve, but also reduced their emissions and increased innovations (Flammer, 2018). A second study found “companies improve their environmental footprint following the issuance of green bonds. Specifically, companies significantly reduce their volume of CO2 emissions post-issuance” (Flammer, 2020). If this trend continues, green bonds will signal real commitment to sustainable innovation, not just greenwashing, by a company.
However, there are also potential downsides to green bonds. First, there is the constriction of the limited use of funds. And since it is a bond, the benefits of lower cost of capital only hold true if a company’s credit rating is in good standing. In addition, due to the specific classification of the bond, companies are expected to disclose what funds are spent on and often use third parties to verify their actions. Annual impact reports disclosing updates on spending have become an accepted form of public disclosure. These additional steps require a material increase in time and expense for the issuer. And lastly, though reporting can be a powerful tool, the impacts from the bond can be hard to define in some cases. If a company is unable to show clear impacts, they can be accused of “greenwashing” and potentially lose the benefit of the bond’s signaling to investors and consumers alike.
Even with the potential risks, the number of corporations issuing green bonds has continued to grow. Unilever was one of the first companies to issue a green bond, issuing one in 2014 for €250 million. It used the proceeds to fund a number of new factories, which will cut in half the amount of waste, water usage, and greenhouse gas emissions of existing factories (Bolger and Scheherazade, 2014). Starbucks issued three bonds between 2016 and 2019, ranging from $500 million to $1 billion. Proceeds were put toward ethically sourcing coffee and supporting farmers with loans (Starbucks, 2019). PepsiCo issued a $1 billion green bond in 2019 (PepsiCo, 2019). Its proceeds were used to address the company’s carbon emissions, access to clean water, and plastic waste (PepsiCo, 2020) Projects included creating 100% recycled polyethylene terephthalate (rPET) packaging for PepsiCo’s Tazo, Naked, and Lifewtr brands, as well as installing solar power at its new campus (PepsiCo, 2020). Apple, Toyota, and Verizon have also joined the list of companies to issue green bonds in recent years. 6.3 Case Study 3: Applying Financial Incentives to Combined Heat and Power Project at Facility A
In 2020, OSC reviewed the financial impacts of a CHP project at Facility A that was ultimately rejected. The project relied upon financial incentives offered through the Massachusetts Alternative Portfolio Standard program, but there was some concern that future changes to the program may reduce support for CHP projects, so the plan was tabled. Our team revisited this proposal to understand why it was rejected and identify other financing sources or mechanisms that could justify such an investment in the future.
CHP is an energy-efficiency technology in which electricity is generated at the site of consumption and excess heat created in the process can be used for other applications on-site,

47
such as space heating, water heating and industrial processes. By using some of the nearly two-thirds of energy wasted in the form of heat discharged to the atmosphere in traditional electricity generation, and my avoiding distribution losses by generating and using electricity in the same location, CHP systems can achieve efficiencies of over 80%, compared to 50% for conventional technologies (EPA, 2019). These improved efficiencies typically result in reduced emissions, especially in areas of the United States where the electricity grid uses fewer renewable and low-emissions sources of energy.
Incentives factored into the finances of the CHP project at Facility A were solely from the Massachusetts Alternative Portfolio Standard (APS) requirements. To meet minimum standards each year, the state of Massachusetts was required to add at least 13.5 MW per year of new CHP installations from 2015–2020. New CHP systems can be subsidized by generating alternative energy credits (AECs). AECs work by creating a market where any heat and power generated beyond the needs of the system can be sold as a credit. Recent estimates place the value of AECs at approximately $20 each (Mass.gov, 2020).
OSC sought a quote for a CHP project at Facility A in 2019 from Waldron Engineering and Construction. According to the financial information in the estimate provided by Waldron, the project was forecasted to generate $1,086,568 in AECs annually. Without accounting for AECs, the annual cost of the CHP project would be approximately $321,964. With AECs, the estimated annual savings from the CHP project would be approximately $764,603. The cost savings in the Waldron financials relied on a financing plan that spread the cost of the CHP facility over several years, the details of which were not included in the provided documents.
Waldron also estimated that the new project would result in a reduction of electricity consumption at Facility A from 31,746,639 kWh to 2,453,392 kWh, while increasing natural gas consumption from 370,744 million BTUs (MMBtu) to 507,639 MMBtu. Our team used Accuvio to model the projected change in annual emissions should Facility A replace its current electricity and natural gas purchases with the on-site CHP system. Based on the figures provided in the Waldron quote, the CHP project would reduce Facility A’s annual GHG emissions by 1,847 tonnes, a 6.3% annual reduction. By comparison, the State of Massachusetts Department of Energy Resources estimates that on-site natural gas CHP projects reduce emissions by an average of 17% annually (Mass.gov, 2020).
Massachusetts is currently undergoing a third-party review of their APS policy. Initial feedback from the review suggests that the program may cease to support CHP projects in the future. This is because, according to the review, CHP projects are already economically viable without the support of APS, particularly when developed with support from the federal Investment Tax Credit (ITC) program. Because of this, the uptake rate under APS has been higher than expected, and supply is outpacing demand for AECs from CHP projects. However, no formal moves have yet been made to remove CHP from APS eligibility in Massachusetts (Daymark Energy Advisors, 2020). By revisiting the standards under which projects are approved, OSC could potentially justify investment in the CHP project, even without AECs. The Waldron quote demonstrated energy cost savings in year 1 when applying AECs, factoring in a financing plan that spread the $20,400,000 cost of installing the system into annual payment of $1,995,950 (Table 12). The number of periods in this payment plan was unclear from the pro forma we reviewed. But our team found that, when discounting the future cash outflows of the CHP project at a discount rate of 12%, a figure that was confirmed by the OSC finance team, the project would begin to

48
generate a net savings to OSC in year 7, even without the revenue streams provided by AECs. With AECs incorporated, the project generates savings beginning in year 6. Additionally, the quote provided by Waldron did not factor in the up-front savings that could be attained by taking advantage of federal ITCs, which would offset the cost of the project with a tax credit valued at 10% the cost of the project (DSIRE, 2020). With ITC applied, the present value of the cash outflows of the project begin to show a savings at year 6, identical to the payoff timing of the project inclusive of AECs. Table 12: CHP Scenario with AECS, ITC, and neither.
Application of an internal carbon pricing mechanism could further assist in economic
justification of CHP and other efficiency and emissions-reduction projects.

49
7. Communications Plan 7.1 Internal Communications
Concluding our analysis, we presented our study goals, methods and key findings and recommendations to OSC senior leadership1. The detailed presentation outline for leadership can be found in Appendix H. The main goal of internal communication to leadership is to show the importance of pursuing clear sustainability goals by elaborating on the specific business risks for OSC from competitors, customers, and potential for new regulations on carbon emissions. In addition, the presentation directs OSC toward potential actions to include in an emission reduction plan for Scopes 1 and 2 emissions, as well as specific mitigation strategies and financial strategies that could be considered. 7.2 External Communications Strategy
The initial step for external communication is a press release on OSC’s new commitment to GHG mitigation. We have prepared a press release that can be found in Appendix J to publicly announce Ocean Spray’s commitment to SBTi, if the company decides to pursue that goal. The commitment goal, formatted as (X% reduction of GHG emission for Scopes 1, 2, and 3 by year X), is developed based on the GHG Emissions Reduction Timeline for Net Zero under 1.5°C scenario for Ocean Spray. This goal can be adjusted if needed after comprehensive feasibility discussions with leadership, technicians, and grower-owners. According to our recommendations in Section 8.5, an absolute goal target over 10-15 years in line with the 1.5°C scenario is best for securing the reputation and a responsible footprint reduction for OSC. Therefore, the year 2034 was selected as the goal year. The format of the external communication follows the previous press releases for OSC. 8. Conclusions 8.1 Key Findings Cranberries are highly susceptible to climate change. Increased variability and severity of temperature and precipitation changes may lead to non-viable growing conditions in certain regions where cranberries are traditionally grown. Many of OSC’s farmers are small family farms. These farms have been in operation for generations, and many plan on continuing for generations to come. Unfortunately, climate change may threaten these family businesses with decreased crop yields and decreased value. Although there is currently a surplus of cranberry product on the market, this could quickly change if a late frost killed flower buds across an entire growing region. The majority of OSC’s Scope 1 and 2 emissions from Manufacturing and Receiving facilities come from electricity accounting for about 94% of total Scope 2 emissions or 43% of total Scope 1 and 2 emissions). The United States’ electricity grid is not homogenous, and certain grids are more carbon-intensive than others. The grid that each facility or farm is located on must be considered when creating an emissions reduction strategy. Some regions, such as the Pacific Northwest, may want to focus on reducing their Scope 1 emissions because their grid
1 The senior leadership we presented to included Senior VP R&D and Sustainability, Director Engineering and Product Development, Director Health Science, Nutrition, and Regulatory Affairs, Director Food Safety and Quality Assurance, Senior Manager Packaging Development, Senior Manager R&D Data Systems, Consumer Affairs Manager, Assistant Sustainability Manager, Executive Assistant.

50
already has a high percentage of clean energy. Other regions, such as the Midwest (and especially Wisconsin) may want to focus their efforts more strongly on sourcing out cleaner energy sources or switching to on-site solar resources, if available. It is also important to note that while switching equipment from diesel or gasoline to electric can reduce emissions, the new electric appliance is only as “green” as the grid that it is located in. OSC’s manufacturing facilities have significantly higher emissions than the receiving facilities. Part of this is intuitive, as the receiving facilities are primarily active during harvest season, and manufacturing facilities operate at a similar capacity throughout the entire year. At the same time, there are the same number of receiving facilities as manufacturing facilities, so they are all processing similar amounts of product. Although it is important to reduce emissions across all sectors of OSC’s supply chain, we suggest that OSC focus efforts on first reducing the carbon footprint of the manufacturing facilities. After interviewing all of the plant managers at OSC’s manufacturing facilities, we noticed that most of OSC’s sustainability and efficiency projects have been lighting upgrades to LED lighting. This is a good first step to reducing emissions, and it is something that is easy to implement and duplicate across all facilities. We also observed that a few facilities still did not see this project as economically feasible, due to a longer payback period. This is mildly concerning, as switching to LED lightbulbs is considered a “low-hanging fruit” sustainability project.
Underpinning the challenges to advancing sustainability at OSC is the expected ROI at the company. While completed projects at OSC focus on maintaining or improving safety and productivity within a three-year payback period, we observed support among the manufacturing facilities for projects that would improve facilities’ sustainability. However, while the three-year ROI isn’t codified into company policy, proposed projects that would have resulted in greater environmental efficiency have been rejected in favor of less-sustainable projects with a shorter payback period. This leads to dampening enthusiasm for sustainability-aligned projects. Ultimately, sustainability is incidental, rather than a criterion.
As discussed in this report, beyond the implications of climate change on the planet and the supply chain, with growing reputational risks and oncoming regulation of environmental impacts, sustainability must be incorporated into decision-making criteria. In recent years, the Task Force on Climate-Related Financial Disclosures (TCFD) has developed recommendations for climate-related disclosures for greater market transparency. This standard of disclosures has implications on OSC’s business, including insurance underwriting and access to capital. Adjusting ROI standards such that they are inclusive of sustainability and emissions concerns insulates OSC in a low-carbon economy, turning risks into opportunities.
8.2 Recommendations 8.2.1 Data Processing and Collection Improvements
The current process for data upload and entry into the Accuvio software consists of data managers who work at the manufacturing and receiving facilities. Data managers are expected to upload data on a monthly, quarterly, or yearly basis depending on the type of data. However, we recommend an additional level of support be provided for the data managers. During the GHG inventory conducted by our team, we found that many of the data managers were overwhelmed with the upload and often required additional support from us to complete the upload. We suggest that someone that reports to the Sustainability Team be assigned to help upload and

51
check data as it is entered in Accuvio. We recommend this individual review all data uploads to ensure there are no mistakes such as duplicate data or missing data. In addition to providing upload support, we recommend that yearly or twice yearly Accuvio training for data managers be provided.
In order to ensure more accurate data collection and, therefore, more accurate emission calculations, we recommend obtaining data by what is utilizing fuel (e.g., forklifts, boiler, trucks) instead of in big categories like diesel, propane, and natural gas. This will allow OSC and the manufacturing and receiving facilities to track which pieces of equipment are using the most fuel. We also recommend more detailed information on waste, such as what items are in the dumpsters that only get picked up monthly from receiving facilities, even if this is just a weight estimate. We also recommend installing meters on well water connects at the facilities that are not on city water to get accurate numbers of water consumption.
We recommend conducting yearly audits of all Accuvio data. Audits should be conducted by a third party that specializes in conducting audits of GHG inventories. GHG audits are informative and can help ensure there are no data gaps in the inventory.
8.2.2 Additional Data Collection
One of the barriers to more specific mitigation strategies was the lack of access to energy consumption details. We were unable to identify specific energy-intensive processes outside of each facility general emissions activity. We could identify that most emissions came from electricity consumption, for example, but were not able to identify the cause of that consumption. We recommend that OSC conduct audits (or install smart and sub metering on equipment and production lines) in the future to pinpoint how much energy specific appliances consume. As an example, we recommend an audit to figure out the number of light fixtures and lighting technologies (e.g., linear fluorescents, LEDs, halogen, etc.) in a facility. This would allow for a true cost and energy consumption comparison between currently installed fixtures and the impact of replacing them with LED lights. Similar audits could be done to measure the energy consumption of dryers and refrigerators. We also recommend conducting surveys of each building's envelope to assess insulation, windows, and infiltration areas particularly in older manufacturing facilities so they can be improved. 8.2.2.1 Possible Composting Practices at Facility E
Facility E expressed great interest in composting. Unfortunately, due to their remote location and lack of access to a single entity that could handle their capacity, they have not been able to start a composting program. The cost to haul one ton of compost is currently cost-prohibitive, especially when compared with the cost of landfilling that waste. We recommend further research into other facilities that could utilize their compost and to research ways to reduce the cost of composting. Food waste made up 24% of landfilled municipal solid waste in 2018 (National Overview: Facts and Figures on Materials, Wastes and Recycling, 2020), where it generates methane as it decomposes. Methane is a potent greenhouse gas that has a global warming potential that is 28 to 36 times that of carbon dioxide (EPA, 2020).
8.3 Future Work: Scope 3 Emissions
During the course of the project, some basic Scope 3 emissions data were collected. This included data collected in 2020 from OSC farms and historical data from 2008 that included

52
other suppliers in OSC’s value chain. Given our preliminary findings of this data, Scope 3 is a large portion of OSC’s emissions and likely comprises a significant portion of its emissions. For comparison, a 2019 GHG Protocol guidance document focused on U.S. dairy cooperatives estimated that over half of the industry’s emissions were generated on-farm, and as an upstream supplier for dairy cooperatives, these activities fall under Scope 3 (Innovation Center for U.S. Dairy, 2019). However, further data collection is required to determine an accurate emission number from all farms within OSC’s supply chain and more recent data would be needed to determine the emissions from the other parts of OSC’s supply chain. In order to be prepared for external requests for OSC’s footprints, such as Walmart’s supply chain surveys, and to better understand its own footprint and areas for improvement, we recommend OCS collect data on Scope 3 at a regular interval going forward. Collecting Scope 3 data every few years would allow OSC to set a baseline and track emissions in a reliable manner and empower it to begin to address Scope 3 reductions. 8.3.1 Farm Data Collection
Conducting a thorough and accurate accounting of Scope 3 emissions is important for any company that seriously wants to reduce its carbon emissions, but will be particularly critical for OSC since the farmers that constitute the cooperative fall under Scope 3. As noted before, “if a company’s relevant and mandatory scope 3 emissions are 40% or more of total scope 1, 2, and 3 emissions, a scope 3 target is required” (SBTi, 2020). While the underlying data is unverified, data collected from OSC’s Farm Stewardship Assessment suggest that OSC’s farms contributed 328, 601 tonnes of CO2e in 2019 (Scope 3 and Biomass emissions). The information collected through this informal assessment was a good start, but more stringent measures of data collection and verification are necessary to paint a complete picture of emissions generated by farm activity.
We recommend developing and implementing a process to collect emissions-generating activity data from all farmers on, at minimum, an annual basis for upload to Accuvio. These figures should be supported by documentation and, ideally, subject to audit to ensure completeness and accuracy. Expectations for scope, formatting, emissions activity definitions and units of data collected should be clearly communicated to representatives from each grower-owner to ensure uniform data submission.
Relying on the same data collection mechanism as the Farm Stewardship Assessment in the future will be insufficient to produce a reasonable, reliable emissions estimate for OSC’s farms. The assessment was long and involved, with emissions-related questions constituting only a small part of the survey. Instituting a separate, regular practice of collecting emissions activity data from farms will underscore the particular importance of gathering this data and ensure that respondents prioritize submitting accurate and complete data, rather than experiencing potential “survey fatigue” from completing a long, multi-topic survey each year.
Additionally, the results obtained from normalizing and scaling the activity and fuel usage data from the assessment on a per-barrel basis raise some questions that undermine the accuracy of the collected data. For example, per-barrel electricity usage averages in OSC’s Canadian farming regions — Quebec/New Brunswick/Nova Scotia and British Columbia/Northern Washington — were significantly higher at 8.25 kWh and 12.56 kWh, respectively, than the OSC total average of 3.77 kWh. This resulted in much higher emissions generated from electricity consumption in these two regions than any of the other growing

53
regions, despite their relatively lower quantities of cranberry barrels delivered to OSC in 2019. This suggests that there are inconsistencies in data submissions between regions and individual farms that cast doubt on the reliability of the projected emissions data.
We recommend that OSC prioritize more stringent and standardized data collection policies for its grower-owners for a few reasons. With large, business-critical customers like Walmart demanding more transparency from their suppliers regarding emissions, OSC could be placed at a competitive disadvantage by not having an accurate understanding of the emissions generated by its farms. Second, if OSC hopes to adopt a comprehensive and aggressive emissions reduction strategy, accurate accounting of grower-owner emissions will be necessary. With the activities on OSC farms likely constituting a significant portion of OSC’s Scope 3 emissions, they will also represent a significant portion of opportunities for emissions reduction and potentially carbon sequestration solutions down the road. Without knowing where and how these emissions are generated, and in what quantities, with a significant degree of confidence, mitigating them will be impossible.
8.4 Corporate Cultural Shift To achieve emissions reductions at a significant scale, OSC requires company-wide participation and top-level support for sustainability investments. While sustainability projects have been explored in the past, they haven’t been able to clear the three-year ROI threshold that originates from OSC corporate; as a result, such projects are not prioritized over competing demands. This not only prevents those projects from being completed but slows down future sustainability efforts as such projects are seen as not feasible. To signal clear support for sustainability projects, OSC must reconsider the criteria by which it judges capital investment proposals. We recommend using an internal carbon price to achieve this. An internal carbon price will reorient incentives when the company and individual facilities are considering investment projects, leading to greater overall energy efficiency and fewer emissions. To implement an ICP, Carbon Pricing Unlocked — a partnership between climate consultancy Ecofys, sustainability advocacy initiative Generation Foundation, and CDP (formerly Carbon Disclosure Project) — recommends a four-step process (Ecofys, et al.):
1. Engage the business on ICP 2. Design a best practice ICP approach 3. Roll out the ICP approach 4. Monitor and evaluate the ICP approach
Currently, OSC has initiated steps 1 and 2. The first step calls for engaging stakeholders throughout the business, establishing clear goals and objectives, and developing a business case for ICP. The second step calls for gathering detailed information to help design the ICP approach, which encompasses GHG accounting, and thoroughly understanding emissions drivers and decision-making processes. This information is used to determine an implementation strategy, for example, a shadow price or an internal carbon fee. Framework from Yale School of Forestry and Environmental Studies can also support an ICP implementation plan. This framework includes the following questions (Addicott, et al.):
● How will carbon be priced? ● How much will be charged?

54
● How often is the charge assessed? ● Is the money returned? ● What is the return mechanism? ● Is the money earmarked or unrestricted?
Using these tools will allow OSC to create an ICP that best aligns with OSC’s reduction goals. However, it is critical that this initiative receives high-level and comprehensive support. 8.5 Science Based Targets Initiative
The SBTi has become an industry recognized norm for setting responsible emissions reduction goals. With a quarter of food and beverage companies examined for this study already having committed to SBTs, OSC should commit to SBTs in order to maintain standing as an industry sustainability leader. At this time, if OSC were to commit to SBTs, it would be the first fruit cooperative to commit, making it stand out among farming competitors. With regulation and buyer reporting requests on the horizon, setting SBTs and getting it approved will ensure OSC is following the strictest standards and will be in line with requests from governments or buyers. Though the timeline for regulations or buyer requests is unknown, by setting an absolute target within 1.5 degrees Celsius over ten or fifteen years, OSC will secure both its reputation and a responsible footprint reduction. A 2-degree Celsius goal would also be acceptable, though would not support OSC meeting the strictest standards. Ultimately, publicly committing to SBTs will continue to signal to OSC’s value chain and customers that as a company it is continuing to prioritize the sustainable health of people and the planet, while providing top quality products consumers know and love.

55
References Accuvio User Manual, 1.1 - Technical Background Information and Calculation
Methodologies. Addicott, Ethan, Alhasan Badahdah, Luke Elder, and Weiliang Tan. “Internal Carbon
Pricing: Policy Framework and Case Studies.” Yale School of Forestry and Environmental Studies. 2019. https://cbey.yale.edu/programs/internal-carbon-pricing-policy-framework-and-case-studies.
Aji, H.M. and B. Sutikno. “The extended consequence of greenwashing: Perceived
consumer skepticism.” International Journal of Business and Information 10, no. 4 (2015): 433.
Allcott, H., and M. Greenstone. “Is there an energy efficiency gap?” Journal of Economic Perspectives 26, no. 1 (2012): 3-28.
Allen, Myles, Heleen de Coninck, Francois Engelbrecht, Marion Ferrat, James Ford, Sabine Fuss, Nigel Hawtin, Ove Hoegh Guldberg, Daniela Jacob, Debora Ley, et al. “Special Report 15: Frequently Asked Questions.” Intergovernmental Panel on Climate Change. 2019. https://www.ipcc.ch/site/assets/uploads/sites/2/2019/05/SR15_FAQ_Low_Res.pdf.
Alliance 54. “Green Bonds Attract Private Sector Climate Finance.” Last modified June
11, 2015. http://alliance54.com/green-bonds-attract-private-sector-climate-finance/. American Petroleum Institute. "Nonrenewable Energy Resources.” Api.Org. Accessed
October 20, 2020. https://www.api.org/oil-and-natural-gas/consumer-information/in-the-classroom/energy-resources/nonrenewable-energy-resources.
Anderson, B., and T. Bernauer. “How much carbon offsetting and where? Implications of
efficiency, effectiveness, and ethicality considerations for public opinion formation.” Energy Policy, 94 (2016): 387–395. https://doi.org/10.1016/j.enpol.2016.04.016
Angel, J., C. Swanston, B.M. Boustead, K.C. Conlon, K.R. Hall, J.L. Jorns, K.E. Kunkel,
M.C. Lemos, B. Lofgren, T.A. Ontl, et al. “Midwest. In Impacts, Risks, and Adaptation in the United States: Fourth National Climate Assessment, Volume II.” Washington D.C.: U.S. Global Change Research Program. (2018): 872–940.
“Apply to the APS: CHP, Flywheel Storage, and Fuel Cells.” Mass.gov. Accessed
December 28, 2020. https://www.mass.gov/guides/apply-to-the-aps-chp-flywheel-storage-and-fuel-cells.
Armstrong, Charles. "Cranberries And A Changing Climate". 2016.
https://extension.umaine.edu/cranberries/wp-content/uploads/sites/40/2020/04/Cranberries-and-a-Changing-Climate-opt.pdf.

56
Barber, David. “Diesel Fuel Vs. Home Heating Oil”, Sciencing.com. Last modified January 9, 2018. https://sciencing.com/about-6726131-diesel-vs--home-heating-oil.html.
Bachram, H. (2004). “Climate fraud and carbon colonialism: the new trade in greenhouse
gases.” Capitalism Nature Socialism 15, no. 4 (2004): 5-20.
Barker, Richard, Robert G. Eccles, and George Serafeim. “The Future of ESG is… Accounting?” Harvard Business Review. Last modified December 3, 2020. https://hbr.org/2020/12/the-future-of-esg-is-accounting.
Beymer-Farris, B.A., and T.J. Basset. “The REDD menace: Resurgent protectionism in Tanzania's mangrove forests.” Global Environmental Change 22, no. 2 (2012): 332-341.
Bergmann, A., J.N. Rotzek, M. Wetzel, and E. Guenther. “Hang the low-hanging fruit
even lower-Evidence that energy efficiency matters for corporate financial performance.” Journal of Cleaner Production 147 (2017): 66-74
Biden-Harris Administration. “Climate Plan.” Accessed November 5, 2020.
https://joebiden.com/climate-plan/#. Biggs, Chris, Shalini Unnikrishnan and Nidhi Singh. “Sustainability Matters Now More
Than Ever for Consumer Companies.” BCG. Last modified August 11, 2020. https://www.bcg.com/en-us/publications/2020/sustainability-matters-now-more-than-ever-for-consumer-companies.
Bolger, Andrew and Scheherazade Daneshkhu. “Unilever Issues £250m Green Bond.”
Financial Times. Last modified March 19, 2014. https://www.ft.com/content/b3ea447a-af59-11e3-9cd1-00144feab7de.
“Business Energy Incentive Tax Credit (ITC).” Database of State Incentives for
Renewables and Efficiency (DSIRE). Accessed December 14, 2020. https://programs.dsireusa.org/system/program/detail/658.
CDP. “The Carbon Trust. Cascading Commitments: Driving Ambitious Action through
Supply Chain Engagement.” 2019. https://6fefcbb86e61af1b2fc4-c70d8ead6ced550b4d987d7c03fcdd1d.ssl.cf3.rackcdn.com/cms/reports/documents/000/004/072/original/CDP_Supply_Chain_Report_2019.pdf?1550490556.
“Carbon Pricing”. United Nations. Accessed December 20, 2020. https://www.unglobalcompact.org/take-action/action/carbon.
Christie, Richard, Bruce Wollenberg, and Ivan Wangensteen. "Transmission
Management In The Deregulated Environment". Proceedings Of The IEEE, 88, no. 2 (2000): 170-195. https://ieeexplore.ieee.org/stamp/stamp.jsp?tp=&arnumber=823997.

57
The Coca-Cola Company. “Sustainable Business: Science Based Targets.” Accessed December 11, 2020. https://www.coca-colacompany.com/sustainable-business/climate/science-based-targets.
Dahlmann, F., L. Branicki, L., and S. Brammer. “Managing Carbon Aspirations: The
Influence of Corporate Climate Change Targets on Environmental Performance.” Journal of Business Ethics 158, no. 1 (2019): 1–24. https://doi.org/10.1007/s10551-017-3731-z
Daymark Energy Advisors. “Alternative Energy Portfolio Standard Review.” October 30,
2020. https://www.mass.gov/doc/alternative-energy-portfolio-standard-review/download. DSIRE. "Database of State Incentives for Renewables and Efficiency. 3rd Party Solar
PPA Policies - DSIRE". DSIRE. Last modified March 2, 2015. http://www.dsireusa.org/resources/detailed-summary-maps/3rd-party-ppa_0302015-2/.
Davis, Chantal and Kelly Levin. “What Does "Net-Zero Emissions" Mean? 6 Common
Questions, Answered.” World Resources Institute. Last modified August 12, 2020. https://www.wri.org/blog/2019/09/what-does-net-zero-emissions-mean-6-common-questions-answered
Delaney, Meghin. “Gov. Sisolak launches new State of Nevada Climate Initiative”.
NV.gov. Last modified August 24, 2020. https://gov.nv.gov/News/Press/2020/Gov__Sisolak_launches_new_State_of_Nevada_Climate_Initiative/
Delmas, M.A., and V.C. Burbano. “The Drivers of Greenwashing.” California
management review 54, no. 1 (2011): 64-87.
Denchak, Melissa. “Greenhouse Effect 101.” National Resource Defense Council. Last modified July 16, 2019. https://www.nrdc.org/stories/greenhouse-effect-101.
Denchak, Melissa. 2017. “Global Climate Change: What You Need to Know.” National
Resource Defense Council. Last modified February 23, 2017. https://www.nrdc.org/stories/global-climate-change-what-you-need-know..
Dragomir, V. D. “The disclosure of industrial greenhouse gas emissions: A critical
assessment of corporate sustainability reports.” Journal of Cleaner Production (2012): 29–30, 222–237. https://doi.org/10.1016/j.jclepro.2012.01.024
Dupigny-Giroux, L.A., E.L. Mecray, M.D. Lemcke-Stampone, G.A. Hodgkins, E.E. Lentz, K.E. Mills, E.D. Lane, R. Miller, D.Y. Hollinger, W.D. Solecki, et al. “Northeast. In Impacts, Risks, and Adaptation in the United States: Fourth National Climate Assessment, Volume II.” Washington D.C.: U.S. Global Change Research Program. (2018): 669–742.

58
Ecofys, The Generation Foundation, and CDP. “How-to guide to corporate internal carbon pricing - Four dimensions to best practice approaches.” December 2017. http://b8f65cb373b1b7b15feb-c70d8ead6ced550b4d987d7c03fcdd1d.r81.cf3.rackcdn.com/cms/reports/documents/000/002/740/original/cpu-2017-how-to-guide-to-internal-carbon-pricing.pdf?1521554897
EIA. “Battery Storage in the United States: An Update on Market Trends.” EIA. 2020.
https://www.eia.gov/analysis/studies/electricity/batterystorage/pdf/battery_storage.pdf. EIA. "Delivery To Consumers". 2020. EIA. Accessed November 1, 2020.
https://www.eia.gov/energyexplained/electricity/delivery-to-consumers.php. EIA. “Electricity in the U.S.” EIA. 2020. Accessed October 25, 2020.
https://www.eia.gov/energyexplained/electricity/electricity-in-the-us.php.
Ellwood, Elizabeth R., Susan R. Playfair, Caroline A. Polgar, and Richard B. Primack. "Cranberry Flowering Times And Climate Change In Southern Massachusetts". International Journal Of Biometeorology, 58, no. 7 (2013): 693-1697. doi:10.1007/s00484-013-0719-y.
EPA. “An Introduction to Environmental Accounting As A Business Management Tool:
Key Concepts And Terms.” EPA. 1995. https://www.epa.gov/sites/production/files/2014-01/documents/busmgt.pdf
EPA. “Green Power Partnership National Top 100.” EPA. Last modified January 25, 2021. https://www.epa.gov/greenpower/green-power-partnership-national-top-100.
EPA. “National Overview: Facts and Figures on Materials, Wastes and Recycling.” EPA.
Last modified November 20, 2020. https://www.epa.gov/facts-and-figures-about-materials-waste-and-recycling/national-overview-facts-and-figures-materials
EPA. “Power Profiler.” EPA. Accessed March 29, 2021.
https://www.epa.gov/egrid/power-profiler#/. EPA. "Power Profiler Methodology, Terms And Calculations". EPA. Last modified
December 1, 2018. https://www.epa.gov/sites/production/files/2018-12/documents/power_profiler_terms_calculations_and_data_sources_12-1-2018.pdf.
EPA. "Renewable Energy Certificate (REC) Arbitrage". 2017. EPA. Accessed October
23, 2020. https://www.epa.gov/sites/production/files/2017-09/documents/gpp-rec-arbitrage.pdf. EPA. “Sources of Greenhouse Gas Emissions”. 2018. EPA. Accessed April 13, 2021.
https://www.epa.gov/ghgemissions/sources-greenhouse-gas-emissions.
EPA. “Understanding Global Warming Potentials.” EPA. Accessed October 1, 2020. https://www.epa.gov/ghgemissions/understanding-global-warming-potentials.

59
EPA. "U.S. Electricity Grid & Markets | US EPA". EPA. Accessed October 27, 2020.
https://www.epa.gov/greenpower/us-electricity-grid-markets. EPA. “What Is CHP?,” EPA. Last modified May 13, 2019. Accessed December 14, 2020.
https://www.epa.gov/chp/what-chp. European Commission. “EU climate action and the European Green Deal.” Accessed
November 5, 2020. https://ec.europa.eu/clima/policies/eu-climate-action_en. Fink, Larry. “CEO Letter: A Fundamental Reshaping of Finance.” Accessed October 24,
2020. https://www.blackrock.com/us/individual/larry-fink-ceo-letter. Flammer, Caroline. “Green Bonds Benefit Companies, Investors, and the Planet.”
Harvard Business Review. Last modified November 22, 2018. https://hbr.org/2018/11/green-bonds-benefit-companies-investors-and-the-planet.
Flammer, Caroline. “Corporate Green Bonds Benefit Both Companies and the
Environment.” The FinReg Blog, Global Financial Markets Center Duke University School of Law. July 21, 2020. https://sites.law.duke.edu/thefinregblog/2020/07/21/corporate-green-bonds-benefit-both-companies-and-the-environment.
The Food and Agriculture Climate Alliance. “Rising to the Climate Challenge.” Accessed
November 1, 2020. https://agclimatealliance.com/files/2020/11/faca_recommendations.pdf "Frequently Asked Questions | Massachusetts Cranberries". Cranberries.Org. Accessed
October 15, 2020. https://www.cranberries.org/faqs.
FAO. “Climate-Smart Agriculture.” Food and Agriculture Organization of the United Nations (FAO). Accessed December 15, 2020. http://www.fao.org/climate-smart-agriculture.
Funk, Cary and Brian Kennedy. “How Americans see climate change and the environment in 7 charts.” April 21, 2020. https://www.pewresearch.org/fact-tank/2020/04/21/how-americans-see-climate-change-and-the-environment-in-7-charts/.
Gareau, B.J., X. Huang, and T.P. Gareau. “Social and ecological conditions of cranberry
production and climate change attitudes in New England.” Plos one, 13 no. 12 (2018).
Greenhouse Gas Protocol. “FAQ.” Accessed October 15, 2020. https://www.ghgprotocol.org/sites/default/files/standards_supporting/FAQ.pdf
Greenhouse Gas Protocol. “GHG Protocol Agricultural Guidance.” April 25, 2020. https://ghgprotocol.org/agriculture-guidance.

60
Greenhouse Gas Protocol. “Global Warming Potential Values.” Accessed March 18, 2021. https://www.ghgprotocol.org/sites/default/files/ghgp/Global-Warming-Potential-Values%20%28Feb%2016%202016%29_1.pdf.
Giesekam, J., J. Norman, A. Garvey, and S. Betts-Davies, “Science-Based Targets: On
Target?” Sustainability 13, no. 4 (2021): 1657. Goldstein, A. (2015). “The Bottom Line: Taking Stock of the Role of Carbon Offsets in
Corporate Carbon Strategies.” Ecosystem Marketplace. Last modified March 19, 2015. https://www.forest-trends.org/publications/the-bottom-line/.
Gowda, P., J.L. Steiner, C. Olson, M. Boggess, T. Farrigan, and M.A. Grusak.
“Agriculture and Rural Communities. In Impacts, Risks, and Adaptation in the United States: Fourth National Climate Assessment, Volume II.” 2018. Washington D.C.: U.S. Global Change Research Program (2018): 391–437.
Hand, M.M., S. Baldwin, E. DeMeo, J.M. Reilly, T. Mai, D. Arent, G. Porro, M. Meshek,
and D. Sandor. “Renewable electricity futures study.” National Renewable Energy Lab (NREL) 1, (2012): No. NREL/TP-6A20-52409-1.
"How Cranberries Grow: Pollination | Massachusetts Cranberries." Cranberries.Org. Accessed October 15, 2020. https://www.cranberries.org/how-cranberries-grow/pollination.
IFC. “Mobilizing Private Climate Finance- Green Bonds and Beyond.” 2016. https://www.ifc.org/wps/wcm/connect/2996f197-a75b-422a-9e2f-cdc022d8ea96/EMCompass+Note+25+Green+Bonds+FINAL+12-5.pdf?MOD=AJPERES&CVID=lzgXSmr
IPCC. “Special Report: Global Warming of 1.5” 2018. https://www.ipcc.ch/sr15/ IPCC. "About — IPCC". Accessed October 1, 2020. https://www.ipcc.ch/about/. Innovation Center for U.S. Dairy . “Scope 3 GHG Inventory Guidance for U.S. Dairy
Cooperatives and Processors.” Greenhouse Gas Protocol. November 2019. https://ghgprotocol.org/sites/default/files/Scope_3_Handbook_2019_FINAL%20%2811%29_0.pdf.
Interagency Working Group on Social Cost of Greenhouse Gases. “Technical Update of
the Social Cost of Carbon for Regulatory Impact Analysis -Under Executive Order 12866. United States Government.” August 28, 2016. https://obamawhitehouse.archives.gov/sites/default/files/omb/inforeg/scc_tsd_final_clean_8_26_16.pdf
61
“Internal Carbon Pricing.” Center for Climate and Energy Solutions. Accessed December 20, 2020. https://www.c2es.org/content/internal-carbon-pricing.
Jennifer Bowe, phone conversation with authors, June 16, 2020. Joanne Kovaloski, phone conversation with authors, April 17, 2020. Krabbe, O., G. Linthorst, K. Blok, W. Crijns-Graus, D.P. Van Vuuren, N. Höhne, and
A.C. Pineda. “Aligning corporate greenhouse-gas emissions targets with climate goals.” Nature Climate Change 5, no. 12 (2015): 1057-1060.
Kalla, Helen. “Governor Sisolak Signs Bill to Raise Nevada’s Renewable Portfolio
Standard To 50% By 2030.” NV.gov. Last modified April 22, 2019. https://gov.nv.gov/News/Press/2019/Governor_Sisolak_Signs_Bill_to_Raise_Nevada%E2%80%99s_Renewable_Portfolio_Standard_To_50__By_2030/#
Kansal, Rachit. "Virtual Power Purchase Agreement". Rocky Mountain Institute. 2019. https://rmi.org/insight/virtual-power-purchase-agreement/#.
Kent, Christopher. "Introduction To Virtual Power Purchase Agreements". EPA. 2016.
https://www.epa.gov/sites/production/files/2016-09/documents/webinar_kent_20160928.pdf. Kragt, M. E., N.P. Dumbrell, and L. Blackmore. “Motivations and barriers for Western
Australian broad-acre farmers to adopt carbon farming.” Environmental Science & Policy 73, (2017): 115-123.
Kronthal-Sacco, Randi and Tensie Whelan. “Research: Actually, Consumers Do Buy
Sustainable Products.” Harvard Business Review. Last modified June 19, 2019. https://hbr.org/2019/06/research-actually-consumers-do-buy-sustainable-products.
Lee, S. Y. (2012). “Corporate carbon strategies in responding to climate change.” Business Strategy and the Environment 21, no. 1 (2012): 33-48.
Liesen, A., A.G. Hoepner, D.M Patten, and F. Figge. “Does stakeholder pressure
influence corporate GHG emissions reporting? Empirical evidence from Europe.” Accounting, Auditing & Accountability Journal 28 no. 7 (2015): 1047–1074. https://doi.org/10.1108/AAAJ-12-2013-1547
Lindsey, Rebecca. 2020. "Climate Change: Atmospheric Carbon Dioxide | NOAA
Climate.Gov". Climate.Gov. Last modified August 14, 2020. https://www.climate.gov/news-features/understanding-climate/climate-change-atmospheric-carbon-dioxide.
Marcacci, S. (2020, January 21). Renewable Energy Prices Hit Record Lows: How Can
Utilities Benefit From Unstoppable Solar And Wind? Forbes.

62
https://www.forbes.com/sites/energyinnovation/2020/01/21/renewable-energy-prices-hit-record-lows-how-can-utilities-benefit-from-unstoppable-solar-and-wind/.
Masson-Delmotte, V, P Zhai, H.-O Portner, D. Roberts, J Skea, P.R. Shukla, and A. Pirani W. Moufouma-Okia et al. "Summary For Policymakers. In: Global Warming Of 1.5°C. Geneva: IPCC and World Meteorological Organization. 2018.
May C., C. Luce, J. Casola, M. Chang, J. Cuhaciyan, M. Dalton, S. Lowe, G. Morishima,
P. Mote, A. Petersen, G. Roesch-McNally, and E. York. “Northwest. In Impacts, Risks, and Adaptation in the United States: Fourth National Climate Assessment, Volume II.” Washington D.C.: U.S. Global Change Research Program. (2018): 1036–1100.
Metzger, Eliot. “Bottom Line on Corporate GHG Inventories.” World Resource Institute.
Last modified March 2008. https://www.wri.org/publication/bottom-line-corporate-ghg-inventories
Nestlé. “Nestlé accelerates action to tackle climate change and commits to zero net
emissions by 2050.” Last modified September 12, 2019. https://www.nestle.com/media/pressreleases/allpressreleases/nestle-climate-change-commitment-zero-net-emissions-2050?te=1&nl=dealbook&emc=edit_dk_20201203
New Hampshire Department of Revenue. “Formulas for Conversion.” Accessed
December 20, 2020. https://www.revenue.nh.gov/mun-prop/property/documents/timber-conversion-formulas.pdf
Nguyen, Terry. “More companies want to be ‘carbon neutral.’ What does that mean?”
Vox. Last modified June 16, 2020. https://www.vox.com/the-goods/2020/3/5/21155020/companies-carbon-neutral-climate-positive.
Nurunnabi, M., J. Esquer, N. Munguia, D. Zepeda, R. Perez, and L Velazquez. “Reaching
the sustainable development goals 2030: Energy efficiency as an approach to corporate social responsibility (CSR).” GeoJournal 85, no. 2 (2020): 363-374.
NV Energy. “NV GreenEnergy Rider program Frequently Asked Questions.” Accessed
December 20, 2020. https://www.nvenergy.com/publish/content/dam/nvenergy/brochures_arch/ngr/NGR-FAQs.pdf
NV Energy. “How To Read Your Bill RESIDENTIAL ELECTRIC AND/OR GAS
SERVICE.” Accessed December 20, 2020. https://www.nvenergy.com/publish/content/dam/nvenergy/brochures_arch/help/understand-your-bill/South-RES-flatrate-understand-your-bill.pdf.
Ocean Spray Cranberries, Inc. "Our Cranberry Harvest.” Accessed December 1, 2020.
.https://www.oceanspray.com/en/Our-Story/About-the-Harvest.

63
Ocean Spray Cranberries, Inc. “Our Leadership.” Accessed April 1, 2021. https://www.oceanspray.com/Our-Leadership.
Ocean Spray Cranberries, Inc. “Press Kit.” Accessed December 1, 2020.
https://news.oceanspray.com/?_ga=2.144049653.1324974693.1608175539-1275558133.1608175539.
Owusu, P. A., and S. Asumadu-Sarkodie. “A review of renewable energy sources,
sustainability issues and climate change mitigation.” Cogent Engineering, 3 no. 1 (2016). https://doi.org/10.1080/23311916.2016.1167990
“The Paris Agreement.” United Nations Framework Convention on Climate Change. Accessed November 15, 2020. www.unfccc.int/process-and-meetings/the-paris-agreement/what-is-the-paris-agreement
Pepsico. “PepsiCo Prices US$1 Billion Green Bond to Fund Key Sustainability Initiatives.” Last modified October 7, 2019. https://www.pepsico.com/news/press-release/pepsico-prices-us1-billion-green-bond-to-fund-key-sustainability-initiatives10072019.
Pepsico. “Pepsico 2020 Green Bond Relief.” Last modified October 2020.
https://www.pepsico.com/docs/album/esg-topics-policies/pepsico-2020-green-bond-report.pdf. Pinkse, J., and T. Busch. (2013). “The emergence of corporate carbon norms: Strategic
directions and managerial implications.” Thunderbird International Business Review 55, no. 6 (2013): 633-645.
Ponce, Roberto, Maria Blanco, and Carlo Giupponi. "The Economic Impacts Of Climate
Change On The Chilean Agricultural Sector. A Non-Linear Agricultural Supply Model". Chilean Journal Of Agricultural Research 74, no. 4 (2014): 404-412. Doi:10.4067/S0718-58392014000400005.
"Power Purchase Agreement | Better Buildings Initiative".
Betterbuildingssolutioncenter.Energy.Gov. Accessed November 15, 2020. https://betterbuildingssolutioncenter.energy.gov/financing-navigator/option/power-purchase-agreement
Prapanukool, Chawin, and Surachai Chaitusaney. "Designing Solar Power Purchase
Agreement Of Rooftop PVs With Battery Energy Storage Systems Under The Behind-The-Meter Scheme". Energies 13, no. 17 (2020): 4438. doi:10.3390/en13174438.
Prindle, W., and A. de Fontaine. “A survey of corporate energy efficiency strategies.”
ACEEE. 2009. https://www.aceee.org/files/proceedings/2009/data/papers/5_81.pdf. RE100. “RE100.” Accessed October 1, 2020. https://www.there100.org/.
https://betterbuildingssolutioncenter.energy.gov/financing-navigator/option/power-purchase-agreement

64
Reints, Renea. “Consumers Say They Want More Sustainable Products. Now They Have the Receipts to Prove It.” Fortune. Last modified November 5, 2019. https://fortune.com/2019/11/05/sustainability-marketing-consumer-spending/.
Regulatory Assistance Project. "Economics Of Wholesale Electricity Markets". Last
modified June 2018. https://www.raponline.org/wp-content/uploads/2018/06/rap-uva-rff-economics-wholesale-electricity-markets-2018-final.pdf.
S.B. 254, 80th Session. Nevada: Nevada Legislative Counsel Bureau, 2019. Accessed
December 20, 2020. https://www.leg.state.nv.us/App/NELIS/REL/80th2019/Bill/6431/Overview.
Science Based Targets. “SBTi Call to Action Guidelines.” Last modified April 2020. www.sciencebasedtargets.org/wp-content/uploads/2018/10/C2A-guidelines.pdf
Science Based Targets. “About Us.” Accessed October 1, 2020. https://sciencebasedtargets.org/about-us
Science Based Targets. “SBTi Criteria and Recommendations.” April 2020.
https://sciencebasedtargets.org/resources/files/SBTi-criteria.pdf. Science Based Targets Initiative, email with authors, December 2020. Silberman, Alexandre. "Climate Change Creating New Challenges For Cranberry
Producers | CBC News". CBC. Last modified November 5, 2020. https://www.cbc.ca/news/canada/new-brunswick/climate-change-challenges-cranberries-1.5787221.
Senate Democrats Special Committee on the Climate Crisis. “The Case for Climate
Action Building A Clean Economy For The American People.” Accessed November 5, 2020. https://www.schatz.senate.gov/imo/media/doc/SCCC_Climate_Crisis_Report.pdf.
Smithers, Rebecca. “Majority of UK public mistrusts corporate carbon claims, poll
finds.” The Guardian. Last modified March 21, 2011. https://www.theguardian.com/environment/2011/mar/21/uk-public-corporate-carbon-claims.
Sotos, Mary. "GHG Protocol Scope 2 Guidance". World Resources Institute. 2015.
https://ghgprotocol.org/sites/default/files/standards/Scope%202%20Guidance_Final_Sept26.pdf. Starbucks. “Starbucks Completes Issuance of Third and Largest Sustainability Bond.”.
Last modified May 13, 2019. https://stories.starbucks.com/press/2019/starbucks-completes-issuance-of-third-and-largest-sustainability-bond/.
Tan, H. (2019, September 19). Renewable energy is now a compelling alternative as it
costs less than fossil fuels, says Michael Milken. CNBC.

65
https://www.cnbc.com/2019/09/19/renewable-energy-is-cost-effective-says-michael-milken.html.
Tatsutani, M., and W.A. Pizer. (2008). “Managing Costs in a U.S. Greenhouse Gas
Trading Program: A Workshop Summary.” Social Science Research Network. No. 08-23 (2008): 1-23. https://doi.org/10.2139/ssrn.1238804
Target. “Target Just Announced Our Most Ambitious Climate Goals Yet.”. Last modified March 27, 2019. https://corporate.target.com/article/2019/03/climate-goals.
Trabish, Herman K. “NV Energy expands Green Energy Rider program to large
customers”. Utility Dive. Last modified May 6, 2016. https://www.utilitydive.com/news/nv-energy-expands-green-energy-rider-program-to-large-customers/418748/.
U.S. Commodity Futures Trading Commission. “Managing Climate Risk in the U.S.
Financial System: Report of the Climate-Related Market Risk Subcommittee, Market Risk Advisory Committee of the U.S. Commodity Futures Trading Commission.” Last modified September 9, 2020. https://www.cftc.gov/sites/default/files/2020-09/9-9-20%20Report%20of%20the%20Subcommittee%20on%20Climate-Related%20Market%20Risk%20-%20Managing%20Climate%20Risk%20in%20the%20U.S.%20Financial%20System%20for%20posting.pdf.
USDA Economic Research Service. “Ag and Food Sectors and the Economy.” Last
modified December 16, 2020. https://www.ers.usda.gov/data-products/ag-and-food-statistics-charting-the-essentials/ag-and-food-sectors-and-the-economy/.
Walmart. “Walmart Sets Goal to Become a Regenerative Company.” Last modified
September 21, 2020. https://corporate.walmart.com/newsroom/2020/09/21/walmart-sets-goal-to-become-a-regenerative-company.
The World Bank. “What is Carbon Pricing?” The World Bank. Accessed December 20,
2020. https://carbonpricingdashboard.worldbank.org/what-carbon-pricing.
The World Bank. "World Bank Climate Change Knowledge Portal". Accessed December 1, 2020. https://climateknowledgeportal.worldbank.org/country/chile/vulnerability.
The World Bank. “Carbon Pricing Dashboard.” Accessed April 2, 2021. https://carbonpricingdashboard.worldbank.org/map_data.
The World Bank. “State and Trends of Carbon Pricing.” 2020.
https://openknowledge.worldbank.org/handle/10986/33809.
https://corporate.walmart.com/newsroom/2020/09/21/walmart-sets-goal-to-become-a-regenerative-company

66
Appendix A: Emissions sources for emission factors used in Accuvio. Country Scope Emission Source(s) - Publication Title
United States
1 EPA Center for Climate Leadership. Emission Factors for Greenhouse Inventories; IPCC Fourth Assessment Report: Climate Change 2007 (AR4)
2 2018 and 2019 Green-e Energy Residual Mix Emission Rates. Center for Resource Solutions; EPA eGRID Year 2016 data. February 15, 2018
3 2018 and 2019 UK Government GHG Conversion Factors for Company Reporting; EPA eGRID Year 2016 data. February 15, 2018
Canada
1 National Inventory Report 1990-2016: Greenhouse Gas Sources and Sinks in Canada; National Inventory Report 1990-2017: Greenhouse Gas Sources and Sinks in Canada
2 National Inventory Report 1990-2017: Greenhouse Gas Sources and Sinks in Canada; National Inventory Report 1990-2017
3 2018 and 2019 UK Government GHG Conversion Factors for Company Reporting; National Inventory Report 1990–2017: Greenhouse Gas Sources and Sinks in Canada
Chile
1 EPA Center for Climate Leadership. Emission Factors for Greenhouse Inventories; IPCC Fourth Assessment Report: Climate Change 2007 (AR4)
2 IEA CO2 Emissions from Fuel Combustion, OECD/IEA, Paris, 2018. 2018 UK Government Conversion Factors for Company Reporting; IEA (2019), Emission Factors. 2019 UK Government Conversion Factors for Company Reporting
3 2018 and 2019 UK Government GHG Conversion Factors for Company Reporting; IEA (2019), Emission Factors. 2019 UK Government Conversion Factors for Company Reporting; IEA CO2 Emissions from Fuel Combustion, OECD/IEA, Paris, 2018. 2018 UK Government Conversion Factors for Company Reporting.

67
Appendix B: Greenhouse Gas Inventory Methodology Data Entry Process Users
Data was entered in the Accuvio software through multiple avenues including automatic connections with utilities, uploading of historical data, and ongoing data entry. OSC finance staff, engineering, performance excellence, and / or operational staff entered in the data. Data was also uploaded by sustainability staff, as well as corporate interns and masters’ students from the University of Michigan. Upload Option
Data was input using individual entry buttons in the software, or the “bulk upload” option using the excel template. The "repeat upload" function allows for multiple metrics to be uploaded at the same time and trains the software to be prepared for the same bulk upload every month for ongoing future uploads. Excel Template
When using the Excel template, users were required to fill in the “yellow" columns with required information. Users were instructed to ensure that dates, units, and quantities were entered into the excel templates as accurately as possible, ensuring that both the quantities and units matched the original invoice or record of activity. Users were instructed not to multiply or divide the quantity to match the units. Users were encouraged to ensure month to month there are no gaps. For example, if a "December" invoice covers utility usage from November 28 to December 28, the "January" invoice reported should include data starting from December 29. As required by the software, start and end dates were entered as Day/Month/Year. Accuvio Data Input for Resource Usage Datasets for resource use such as propane, gasoline, etc., were uploaded to Accuvio to account for the time period in which the resource was used. This enables the software to track the overall usage of a resource and keep track of how long it takes for the resource to be used. For example, when uploading an invoice for a propane refill with a date of September 1st and a subsequent refill date of October 6th, the invoice would be uploaded as either:
● 01/09/2019 - 06/10/2019 ● 01/09/2019 - 05/10/2019
This allows the software to track the use of the resource over the timeframe it was used.
While inputting these emissions activities as a one-day event will not change the overall amount of recorded CO2 eq. emissions, it is valuable for OSC to see how resources are being used over time.
In the case that users have an initial resource invoice but a subsequent refill and invoice has not occurred, users were directed to either wait to upload the data till the subsequent refill has occurred (recommended) or make a note to change the end date once a new refill has been received.
For resources that have large quantities of invoices in a month, such as propane, users were directed to add the total invoices together for each month. For example, the one facility had

68
over 200 propane invoices during 2019. Rather than upload them individually, the total amount of propane was added for each month and then uploaded to Accuvio. Documented Data Gaps Receiving Facilities The majority of work at receiving facilities happens during harvest, with only full-time staff working outside the harvest season. Harvest season is generally September to November in the Northern Hemisphere. Due to this, the receiving facilities have activities that are not consistently used throughout the year. Activities that fall under these parameters have been documented below and data entered as “0” for the months they are inactive. Facility R Mixed Municipal Waste- Landfill Landfill waste is deposited in a 4-yard by 4-yard dumpster and is taken away when it is full (at least once a month, sometimes multiple times a month). The facility is charged a flat rate each time it is emptied rather than a rate based on the weight of the material going to the landfill. The dumpster is filled with office waste including items that qualify for recycling (paper, etc.). We estimated the amount of waste emptied each time using the calculations below. Each time the dumpster is emptied, the material weighs 1048 pounds. Using the Recycling Reference Card (South Carolina Department of Health and Environmental Control 2017)2, we determined that office waste is “Cans, Bottles, Steel Cans, Glass, and Mixed Paper”. The conversion factor is 1.30 pounds per gallon or 262 pounds per cubic yard. The Recycling Reference Card outlines the following equation for calculating the total weight of the material per pick-up:
Number of containers x Size of Container x Conversion Factor = Weight of Material/Pickup
(1) x (4) x 262 = 1048 pounds per pick-up NOTE: This number is likely an overestimation as the dumpster is emptied every month, regardless of if it is full. Facility P 2019 Harvest Season Sept 15, 2019 to November 15, 2019 Universal Waste
2 South Carolina Department of Health and Environmental Control. 2017. "Recycling Containers Reference Card."https://scdhec.gov/sites/default/files/Library/CR-011176.pdf

69
In 2019, the Long Beach facility recycled three AAA batteries and one AA battery. AAA batteries roughly weigh 11.5 grams and AA batteries weigh roughly 23 grams (Olivetti, Gregory, and Kirchain 2011).3 In total, they recycled 0.127 pounds of batteries. In 2019, the Long Beach facility recycled 5 fluorescent lighting tubes. Each fluorescent tube was assumed to weigh 3.5 pounds, totaling 17.5 pounds (Environmental Health and Safety Online 2020).4 Organic Waste- Composting This activity is not used outside of harvest season. The 2019 harvest season at the Facility P was from September 15, 2019 to November 15, 2019. “0” was entered for the time period outside of the harvest season. Water Usage Facility P uses well water on site without a water meter to directly measure the amount of water being used. During the harvest season, water usage is estimated through a water meter located on the receiving line and water is used to clean the berries. Outside of harvest season there is no way to measure the amount of water being used. Water usage not on the receiving line was calculated using the number and brand of toilets on site, the number of employees on site, and the average number of times individuals use the toilet on a given day, and the number of working days per month, excluding holidays and weekends. The following are the assumptions used to calculate water usage at Facility P:
○ Toilets: ■ Women’s Restroom: One Kohler 16 gal toilet ■ Men’s Restroom: One GlacierBay toilet, older than 8 years old. ■ Based on a timeline created by Plumbing Manufacturers International, both
toilets are assumed to use both toilets assumed to use 1.6 gallons/flush (2014).5
○ Number of Employees per month: ■ Two employees from December – February ■ Six employees from March – August ■ Twenty-six employees from September – November
○ Average bathroom usage: ■ WebMD states that the average person uses the toilet 6-8 times a day. As there
are 24 hours in the day, the average person uses the bathroom every 3 hours. Since the average work day is 8 hours, the average person goes to the restroom ~3 times a day at work.
3 Olivetti, Elsa, Jeremy Gregory, and Randolph Kirchain. 2011. "Life Cycle Impacts Of Alkaline Batteries With A Focus On End-Of-Life". https://web.archive.org/web/20160303173602/http://www.epbaeurope.net/documents/NEMA_alkalinelca2011.pdf. 4 Environmental Health and Safety Online. “Fluorescent Light Bulbs and Other Lighting - Disposal and Recycling Information.” 2020. Ehso.com http://www.ehso.com/fluoresc.php 5 Plumbing Manufacturers International. “The History of Plumbing...So Far!”. 2014. Safeplumbing.org. https://www.safeplumbing.org/files/safeplumbing.org/documents/misc/timeline.pdf

70
The following table outlines the water usage calculations for each month, in addition to the water usage on the receiving line during harvest season: General calculation of water usage for 1 employee:
1.6 gallons per flush x 3 trips to the bathroom during the working day = 4.8 gallons per employee/day
Month Number of Employees Number of Working Days in 2019
(including Holidays) Estimated Water Usage (gallons)
January 2 23 220.8 February 2 20 192 March 6 23 662.4 April 6 22 633.6 May 6 23 662.4 June 6 20 576 July 6 23 662.4
August 6 22 633.6 September 26 21 2,620.8
October 26 24 2,995.2 November 26 26 2,620.8 December 2 22 633.6 Facility O Light Goods Vehicle- Propane Minimum use outside of harvest season. Organic Waste- Composting This activity is not used outside of June/July through harvest season. “0” was entered for the time period outside of harvest season. Mixed Municipal Waste- Landfill According to the Receiving Facility, waste not picked up after Nov 8, 2019 as all seasonal employees were stopped work in 2019. “0” entered for the remainder of 2019. Wood- Landfill Wooden totes are used to ship frozen cranberries from receiving facilities to manufacturing facilities. The wooden totes return to the receiving facilities after the berries have been offloaded. Seasonal employees are hired back in March and repair the wood totes. Wood totes that are unable to be repaired, are sent to the landfill. Additional employees are hired around June and July and therefore, more wood totes are repaired/discarded during this time. This is reflected in the data as there are higher amounts of wood totes around June and July.

71
Facility M Light Goods Vehicle- Propane Minimum to no use outside of harvest season. “0” was entered for the time period outside of harvest season. Mixed Municipal Waste- Landfill According to the Receiving Facility, waste not picked up after Dec 4, 2019 as all seasonal employees were stopped work in 2019. “0” entered for the remainder of 2019. Organic Waste- Composting This activity is not used outside of harvest season. The 2019 harvest season at the Richmond Receiving Facility was from roughly September 28, 2019 to November 7, 2019. “0” was entered for the time period outside of harvest season. Wood- Landfill Wooden totes are used to ship frozen cranberries from receiving facilities to manufacturing facilities. The wooden totes return to the receiving facilities after the berries have been offloaded. Seasonal employees are hired back in March and repair the wood totes. Wood totes that are unable to be repaired, are sent to the landfill. Additional employees are hired around June and July and therefore, more wood totes are repaired/discarded during this time. This is reflected in the data as there are higher amounts of wood totes around June and July. Facility K Water Facility K uses well water on site without a water meter to directly measure the amount of water being used. During the harvest season, water usage is estimated through a water meter located on the receiving line and water is used to clean the berries. Outside of harvest season there is no way to measure the amount of water being used. Water usage not on the receiving line was calculated using the number and brand of toilets on site, the number of employees on site, and the average number of times individuals use the toilet on a given day, and the number of working days per month, excluding holidays and weekends. The following are the assumptions used to calculate water usage at the Facility K:
○ Toilets: ■ 10 total toilets: tankless, low-water use, Sloan valve style: use 1.1 gallons per
flush (Sloan n.d.)6 ○ Number of Employees per month:
■ 7 full time employees during off season ■ ~160 (including 7 full time employees) during harvest season
○ Average bathroom usage: ■ WebMD states that the average person uses the toilet 6-8 times a day. As there
are 24 hours in the day, the average person uses the bathroom every 3 hours.
6 Sloan. “Sloan Water Efficiency Brochure.” n.d. Sloan.com https://www.sloan.com/themes/sloan/files/water-efficiency-brochure.pdf.

72
Since the average work day is 8 hours, the average person goes to the restroom ~3 times a day at work.
The following table outlines the water usage calculations for each month, in addition to the water usage on the receiving line during harvest season:
General calculation of water usage for 1 employee: 1.1 gallons per flush x 3 trips to the bathroom during the working day = 3.3 gallons per employee/ day
Month Number of Employees Number of Working Days in
2019 (including Holidays) Estimated Water Usage
(gallons)
January 7 23 531.3 February 7 20 462 March 7 23 531.3
April 7 22 508.2 May 7 23 531.3 June 7 20 462 July 7 23 531.3
August 7 22 508.2 September 160 21 11,088
October 160 24 16,672 November 160 26 13,728 December 7 22 508.2
Organic Waste- Composting This activity is not used outside of harvest season. The 2019 harvest season at the Carver Receiving Facility was from roughly September 1, 2019 to November 30, 2019. “0” was entered for the time period outside of harvest season. Mixed Municipal Waste- Landfill Activity only applies to harvest season unless there is restoration work at the receiving Facility. Propane Propane is used for both mobile and stationary combustion. Due to the nature of the invoices, we are unable to split up invoices between stationary and mobile and all propane data has been entered under the general Propane Activity. Facility L Recycling- Cardboard

73
Facility L uses a 20-yard dumpster for their cardboard waste. The dumpster is emptied when it is full and is therefore not emptied every month. Additionally, they are charged per time the dumpster is emptied rather than the weight of the material emptied. The following outlines the process used to estimate the amount of cardboard emptied: Using the Recycling Reference Card7, we determined that the conversion factor of “Cardboard” is 0.524820 pounds per gallon or 106 pounds per cubic yard (South Carolina Department of Health and Environmental Control 2017). The Recycling Reference Card outlines the following equation for calculating the total weight of the material per pick-up: Number of containers x Size of Container x Conversion Factor = Weight of Material/Pickup
(1) x (20) x 106 pounds = 2120 pounds per pick-up
Mixed Municipal Waste Landfill The landfill waste (excluding cranberries, hazardous waste, and cardboard) is stored in a 40-yard dumpster. Facility L is charged $325 monthly for use of the dumpster, as shown on the invoices. However, the dumpster is not emptied every month. Months when the dumpster is emptied state “Roll off Exchange.” The invoices also show a weight in “TN” or metric tons. Metric tons were converted to pounds using the following equation before being uploaded to Accuvio: 1 metric ton = 2204.62 pounds.
Universal Waste Facility L has a large amount of universal waste, and the invoices have various sized containers with various waste items. There was no weight listed, only the size of the containers. Each waste item (name from invoice) has an estimated weight and a source attached. When uploading the universal waste to Accuvio, Accuvio was not recognizing certain waste categories, even if they are classified as universal waste (ex. Lightbulbs, Hazardous Waste). In this scenario, all categories not being recognized were uploaded as universal waste, designated in Accuvio as “custom waste fraction”. Because most of the waste was less than 100 pounds, it was coming up as 0-0.2 tonnes of CO2e, and we felt that organizing the waste into less specific categories was acceptable. We chose not to upload the waste oil or the wastewater from the parts washer, as Accuvio has not gotten back to us to inform us on how to classify these activities and where they should go. These are indicated as italicized in the table below. Because these numbers are minute, we feel that it will not significantly impact the overall footprint of OSC, but that it would be helpful in the future to have specific values for maximum mitigation. Facility L’s Universal Waste Categories
7 South Carolina Department of Health and Environmental Control. 2017. "Recycling Containers Reference Card."https://scdhec.gov/sites/default/files/Library/CR-011176.pdf

74
Waste Item Use Calculation Pail, 5 GL black poly w/screw on
lid Uncrushed soil oil filters Estimated 6lbs used oil; 10 lbs ferrous metal
(adjusted from 55 gal)1
Drum open head 55GL and Drum 55 waste oil filters
Uncrushed oil filters Estimated 66 lbs used oil; 110 lbs ferrous metal 1
Non-haz waste for inc 55GL spill cleanup
Oil, rags, and polypropylene Estimated 200 pounds; classified as mixed industrial waste 2
AQ-1 automatic parts washer Disposing of contaminated wastewater
Maximum capacity: 20 gallons3
LP Aerosols for INC 30 GL Aerosol cans; empty, non-punctured
Estimated 10.4 lbs ; 96 cans fit in a 55-gallon drum, so 52 cans can fit in a 30-gallon
drum4;
We assumed each can was 12 oz empty (0.2 lbs)
12 oz can empty = 0.2 lbs (52 * 0.2 = 10.4 lbs) 5
PAIL 5.5 GL Black Poly W/Screw on Lid
Light bulbs disposal Estimated 66 lbs 2
30 GL Drum Open head- black new/Drum. 30-gallon black poly
OH
Waste Oil- classified as Universal Waste6
Estimated 227.33 lbs
Waste oil = 7.58lb/gal (7.58 lb/gal x 30 gal = 227.33 lbs)7
Drum 15 GL black poly OH Waste Oil- classified as Universal Waste6
Estimated 113.66 lbs 7
LBLA 5-gal Batt core profile Battery disposal Estimated 70 lbs 8

75
Metal REC electronics 30G Electronics disposal Assuming 52.4 lbs; classifying as waste-electrical
Method:
1. Computer-related electronics (354 lbs/cubic yard)9
2. 30 gallon container was currently in
liquid gallons, but electronics are classified as a dry gallon, or a cubic yard, as in the
source above: 1 wet gal = 0.86 dry gal => 30 wet gal = 25.78 dry gal10
3. If 1 cubic yard = 173.57 dry gallons, then 25.78 dry gallons = 0.148 cubic yard: 354 lbs/cubic yard / 0.148 cubic yard = 52.4
lbs11
1. “Materials Conversion Table.” 2012. Loudoun.gov. https://www.loudoun.gov/DocumentCenter/View/33167/Materials-Conversion-Table 2. Sharps Compliance, Inc. “5-Gallon Mixed Lamps Recycling Pail.” n.d. Sharpsinc.com https://www.sharpsinc.com/store/5-gal-mixed-lamps-recycling-pail 3. Safety-Kleen. “Parts Washer - AQ-1.” n.d. safety-kleen.com. https://www.safety-kleen.com/products/parts-washers/aqueous/aq-1 4. S&G Enterprises. “Aerosols FAQ.” 2013. ramflat.com https://www.ramflat.com/wp-content/uploads/2013/03/aero_faq.pdf 5. Source: Catherine Mullin’s (student on MP) summer internship used 12 oz cans of refrigerant and when emptied they were the weight listed above. 6. Pegex. “Automotive Shops and Used Oil Waste: FAQs.” 2014. hazardouswasteexperts.com https://www.hazardouswasteexperts.com/automotive-shops-and-used-oil-waste-faqs/ 7. Environmental Protection Agency. “Gallons Pounds Conversion Excel Template.” 2014. epa.gov https://www.epa.gov/sites/production/files/2014-01/gallonspoundsconversion.xls 8. “5 Gallon Battery Recycling Pail.” n.d. simple-cycle.com http://simple-cycle.com/5-gallon-dry-cell-battery-recycling-pail.html 9. Environmental Protection Agency. “Volume-to-Weight Conversion Factors.” 2016. epa.gov https://www.epa.gov/sites/production/files/2016-04/documents/volume_to_weight_conversion_factors_memorandum_04192016_508fnl.pdf 10. “Convert Gallons Liquid US Gal Into US Dry Gallons.” n.d. traditionaloven.com https://www.traditionaloven.com/culinary-arts/volume/convert-galon-gal-us-to-gallon-dry-us.html 11. “US Gallons (Dry) to Cubic Yards Conversion.” n.d. metric-conversions.org https://www.metric-conversions.org/volume/us-dry-gallons-to-cubic-yards.htm
Manufacturing Facilities Facility I Propane Propane at Facility I is used in boilers to generate heat and steam. Due to the frequency of invoices for propane fill ups (weekly, sometimes multiple times a day), propane data was entered on a monthly basis rather than invoice to invoice.

76
Other Lakeville Corporate Offices The Lakeville offices of OSC are categorized as Scope 3 emissions, with the exception of purchased electricity, which falls under Scope 2. While OSC’s corporate office buildings are under an operational lease, interviews with OSC management led us to conclude that operational management of the corporate office buildings does not substantially fall under OSC’s purview, and thus an exception to the operational control approach was applied to these facilities in accordance with the GHG Protocol guidelines. Refrigerants This activity is only used when there is a leak in the onsite AC units. As there was no leak in 2019, “0” was entered for the 2019.

77
Appendix C: Glossary of Emissions Activities The below list encompasses and defines the emissions-generating activities we accounted for and uploaded to Accuvio, along with units, the correct input selection to use in Accuvio, and real-world examples for reference. When uploading and naming these activities to Accuvio, specificity is encouraged for user reference (e.g., the specific area within the facility where electricity or natural gas usage occurred), but the proper activity categorization is important. For example, on-site propane usage in forklifts should be classified as first mobile combustion, then light goods vehicle, and finally propane, rather than stationary combustion then propane. Electricity Definition Purchased electricity associated with any of the primary plant
processes and machinery that is a permanent fixture within the control of the plant.
Unit kWh
Input Selection Option Electricity
Specific Use Examples ● Electricity - Annex Bldg ● Electricity - Fire Protection ● Electricity - Guard Shack ● Electricity - Ingredient Plant ● Electricity – Main Meter ● Electricity – Outside Lights ● Electricity – Plant
Mobile Combustion Definition Transportation of materials, products, waste, and employees. These
emissions result from the combustion of fuels in company owned/controlled mobile combustion sources (i.e., forklifts, passenger vehicles, mobile pressure washers, lawnmowers, etc.).
Light Duty Truck – Diesel
● Unit: gallon (US) ● Input selection option: Diesel ● Examples: Diesel pickup trucks
Light Goods Vehicle – Gasoline
● Unit: gallon (US) ● Input selection option: Motor gasoline ● Examples: C1500 RegCab, Ford F-150, Company Trucks,
Chevrolet, 2010 Chevy, Jeep Liberty, Toyota Sonoma, 2500 HD, 2010 Toyota Tacoma Truck, GMC, Dodge, Lawn Mower, 2005 Ford, 1996 Ford 350, 1998 Dodge Dakota,

78
2004 Chevy 1500, 2008 GMC 15 Passenger Van, Husqvarna 61" Deck - Tractor, Husqvarna 52" Deck – Tractor
Light Goods Vehicle – Propane
● Unit: gallon (US) ● Input selection option: Propane ● Examples: Nissan LPC40KLP, Nissan JC40LP, American
Lincoln Scrubber, Propane Forklifts, Fork Trucks
Heavy Duty Vehicle – Diesel
● Unit: gallon (US) ● Input selection option: Diesel ● Examples: Diesel trucks, 1998 Mack, Tractors, 2003 John
Deere tractor, Branson 10/20 series tractor
Passenger Vehicle – Gasoline
● Unit: gallon (US) ● Input selection option: Motor gasoline ● Examples: Utility Truck, Tacoma 4x4, Cherokee, 2006 Ford
Explorer, 2006 Ford Explorer, 1996 Chevy Blazer, Jeep, 2002 Ford Taurus
Nitrogen Definition Any nitrogen used on the premises.
Unit pound (lbs) Purchased Steam Definition Steam purchased for use in mechanical work, heat, or directly as a
process medium.
Unit Million Btu
Input Selection Option District heat and steam Refrigerant Definition Quantity of refrigerant leaked from equipment used on-site (fugitive
emissions)
Unit Pounds (lbs) or as given by the A/C maintenance service provider
Input Selection Option Select relevant refrigerant from the dropdown list

79
Stationary Combustion Definition Stationary Combustion Fuels are fuels used for generation of
electricity, heat, or steam. These emissions result from combustion of fuels in stationary sources, e.g., boilers, furnaces, turbines. Mobile sources, including forklifts, should be entered into the mobile section.
Biodiesel Units: gallon (US)
Distillate Fuel Oil #2 Units: gallon (US)
Distillate Fuel Oil #4 Units: gallon (US)
Distillate Fuel Oil #6 Units: gallon (US)
Motor Gasoline Units: gallon (US)
Kerosene Units: gallon (US)
Landfill Gas Units: Ccf
Natural Gas
Units: Ccf ● Specific use examples: ● Natural Gas – Admin Building ● Natural Gas – Commodity ● Natural Gas – Main Meter ● Natural Gas – Recycling Center ● Natural Gas – Warehouse
Propane Units: gallon (US) Waste Definition Recording of waste amount, type, and disposal method.
Units Pounds (lbs), Tonnes, Kilograms
Input selection option Waste type → waste disposal method
Waste type options ● Mixed municipal waste ● Mixed paper ● Cardboard (corrugated and paperboard) ● Wood ● Mixed recyclables ● Glass

80
● Mixed metals ● Mixed scrap metal ● Aluminum ● Steel ● Mixed commercial and industrial waste ● Construction, demolition, and excavation – average ● Waste electrical and electronic equipment ● Universal waste – light bulbs (fluorescent and compact) ● Fridges and freezers ● Universal waste – batteries (post-consumer non-automotive) ● Hazardous waste ● Mixed plastics ● Average plastic film ● Average plastic rigid ● PET plastic ● HDPE plastic ● LDPE and/or LLDPE plastic ● PP plastic ● PVC ● Sludge ● Organic waste (cranberry, ingredient, byproduct – NOT
rework) ● Clothing ● Rubber ● Mineral oil
Waste disposal methods
● Landfill Waste - Landfill waste refers to all waste streams that end in the landfill. This does not include any waste that is reused, recycled, or organically disposed of (i.e., land application)
● Recycling - Recycling refers to discarded products and packaging materials recovered for reuse and/or processing into new products. Recycling waste streams should have a dedicated hauler.
● Compost - According to the U.S Environmental Protection Agency (EPA), compost refers to discarded organic materials processed into a soil amendment, fertilizer, and/or mulch.
● Land Application - Land application, sometimes referred to as "sludge" is typically a mixture of water and solid waste at the end of the aerobic activated sludge cycle. For OSC's purposes, land application refers to any biosolids that are directly applied to land without having undergone the composting process.

81
● Incineration - Incineration is any waste material that is sent directly to an incinerator. These facilities burn the waste to produce and harvest energy, meaning it has different environmental factors than landfill.
● Waste to Biodigester - Organic materials can be separated from the municipal solid waste (MSW) stream and processed in an anaerobic digester.
● Animal Feed - Any organic or cranberry waste produced on site is NOT being converted into pellets or undergoing any additional processing on site. It’s trucked away and the various vendors mix it with other materials for animal feed.
Water and Wastewater Discharge Definition Recording of water usage and water discharge
Units Gallon (US)
Water Supply ● Any water supplied to the premises by the water supplier. ● Specific use examples:
○ Water – Annex Bldg ○ Water – Main Meter ○ Water – Plant ○ Water – Potable Human Consumption
Water Treatment ● Any water leaving the premises to be discharged back to the sewer.
● Specific use examples: ○ Wastewater Treatment ○ Sewer-Wastewater ○ Total Wastewater Discharge

82
Appendix D: Manufacturing Facilities Interview Summaries Interview responses with each manufacturing facility. The responses have been
summarized, paraphrased, and edited for clarity. Facility names have been changed. Facility A
Facility A processes 195 million pounds of fruit for Craisins and ships out goods directly, the only facility with a direct site distribution center. Facility A created a recipe in conjunction with its state’s Department of Agriculture to compost cranberry waste. This has resulted in 93% waste diversion from the landfill. The recipe is now being used by other OSC manufacturing locations. The facility was awarded OSC's Manufacturing "Sustainability Award" in July 2019 for their light-emitting diode (LED) lighting project. The facility replaced inefficient light bulbs with a SMART LED lighting system, slashing lighting-related electricity consumption by over 80% every month which resulted in approximately $1.6 million in savings in three years. Additional energy saving projects the facility has implemented include updating the dryers with larger coils, which provided 15% more capacity in each dryer; increasing efficiency to the wastewater treatment plant through aeration, which resulted in approximately $225,000 savings; and reducing water usage. Engineers at Facility A believe that solar panels, combined heat and power, and domestic waste and recycling are all opportunities for future energy saving projects. Access to capital is one of the largest challenges the facility faces in implementing future projects. Facility B
Facility B was built in 1996 and acquired by OSC in 2013. Some of the most energy-intensive activities at this facility include drying fruit after the harvest comes in and refrigeration. Refrigeration alone accounts for roughly 70% of the facility’s electrical consumption. In 2019, Facility B switched their steam boilers from Fuel Oil #5 to propane, resulting in a significant emissions and particulate reduction. In this region, there is less regulation surrounding GHG emissions than particulate matter emissions. Current efficiency projects include an effort to reduce food waste by 600,000 pounds. Facility staff reports that financial challenges — particularly time to payback in excess of 18 months — can be an obstacle to completing energy efficiency measures. Facility staff also believe that water use and wastewater treatment present the greatest opportunity for efficiency improvements on-site. Larger-than-expected harvests in recent years are also adding pressure to improve facility efficiency. Facility C Facility C was built in 1970. The facility receives cranberry concentrate and mixes the concentrate with other ingredients to produce cranberry beverage. The concentrate is first shipped to the facility via rail car or tractor trailer, then pumped into storage tanks to mix with other ingredients. Two efficiency projects have been conducted at this facility: LED lightning upgrades, and purchasing compressed air as a commodity instead of keeping on-site air compressors. Purchasing air externally is more efficient because their old compressors used a lot of electricity, and because the external provider can provide the air depending on the demand thus avoiding waste. When making investments on sustainability projects, Facility C prioritizes safety and quality. The biggest challenges to sustainability this facility faces are aging buildings, and older, inefficient equipment and processes. In the future, Facility C is interested in the following projects: replacing their transformers; replacing their four steam boilers with biomass boilers; and reducing their water consumption.

83
Facility D Facility D has collected nearly a decade of energy use data. Despite a thorough understanding of where waste exists at the facility, the facility is limited by access to capital to make improvements. However, the facility has been able to take on projects to improve energy efficiency, including reclaiming rinse water and recovering juice during processing for significant water savings, halving chemical truck deliveries, and making improvements to the ammonia compressor for electricity savings. Facility D has taken advantage of past energy savings incentives, such as a rebate for a water savings project, and energy credits for improvements to thermostats and HVAC systems. Given limitations in access to water in its location, the facility must prioritize water efficiency. However, the facility is seeking to be efficient across all resources, developing an overarching “resource strategy.” When considering projects, the facility generally considers a three-year ROI, but ultimately, the facility responds to the overarching business goals of OSC. Facility D, which was recently voted within its state as one of the top places, is very enthusiastic about sustainable practices but lacks the resources to implement them. This facility suggests that OSC implement policies from the top down to ensure that resource efficiency projects, which typically have a longer ROI, can be completed. Such a policy would require a modest amount of capital dedicated to sustainability improvements for each facility, for which the ROI would be set on a longer time horizon, such as seven years. Facility E Facility E is one of the oldest facilities that OSC manages. Part of the building was built in the 1940s and requires a large amount of maintenance. The building has a large footprint and is spread out for a one-line operation. Facility E is one of the few facilities that uses well water, and their wastewater discharges directly into the mouth of the nearby river. Facility management mentioned that they could decrease their water consumption with little cost involved. This facility suggested setting a goal for saving water company-wide. Facility E would like to improve their composting practices, but they are in a remote location and it currently costs $38/ton to haul away. There are multiple farms nearby, but the compost would need to be given to multiple smaller vendors, which is something different from other OSC facilities. They have had contracts with different utilities over the last few decades to reduce consumption and have received multiple rebates. They have experienced no issues with policy incentives due to being in the OSC Co-op. Capital is their only barrier to sustainability projects. Facility E suggested creating projects on a quarterly basis, as they are hesitant to spend money in the first half of the pool year, but also do not want to get overwhelmed with capital at the end of the pool year. Facility F
Facility F produces sweetened dried cranberries and cranberry juice, shipped to bottling plants as concentrate. The rural location of the facility makes water and wastewater management a challenge, as they use their own high-volume wells as a water source and do not rely on a local water utility. As a result, the majority of their facility upgrades and efficiency projects have been devoted to water use — upgraded steam boilers and dryers, reducing water spray on the dryer belts, and a flash steam system. Some energy efficiencies have come out of those projects. For example, the new steam boilers use less horsepower, and the office building has been retrofitted with LED light bulbs. According to facility management, capital constraints have been an obstacle to improving energy efficiency. Facility F competes with all the other facilities for the

84
same pool of funds, and projects that improve employee safety and food quality are typically prioritized. Replacing aging assets, like the cranberry dryers, HVAC system, and packaging equipment, could result in efficiency gains. Facility G Facility G employs more than 100 people and has recently increased its production volume. The facility has taken steps to increase resource efficiency and decrease waste. Past sustainability efforts include projects to improve energy efficiency, and reclaim and reuse water. The facility diverts waste through strategies such as recycling and land application of sludge resulting from on-site wastewater pretreatment, leading to “very little” waste being sent to landfill. Each year, the facility identifies approximately 30 projects for improvements. Ultimately, only about three projects are completed per year due to capital constraints. Due to a 30 percent ROI goal that generally results in a three-year payback window, the facility does not move forward with projects solely for sustainability purposes, as most sustainability projects do not pay themselves back within the requisite three years. Instead, the facility prioritizes projects to maintain safety and quality. However, when the facility takes on projects, sustainability is incorporated into the project if financially feasible. The facility has been pursuing a large lighting improvement project for years, but due to the high expense, it has not been completed; instead, individual lights are replaced with LEDs as they burn out. Facility H
Facility H is a 300,000-square-foot facility that produces SDC and cranberry juice and concentrate. The facility is able to meet most of its natural gas demand (90 to 95%) using landfill gas from a nearby landfill. Facility management believes electricity efficiency measures, like LED lights and strategies to improve facility production per kilowatt, are the best opportunities for emissions reduction. Half the facility has been upfit with LED bulbs and replacing the remainder has been an ongoing project. Facility management has worked with local vendors for the LED upfit and other projects, and have successfully been able to claim regional and national incentives to lower efficiency upgrade costs (the cooperative status of OSC has not been an issue in claiming these incentives). Reducing both waste in general and water usage during the facility cleaning process are areas of opportunity. GHG emissions do come up as a factor in prioritizing facility projects, but ROI —- and a payback period of 12 to 18 months — typically overrides that. Facility I Facility I produces SDC and juice concentrate. The facility uses hydroelectric power for its electricity, but uses propane for heating and for steam production. The facility uses nearby river water and the wastewater is treated with an on-site water treatment plant and goes to nearby bogs. To further reduce the transportation cost of water, Facility I is currently working on a project to concentrate on-site sludge instead of sending it off site to be treated. This facility has already participated in several efficiency projects, such as optimizing their dryers and LED lighting replacement. The facility would like to pursue three mitigation projects in the future: replacing the propane boiler with an electric boiler; upgrading the current evaporator for juice concentration to a more energy-efficient evaporator; and reusing hot water in their operation processes.

85
Facility J Facility J, established in 2014, is OSC’s newest facility. This energy-efficient facility has saved OSC $4.6 million, with the help of their 20-year agreement with an engineering firm. This firm owns most of the production equipment at Facility J, and it charges the facility over 20 years while also guaranteeing a certain amount of energy savings. The engineering firm owns almost all of the capital expenses except for the compressors and coilers. Facility J became the first facility in the United States to run on entirely hot water instead of steam, and also uses zero energy to heat the building during the winter. This facility also participates in voluntary curtailment with their utility, saving them $250,000 a year. Their past efficiency projects include heat reclamation from juice bottles, improving the efficiency of their air compressors, installing LED lighting, and installing sensors for automatic shutoff of conveyor belts. In the future, they would like to have CHP, but the ROI is 8 to 9 years. They would also like to repurpose boilers and send them to Facility D, as Facility D currently spends about $1 million purchasing steam. Their main constraints to starting these projects are time and resources.

86
Appendix E: 2019 Emissions: Manufacturing Facilities, Receiving Facilities, and Farms Manufacturing Facilities Facility A Facility A emitted a total of 27,614 tonnes of CO2e in 2019. Scope 1 emissions estimated at 20,196 tonnes of CO2e made up the largest share of emissions, accounting for 73% of the total emissions. Scope 2 emissions were 6,526 tonnes of CO2e accounting for 24% of total emissions, and Scope 3 were 892 tonnes of CO2e accounting for 3% of total emissions. Of the Scope 1 emissions, nearly all of the emissions were due to natural gas consumption at 18,191 tonnes of CO2e used for steam production and onsite warehouse heaters.

87
Facility B Facility B emitted a total of 13,085 tonnes of CO2e in 2019. Scope 1 emissions estimated at 7,242 tonnes of CO2e made up the largest share of emissions, accounting for 55.2% of the total emissions. Scope 2 were 4,887 tonnes of CO2e accounting for 37.2% of the total and Scope 3 emissions were 956 tonnes of CO2e, approximately 7.3% of the total. Of the Scope 1 emissions, a majority of the emissions were due to Fuel Oil #5 at 5,628 tonnes of CO2e used for steam production, but as of September 2019 the boilers have been switched to propane. Fuel Oil No. 5 is now a backup fuel source for the boilers.

88
Facility C Facility C emitted a total of 19,833 tonnes of CO2e in 2019. Scope 1 emissions estimated at 8,739 tonnes of CO2e made up the largest share of emissions, accounting for 44% of the total emissions. Scope 2 emissions were 9,235 tonnes of CO2e accounting for 47% of the total, and Scope 3 emissions were 1,859 tonnes of CO2e, approximately 9% of the total. Of the Scope 1 emissions, nearly all of the emissions were due to natural gas consumption at 8,621 tonnes of CO2e used for facility heating.

89
Facility D Facility D emitted a total of 9,997 tonnes of CO2e in 2019. Scope 1 emissions were estimated at 112 tonnes of CO2e, or 1% of the total emissions. Scope 2 emissions were 9,277 tonnes of CO2e, accounting for the largest share of emissions at 93%, and Scope 3 emissions were 607 tonnes of CO2e, approximately 6% of the total. Scope 1 emissions were not the largest portion of this facility’s footprint due to their usage of purchased steam, which is a Scope 2 category. Of the Scope 1 emissions, nearly all of the emissions were due to propane at 111 tonnes of CO2e.

90
Facility E Facility E emitted a total of 7,741 tonnes of CO2e in 2019. Scope 1 emissions estimated at 3,637 tonnes of CO2e made up the largest share of emissions, accounting for 47%. Scope 2 emissions were 3,646 tonnes of CO2e, accounting also for 47% of total emissions, and Scope 3 emissions were 459 tonnes of CO2e, approximately 6% of total emissions. Of the Scope 1 emissions, a majority of the emissions were due to natural gas consumption at 2,642 tonnes of CO2e used for steam production.

91
Facility F Facility F emitted a total of 22,009 tonnes of CO2e in 2019. Scope 1 emissions estimated at 13,142 tonnes of CO2e made up the largest share of emissions, accounting for 59.7% of the total emissions. Scope 2 emissions were 8,310 tonnes of CO2e accounting for 37.8% of the total, and Scope 3 emissions were 557 tonnes of CO2e, approximately 2.5% of the total. Of the Scope 1 emissions, nearly all of the emissions were due to natural gas consumption at 13,073.1 tonnes of CO2e used for steam production.

92
Facility G Facility G emitted a total of 9,581 tonnes of CO2e in 2019. Scope 1 emissions estimated at 4,225 tonnes of CO2e made up 44% of the total emissions. Scope 2 emissions were 4,702 tonnes of CO2e and made up the largest share of emissions at 49%. Scope 3 emissions were 653 tonnes of CO2e, approximately 7% of the total emissions. Of the Scope 1 emissions, nearly all of the emissions were due to natural gas consumption at 4,103 tonnes of CO2e used for steam production.

93
Facility H Facility H emitted a total of 34,028 tonnes of CO2e in 2019. Scope 1 emissions estimated at 10,614 tonnes of CO2e accounted for 31% of total emissions. Scope 2 emissions were 15,327 tonnes of CO2e which made up the largest share of emissions at 45% of total emissions. Scope 3 emissions were 1,399 tonnes of CO2e accounting for 4% of emissions, and biomass emissions were 6,688 tonnes of CO2e, accounting for 20% of the total emissions. Of the Scope 1 emissions, nearly all of the emissions were due to natural gas consumption at 10,569 tonnes of CO2e used for steam production.

94
Facility I Facility I emitted a total of 5,440 tonnes of CO2e in 2019. Scope 1 emissions estimated at 5,149 tonnes of CO2e made up the largest share of emissions, accounting for 94.6% of the total emissions, Scope 2 emissions were 8 tonnes of CO2e, accounting for approximately 0.1% of total emissions, and Scope 3 emissions were 283 tonnes of CO2e, or approximately 5.2% of total emissions. Of the Scope 1 emissions, nearly all of the emissions were due to propane at 5,144 tonnes of CO2e used for facility heating and steam production.

95
Facility J Facility J emitted a total of 34,715 tonnes of CO2e in 2019. Scope 1 emissions estimated at 17,409 tonnes of CO2e made up the largest share of emissions, accounting for 50% of the total emissions. Scope 2 emissions were 16,043 tonnes of CO2e accounting for 46% of the total, and Scope 3 emissions were 1,263 tonnes of CO2e, accounting for 4% of the total emissions. Of the Scope 1 emissions, 100% of the emissions were due to natural gas consumption at 17,409 tonnes of CO2e used for hot water production.

96
Receiving Facilities Facility K Facility K emitted a total of 557 tonnes of CO2e in 2019. Scope 1 emissions estimated at 172 tonnes of CO2e accounted for 31% of the total emissions. Scope 2 emissions were 224 tonnes of CO2e, making up the largest share of emissions at 40%. Scope 3 emissions were 161 tonnes of CO2e, accounting for 29% of the total emissions. All Scope 1 emissions are due to propane. All 172 tonnes of CO2e were used for facility heating.

97
Facility L Facility L emitted a total of 798 tonnes of CO2e in 2019. Scope 1 emissions estimated at 161 tonnes of CO2e accounted for 20% of the total emissions. Scope 2 emissions were 577 tonnes of CO2e making up the largest share of emissions at 72%. Scope 3 emissions were 60 tonnes of CO2e, accounting for 8% of the total emissions. Of the Scope 1 emissions, nearly all of the emissions were due to propane at 150 tonnes of CO2e used for both facility heating and onsite transportation.

98
Facility M Facility M emitted a total of 219 tonnes of CO2e in 2019. Scope 1 emissions were estimated at 102 tonnes of CO2e accounting for 46% of total emissions. Scope 2 emissions were 3.2 tonnes of CO2e accounting for 2% of total emissions. Scope 3 emissions were 114 tonnes of CO2e, and made up the largest share of emissions at 52% of total emissions. Of the Scope 1 emissions, nearly all of the emissions were due to natural gas at 62.4 tonnes of CO2e used for facility heating.

99
Facility N Facility N emitted a total of 614 tonnes of CO2e in 2019. Scope 1 emissions were estimated at 186 tonnes of CO2e and accounted for 30% of the total emissions. Scope 2 emissions were 408 tonnes of CO2e and made up the largest share of emissions at 67% of the total emissions. Scope 3 emissions were 19 tonnes of CO2e, accounting for 3% of the total emissions. All Scope 1 emissions are due to natural gas at 186 tonnes of CO2e used for facility heating.

100
Facility O Facility O emitted a total of 128 tonnes of CO2e in 2019. Scope 1 emissions were estimated at 56 tonnes of CO2e and accounted for 42% of total emissions. Scope 2 emissions were 2 tonnes of CO2e, accounting for 1% of total emissions. Scope 3 emissions estimated at 71 tonnes of CO2e made up the largest share of emissions, accounting for 57% of the total emissions. Of the Scope 1 emissions, nearly all of the emissions were due to natural gas at 37 tonnes of CO2e used for electricity generation.

101
Facility P Facility P emitted a total of 38 tonnes of CO2e in 2019. Scope 1 emissions were estimated at 15 tonnes of CO2e, accounting for 40% of the total emissions. Scope 2 emissions estimated at 17 tonnes of CO2e made up the largest share of emissions, accounting for 45% of the total emissions. Scope 3 emissions were 6 tonnes of CO2e, or 15% of the total emissions. Of the Scope 1 emissions, nearly all of the emissions were due to propane at 11 tonnes of CO2e used for onsite transportation.

102
Facility Q Facility Q emitted a total of 225 tonnes of CO2e in 2019. Scope 1 emissions estimated at 105 tonnes of CO2e made up the largest share of emissions, accounting for 47% of the total emissions. Scope 2 emissions were 80 tonnes of CO2e accounting for 36% of the total and Scope 3 emissions were 38 tonnes of CO2e, or 17% of the total emissions. Of the Scope 1 emissions, nearly all of the emissions were due to propane at 78 tonnes of CO2e used for facility heating.

103
Facility R Facility R emitted a total of 76 tonnes of CO2e in 2019. Scope 1 emissions were 21 tonnes of CO2e, accounting for 14% of the total emissions, Scope 2 emissions were 40 tonnes of CO2e accounting for 54% of the total emissions and Scope 3 emissions were estimated at 12 tonnes of CO2e making up 17% of the total emissions. Of the Scope 1 emissions, nearly all of the emissions were due to propane at 14 tonnes of CO2e used for onsite transportation.
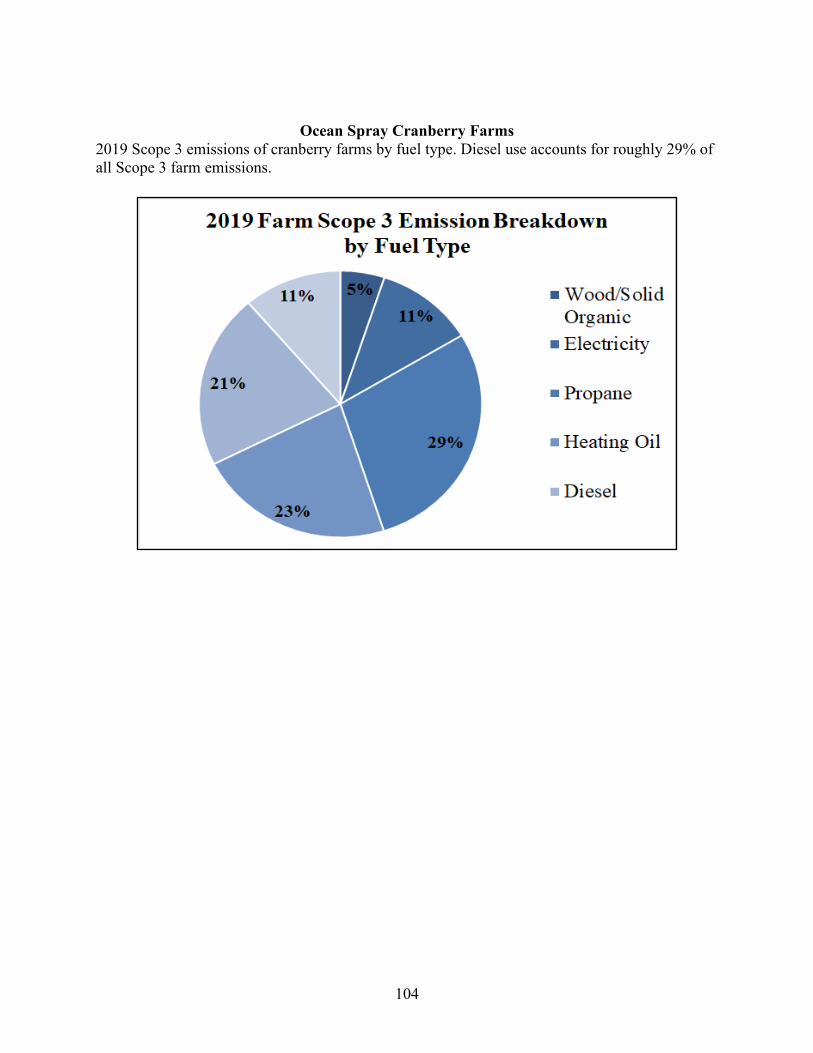
104
Ocean Spray Cranberry Farms 2019 Scope 3 emissions of cranberry farms by fuel type. Diesel use accounts for roughly 29% of all Scope 3 farm emissions.

105
Appendix F: Emissions Activity Breakdowns by Manufacturing Facilities Note: These are the actual values from the Accuvio report and were rounded to the nearest tenth -- other tables and graphs in the report (non-Appendix) have rounded values with no decimal place. Facility A Scope Source End Use Activity Input tonnes CO2e
Scope 1 Stationary Combustion Not Specified Residual Fuel Oil No. 6 1,747.6
Scope 1 Mobile Combustion- Owned Fleet
Transport Propane 257.4
Scope 1 Stationary Combustion Facility Heating Natural Gas 18,191.1
Total Scope 1 Emissions 20,196.0
Scope 2 Purchased and Used Electricity
Facility Electricity Supply
Electricity 6,526.1
Total Scope 2 Emissions 6,526.1
Scope 3 Fuel- and Energy-Related Activities Not Included in Scope 1 or Scope 2
Facility Electricity Supply
Electricity 306.6
Scope 3 Purchased goods and services
Facility Water Supply Water Supply 115.1
Scope 3 Waste Facility Waste Water Water Treatment 223.9
Scope 3 Waste Facility Waste Disposal Cardboard (Corrugate and paperboard) - Recycling
4.0
Scope 3 Waste Facility Waste Disposal Sludge - Composting 32.3
Scope 3 Waste Facility Waste Disposal Organic Waste (Cranberry, Ingredient, By Product - NOT Rework) - Composting
89.0
Scope 3 Waste Facility Waste Disposal Wood - Recycling 0.04
Scope 3 Waste Facility Waste Disposal Mixed Metals - Recycling
1.1
Scope 3 Waste Facility Waste Disposal Construction, Demolition, and Excavation - Average -
0.03

106
Recycling
Scope 3 Waste Facility Waste Disposal Mixed Plastics - Recycling
0.08
Scope 3 Waste Facility Waste Disposal Mixed Municipal Waste - Incineration
5.1
Scope 3 Waste Facility Waste Disposal Organic Waste (Cranberry, Ingredient, By Product - NOT Rework) - Animal Feed
114.5
Total Scope 3 Emissions 891.7
Total Emissions 27,613.8
Facility B Scope Source End Use Activity Input tonnes CO2e
Scope 1 Stationary Combustion Not Specified Residual Fuel Oil No. 5 5,628.4
Scope 1 Stationary Combustion Not Specified Propane 1,399.5
Scope 1 Mobile Combustion- Owned Fleet
Transport Diesel 80.6
Scope 1 Fugitive Emissions Facility Cooling and Refrigeration
R410A 133.2
Total Scope 1 Emissions 7,241.8
Scope 2 Purchased and Used Electricity
Facility Electricity Supply
Electricity 4,887.0
Total Scope 2 Emissions 4,887.0
Scope 3 Fuel- and Energy-Related Activities Not Included in Scope 1 or Scope 2
Facility Electricity Supply
Electricity 607.8
Scope 3 Waste Facility Water Supply Water Treatment 202.5
Scope 3 Purchased goods and services
Facility Water Supply Water Supply 1.1
Scope 3 Waste Facility Waste Water Water Treatment 80.6
Scope 3 Waste Facility Waste Disposal Mixed Municipal Waste - 22.8

107
Landfill
Scope 3 Waste Facility Waste Disposal Organic Waste (Cranberry, Ingredient, By Product - NOT Rework) - Composting
31.1
Scope 3 Waste Facility Waste Disposal Cardboard (Corrugate and paperboard) - Recycling
1.2
Scope 3 Waste Facility Waste Disposal LDPE and/or LLDPE Plastic - Recycling
1.6
Scope 3 Waste Facility Waste Disposal Hazardous Waste - Landfill
0.2
Scope 3 Waste Facility Waste Disposal Sludge - Biodigester 7.3
**Outside of Scopes**
Fugitive Emissions Facility Cooling and Refrigeration
HCFC-22/R22 - Chlorodifluoromethane
44.0
Total Scope 3 Emissions 956.2
Total Emissions 13,129.1
Facility C Scope Source End Use Activity Input tonnes CO2e
Scope 1 Mobile Combustion- Owned Fleet
Transport Propane 118.2
Scope 1 Stationary Combustion Facility Heating Natural Gas 8,621.1
Total Scope 1 Emissions 8,739.3
Scope 2 Purchased and Used Electricity
Facility Electricity Supply
Electricity 9,235.4
Total Scope 2 Emissions 9,235.4
Scope 3 Fuel- and Energy-Related Activities Not Included in Scope 1 or Scope 2
Facility Electricity Supply
Electricity 433.9
Scope 3 Purchased goods and services
Facility Water Supply Water Supply 349.7

108
Scope 3 Waste Facility Water Supply Water Treatment 319.9
Scope 3 Waste Facility Waste Disposal Mixed Municipal Waste - Landfill
729.6
Scope 3 Waste Facility Waste Disposal Organic Waste (Cranberry, Ingredient, By Product - NOT Rework) - Composting
13.7
Scope 3 Waste Facility Waste Disposal Mixed Municipal Waste - Recycling
11.6
Total Scope 3 Emissions 1,858.5
Total Emissions 19,833.2
Facility D Scope Source End Use Activity Input tonnes CO2e
Scope 1 Stationary Combustion Not Specified Propane 56.8
Scope 1 Mobile Combustion- Owned Fleet
Transport Propane 54.5
Scope 1 Mobile Combustion- Owned Fleet
Transport Motor Gasoline 1.1
Total Scope 1 Emissions 112.3
Scope 2 Purchased Heat and Steam Facility Heating Onsite heat and steam 5,026.7
Scope 2 Purchased and Used Electricity
Facility Electricity Supply
Electricity 4,250.5
Total Scope 2 Emissions 9,277.2
Scope 3 Fuel- and Energy-Related Activities Not Included in Scope 1 or Scope 2
Facility Electricity Supply
Electricity 188.0
Scope 3 Purchased goods and services
Facility Water Supply Water Supply 126.8
Scope 3 Waste Facility Water Supply Water Treatment 149.2
Scope 3 Waste Facility Waste Disposal Mixed Municipal Waste-Landfill
55.2

109
Scope 3 Waste Facility Waste Disposal Organic Waste (Cranberry, Ingredient, By Product - NOT Rework) - Composting
21.0
Scope 3 Waste Facility Waste Disposal Mixed Municipal Waste - Recycling
60.2
Scope 3 Waste Facility Waste Disposal Aluminum - Incineration 7.0
Total Scope 3 Emissions 607.4
Total Emissions 9,996.8
Facility E Scope Source End Use Activity Input tonnes CO2e
Scope 1 Stationary Combustion Facility Heating Propane 570.6
Scope 1 Stationary Combustion Facility Heating Natural Gas 2,642.2
Scope 1 Stationary Combustion Not Specified Distillate Fuel Oil No. 2 406.4
Scope 1 Mobile Combustion- Owned Fleet
Transport Propane 17.6
Total Scope 1 Emissions 3,636.8
Scope 2 Purchased and Used Electricity
Facility Electricity Supply
Electricity 3,645.5
Total Scope 2 Emissions 3,645.5
Scope 3 Waste Facility Waste Water Water Treatment 179.9
Scope 3 Purchased goods and services
Facility Water Supply Water Supply 28.0
Scope 3 Fuel- and Energy-Related Activities Not Included in Scope 1 or Scope 2
Facility Electricity Supply
Electricity 161.9
Scope 3 Waste Facility Waste Disposal Mixed Municipal Waste - Landfill
9.6
Scope 3 Waste Facility Waste Disposal Mixed Recyclables - Recycling
0.98
Scope 3 Waste Facility Waste Disposal Mixed Commercial and 12.5

110
Industrial Waste - Landfill
Scope 3 Waste Facility Waste Disposal Mixed Commercial and Industrial Waste - Recycling
1.5
Scope 3 Waste Facility Waste Disposal Sludge - Land Application
18.2
Scope 3 Waste Facility Waste Disposal Organic Waste (Cranberry, Ingredient, By Product - NOT Rework) - Composting
46.0
Total Scope 3 Emissions 458.6
Total Emissions 7,741.0
Facility F Scope Source End Use Activity Input tonnes CO2e
Scope 1 Mobile Combustion- Owned Fleet
Transport Propane 47.1
Scope 1 Mobile Combustion- Owned Fleet
Transport Motor Gasoline 11.5
Scope 1 Mobile Combustion- Owned Fleet
Transport Diesel 10.4
Scope 1 Stationary Combustion Facility Heating Natural Gas 13,073.1
Total Scope 1 Emissions 13,142.0
Scope 2 Purchased and Used Electricity
Facility Electricity Supply
Electricity 8,310.0
Total Scope 2 Emissions 8,310.0
Scope 3 Purchased goods and services
Facility Water Supply Water Supply 51.7
Scope 3 Waste Facility Waste Water Water Treatment 100.4
Scope 3 Fuel- and Energy-Related Activities Not Included in Scope 1 or Scope 2
Facility Electricity Supply
Electricity 390.4

111
Scope 3 Waste Facility Waste Disposal Mixed Commercial and Industrial Waste - Landfill
10.3
Scope 3 Waste Facility Waste Disposal Mixed Recyclables - Recycling
0.4
Scope 3 Waste Facility Waste Disposal Sludge - Land Application
1.7
Scope 3 Waste Facility Waste Disposal Organic Waste (Cranberry, Ingredient, By Product - NOT Rework) - Animal Feed
2.1
Total Scope 3 Emissions 557.0
Total Emissions 22,009.0
Facility G Scope Source End Use Activity Input tonnes CO2e
Scope 1 Mobile Combustion- Owned Fleet
Transport Propane 121.8
Scope 1 Mobile Combustion- Owned Fleet
Transport Motor Gasoline 1.0
Scope 1 Stationary Combustion Facility Heating Natural Gas 4,102.6
Total Scope 1 Emissions 4,225.4
Scope 2 Purchased and Used Electricity
Facility Electricity Supply
Electricity 4,702.4
Total Scope 2 Emissions 4,702.4
Scope 3 Waste Facility Waste Water Water Treatment 121.7
Scope 3 Fuel- and Energy-Related Activities Not Included in Scope 1 or Scope 2
Facility Electricity Supply
Electricity 241.5
Scope 3 Purchased goods and services
Facility Water Supply Water Supply 119.4
Scope 3 Waste Facility Waste Disposal Mixed Municipal Waste - Landfill
114.9

112
Scope 3 Waste Facility Waste Disposal Cardboard (Corrugated and paperboard) - Recycling
3.6
Scope 3 Waste Facility Waste Disposal Mixed Metals - Recycling
0.7
Scope 3 Waste Facility Waste Disposal Mixed Plastics - Recycling
2.4
Scope 3 Waste Facility Waste Disposal Sludge - Land Application
49.0
Total Scope 3 Emissions 653.2
Total Emissions 9,581.0
Facility H Scope Source End Use Activity Input tonnes CO2e
Scope 1 Stationary Combustion Process Equipment Operation
Landfill Gas 34.4
Scope 1 Stationary Combustion Facility Heating Propane 6.0
Scope 1 Stationary Combustion Facility Heating Natural Gas 10,569.3
Scope 1 Mobile Combustion- Owned Fleet
Onsite Transportation Propane 4.1
Total Scope 1 Emissions 10,613.8
Scope 2 Purchased and Used Electricity
Facility Electricity Supply
Electricity 15,326.7
Total Scope 2 Emissions 15,326.7
Scope 3 Purchased goods and services
Facility Water Supply Water Supply 84.8
Scope 3 Waste Facility Waste Water Water Treatment 167.6
Scope 3 Fuel- and Energy-Related Activities Not Included in Scope 1 or Scope 2
Facility Electricity Supply
Electricity 720.1
Scope 3 Waste Facility Waste Disposal Mixed Municipal Waste - 111.8

113
Landfill
Scope 3 Waste Facility Waste Disposal Mixed Municipal Waste - Recycling
3.8
Scope 3 Waste Facility Waste Disposal Organic Waste (Cranberry, Ingredient, By Product - NOT Rework) - Landfill
86.3
Scope 3 Waste Facility Waste Disposal Organic Waste (Cranberry, Ingredient, By Product - NOT Rework) - Animal Feed
81.0
Total Scope 3 Emissions 1,255.4
Biomass Stationary Combustion Process Equipment Operation
Landfill Gas 6,688.3
Total Biomass Emissions 6,688.3
Total Emissions 33,884.2
Facility I Scope Source End Use Activity Input tonnes CO2e
Scope 1 Stationary Combustion Facility Heating Propane 5,143.6
Scope 1 Mobile Combustion- Owned Fleet
Transport Light-duty Gasoline Vehicles (LDGVs) - EPA Tier 2
5.1
Total Scope 1 Emissions 5,148.7
Scope 2 Purchased and Used Electricity
Facility Electricity Supply
Electricity 8.0
Total Scope 2 Emissions 8.0
Scope 3 Waste Facility Waste Water Water Treatment 36.2
Scope 3 Fuel- and Energy-Related Activities Not Included in Scope 1 or Scope 2
Facility Electricity Supply
Electricity 3.3
Scope 3 Purchased goods and services
Facility Water Supply Water Supply 20.0
Scope 3 Waste Facility Waste Disposal Mixed Municipal Waste - 2.1

114
Recycling
Scope 3 Waste Facility Waste Disposal Sludge - Biodigester 111.8
Scope 3 Waste Facility Waste Disposal Organic Waste (Cranberry, Ingredient, By Product - NOT Rework) - Composting
39.2
Scope 3 Waste Facility Waste Disposal Mixed commercial and industrial waste - Landfill
70.7
Total Scope 3 Emissions 283.3
Total Emissions 5,440.0
Facility J Scope Source End Use Activity Input tonnes CO2e
Scope 1 Stationary Combustion Facility Heating Natural Gas 17,408.8
Total Scope 1 Emissions 17,408.8
Scope 2 Purchased and Used Electricity
Facility Electricity Supply
Electricity 16,043.3
Total Scope 2 Emissions 16,043.3
Scope 3 Fuel- and Energy-Related Activities Not Included in Scope 1 or Scope 2
Facility Electricity Supply
Electricity 751.7
Scope 3 Purchased goods and services
Facility Water Supply Water Supply 241.0
Scope 3 Waste Facility Water Supply Water Treatment 236.2
Scope 3 Waste Facility Waste Disposal Organic Waste (Cranberry, Ingredient, By Product - NOT Rework) - Composting
10.6
Scope 3 Waste Facility Waste Disposal Cardboard (Corrugate and paperboard) - Recycling
4.1
Scope 3 Waste Facility Waste Disposal Wood - Recycling 9.1

115
Scope 3 Waste Facility Waste Disposal Steel - Recycling 2.5
Scope 3 Waste Facility Waste Disposal Mixed Plastics - Recycling
1.6
Scope 3 Waste Facility Waste Disposal PET Plastic - Recycling 1.7
Scope 3 Waste Facility Waste Disposal LDPE and/or LLDPE Plastic - Recycling
0.6
Scope 3 Waste Facility Waste Disposal Mixed Municipal Waste - Incineration
4.0
Total Scope 3 Emissions 1,263.2
Total Emissions 34,715.3

116
Appendix G. Emissions Activity Breakdowns by Receiving Facilities Facility K Scope Source End Use Activity Input tonnes CO2e
Scope 1 Stationary Combustion Facility Heating Propane 172.0
Total Scope 1 Emissions 172.0
Scope 2 Purchased and Used Electricity
Facility Electricity Supply
Electricity 223.9
Total Scope 2 Emissions 223.9
Scope 3 Purchased goods and services
Facility Water Supply Water Supply 47.0
Scope 3 Waste Facility Waste Disposal Organic Waste (Cranberry, Ingredient, By Product - NOT Rework) - Composting
53.9
Scope 3 Waste Facility Waste Disposal Mixed Municipal Waste - Landfill
48.7
Scope 3 Fuel- and Energy-Related Activities Not Included in Scope 1 or Scope 2
Facility Electricity Supply
Electricity 11.3
Total Scope 3 Emissions 160.9
Total Emissions 556.8
Facility L Scope Source End Use Activity Input tonnes CO2e
Scope 1 Mobile Combustion- Owned Fleet
Onsite Transportation Propane 16.1
Scope 1 Mobile Combustion- Owned Fleet
Onsite Transportation Gasoline 6.2
Scope 1 Stationary Combustion Facility Heating Propane 133.4
Scope 1 Stationary Combustion Machine Drive Diesel 5.5
Total Scope 1 Emissions 161.3
Scope 2 Purchased and Used Facility Electricity Electricity 576.6

117
Electricity Supply
Total Scope 2 Emissions 576.6
Scope 3 Purchased goods and services
Facility Water Supply Water Supply 3.6
Scope 3 Waste Facility WasteWater Water Treatment 8.3
Scope 3 Fuel- and Energy-Related Activities Not Included in Scope 1 or Scope 2
Facility Electricity Supply
Electricity 29.6
Scope 3 Waste Facility Waste Disposal Mixed Municipal Waste - Landfill
11.2
Scope 3 Waste Facility Waste Disposal Cardboard (Corrugate and paperboard) - Recycling
0.3
Scope 3 Waste Facility Waste Disposal Batteries (Post Consumer Non Automotive) - Landfill
0.005
Scope 3 Waste Facility Waste Disposal WEEE - Mixed - Landfill 0.0
Scope 3 Waste Facility Waste Disposal Organic Waste (Cranberry, Ingredient, By Product - NOT Rework) - Composting
7.1
Total Scope 3 Emissions 60.1
Total Emissions 797.9
Facility M Scope Source End Use Activity Input tonnes CO2e
Scope 1 Stationary Combustion Electricity Generation Natural Gas 62.4
Scope 1 Stationary Combustion Other Process Uses Gasoline 0.5
Scope 1 Mobile Combustion- Owned Fleet
Onsite Transportation Propane 36.4
Scope 1 Mobile Combustion- Owned Fleet
Onsite Transportation Light-duty Gasoline Vehicles (LDGVs) - EPA Tier 1
1.7
Scope 1 Mobile Combustion- Owned Onsite Transportation Light-duty Gasoline 0.9

118
Fleet Trucks (LDGTs) - EPA Tier 2
Total Scope 1 Emissions 101.9
Scope 2 Purchased and Used Electricity
Facility Electricity Supply
Electricity 3.3
Total Scope 2 Emissions 3.3
Scope 3 Purchased goods and services
Facility Water Supply Water Supply 9.9
Scope 3 Waste Facility Waste Water Water Treatment 15.3
Scope 3 Waste Facility Waste Disposal Organic Waste (Cranberry, Ingredient, By Product - NOT Rework) - Composting
3.2
Scope 3 Waste Facility Waste Disposal Cardboard (Corrugate and paperboard) - Recycling
0.03
Scope 3 Waste Facility Waste Disposal Mixed Municipal Waste - Landfill
0.96
Scope 3 Waste Facility Waste Disposal Wood - Landfill 85.6
Scope 3 Fuel- and Energy-Related Activities Not Included in Scope 1 or Scope 2
Facility Electricity Supply
Electricity 0.2
Total Scope 3 Emissions 1153
Total Emissions 219
Facility N Scope Source End Use Activity Input tonnes CO2e
Scope 1 Stationary Combustion Facility Heating Natural Gas 186.3
Total Scope 1 Emissions 186.3
Scope 2 Purchased and Used Electricity
Facility Electricity Supply
Electricity 408.3
Total Scope 2 Emissions 408.3

119
Scope 3 Fuel- and Energy-Related Activities Not Included in Scope 1 or Scope 2
Facility Electricity Supply
Electricity 19.2
Total Scope 3 Emissions 19.2
Total Emissions 613.8
Facility O Scope Source End Use Activity Input tonnes CO2e
Scope 1 Stationary Combustion Electricity Generation Natural Gas 36.7
Scope 1 Stationary Combustion Other Process Uses Gasoline 0.5
Scope 1 Stationary Combustion Other Process Uses Diesel 0.6
Scope 1 Mobile Combustion- Owned Fleet
Onsite Transportation Propane 15.3
Scope 1 Mobile Combustion- Owned Fleet
Onsite Transportation Light-duty Gasoline Trucks (LDGTs) - EPA Tier 2
2.4
Total Scope 1 Emissions 55.5
Scope 2 Purchased and Used Electricity
Facility Electricity Supply
Electricity 2.0
Total Scope 2 Emissions 2.0
Scope 3 Purchased goods and services
Facility Water Supply Water Supply 4.3
Scope 3 Waste Facility Waste Water Water Treatment 7.7
Scope 3 Waste Facility Waste Disposal Mixed Municipal Waste- Landfill
0.8
Scope 3 Waste Facility Waste Disposal Organic Waste (Cranberry, Ingredient, By Product - NOT Rework) - Composting
3.3
Scope 3 Waste Facility Waste Disposal Wood- Landfill 59.1
Scope 3 Fuel- and Energy-Related Activities Not Included in Scope 1 or Scope 2
Facility Electricity Supply
Electricity 0.2

120
Total Scope 3 Emissions 71
Total Emissions 128
Facility P Scope Source End Use Activity Input tonnes CO2e
Scope 1 Mobile Combustion- Owned Fleet
Onsite Transportation Propane 10.8
Scope 1 Mobile Combustion- Owned Fleet
Onsite Transportation Gasoline 3.5
Scope 1 Mobile Combustion- Owned Fleet
Onsite Transportation Diesel 0.8
Total Scope 1 Emissions 15.1
Scope 2 Purchased and Used Electricity
Facility Electricity Supply
Electricity 16.9
Total Scope 2 Emissions 16.9
Scope 3 Purchased goods and services
Facility Water Supply Water Supply 0.4
Scope 3 Waste Facility Waste Disposal Mixed Municipal Waste- Landfill
0.01
Scope 3 Waste Facility Waste Disposal Organic Waste (Cranberry, Ingredient, By Product - NOT Rework) - Composting
4.5
Scope 3 Waste Facility Waste Disposal Wood- Landfill 0.05
Scope 3 Waste Facility Waste Disposal Batteries (Post Consumer Non Automotive) - Recycling - Open Loop
0.0
Scope 3 Waste Facility Waste Disposal Universal Waste - Lightbulbs (fluorescent and compact) - Recycling
0.0
Scope 3 Fuel- and Energy-Related Activities Not Included in Scope 1 or Scope 2
Facility Electricity Supply
Electricity 0.9

121
Total Scope 3 Emissions 5.8
Total Emissions 37.8
Facility Q Scope Source End Use Activity Input tonnes CO2e
Scope 1 Stationary Combustion Facility Heating Propane 78.4
Scope 1 Mobile Combustion- Owned Fleet
Onsite Transportation Propane 12.2
Scope 1 Mobile Combustion- Owned Fleet
Onsite Transportation Gasoline 11.8
Scope 1 Mobile Combustion- Owned Fleet
Onsite Transportation Diesel 2.8
Total Scope 1 Emissions 105.3
Scope 2 Purchased and Used Electricity
Facility Electricity Supply
Electricity 80.4
Total Scope 2 Emissions 80.4
Scope 3 Purchased goods and services
Facility Water Supply Water Supply 7.8
Scope 3 Waste Facility Waste Disposal Organic Waste (Cranberry, Ingredient, By Product - NOT Rework) - Composting
14.7
Scope 3 Waste Facility Waste Disposal Mixed Commercial and Industrial Waste - Landfill
12.3
Scope 3 Fuel- and Energy-Related Activities Not Included in Scope 1 or Scope 2
Facility Electricity Supply
Electricity 4.1
Total Scope 3 Emissions 38.0
Total Emissions 224.6
Facility R

122
Scope Source End Use Activity Input tonnes CO2e
Scope 1 Mobile Combustion- Owned Fleet
Onsite Transportation Propane 13.5
Scope 1 Mobile Combustion- Owned Fleet
Onsite Transportation Gasoline 7.9
Total Scope 1 Emissions 21.4
Scope 2 Purchased and Used Electricity
Facility Electricity Supply
Electricity 39.9
Total Scope 2 Emissions 39.9
Scope 3 Purchased goods and services
Facility Water Supply Water Supply 2.3
Scope 3 Waste Facility Waste Disposal Organic Waste (Cranberry, Ingredient, By Product - NOT Rework) - Composting
5.6
Scope 3 Waste Facility Waste Disposal Mixed Municipal Waste - Landfill
4.2
Scope 3 Waste Facility Waste Disposal Batteries (Post Consumer Non Automotive) - Landfill
0.0
Scope 3 Fuel- and Energy-Related Activities Not Included in Scope 1 or Scope 2
Facility Electricity Supply
Electricity 2.1
Total Scope 3 Emissions 14.2
Total Emissions 75.6

123
Appendix H: Outline of Presentation for Leadership Decision Meeting (ideal presentation time: 30 min)
1. Title slide: Ocean Spray Climate Change Strategy 2. Overview Slide: Agenda and Decision Point
a. Project Background and External Landscape b. GHG inventory initial results c. Barriers and Opportunities d. Recommendation - Commit to Science Based Target Initiative in September
3. Context on Climate Change and Business a. Corporations are increasingly starting to brand themselves as contributing to
carbon neutrality and climate change mitigation. b. Climate change mitigation is urgent because of the skyrocketing global emissions
worldwide c. United Nations: COVID-19 shutdowns is “just a blip” on GHG Emissions
4. Business Risks and Opportunities (For more details see chapter 6) a. Regulatory Risks
i. A central focus of Biden-Harris administration is around climate change ii. “public companies to disclose climate risks and the greenhouse gas
emissions in their operations and supply chains” iii. “decarbonizing the agriculture sector” iv. Congress: plan for a regulated price carbon v. FACA: incentivize farmers to implement tools such as renewable energy
and carbon sequestration vi. State level: There will be carbon taxes worldwide, especially in regions
that commits to be carbon neutral by 2050 (e.g., the EU) b. Economic Risks
i. Reduction in productivity will lead to increased cost of damages and lead to increased competition for water resources and challenge consistent profitability
ii. More damage due to natural disasters iii. Explicit risks to cranberry crops and other ingredients OSC sources from
agriculture due to climate change (temperature, precipitation, and pests, the risks to soil and agricultural growth environments) will result in OSC not having tenable crops for its products year to year.
c. Reputational Risks i. More competitors in the beverage and agriculture industries are taking the
lead to mitigate climate change (Nestle, Coca-Cola) ii. Major retailers such as Walmart and Target are setting GHG emission
reduction goals that require supplier participation (Walmart Project Gigaton and Sustainability Questionnaire; Target Requests to submit to CDP. HIGHLIGHT: Specifically for Ocean Spray we have customers requiring us to participate in their own climate change ambitions)
iii. Consumers are seeking more sustainability-marketed products and are willing to pay more for sustainability
iv. Investors have increased interests in businesses’ sustainability efforts

124
v. The pressure for sustainability from customers and investors only increased after the COVID-19 pandemic
5. What are other companies doing? (For more details see section 1.3.4 and section 4.2) a. Over a thousand companies worldwide are leading the zero-carbon transition by
setting emissions reduction targets grounded in climate science through the SBTi. b. One-quarter of the food and beverage companies analyzed (Valio, Rx Bar from
Kellogg Company, Chobani, Dairy Farmers of America, Inc., and Starbuck Coffee) have already committed to SBTi goals for climate mitigation.
c. Most companies analyzed began committing to GHG targets in 2015 and aim to achieve their goals in 12 to 13 years (target year of 2027 to 2028).
6. Progress at Ocean Spray a. Inventory data in Accuvio Greenhouse Gas software (For more details in section
2.1) b. Farm Stewardship Assessment (For more details in Section 2.4) c. In the past Ocean Spray has been building on historical sustainability scorecard,
past efficiencies, Accuvio Greenhouse Gas software, cranberry farm assessment but the data quality varies and should be standardized in the future.
7. Timeline of New Climate Change Project (LEAVE BLANK FOR FUTURE INFO) 8. What goes into a GHG inventory? (For more details see section 2.1 and Table 1)
a. Scope 1: Natural Gas, Diesel, Propane, Fuel oil, Landfill Gas b. Scope 2: Purchased electricity and Steam c. Scope 3: Gasoline, Diesel, Heating Oil, Propane, Waste, Wastewater Discharge,
Water, Other fuel and energy 9. Results of Scope 1 and 2 (For more details see Chapter 3)
a. Scope 1 emissions, the majority of emissions, accounted for 51% of the total emissions at 91,264.1 tonnes of CO2e. Scope 2 emissions were second at 44% of total emissions with 77,197.0 tonnes of CO2e.
10. Results from Scope 3 (For more details see Chapter 3) a. Scope 3 emissions were roughly 5% of total emissions with 9,165.4 tonnes of
CO2e. 11. Requirements from Science Based Target Initiative (For more details see Chapter 4)
a. SBTi requires time boundaries and specific techniques for companies to reach their goals
b. Process overview: i. Company submits proposed emission reduction targets to SBTi for
approval within 2 years of initial commitment ii. SBTi reviews targets within 30 business days of submission and confirms
if a company’s target is verified iii. If a company falls short in achieving their targets, there is no consequence
from SBTi directly, but it runs the risk of public damage to their brand. 12. Realm of Target for Ocean Spray
a. Method: Using the Science-Based Target setting tool provided by SBTi, setting the absolute contraction approach, using 2019 as the baseline year, 2059 as the target year for 2°C scenario, entering the corresponding Scope 1 and Scope 2 emissions.

125
GHG Emissions Reduction Timeline
13. Mitigation Options to Research Further (For more details see Chapter 5 and 6)
a. Facility J i. Power Purchase Agreement (PPA)
ii. Renewable Energy Certificate (RECs) b. Facility D
i. Onsite Battery Energy Storage System: sunny weather, however not financially viable
ii. Power Purchase Agreement (PPA): Participating NV GreenEnergy Rider (NGR) (Purchasing 50% renewable energy reduces the facility’s emissions by 22.1%, while 100% renewable reduces emissions by 44.2%)
c. Facility A, Massachusetts: new financial incentive for Combined Heat and Power Project
i. Internal Carbon Pricing (ICP) ii. Alternative Energy Credits (AECs)
iii. Massachusetts Alternative Portfolio Standard (APS) d. Internal Carbon Pricing (ICP)
i. Placing a monetary value on greenhouse gas emissions to help guide decision-making by including hidden costs
ii. Can be in the form of shadow pricing, internal carbon fee, or implicit price e. Green Bonds

126
Appendix I: Company GHG Mitigation Examples
Company name
Sector*
Revenue /M$
GHG Target
GHG Target scenario
Scope 1 & 2 reduction rate
Baseline year for Scope 1 and 2
Target year for Scope 1 and 2
Scope 3 reduction rate
Baseline year for Scope 3
Target year for Scope 3
SBTi goal
SBTi status*
Carbon neutral goal
Framing Mitigation solution*
Tropicana F&B 1 NO - - - - - - NO - NO - -
Blue Diamond
F&B 1.05 NO - - - - - - - NO - NO - EE
Siggi’s F&B 2 NO - - - - - - NO - NO - -
Land O Lakes
F&B 6.81 NO - - - 2025 - - 2025 NO - NO - EE, ERFP
Valio F&B 10 YES - - 2020 2035 - 2020 2035 YES C YES carbon neutral
EE, ERFP, RE
Peak Design
TAL 15 YES 1.5C 50% 2018 2030 Not specified yet
2018 2030 YES V NO - COs
Minute Maid (Under Coca cola)
F&B 34.5 YES 2C 25% 2015 2030 25% 2015 2030 YES V NO - EE, DNO, ERFP
Naked Juice (Under PepsiCo.)
F&B 57.4 YES 2C 20% 2015 2030 20% 2015 2030 YES V NO - EE, DNO, RE
Pattern S.P.A.
TAL 65.36 YES 1.5C 50% 2018 2030 Not specified yet
2018 2030 YES V YES carbon neutral
EE, RE, CO-TI
RxBar (Kellogg Company)
F&B 130 Yes 2C 15% 2015 2030 20% 2015 2030 YES C NO - DNO
Happy Family (baby food)
F&B 200 NO - - - - - - - NO - NO - ERFP, EE
Pom Wonderful
F&B 250 NO - - - - - - - NO - NO - EE, RE

127
Welch's F&B 388 NO - - - - - NO - NO - -
Chobani F&B 500 NO - - - - - - - YES C YES North Star Goals
EE, RE, E/CFT, DNO
Calavo growers
F&B 500 NO - - - - - - - NO - NO - EE
Ted Baker TAL 617.4 NO - - - - - - - YES C NO - EE, DNO
TAIHO Pharmaceutical CO., LTD P&B
1,329 YES 2C 30% 2017 2030 20% 2017 2030 YES V NO - -
Maple Leaf Foods Inc.
F&B 3,000 YES 2C 30% 2018 2030 30% 2018 2030 YES V YES Carbon Neutral
EE, CO-SC, CO-NB
Lululemon TAL 3,290 YES 1.5C 60% 2018 2030 60% 2018 2030 YES V NO - RECs, PPA, DNO
Brown forman
F&B 3,360 YES - 15% 2012 2023 - 2012 2023 NO - NO - EE
Levi Strauss & Co.
TAL 5,600 YES 1.5C 90% 2016 2025 40% 2016 2025 YES V NO - DNO, ERFP, RE, RECs
Barry Callebaut
F&B 7,747.54 YES 1.5C 35% 2018 2025 35% 2018 2025 YES V YES carbon and forest positive
EE
Arla F&B 11,800 YES 2C 30% 2015 2030 30% 2015 2030 YES V YES carbon net zero
ERFP, EE, RE, OCCS
Dairy Farmers of America, Inc.
F&B 13,600 YES - 30% 2018 2030 30% 2018 2030 YES C YES a net zero or net negative carbon footprint
OCCS, RE, ERFP
Biogen
P&B
14,400 YES 2C 35% 2013 2030 35% 2013 2030 YES V YES Carbon Neutral
EE, CO-TI
Gap Inc. R 16,600 YES 1.5C 90% 2017 2030 30% 2017 2030 YES V NO - EE, RE

128
UPS
L/D
18,830 NO - 12% - 2025 - - 2025 NO - YES reduce carbon intensity
CO-SC, CO-NB, RE
Starbucks Coffee Company
F&B 26,510 NO - 50% - 2030 - - - YES C YES Resource Positive
RE, DNO, GB
NIKE, Inc. TAL 29,600 YES 1.5C 65% 2015 2030 30% 2015 2030 YES V YES zero carbon and zero waste
EE, RE, CO-TI
Best Buy Co., Inc.
R 42,880 YES 2C 50% 2017 2030 20% 2017 2030 YES V NO - RE, RECs, DNO
IKEA R 48,430 YES 1.5C 80% 2016 2030 50% 2016 2030 YES V YES climate positive
RE, EE, DNO, OCCS
Pfizer Inc.
P&B
51,750 YES 2C 20% 2012 2020 - 2012 2020 YES V NO - RE, EE
PepsiCo F&B 68,158 YES 2C 20% 2015 2030 20% 2015 2030 YES V NO - EE, RE
Target Corporation
R 78,110 YES 2C 30% 2017 2030 30% 2017 2030 YES V NO - RE, EE, DNO, CO-SC
Tesco R 82,710 YES 1.5C 60% 2015 2025 17% 2015 2030 YES V YES net-zero carbon
EE, RE
Microsoft TC 125,843 YES 1.5C 50% 2017 2030 30% 2017 2030 YES V YES carbon negative
RE, COs
Samsung TC 211,200 YES - 70% 2008 2020 - - - NO - NO - -
Apple TC 260,200 YES 1.5C 75% 2015 2030 75% 2015 2030 NO - YES total carbon neutrality
EE, COs, RE,
Amazon R 296,300 YES - - 2020 2031 - 2020 2031 NO - YES net zero carbon
CO-SC, CO-NB
WalMart Stores, Inc.
R 524,000 YES 2C 18% 2015 2025 one billion tonnes
2015 2030 YES V NO - EE, RE

129
*Sector: Food and Beverage Processing: F&B Textile, Apparel, Luxury Goods: TAL Retailing: R Logistics/delivery: L/D Pharmaceuticals and Biotech: P&B Technology: TC *SBTi status: Verified: V Committed: C *Mitigation Solution Categories: Onsite Carbon Capture and Sequestration: OCCS Carbon Offsets: COs Carbon Offsets - Technical Innovation: CO-TI Carbon Offsets - Social Co Benefits: CO-SC Carbon Offsets - Nature Based: CO-NB Virtual PPA: vPPA PPA Green Bonds: GB Energy Efficiency: EE Electric/Clean Fuel Transport: E/CFT Renewable Energy: RE Renewable Energy Credits: RECs Emissions reduction farm practices incentive program: ERFP Distribution network optimization: DNO Internal Carbon Pricing: ICP

130
Appendix J. Draft Press Release Title: Ocean Spray Cranberries, Inc. Sets New Sustainability Goal to Combat Climate Change Text: Ocean Spray Cranberries, Inc., the agricultural cooperative owned by more than 700 farmer families, announces today a major step toward its commitment to sustainability as it becomes the first U.S. fruit cooperative to commit to set a science-based target to reduce greenhouse gas (GHG) emissions. Ocean Spray is ramping up its efforts to combat climate change by developing a comprehensive plan to address its impact on the environment. Ocean Spray Cranberries commits to reduce Scope 1 and 2 GHG emissions X% by Year X from a 2018 base-year. Ocean Spray also commits to reduce Scope 3 GHG emissions X% by YearX from a X base-year. By committing to targets that will be validated by the Science Based Targets initiative (SBTi), Ocean Spray is rigorously supporting the Paris Agreement’s objective to keep global warming to 1.5 degrees Celsius. To reduce climate impact and reach its science-based target, Ocean Spray, its businesses, and its farmer-owners will work across its supply chain to reduce greenhouse gas (GHG) emissions on farms, in processing facilities, and on the road. Key strategies to reduce emissions will be carried out by:
● Improving energy efficiency in all Scopes and expanding the use of renewable energy
● Securing Renewable Energy Certificate (REC) ownership and investing in onsite renewable energy
● Optimizing agricultural inputs in sourcing, enhancing biomass growth and carbon storage in farm practices
● Sourcing post-consumer recycled plastic
Over the course of the next year, Ocean spray will continue developing a series of goals that are in line with the latest science, and ultimately aim to achieve "Net-Zero emissions”. About Ocean Spray: Founded in 1930, Ocean Spray is a vibrant agricultural cooperative owned by more than 700 cranberry farmers in the United States, Canada and Chile who have helped preserve the family farming way of life for generations. The Cooperative's cranberries are currently featured in more than a thousand great-tasting, nutritious products in over 100 countries worldwide. Leading by purpose, Ocean Spray is committed to the power of good—creating good, nutritious food that has a direct and powerful impact for the health of people and planet. All for good. Good for all. For more information visit: www.oceanspray.com About SBTi: Launched in 2015, by partnering with CDP, the United Nations Global Compact (UNGC), World Resources Institute (WRI) and the World Wide Fund for Nature (WWF), the Science Based Targets initiative (SBTi) aims to support the private sector in their efforts to reduce greenhouse gas emissions in line with the latest climate science. Currently, over a thousand companies worldwide are leading the zero-carbon transition by setting emissions reduction targets grounded in climate science through the SBTi. Science-based target setting is becoming part of the yearly

131
reporting practice of companies and the data infrastructure for institutional investors through incorporation in the CDP questionnaire and scoring. Science-based targets are included in CAIT climate data. For more information visit: sciencebasedtargets.org Contact: [email protected] SOURCE Ocean Spray Cranberries, Inc. Related Links http://www.oceanspray.com

School for Environment and Sustainability, 440 Church Street, 3012 Dana Building, Ann Arbor, MI 48109-1041 734-764-1412 | css.umich.edu