2013 Greenhouse Gas Inventory Report_Final
21
The University of North Carolina at Chapel Hill | 2013 Greenhouse Gas Inventory 1
-
Upload
stephen-senter -
Category
Documents
-
view
131 -
download
3
Transcript of 2013 Greenhouse Gas Inventory Report_Final

The University of North Carolina at Chapel Hill | 2013 Greenhouse Gas Inventory 1
The University of North Carolina at Chapel Hill | 2013 Greenhouse Gas Inventory 2
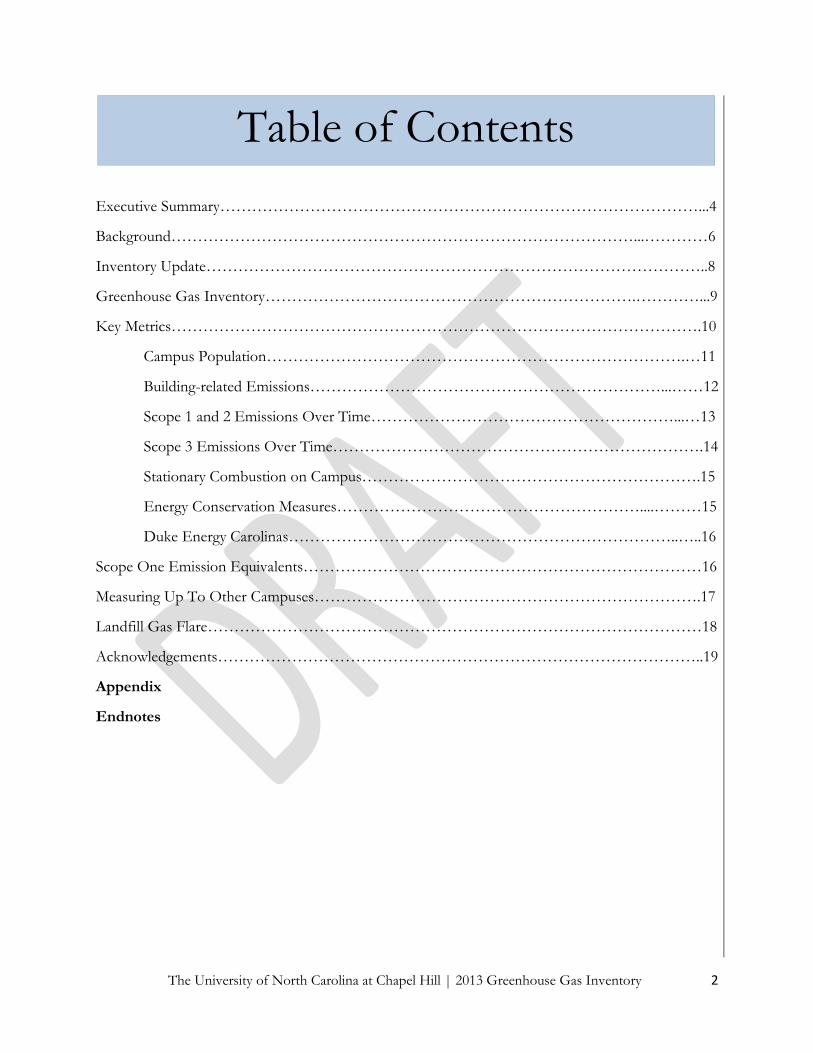
Executive Summary………………………………………………………………………………...4
Background……………………………………………………………………………...…………6
Inventory Update…………………………………………………………………………………..8
Greenhouse Gas Inventory…………………………………………………………….…………...9
Key Metrics……………………………………………………………………………………….10
Campus Population…………………………………………………………………….…11
Building-related Emissions…………………………………………………………...……12
Scope 1 and 2 Emissions Over Time…………………………………………………...…13
Scope 3 Emissions Over Time…………………………………………………………….14
Stationary Combustion on Campus……………………………………………………….15
Energy Conservation Measures…………………………………………………....………15
Duke Energy Carolinas………………………………………………………………..…..16
Scope One Emission Equivalents…………………………………………………………………16
Measuring Up To Other Campuses……………………………………………………………….17
Landfill Gas Flare…………………………………………………………………………………18
Acknowledgements………………………………………………………………………………..19
Appendix
Endnotes
Table of Contents

The University of North Carolina at Chapel Hill | 2013 Greenhouse Gas Inventory 3
Figure 1 – Greenhouse Gas Emissions over Time……………………………………………………………5
Figure 5 – Equivalent measurements of one metric ton of CO2…………………………………………….....7
Table 1 – Current Global Warming Potentials for Greenhouse Gases…………………………………...……8
Table 2 – 2013 Greenhouse Gas Emissions and Totals…………………………………………..………..….9
Figure 6 – Greenhouse Gas Emissions over Time……………………………………………..…………….10
Figure 7 – Greenhouse Gas Emissions by Demand…………………………………………………………10
Figure 8 – Scope 1 and 2 Emissions and Campus Population………………………………………………..11
Table 3 – Campus Population and Emissions……………………………………………………………......11
Figure 9 – Building-Related Emissions……………………..………………………………………………..12
Table 4 – Building-Related Metrics….............................................................................................................................12
Figure 10 – Scope 1 and 2 Emissions over Time...…………………………………………………………..13
Figure 11 – Scope 3 Emissions over Time……………………………………………………….…………..14
Figure 12 – UNC-CH Cogeneration System Emissions...……………………………………..……………..15
Table 5 – Duke Energy Carolinas’ Energy Sources and Percentages……………………………...………….16
Table 6 – Duke Energy Carolinas’ Carbon Intensity over Time…………………………………………….16
Figure 13 – Equivalents to UNC-CH’s Scope 1 Emissions…………………………………………………..16
Appendix A – Scope 1 and 2 Emissions Breakdown, 2007-2013…………………………………………...20
Appendix B – Key Metrics, 2007-2013…………………………………………………………………….21
List of Tables and Figures
The University of North Carolina at Chapel Hill | 2013 Greenhouse Gas Inventory 4
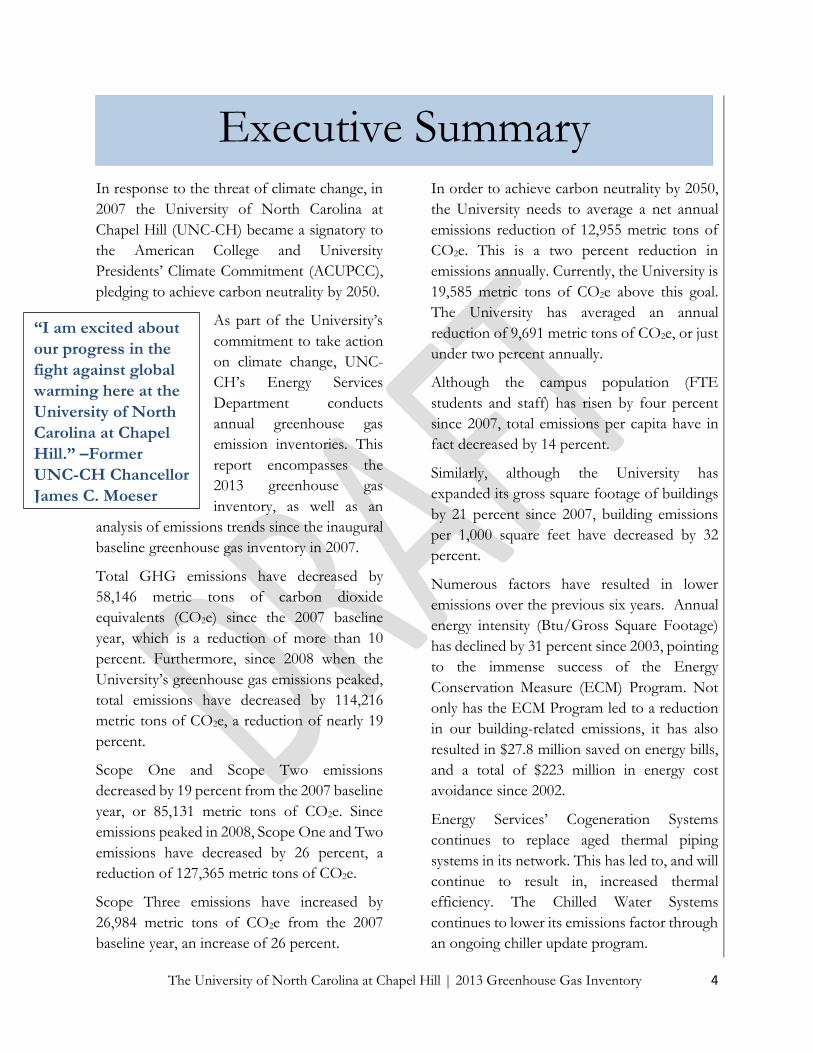
In response to the threat of climate change, in
2007 the University of North Carolina at
Chapel Hill (UNC-CH) became a signatory to
the American College and University
Presidents’ Climate Commitment (ACUPCC),
pledging to achieve carbon neutrality by 2050.
As part of the University’s
commitment to take action
on climate change, UNC-
CH’s Energy Services
Department conducts
annual greenhouse gas
emission inventories. This
report encompasses the
2013 greenhouse gas
inventory, as well as an
analysis of emissions trends since the inaugural
baseline greenhouse gas inventory in 2007.
Total GHG emissions have decreased by
58,146 metric tons of carbon dioxide
equivalents (CO2e) since the 2007 baseline
year, which is a reduction of more than 10
percent. Furthermore, since 2008 when the
University’s greenhouse gas emissions peaked,
total emissions have decreased by 114,216
metric tons of CO2e, a reduction of nearly 19
percent.
Scope One and Scope Two emissions
decreased by 19 percent from the 2007 baseline
year, or 85,131 metric tons of CO2e. Since
emissions peaked in 2008, Scope One and Two
emissions have decreased by 26 percent, a
reduction of 127,365 metric tons of CO2e.
Scope Three emissions have increased by
26,984 metric tons of CO2e from the 2007
baseline year, an increase of 26 percent.
In order to achieve carbon neutrality by 2050,
the University needs to average a net annual
emissions reduction of 12,955 metric tons of
CO2e. This is a two percent reduction in
emissions annually. Currently, the University is
19,585 metric tons of CO2e above this goal.
The University has averaged an annual
reduction of 9,691 metric tons of CO2e, or just
under two percent annually.
Although the campus population (FTE
students and staff) has risen by four percent
since 2007, total emissions per capita have in
fact decreased by 14 percent.
Similarly, although the University has
expanded its gross square footage of buildings
by 21 percent since 2007, building emissions
per 1,000 square feet have decreased by 32
percent.
Numerous factors have resulted in lower
emissions over the previous six years. Annual
energy intensity (Btu/Gross Square Footage)
has declined by 31 percent since 2003, pointing
to the immense success of the Energy
Conservation Measure (ECM) Program. Not
only has the ECM Program led to a reduction
in our building-related emissions, it has also
resulted in $27.8 million saved on energy bills,
and a total of $223 million in energy cost
avoidance since 2002.
Energy Services’ Cogeneration Systems
continues to replace aged thermal piping
systems in its network. This has led to, and will
continue to result in, increased thermal
efficiency. The Chilled Water Systems
continues to lower its emissions factor through
an ongoing chiller update program.
Executive Summary
“I am excited about
our progress in the
fight against global
warming here at the
University of North
Carolina at Chapel
Hill.” –Former
UNC-CH Chancellor
James C. Moeser
The University of North Carolina at Chapel Hill | 2013 Greenhouse Gas Inventory 5
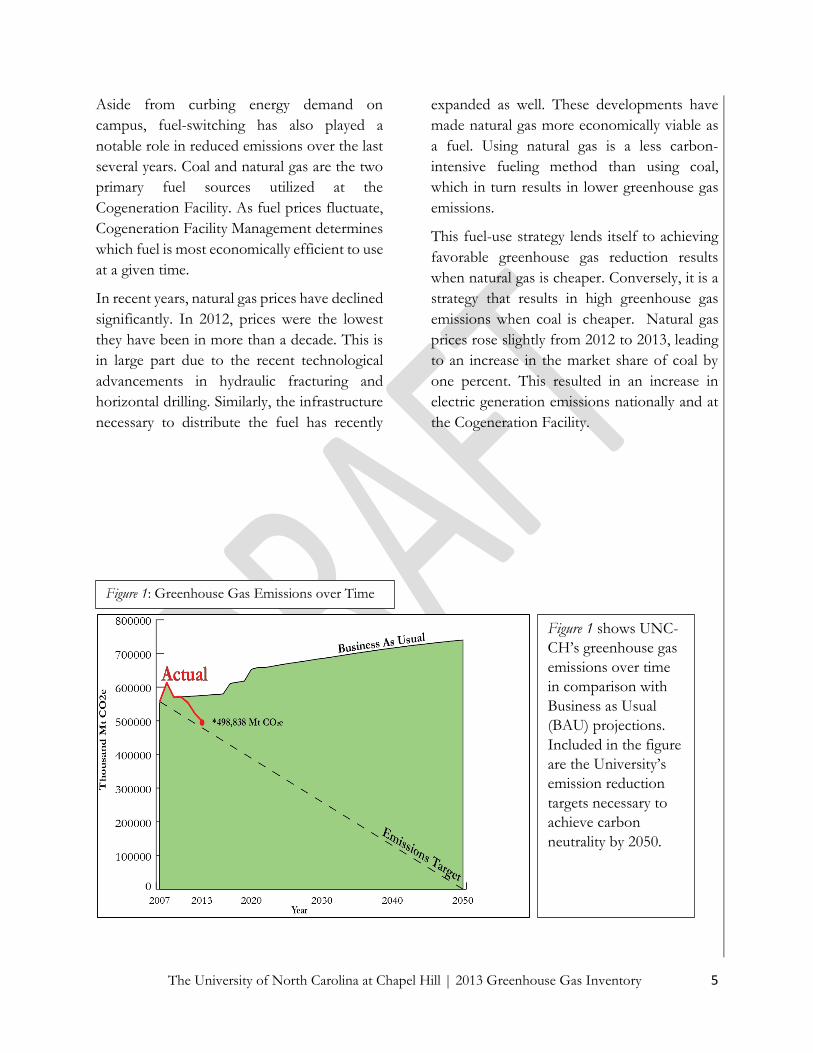
Aside from curbing energy demand on
campus, fuel-switching has also played a
notable role in reduced emissions over the last
several years. Coal and natural gas are the two
primary fuel sources utilized at the
Cogeneration Facility. As fuel prices fluctuate,
Cogeneration Facility Management determines
which fuel is most economically efficient to use
at a given time.
In recent years, natural gas prices have declined
significantly. In 2012, prices were the lowest
they have been in more than a decade. This is
in large part due to the recent technological
advancements in hydraulic fracturing and
horizontal drilling. Similarly, the infrastructure
necessary to distribute the fuel has recently
expanded as well. These developments have
made natural gas more economically viable as
a fuel. Using natural gas is a less carbon-
intensive fueling method than using coal,
which in turn results in lower greenhouse gas
emissions.
This fuel-use strategy lends itself to achieving
favorable greenhouse gas reduction results
when natural gas is cheaper. Conversely, it is a
strategy that results in high greenhouse gas
emissions when coal is cheaper. Natural gas
prices rose slightly from 2012 to 2013, leading
to an increase in the market share of coal by
one percent. This resulted in an increase in
electric generation emissions nationally and at
the Cogeneration Facility.
Figure 1: Greenhouse Gas Emissions over Time
Figure 1 shows UNC-
CH’s greenhouse gas
emissions over time
in comparison with
Business as Usual
(BAU) projections.
Included in the figure
are the University’s
emission reduction
targets necessary to
achieve carbon
neutrality by 2050.
The University of North Carolina at Chapel Hill | 2013 Greenhouse Gas Inventory 6
Greenhouse Gases
A greenhouse gas is a gaseous compound that
absorbs infrared radiation, traps heat in the
atmosphere, and contributes to the greenhouse
effect. Pursuant to the Kyoto Protocol, the
University accounts for five greenhouse gases:
carbon dioxide (CO2), methane (CH4), nitrous
oxide (N2O), hydrofluorocarbons (HFCs),
perfluorocarbons (PFCs), and sulfur
hexafluoride (SF6).
Accounting Protocol
Greenhouse Gas accounting is a relatively new
practice. Methodologies and protocols are
continually changing and becoming more
accurate. Carolina adheres to the methodology
developed by the World Resources Institute
(WRI) and the World Business Council for
Sustainable Development (WBCSD), the
Greenhouse Gas Protocol for the US Public Sector.
This protocol is widely accepted and is utilized
by agencies and organizations like the US
Environmental Protection Agency (EPA), the
EU Emissions Trading Scheme (EU-ETS), and
Duke Energy. Where necessary, the inventory
deviates from the GHG Protocol to most
accurately reflect the unique nuances of the
University’s operations and energy use.
In accordance with the GHG Protocol, Energy
Services strives to adhere to the following
guiding principles throughout the inventory
and reporting process: 1) Relevance, 2)
Completeness, 3) Consistency, 4)
Transparency, and 5) Accuracy.
Boundary Conditions
The boundaries for the University’s inventory
are defined by the Operational Control
Approach. This approach allocates ownership
of emissions to Carolina that are emitted from
an entity that operates under the authority of
the University.
All UNC Hospital System emissions associated
with electricity use are not included in the
inventory. Although the University shares
space and infrastructure with the hospitals, the
hospitals are funded, operated, and managed
separately from the University.
Types of Emissions
Scope One
Scope One emissions are all emissions that are
a direct result of the institution’s operations.
We have direct ownership of, and
responsibility for these emissions from
“cradle-to-grave”. For Carolina, this includes
stationary combustion emissions, fugitive
emissions, as well as mobile combustion
emissions. Scope One emissions are also the
most accurately reported emissions, as all data
in this category is measured directly.
Scope Two
Scope Two emissions are all indirect emissions
that are sourced from purchased electricity,
heat, or steam. Though Carolina does not
create these emissions, it does create the
demand for them. Because Carolina creates the
demand for them, the University is obligated to
assume ownership upon purchasing them. For
Carolina, Scope Two emissions come from all
Background

The University of North Carolina at Chapel Hill | 2013 Greenhouse Gas Inventory 7
of our purchases from Duke Energy. The data
reported in this category, though very reliable,
is not always as complete as Scope One data.
Scope Three
Scope Three includes a broad range of
emission sources, and is considered optional
for reporting under the GHG Accounting
Protocol. Scope Three includes all other indirect
emissions associated with our operations and
activities that do not fall into Scope One or
Two. In reporting Carolina’s Scope Three
emissions, the focus is on targeting significant
emissions sources, as well as sources that have
accessible and reliable data. Major Scope Three
sources that are included in Carolina’s
inventory include emissions from commuters,
solid waste, air travel, and food consumption.
This data is inherently less reliable than Scope
One and Two, and often is based on best
estimations.
What is a metric ton of CO2?
It can be difficult to grasp what one metric ton
of CO2 really is. To better understand a
greenhouse gas inventory, as well as the
impacts that our actions have on the climate, it
can be helpful to equate CO2 into everyday
terms and uses. Unless there is some level of
comprehension of what one metric ton of CO2
actually is, it is impossible to expect people or
an organization to effect real change. Figure 5
helps put one metric ton of carbon dioxide into
perspective.
One metric ton of CO2 is equivalent to…
Figure 5 shows equivalent measurements of one metric ton of carbon dioxide.
The University of North Carolina at Chapel Hill | 2013 Greenhouse Gas Inventory 8
To maintain the integrity of a greenhouse gas inventory database,
it is necessary to regularly update the inventory as new acceptable
practices and protocols are adopted, and as new scientific
consensus emerges on various critical aspects of climate science.
Most notably, Carolina’s inventory database currently reflects
updates from the Environmental Protection Agency regarding
the 100-year Global Warming Potential (GWP) of methane
(CH4) and nitrous oxide (N2O). These updates are reflected in
this report and in all ensuing comparative analyses.
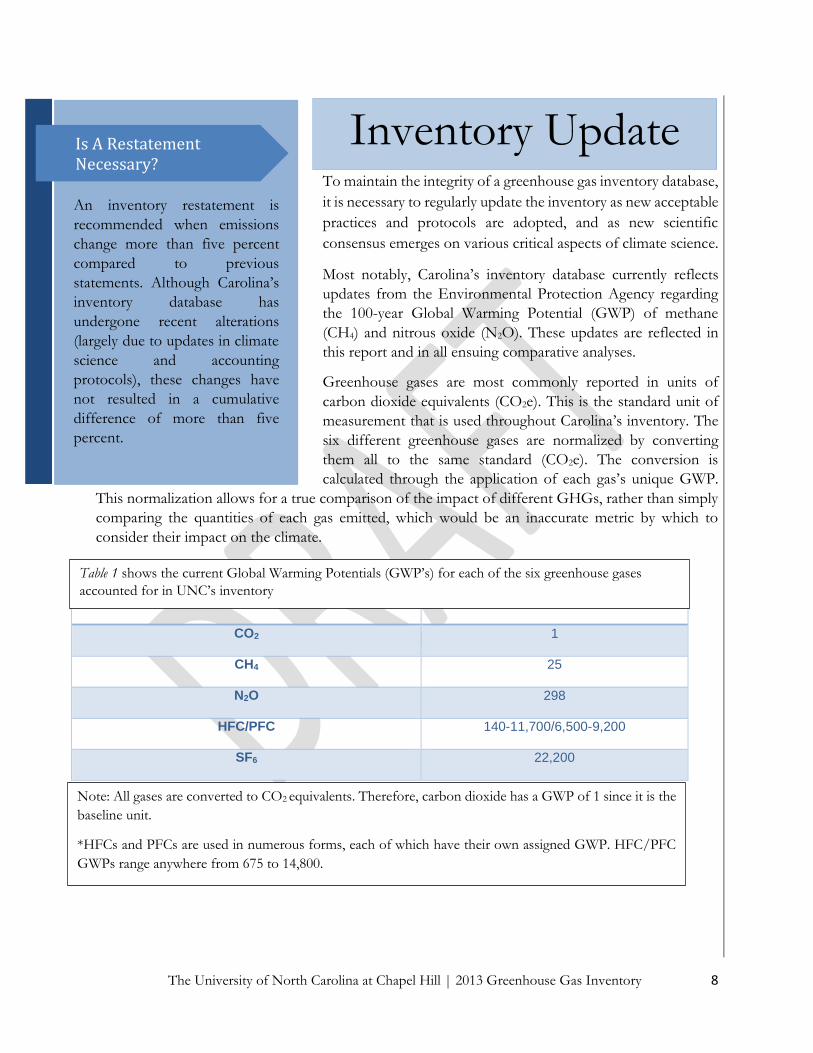
Greenhouse gases are most commonly reported in units of
carbon dioxide equivalents (CO2e). This is the standard unit of
measurement that is used throughout Carolina’s inventory. The
six different greenhouse gases are normalized by converting
them all to the same standard (CO2e). The conversion is
calculated through the application of each gas’s unique GWP.
This normalization allows for a true comparison of the impact of different GHGs, rather than simply
comparing the quantities of each gas emitted, which would be an inaccurate metric by which to
consider their impact on the climate.
GHG GWP
CO2 1
CH4 25
N2O 298
HFC/PFC 140-11,700/6,500-9,200
SF6 22,200
Inventory Update
Table 1 shows the current Global Warming Potentials (GWP’s) for each of the six greenhouse gases
accounted for in UNC’s inventory
Note: All gases are converted to CO2 equivalents. Therefore, carbon dioxide has a GWP of 1 since it is the
baseline unit.
*HFCs and PFCs are used in numerous forms, each of which have their own assigned GWP. HFC/PFC
GWPs range anywhere from 675 to 14,800.
An inventory restatement is
recommended when emissions
change more than five percent
compared to previous
statements. Although Carolina’s
inventory database has
undergone recent alterations
(largely due to updates in climate
science and accounting
protocols), these changes have
not resulted in a cumulative
difference of more than five
percent.
Is A Restatement Necessary?

The University of North Carolina at Chapel Hill | 2013 Greenhouse Gas Inventory 9
Table 2. 2013 GHG Inventory Sources and Emission Totals (*Note: all values are reported in metric tons of CO2e)
SOURCE CO2 CH4 N2O HFC/CFC SF6 SUBTOTAL
Scope 1 236,865.39 24.79 1,084.18 3,934.33 1,995.33 243,904.03
Stationary Combustion
Blackstart Generators 31.06 0.03 0.08 31.17
Building Boilers 6,401.66 2.47 47.44 6,451.57
Cogeneration 219,898.70 18.30 893.47 220,810.46
Emergency Generators 33.52 0.01 0.00 33.53
Manning Steam Plant 8,187.60 3.18 3.79 8,194.58
Fugitive Emissions
HVAC 1,276.76 1,276.76
Laboratory Gases 2,657.57 2,657.57
Water Chillers 112.61 136.79 249.41
Switchgear 1,903.5 1,903.5
Mobile Combustion
Vehicle Fleet 2,200.23 0.79 2.61 2,203.64
Scope 2 121,304.55 101.33 969.02 122,374.90
Purchased Electricity
Duke Energy 148,992.40 102.27 991.41 150,086.07
Progress Energy 251.36 0.13 1.23 252.71
Hospital Sales (27,939.20) (1.06) (23.62) (27,963.89)
Scope 3 129,008.06 3,274.22 167.96 200.28 132,650.52
Transportation
Mass Transit 4,383.70 1.97 22.05 200 4,607.99
Faculty/Staff 14,685.79 22.06 53.59 14,761.44
Students 9,006.15 15.08 34.58 9,055.81
Air Travel 66,466.16 66,466.16
Solid Waste
Compost (412.59) (412.59)
Landfill 2,883.71 2,883.71
Recycling (7,437.25) (7,437.25)
Other
Food Consumption 34,809.90 34,809.90
Forest Carbon Sequestration
(6,120) (6,120)
Landscaping 3.09 21.63 24.72
Paper Use 1,101.43 1,101.43
Upstream Natural Gas 4,671.84 8,201.24 36.12 12,909.20
Grand Totals 452,368 3,400 2,221 4,135 1,995 498,838
2013 Greenhouse Gas Inventory
The University of North Carolina at Chapel Hill | 2013 Greenhouse Gas Inventory 10
Overview
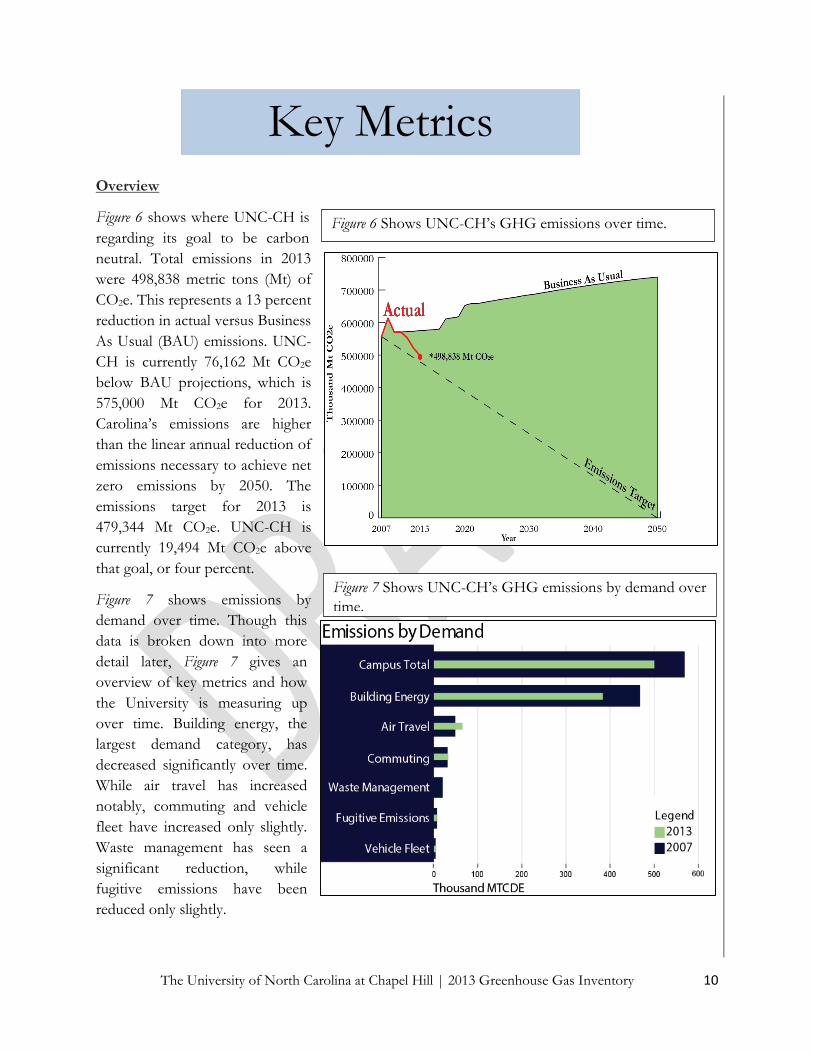
Figure 6 shows where UNC-CH is
regarding its goal to be carbon
neutral. Total emissions in 2013
were 498,838 metric tons (Mt) of
CO2e. This represents a 13 percent
reduction in actual versus Business
As Usual (BAU) emissions. UNC-
CH is currently 76,162 Mt CO2e
below BAU projections, which is
575,000 Mt CO2e for 2013.
Carolina’s emissions are higher
than the linear annual reduction of
emissions necessary to achieve net
zero emissions by 2050. The
emissions target for 2013 is
479,344 Mt CO2e. UNC-CH is
currently 19,494 Mt CO2e above
that goal, or four percent.
Figure 7 shows emissions by
demand over time. Though this
data is broken down into more
detail later, Figure 7 gives an
overview of key metrics and how
the University is measuring up
over time. Building energy, the
largest demand category, has
decreased significantly over time.
While air travel has increased
notably, commuting and vehicle
fleet have increased only slightly.
Waste management has seen a
significant reduction, while
fugitive emissions have been
reduced only slightly.
Key Metrics
Figure 6 Shows UNC-CH’s GHG emissions over time.
Figure 7 Shows UNC-CH’s GHG emissions by demand over
time.
The University of North Carolina at Chapel Hill | 2013 Greenhouse Gas Inventory 11
Emissions and Campus Population
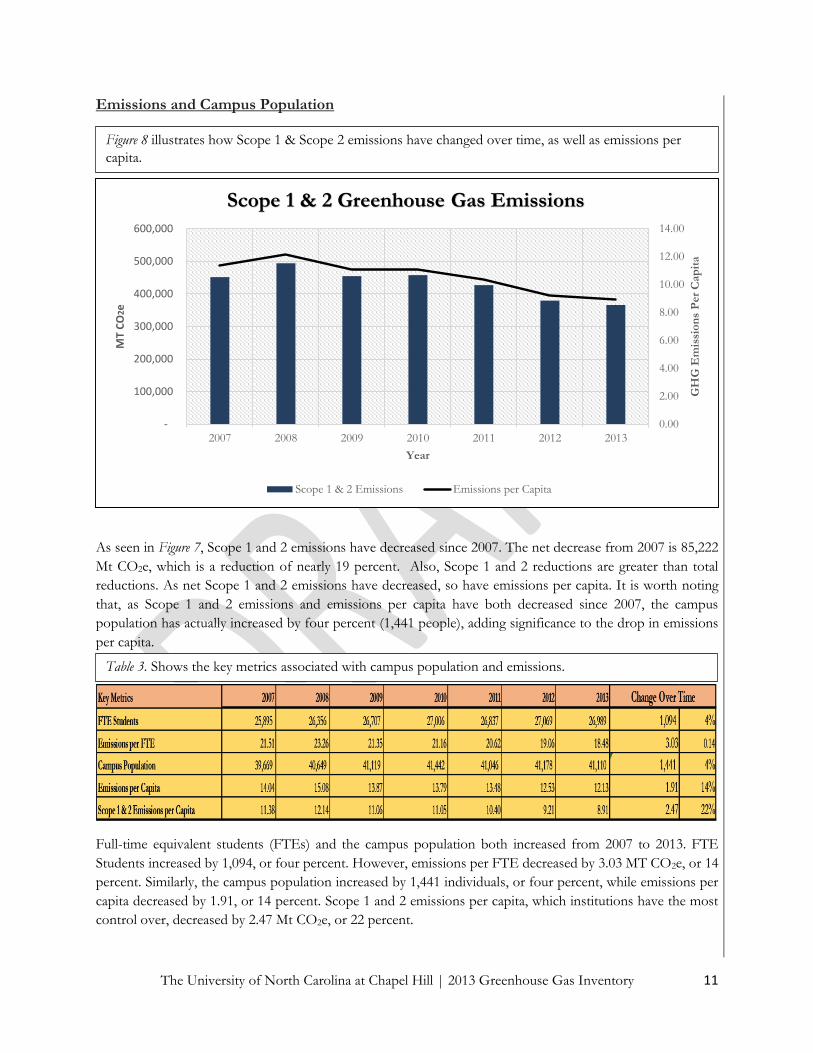
As seen in Figure 7, Scope 1 and 2 emissions have decreased since 2007. The net decrease from 2007 is 85,222
Mt CO2e, which is a reduction of nearly 19 percent. Also, Scope 1 and 2 reductions are greater than total
reductions. As net Scope 1 and 2 emissions have decreased, so have emissions per capita. It is worth noting
that, as Scope 1 and 2 emissions and emissions per capita have both decreased since 2007, the campus
population has actually increased by four percent (1,441 people), adding significance to the drop in emissions
per capita.
Full-time equivalent students (FTEs) and the campus population both increased from 2007 to 2013. FTE
Students increased by 1,094, or four percent. However, emissions per FTE decreased by 3.03 MT CO2e, or 14
percent. Similarly, the campus population increased by 1,441 individuals, or four percent, while emissions per
capita decreased by 1.91, or 14 percent. Scope 1 and 2 emissions per capita, which institutions have the most
control over, decreased by 2.47 Mt CO2e, or 22 percent.
Figure 8 illustrates how Scope 1 & Scope 2 emissions have changed over time, as well as emissions per
capita.
Table 3. Shows the key metrics associated with campus population and emissions.
0.00
2.00
4.00
6.00
8.00
10.00
12.00
14.00
-
100,000
200,000
300,000
400,000
500,000
600,000
2007 2008 2009 2010 2011 2012 2013
GH
G E
mis
sio
ns
Per
Cap
ita
MT
CO
2e
Year
Scope 1 & 2 Greenhouse Gas Emissions
Scope 1 & 2 Emissions Emissions per Capita

The University of North Carolina at Chapel Hill | 2013 Greenhouse Gas Inventory 12
Building-Related Emissions
As seen in Figure 9, gross square footage of UNC-CH building space has increased steadily since 2007. Square
footage has increased a total of 3.45 million square feet, growing a total of 21 percent, which is nearly four
percent growth annually. Meanwhile, Carolina’s building-related emissions have decreased. The total change
over time is a reduction of 80,924 Mt CO2e annually, which is an 18 percent total reduction and a two percent
reduction annually. The critical component to this metric is building emissions per 1,000 square feet. As building
gross square footage has grown, as has campus population, building emissions per 1,000 square feet have
decreased by 9.18 Mt CO2e. This is a 32 percent reduction total and a five percent annual reduction.
Table 4 breaks down the data displayed in Figure 9. Again, the data shows a clear trend of decreasing building-
related emissions.
0.00
5.00
10.00
15.00
20.00
25.00
30.00
-
100,000
200,000
300,000
400,000
500,000
600,000
2007 2008 2009 2010 2011 2012 2013
Sq
uare
Feet
MT
CO
2e
Year
Building Related Emissions
Building Related Emissions Building Emissions/1000 sq. ft. Gross Sq. Footage (Million Sq. Ft.)
Figure 9 displays building-related emissions, gross square footage and emissions per 1,000 square feet.
Table 4 shows the key building-related emissions metrics, and how they have changed over time.

The University of North Carolina at Chapel Hill | 2013 Greenhouse Gas Inventory 13
Scope 1 & 2 Emissions over Time
Scope 1 and 2 reductions from 2007 to 2013 are noteworthy. The largest source of Carolina’s
emissions is stationary combustion emissions, 94 percent of which come from the University’s fossil-
fuel powered Cogeneration Facility. Stationary combustion emissions decreased by 44,871 Mt CO2e
from 2007 to 2013. This is a reduction of 16 percent. UNC’s purchased electricity from Duke Energy
showed a similar decrease of 41,414 Mt CO2e, a reduction of 25 percent. Fugitive emissions and
mobile emissions increased from 2007 to 2013 by 1,061 Mt CO2e, or, 15 percent.
Stationary Combustion – Includes the Cogeneration facility, building boilers, black start generators,
emergency generators, and Manning Steam Plant.
Fugitive Emissions – Includes fugitive emissions related to HVAC, chilled water, laboratory gases,
and switchgear.
Mobile Emissions – Includes emissions related to the fuel usage and miles driven of Carolina’s vehicle
fleet.
Purchased Electricity – Includes emissions associated with Carolina’s electricity purchases from Duke
Energy Carolinas, less electricity that is used by the UNC Hospital System. It also includes purchases
from PSNC Energy.
-
50,000
100,000
150,000
200,000
250,000
300,000
2007 2008 2009 2010 2011 2012 2013
MT
CO
2E
YEAR
SCOPE 1 AND SCOPE 2 EMISSIONS OVER TIME
Stationary Combustion Fugitive and Mobile Emissions Purchased Electricity
Figure 10 shows how Scope 1 and 2 emissions have changed from 2007 to 2013.
The University of North Carolina at Chapel Hill | 2013 Greenhouse Gas Inventory 14
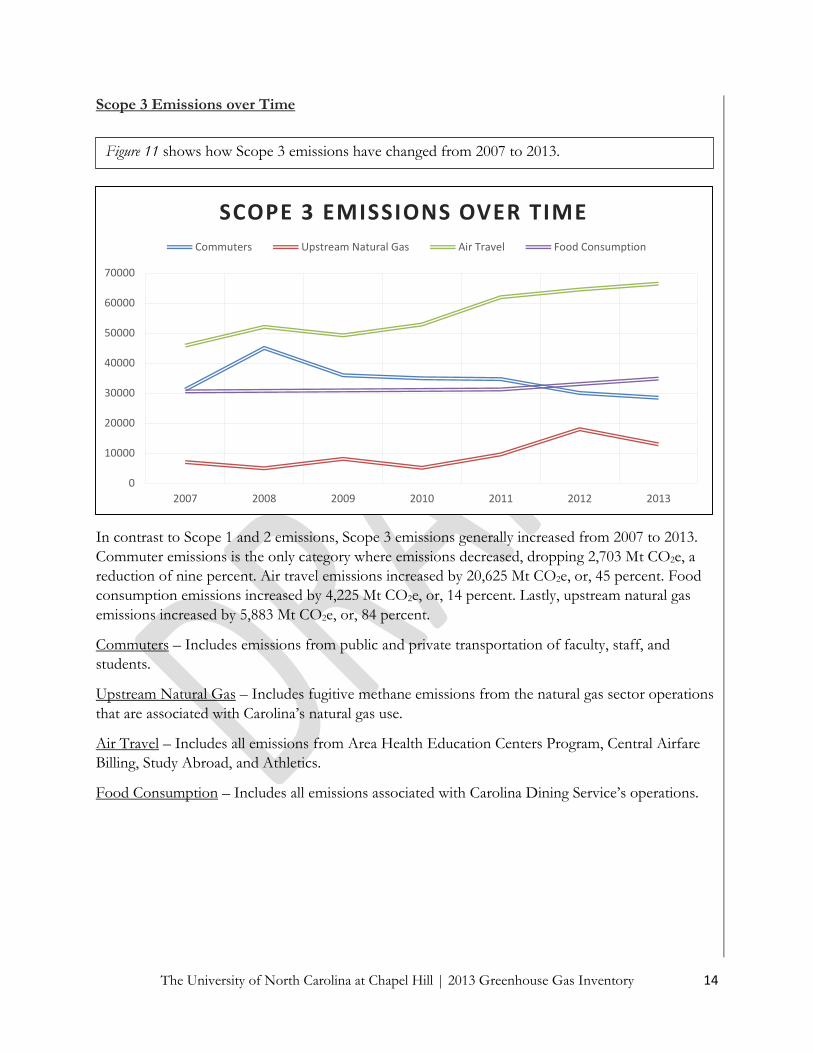
Scope 3 Emissions over Time
In contrast to Scope 1 and 2 emissions, Scope 3 emissions generally increased from 2007 to 2013.
Commuter emissions is the only category where emissions decreased, dropping 2,703 Mt CO2e, a
reduction of nine percent. Air travel emissions increased by 20,625 Mt CO2e, or, 45 percent. Food
consumption emissions increased by 4,225 Mt CO2e, or, 14 percent. Lastly, upstream natural gas
emissions increased by 5,883 Mt CO2e, or, 84 percent.
Commuters – Includes emissions from public and private transportation of faculty, staff, and
students.
Upstream Natural Gas – Includes fugitive methane emissions from the natural gas sector operations
that are associated with Carolina’s natural gas use.
Air Travel – Includes all emissions from Area Health Education Centers Program, Central Airfare
Billing, Study Abroad, and Athletics.
Food Consumption – Includes all emissions associated with Carolina Dining Service’s operations.
0
10000
20000
30000
40000
50000
60000
70000
2007 2008 2009 2010 2011 2012 2013
SCOPE 3 EMISSIONS OVER TIME
Commuters Upstream Natural Gas Air Travel Food Consumption
Figure 11 shows how Scope 3 emissions have changed from 2007 to 2013.

The University of North Carolina at Chapel Hill | 2013 Greenhouse Gas Inventory 15
Stationary Combustion on Campus
Emissions from the Cogeneration Facility, which constitute 91 percent of
Carolina’s Scope 1 emissions and 44 percent of total emissions, have
decreased by 19.6 percent from 2007 to 2013. Despite this long-term trend,
the Cogeneration Facility’s emissions increased 5.87 percent from 2012 to
2013. As natural gas has become cheaper due to advancements in hydraulic
fracturing and horizontal drilling, it has become a more economically viable
fuel source. Burning it coincidentally emits less carbon dioxide than coal.
*UNC-CH’s Cogeneration Facility on Cameron Avenue is not classified by EPA as an Electric
Generating Unit (EGU)
Energy Conservation Measures
UNC-CH’s Energy Conservation Measurement (ECM) Program has been a significant driver behind
campus GHG reductions. The program is an in-house continuous commissioning effort that has most
recently focused on correcting deficiencies and monitoring performance in campus buildings. Since
2002, the program has directly led to reductions of approximately 230,000 MT CO2e. Additionally,
the program savings are nearly $28 million.
Because of the program, UNC’s annual energy consumption has been reduced by 31 percent since
2002. This achievement exceeds NC State-mandated targets of 30 percent. Furthermore, since 2002,
the ECM Program has resulted in $223 million in energy cost avoidance.
Figure 12 shows how UNC-CH’s emissions from its Cogeneration Facility have
changed over time.
In 2013, UNC’s
fuel-mix was
77.4 percent
coal and 22.6
percent natural
gas on a heat
input basis.
-
50,000
100,000
150,000
200,000
250,000
300,000
350,000
2007 2008 2009 2010 2011 2012 2013
Me
tric
To
ns
of
Car
bo
n D
ioxi
de
Year
UNC-CH Cogeneration Emissions
UNC Cogeneration Facility Emissions
Linear (UNC Cogeneration Facility Emissions)
About 117
pounds of CO2
are produced
per million Btu
(MMBTU)
equivalents of
natural gas.
About 200
pounds of
CO2/MMBTU
are produced
by coal.

The University of North Carolina at Chapel Hill | 2013 Greenhouse Gas Inventory 16
Duke Energy Carolinas
All of UNC-CH’s electricity purchases are from Duke Energy Carolinas (DEC). After the UNC
Hospital System’s electricity emissions are deducted, UNC-CH’s emissions from purchased electricity
(which is also all of the University’s Scope 2 emissions) constitute 24.5 percent of total campus
emissions. Emissions from UNC-CH’s Scope 2 emissions have decreased by eight percent from 2007
to 2013. DEC’s carbon intensity has seen notable reductions in recent years, and is projected to
continue to decline through 2030. DEC has the flexibility of tapping into a variety of energy sources
to meet demand. DEC’s reliance on fuel sources other than coal allows it to effectively reduce its
emissions over time.
Carolina’s Scope One emissions are equivalent to…
Figure 13 shows equivalent measurements of Carolina’s Scope 1 emissions, the emissions that we create
and have direct control over.
Table 5 shows Duke Energy Carolinas’
energy sources and the percentage of energy
derived from each source.
Table 6 shows Duke Energy
Carolinas’ CO2 carbon intensity
from 2007 to 2013.

The University of North Carolina at Chapel Hill | 2013 Greenhouse Gas Inventory 17
Duke University has a goal to be carbon neutral by
2024. Duke has achieved a 21 percent net reduction in
greenhouse gas emissions since 2007, its baseline year.
Duke purchases all of its electricity from Duke Energy.
Duke has two on-campus steam plants that switched
from using coal to only natural gas in 2011.
North Carolina State University has a goal to be
carbon neutral by 2050. State has reduced their
emissions by 13.5 percent since 2008. Its largest
reductions have come from the categories of
electricity, refrigerants, and commuting.
Wake Forest University does not currently have a
goal to be carbon neutral. However, Wake Forest does
have notable sustainability goas, including efforts to
make new and existing buildings increasingly efficient.
Appalachian State University has a goal to be carbon
neutral by 2050. Currently, ASU’s GHG emissions
have increased by eight percent since 2009, its baseline
year.
University of North Carolina at Charlotte has a goal
to be carbon neutral by 2050. From 2009 to 2012,
UNCC reduced its GHG emissions by seven percent.
University of North Carolina at Greensboro has a
goal to be carbon neutral by 2050. From 2009 to 2012,
UNCG reduced their GHG emissions by 25 percent.
Measuring Up To Other Campuses
UNC-CH has a goal to be
carbon neutral by 2050. From
2007 to 2013, UNC-CH
reduced its GHG emissions
by 10 percent

The University of North Carolina at Chapel Hill | 2013 Greenhouse Gas Inventory 18
Energy Services’ landfill gas (LFG) project captures methane from an Orange County landfill. The
methane is then either destroyed by a flare or piped to an electric generating engine on the Carolina
North campus. The engine creates electricity that is sold to Duke Energy. The flare began burning
methane in FY11-12, while the generator came online in FY12-13.
The project, in destroying methane, a greenhouse gas, creates carbon offset
credits. One credit is equal to one MT CO2e. Credits, after verification, can
be bought, sold, and traded on both voluntary and compliance carbon
markets. Another common option for organizations attempting to achieve
carbon reduction goals is, rather than selling the credits on a market, to
retire the credits and debit them against that organization’s emissions, thus
reducing the organization’s net balance of emissions.
UNC-CH’s LFG offsets are registered with the Climate Action Reserve (the Reserve). The Reserve is
a highly respected registry and is one of only three offset registries allowed to operate in California’s
cap-and-trade market. Currently, UNC-CH has verified and deposited 19,614 carbon credits, has
34,590 credits verified and pending deposit, and expects 43,669 additional credits to be verified in the
near future from methane flared in FY2013-14. This is a total of 97,873 MT CO2e reductions. Keep
in mind that, although these credits have been created, they are still in play in the market because
UNC-CH has yet to sell them or retire them.
UNC-CH has several options for what to do with these carbon offset credits:
Bank the credits for future use. The LFG project was created under the auspices of an impending
federal cap-and-trade program (Waxman-Markey Bill, 2009). The cap-and-trade program never came
to fruition, so UNC-CH began banking the credits, which is a common practice. One option is to use
the carbon offsets to meet its future carbon reduction goals. Another would be to continue banking
the credits to meet potential future compliance requirements.
Sell the credits on a compliance market. Compliance markets are typically more robust than
voluntary markets, therefore offset prices are generally higher on these markets. However, California’s
market currently does not allow offsets from LFG projects. Regional Greenhouse Gas Initiative
(RGGI), the only other American compliance market, requires that all offset projects be located in a
RGGI state and furthermore only allows 3.3% of compliance obligations to be met by offsets.
Sell the credits on the voluntary market. The voluntary market, because it is not compliance-driven,
reflects inherently lower prices. Prices generally fluctuate broadly based on location and project type.
Carbon credits transactions dropped 26 percent from 2012 to 2013. The average voluntary offset
credit was $4.90/MT CO2e. This market contraction is due to the expansion of compliance markets.
As climate commitments deepen, and compliance markets continually expand, it is a wise decision to
continue to bank carbon credits created by the LFG project.
Landfill Gas
Energy Services
has destroyed
97,873 MT CO2e
to date using its
landfill gas flare
The University of North Carolina at Chapel Hill | 2013 Greenhouse Gas Inventory 19
GHG Inventory & Report
Stephen Senter
Air Travel
Pratyush Mehta
Mark Nielsen
Martha Pendergrass
Campus Energy Systems
Tim Aucoin
Mal Donohue
Jeff Koone
Bill Lowery
Doug Mullen
Kevin Quinlan
Butch Smith
Carolina Dining Services
Kaitlin Strahler
Scott Weir
Fugitive Emissions
Steve Hargett
Ben Martin
Teresa Suggs
Chick Turner
Commuting
Amanda Simmons
Waste Management
Ashley Kiser
BJ Tipton
Vehicle Fleet
Laura Corin
Paper Usage
Bernard Law
Guidance
Phil Barner
Ben Poulson
Eric Ripley
Acknowledgements
For Questions or Inquiries: Stephen Senter Greenhouse Gas Specialist Energy Services Department University of North Carolina at Chapel Hill (919) 843-7572 [email protected] www.climate.unc.edu

The University of North Carolina at Chapel Hill | 2013 Greenhouse Gas Inventory 20
Appendix A

The University of North Carolina at Chapel Hill | 2013 Greenhouse Gas Inventory 21
Appendix B