GREENHOUSE GAS EMISSIONS INVENTORY DRAFT - San Mateo County
28
C OUNTY OF S AN M ATEO G REENHOUSE G AS E MISSIONS I NVENTORY DRAFT Prepared for the County San Mateo by DRAFT UPDATED MARCH 2012
Transcript of GREENHOUSE GAS EMISSIONS INVENTORY DRAFT - San Mateo County
COUNTY OF SAN MATEO
GREENHOUSE GAS EMISS IONS
INVENTORY DRAFT
Prepared for the County San Mateo
by
DRAFT UPDATED MARCH 2012

County of San Mateo GHG Inventory March 2012
1
This greenhouse gas emissions inventory (Inventory) summarizes the preliminary results of three key milestone tasks of the County’s greenhouse gas (GHG) reduction planning process: (1) inventorying baseline GHG emissions, (2) forecasting GHG emissions, and (3) setting GHG emissions reduction target(s). Specifically, this Inventory presents the findings and recommendations of the following:
A. 2005 Baseline Community-Wide GHG Inventory;
B. 2020 and 2035 Community-Wide GHG Inventory Forecasts; and
C. GHG reduction targets.
This Inventory is a revised draft that incorporates new methods for quantifying emissions from propane use in homes and waste disposal. Findings are subject to revisions during Energy Efficiency Climate Action Plan development.
1. BASELINE GREENHOUSE GAS EMISSIONS INVENTORY BACKGROUND
PURPOSE
The Inventory will act as a foundation for the County’s Energy Efficiency Climate Action Plan by informing the County and community of the largest sources of GHG emissions, and thus the largest opportunities for reduction. This Inventory focuses on community-wide emissions in the unincorporated county only, as the County is currently in the process of updating the County operations government GHG emissions inventory. The purpose of a GHG emissions inventory is to present the major sources and quantities of GHG emissions caused by activities within the unincorporated boundary of San Mateo County. The Inventory will provide a baseline against which future progress can be measured and will serve as the foundation for the County’s Energy Efficiency Climate Action Plan.
Specifically, the Inventory does the following:
• Presents GHGs from community-wide activities in calendar year 2005;
• Forecasts how community-wide emissions will increase by 2020, and 2035 if no behavioral or regulatory changes are made (known as a business-as-usual scenario);
• Adjusts the GHG forecasts to account for reduction efforts mandated by the State of California (State), such as new vehicle standards and fuel standards; and
• Provides County staff, decision-makers, and Steering Committee and Technical Advisory Committee members with adequate information to direct development of an Energy Efficiency Climate Action Plan (EECAP) and establish additional emission reduction targets, if desired.
The Inventory includes the major sources of GHGs caused by activities in the county1 and by the County per best practice and consistent with the methodology recommended by the California Air
1 In this document, “county” refers to the unincorporated area within the San Mateo County boundary, excluding areas within incorporated city boundaries. The term “County” refers to San Mateo County government or government operations. The County has jurisdiction over the unincorporated area referred to as the “county” in this Inventory.
County of San Mateo GHG Inventory March 2012
2
Resources Board (CARB), ICLEI-Local Governments for Sustainability, and the Bay Area Air Quality Management District (BAAQMD). The Inventory analyzes the following emissions sources:
• Energy – Electricity, natural gas, and residential propane consumed in the county in 2005.
• Transportation – Vehicle miles traveled (VMT) to and/or from the county in 2005.
• Waste – Methane emissions from waste sent to landfills from the community in 2005.
• Landfills – Direct emissions from landfills, for the baseline year, are included in this analysis.
• Water and Wastewater – The energy required to extract, filter, move, and treat the water consumed and/or treated in the county in 2005. Direct process emissions from the County’s wastewater treatment facilities and fugitive emissions from septic tanks2 in the county are excluded from analysis, as they will be accounted for as appropriate in the County government operations inventory update.
• Stationary Sources – Direct emissions from industrial processes in the county that are permitted by the Bay Area Air Quality Management District (BAAQMD).
• Off-road – Emissions from agricultural, construction, and lawn and garden equipment/vehicles.
• Agriculture – Emissions from fertilizer and agricultural off-road equipment/vehicles.
Carbon sequestration, or simply sequestration, is the physical act of removing carbon dioxide from the atmosphere. The most common sources of sequestration are trees, which consume carbon dioxide during photosynthesis. San Mateo County’s vast stock of redwood forests and wetlands are a major source of sequestration. The effect of the County’s sequestration have not been quantified or included in the baseline inventory and forecast because this report focuses on emissions that can be mitigated or reduced. The County is currently studying the amount of sequestration potential in the county. When the results of this study become available, to the greatest extent feasible, the emissions benefits will be included in the Energy Efficiency Climate Action Plan as a GHG reduction or credit.
RELATIONSHIP TO THE 2008 ICLEI INVENTORY
In 2008, ICLEI-Local Governments for Sustainability conducted a 2005 community-wide GHG emissions inventory for the unincorporated areas of San Mateo County. Changes to the regulatory structure and incentives to address GHG emissions since the creation of this initial inventory have prompted the County to re-inventory emissions from community-wide sources. This Inventory is a new assessment of GHG emissions in the county.
In response to California Environmental Quality Act (CEQA) Guidelines that went into effect in March 2010, BAAQMD updated its CEQA Guidelines for the San Francisco Bay Area Basin. The purpose of the guidelines is to assist lead agencies in evaluating the air quality impacts of proposed projects and plans. The guidelines also establish thresholds of significance for impacts related to GHG emissions. Plans that
2 According to the Local Government Operations Protocol, “Fugitive emissions that are not physically controlled but result from intentional or unintentional releases, commonly arising from the production, processing, transmission, storage, and use of fuels and other substances, often through joints, seals, packing, gaskets, etc.”
County of San Mateo GHG Inventory March 2012
3
comply with BAAQMD’s suggested guidelines could serve as a Qualified GHG Reduction Strategy, providing streamlined CEQA tiering for development projects that comply with standards in the plan.
To create a Qualified GHG Reduction Strategy in compliance with BAAQMD guidelines, the County contracted with PMC to create a new inventory that incorporates new BAAQMD-recommended methodologies and addresses all emissions sectors identified by the guidelines. PMC used the 2008 inventory as a starting point for analysis in this Inventory, but re-inventoried emissions as described below. Landfill emissions are the only sector in this Inventory that rely on 2008 inventory findings; due to unavailability of data and informational nature of this sector, the original assessment was found to provide the best approach and facilitate compliance with BAAQMD guidance. In the process of completing the inventory, PMC completed new emissions calculations to use the most up-to-date tools and resources. The primary distinctions between this Inventory and the 2008 inventory prepared by ICLEI include the following:
• Inclusion of new emissions sources not previously inventoried (water).
• Incorporation of refined methodologies for agriculture. The 2008 inventory used a top-down approach to attribute all countywide agriculture emissions to the unincorporated county. This Inventory captures only relevant agriculture emissions from fertilizer use, based on local crop types.
• Calculation of emissions for direct access electricity based on actual activity in the county, as reported by PG&E. The 2008 inventory estimated direct access consumption based on a top-down approach to disaggregate total direct access electricity and natural gas in the incorporated an unincorporated San Mateo County. PG&E did not report direct access natural gas consumption for the county in 2005.
• Calculation of off-road emissions for agricultural equipment, construction equipment, and lawn and garden equipment, consistent with BAAQMD compliance and using more accurate baseline information for the year 2005, based on 2005 emissions data, households, and building permits. The 2008 inventory used 2007 emissions reported by BAAQMD, based on households and jobs.
• Exclusion of emissions for light service equipment included in the 2008 inventory due to overlap with the stationary source emissions reported by BAAQMD and potential double-counting of emissions from energy consumption.
• Inclusion of stationary source emissions in the county reported by BAAQMD.
• Calculation of waste using the California-specific 2009 Landfill Emissions Tool developed by the California Air Resources Board, instead of using national defaults provided by the ICLEI Clean Air and Climate Protection program.
• Integration of improved emissions factors in the Local Government Operations Protocol (LGOP) V1.1.
DATA PARAMETERS
The Inventory was developed with the best-available tools, data, and methodology; however, as with any GHG inventory, there are limitations to representing all sources of emissions in a local jurisdiction. The main factors that limit GHG inventories include (1) data availability, (2) privacy laws, and (3) deficient

County of San Mateo GHG Inventory March 2012
4
methodology. The following sections highlight emissions that cannot be included in a GHG inventory due to these factors. It is estimated that sources not included in the Inventory for reasons of data availability and privacy laws comprise less than 5% of total emissions in the county and are therefore anticipated to have a minimal impact. The emissions excluded for reasons of methodological limitations may be considerable, but it is not possible to estimate their impact on San Mateo County’s inventory under current methodological constraints.
1. Data Availability Lack of available data prevented the calculation of emissions from the following sources for the following reasons:
• Propane use – Propane is essentially an unregulated fuel in California (except for storage and safety issues, which are regulated). Because it is an unregulated commodity, no data is collected by the State on propane sales or usage. While propane use in rural San Mateo County is likely, the availability of such data prevents accurate calculations of emissions from propane. In addition, propane is not anticipated to be widely used and is likely to contribute minimally to community-wide emissions. A protocol for calculating GHG emissions is currently under development, and is anticipated to provide future guidance that will inform the accurate collection of propane use in the county.
• Refrigerants – Similar to propane, above, the amount of fugitive refrigerant emissions cannot be calculated because sales are not tracked.
2. Privacy Laws Commercial, industrial, and institutional electricity and natural gas are combined into a non-residential category due to the California 15/15 rule. The 15/15 rule was adopted by the California Public Utilities Commission in the Direct Access Proceeding (CPUC Decision 97-10-031) to protect customer confidentiality. The 15/15 Rule requires that any aggregated information provided by the utilities must include at least 15 customers and that a single customer's load must be less than 15% of an assigned category. If the number of customers in the compiled data is below 15, or if a single customer's load is more than 15% of the total data, categories must be combined before the information is released. The rule further requires that if the 15/15 Rule is triggered for a second time after the data has been screened already using the 15/15 Rule, the customer must be dropped from the information provided.
3. Unavailability of Protocol for Life-Cycle Emissions Industry protocol at this time does not recommend inclusion of life-cycle emissions in community-wide local government GHG inventories. A protocol for estimating life-cycle emissions is still under development at this time. Life-cycle emissions are emissions associated with the production and disposal of items consumed by a community (i.e., “cradle-to-grave”). For instance, a life-cycle assessment of vehicle emissions would include those from designing, extracting raw materials, producing, delivering, and disposing of each car in the county. In contrast, this analysis only captures how much that car is driven in the county consistent with standard protocol.
4. Other Excluded Emissions Other GHG emissions sectors have been excluded from this Inventory, as they are negligible in size or relevance. Caltrain operates heavily within San Mateo County but only passes though unincorporated areas briefly along its route. Considering the amount of time and effort it would take to quantify these emissions with marginal impact in the baseline emissions inventory and limited control over Caltrain operations, these emissions have been omitted. The Half Moon Bay Airport is
County of San Mateo GHG Inventory March 2012
5
located within unincorporated land but is operated by the County of San Mateo. To avoid any unnecessary overlap and redundancy, this analysis was excluded as it will be part of the municipal inventory currently taking place.
Review of similar inventories, including the California Greenhouse Gas Inventory prepared by the California Air Resources Board (CARB), indicates that those sources not included in the Inventory for the reasons stated above comprise less than 5.0% of total emissions in the county. The emissions identified in this Inventory are primarily GHGs that the community has directly caused and has the ability to reduce through implementation of conservation actions, a Qualified GHG Reduction Strategy, or corresponding efforts.
KEY TERMS AND TIMELINES
The following terms are used throughout the Inventory. These concepts are fundamental to understanding the contents of the Inventory.
Baseline year: Emissions are quantified for calendar year 2005, due to the availability of reliable data and consistency with the County’s General Plan and Assembly Bill (AB) 32. A baseline year gives the County a basis of comparison for future reduction efforts and inventories.
Carbon dioxide equivalent (CO₂e): The universal unit for representing the six different GHGs (see definition of greenhouse gas emissions, below) in one single unit by converting each gas into the equivalent potency of carbon dioxide. CO2e is commonly expressed in metric tons, each of which equals 2,205 pounds.
Greenhouse gas emissions: Gases that trap heat in the earth’s atmosphere are called greenhouse gases, or GHGs. GHGs include carbon dioxide (CO2), methane (CH4), nitrous oxide (N2O), hydrofluorocarbons (HFCs), perfluorocarbons (PFCs), and sulfur hexafluoride (SF6). While many of these gases occur naturally in the atmosphere, modern human activity has led to a steep increase in the amount of GHGs released into the atmosphere over the last 100 years. Collectively, these gases intensify the natural greenhouse effect, thus causing global average surface temperatures to rise, which in turn affects global climate patterns. GHGs are often quantified in terms of CO₂ equivalent, or CO₂e, a unit of measurement that equalizes the potency of GHGs.3
Scope: Emissions sources are also categorized by scope to help identify where emissions originate and what entity retains regulatory control and the ability to implement efficiency measures. Scopes are discussed in further detail below.
Scope 1. Direct emissions caused by activities in the county in 2005 and emitted within the county. Examples of Scope 1 sources include the combustion of fuels such as gasoline and natural gas.
Scope 2. Indirect emissions are caused by activities within the county in 2005 but emitted outside of the county. Examples of Scope 2 sources include electricity used within the community yet generated at power plants outside of the county. These emissions should be included in the community-wide analysis, as they are the result of the community's electricity consumption.
Scope 3. All other indirect emissions that occur as a result of activity within the community. An example of a Scope 3 source is methane emissions from solid waste generated in the community in
3 Refer to the Intergovernmental Panel on Climate Change for more information: http://www.ipcc.ch/.
County of San Mateo GHG Inventory March 2012
6
2005 yet released over the lifetime of the waste. Scope 3 emissions have the greatest amount of variability and are less attuned to the specific community than Scope 1 and 2 sources.
Sector: Emissions are grouped by the type of activity that generated the emissions, such as transportation, residential energy use, non-residential energy use, and more.
II. BASELINE COMMUNITY-WIDE GHG INVENTORY
SUMMARY
This Inventory includes Scope 1, Scope 2, and Scope 3 sources from the following sectors: residential energy, non-residential energy, transportation, off-road equipment, water, wastewater, solid waste, stationary sources, and agriculture.
Emissions from county sources totaled 905,090 metric tons of carbon dioxide equivalents (MTCO₂e) in the baseline year 2005. As shown in Table 1 and Figure 1, the transportation sector is the largest contributor at 53%, producing approximately 479,400 MTCO₂e in 2005. Emissions from the commercial and industrial energy sector were the next largest contributor, accounting for a combined 18% of the total emissions, producing approximately 160,900 MTCO₂e. Direct emissions from landfills accounted for 14% of the total emissions (123,000 MTCO₂e), and emissions from residential energy use comprised 10% of the total (93,100 MTCO₂e). Emissions were also inventoried for lawn and garden and construction equipment (also ‘off-road equipment;’ 4% of total emissions, 35,800 MTCO₂e), solid waste (1% or total emissions, 8,380 MTCO₂e), agriculture (3,000 MTCO₂e and <1%), water and wastewater (1,500 MTCO₂e and <1%), and stationary point sources (stationary) (<1% with 10 MTCO₂e).
Table 1 and Figure 1 include stationary emissions from the proxy year of 2009, the closest available year to 2005. Stationary source emissions are defined as any fixed emitter of air pollutants, such as power plants, stationary generators, petrochemical plants, and other heavy industrial sources. While some of these emissions may overlap with energy-related emissions, others may be missed if not included in the Inventory. BAAQMD provided a list of stationary source emissions within the County of San Mateo, and sources from the county totaled 10 MTCO2e or <1% of total community-wide emissions in 2005. Stationary source emissions are discussed in this Inventory for informational purposes only, as stationary source emissions are influenced by market forces beyond the County’s local influence and are instead best addressed and regulated by BAAQMD or through federal and state programs. In addition, direct landfill emissions occurring in the baseline year for waste generated both within and outside of the unincorporated county are included in this Inventory as suggested by BAAQMD. The County has limited control over the operation of landfills in the county and is unable to directly affect the emissions generated from previously generated waste.4 The baseline inventory is intended to guide future local policy decisions that relate to emissions within the County’s influence; therefore, stationary source emissions are excluded from all further discussions of this Inventory after Table 1 and Figure 1.
4 At this time, the County is interested in purchasing methane emitted by landfills, but is precluded from doing so based on existing agreements between landfills and other jurisdictions. Regardless, even the purchase of methane for the production of energy would not result in a net decrease in GHG emissions.
County of San Mateo GHG Inventory March 2012
7
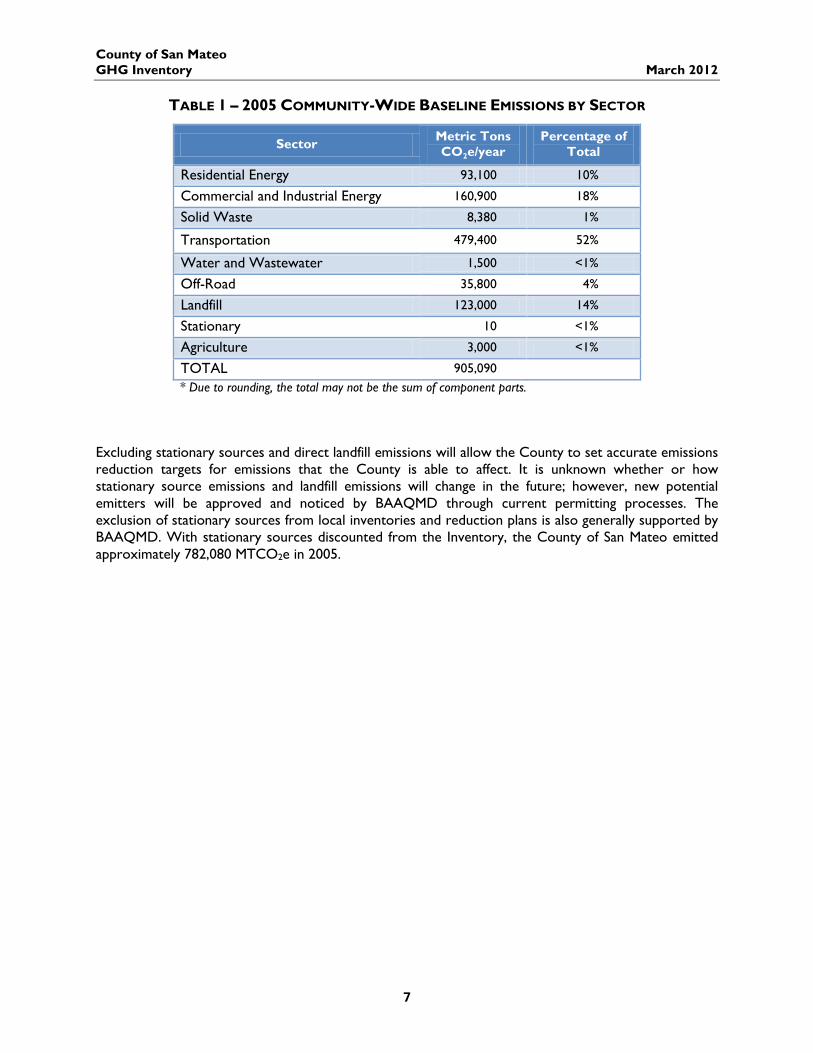
TABLE 1 – 2005 COMMUNITY-WIDE BASELINE EMISSIONS BY SECTOR
Sector Metric Tons CO2e/year
Percentage of Total
Residential Energy 93,100 10%
Commercial and Industrial Energy 160,900 18%
Solid Waste 8,380 1%
Transportation 479,400 52%
Water and Wastewater 1,500 <1%
Off-Road 35,800 4%
Landfill 123,000 14%
Stationary 10 <1%
Agriculture 3,000 <1%
TOTAL 905,090 * Due to rounding, the total may not be the sum of component parts.
Excluding stationary sources and direct landfill emissions will allow the County to set accurate emissions reduction targets for emissions that the County is able to affect. It is unknown whether or how stationary source emissions and landfill emissions will change in the future; however, new potential emitters will be approved and noticed by BAAQMD through current permitting processes. The exclusion of stationary sources from local inventories and reduction plans is also generally supported by BAAQMD. With stationary sources discounted from the Inventory, the County of San Mateo emitted approximately 782,080 MTCO2e in 2005.
County of San Mateo GHG Inventory March 2012
8
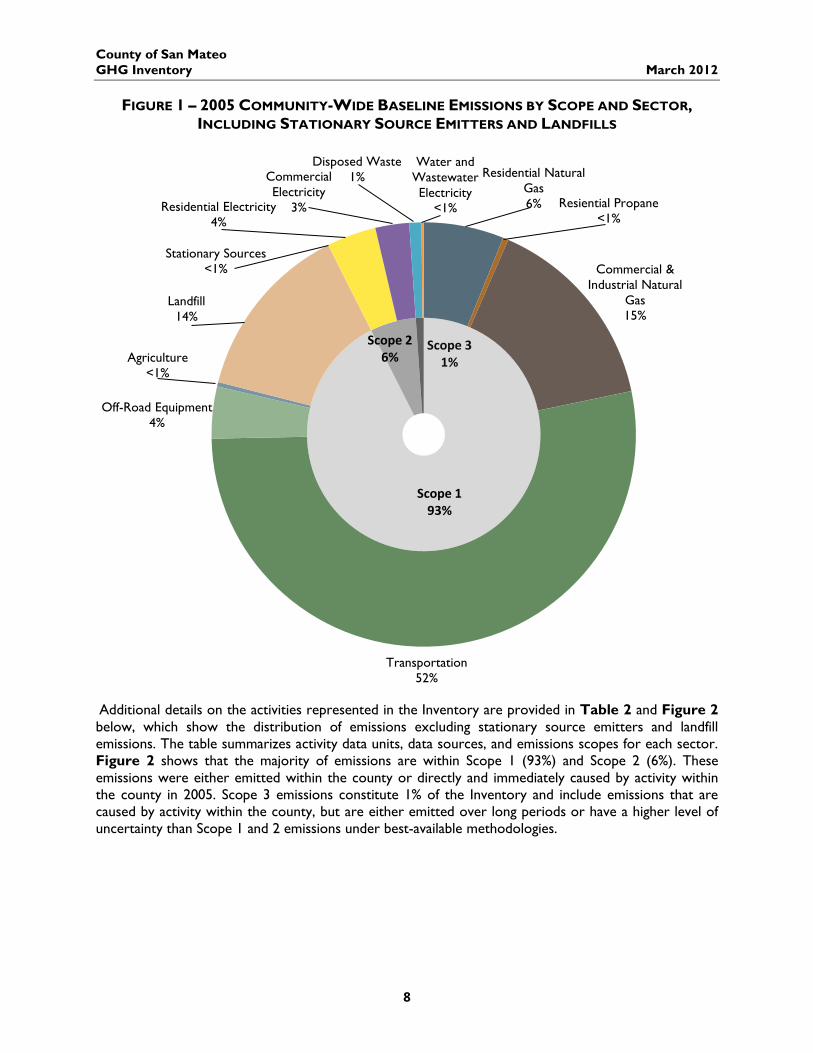
FIGURE 1 – 2005 COMMUNITY-WIDE BASELINE EMISSIONS BY SCOPE AND SECTOR, INCLUDING STATIONARY SOURCE EMITTERS AND LANDFILLS
Additional details on the activities represented in the Inventory are provided in Table 2 and Figure 2 below, which show the distribution of emissions excluding stationary source emitters and landfill emissions. The table summarizes activity data units, data sources, and emissions scopes for each sector. Figure 2 shows that the majority of emissions are within Scope 1 (93%) and Scope 2 (6%). These emissions were either emitted within the county or directly and immediately caused by activity within the county in 2005. Scope 3 emissions constitute 1% of the Inventory and include emissions that are caused by activity within the county, but are either emitted over long periods or have a higher level of uncertainty than Scope 1 and 2 emissions under best-available methodologies.
Scope 1 93%
Scope 2 6%
Scope 3 1%
Residential Natural Gas 6% Resiential Propane
<1%
Commercial & Industrial Natural
Gas 15%
Transportation 52%
Off-Road Equipment 4%
Agriculture <1%
Landfill 14%
Stationary Sources <1%
Residential Electricity 4%
Commercial Electricity
3%
Disposed Waste 1%
Water and Wastewater Electricity
<1%
County of San Mateo GHG Inventory February 2012
9
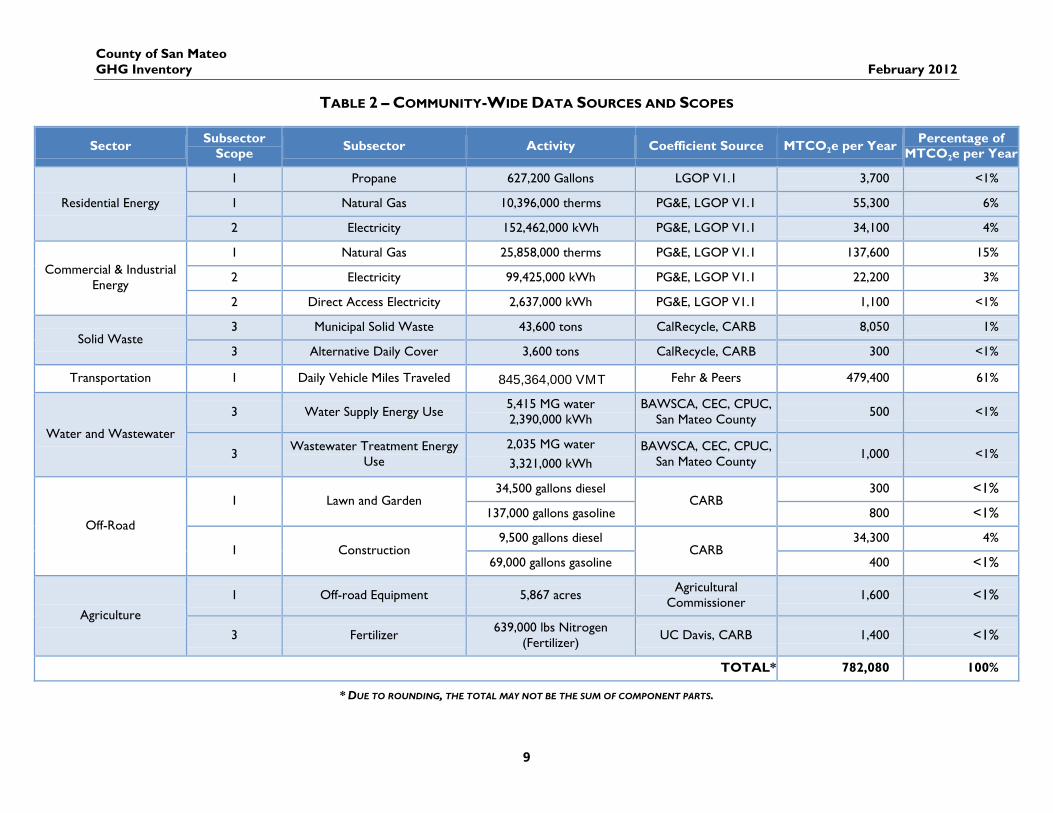
TABLE 2 – COMMUNITY-WIDE DATA SOURCES AND SCOPES
* DUE TO ROUNDING, THE TOTAL MAY NOT BE THE SUM OF COMPONENT PARTS.
Sector Subsector Scope Subsector Activity Coefficient Source MTCO2e per Year Percentage of
MTCO2e per Year
Residential Energy
1 Propane 627,200 Gallons LGOP V1.1 3,700 <1%
1 Natural Gas 10,396,000 therms PG&E, LGOP V1.1 55,300 6%
2 Electricity 152,462,000 kWh PG&E, LGOP V1.1 34,100 4%
Commercial & Industrial Energy
1 Natural Gas 25,858,000 therms PG&E, LGOP V1.1 137,600 15%
2 Electricity 99,425,000 kWh PG&E, LGOP V1.1 22,200 3%
2 Direct Access Electricity 2,637,000 kWh PG&E, LGOP V1.1 1,100 <1%
Solid Waste 3 Municipal Solid Waste 43,600 tons CalRecycle, CARB 8,050 1%
3 Alternative Daily Cover 3,600 tons CalRecycle, CARB 300 <1%
Transportation 1 Daily Vehicle Miles Traveled 845,364,000 VMT Fehr & Peers 479,400 61%
Water and Wastewater
3 Water Supply Energy Use 5,415 MG water 2,390,000 kWh
BAWSCA, CEC, CPUC, San Mateo County 500 <1%
3 Wastewater Treatment Energy Use
2,035 MG water 3,321,000 kWh
BAWSCA, CEC, CPUC, San Mateo County 1,000 <1%
Off-Road
1 Lawn and Garden 34,500 gallons diesel
CARB 300 <1%
137,000 gallons gasoline 800 <1%
1 Construction 9,500 gallons diesel
CARB 34,300 4%
69,000 gallons gasoline 400 <1%
Agriculture
1 Off-road Equipment 5,867 acres Agricultural Commissioner 1,600 <1%
3 Fertilizer 639,000 lbs Nitrogen (Fertilizer) UC Davis, CARB 1,400 <1%
TOTAL* 782,080 100%
County of San Mateo GHG Inventory February 2012
10
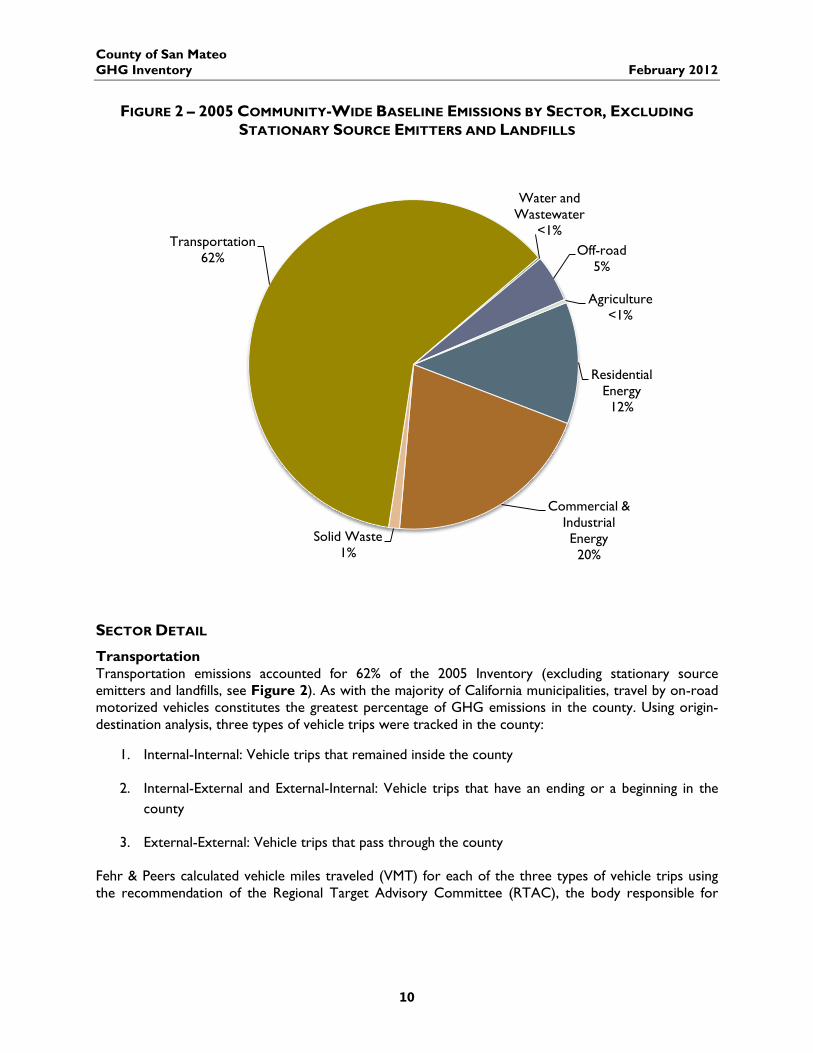
FIGURE 2 – 2005 COMMUNITY-WIDE BASELINE EMISSIONS BY SECTOR, EXCLUDING STATIONARY SOURCE EMITTERS AND LANDFILLS
SECTOR DETAIL
Transportation Transportation emissions accounted for 62% of the 2005 Inventory (excluding stationary source emitters and landfills, see Figure 2). As with the majority of California municipalities, travel by on-road motorized vehicles constitutes the greatest percentage of GHG emissions in the county. Using origin-destination analysis, three types of vehicle trips were tracked in the county:
1. Internal-Internal: Vehicle trips that remained inside the county
2. Internal-External and External-Internal: Vehicle trips that have an ending or a beginning in the county
3. External-External: Vehicle trips that pass through the county
Fehr & Peers calculated vehicle miles traveled (VMT) for each of the three types of vehicle trips using the recommendation of the Regional Target Advisory Committee (RTAC), the body responsible for
Residential Energy 12%
Commercial & Industrial Energy 20%
Solid Waste 1%
Transportation 62%
Water and Wastewater
<1% Off-road
5%
Agriculture <1%
County of San Mateo GHG Inventory February 2012
11
Senate Bill 375 target setting. VMT from trips of type 1, 2, and 3 were counted 100%, 50%, and 0% respectively toward jurisdiction-generated VMT.5 The VMT results are summarized in Appendix A.
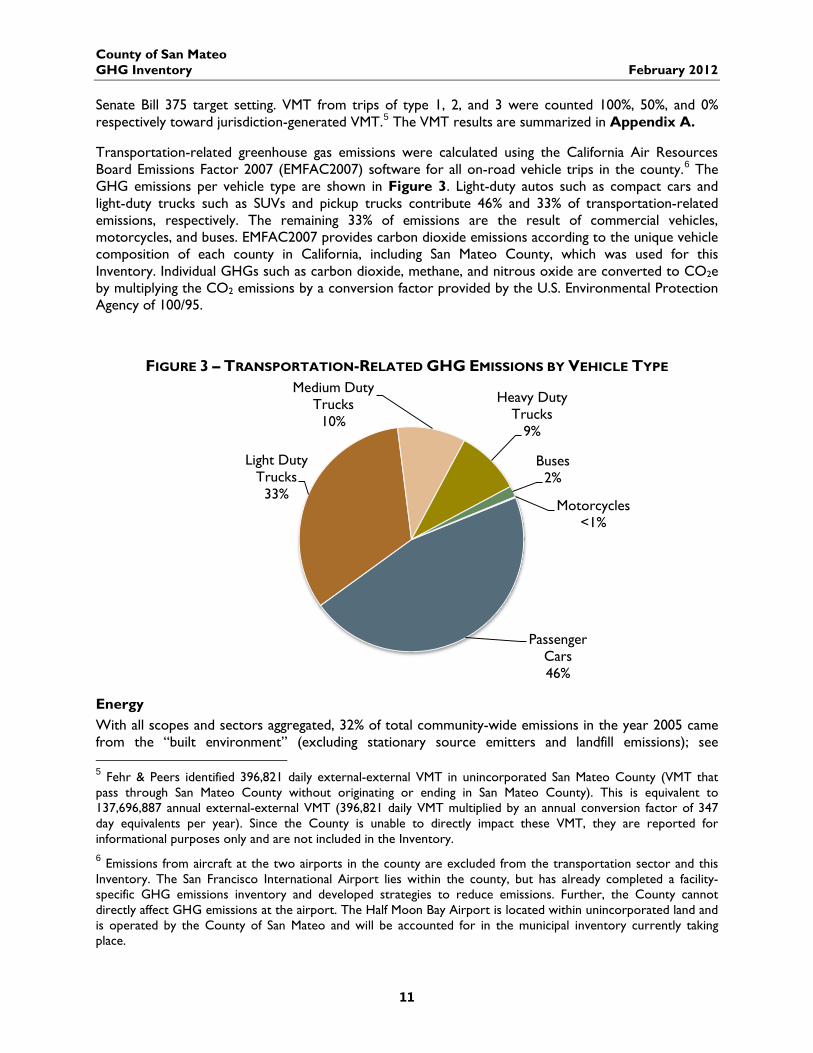
Transportation-related greenhouse gas emissions were calculated using the California Air Resources Board Emissions Factor 2007 (EMFAC2007) software for all on-road vehicle trips in the county.6 The GHG emissions per vehicle type are shown in Figure 3. Light-duty autos such as compact cars and light-duty trucks such as SUVs and pickup trucks contribute 46% and 33% of transportation-related emissions, respectively. The remaining 33% of emissions are the result of commercial vehicles, motorcycles, and buses. EMFAC2007 provides carbon dioxide emissions according to the unique vehicle composition of each county in California, including San Mateo County, which was used for this Inventory. Individual GHGs such as carbon dioxide, methane, and nitrous oxide are converted to CO2e by multiplying the CO2 emissions by a conversion factor provided by the U.S. Environmental Protection Agency of 100/95.
FIGURE 3 – TRANSPORTATION-RELATED GHG EMISSIONS BY VEHICLE TYPE
Energy With all scopes and sectors aggregated, 32% of total community-wide emissions in the year 2005 came from the “built environment” (excluding stationary source emitters and landfill emissions); see 5 Fehr & Peers identified 396,821 daily external-external VMT in unincorporated San Mateo County (VMT that pass through San Mateo County without originating or ending in San Mateo County). This is equivalent to 137,696,887 annual external-external VMT (396,821 daily VMT multiplied by an annual conversion factor of 347 day equivalents per year). Since the County is unable to directly impact these VMT, they are reported for informational purposes only and are not included in the Inventory. 6 Emissions from aircraft at the two airports in the county are excluded from the transportation sector and this Inventory. The San Francisco International Airport lies within the county, but has already completed a facility-specific GHG emissions inventory and developed strategies to reduce emissions. Further, the County cannot directly affect GHG emissions at the airport. The Half Moon Bay Airport is located within unincorporated land and is operated by the County of San Mateo and will be accounted for in the municipal inventory currently taking place.
Passenger Cars 46%
Light Duty Trucks
33%
Medium Duty Trucks
10%
Heavy Duty Trucks
9%
Buses 2%
Motorcycles <1%
County of San Mateo GHG Inventory February 2012
12
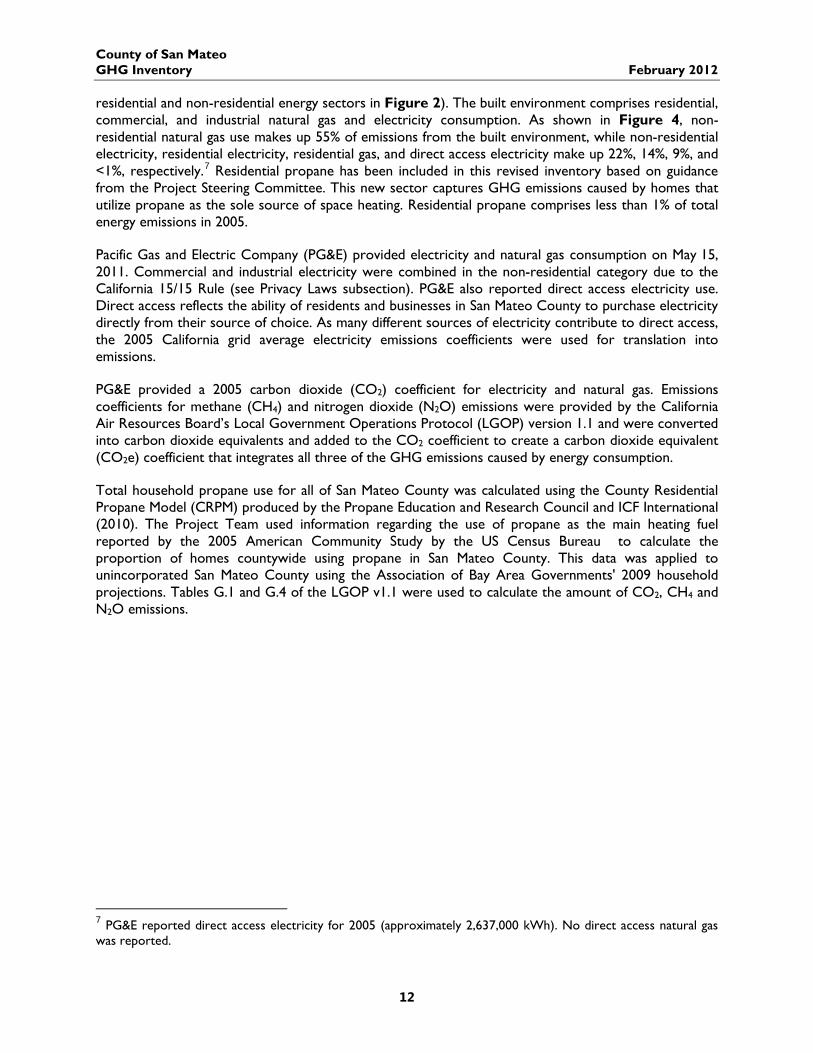
residential and non-residential energy sectors in Figure 2). The built environment comprises residential, commercial, and industrial natural gas and electricity consumption. As shown in Figure 4, non-residential natural gas use makes up 55% of emissions from the built environment, while non-residential electricity, residential electricity, residential gas, and direct access electricity make up 22%, 14%, 9%, and <1%, respectively.7 Residential propane has been included in this revised inventory based on guidance from the Project Steering Committee. This new sector captures GHG emissions caused by homes that utilize propane as the sole source of space heating. Residential propane comprises less than 1% of total energy emissions in 2005.
Pacific Gas and Electric Company (PG&E) provided electricity and natural gas consumption on May 15, 2011. Commercial and industrial electricity were combined in the non-residential category due to the California 15/15 Rule (see Privacy Laws subsection). PG&E also reported direct access electricity use. Direct access reflects the ability of residents and businesses in San Mateo County to purchase electricity directly from their source of choice. As many different sources of electricity contribute to direct access, the 2005 California grid average electricity emissions coefficients were used for translation into emissions.
PG&E provided a 2005 carbon dioxide (CO2) coefficient for electricity and natural gas. Emissions coefficients for methane (CH4) and nitrogen dioxide (N2O) emissions were provided by the California Air Resources Board’s Local Government Operations Protocol (LGOP) version 1.1 and were converted into carbon dioxide equivalents and added to the CO2 coefficient to create a carbon dioxide equivalent (CO2e) coefficient that integrates all three of the GHG emissions caused by energy consumption.
Total household propane use for all of San Mateo County was calculated using the County Residential Propane Model (CRPM) produced by the Propane Education and Research Council and ICF International (2010). The Project Team used information regarding the use of propane as the main heating fuel reported by the 2005 American Community Study by the US Census Bureau to calculate the proportion of homes countywide using propane in San Mateo County. This data was applied to unincorporated San Mateo County using the Association of Bay Area Governments' 2009 household projections. Tables G.1 and G.4 of the LGOP v1.1 were used to calculate the amount of CO2, CH4 and N2O emissions.
7 PG&E reported direct access electricity for 2005 (approximately 2,637,000 kWh). No direct access natural gas was reported.
County of San Mateo GHG Inventory February 2012
13
FIGURE 4 – BUILT-ENVIRONMENT GHG EMISSIONS BY SECTOR
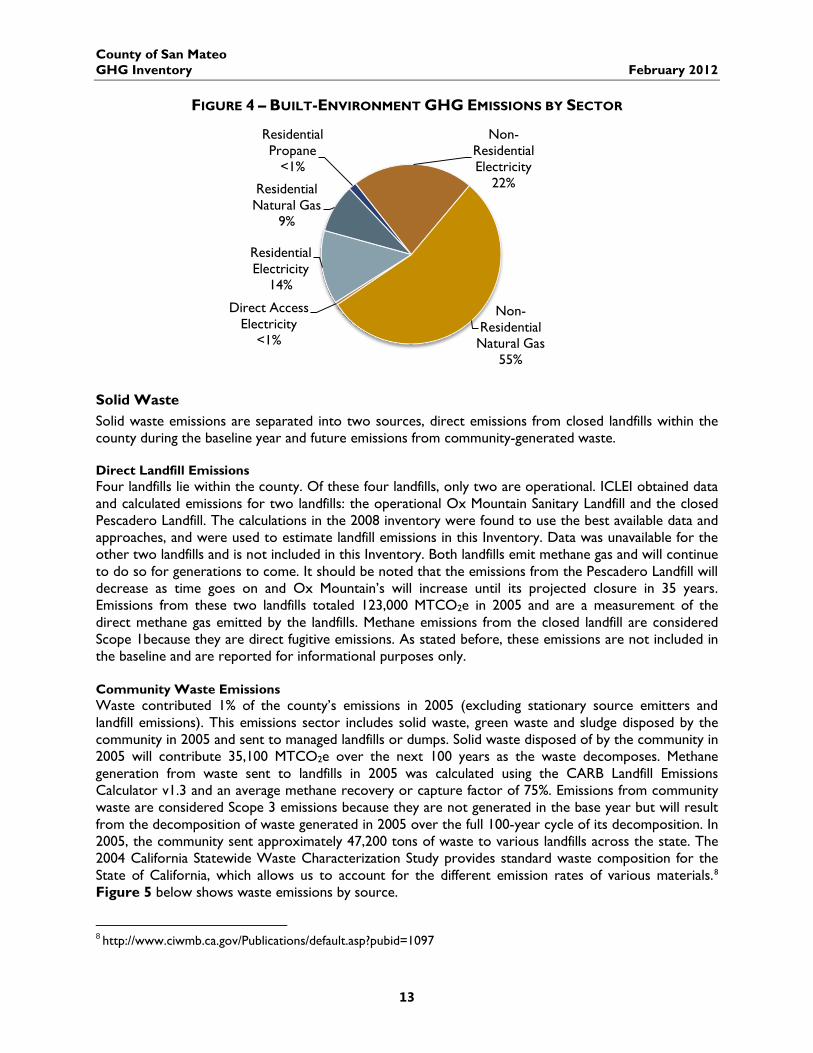
Solid Waste Solid waste emissions are separated into two sources, direct emissions from closed landfills within the county during the baseline year and future emissions from community-generated waste. Direct Landfill Emissions Four landfills lie within the county. Of these four landfills, only two are operational. ICLEI obtained data and calculated emissions for two landfills: the operational Ox Mountain Sanitary Landfill and the closed Pescadero Landfill. The calculations in the 2008 inventory were found to use the best available data and approaches, and were used to estimate landfill emissions in this Inventory. Data was unavailable for the other two landfills and is not included in this Inventory. Both landfills emit methane gas and will continue to do so for generations to come. It should be noted that the emissions from the Pescadero Landfill will decrease as time goes on and Ox Mountain’s will increase until its projected closure in 35 years. Emissions from these two landfills totaled 123,000 MTCO2e in 2005 and are a measurement of the direct methane gas emitted by the landfills. Methane emissions from the closed landfill are considered Scope 1because they are direct fugitive emissions. As stated before, these emissions are not included in the baseline and are reported for informational purposes only. Community Waste Emissions Waste contributed 1% of the county’s emissions in 2005 (excluding stationary source emitters and landfill emissions). This emissions sector includes solid waste, green waste and sludge disposed by the community in 2005 and sent to managed landfills or dumps. Solid waste disposed of by the community in 2005 will contribute 35,100 MTCO2e over the next 100 years as the waste decomposes. Methane generation from waste sent to landfills in 2005 was calculated using the CARB Landfill Emissions Calculator v1.3 and an average methane recovery or capture factor of 75%. Emissions from community waste are considered Scope 3 emissions because they are not generated in the base year but will result from the decomposition of waste generated in 2005 over the full 100-year cycle of its decomposition. In 2005, the community sent approximately 47,200 tons of waste to various landfills across the state. The 2004 California Statewide Waste Characterization Study provides standard waste composition for the State of California, which allows us to account for the different emission rates of various materials.8 Figure 5 below shows waste emissions by source.
8 http://www.ciwmb.ca.gov/Publications/default.asp?pubid=1097
Residential Electricity
14%
Residential Natural Gas
9%
Residential Propane
<1%
Non-Residential Electricity
22%
Non-Residential Natural Gas
55%
Direct Access Electricity
<1%
County of San Mateo GHG Inventory February 2012
14
FIGURE 5 – WASTE EMISSIONS BY SOURCE
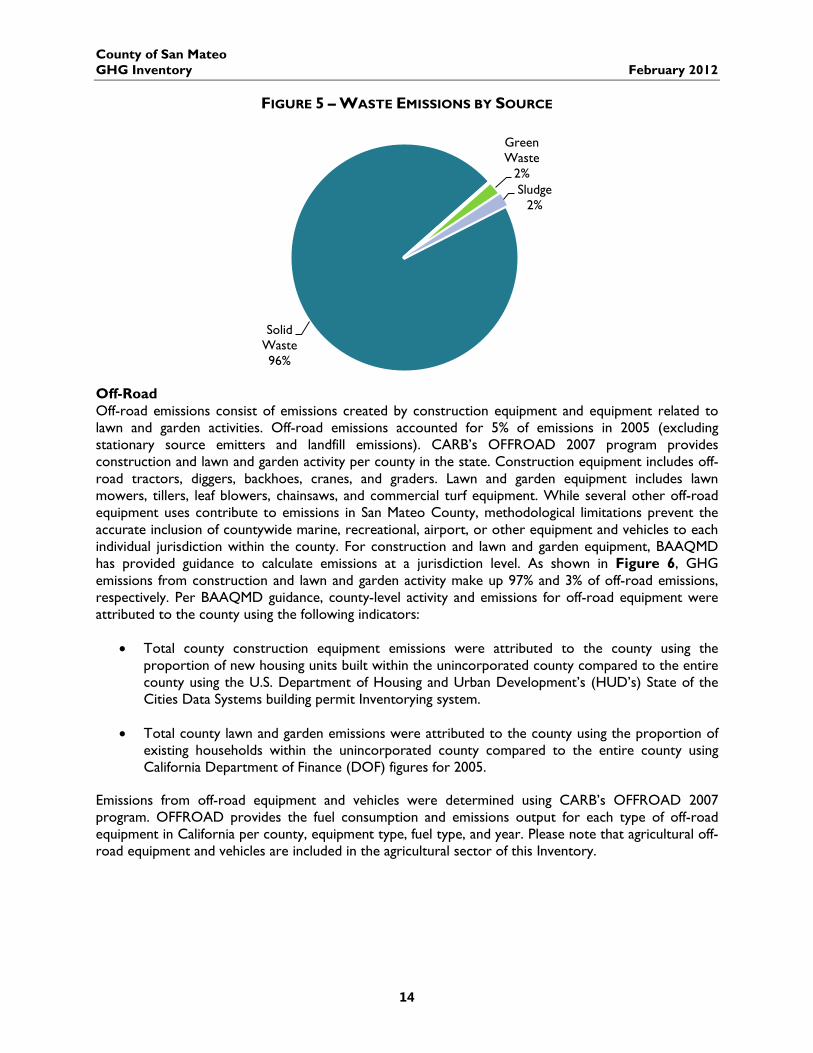
Off-Road Off-road emissions consist of emissions created by construction equipment and equipment related to lawn and garden activities. Off-road emissions accounted for 5% of emissions in 2005 (excluding stationary source emitters and landfill emissions). CARB’s OFFROAD 2007 program provides construction and lawn and garden activity per county in the state. Construction equipment includes off-road tractors, diggers, backhoes, cranes, and graders. Lawn and garden equipment includes lawn mowers, tillers, leaf blowers, chainsaws, and commercial turf equipment. While several other off-road equipment uses contribute to emissions in San Mateo County, methodological limitations prevent the accurate inclusion of countywide marine, recreational, airport, or other equipment and vehicles to each individual jurisdiction within the county. For construction and lawn and garden equipment, BAAQMD has provided guidance to calculate emissions at a jurisdiction level. As shown in Figure 6, GHG emissions from construction and lawn and garden activity make up 97% and 3% of off-road emissions, respectively. Per BAAQMD guidance, county-level activity and emissions for off-road equipment were attributed to the county using the following indicators:
• Total county construction equipment emissions were attributed to the county using the proportion of new housing units built within the unincorporated county compared to the entire county using the U.S. Department of Housing and Urban Development’s (HUD’s) State of the Cities Data Systems building permit Inventorying system.
• Total county lawn and garden emissions were attributed to the county using the proportion of existing households within the unincorporated county compared to the entire county using California Department of Finance (DOF) figures for 2005.
Emissions from off-road equipment and vehicles were determined using CARB’s OFFROAD 2007 program. OFFROAD provides the fuel consumption and emissions output for each type of off-road equipment in California per county, equipment type, fuel type, and year. Please note that agricultural off-road equipment and vehicles are included in the agricultural sector of this Inventory.
Solid Waste 96%
Green Waste
2% Sludge
2%
County of San Mateo GHG Inventory February 2012
15
FIGURE 6 – OFF-ROAD GHG EMISSIONS BY EQUIPMENT CATEGORY
Water and Wastewater Water and wastewater emissions accounted for <1% of total GHG emissions in 2005 (see Table 2). This inventory includes emissions from the electricity used to process, treat, and move water and wastewater to and from the county. It should be noted that some of this electricity use did not take place within the county, but was used to deliver water to San Mateo County.GHG emissions by type of activity are summarized in Figure 7. While this sector may potentially double-count electricity consumption captured in the energy sector, water and wastewater emissions are calculated separately to comply with BAAQMD guidance. The overlap between electricity and water and wastewater energy is anticipated to have a negligible effect on the Inventory, due to the small contribution of the water and wastewater sector (less than 1% of the Inventory). Due to data limitations and diversity of water and wastewater treatment providers in the county, the analysis relies on averages for the service population using best available data focused on the San Francisco Peninsula.
Lawn and Garden
Equipment 3%
Construction Equipment
97%
County of San Mateo GHG Inventory February 2012
16
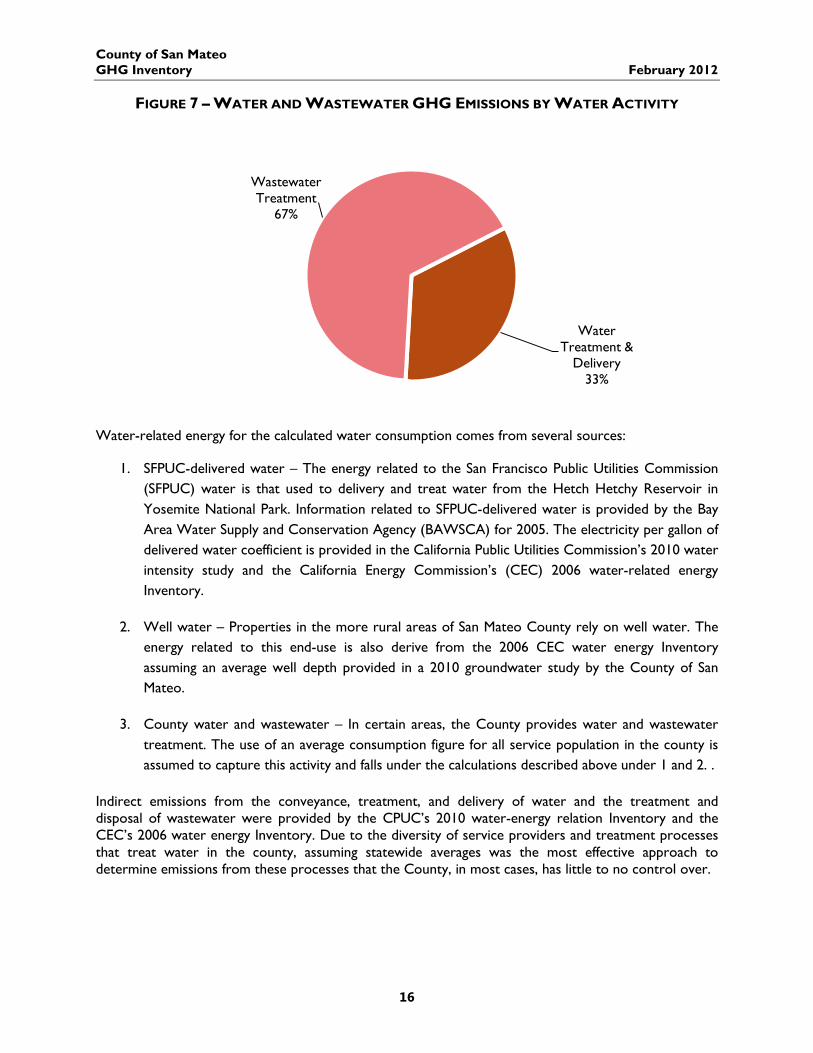
FIGURE 7 – WATER AND WASTEWATER GHG EMISSIONS BY WATER ACTIVITY
Water-related energy for the calculated water consumption comes from several sources:
1. SFPUC-delivered water – The energy related to the San Francisco Public Utilities Commission (SFPUC) water is that used to delivery and treat water from the Hetch Hetchy Reservoir in Yosemite National Park. Information related to SFPUC-delivered water is provided by the Bay Area Water Supply and Conservation Agency (BAWSCA) for 2005. The electricity per gallon of delivered water coefficient is provided in the California Public Utilities Commission’s 2010 water intensity study and the California Energy Commission’s (CEC) 2006 water-related energy Inventory.
2. Well water – Properties in the more rural areas of San Mateo County rely on well water. The energy related to this end-use is also derive from the 2006 CEC water energy Inventory assuming an average well depth provided in a 2010 groundwater study by the County of San Mateo.
3. County water and wastewater – In certain areas, the County provides water and wastewater treatment. The use of an average consumption figure for all service population in the county is assumed to capture this activity and falls under the calculations described above under 1 and 2. .
Indirect emissions from the conveyance, treatment, and delivery of water and the treatment and disposal of wastewater were provided by the CPUC’s 2010 water-energy relation Inventory and the CEC’s 2006 water energy Inventory. Due to the diversity of service providers and treatment processes that treat water in the county, assuming statewide averages was the most effective approach to determine emissions from these processes that the County, in most cases, has little to no control over.
Water Treatment &
Delivery 33%
Wastewater Treatment
67%
County of San Mateo GHG Inventory February 2012
17
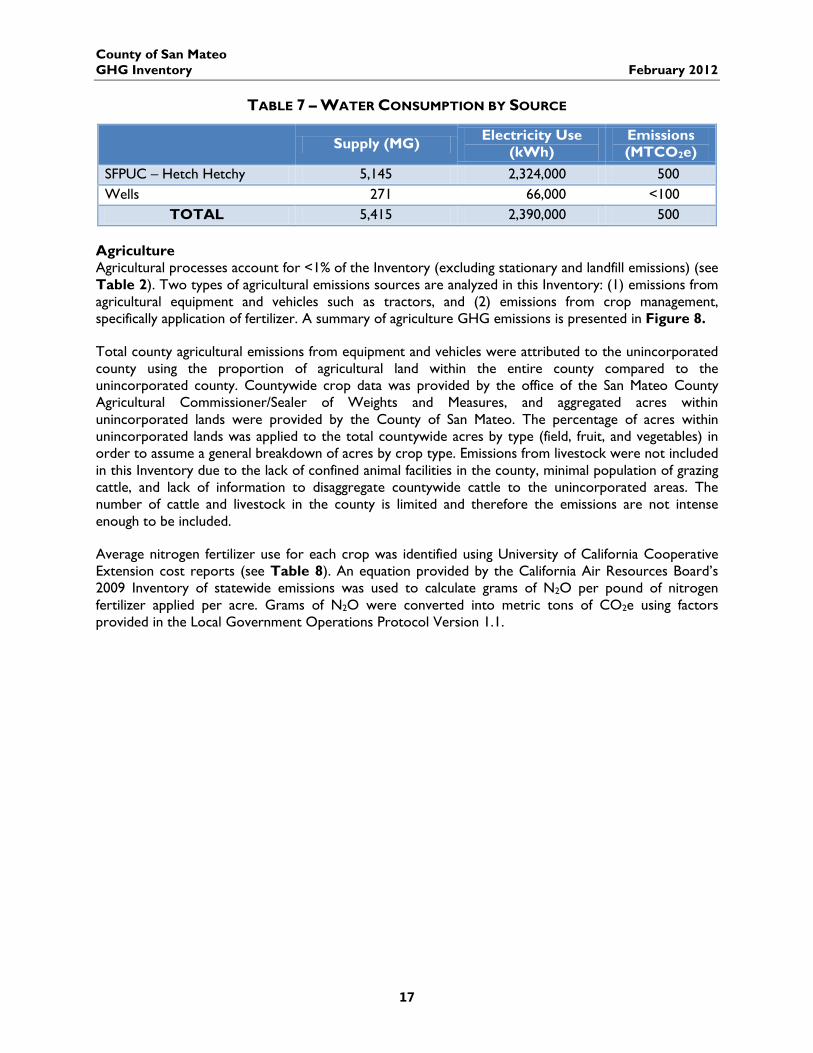
TABLE 7 – WATER CONSUMPTION BY SOURCE
Supply (MG) Electricity Use (kWh)
Emissions (MTCO2e)
SFPUC – Hetch Hetchy 5,145 2,324,000 500 Wells 271 66,000 <100
TOTAL 5,415 2,390,000 500 Agriculture Agricultural processes account for <1% of the Inventory (excluding stationary and landfill emissions) (see Table 2). Two types of agricultural emissions sources are analyzed in this Inventory: (1) emissions from agricultural equipment and vehicles such as tractors, and (2) emissions from crop management, specifically application of fertilizer. A summary of agriculture GHG emissions is presented in Figure 8.
Total county agricultural emissions from equipment and vehicles were attributed to the unincorporated county using the proportion of agricultural land within the entire county compared to the unincorporated county. Countywide crop data was provided by the office of the San Mateo County Agricultural Commissioner/Sealer of Weights and Measures, and aggregated acres within unincorporated lands were provided by the County of San Mateo. The percentage of acres within unincorporated lands was applied to the total countywide acres by type (field, fruit, and vegetables) in order to assume a general breakdown of acres by crop type. Emissions from livestock were not included in this Inventory due to the lack of confined animal facilities in the county, minimal population of grazing cattle, and lack of information to disaggregate countywide cattle to the unincorporated areas. The number of cattle and livestock in the county is limited and therefore the emissions are not intense enough to be included.
Average nitrogen fertilizer use for each crop was identified using University of California Cooperative Extension cost reports (see Table 8). An equation provided by the California Air Resources Board’s 2009 Inventory of statewide emissions was used to calculate grams of N2O per pound of nitrogen fertilizer applied per acre. Grams of N2O were converted into metric tons of CO2e using factors provided in the Local Government Operations Protocol Version 1.1.

County of San Mateo GHG Inventory February 2012
18
FIGURE 8 – AGRICULTURE GHG EMISSIONS BY ACTIVITY
TABLE 8 – AGRICULTURAL LAND, FERTILIZER & EMISSIONS BY CROP TYPE
Assumed Unincorporated
Acres
Average lbs N Applied per Acre per Year
Total Direct & Indirect Emissions
(MTCO2e)
Vegetable Crops 4,433 104 1,020 Field Crops 1,061 150 350 Wine grapes 164 10 – Misc. Fruit 131 95 30 Berries 78 64 10 TOTAL
424 1,400
Off-Road Equipment
53%
Direct Fertilizer Emissions
43%
Indirect Fertilizer Emissions
3%
County of San Mateo GHG Inventory February 2012
19
III. 2020, AND 2035 GHG FORECAST
A GHG emissions forecast is an estimate of how GHG emissions will change in the future based on anticipated changes in population, jobs, households, commercial activity, and driving patterns. This GHG emissions forecast of community-wide emissions focuses on two target years: 2020, and 2035. The 2020 year is estimated for consistency with Assembly Bill 32 targets, and the year 2035 is projected to create a parallel with Senate Bill 375. The presentation of three forecast years presents the County’s opportunities to demonstrate sustained success of reducing emissions.
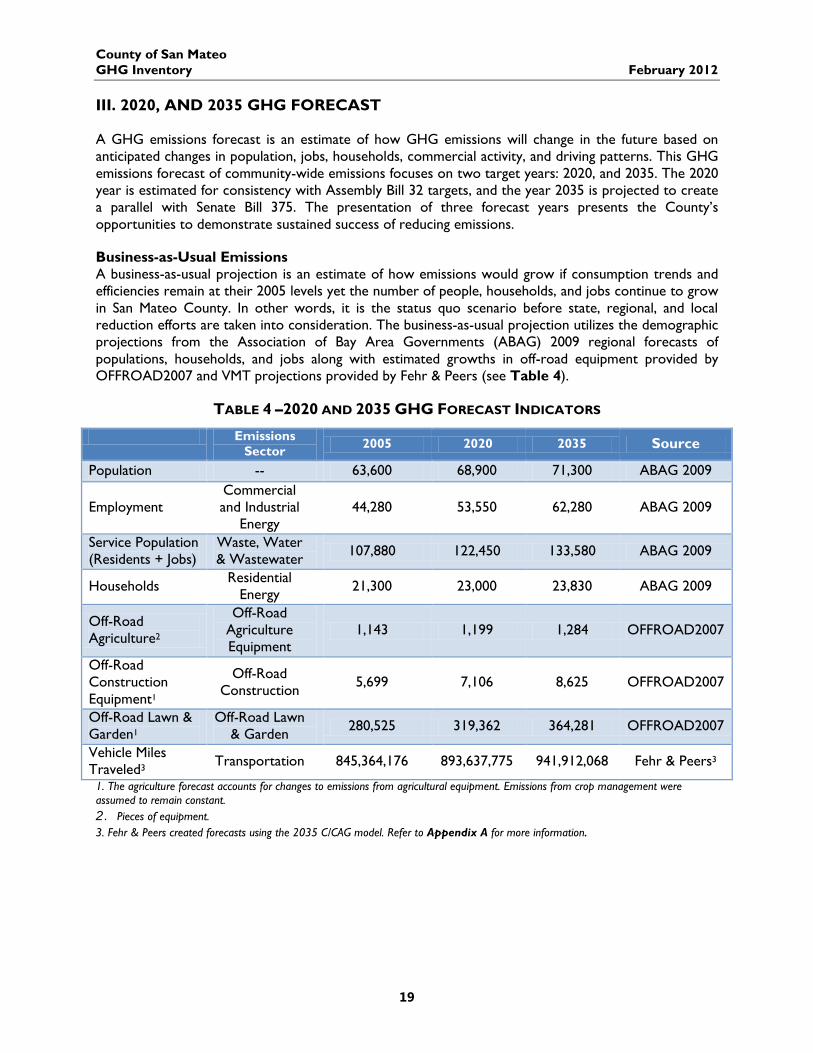
Business-as-Usual Emissions A business-as-usual projection is an estimate of how emissions would grow if consumption trends and efficiencies remain at their 2005 levels yet the number of people, households, and jobs continue to grow in San Mateo County. In other words, it is the status quo scenario before state, regional, and local reduction efforts are taken into consideration. The business-as-usual projection utilizes the demographic projections from the Association of Bay Area Governments (ABAG) 2009 regional forecasts of populations, households, and jobs along with estimated growths in off-road equipment provided by OFFROAD2007 and VMT projections provided by Fehr & Peers (see Table 4).
TABLE 4 –2020 AND 2035 GHG FORECAST INDICATORS
Emissions Sector 2005 2020 2035 Source
Population -- 63,600 68,900 71,300 ABAG 2009
Employment Commercial and Industrial
Energy 44,280 53,550 62,280 ABAG 2009
Service Population (Residents + Jobs)
Waste, Water & Wastewater 107,880 122,450 133,580 ABAG 2009
Households Residential Energy 21,300 23,000 23,830 ABAG 2009
Off-Road Agriculture2
Off-Road Agriculture Equipment
1,143 1,199 1,284 OFFROAD2007
Off-Road Construction Equipment1
Off-Road Construction 5,699 7,106 8,625 OFFROAD2007
Off-Road Lawn & Garden1
Off-Road Lawn & Garden 280,525 319,362 364,281 OFFROAD2007
Vehicle Miles Traveled3 Transportation 845,364,176 893,637,775 941,912,068 Fehr & Peers3
1. The agriculture forecast accounts for changes to emissions from agricultural equipment. Emissions from crop management were assumed to remain constant. 2. Pieces of equipment. 3. Fehr & Peers created forecasts using the 2035 C/CAG model. Refer to Appendix A for more information.
County of San Mateo GHG Inventory February 2012
20
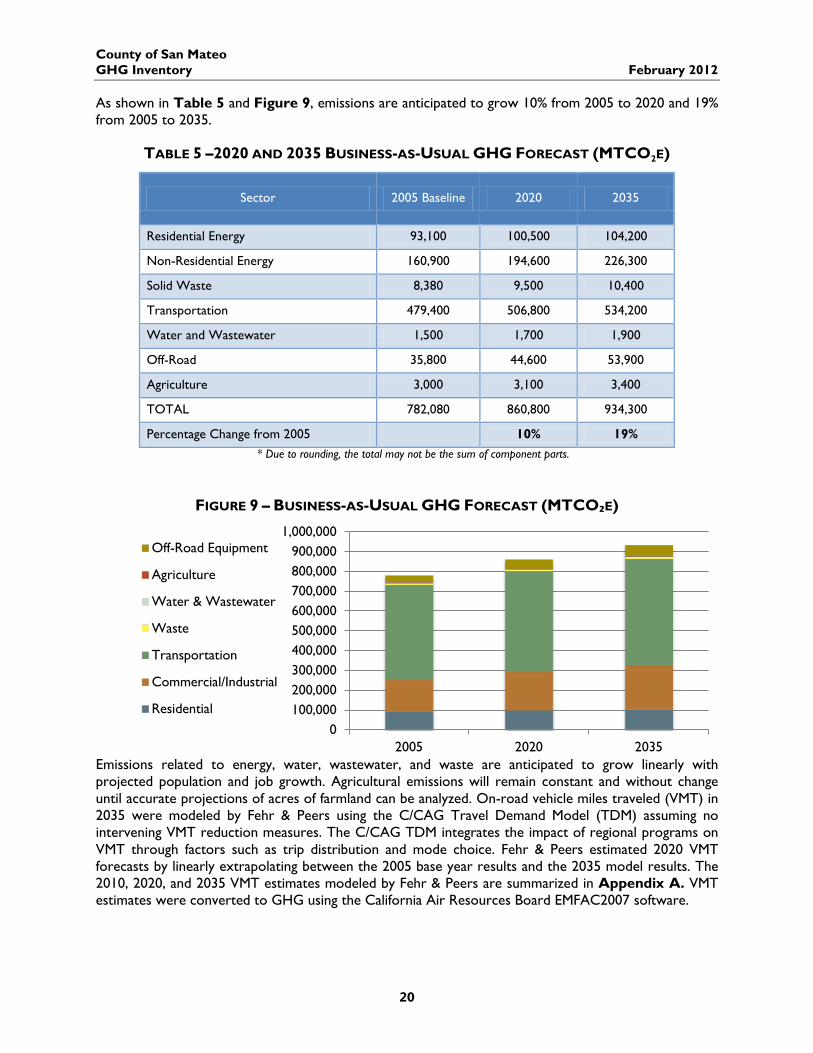
As shown in Table 5 and Figure 9, emissions are anticipated to grow 10% from 2005 to 2020 and 19% from 2005 to 2035.
TABLE 5 –2020 AND 2035 BUSINESS-AS-USUAL GHG FORECAST (MTCO2E)
Sector 2005 Baseline 2020 2035
Residential Energy 93,100 100,500 104,200
Non-Residential Energy 160,900 194,600 226,300
Solid Waste 8,380 9,500 10,400
Transportation 479,400 506,800 534,200
Water and Wastewater 1,500 1,700 1,900
Off-Road 35,800 44,600 53,900
Agriculture 3,000 3,100 3,400
TOTAL 782,080 860,800 934,300
Percentage Change from 2005 10% 19% * Due to rounding, the total may not be the sum of component parts.
FIGURE 9 – BUSINESS-AS-USUAL GHG FORECAST (MTCO₂E)
Emissions related to energy, water, wastewater, and waste are anticipated to grow linearly with projected population and job growth. Agricultural emissions will remain constant and without change until accurate projections of acres of farmland can be analyzed. On-road vehicle miles traveled (VMT) in 2035 were modeled by Fehr & Peers using the C/CAG Travel Demand Model (TDM) assuming no intervening VMT reduction measures. The C/CAG TDM integrates the impact of regional programs on VMT through factors such as trip distribution and mode choice. Fehr & Peers estimated 2020 VMT forecasts by linearly extrapolating between the 2005 base year results and the 2035 model results. The 2010, 2020, and 2035 VMT estimates modeled by Fehr & Peers are summarized in Appendix A. VMT estimates were converted to GHG using the California Air Resources Board EMFAC2007 software.
0100,000200,000300,000400,000500,000600,000700,000800,000900,000
1,000,000
2005 2020 2035
Off-Road Equipment
Agriculture
Water & Wastewater
Waste
Transportation
Commercial/Industrial
Residential
County of San Mateo GHG Inventory February 2012
21
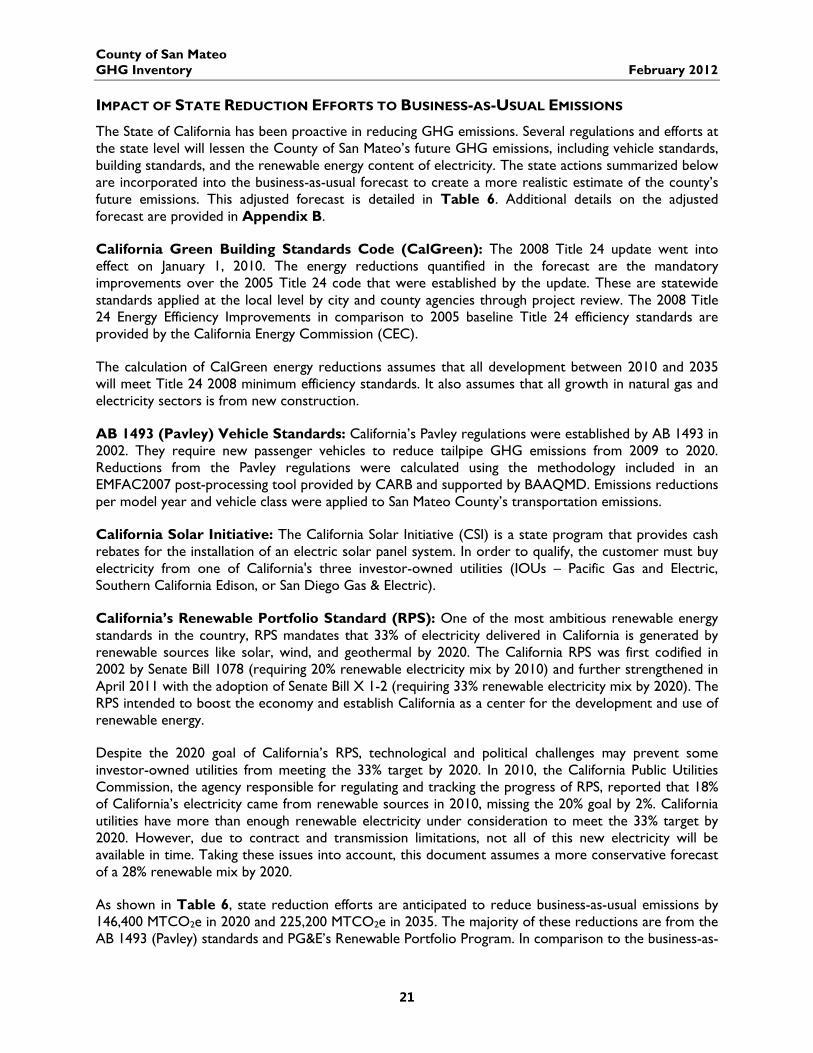
IMPACT OF STATE REDUCTION EFFORTS TO BUSINESS-AS-USUAL EMISSIONS
The State of California has been proactive in reducing GHG emissions. Several regulations and efforts at the state level will lessen the County of San Mateo’s future GHG emissions, including vehicle standards, building standards, and the renewable energy content of electricity. The state actions summarized below are incorporated into the business-as-usual forecast to create a more realistic estimate of the county’s future emissions. This adjusted forecast is detailed in Table 6. Additional details on the adjusted forecast are provided in Appendix B.
California Green Building Standards Code (CalGreen): The 2008 Title 24 update went into effect on January 1, 2010. The energy reductions quantified in the forecast are the mandatory improvements over the 2005 Title 24 code that were established by the update. These are statewide standards applied at the local level by city and county agencies through project review. The 2008 Title 24 Energy Efficiency Improvements in comparison to 2005 baseline Title 24 efficiency standards are provided by the California Energy Commission (CEC).
The calculation of CalGreen energy reductions assumes that all development between 2010 and 2035 will meet Title 24 2008 minimum efficiency standards. It also assumes that all growth in natural gas and electricity sectors is from new construction.
AB 1493 (Pavley) Vehicle Standards: California’s Pavley regulations were established by AB 1493 in 2002. They require new passenger vehicles to reduce tailpipe GHG emissions from 2009 to 2020. Reductions from the Pavley regulations were calculated using the methodology included in an EMFAC2007 post-processing tool provided by CARB and supported by BAAQMD. Emissions reductions per model year and vehicle class were applied to San Mateo County’s transportation emissions.
California Solar Initiative: The California Solar Initiative (CSI) is a state program that provides cash rebates for the installation of an electric solar panel system. In order to qualify, the customer must buy electricity from one of California's three investor-owned utilities (IOUs – Pacific Gas and Electric, Southern California Edison, or San Diego Gas & Electric).
California’s Renewable Portfolio Standard (RPS): One of the most ambitious renewable energy standards in the country, RPS mandates that 33% of electricity delivered in California is generated by renewable sources like solar, wind, and geothermal by 2020. The California RPS was first codified in 2002 by Senate Bill 1078 (requiring 20% renewable electricity mix by 2010) and further strengthened in April 2011 with the adoption of Senate Bill X 1-2 (requiring 33% renewable electricity mix by 2020). The RPS intended to boost the economy and establish California as a center for the development and use of renewable energy.
Despite the 2020 goal of California’s RPS, technological and political challenges may prevent some investor-owned utilities from meeting the 33% target by 2020. In 2010, the California Public Utilities Commission, the agency responsible for regulating and tracking the progress of RPS, reported that 18% of California’s electricity came from renewable sources in 2010, missing the 20% goal by 2%. California utilities have more than enough renewable electricity under consideration to meet the 33% target by 2020. However, due to contract and transmission limitations, not all of this new electricity will be available in time. Taking these issues into account, this document assumes a more conservative forecast of a 28% renewable mix by 2020.
As shown in Table 6, state reduction efforts are anticipated to reduce business-as-usual emissions by 146,400 MTCO2e in 2020 and 225,200 MTCO2e in 2035. The majority of these reductions are from the AB 1493 (Pavley) standards and PG&E’s Renewable Portfolio Program. In comparison to the business-as-
County of San Mateo GHG Inventory February 2012
22
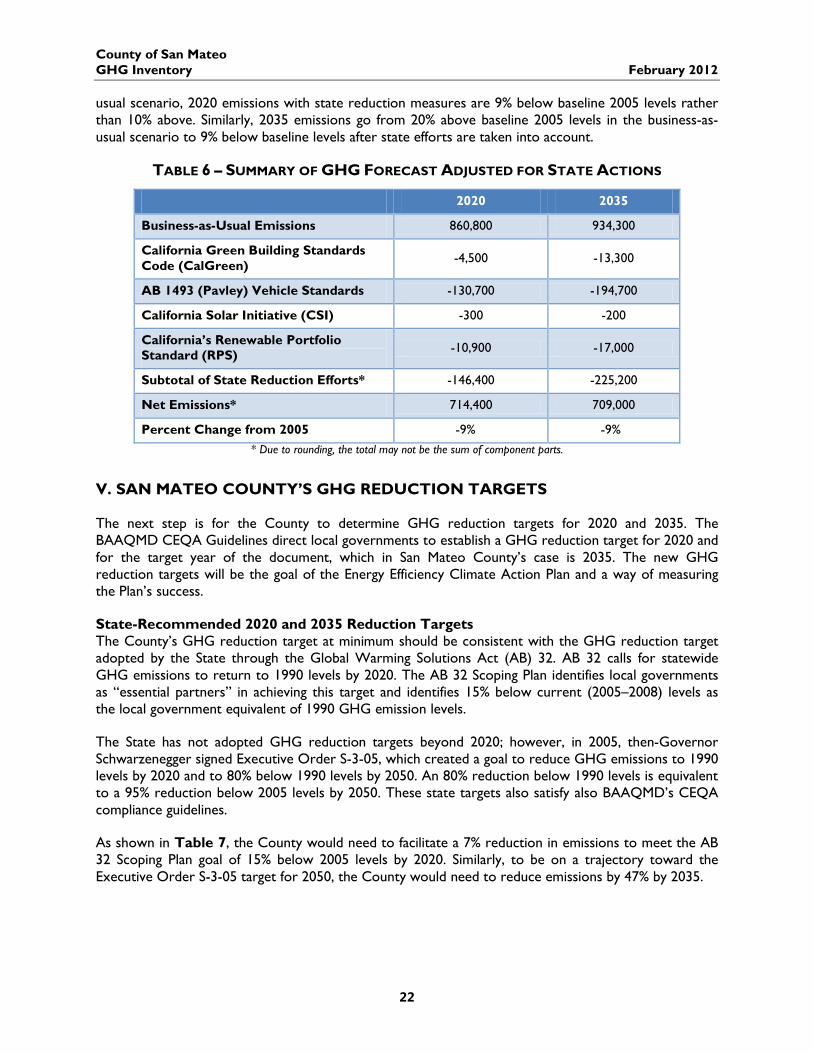
usual scenario, 2020 emissions with state reduction measures are 9% below baseline 2005 levels rather than 10% above. Similarly, 2035 emissions go from 20% above baseline 2005 levels in the business-as-usual scenario to 9% below baseline levels after state efforts are taken into account.
TABLE 6 – SUMMARY OF GHG FORECAST ADJUSTED FOR STATE ACTIONS
2020 2035
Business-as-Usual Emissions 860,800 934,300
California Green Building Standards Code (CalGreen) -4,500 -13,300
AB 1493 (Pavley) Vehicle Standards -130,700 -194,700
California Solar Initiative (CSI) -300 -200
California’s Renewable Portfolio Standard (RPS) -10,900 -17,000
Subtotal of State Reduction Efforts* -146,400 -225,200
Net Emissions* 714,400 709,000
Percent Change from 2005 -9% -9% * Due to rounding, the total may not be the sum of component parts.
V. SAN MATEO COUNTY’S GHG REDUCTION TARGETS
The next step is for the County to determine GHG reduction targets for 2020 and 2035. The BAAQMD CEQA Guidelines direct local governments to establish a GHG reduction target for 2020 and for the target year of the document, which in San Mateo County’s case is 2035. The new GHG reduction targets will be the goal of the Energy Efficiency Climate Action Plan and a way of measuring the Plan’s success.
State-Recommended 2020 and 2035 Reduction Targets The County’s GHG reduction target at minimum should be consistent with the GHG reduction target adopted by the State through the Global Warming Solutions Act (AB) 32. AB 32 calls for statewide GHG emissions to return to 1990 levels by 2020. The AB 32 Scoping Plan identifies local governments as “essential partners” in achieving this target and identifies 15% below current (2005–2008) levels as the local government equivalent of 1990 GHG emission levels.
The State has not adopted GHG reduction targets beyond 2020; however, in 2005, then-Governor Schwarzenegger signed Executive Order S-3-05, which created a goal to reduce GHG emissions to 1990 levels by 2020 and to 80% below 1990 levels by 2050. An 80% reduction below 1990 levels is equivalent to a 95% reduction below 2005 levels by 2050. These state targets also satisfy also BAAQMD’s CEQA compliance guidelines.
As shown in Table 7, the County would need to facilitate a 7% reduction in emissions to meet the AB 32 Scoping Plan goal of 15% below 2005 levels by 2020. Similarly, to be on a trajectory toward the Executive Order S-3-05 target for 2050, the County would need to reduce emissions by 47% by 2035.
County of San Mateo GHG Inventory February 2012
23
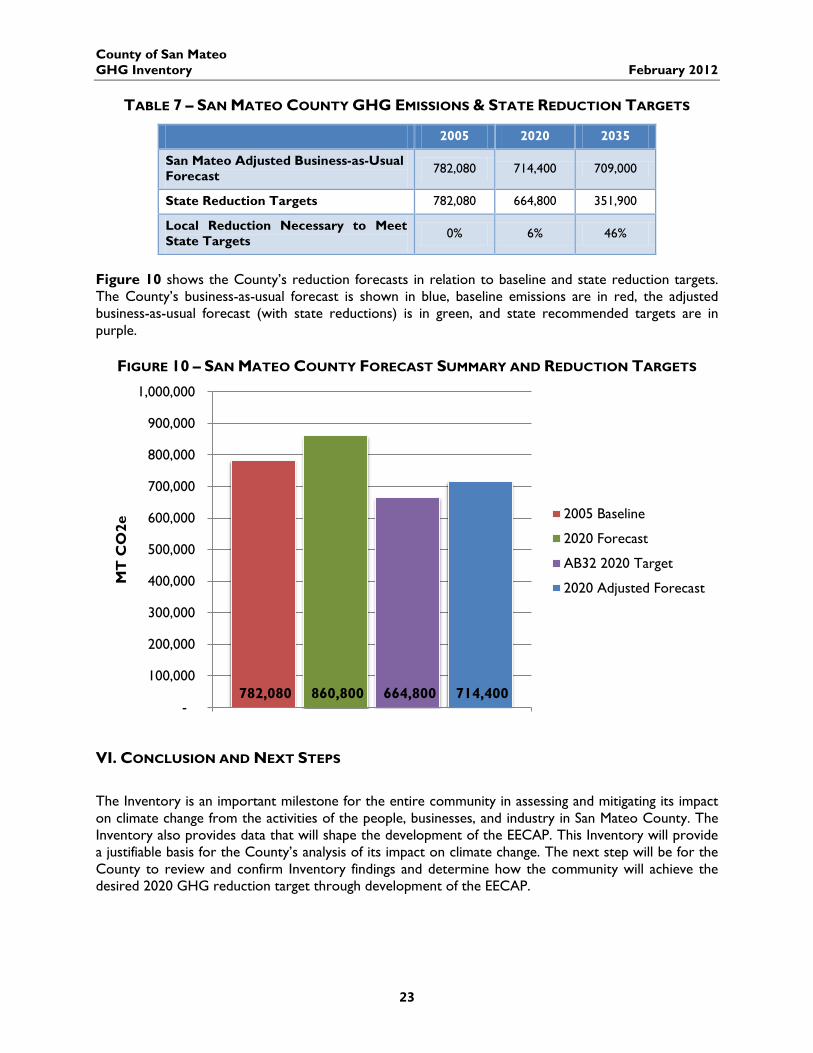
TABLE 7 – SAN MATEO COUNTY GHG EMISSIONS & STATE REDUCTION TARGETS
2005 2020 2035
San Mateo Adjusted Business-as-Usual Forecast 782,080 714,400 709,000
State Reduction Targets 782,080 664,800 351,900
Local Reduction Necessary to Meet State Targets 0% 6% 46%
Figure 10 shows the County’s reduction forecasts in relation to baseline and state reduction targets. The County’s business-as-usual forecast is shown in blue, baseline emissions are in red, the adjusted business-as-usual forecast (with state reductions) is in green, and state recommended targets are in purple.
FIGURE 10 – SAN MATEO COUNTY FORECAST SUMMARY AND REDUCTION TARGETS
VI. CONCLUSION AND NEXT STEPS
The Inventory is an important milestone for the entire community in assessing and mitigating its impact on climate change from the activities of the people, businesses, and industry in San Mateo County. The Inventory also provides data that will shape the development of the EECAP. This Inventory will provide a justifiable basis for the County’s analysis of its impact on climate change. The next step will be for the County to review and confirm Inventory findings and determine how the community will achieve the desired 2020 GHG reduction target through development of the EECAP.
782,080 860,800 664,800 714,400 -
100,000
200,000
300,000
400,000
500,000
600,000
700,000
800,000
900,000
1,000,000
MT
CO
2e 2005 Baseline
2020 Forecast
AB32 2020 Target
2020 Adjusted Forecast
County of San Mateo GHG Inventory February 2012
24
WORKS CITED
Association of Bay Area Governments (ABAG). 2009. Regional Projections for Population, Housing, Employment and Jobs.
Bay Area Air Quality Management District (BAAQMD). 2010. California Environmental Quality Act Air Quality Guidelines. San Francisco: BAAQMD.
Bay Area Air Quality Management District (BAAQMD) – Public Records Section. 2009. 2009 San Mateo County GHG Emitting Facilities. San Francisco: BAAQMD.
Bay Area Water Supply & Conservation Agency (BAWSCA) 2010. Annual Survey: FY 2008-2009. www.bawsca.org/docs/BAWSCA_Survey_08_09_FINAL_rev_5_3.pdf (accessed June 2011).
California Air Resources Board (CARB). 2007. OFFROAD 2007. Version 2.0.1.2. http://www.arb.ca.gov/msei/offroad/offroad.htm.
———. 2009. California's 1990–2004 Greenhouse Gas Emissions Inventory and 1990 Emissions Level. Technical Support Document. http://www.arb.ca.gov/cc/inventory/doc/methods_v1/ghg_inventory_technical_support_document.pdf.
———. 2010a. Clean Car Standards – Pavley, Assembly Bill 1493. http://www.arb.ca.gov/cc/ccms /ccms.htm.
———. 2010b. Pavley I and Low Carbon Fuel Standard Postprocessor Version 1.0. http://www.arb.ca.gov/cc/sb375/tools/postprocessor.htm.
———. 2011. ARB Landfill Emissions Tool. http://www.arb.ca.gov/cc/protocols/localgov/localgov.htm.
California Department of Finance, Demographic Research Unit. 2010. E-5 Population and Housing Estimates for Cities, Counties and the State, 2001–2010, with 2000 Benchmark. http://www.dof.ca.gov/research/demographic/reports/view.php#objCollapsiblePanelEstimatesAnchor.
California Energy Commission (CEC). 2006. Refining Estimates of Water-Related Energy Use in California. PIER Final Project Report. Prepared by Navigant Consulting, Inc. CEC-500-2006-118. http://www.energy.ca.gov/2006publications/CEC-500-2006-118/CEC-500-2006-118.PDF (accessed September 8, 2010).
———. 2007. Impact Analysis: 2008 Update to the California Energy Efficiency Standards for Residential and Nonresidential Buildings.
California Public Utilities Commission (CPUC). 2010. Water Intensity Study 1. ftp://ftp.cpuc.ca.gov/gopher-data/energy%20efficiency/Water%20Studies%201/Study%201%20-%20FINAL.pdf
———. 2011. 4th Quarter 2010 Renewable Portfolio Standard Report. http://www.cpuc.ca.gov/NR /rdonlyres/CFD76016-3E28-44B0-8427-3FAB1AA27FF4/0/FourthQuarter2010RPSReporttothe Legislature.pdf
County of San Mateo. 2006. San Mateo County Energy – Water Snapshot.
County of San Mateo GHG Inventory February 2012
25
———. 2008a. County of San Mateo 2005 Community Greenhouse Gas Emissions Inventory. Prepared by ICLEI-Local Governments for Sustainability USA.
———. 2008b. County of San Mateo 2005 Government Operations Greenhouse Gas Emissions Inventory. Prepared by ICLEI-Local Governments for Sustainability USA.
Fehr & Peers. 2011. County of San Mateo Greenhouse Gas Reduction Program Transportation Baseline and Future Year VMT Estimates Inventory.
Heaney, James P., William DeOreo, Peter Mayer, Paul Lander, Jeff Harpring, Laurel Stadjuhar, Beorn Courtney, and Lynn Buhlig. Accessed 2011. Nature of Residential Water Use and Effectiveness of Conservation Programs. Boulder Area Sustainability Information Network (BASIN). http://bcn.boulder.co.us/basin/local/heaney.html.
Intergovernmental Panel on Climate Change (IPCC). 1997. Revised 1996 IPCC Guidelines for National Greenhouse Gas Inventories. http://www.ipcc-nggip.iges.or.jp/public/gl/invs1.html.
Joseph, John. 2011. Pacific Gas & Electric Company. E-mail correspondence. May 15.
Propane Education & Research Council and ICF International. 2010. County Residential Propane Model (CRPM) Version 3.2. http://www.propanecouncil.org/MMI/DEMAND-MODEL/.
San Mateo County Agricultural Commissioner/Sealer of Weights and Measures Office. 2005. San Mateo
County 2005 Agricultural Crop Report. Redwood City, CA.
University of California, Davis. 2011. Agriculture and Resource Economics, Current Cost and Return Studies. http://coststudies.ucdavis.edu/.
U.S. Department of Housing and Urban Development (HUD). 2011. SOCDS Building Permits Database. http://socds.huduser.org/permits/.
U.S. Environmental Protection Agency. 2005. Emissions Facts: Greenhouse Gas Emissions from a Typical Passenger Vehicle. http://www.epa.gov/otaq/climate/420f05004.pdf.

County of San Mateo GHG Inventory February 2012
26
APPENDICES:
A. San Mateo County Transportation Baseline and Future Year Inventory Fehr & Peers. B. Adjusted Business As usual Forecast Summary: State Reduction Efforts


![Greenhouse Gas Emissions and Emissions Trading in North … · 2020. 2. 23. · 2002] Stephenson-Greenhouse Gas Emissions, Kyoto and U.S. Response 45 greenhouse gas molecules. This](https://static.fdocuments.in/doc/165x107/60facf56e286b02f9b10de99/greenhouse-gas-emissions-and-emissions-trading-in-north-2020-2-23-2002-stephenson-greenhouse.jpg)